Article

Atmospheric Rivers in South-Central Chile: Zonal and Tilted Events

by
René D. Garreaud
1,2,*,
Martín Jacques-Coper
2,3,
Julio C. Marín
4,5 and
Diego A. Narváez
6,7
1
Department of Geophysics, Universidad de Chile, Santiago 8370499, Chile
2
Center for Climate and Resilience Research (CR2), Santiago 8370499, Chile
3
Department of Geophysics, Universidad de Concepción, Concepción 4070386, Chile
4
Department of Meteorology, Universidad de Valparaíso, Valparaíso 2362735, Chile
5
Centro de Estudios Atmosféricos y Cambio Climático, CEACC, Universidad de Valparaíso, Valparaíso 2362735, Chile
6
Center for Oceanographic Research COPAS Coastal, Universidad de Concepción, Concepción 4070386, Chile
7
Department of Oceanography, University of Concepción, Concepción 4070386, Chile
*
Author to whom correspondence should be addressed.
Atmosphere 2024, 15(4), 406; https://doi.org/10.3390/atmos15040406
Submission received: 6 February 2024 / Revised: 15 March 2024 / Accepted: 19 March 2024 / Published: 26 March 2024
(This article belongs to the Section Meteorology)

Abstract

:
The extratropical west coast of South America has one of the largest frequencies of landfalling atmospheric rivers (ARs), with dozens of events per season that account for ~50% of the annual precipitation and can produce extreme rainfall events in south-central Chile. Most ARs form an acute angle with the Andes, but, in some cases, the moist stream impinges nearly perpendicular to the mountains, referred to as zonal atmospheric rivers (ZARs). Enhanced surface-based and upper-air measurements in Concepcion (36.8° S), as well as numerical simulations, were used to characterize a ZAR and a meridionally oriented AR in July 2022. They represent extremes of the broad distribution of winter storms in this region and exhibit key features that were found in a composite analysis based on larger samples of ZARs and tilted ARs. The latter is associated with an upper-level trough, broad-scale ascent, extratropical cyclone, and cold front reaching southern Chile. Instead, ZARs are associated with tropospheric-deep, strong zonal flow and a stationary front across the South Pacific, with ascent restricted upstream of the Andes. Consequently, ZARs have minimum precipitation offshore but a marked orographic precipitation enhancement and exhibit relatively warm temperatures, thus resulting in an augmented risk of hydrometeorological extreme events.

1. Introduction

Since the pioneering work by Zhu and Newell in the late 1990s [1], atmospheric rivers (ARs) have been identified as a key component of the Earth’s water cycle [2,3,4]. These transient, narrow, and elongated bands transport water vapor and heat poleward from the tropics, feeding the warm conveyor belt of extratropical cyclones and frontal precipitation [5,6]. ARs most often form over the oceans [7], and when approaching a land mass, they are forced to ascend over coastal mountains. Landfalling ARs thus cause substantial precipitation in the west margins of the continents, including South America [8] and North America [9], with their hydrometeorological impact ranging from beneficial to hazardous. More recently, Ralph et al. [10] proposed a five-category impact scale for landfalling ARs primarily determined by the magnitude of the vertically integrated water vapor transport (IVT vector) and closely determining the flooding intensity in selected basins in coastal California. Such a scale has been adopted in many regions [11,12], but, as we show later, ARs’ features other than IVT magnitude can significantly modulate the hydrometeorological impact of these events.
The present study focuses on AR landfalling in south-central Chile (33–40° S), a narrow strip of land between the Pacific Ocean and the Andes Cordillera that reaches between 2.5 and 6 km above sea level (Figure 1a). The regional geography also includes a coastal range (~1 km ASL (above sea level)) and inland valleys at the foothills of the Andes. South-central Chile hosts more than 8 million inhabitants (about half of the country’s population), key economic activities, and major cities. Its climate features a transition between the hyperaridity of the Atacama Desert and hyper-humid conditions in western Patagonia [13]. Consistently, the annual mean precipitation along the coast and inland valleys increases gradually from 300 mm at 33° S to 2000 mm at 40° S (Figure 1b), mainly concentrated in the winter months [14], although seasonality decreases poleward. Orographic enhancement by forced uplift causes a first precipitation maximum over the coastal range, followed by a weak rain shadow over the interior Central Valley, and then a rapid increase by a factor of 2–3 over the western slope of the Andes (Figure 1b; [14]).
Global surveys reveal that the extratropical west coast of South America has one of the largest frequencies of landfalling ARs [7], with dozens of events per season (Figure 1c) that account for about 50% of the annual precipitation [8] and can produce extreme, damaging rainfall events in south-central Chile [15,16,17,18]. The angle of the along-AR main axis relative to the Andes varies widely. ARs are generally oriented in the NW–SE direction, forming an acute angle with the Andes (tilted ARs; [8]), but in some cases, the moist stream impinges nearly perpendicular to the mountains, referred to as zonal atmospheric rivers (ZARs; [19]). Winter storms in central Chile with unusually high air temperatures often feature a ZAR [15], and some high-impact events in the recent past have been caused by this type of AR (e.g., [20]).
Studies of AR in other regions have also recognized the relevance of the IVT direction in rainfall accumulation in coastal and inland areas. For instance, a major flood in Arizona, USA, in January 2010 was instigated by the inland penetration of an AR with its major axis nearly perpendicular to the mountain ranges of the southwestern USA [21,22]. This result was generalized by [23], where a k-means clustering method was used to separate ARs with different orientations and show their influence on precipitation distributions over North Coastal California. In that case, south–southwesterly-oriented ARs produce, on average, more precipitation than westerly-oriented ARs. Likewise, an analysis of flooding events in two basins in the UK revealed that the hydrological response is the largest when the AR is aligned with the basin’s main axis, which maximizes the efficiency of orographic enhancement [24]. ARs reaching the coast with different orientations also seem to have distinct moisture sources. The westerly cases identified in [23] appear to draw moisture from the central part of the midlatitude North Pacific, while the southwesterly cases appear to draw moisture from the subtropical eastern Pacific [23]. Recognizing this diversity may reconcile divergent views on the ARs moisture sources with some studies favoring local sources [25] and other long-range transport [26].
Nonetheless, there is a lack of systematic observations and analyses focused on the structure and impacts of ZARs, as well as their differences with the more commonly tilted ARs reaching the west coast of South America, a gap that we aim to address in the present work. Based on our synoptic experience, we hypothesize that (a) ZARs develop under a more steady, quasi-barotropic synoptic-scale environment compared with that accompanying tilted ARs, (b) produce a larger orographic precipitation enhancement, and (c) tend to be warmer than other events. Note that a combination of the last two conditions may result in more hazardous settings during ZARs relative to titled ARs, even if they have comparable IVT magnitude at the landfalling region. Furthermore, characterizing the synoptic conditions of a ZAR may help their forecast. To this end, we first use in-situ, dedicated measurements, and numerical simulations (Section 2) to describe a pair of ARs with nearly identical IVT magnitude but contrasting landfall orientations that reached the coast on 9 and 17 July 2022. We first present their overall structure and coastal evolution and then contrast their precipitation distribution inland (Section 3.1). We next generalize the results emerging from these cases of study using a composite analysis based on a larger sample of ZARs and tilted ARs (Section 3.2). In that subsection, we focus on the broad-scale environment during these types of events and the regional-scale precipitation distribution to support the hypothesis above. A discussion on the topographic effects and ARs’ broader impacts is presented in Section 4, and concluding remarks are in Section 5.

2. Materials and Methods

2.1. The Atmospheric Rivers Observatory in Concepción

The large-scale structure of precipitating systems in south-central Chile has been studied using the network of conventional weather stations, atmospheric reanalysis, and satellite images (see [13] for a review). Much less is known about the microphysical aspects of the precipitating clouds and sub-synoptic dynamics. This gap motivated the implementation of the first Atmospheric River Observatory (ORA) in Chile, placed in Concepción (36.8° S, 73° W, 25 m ASL) near the coast in the Biobio region. Concepción is a major city located on the northern edge of the sector with a large frequency of landfalling ARs in south-central Chile (Figure 1c). The ORA consists of a suite of instruments mounted on the roof of the Geophysics Department at Universidad de Concepción (about 35 m above ground level, Supplementary Figure S1), including a vertically-pointing micro rain radar (MMR-2), a PARSIVEL disdrometer, a laser ceilometer, and an automatic weather station (see details in Supplementary Table S1). Among other variables, the MRR-2 delivers vertical profiles of radar reflectivity—closely related to rain rate—and the fall speed of hydrometeors from which the melting layer (ice-to-rain transition) can be identified [27]. All instruments became operational in April 2022, measuring continuously with a high sampling rate (1 min or less). Real-time data and archived files are publicly available at https://www.cr2.cl/ORA/ accessed on 17 March 2024.

2.2. The July 2022 Field Campaign

The Chilean National Weather Directorate (DMC) launches radiosonde once daily in four stations along the coast, but none of them are in Concepción. The closest radiosonde sites are Santo Domingo (33° S) and Puerto Montt (41° S), both about 500 km away from Concepción (Figure 1a). Nearly 40 radiosondes (InterMET iMet-4) were launched from the exact location where ORA is installed at the Universidad de Concepción in July 2022, complementing surface-based measurements. We used an on-demand launching strategy, with most soundings released every 6 or 8 h during intensive observation periods (IOPs; see dates in Section 3) that coincide with the arrival of frontal systems to the region. Three IOPs were planned and conducted using guidance from the weather forecast, attempting to capture the largest IVT and precipitation events.

2.3. Other Sources

Hourly precipitation data from about 700 automatic weather stations in south-central Chile was obtained from the DMC and General Water Directorate (DGA) through the VisMet online platform (https://vismet.cr2.cl/ accessed 17 March 2024). The large-scale circulation during the storms was characterized using the ERA5 reanalysis of the European Centre for Medium-Range Weather Forecasts [28] with hourly resolution on a 0.25° × 0.25° lat–lon grid and 137 vertical levels. We employed both three-dimensional pressure level variables (temperature, geopotential, humidity, and wind) and single-level fields, including large-scale and convective precipitation rates, the zero-degree isotherm height (H0), total column precipitable water (PW), and integrated water vapor transport (IVT vector).

2.4. WRF Simulations

Orographic precipitation enhancement is a crucial element during winter storms in central Chile. However, there are few precipitation gauges above 2000 m ASL, and satellite products tend to underestimate snowfall in these cases [29]. This motivated using numerical simulations to estimate the precipitation distribution over the Andes.
We conducted a control simulation for IOP1 and IOP2 using version 4.3.1 of the Weather Research and Forecasting (WRF, [30]) model. The simulations employed three nested domains with 9, 3, and 1 km horizontal resolutions (Supplementary Figure S2) and 55 irregularly spaced vertical sigma levels, with a top at 50 hPa. The simulations were run for 48 h, starting at 12 UTC on 8 July 2022 for IOP1 and at 12 UTC on 16 July 2022 for IOP2. Initial and boundary conditions were provided by ERA5 every 3 h at a 0.25° × 0.25° horizontal resolution, and the outputs from domains 2 and 3 were saved every 1 h. In this paper, we use results from domain 2 that cover south-central Chile (Supplementary Figure S2).
The control simulations employed the same parameterization setting in all domains. This includes the four-layer Noah-MP land surface model [31] to solve the land-surface processes, the Mellor–Yamada–Nakanishi–Niino (MYNN, [32]). Level 2.5 parametrization for the planetary boundary layer, the Rapid Radiative Transfer Model (RRTMG, [33]) for shortwave and longwave radiation processes, the Thompson two-moment scheme [34] to solve the microphysics processes and convection was resolved by the Tiedke scheme [35].
In addition to the control simulations, we performed several sensitivity experiments to gauge the effect of the Andes on the precipitation distribution over central Chile during IOP1 and IOP2. To this end, we ran the model with the same settings as the control simulations but with the topography reduced by a factor τ in all domains. The factor τ was changed from 1 (control run or factual simulation) to 0.75, 0.50, 0.25, and 0.10, thus resulting in counterfactual simulations with a decreasing lower Andes cordillera and coastal range.

3. Results

3.1. Two Study Cases

3.1.1. Overview of July 2022

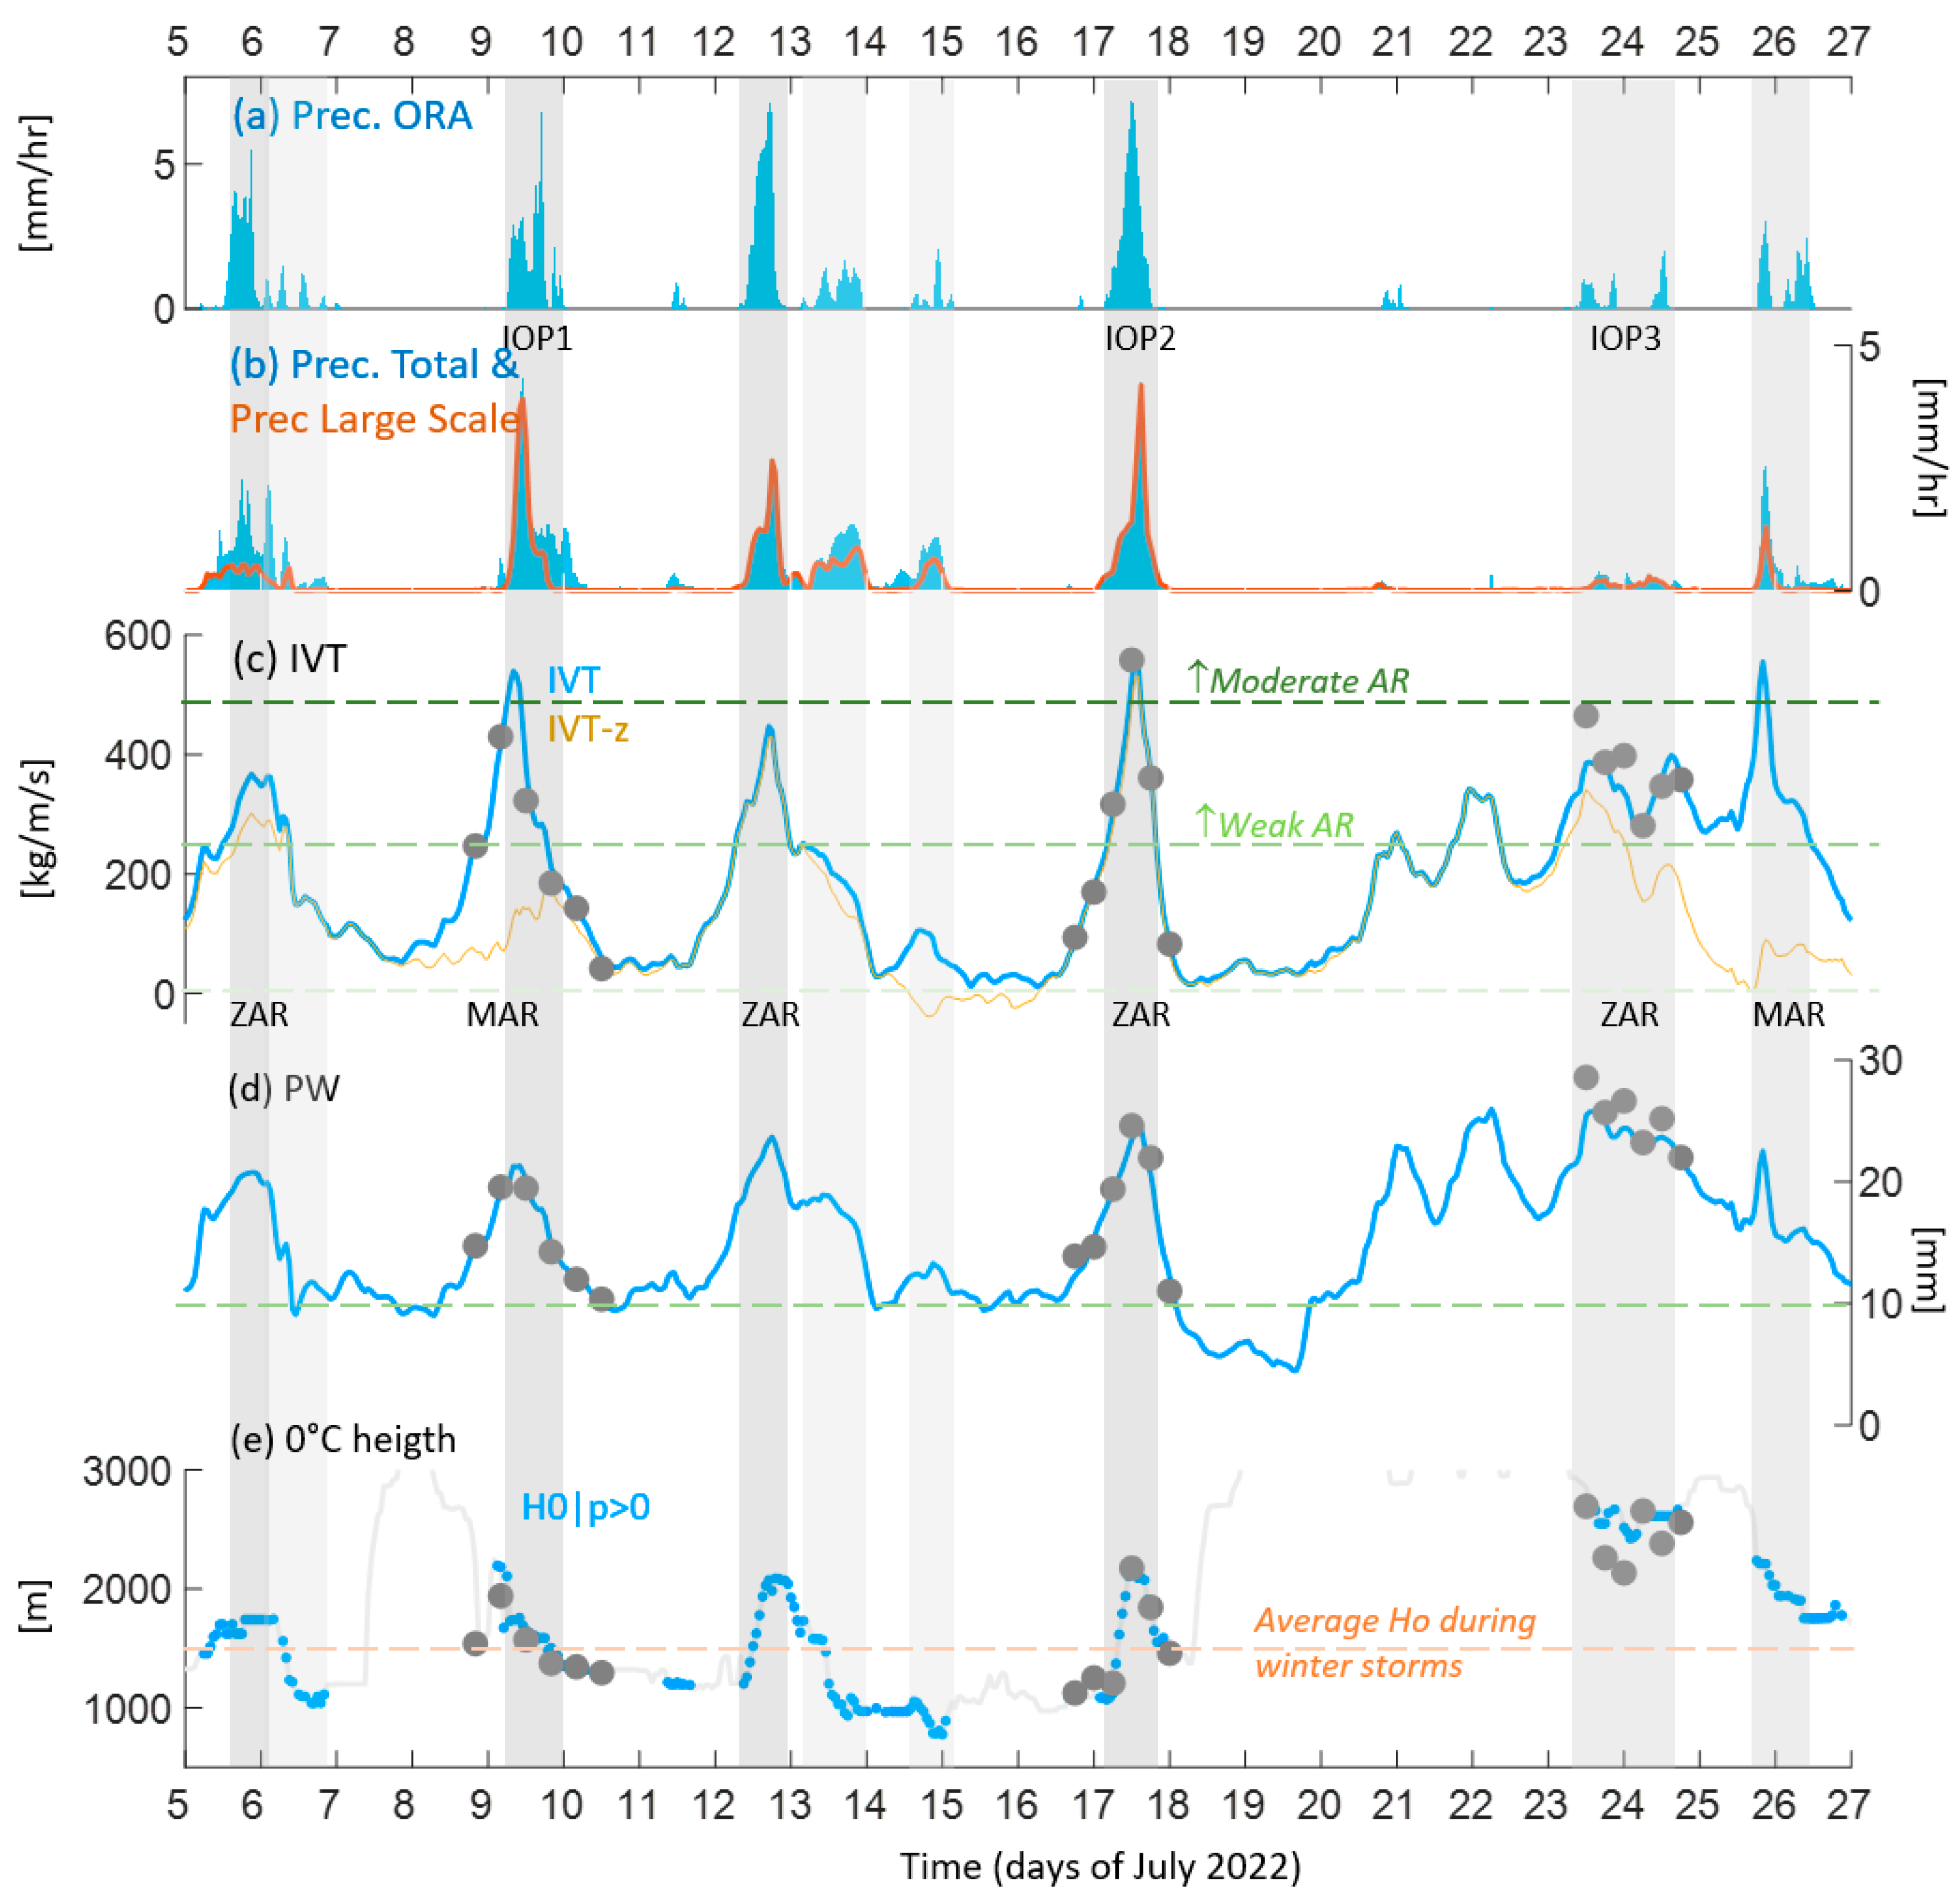
Despite the prevailing La Niña conditions, which often bring dry conditions to central Chile [36], Concepción received near-average precipitation during the winter of 2022. In July, it accumulated 220 mm, which is about 10% above climatology, accounted for by five precipitation events registered at ORA (Figure 2a). IOP1 occurred between 9 and 10 July with an accumulation of 37 mm, just above the threshold of extreme precipitation for this location as defined by Valenzuela and Garreaud (2019). IOP2 occurred between 17 and 18 July 2022, with an accumulation of 45 mm. By 20 July, the forecasts anticipated accumulations over 50 mm over the coastal sector of the Biobio region, so we prepared and conducted a third IOP for 23 and 24 July 2022. This storm, however, resulted in less than 5 mm in Concepción and thus is not further analyzed here.
The ERA-5 hourly rainfall interpolated to Concepción (Figure 2b) matches the ORA observations remarkably—both in the magnitude and timing of the events—and suggests that most of the precipitation was caused by large-scale processes with a minimum contribution from convection. According to ERA5, each precipitation event was accompanied by a marked increase in PW from a background of about 10 mm to more than 20 mm (Figure 2d). The sounding-derived PW measurements are also superimposed on the ERA5 hourly series, revealing a close match between them. Furthermore, the magnitude of IVT surpassed the 250 kg/m/s threshold to detect AR-like conditions for about 24 h in each of July’s precipitation events (Figure 2c). All these events are interesting in their own way, but here we focus on the larger IVT peaks that coincided with IOP1 and IOP2.
The IVT magnitude reached over 450 kg/m/s during IOP1 and IOP2, signaling the arrival of a category 3 AR, although these values are in the upper quartile of the distribution for south-central Chile [8]. During IOP1, the total magnitude of water vapor transport was primarily dominated by the IVT meridional component. Hence, we refer to this case as the meridional atmospheric river, an extreme expression of tilted ARs. On the contrary, IVT was primarily dominated by its zonal component during IOP2, signaling the arrival of a zonal atmospheric river (ZAR).

3.1.2. The Meridional AR

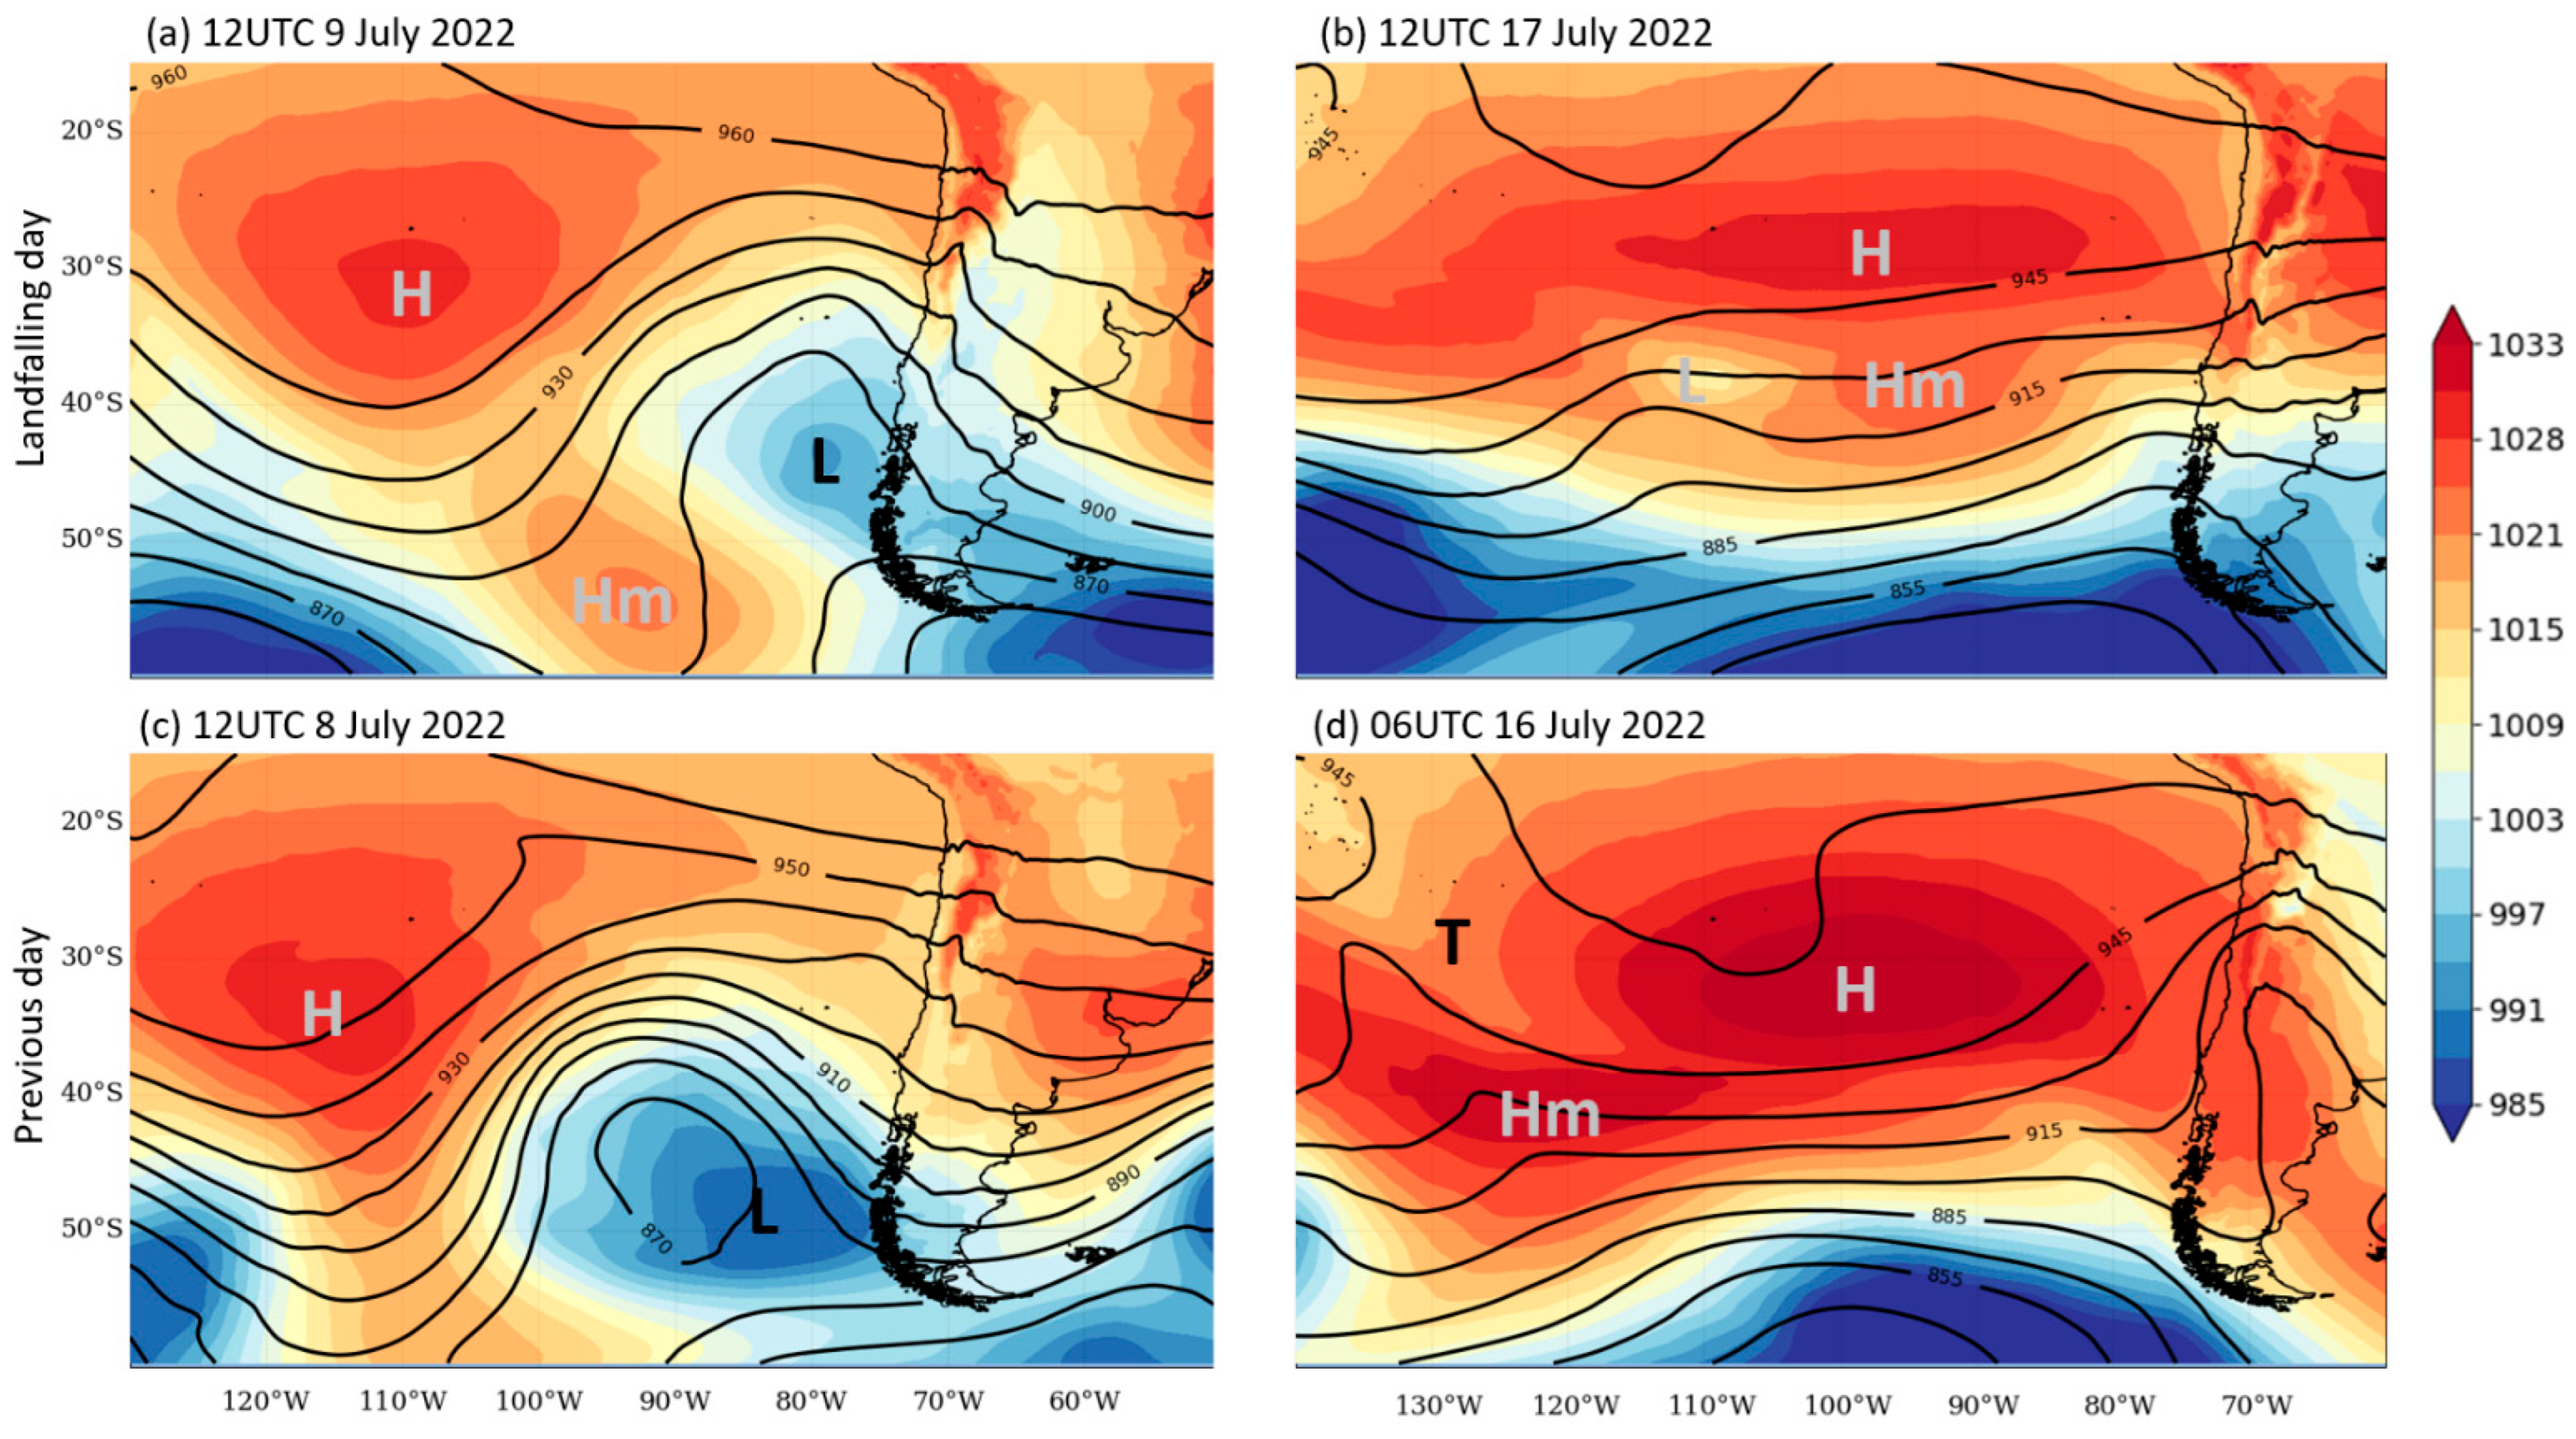
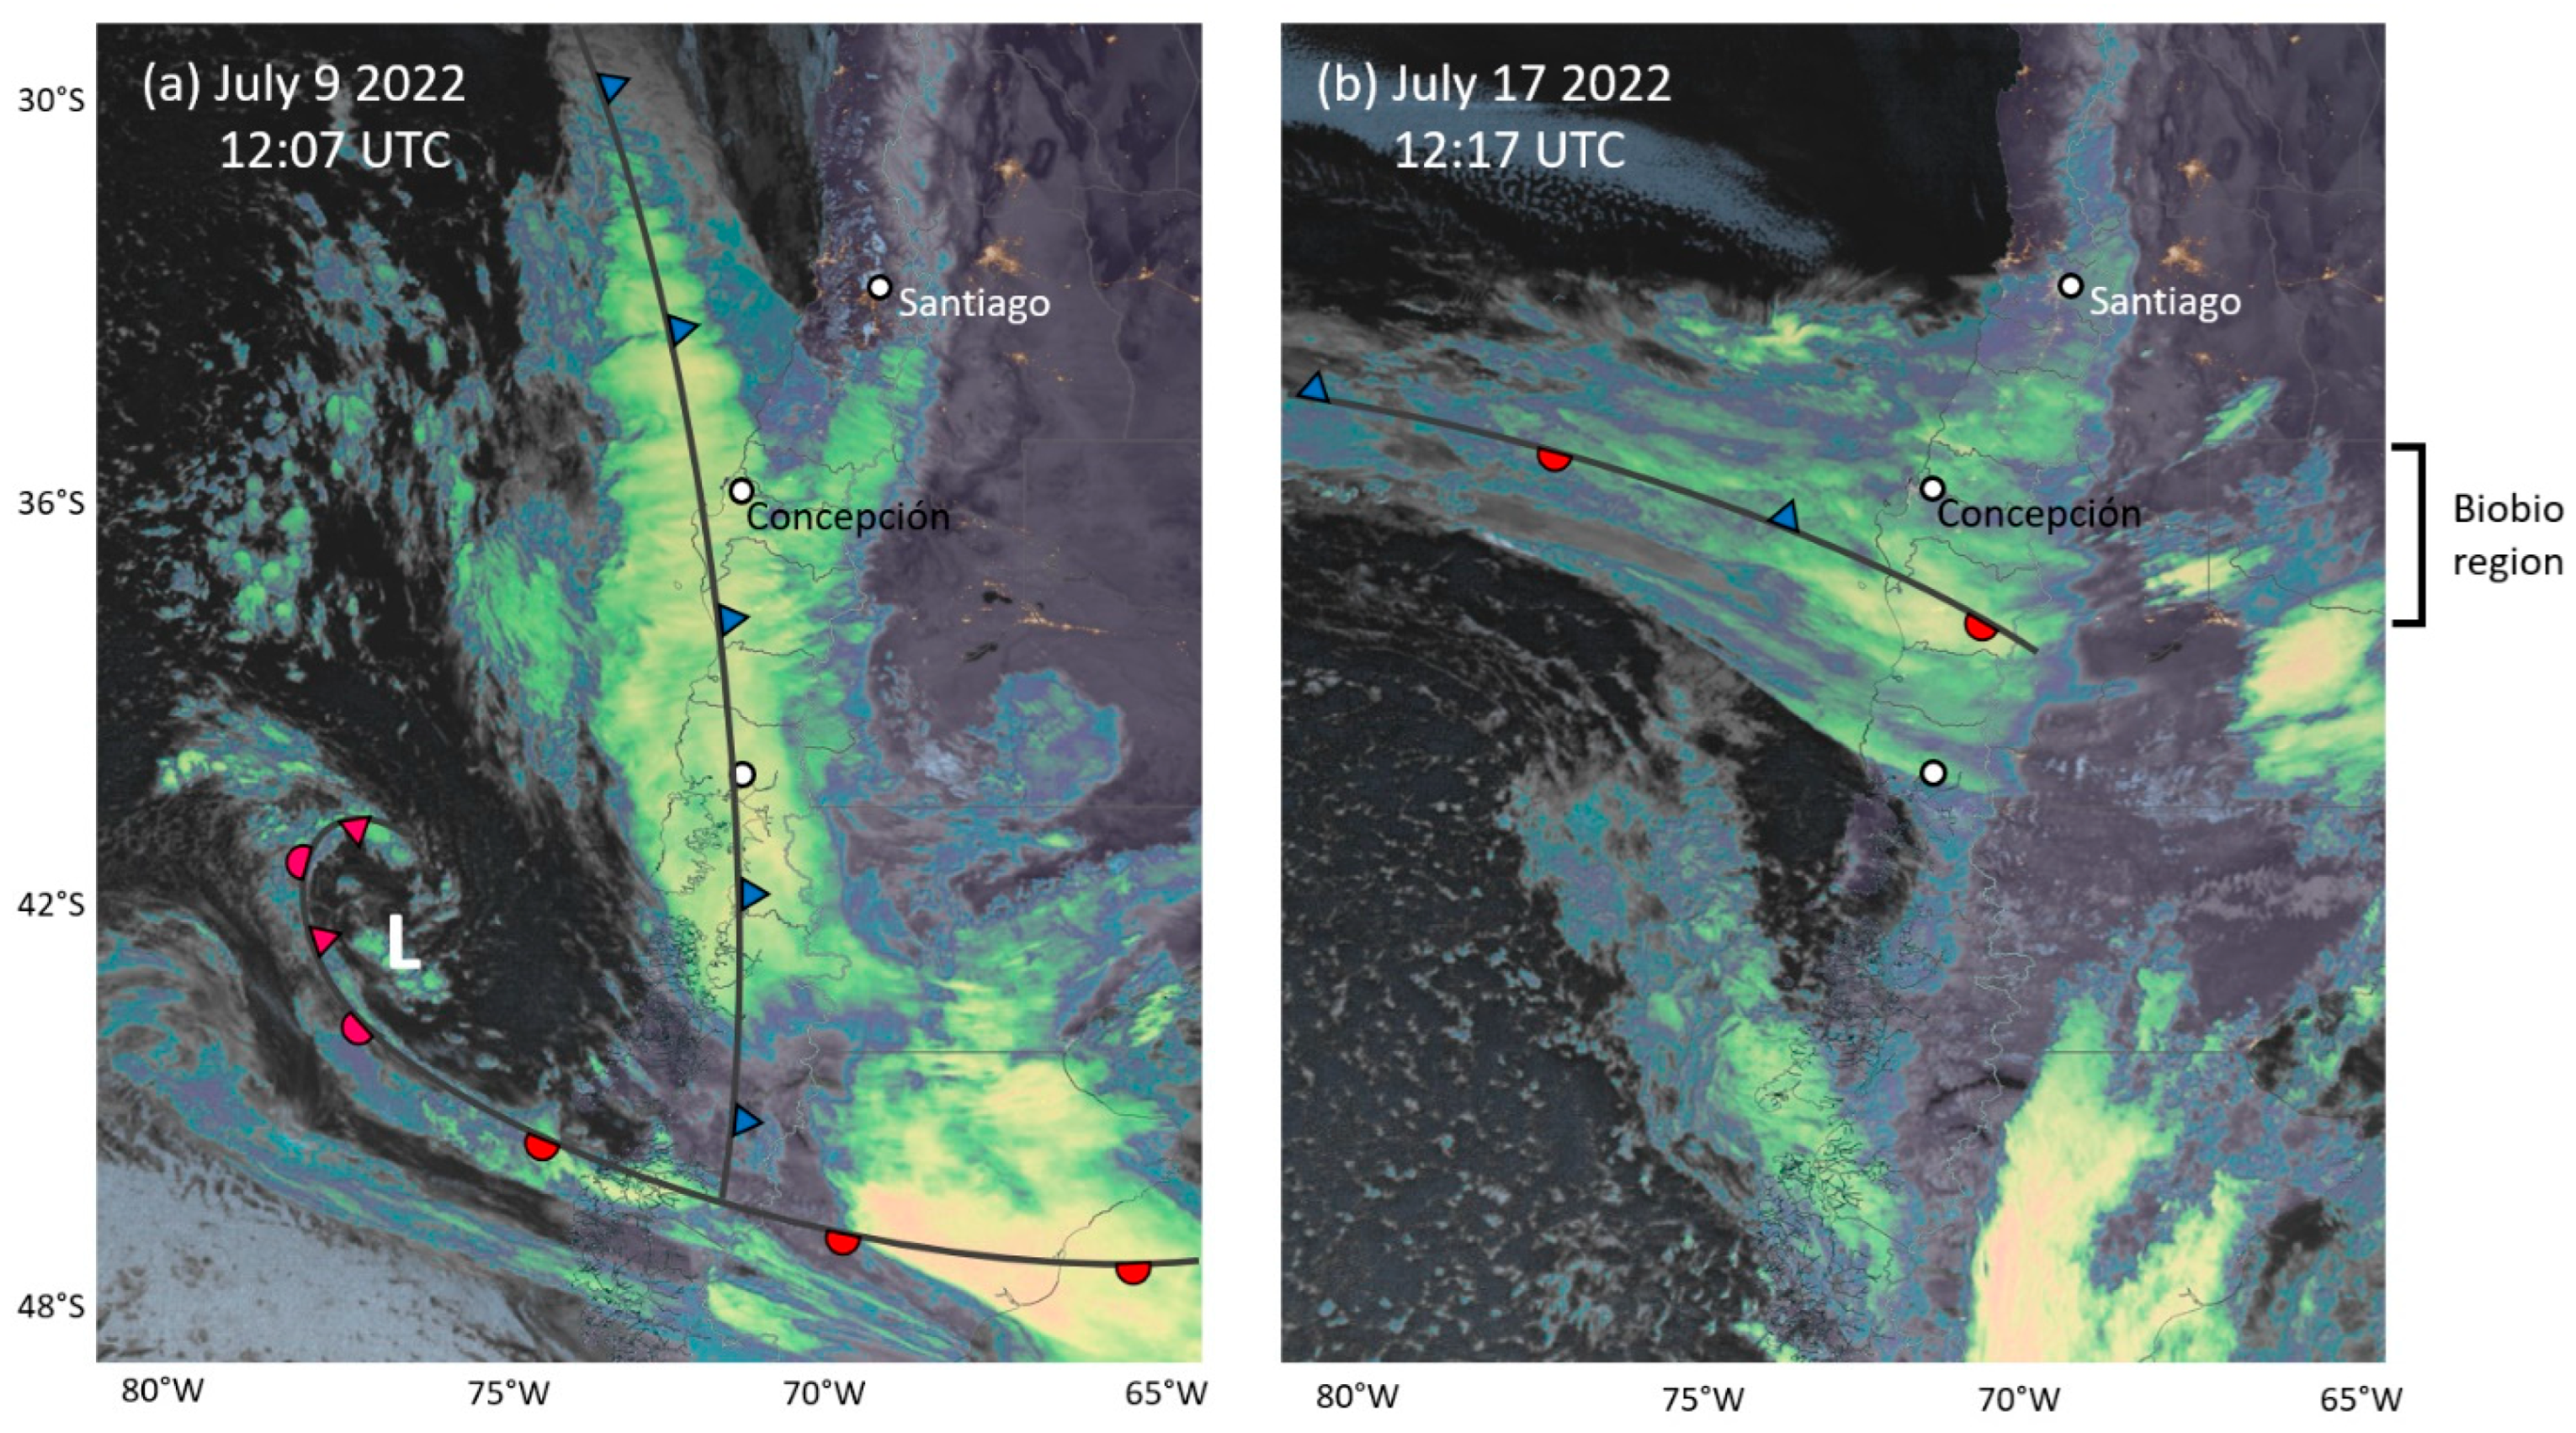
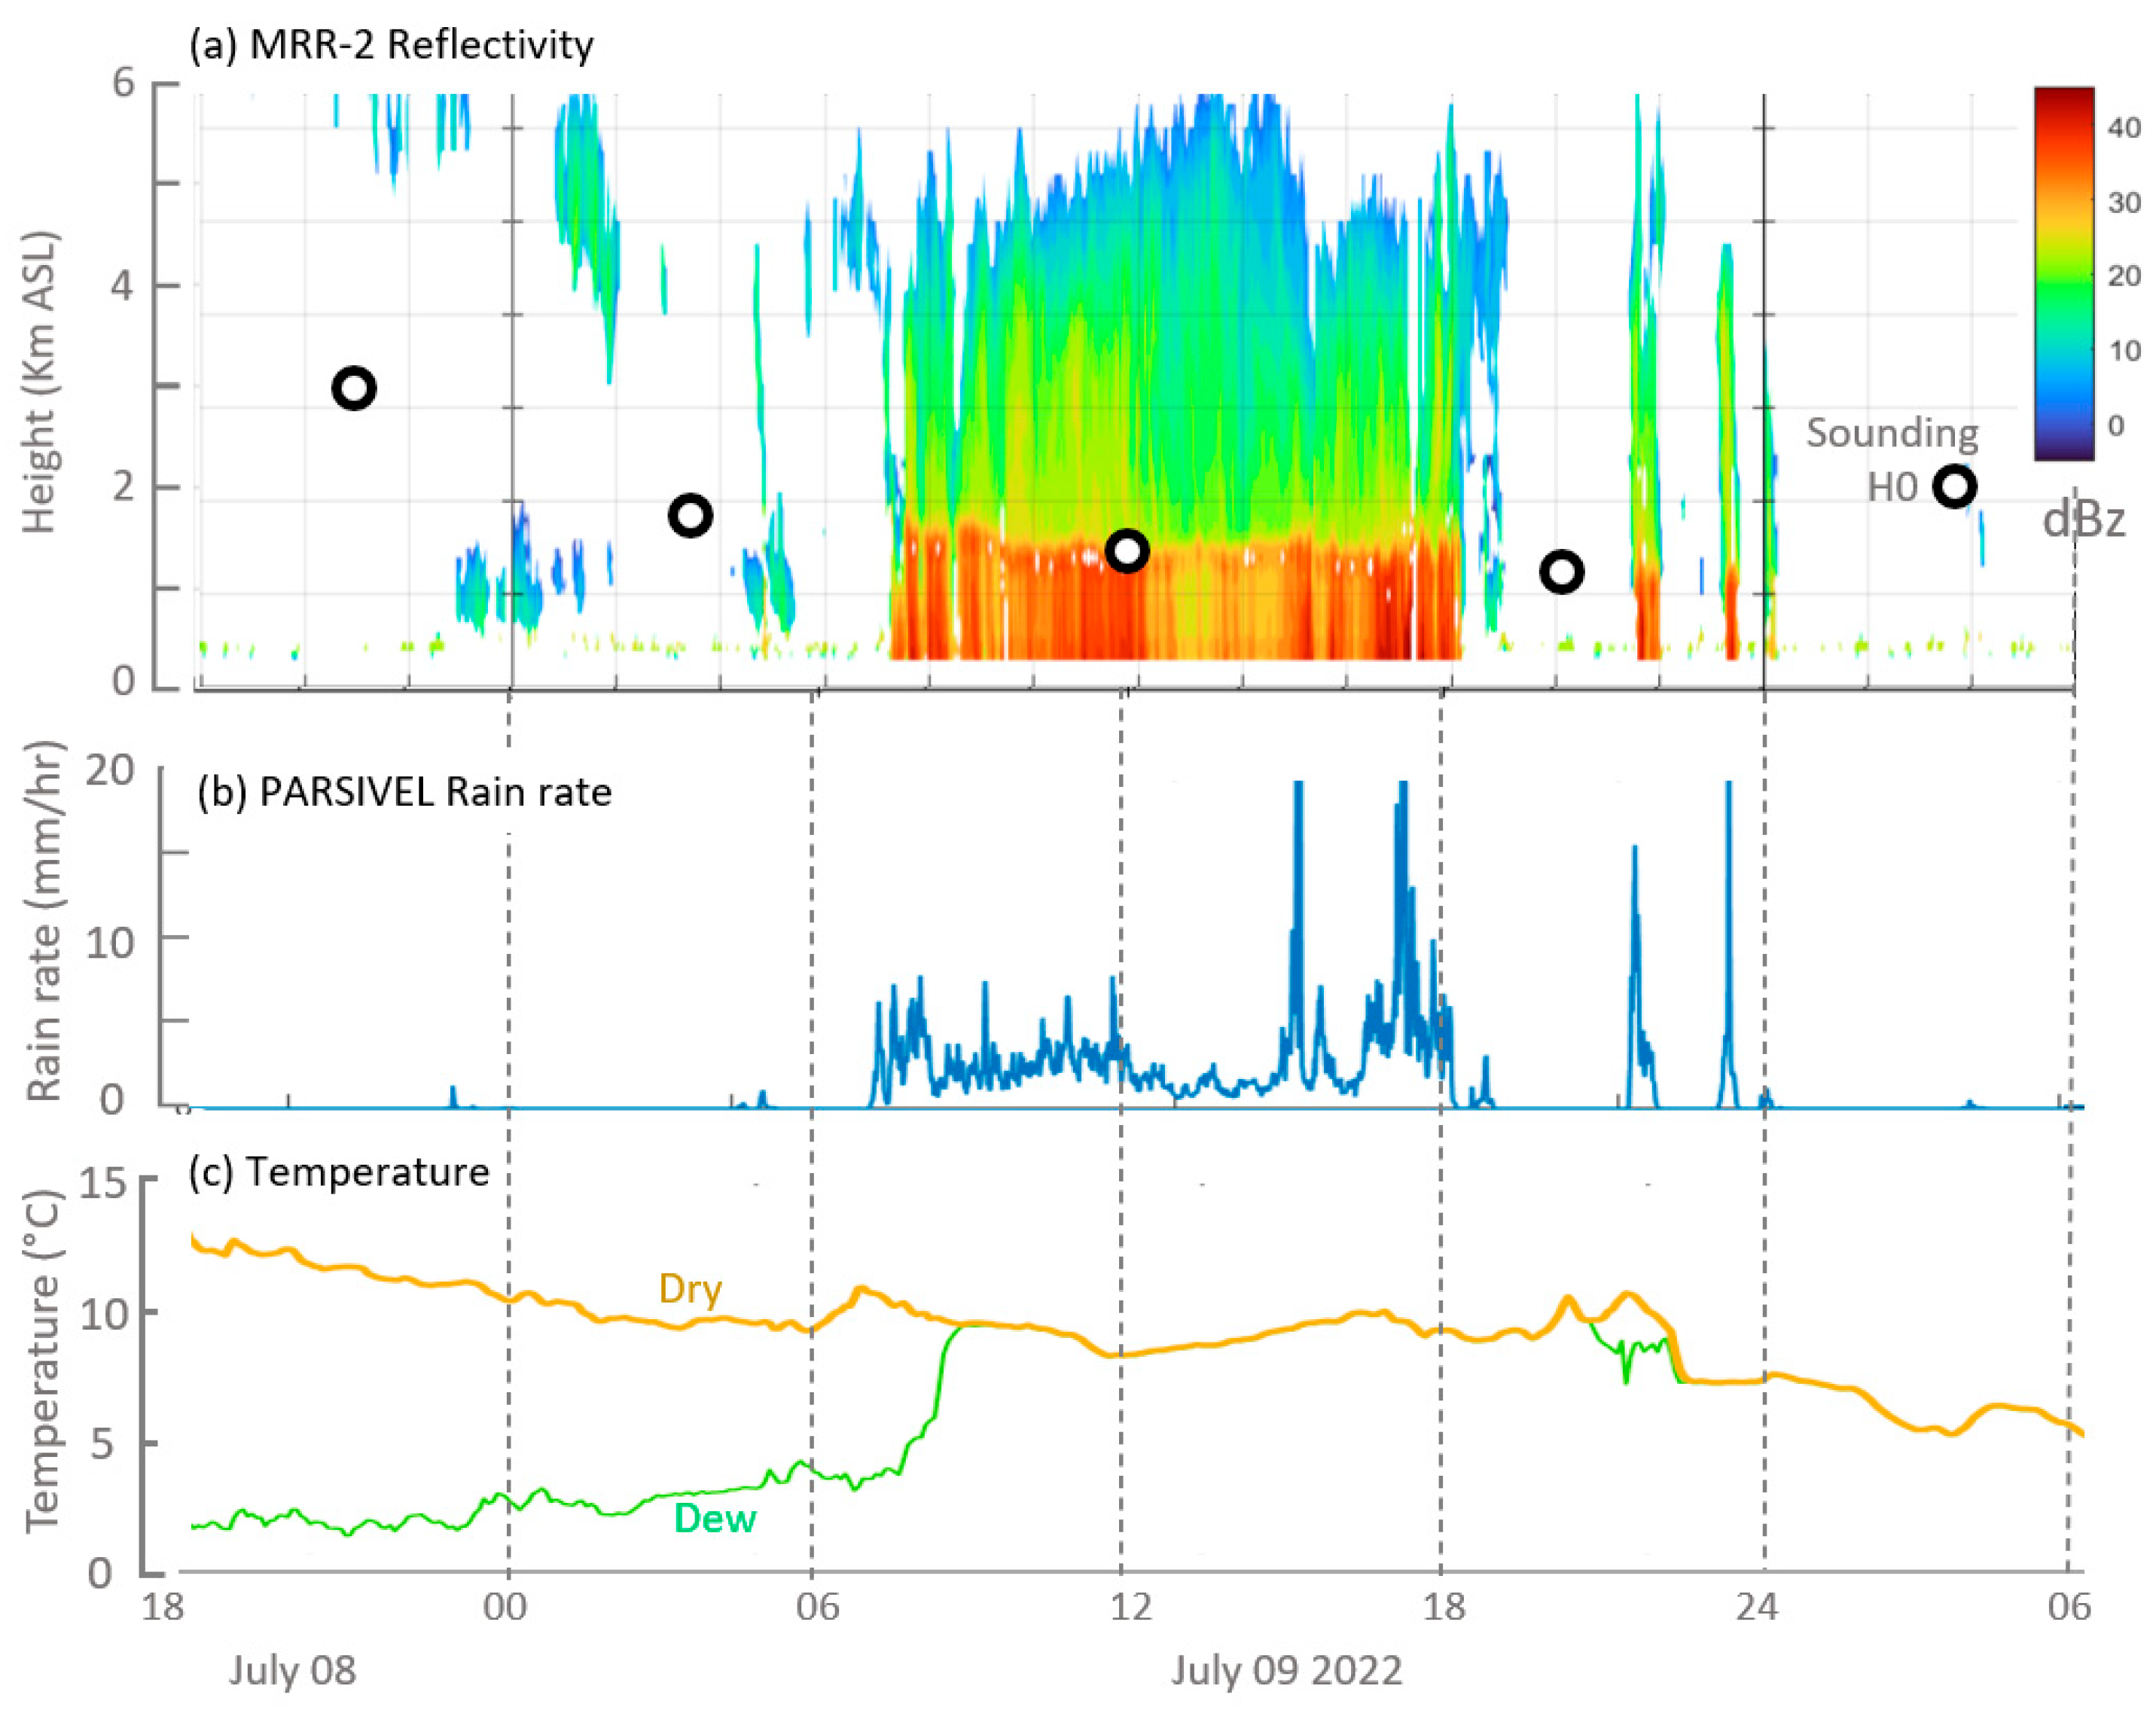
Precipitation in Concepción during IOP1 fell continuously from 8–18 UTC on 9 July, caused by a synoptic-scale system that conforms to the typical pattern of an extratropical cyclone/cold front reaching south-central Chile (Figure 3a–c) during winter [37]. The satellite imagery at the beginning of the episode shows a frontal cloud band reaching southern Chile, nearly parallel to the Andes Cordillera (Figure 4a). The cold front was, in turn, anchored in a deep depression (central pressure 980–990 hPa) near the west coast of South America at about 43° S. By 9 July, the surface cyclone was in its mature stage under a shortwave trough in the middle troposphere. The approaching trough was also evident in a cooling of about 5 °C in the middle troposphere and H0 descending from about 3000 m ASL before the precipitation period to 1500 m ASL towards its end (Figure 2d).
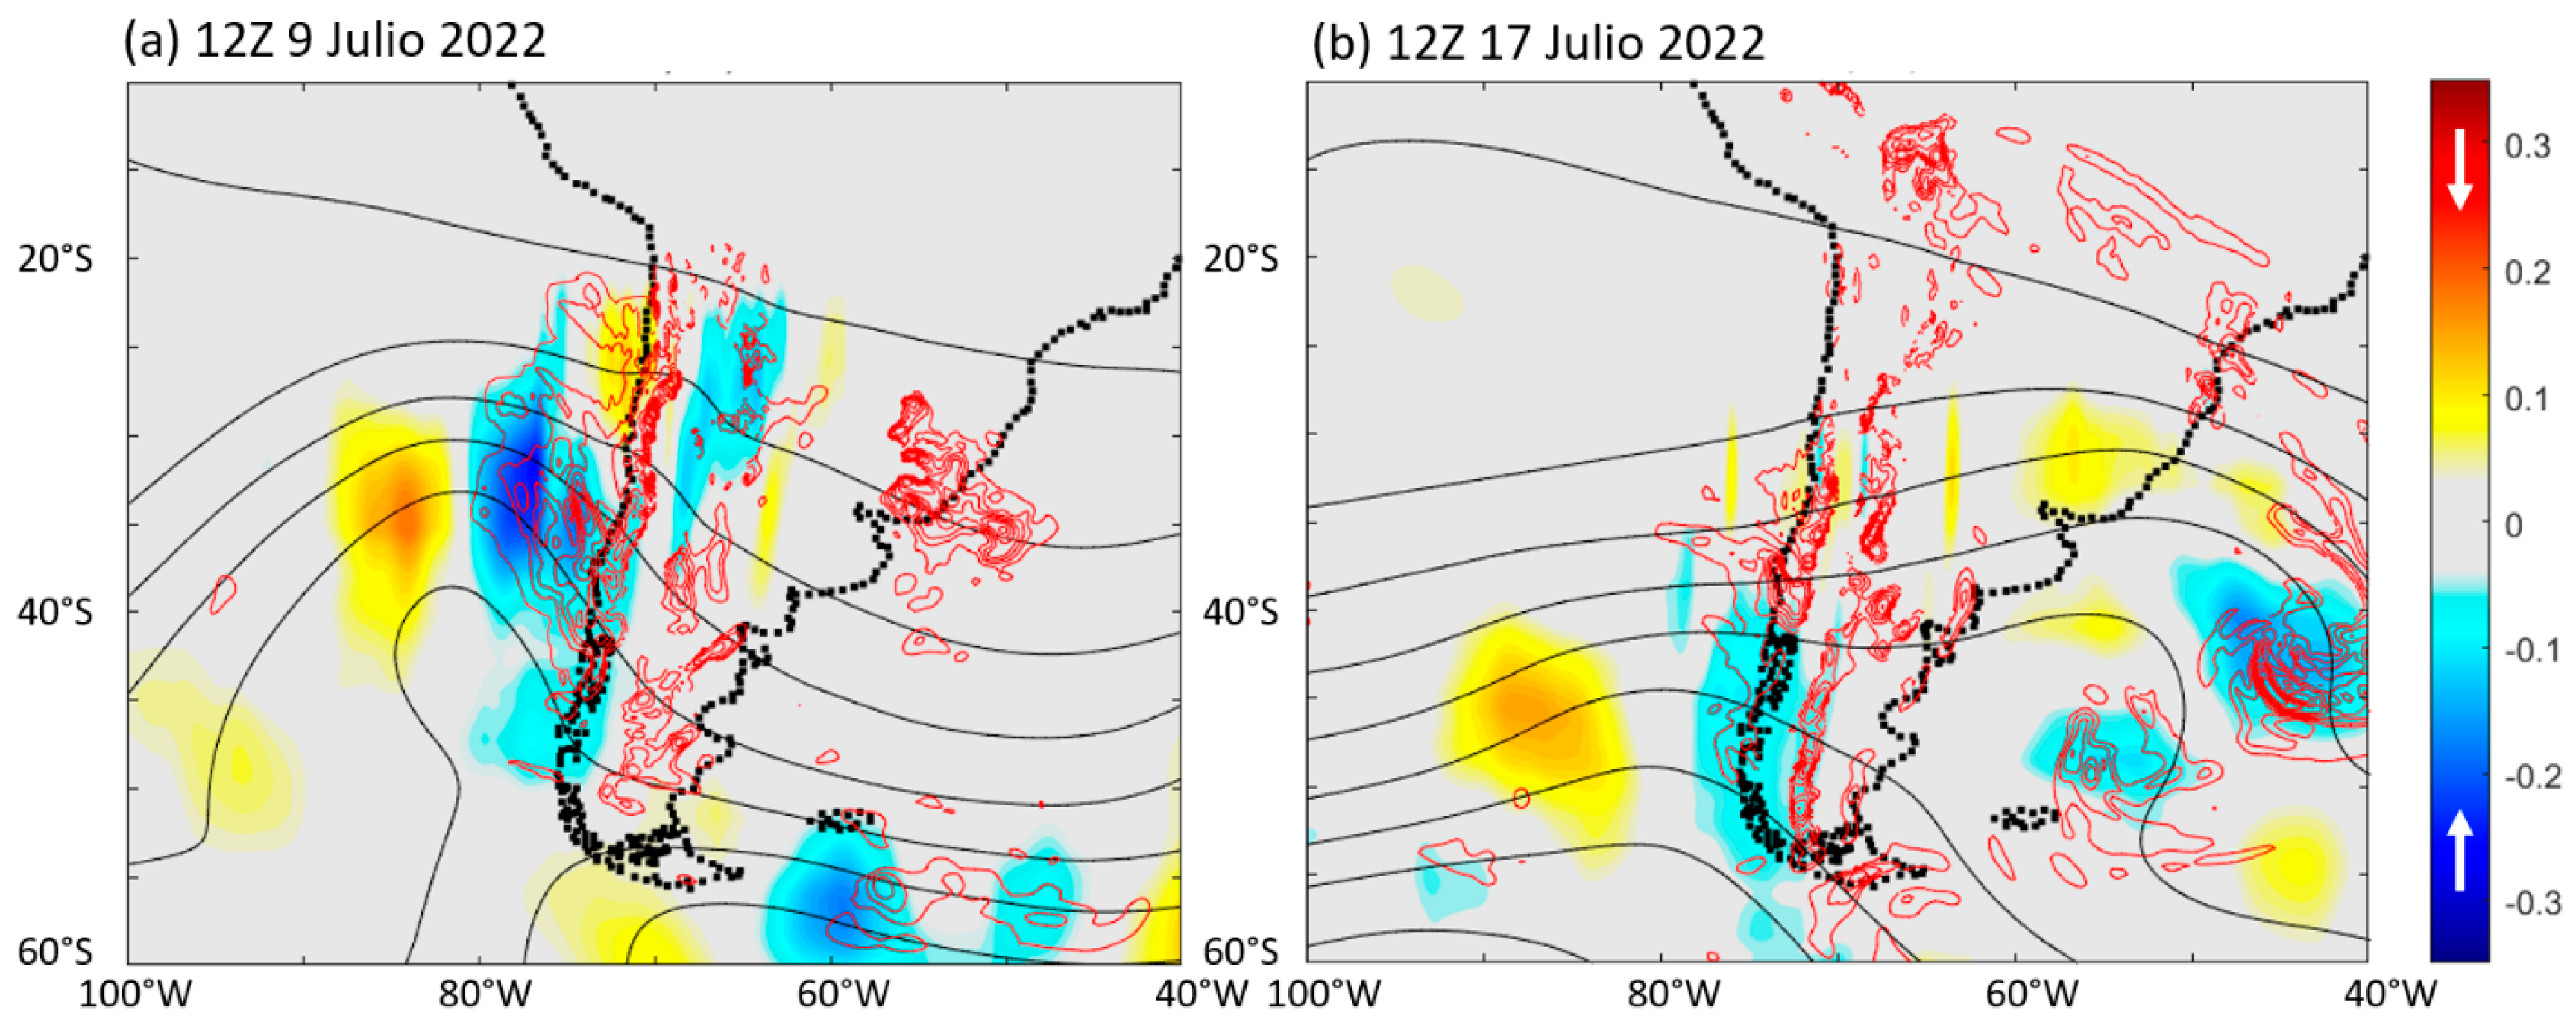
The trough axis extended from midlatitudes to the subtropics parallel to the coast (Figure 3a–c), causing strong NNW winds above 850 hPa. As observed in the soundings at Concepción, the wind became northerly below 850 hPa (e.g., Figure 5a) due to the blocking effect of the coastal range [38]. The sharp trough over the far eastern Pacific and NNW winds downstream resulted in strong cyclonic vorticity advection in the upper troposphere, forcing a large-scale ascent off the Chilean coast and further inland, as signaled by the convergence of the Q-vectors [39] evaluated at the 400 hPa level (Figure 6a). This area of mid-level convergence broadly coincides with the area of ascent in the reanalysis field.
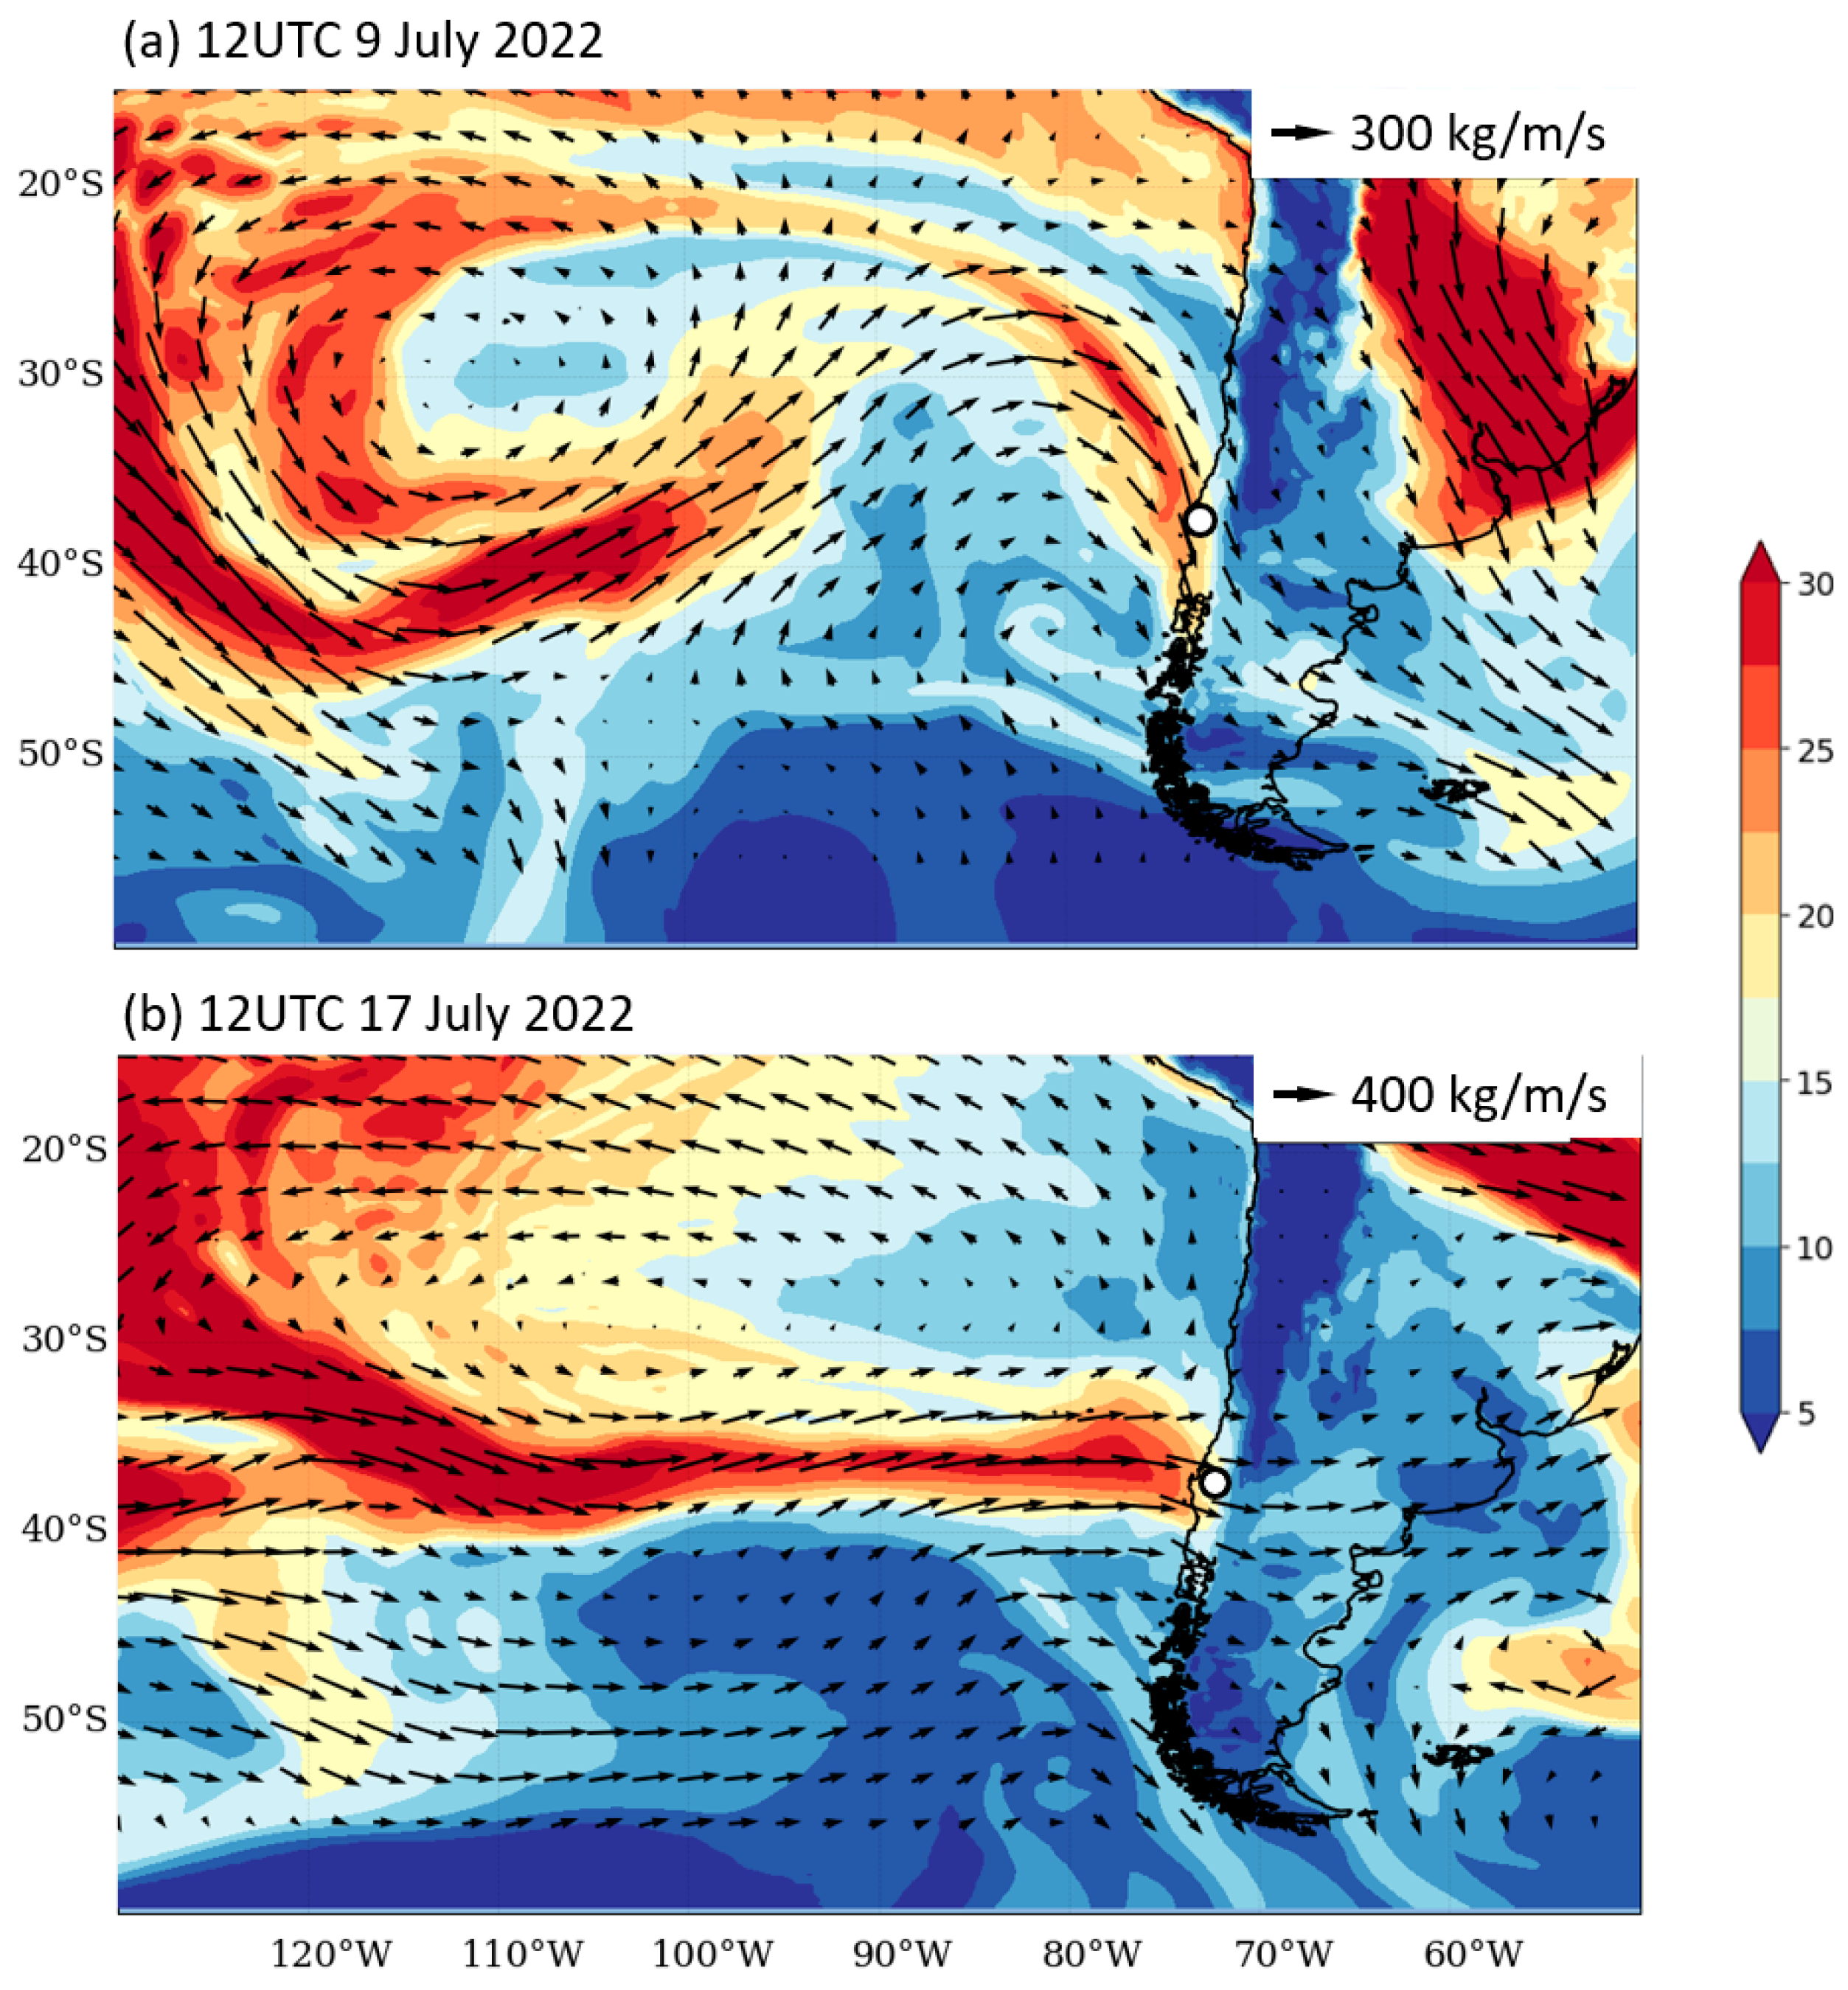
The PW field during IOP1 featured a narrow tongue of high values (>30 mm) arching from the subtropical Southeast Pacific towards southern Chile (Figure 7a), where the sounding at Concepción exhibited near saturated conditions in the lower and middle troposphere and neutral stability (except in the lowest 1500 m where moist unstable conditions occurred; Figure 4a). The high moisture content and strong northerly flow resulted in a well-defined, meridionally oriented AR off the Chilean coast with a maximum IVT magnitude ~400 kg/m/s that made landfall in the Biobio region around 12 UTC on 9 July and remained in place for the next 12 h (Figure 7a).
During the frontal period, the MRR-2 at ORA detected falling hydrometeors up to 6 km ASL from 8 to 18 UTC on 9 July, followed by two isolated cloud towers at the end of that day (Figure 8a). Minute rain rates varied between 2–6 mm/h most of the time, but high rates (>20 mm/h) were recorded briefly at the end of the main precipitation period and during the isolated post-frontal shafts. The deep precipitating cloud over Concepción produced continuous rain coincident with nearly saturated and isothermal conditions (Figure 8c), minimum pressure, and sustained northerly winds at the surface. The MRR-2-derived melting layer remained at ~1500 m ASL (Figure 8a), indicating ice-initiated precipitation during this period. At around 20 UTC, there was a temperature drop of ~3 °C, the wind speed relaxed, and its direction veered from N to WNW, signaling the arrival of the post-frontal air mass [40].

3.1.3. The Zonal AR

IOP2 also featured continuous rainfall for about 14 h in Concepción, beginning at 4 UTC on 17 July 2022. Unlike the previous AR, however, the mid-level circulation over the far Southeast Pacific was mostly zonal, with a weak trough to the south of 45° S off the coast (Figure 3b–d) and a wide cloud band oriented in the west–east direction between 36° S and 39° S (Figure 4b). Such a large-scale pattern forced weak-if any-vertical motion in our study region, as signaled by the insignificant Q-vector divergence at 400 hPa (Figure 6b, [39]). Furthermore, surface anticyclonic conditions dominated the far eastern Pacific. The warm-core subtropical high was about 2 hPa stronger than average, encompassing a broad longitudinal swath from the Chilean coast (~73° W) to about 120° W. At midlatitudes, just to the south of the subtropical anticyclone, a colder high-pressure center moved eastward for about 36 h to reach ~95° W on July 17 (Figure 3b–d).
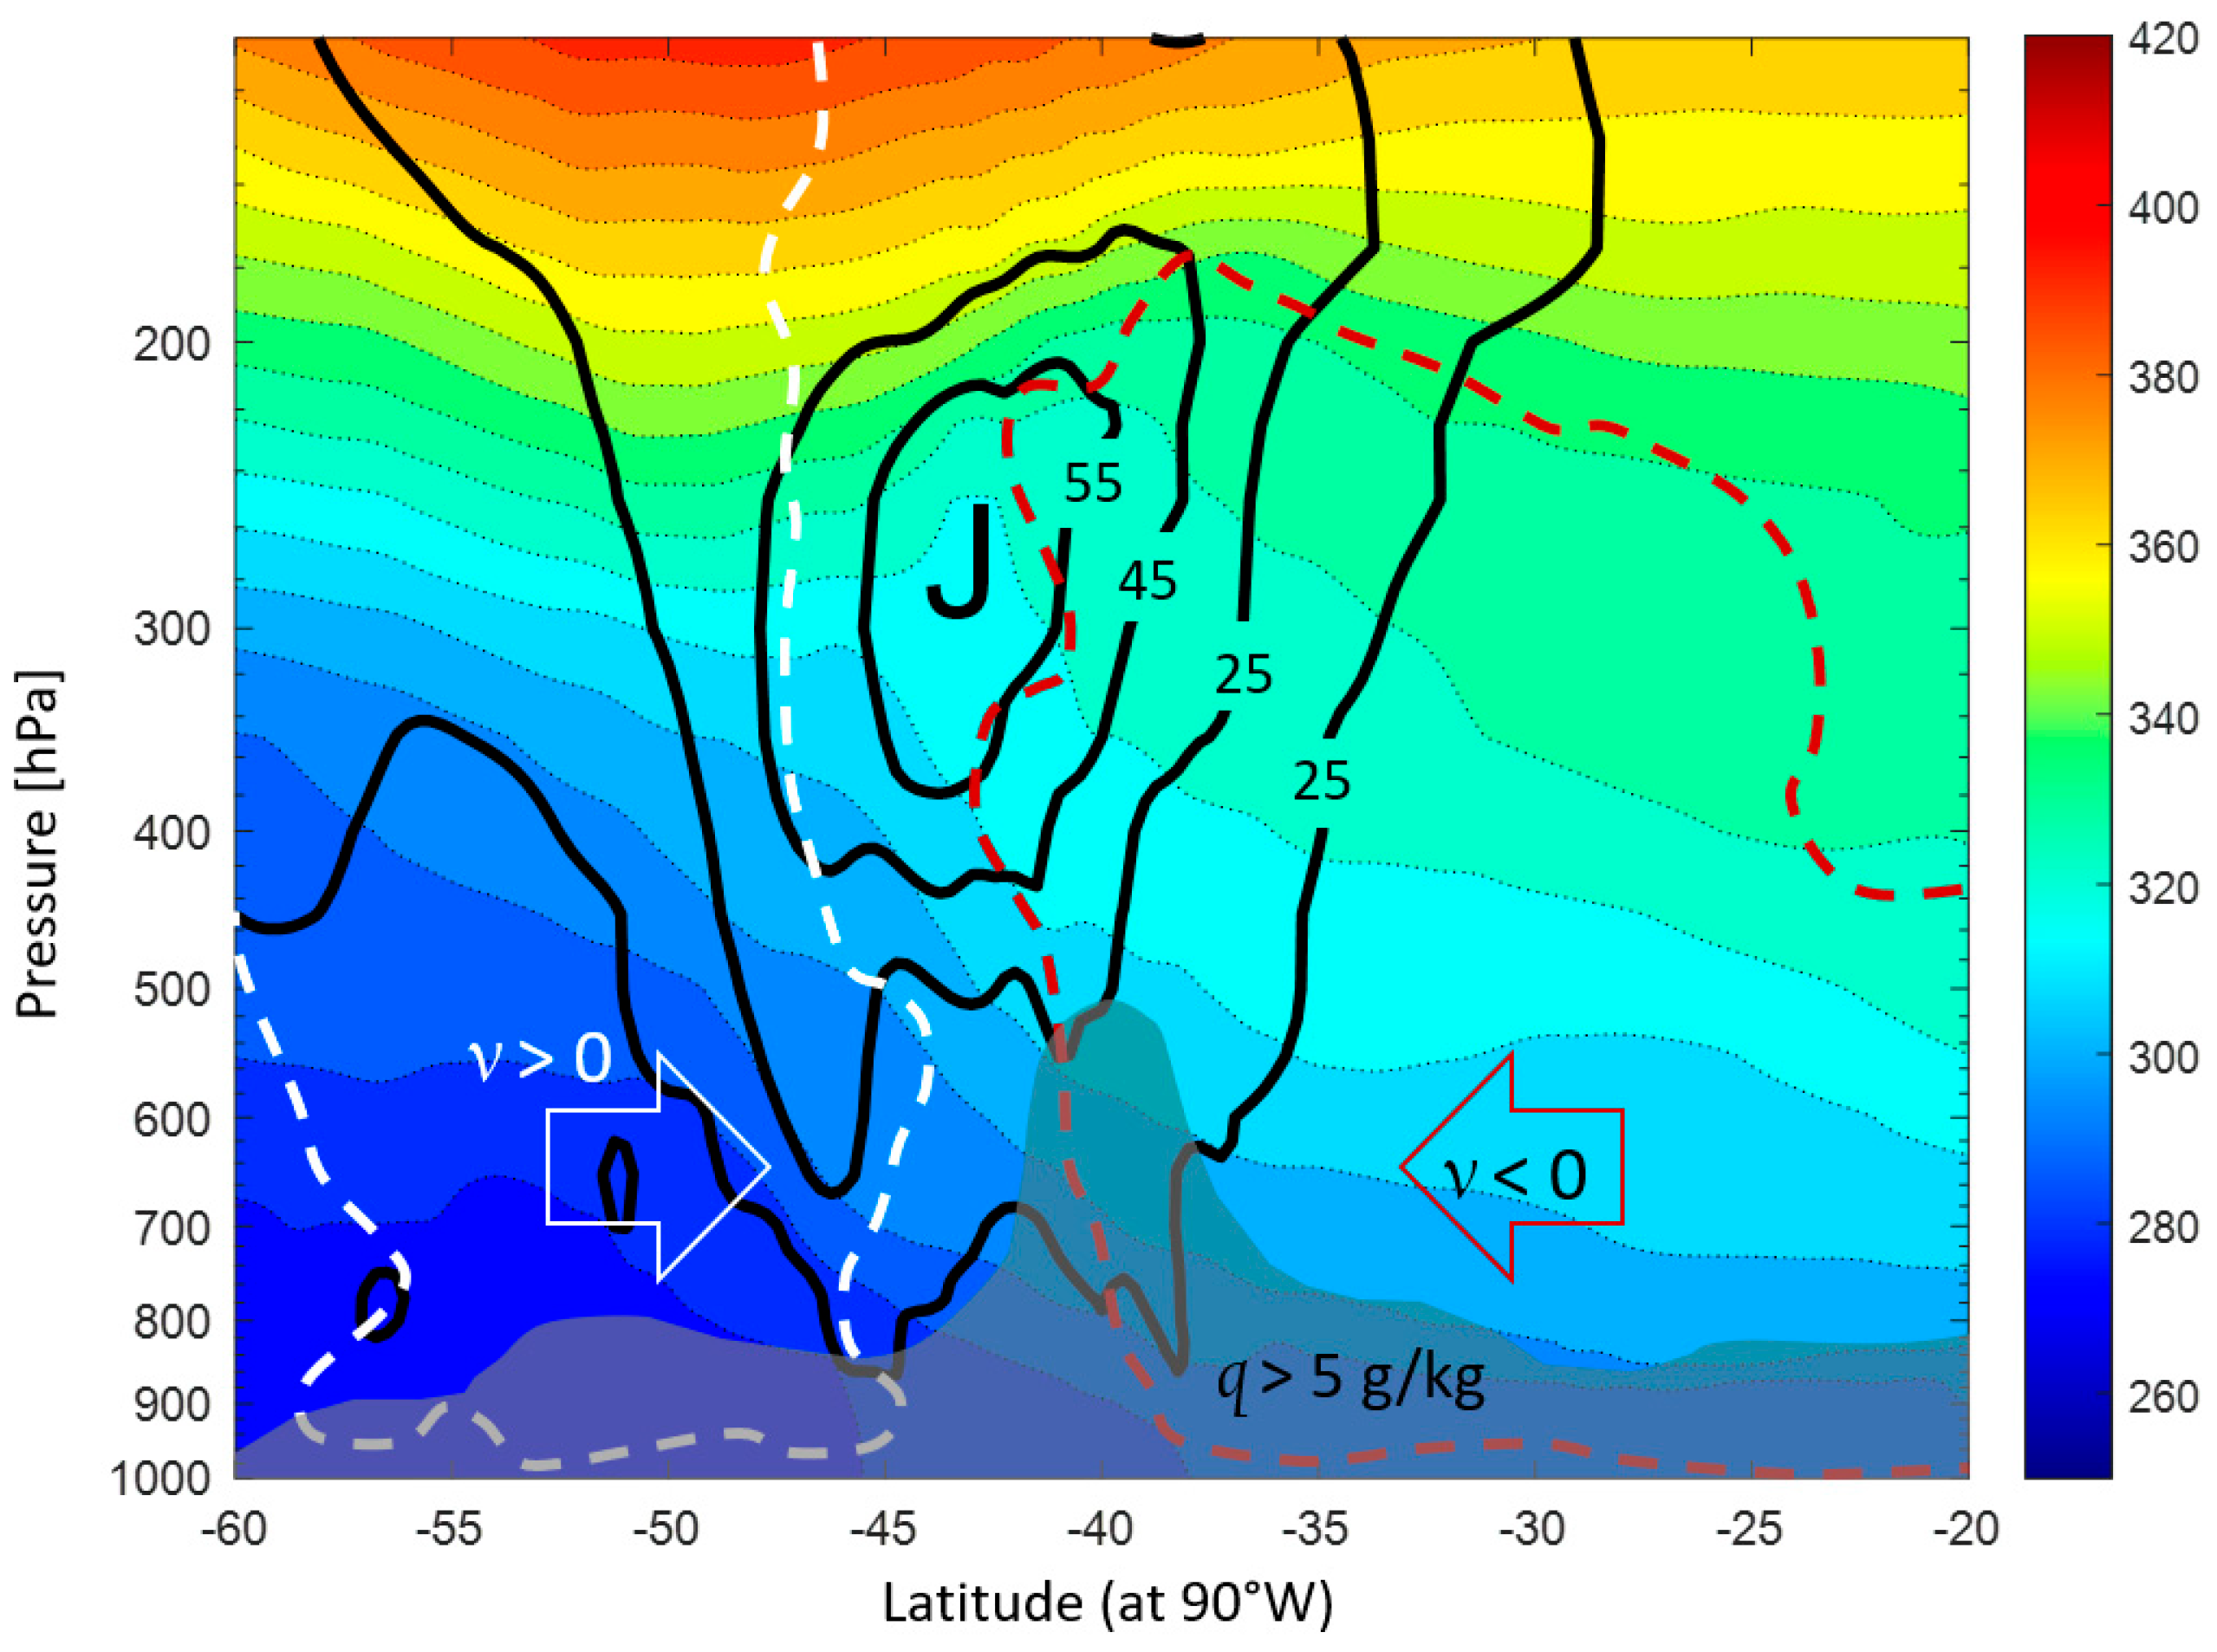
Southwesterly winds along the eastern flank of the migratory anticyclone caused cold advection in the lower troposphere, sharpening a north-to-south thermal gradient and sustaining a stationary front along ~40° S (Figure 9). The thermal wind in this band increased the westerly flow from the surface to the middle and upper troposphere, resulting in a strong zonal jet over the South Pacific that extended from 120° W to the Chilean coast. Tropospheric deep, strong westerlies over the open ocean persisted during 16–17 July (Figure 9). Soundings at Concepción reveal that the zonal jet reached the Chilean coast early on 17 July, although blocking exerted by the coastal range still caused a northerly jet below 850 hPa (Figure 5b). At higher levels, incoming westerlies could cross the Andes, producing a narrow band of ascent upstream of the mountains (Figure 6b).
A low-level trough over the subtropical Pacific centered at ~35° S–125° W on 16 July was another key feature of the large-scale pattern, which fostered northwesterly flow at about 130° W (Figure 3d). The pattern progressed eastward as a low-level low centered at ~40° S, 110° W on 17 July. This caused local moisture convergence and subsequent transport towards the entrance of the zonal jet, feeding the AR that progressed along ~40° S during 16–17 July until reaching the Chilean coast (Supplementary Figure S3). The ZAR over the Pacific was characterized by a narrow (~300 km), long (~3000 km) band of PW exceeding 30 mm and a maximum IVT magnitude of 400 kg/m/s (Figure 7, reanalysis values). At the coast, IVT magnitude peaked at 12 UTC on 17 July with 560 kg/m/s (480 kg/m/s in the zonal direction), a value slightly higher than the maximum during IOP1 due to a warmer, fully saturated profile extending from the surface to 300 hPa and also stronger winds (Figure 5b). Weakly stable conditions were found at all times and levels during IOP2.
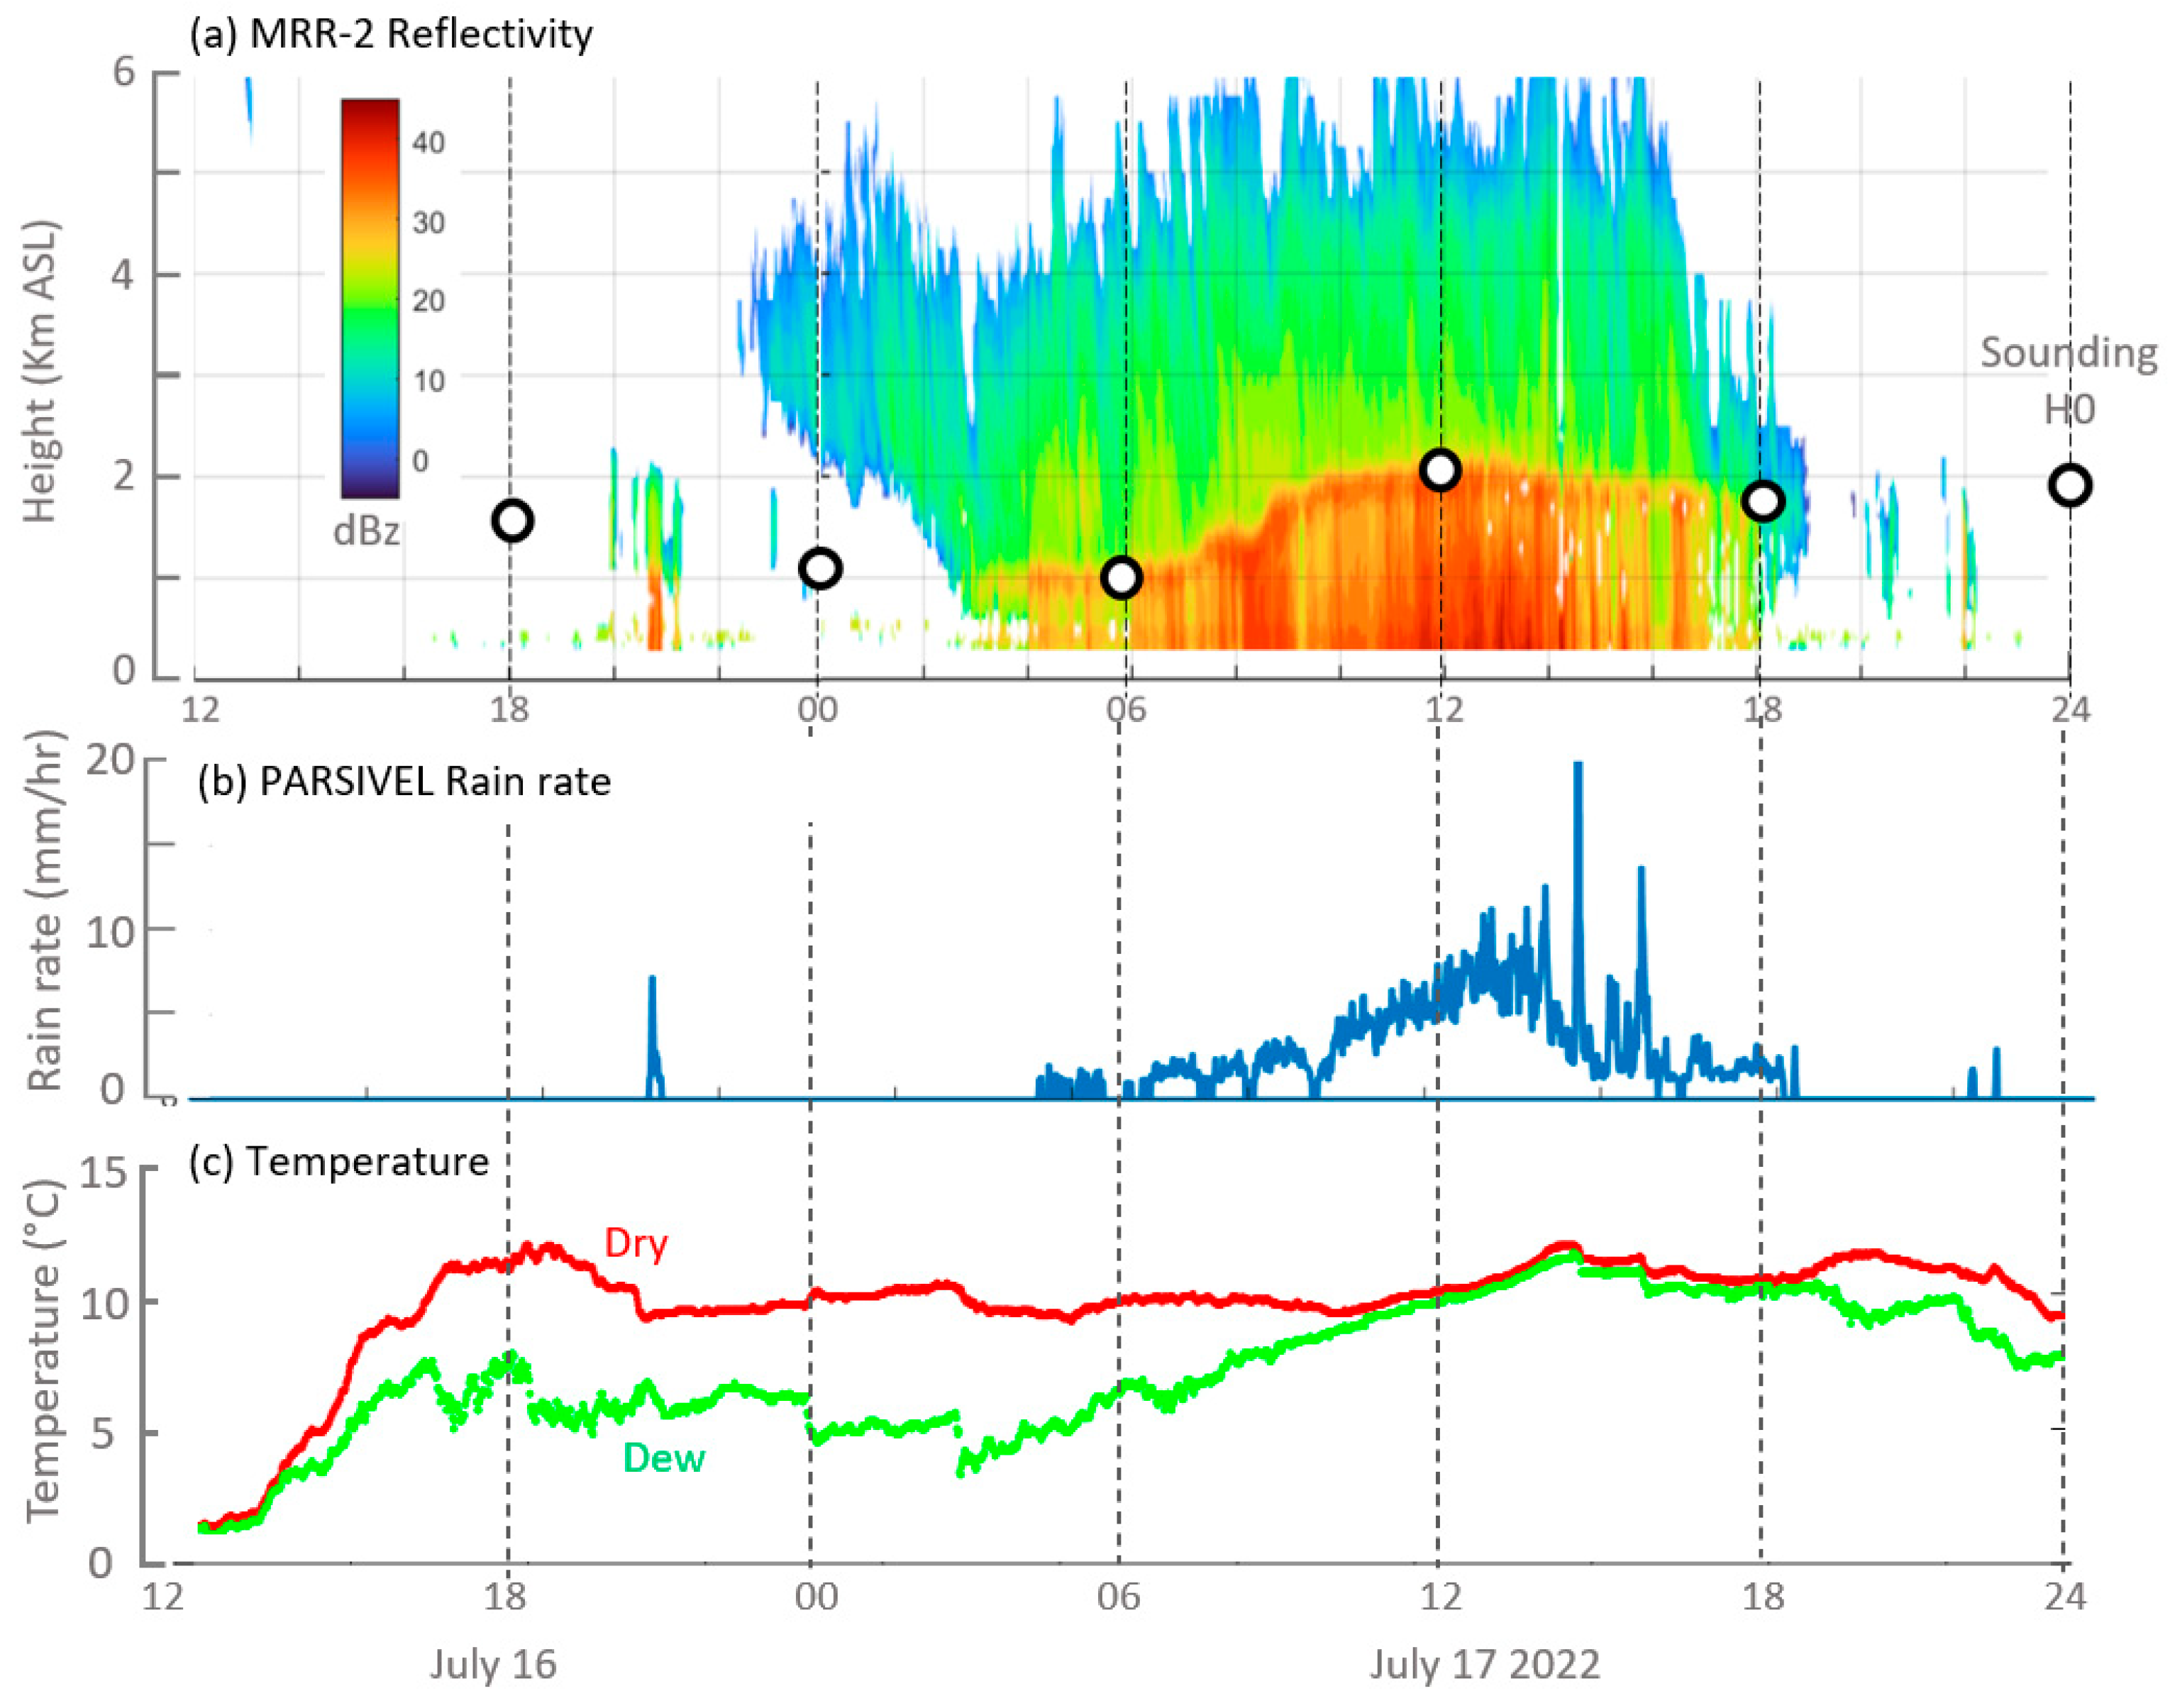
Mid-level virga appeared at 22 UTC on 16 July, with the precipitation edge descending until reaching the surface at 4 UTC on 17 July (Figure 10). Light rain (<1 mm/h) fell until about 9 UTC, coincident with unsaturated and isothermal surface conditions. Later, minute rain rates increased markedly, reaching >10 mm/h until 14 UTC, followed by light rain in the next two hours. The heavy rain period was accompanied by an increase in temperature and saturated conditions at the surface (Figure 10c). The MRR-2-derived melting layer height closely matches the sounding measurements of H0 (Figure 10a), and, more surprisingly, it also increased from about 1000 m ASL at the beginning of the storm to 2000 m ASL by 12 UTC, signaling that the ZAR brought both moist and warm air to the coast of south-central Chile. After 14 UTC, the melting layer height subdued slightly, the surface wind relaxed, and pressure increased, indicating the stationary front’s passage over Concepción.

3.1.4. Precipitation Distribution

The observed (station data) storm-total precipitation is shown in Figure 11, superimposed on the WRF simulated (control run, domain 2) accumulation, considering a 36-h period for both IOPs. WRF accumulations agree with the observations (r = 0.62 for IOP1 and r = 0.71 for IOP2 in domain 2, see Supplementary Figure S4) and allow us to characterize the precipitation field more continuously and over the high terrain.
Consistent with the oblique pattern of the meridional AR and frontal cloud band, the precipitation accumulation during IOP1 encompassed the full latitudinal range of the domain and exhibited several NW–SE-oriented bands off south-central Chile (Figure 11a). There is a well-defined maximum (>80 mm) in the coastal zone just south of Concepción, where the Nahuelbuta mountains stand out, intercepting the moist-laden stream directly [40]. Large accumulations (>60 mm) also occurred along the foothills of the coastal range to the north of Concepción. Further inland, precipitation decreases (<30 mm) over the central valleys and then increases over the western slopes of the Andes. Notably, the orographic enhancement was moderate (~15 mm/km in the 300–3000 m altitudinal range), and maximum accumulations were less than 60 mm in the Biobio region (36–39° S), even though the mean height of the Andes still surpasses 2000 m ASL there. The orographic enhancement was more substantial (~25 mm/km) in the northern sector of the domain, where the cold front arrived towards the end of IOP1 and the Andes surpassed 5000 m ASL.
The precipitation distribution during IOP2 was largely restricted to the 36–39° S band directly impacted by the ZAR, which remained in place for the whole period (Figure 11b). The storm accumulation was generally <20 mm off the coast but increased sharply along the coast of the Biobio region, especially near the Nahuelbuta mountains (>80 mm). Precipitation decreased slightly over the central valley and increased again over the western slope of the Andes. Unlike IOP1, Andean accumulations exceeded 80 mm in many sectors, thus producing a more substantial orographic enhancement (~20 mm/km) in the range of latitudes of the Biobio region.

3.2. Compositing Analysis

3.2.1. Event Selection

The two components of the daily mean IVT for a 1° × 1° lat–lon grid box over Concepción are shown in a polar plot in which the symbol size is proportional to the accumulated precipitation (Figure 12a). Both variables are from ERA5, covering the austral winter (May/August) from 2000 to 2020. Consistent with previous studies, the angle of IVT at the coast varies more or less continuously between 90° (zonal direction) and 180° (meridional direction), with most ARs oriented along the NW-SE direction [16], while the magnitude of IVT is correlated with the coastal precipitation [37]. Despite their distinctive large-scale pattern, ZARs are not particularly evident in the coastal IVT plot because, even in these cases, the orographic blocking results in a low-level northerly flow along the coast (e.g., Figure 4b), favoring the meridional component of IVT. On the contrary, upper-level westerlies dominate during a ZAR, even over the Andes, so to better identify these cases, Figure 12b shows the wind components at 300 hPa (u300, v300), colored according to IVT magnitude and sized according to the accumulated precipitation (same grid box and period as panel a). AR days are selected using an IVT magnitude threshold of 350 kg/m/s and precipitation greater than 20 mm/day; ZAR further requires strong zonal and weak meridional components (u300 > 30 m/s and v300 < 10 m/s), resulting in 31 independent cases. The remaining cases (67 days) are pooled into the tilted AR group (TAR).

3.2.2. Large Scale Patterns

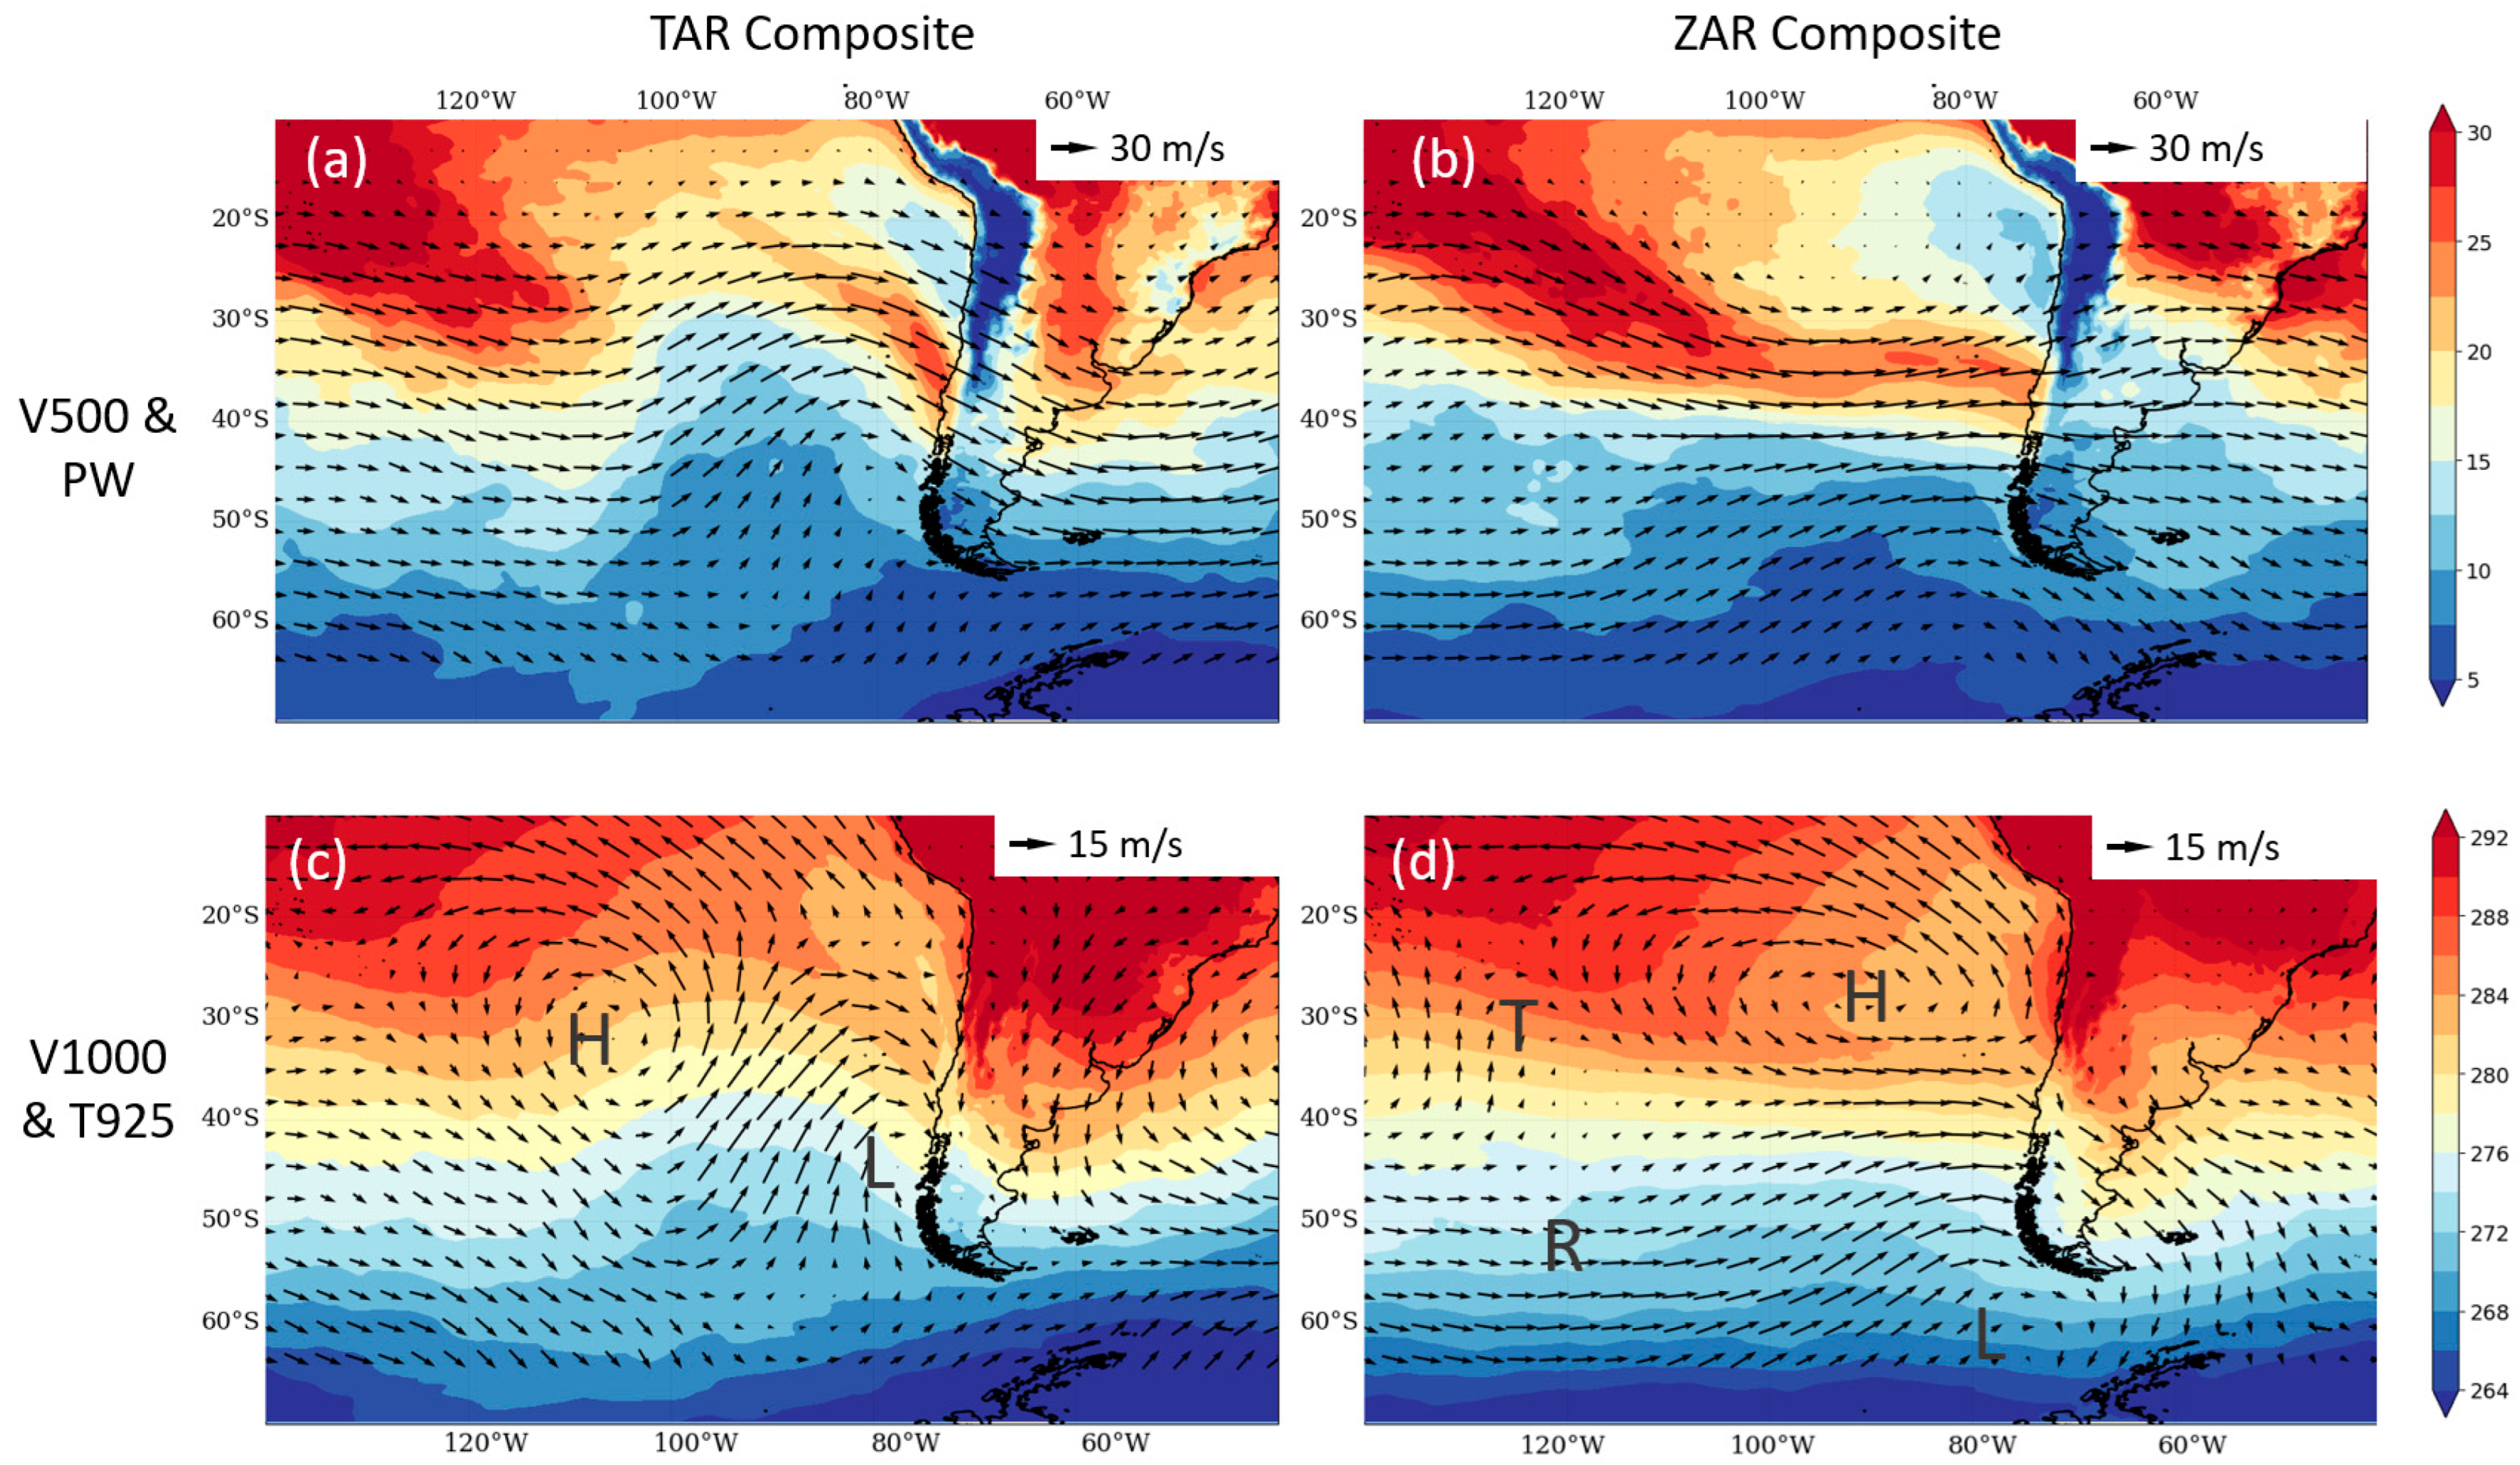
To document the large-scale features of the ZARs and TARs, we next display the mean fields of selected variables for each group side-by-side. Since most cases have a one-day duration, the composite represents the conditions during the AR landfall in south-central Chile. The mid-level circulation (Figure 13a) shows a marked trough over the Southeast Pacific and NW winds over south-central Chile during TAR cases. There is a broad region of mid-level ascending (descending) motion upstream (downstream) of the trough axis. Likewise, the near-surface winds reveal a closed low over the southern tip of the continent, producing northerly flow off the south-central Chile coast, and a subtropical anticyclone displaced well to the west of its climatological position. In between the surface high and the midlatitude cyclone, southerly winds produce cold advection that sustains a cold front arching from the Chilean coast to the subtropical Pacific (Figure 13c).
In the ZAR cases, there is mid-level zonal flow across much of the Pacific, and WSW winds off central Chile signal a weak ridge approaching this region (Figure 13b). The vertical velocity field shows a narrow area of ascending motion upstream of the Andes, revealing the dominant role of orographic uplift in these events. The zonal flow at midlatitudes also dominates the mean low-level circulation and exhibits four salient features around it (Figure 13d). First, over the eastern Pacific, the subtropical anticyclone is strong and encompasses from the Chilean coast to 110° W, while a weak cyclone is located well to the south, near the Drake Passage. Inspection of individual ZAR cases (including the one during IOP2) reveals these lows are most often in their demise phase and always centered south of 45° S. Second, farther west (130–120° W), the pressure couplet reverses with a ridge at midlatitudes and a trough in the subtropics. These features are rather subtle in the composite map because of their variable position among the ZAR sample, which is stronger in individual cases. SW winds at mid-latitudes—between the ridge and aging low—are particularly relevant by strengthening the meridional low-level temperature gradient just to the south of the subtropical anticyclone (Figure 13d), thus intensifying the tropospheric deep zonal jet from about 110° W to the Chilean coast.
The composite map of PW for the TAR sample shows a tongue of high values just north of the surface cold front that draws moisture from the subtropical Southeast Pacific (Figure 13a). This band of high moisture and the prevailing NW flow result in an AR of moderate intensity (300 kg/m/s) impinging upon south-central Chile with an acute angle (as it should be by the construction of this sample). In the ZAR composite, NW wind around 120° W between the subtropical trough and the Southeast Pacific anticyclone seems instrumental in stretching the reservoir of high PW at low latitudes toward the entrance region of the zonal jet that swiftly transports water vapor eastward, thus forming the ZAR that finally impinges upon the Andes with an average IVT magnitude of 400 kg/m/s (Figure 13d).

3.2.3. Precipitation Distribution and Thermal Differences

The distinctive precipitation distribution between the mean ZAR and TAR is illustrated by the composite map of their differences (Figure 14a). The larger precipitation off the coast in the TAR composite is caused by the broad-scale ascending motion upstream of the mid-level trough and narrow ascent along the cold front that often reaches subtropical latitudes. None of these factors operate in ZAR cases. On the other hand, precipitation over the slopes of the Andes is larger in the ZAR cases, despite their IVT magnitude at the coast not being much different than their TAR counterpart, since they maximize the moisture flux against the Andes [37]. Using ERA5 data, we found that precipitation increased by a factor of 2.2 ± 0.5 (mean ± 1 std) between the central valley and the slope of the Andes in the Biobio region (36–39° S) for the TAR sample. In contrast, precipitation is very weak offshore in the ZAR composite but increases sharply over south-central Chile (Figure 14). The average precipitation enhancement in these cases is 3.4 ± 0.3, significantly higher than the TAR counterpart and the climatological value reported by [14] for this range of latitudes. As a result, accumulated precipitation over the western slope of the Andes tends to be higher during ZAR cases relative to TAR cases, for a comparable level of IVT magnitude at the coast. This is shown in Figure 14b by the mean ± one standard deviation of the precipitation over the elevated terrain of the Biobio region for both types of events, stratified in three categories of IVT magnitude. As expected, mountain precipitation increases with the amount of moisture flux, but the tendency is more marked in the zonal cases. For the high category of IVT magnitude, mean ZAR precipitation is about 50% larger than its TAR counterpart. Nevertheless, there is substantial variability among the cases for a given category and type of AR because a simple metric such as the one presented in Figure 14b cannot account for the distribution of precipitation over the complex terrain of south-central Chile.
The mean temperature profile at the coast in ZAR cases is 1–2 °C warmer than the TAR profiles because the ZAR is typically located in the north (warm sector) of a nearly stationary front that slowly progresses northward along the coast. In contrast, TARs are also found in the warm sector of a cold front that moves northward more rapidly. An important consequence of the distinct thermal environment is that the mean 0 °C isotherm height was 2.7 ± 0.7 km ASL and 2.1 ± 0.9 km ASL in the ZAR and TAR groups, respectively. These H0 values are calculated over Concepción (coastal grid box), so the actual rain-snow limit may be several hundred meters lower over the inland mountains that reach up to 3.5 km ASL in south-central Chile (and up to 6 km ASL farther north). Nevertheless, the difference in coastal H0 implies that Andean basins have a larger pluvial area during ZAR events than TAR events, whose effects are discussed later.

4. Discussion

The meridional and zonal ARs probed during IOP1 and IOP2 in July 2022 represent extremes of the broad distribution of the IVT angle during winter storms in the Biobio region of south-central Chile (Figure 12) but exhibit the same features that were found in the composite analyses based on larger samples, underscoring the relevance of their in-depth analysis. Beyond the attending large-scale circulation patterns, the fine-scale precipitation distribution revealed by the WRF simulations is similar to the composite distribution of their respective groups, with more offshore precipitation during the meridional and larger orographic enhancement during the ZAR, highlighted by the map of precipitation differences between IOP1 and IOP2 (cf. Supplementary Figure S5 and Figure 14).
Although the orographic enhancement was weaker during the meridional AR compared with the ZAR, the Andes cordillera impacted both storms, as revealed by the WRF sensitivity experiments, in which the topography was reduced by a factor τ across the inner domain. Supplementary Figure S6 compares the IOP precipitation accumulation for the extreme case τ = 0.1 against τ = 1 (control run) in domain 2. There is an evident reduction in both cases over the continent and the adjacent ocean, suggesting that the orographic modification extends several hundreds of kilometers offshore regardless of the orientation of the moisture flux. The oblique precipitation bands for IOP1 (meridional AR) are still discernible over the ocean for τ = 0.1, but their magnitude is reduced to ~1/3 of the control values (Supplementary Figure S6). Inland, the maximum accumulations over the coastal range and the Andes are absent, leading to a precipitation decrease of ~65% relative to the control run. For IOP2 (ZAR), there are minor differences between τ = 0.1 and τ = 1 offshore because precipitation was low in that sector even in the control run. On the contrary, the large accumulations over the Andes found in the control run are absent in the low-topography experiment. When considering the precipitation within a box located over the Andes for all the experiments, it is interesting to note that the reduction during the meridional AR is relatively linear in the whole range of τ (from 1 to 0.1). During the ZAR, instead, there is a weaker reduction of the accumulation as elevation decreases until τ = 0.25, followed by the rapid decline that we found for τ = 0.1 (Supplementary Figure S6).
Warm winter storms with an elevated melting layer (identified by high H0) are of particular concern in central Chile because they deliver rain, instead of snow, over the high Andes, amplifying their immediate hydrological response [41]. The occurrence of these so-called warm winter storms has been associated with ZAR in previous studies [15,16]. Still, the detailed measurements at ORA reveal that H0 can rise during a ZAR, increasing the risk it poses as the rain can melt the snow deposited over the mountains in the early stages of the storm, a process that we refer to as auto-ROS (rain-over-snow).
Based on our cases of study and compositing analyses, we speculate that the ZARs convey more hazardous conditions than the TARs by producing larger orographic precipitation over the western slopes of the Andes concurrent with a relatively warm environment, enlarging the pluvial area. A formal demonstration of the ZAR’s augmented risk is beyond the scope of this work, but we noted that some recent disasters in south-central Chile occurred in connection with a ZAR landfall. On 3 May 1993, a moderate precipitation event (as measured in low-elevation stations) triggered a landslide outbreak in the foothills of the Andes just east of Santiago, causing more than 80 fatalities [42]. Although the term “ZAR” had not been coined yet, a cursory analysis of the synoptic conditions reveals the presence of a strong AR impinging normally on the Andes of central Chile. A single but massive landslide took the lives of more than 25 people in December 2017 in Villa Santa Lucia (44° S), western Patagonia, triggered by intense rains up to 3000 m ASL caused by another ZAR [43]. The summer months are extremely dry in central Chile. Still, a strong ZAR made its way to this region in late January 2021, causing a “winter storm in the middle of the summer” with detrimental social and economic impacts [18]. ZARs have also resulted in major and widespread flooding in south-central Chile in July 2007 and, more recently, in June 2023 [17].
The larger rainfall accumulations over the western slope of the Andes in ZARs relative to TARs are ultimately caused by the augmented efficiency of the orographic precipitation enhancement as the moisture flux impinges perpendicular to the mountains in the zonal cases. Indeed, the relevance of the AR main axis orientation relative to the topography has been recognized along the west coast of North America [21,22,23] and the United Kingdom [23]. Moreover, the differences in the moisture source and orientation of the ZAR relative to the TAR are reminiscent of types I and II ARs, respectively, reaching Arizona in the United States, as described in [39]. Type I ARs also feature a zonal alignment, and the broad-scale circulation induces a weak convergence of the Q-vector at mid-levels so that most of the ascent is caused by orographic uplift. Type II ARs are more meridional and accompanied by a marked mid-level trough off the coast of Baja California that induced widespread ascending motion over the region of interest [39]. We further note that the subtropical-extratropical (30–40° of latitude) west coasts of South and North America have a similar frequency of landfalling ARs [7] and geographical settings. The coastline in North America has a general NW-SE orientation, so the typically tilted ARs in the North Pacific impinge nearly normal over the inland mountains [23,39]. In that region, south–southwesterly-oriented ARs produce, on average, more precipitation over coastal watersheds than westerly-oriented ARs [23]. In South America, however, the coastline runs north–south, so the less frequent ZARs are the cases that maximize water vapor flux against the Andes and may cause the largest precipitation and flooding for a given value of IVT magnitude. This emphasizes the need to consider metrics beyond the IVT magnitude and duration [10,12] to assess the risk of atmospheric rivers in south-central and austral Chile. Among them, the IVT angle and attending temperature stand out as critical variables in Chile and elsewhere.

5. Concluding Remarks

The west coast of extratropical South America exhibits one of the largest frequencies of landfalling atmospheric rivers, with ARs accounting for more than half of the accumulated precipitation in south-central Chile and may cause extreme rainfall events and floodings. The angle of the AR main axis varies in a wide range, and here we separate the events between zonal cases—reaching the coast nearly perpendicular—and tilted cases—when the AR is oriented from NW to SE. Using ERA-5 data from 2000–2020, we found that zonal cases are only one-third of the total sample (~100) of ARs reaching the coast of the Biobio region (36–39° S). ZAR, however, exhibits an average orographic precipitation enhancement about 50% larger than the average of the tilted ARs, thus causing more precipitation over the western slope of the Andes for a comparable level of IVT magnitude. This situation was evident in two case studies conducted in July 2022 that were documented in further detail using special observations carried out at the Atmospheric River Observatory located in the coastal city of Concepción at 37.5° S. We also found that precipitation during ZAR events occurs in a warmer environment relative to tilted cases, increasing the hydrometeorological risk of these events. The ZAR sampled in July 2022 even exhibits a marked rise in the melting layer as the event develops.
Zonal and tilted ARs occur under distinctive broad-scale circulation patterns. The mid-level circulation during the most common TAR shows a marked trough rapidly advancing over the Southeast Pacific and NW winds over south-central Chile. There is a broad region of mid-level ascending motion and a surface low upstream of the trough axis, thus conforming to a typical baroclinic wave reaching the west coast of extratropical South America. In the ZAR cases, there is tropospheric-deep zonal flow across much of the Pacific and WSW winds off central Chile. The zonal tongue of high PW in these cases originates far from the coast, around 120° W, where a subtropical trough and the Southeast Pacific anticyclone seem instrumental in stretching the reservoir of high PW at low latitudes toward the entrance region of the zonal jet that swiftly transports water vapor eastward. Close to the coast, the vertical velocity field shows a narrow area of ascending motion upstream of the Andes, revealing the dominant role of orographic uplift in these events.
In closing this section, we acknowledge that the dependence of regional precipitation on AR orientation has been documented along the west coast of North America, where southwesterly-oriented ARs produce more precipitation than zonal cases. That is the opposite situation to the one reported in our work due to the different orientations of the coastal and inland mountain ranges in these regions.

Supplementary Materials

The following supporting information can be downloaded at: https://www.mdpi.com/article/10.3390/atmos15040406/s1. Figure S1: A picture of the Atmospheric River Observatory (ORA) on the roof of the Geophysics Department, University of Concepción. The sensors are detailed in Table S1; Figure S2: WRF domains configuration. Domain 1: 9 km grid spacing; Domain 2: 3 km grid spacing; Domain 3: 1 km grid spacing. Yellow start indicates location of Concepción; Figure S3: Composite maps of precipitable water (color, mm) and 850 hPa wind vectors (arrows) from 48 h to landfall time for the ZAR; Figure S4: WRF Validation. (a) and (b): Hourly WRF precipitation (domain 2, 9 km) interpolated to Concepción for IOP1 and IOP2, respectively. (c) Scatter plot between WRF accumulated precipitation interpolated to stations within domain 2 against observed accumulations for IOP1 and IOP2; Figure S5: The difference in WRF (domain 2) accumulated precipitation (colors, mm) for IOP1 minus IOP2; Figure S6: Sensitivity analysis using WRF (Domain 2) for (a) IOP1 and (b) IOP2. The horizontal axis is the topographic factor (τ) applied to the terrain elevation. The vertical axis is the accumulated precipitation in the offshore (blue), coastal (red), and Andean (yellow) boxes defined in the inset map. The circle corresponds to the mean accumulation and the vertical line is the range of values within the box. There is a linear accumulation decrease in the Andean box across the full range of τ for IOP1 (MAR) but only up to 0.25 in IOP2 (ZAR); Table S1: Sensor’s details at Atmospheric River Observatory (ORA).

Author Contributions

Conceptualization, R.D.G.; methodology, R.D.G., M.J.-C. and J.C.M.; investigation, R.D.G., M.J.-C., J.C.M. and D.A.N.; writing—original draft preparation, R.D.G.; writing—review and editing, R.D.G., M.J.-C., J.C.M. and D.A.N. All authors have read and agreed to the published version of the manuscript.

Funding

This research was funded by ANID Chile, grants FONDECYT Regular 1211412, FONDECYT Regular 1211898 and COPAS Coastal FB210021.

Institutional Review Board Statement

Not applicable.

Informed Consent Statement

Not applicable.

Data Availability Statement

The ERA5 reanalysis used in this study is available online at https://climate.copernicus.eu/climate-reanalysis (accessed on 5 February 2024). Surface meteorological data is freely available from https://vismet.cr2.cl/ (accessed on 5 February 2024). ORA data at Concepción freely available from https://www.cr2.cl/ORA/ (accessed on 5 February 2024).

Acknowledgments

R.D.G. and M.J.-C. are supported by ANID/FONDAP Grant 1523A0002 (CR2). We are grateful to José Miguel Campillo and Raul Valenzuela for their support in deploying ORA at Concepción. J.C.M. acknowledges support from Centro de Estudios Atmosféricos y Cambio Climático (CEACC), Universidad de Valparaíso. R.D.G. thanks ANID Fondecyt project 1211412. J.M.C. and M.J.-C. thank ANID Fondecyt project 1211898. D.A.N. and M.J.-C. are partially funded by COPAS Coastal ANID FB210021. Powered@NLHPC: This research was partially supported by the supercomputing infrastructure of the National Laboratory for High Performing Computer (NLHPC) (ECM-02). Constructive comments by three anonymous reviewers helped to produce a more robust, clear version of this paper.

Conflicts of Interest

The authors declare no conflicts of interest.

References

  1. Zhu, Y.; Newell, R.E. A proposed algorithm for moisture fluxes from atmospheric rivers. Mon. Weather Rev. 1998, 126, 725–735. [Google Scholar] [CrossRef]
  2. Ralph, F.M.; Dettinger, M.D. Storms, floods, and the science of atmospheric rivers. Eos Trans. Am. Geophys. Union 2011, 92, 265–266. [Google Scholar] [CrossRef]
  3. Gimeno, L.; Nieto, R.; Vázquez, M.; Lavers, D.A. Atmospheric rivers: A mini-review. Front. Earth Sci. 2014, 2. [Google Scholar] [CrossRef]
  4. Ralph, F.M.; Dettinger, M.D.; Rutz, J.J.; Waliser, D.E. (Eds.) Atmospheric Rivers; Springer International Publishing: Cham, Switzerland, 2020; Volume 1. [Google Scholar]
  5. Dacre, H.F.; Martínez-Alvarado, O.; Mbengue, C.O. Linking atmospheric rivers and warm conveyor belt airflows. J. Hydrometeorol. 2019, 20, 1183–1196. [Google Scholar] [CrossRef]
  6. Mo, R. Prequel to the stories of warm conveyor belts and atmospheric rivers: The moist tongues identified by rossby and his collaborators in the 1930s. Bull. Am. Meteorol. Soc. 2022, 103, E1019–E1040. [Google Scholar] [CrossRef]
  7. Waliser, D.; Guan, B. Extreme winds and precipitation during landfall of atmospheric rivers. Nat. Geosci. 2017, 10, 179–183. [Google Scholar] [CrossRef]
  8. Viale, M.; Valenzuela, R.; Garreaud, R.D.; Ralph, F.M. Impacts of atmospheric rivers on precipitation in southern South America. J. Hydrometeorol. 2018, 19, 1671–1687. [Google Scholar] [CrossRef]
  9. Mundhenk, B.D.; Barnes, E.A.; Maloney, E.D. All-season climatology and variability of atmospheric river frequencies over the North Pacific. J. Clim. 2016, 29, 4885–4903. [Google Scholar] [CrossRef]
  10. Ralph, F.M.; Rutz, J.J.; Cordeira, J.M.; Dettinger, M.; Anderson, M.; Reynolds, D.; Schick, L.J.; Smallcomb, C. A Scale to Characterize the Strength and Impacts of Atmospheric Rivers. Bull. Am. Meteorol. Soc. 2019, 100, 269–289. [Google Scholar] [CrossRef]
  11. Eiras-Barca, J.; Ramos, A.M.; Algarra, I.; Vázquez, M.; Dominguez, F.; Miguez-Macho, G.; Nieto, R.; Gimeno, L.; Taboada, J.; Ralph, F.M. European West Coast atmospheric rivers: A scale to characterize strength and impacts. Weather. Clim. Extremes 2021, 31, 100305. [Google Scholar] [CrossRef]
  12. Guan, B.; Waliser, D.E.; Ralph, F.M. Global application of the atmospheric river scale. J. Geophys. Res. Atmos. 2023, 128, e2022JD037180. [Google Scholar] [CrossRef]
  13. Aceituno, P.; Boisier, J.P.; Garreaud, R.; Rondanelli, R.; Rutllant, J.A. Climate and weather in Chile. In Water Resources of Chile; Springer International Publishing: Cham, Switzerland, 2021; pp. 7–29. [Google Scholar]
  14. Viale, M.; Garreaud, R. Orographic effects of the subtropical and extratropical Andes on upwind precipitating clouds. J. Geophys. Res. Atmos. 2015, 120, 4962–4974. [Google Scholar] [CrossRef]
  15. Garreaud, R. Warm winter storms in Central Chile. J. Hydrometeorol. 2013, 14, 1515–1534. [Google Scholar] [CrossRef]
  16. Valenzuela, R.A.; Garreaud, R.D. Extreme daily rainfall in central-southern Chile and its relationship with low-level horizontal water vapor fluxes. J. Hydrometeorol. 2019, 20, 1829–1850. [Google Scholar] [CrossRef]
  17. Garreaud, R. Return of the Giants. A Preliminary Analysis of the June 21-26, 2023, Storm in Central Chile. CR2 Analysis. 2023. Available online: https://www.cr2.cl/analisis-cr2-vuelven-los-gigantes-un-analisis-preliminar-de-la-tormenta-ocurrida-entre-el-21-y-26-de-junio-de-2023-en-chile-central/ (accessed on 21 December 2023).
  18. Pozo, D.; Marín, J.C.; Gutiérrez, F. Cloud properties of cold fronts affecting central Chile: Low and high freezing level storms. Earth Space Sci. 2023, 10, e2022EA002591. [Google Scholar] [CrossRef]
  19. Valenzuela, R.; Garreaud, R.; Vergara, I.; Campos, D.; Viale, M.; Rondanelli, R. An extraordinary dry season precipitation event in the subtropical Andes: Drivers, impacts and predictability. Weather Clim. Extremes 2022, 37, 100472. [Google Scholar] [CrossRef]
  20. Poveda, G.; Espinoza, J.C.; Zuluaga, M.D.; Solman, S.A.; Garreaud, R.; van Oevelen, P.J. High impact weather events in the Andes. Front. Earth Sci. 2020, 8, 162. [Google Scholar] [CrossRef]
  21. Neiman, P.J.; Ralph, F.M.; Moore, B.J.; Hughes, M.; Mahoney, K.M.; Cordeira, J.M.; Dettinger, M.D. The landfall and inland penetration of a flood-producing atmospheric river in Arizona. Part I: Observed synoptic-scale, orographic, and hydrometeorological characteristics. J. Hydrometeorol. 2013, 14, 460–484. [Google Scholar] [CrossRef]
  22. Hughes, M.; Mahoney, K.M.; Neiman, P.J.; Moore, B.J.; Alexander, M.; Ralph, F.M. The landfall and inland penetration of a flood-producing atmospheric river in Arizona. Part II: Sensitivity of modeled precipitation to terrain height and atmospheric river orientation. J. Hydrometeorol. 2014, 15, 1954–1974. [Google Scholar] [CrossRef]
  23. Hecht, C.W.; Cordeira, J.M. Characterizing the influence of atmospheric river orientation and intensity on precipitation distributions over North Coastal California. Geophys. Res. Lett. 2017, 44, 9048–9058. [Google Scholar] [CrossRef]
  24. Griffith, H.V.; Wade, A.J.; Lavers, D.A.; Watts, G. Atmospheric river orientation determines flood occurrence. Hydrol. Process. 2020, 34, 4547–4555. [Google Scholar] [CrossRef]
  25. Dacre, H.F.; Clark, P.A.; Martinez-Alvarado, O.; Stringer, M.A.; Lavers, D.A. How do atmospheric rivers form? Bull. Am. Meteorol. Soc. 2015, 96, 1243–1255. [Google Scholar] [CrossRef]
  26. Stohl, A.; Forster, C.; Sodemann, H. Remote sources of water vapor forming precipitation on the Norwegian west coast at 60 °N–a tale of hurricanes and an atmospheric river. J. Geophys. Res. Atmos. 2008, 113. [Google Scholar] [CrossRef]
  27. Brast, M.; Markmann, P. Detecting the melting layer with a micro rain radar using a neural network approach. Atmospheric Meas. Tech. 2020, 13, 6645–6656. [Google Scholar] [CrossRef]
  28. Hersbach, H.; Bell, B.; Berrisford, P.; Hirahara, S.; Horányi, A.; Muñoz-Sabater, J.; Nicolas, J.; Peubey, C.; Radu, R.; Schepers, D.; et al. The ERA5 global reanalysis. Q. J. R. Meteorol. Soc. 2020, 146, 1999–2049. [Google Scholar] [CrossRef]
  29. Rojas, Y.; Minder, J.R.; Campbell, L.S.; Massmann, A.; Garreaud, R. Assessment of GPM IMERG satellite precipitation estimation and its dependence on microphysical rain regimes over the mountains of south-central Chile. Atmospheric Res. 2021, 253, 105454. [Google Scholar] [CrossRef]
  30. Skamarock, W.C.; Klemp, J.B.; Dudhia, J.; Gill, D.O.; Zhiquan, L.; Berner, J.; Wang, W.; Powers, J.G.; Duda, M.G.; Barker, D.M.; et al. A Description of the Advanced Research WRF Model Version 4.3 (No. NCAR/TN-556+STR). 165 pp. Available online: https://opensky.ucar.edu/islandora/object/technotes%3A588/datastream/PDF/view (accessed on 19 March 2024).
  31. Niu, G.-Y.; Yang, Z.-L.; Mitchell, K.E.; Chen, F.; Ek, M.B.; Barlage, M.; Kumar, A.; Manning, K.; Niyogi, D.; Rosero, E.; et al. The community Noah land surface model with multiparameterization options (Noah-MP): 1. Model description and evaluation with local-scale measurements. J. Geophys. Res. 2011, 116, D12109. [Google Scholar] [CrossRef]
  32. Nakanishi, M.; Niino, H. An improved mellor-yamada level-3 model: Its numerical stability and application to a regional prediction of advection fog. Bound. Layer Meteorol. 2006, 119, 397–407. [Google Scholar] [CrossRef]
  33. Iacono, M.J.; Delamere, J.S.; Mlawer, E.J.; Shephard, M.W.; Clough, S.A.; Collins, W.D. Radiative forcing by long-lived greenhouse gases: Calculations with the AER radiative transfer models. J. Geophys. Res. Atmos. 2008, 113, D13103. [Google Scholar] [CrossRef]
  34. Thompson, G.; Field, P.R.; Rasmussen, R.M.; Hall, W.D. Explicit forecasts of winter precipitation using an improved bulk microphysics scheme. Part II: Implementation of a new snow parameterization. Mon. Weather Rev. 2008, 136, 5095–5115. [Google Scholar] [CrossRef]
  35. Zhang, C.; Wang, Y. Projected Future Changes of Tropical Cyclone Activity over the Western North and South Pacific in a 20-km-Mesh Regional Climate Model. J. Clim. 2017, 30, 5923–5941. [Google Scholar] [CrossRef]
  36. Montecinos, A.; Aceituno, P. Seasonality of the ENSO-related rainfall variability in central Chile and associated cir-culation anomalies. J. Clim. 2003, 16, 281–296. [Google Scholar] [CrossRef]
  37. Falvey, M.; Garreaud, R. Wintertime precipitation episodes in central Chile: Associated meteorological conditions and orographic influences. J. Hydrometeorol. 2007, 8, 171–193. [Google Scholar] [CrossRef]
  38. Barrett, B.S.; Garreaud, R.; Falvey, M. Effect of the andes cordillera on precipitation from a midlatitude cold front. Mon. Weather Rev. 2009, 137, 3092–3109. [Google Scholar] [CrossRef]
  39. Rivera, E.R.; Dominguez, F.; Castro, C.L. Atmospheric rivers and cool season extreme precipitation events in the verde river basin of arizona. J. Hydrometeorol. 2014, 15, 813–829. [Google Scholar] [CrossRef]
  40. Garreaud, R.; Falvey, M.; Montecinos, A. Orographic precipitation in coastal southern Chile: Mean distribution, temporal variability, and linear contribution. J. Hydrometeorol. 2016, 17, 1185–1202. [Google Scholar] [CrossRef]
  41. Mardones, P.; Garreaud, R.D. Future changes in the free tropospheric freezing level and rain–snow limit: The case of central Chile. Atmosphere 2020, 11, 1259. [Google Scholar] [CrossRef]
  42. Garreaud, R.; Rutllant, J. Análisis meteorológico de los aluviones de Antofagasta y Santiago de Chile en el periodo 1991–1993. Atmósfera 1996, 9, 251–271. [Google Scholar]
  43. Viale, M. Aluvión en Villa Santa Lucía y su Relación con un Río Atmosférico. DGF-Analysis. 2017. Available online: http://www.dgf.uchile.cl/noticias/140021/aluvion-en-villa-santa-lucia-y-su-relacion-con-un-rio-atmosferico (accessed on 21 December 2023).
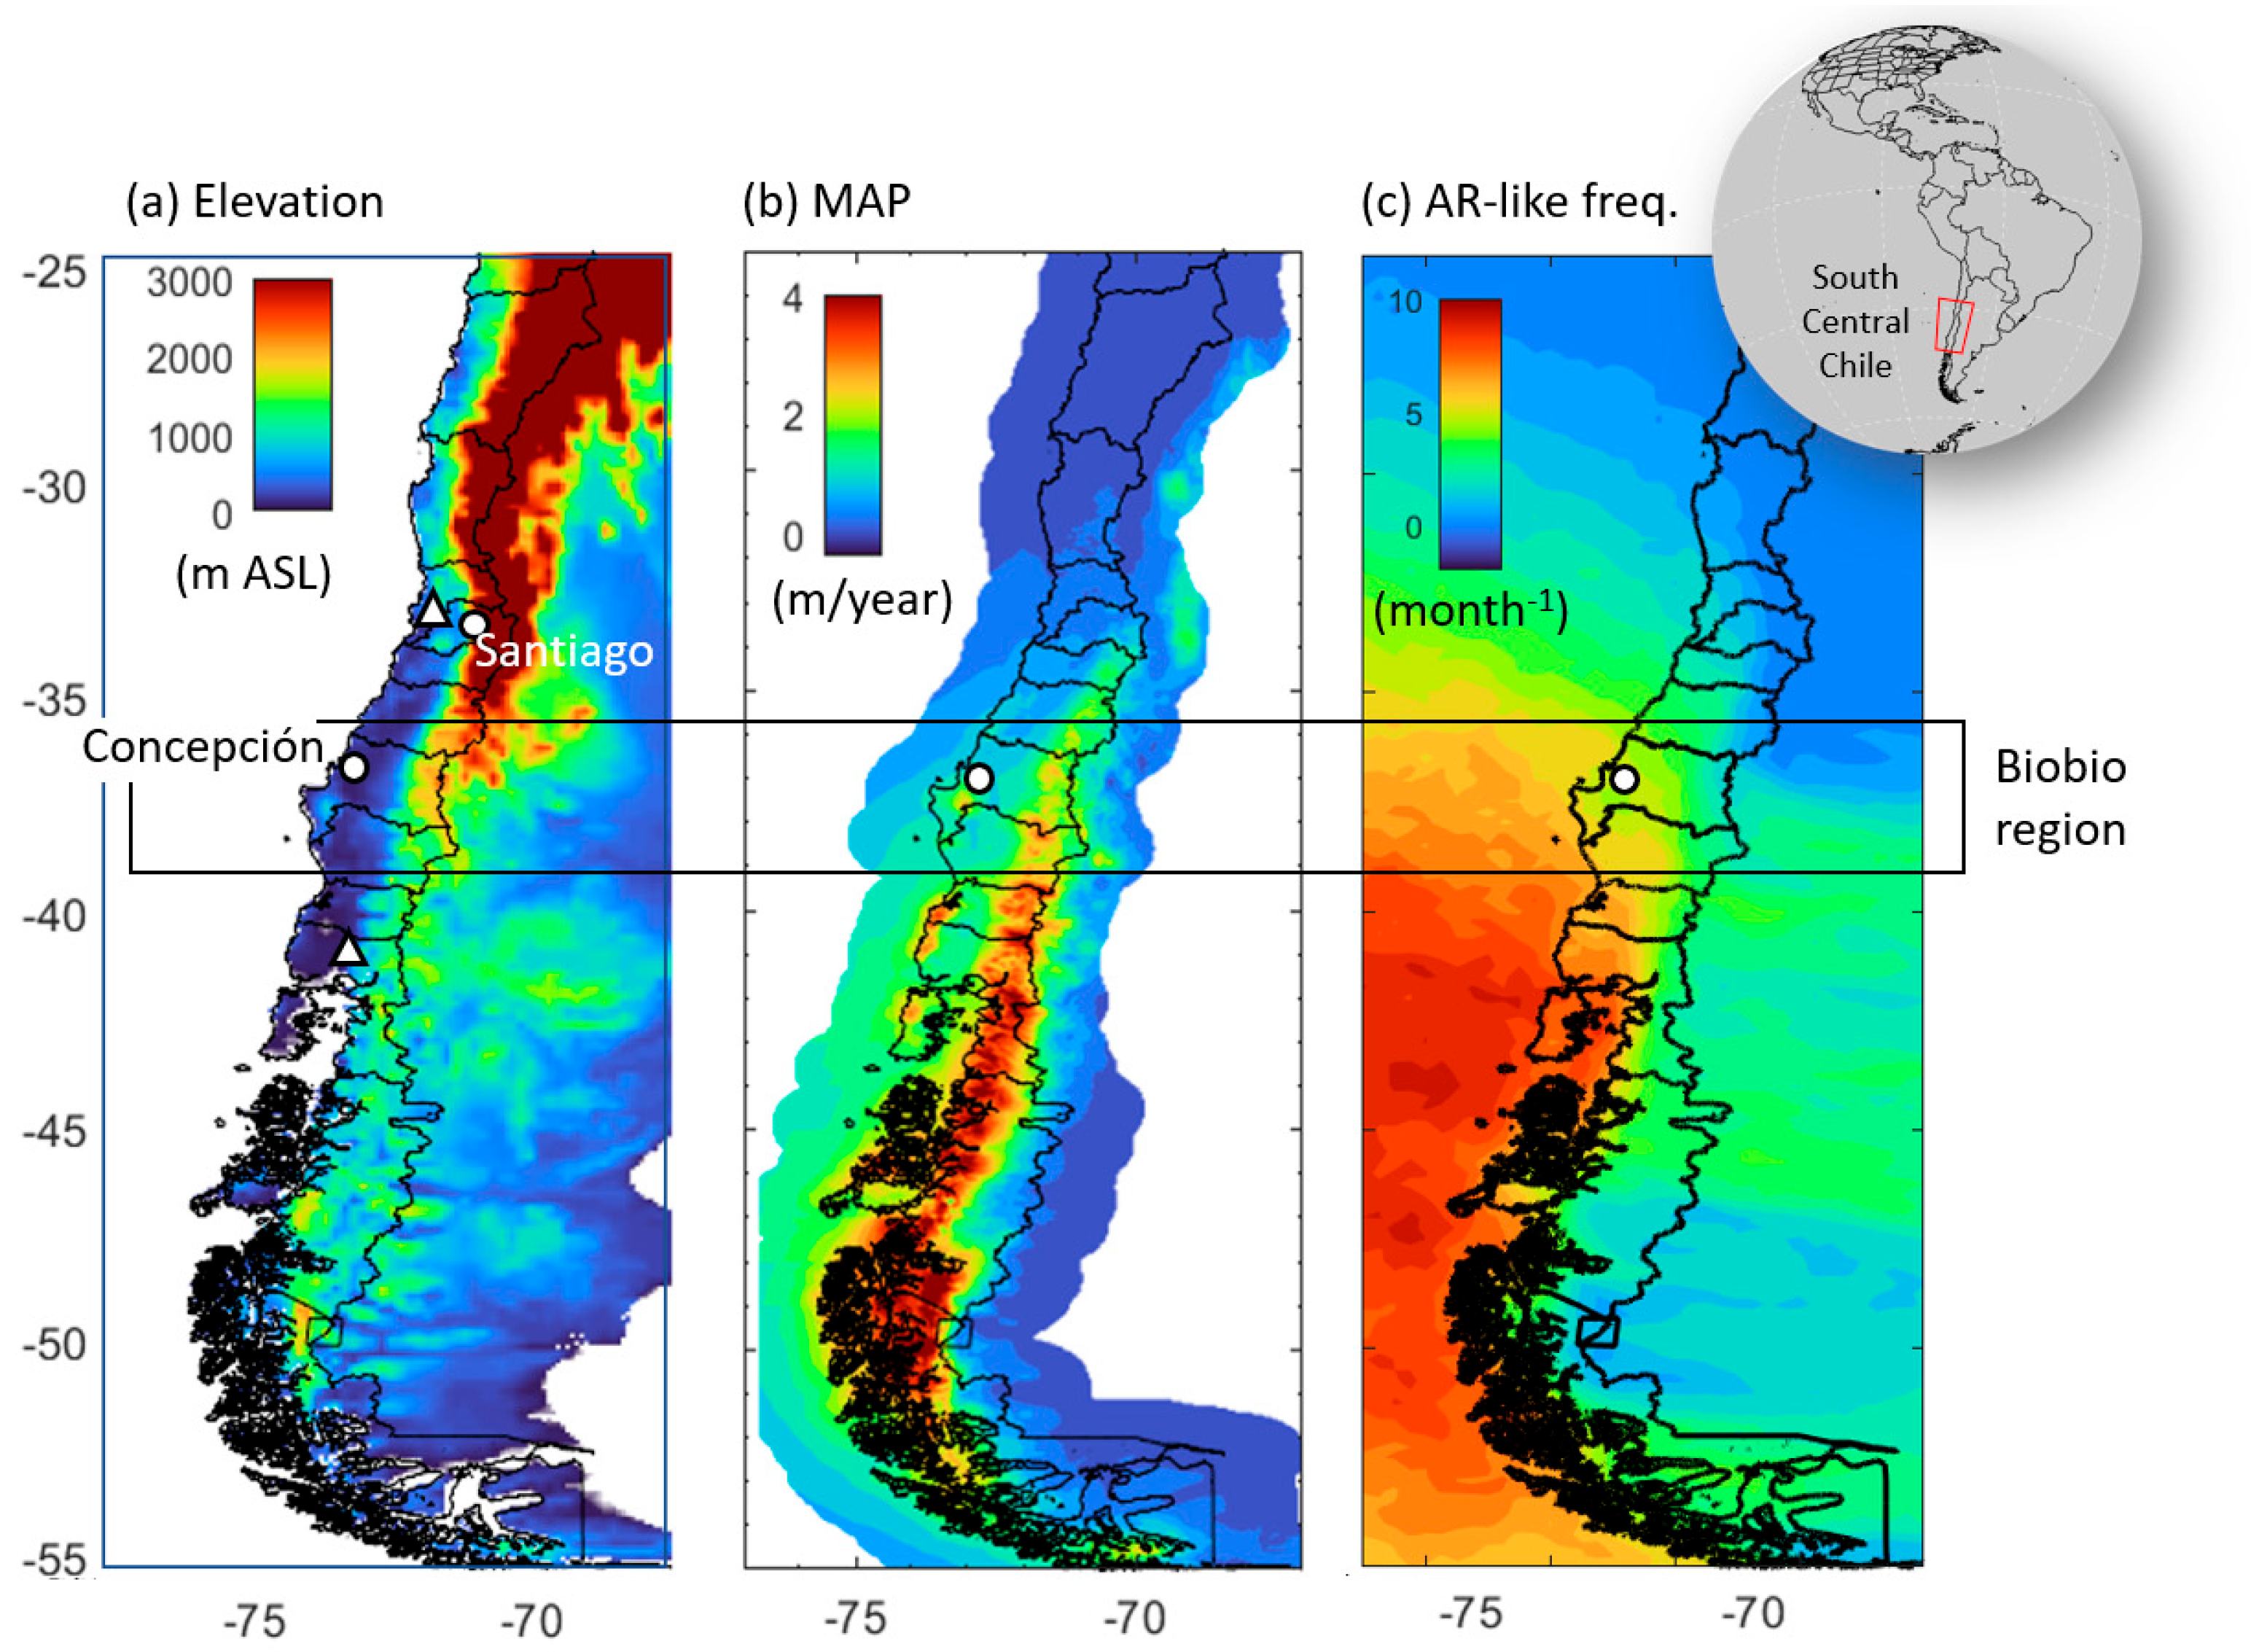
Figure 1. Geographical and climate context of south-central Chile. (a) Terrain elevation and location of Santiago and Concepción (white dots). White triangles indicate the location of the Santo Domingo (33° S) and Puerto Montt (41° S) upper air stations. Black lines outline the administrative regions of the country and the Chile-Argentina border. (b) Annual mean precipitation obtained from the CR2Met dataset. (c) The monthly mean frequency of AR-like events is defined as days in which IVT magnitude surpass 250 kg/m/s in each grid box (ERA5 data).
Atmosphere 15 00406 g001
Figure 2. Meteorological synthesis of July 2022 in Concepción, when the three IOPs took place. (a) Hourly series of rainfall from the PARSIVEL disdrometer (minute data) at ORA. Grey bars are precipitation periods. (b) Hourly series of large-scale (blue bars) and convective precipitation (red line) interpolated to Concepción from ERA5. (c) Hourly series of IVT magnitude (blue line) over Concepción from ERA5. The orange line is the zonal component of IVT. The gray dots are the sounding-derived IVT magnitude. (d) As in the previous panel, but for precipitable water (PW). (e) Zero-degree isotherm height over Concepción from ERA5 (grey line). The blue dots are the values when precipitation is present. Large gray dots are sounding derived H0 values. The ticks in the horizontal axis indicate the 00:00 UTC of each day.
Atmosphere 15 00406 g002
Figure 3. Large-scale circulation during IOP1 (a,c) and IOP2 (b,d) is represented by the 300 hPa geopotential height (contours, decameters) and sea level pressure (shaded, hPa). Dates and hours are indicated at the top of each panel. The upper panels correspond to the time the AR made landfall in south-central Chile. The lower panels show the conditions about one day before. L = low; H = subtropical high; Hm = midaltitude high; T = trough.
Atmosphere 15 00406 g003
Figure 4. GOES-16 imagery during the AR landfall in south-central Chile during (a) IOP1 and (b) IOP2. Dates and hours are indicated at the top of each panel. The imagery corresponds to the clean infrared longwave window (10.3 um), where green and yellow indicate high clouds while blue and gray indicate low clouds. Surface fronts are superimposed and use the conventional drawing format (blue triangles: cold front, red semi-circle: warm front, both symbols: stationary front). L indicates the center of the surface low during IOP1.
Atmosphere 15 00406 g004
Figure 5. Soundings during the AR landfall in south-central Chile during (a) IOP1 and (b) IOP2. Dates and hours are indicated at the top of each panel. The red (green) line is the air temperature (dew point temperature) profile. Meteorological bars show the wind to the right of the panel.
Atmosphere 15 00406 g005
Figure 6. Mid-level vertical motions during (a) IOP1 and (b) IOP2. The black solid lines represent the 400 hPa geopotential height field. Thin red lines indicate ascending motion at the same level (values of ω ≤ −0.01 Pa/s every 0.01 Pa/s). Colors are the 2 × Q-vector divergence (×10−15 K/m2/s) with blue (red) shades for convergence (divergence) associated with ascending (descending) motion.
Atmosphere 15 00406 g006
Figure 7. Precipitable water (PW, colors in mm) and Integrated Water Vapor Transport (IVT vectors in kg/m/s) at the time of the AR landfall in south-central Chile during (a) IOP1 and (b) IOP2. Dates/times are at the top of each panel. The white box indicates the position of Concepción.
Atmosphere 15 00406 g007
Figure 8. Local conditions during IOP1 (18 UTC on 8 July–6 UTC on 10 July 2022). (a) MRR-2 radar reflectivity. The white dots indicate the sounding derived 0 °C isotherm height. (b) PARSIVEL minute rain intensity (expressed in mm/h). (c) Air temperature (orange) and dew point temperature (green). All instruments are located at ORA-UdeC.
Atmosphere 15 00406 g008
Figure 9. Latitude-height cross-section at 90° W and 18 UTC on 16 July 2022, with isolines of potential temperature (colors and dotted lines), northerly wind (−2 m/s in red), southerly wind (+2 m/s in white), and westerly wind (every 5 m/s in black contours; J is the westerly jet core). Gray shading indicates water vapor mixing ratio in excess of 5 gr/Kg.
Atmosphere 15 00406 g009
Figure 10. Local conditions during IOP2 (12 UTC on 16 July–24 UTC on 17 July 2022). (a) MRR-2 radar reflectivity. The white dots indicate the sounding derived 0 °C isotherm height. (b) PARSIVEL minute rain intensity (expressed in mm/h). (c) Air temperature (red) and dew point temperature (green). All instruments are located at ORA-UdeC.
Atmosphere 15 00406 g010
Figure 11. (a) WRF-simulated accumulated precipitation (domain 2, 9 km) during IOP1 (36 h from 18 UTC on 8 July to 6 UTC on 10 July 2022). The station data accumulation is shown in small dots using the same color scale. (b) As panel (a) but for IOP2 (36 h from 12 UTC on 16 July to 24 UTC on 17 July 2022).
Atmosphere 15 00406 g011
Figure 12. (a) Polar plot in which each circle indicates the zonal and meridional components of IVT for a given day (May–August 2000–2020) on a 1° × 1° lat–lon grid box over Concepción. The circle’s color indicates the IVT magnitude, and the size is proportional to the daily rainfall at Concepción for that day (reanalysis data). (b) As in panel (a), but for the zonal and meridional components of the wind at the 300 hPa level. The ZAR and TAR groups are identified here. See details in Section 3.2.1.
Atmosphere 15 00406 g012
Figure 13. Large-scale circulation for the TAR (a,c) and ZAR groups (b,d). The upper panels show the composite 500 hPa wind vectors and precipitable water (colors, mm) for each group. The lower panels show the composite 1000 hPa wind vectors and 925 hPa air temperature (colors, mm) for each group. Some surface features are identified for guidance: L = low; H = subtropical high; R = ridge; T = trough. All variables are from ERA5.
Atmosphere 15 00406 g013
Figure 14. (a) Precipitation difference between the mean in the ZAR group and the mean in the TAR group. The difference was divided by the average of all cases and expressed in percentages. The green and cyan arrows represent the central axis along the ZAR and TAR, respectively. (b) Mean ± one standard deviation of the precipitation over the elevated terrain of the Biobio region (37–38° S, 71.6–71.1° W, mean elevation 1690 m ASL) for ZAR and TAR events, stratified in three categories of IVT magnitude at the coast. Note that IVT magnitude increases to the left.
Atmosphere 15 00406 g014
Disclaimer/Publisher’s Note: The statements, opinions and data contained in all publications are solely those of the individual author(s) and contributor(s) and not of MDPI and/or the editor(s). MDPI and/or the editor(s) disclaim responsibility for any injury to people or property resulting from any ideas, methods, instructions or products referred to in the content.