Article

Analysis of the Influencing Factors and Sources of Brown Carbon Light Absorption in a Typical Megacity of the Yangtze River Delta, China

1
Jiangsu Key Laboratory of Atmospheric Environment Monitoring and Pollution Control, Collaborative Innovation Center of Atmospheric Environment and Equipment Technology, School of Environmental Science and Engineering, Nanjing University of Information Science and Technology, Nanjing 210044, China
2
Suzhou Environmental Monitoring Center, Suzhou 215011, China
3
Department of Advanced Technologies in Medicine & Dentistry, Center for Advanced Studies and Technology (CAST), University “G. d’Annunzio” of Chieti-Pescara, 66100 Chieti, Italy
*
Author to whom correspondence should be addressed.
Atmosphere 2024, 15(4), 421; https://doi.org/10.3390/atmos15040421
Submission received: 23 February 2024 / Revised: 25 March 2024 / Accepted: 26 March 2024 / Published: 28 March 2024
(This article belongs to the Special Issue Characteristics and Source Apportionment of Urban Air Pollution)

Abstract

:
Brown carbon (BrC) is a new term for organic aerosol (OA) with strong absorption ability from the visible to ultraviolet (UV) wavelengths, which plays a vital role in atmospheric visibility and climate change. Herein, we report field measurements from 1 March 2020 to 28 February 2021, sampled at urban Suzhou, Yangtze River Delta (YRD), China, to investigate the optical properties and sources of BrC. By analyzing the seasonal characteristics of the absorption of BrC at 370 nm (babs370), babs370 was found to be the highest (9.0 ± 7.2 Mm−1) in winter and the lowest (5.1 ± 3.3 Mm−1) in summer, respectively. The absorption Ångström exponent (AAE) value of BrC in winter was 1.22 ± 0.05, followed by 1.21 ± 0.05, 1.20 ± 0.05, and 1.19 ± 0.05 for fall, spring, and summer, respectively. The mass absorption cross-section (MAC) of secondary organic carbon (SOC) was 3.3 ± 0.2 m2g−1 in spring, 2.9 ± 0.1 m2g−1 in summer, 4.3 ± 0.1 m2g−1 in fall, and 2.8 ± 0.2 m2g−1 in winter, significantly lower than that of primary organic carbon (POC) at 370 nm, suggesting the aging process could weaken the light absorption of BrC. Five different BrC factors were identified by the positive matrix factorization (PMF) analysis, including biomass-burning-related, vehicle-related, sulfate-related, nitrate-related, and dust-related factors, which on average account for 7.4%, 73.4%, 11.9%, 1.9%, and 5.4% of babs370, respectively. Potential Source Contribution Factor (PSCF) analysis showed that those high babs370 periods were mainly contributed by air mass from the south. Moreover, for the influence degree of the potential source areas, the sequence was winter > spring > fall > summer. Our results improve the understanding of BrC in an important industrial city in YRD, which could reduce the uncertainty of the prediction of its climate effect in this region.

1. Introduction

Atmospheric brown carbon (BrC), as a light-absorbing organic carbon (OC), has a strong capacity to absorb solar radiation from near-ultraviolet (UV) to visible wavelengths [1,2]. This absorption could affect the atmospheric visibility and regional energy balance directly, through either light scattering or light absorption [3,4]. Also, BrC could reduce the amount of solar radiation reaching the ground and have a significant impact on the climate indirectly [5]. However, the sources of BrC emissions are complex and variable, and great uncertainties remain in quantifying the light absorption ability of BrC as a result of different spatiotemporal distributions, with various atmospheric chemical processes, hindering more accurate estimations of its climate radiative forcing.
In recent years, there has been an increase in studies on the light absorption, source apportionment, and chemical composition of BrC [6,7,8]. Fossil fuel combustion and biomass burning were reported to be major sources of anthropogenic BrC [9,10,11,12]. This primary BrC can react with atmospheric oxidants, leading to more-absorbing or less-absorbing products, or whitening via two major processes, e.g., photochemical processing and aqueous oxidation [13,14,15]. It has been reported that a great number of emissions from coal combustion for winter heating in the north of China, and biomass burning such as straw in rural areas, has resulted in a significant amount of light-absorbing BrC entering the atmospheric environment [16,17]. For instance, Beijing and Xi’an are typical regions of high atmospheric BrC emissions, which has been reported as 3–10 times higher than that in Los Angeles [18,19,20]. Moreover, the atmospheric BrC in many regions of China not only has higher concentrations but also stronger light absorption capacity, i.e., has higher mass absorption efficiency (MAE) [9,21]. In the Pearl River Delta (PRD) region, the light absorption contributions of BrC are estimated to be between 6.3 and 12.1% at 405 nm [22]. Absorption Ångström exponent (AAE) values of 5.79–5.97 in summer and 4.95–5.26 in winter were reported in Nanjing [23] in the Yangtze River Delta (YRD).
Suzhou, as an important city in the center of the Yangtze River Delta (YRD) region, has the highest density of industries and the richest business in China. Over the past decade, it has been frequently impacted by severe air pollution events resulting from both industrial emissions and human activities. Li et al. [24] reported that organic matter (OM) was found to be the most dominant component of PM2.5 in Suzhou, China, followed by NO3 (6.7 ± 6.5 μg m−3), which, in atmospheric aqueous phases, generates a variety of reactive oxygen species and reactive nitrogen species through photolysis. It can also facilitate the photo-oxidation of organic compounds to form BrC [25]. However, previous research focused on brown carbon in the YRD was mainly concentrated in Nanjing and Shanghai [26,27,28,29], and there have been few studies on the seasonal light absorption properties and sources of BrC in Suzhou.
In this study, online measurements were conducted at South Gate Station, urban Suzhou. To obtain the seasonal light absorption properties, the factors affecting the light absorption of BrC and sources of BrC were observed from March 2020 to February 2021. This could help us to understand the characteristics of atmospheric pollution of typical industrial cities like Suzhou, and provide data support for analyzing the causes of heavy pollution weather. The chemical composition and absorption coefficient were introduced into the positive matrix factorization (PMF) model, including biomass-burning-related, vehicle-related, sulfate-related, nitrate-related, and dust-related sources, to estimate the contributions of different sources of BrC. Potential Source Contribution Factor (PSCF) analysis was applied to determine the contribution sources of BrC during different seasons.

2. Materials and Methods

2.1. Sampling Site and Instrumentation

Field observations were conducted at South Gate Station (31.29° N, 120.63° E) located in urban Suzhou, Yangtze River Delta, China, from 1 March 2020 to 28 February 2021. The sampling site and its surrounding environment were comprehensively described in a prior study [30].
Black carbon (BC) mass concentration was measured using a seven-wavelength aethalometer (Magee Scientific, model AE31) at 370, 470, 520, 590, 660, 880, and 950 nm. Simultaneously, PM2.5 mass concentration was measured using a PM2.5 analyzer (TE5030, Thermo Fisher, Waltham, MA, USA). PM2.5 carbonaceous species were determined by a thermal–optical carbon analyzer (Model 4, Sunset Lab. Inc., Portland, OR, USA) following the IMPROVE_A protocol (Interagency Monitoring of Protected Visual Environments). The water-soluble ions (WSIs), which included SO42−, NO3, NH4+, Cl, K+, Ca2+, Na+, and Mg2+), were determined using the Ambient Ion Monitor-Ion Chromatograph (AIM-IC, URG-9000D, Thermo Fisher, USA).
The concentrations of gaseous species such as O3, CO, SO2, and NOx were measured using EC9810, EC9830 (Thermo Fisher, USA), EC9850B, and EC984 (Sailhero, Shijiazhuang, China), respectively. Additionally, meteorological data, including relative humidity (RH), wind speed (WS), wind direction (WD), ambient temperature (T), and atmospheric pressure (P), were collected at the same site. All the data in this study are hourly averages.

2.2. Calculation of Optical Parameters

The total aerosol absorption coefficient (babs (λ), Mm−1) is estimated as follows [31]:
b a b s λ = B C × M A C C × R A T N
where BC is the mass concentration of black carbon (μg m−3); MAC refers to the mass absorption cross-section (m2 g−1); C represents the multiple scattering uncertainty factor, which is contingent upon the filter paper and apparatus employed (C = 2.14); and R(ATN) is a correction factor accounting for the shadowing effect where the alteration in attenuation will be lower when the filter spot is heavily loaded as compared to a fresh filter spot and is determined as follows [32]:
R A T N = 1 f 1 ln A T N ln 10 ln 50 ln 10 + 1
where f denotes the compensation parameter for the filter loading effect, which is obtained following Table S1 [32], and ATN represents the attenuation of light passing through the filter tape.
A A E λ 1 , λ 2 = ln b a b s λ 1 ln b a b s λ 2 ln λ 1 ln λ 2
where AAE represents the absorption Ångström exponent and λ denotes the wavelength. AAE is a powerful real-time measurable spectral parameter for source apportionment [33]. Previous studies have demonstrated that values of AAE of approximately 2 are typically indicative of black carbon mainly derived from biomass burning, whereas an AAE value of 1 is approximately more associated with black carbon emissions from fossil fuel [1,34]. In this study, the AAE values for four seasons were calculated based on the absorption coefficients at 370 nm and 950 nm within the visible light spectrum.
BrC absorption at a certain wavelength λ (bBrC (λ)) is equal to the value of total aerosol absorption (babs (λ)) minus BC absorption (bBC (λ)).
b B r C λ = b a b s λ b B C λ
Assuming that only BC absorbs light at wavelengths of 880 nm and 950 nm and the value of AAE is 1 [15], BC’s absorption at the other wavelengths, including 370 nm, 470 nm, 520 nm, 590 nm, and 660 nm (bBrC (λ)), can be obtained from the value of AAE via the following equation [35,36]:
b B C λ = b a b s 880 × 880 / λ A A E
Multiple linear regression mode was used to analyze the light absorption of different organic and inorganic components at each specified wavelength (i.e., 370 nm, 470 nm, 520 nm, 590 nm, and 660 nm) [15,37,38].
b a b s λ = a P O C + b S O C + c I n o r g   i o n s
I n o r g   i o n s = S O 4 2 + N O 3 + N H 4 + + C l
In the above equation, constants a to c correspond to correlation factors that signify the light absorption coefficient of different components. These correlation factors can be obtained and are equivalent to the MAC of each component. Primary organic carbon [POC], secondary organic carbon [SOC], and [Inorg ions] denote the mass concentration of each corresponding component.

2.3. Primary and Secondary OC

Elemental carbon (EC) as a tracer for primarily emitted organic carbon (OC) can be used to estimate SOC [39].
O C t o t a l = P O C + S O C
P O C = O C / E C p r i × E C + O C n o n c o m b
Then, SOC can be calculated as
S O C = O C t o t a l O C / E C p r i × E C O C n o n c o m b
where (OC/EC)pri is the OC/EC ratio of aerosols from the primary emission sources, and non-combustion POC (OCnon-comb) can be determined by examining the intercept of the linear regression between OC and EC. However, as the intercept term is insubstantial, it can be disregarded [39]. The value of OCnon-comb was set to zero for estimating SOC in this study.

2.4. Data Analysis

2.4.1. PSCF Model

The potential contribution source function (PSCF) is in consideration of backward trajectories connecting the residence time in upwind areas with relatively high concentrations of certain species via conditional probabilities [24,40]. The PSCF method can be described as follows:
P S C F i , j = w i j × m i j n i j
where wij is an arbitrary weighting function aimed at reducing the influence of small values of nij. nij represents the number of endpoints and mij denotes the number of endpoints belonging to trajectories contained within the given grid cell whose values are higher than the threshold value [40].

2.4.2. PMF Model

The US Environmental Protection Agency’s positive matrix factorization (PMF) receptor model (version 5.0) was adopted to identify and determine the source apportionment of BrC. In this study, 8 Water-Soluble Ionic Indicators (WSIIs), babsBrC-370, as well as OC and EC were selected in the EPA PMF 5.0 model. The input data consisted of concentration (c) values and the corresponding uncertainty values for each species. The uncertainty values contained detection limits (MDL) and error fractions (EF, 10%). The detection limits for Na+, NH4+, K+, Mg2+, Ca2+, Cl, NO3, and SO42− were 0.02, 0.02, 0.02, 0.02, 0.02, 0.03, and 0.05 μg m−3, respectively, and the detection limits for OC and EC were 0.4 and 0.2 μg m−3 correspondingly. The uncertainty (Unc) was calculated using the following equation [41,42]:
U n c = E F × c 2 + 0.5 × M D L 2             c > M D L
U n c = 5 6 × M D L             c M D L

3. Results and Discussion

3.1. Seasonal Variation in BrC Absorption Parameters

3.1.1. BrC Absorption Coefficient

Four seasons were assessed in this study, e.g., spring (1 March to 31 May 2020), summer (1 June to 31 August 2020), fall (1 September to 30 November 2020), and winter (1 December 2020 to 28 February 2021). Figure S1 shows hourly averaged temporal variations in meteorological parameters, the concentrations of gaseous and major PM2.5 species, and the absorption coefficients of black carbon (BC) and BrC at 370 nm. Seasonal-averaged optical absorption coefficients and the contribution of BC and BrC to the total light absorption at 370 nm are shown in Figure 1. Since BrC has the strongest light absorption at 370 nm, babs370 is usually used to characterize the light absorption properties of BrC [38,43]. PM2.5 light absorption was predominantly by BC; however, BrC also played a significant role, especially at shorter wavelengths. From the perspective of seasonal variation, the average light absorption coefficient of BrC (babs370) in winter was (9.0 ± 7.2) Mm−1, higher than other seasons (spring 7.3 ± 6.6 Mm−1, summer 5.1 ± 3.3 Mm−1, and fall 6.5 ± 4.3 Mm−1). This is consistent with the research results of Gao et al. [44]; they reported that the light absorption of BrC was highest in winter, followed by spring and summer. However, the value of babs370 was much lower than that in Guangzhou, China (23.5 Mm−1) [43]. However, the contribution of BrC to total PM2.5 (BC+BrC) light absorption does not show significant differences in spring (16.5 ± 4.1%), summer (15.6 ± 3.8%), fall (16.6 ± 3.6%), and winter (17.7 ± 3.5%). These results are lower than the average absorption contributions of BrC in Guangzhou, China (34.1 ± 8.0%) [43].
To further explore the light absorption properties of BrC at different wavelengths, Figure 2a presents the average light absorption of BrC at a wavelength of 370–660 nm. It shows that the light absorption of BrC decreased with the increase in wavelength, and the light absorption at longer wavelengths was almost negligible. On the other hand, seasonal variation in the BrC absorption coefficient under each wavelength was consistent, showing a U shape, with the highest value in winter, followed by spring, fall, and then summer. This result is in line with BC concentrations in different seasons, suggesting higher emissions in winter. Figure 2b demonstrates the frequency distributions of light absorption contributions at 370 nm of BrC in different seasons. It shows that the light absorption contribution of BrC in winter is significantly greater than that in the other three seasons, which may be due to the increase in vehicle emissions and other combustion activities with the highest concentration of BC (Figure 1) on a local scale. Furthermore, Figure S2 suggests the high PSCF values of CO and NO2 are mainly close to the sampling site.

3.1.2. Absorption Ångström Exponent (AAE)

AAE can be affected by aerosol size distribution, chemical composition, and mixing state [32]. The AAE for pure BC is 1, but the AAE for BrC can reach up to 9.5 [45]. The frequency distributions of the AAE values of BrC are shown in Figure 3. In the whole observation, AAE values were almost greater than 1, indicating the presence of BrC [46]. The frequency distributions of the averaged AAE values showed that it was higher in winter than in the other three seasons. On the other hand, the peak width of AAE frequency distributions in winter was larger than that in other seasons, indicating that the pollution emissions were more complicated and the sources of BrC were more extensive in winter.

3.1.3. Mass Absorption Cross-Section (MAC)

Figure 4 shows the mass absorption cross-section (MAC) values of the different components in four seasons. POC had the highest MAC values, while inorganic ions had the lowest. The light absorption of POC is three times higher than that of SOC, which suggests that the light absorption of fresh OC is higher than that of its aged products. This is consistent with the research of Li et al. [43], who suggested that primary organic aerosols (POA) had a larger BrC absorption capacity than secondary organic aerosols (SOAs). In the four seasons, the light absorption of POC is the strongest in fall (MAC = 13.6 m2 g−1 at 370 nm), followed by spring (MAC = 12.1 m2 g−1 at 370 nm), winter (MAC = 10.7 m2 g−1 at 370 nm), and summer (MAC = 10.2 m2 g−1 at 370 nm). Similarly, SOC had the highest light absorption in fall (MAC = 4.3 m2 g−1 at 370 nm). The light absorption of SOC in the other three seasons was similar. This result is different from the contributions of the BrC absorption coefficient in different seasons. The implication is that there is a great difference in SOC composition in different seasons as a result of different sources and atmospheric processes.

3.2. The Factors Affecting the Light Absorption of BrC

3.2.1. The Effect of PM2.5 Concentration on the Light Absorption of BrC

To elucidate the factors that affect the differences in the light absorption properties of BrC in different seasons, the variations in the light absorption coefficients of BrC with the increasing PM2.5 concentrations at wavelengths of 370–660 nm were investigated (Figure 5). Generally, PM2.5 shows a great correlation with the light absorption of BrC, and the fraction of BrC absorption at different wavelengths shows similar contributions in different PM2.5 concentrations. The implication is that a higher concentration of PM2.5 has a higher BrC absorption. However, when the PM2.5 concentration (winter average) is in the range of 150 to 175, it shows a lower BrC absorption, which may be attributed to the summer photochemical breach (Figure 6a).
Figure 6 presents seasonal average light absorption coefficients and their proportions of BrC at 370 nm in different PM2.5 concentration ranges. According to different PM2.5 concentrations, it was divided into four stages: stage 1 (S1, PM2.5 < 15 µg m−3), stage 2 (S2, 15 µg m−3 ≤ PM2.5 < 35 µg m−3), stage 3 (S3, 35 µg m−3 ≤ PM2.5 < 75 µg m−3), and stage 4 (S4, PM2.5 ≥ 75 µg m−3). Interestingly, in the first three stages, the light absorption coefficient of BrC is the largest in fall. In the fourth stage, the light absorption coefficient of BrC increased significantly in winter but had a negligible value in summer. PM2.5 had the highest value in winter, but the average MAC value in fall was the highest (Figure 4). It was found that there is a significant positive correlation between PM2.5 and absBrC370 in winter (r = 0.72), but the correlation coefficient was only 0.54 in summer, indicating that absBrC370 was greatly affected by the concentration of PM2.5, while it was affected by other factors in summer, such as photobleaching [47]; therefore, it could be obtained that the value of bBrC not only depends on the air quality, especially in summer. The implication is that a high concentration of PM2.5 does not imply a strong light absorption ability; there are other impact factors. Indeed, the fraction of SOC was the highest in the fall (Figure S3), suggesting aging processes may play an important role in the enhancement of the light absorption of BrC in the fall.

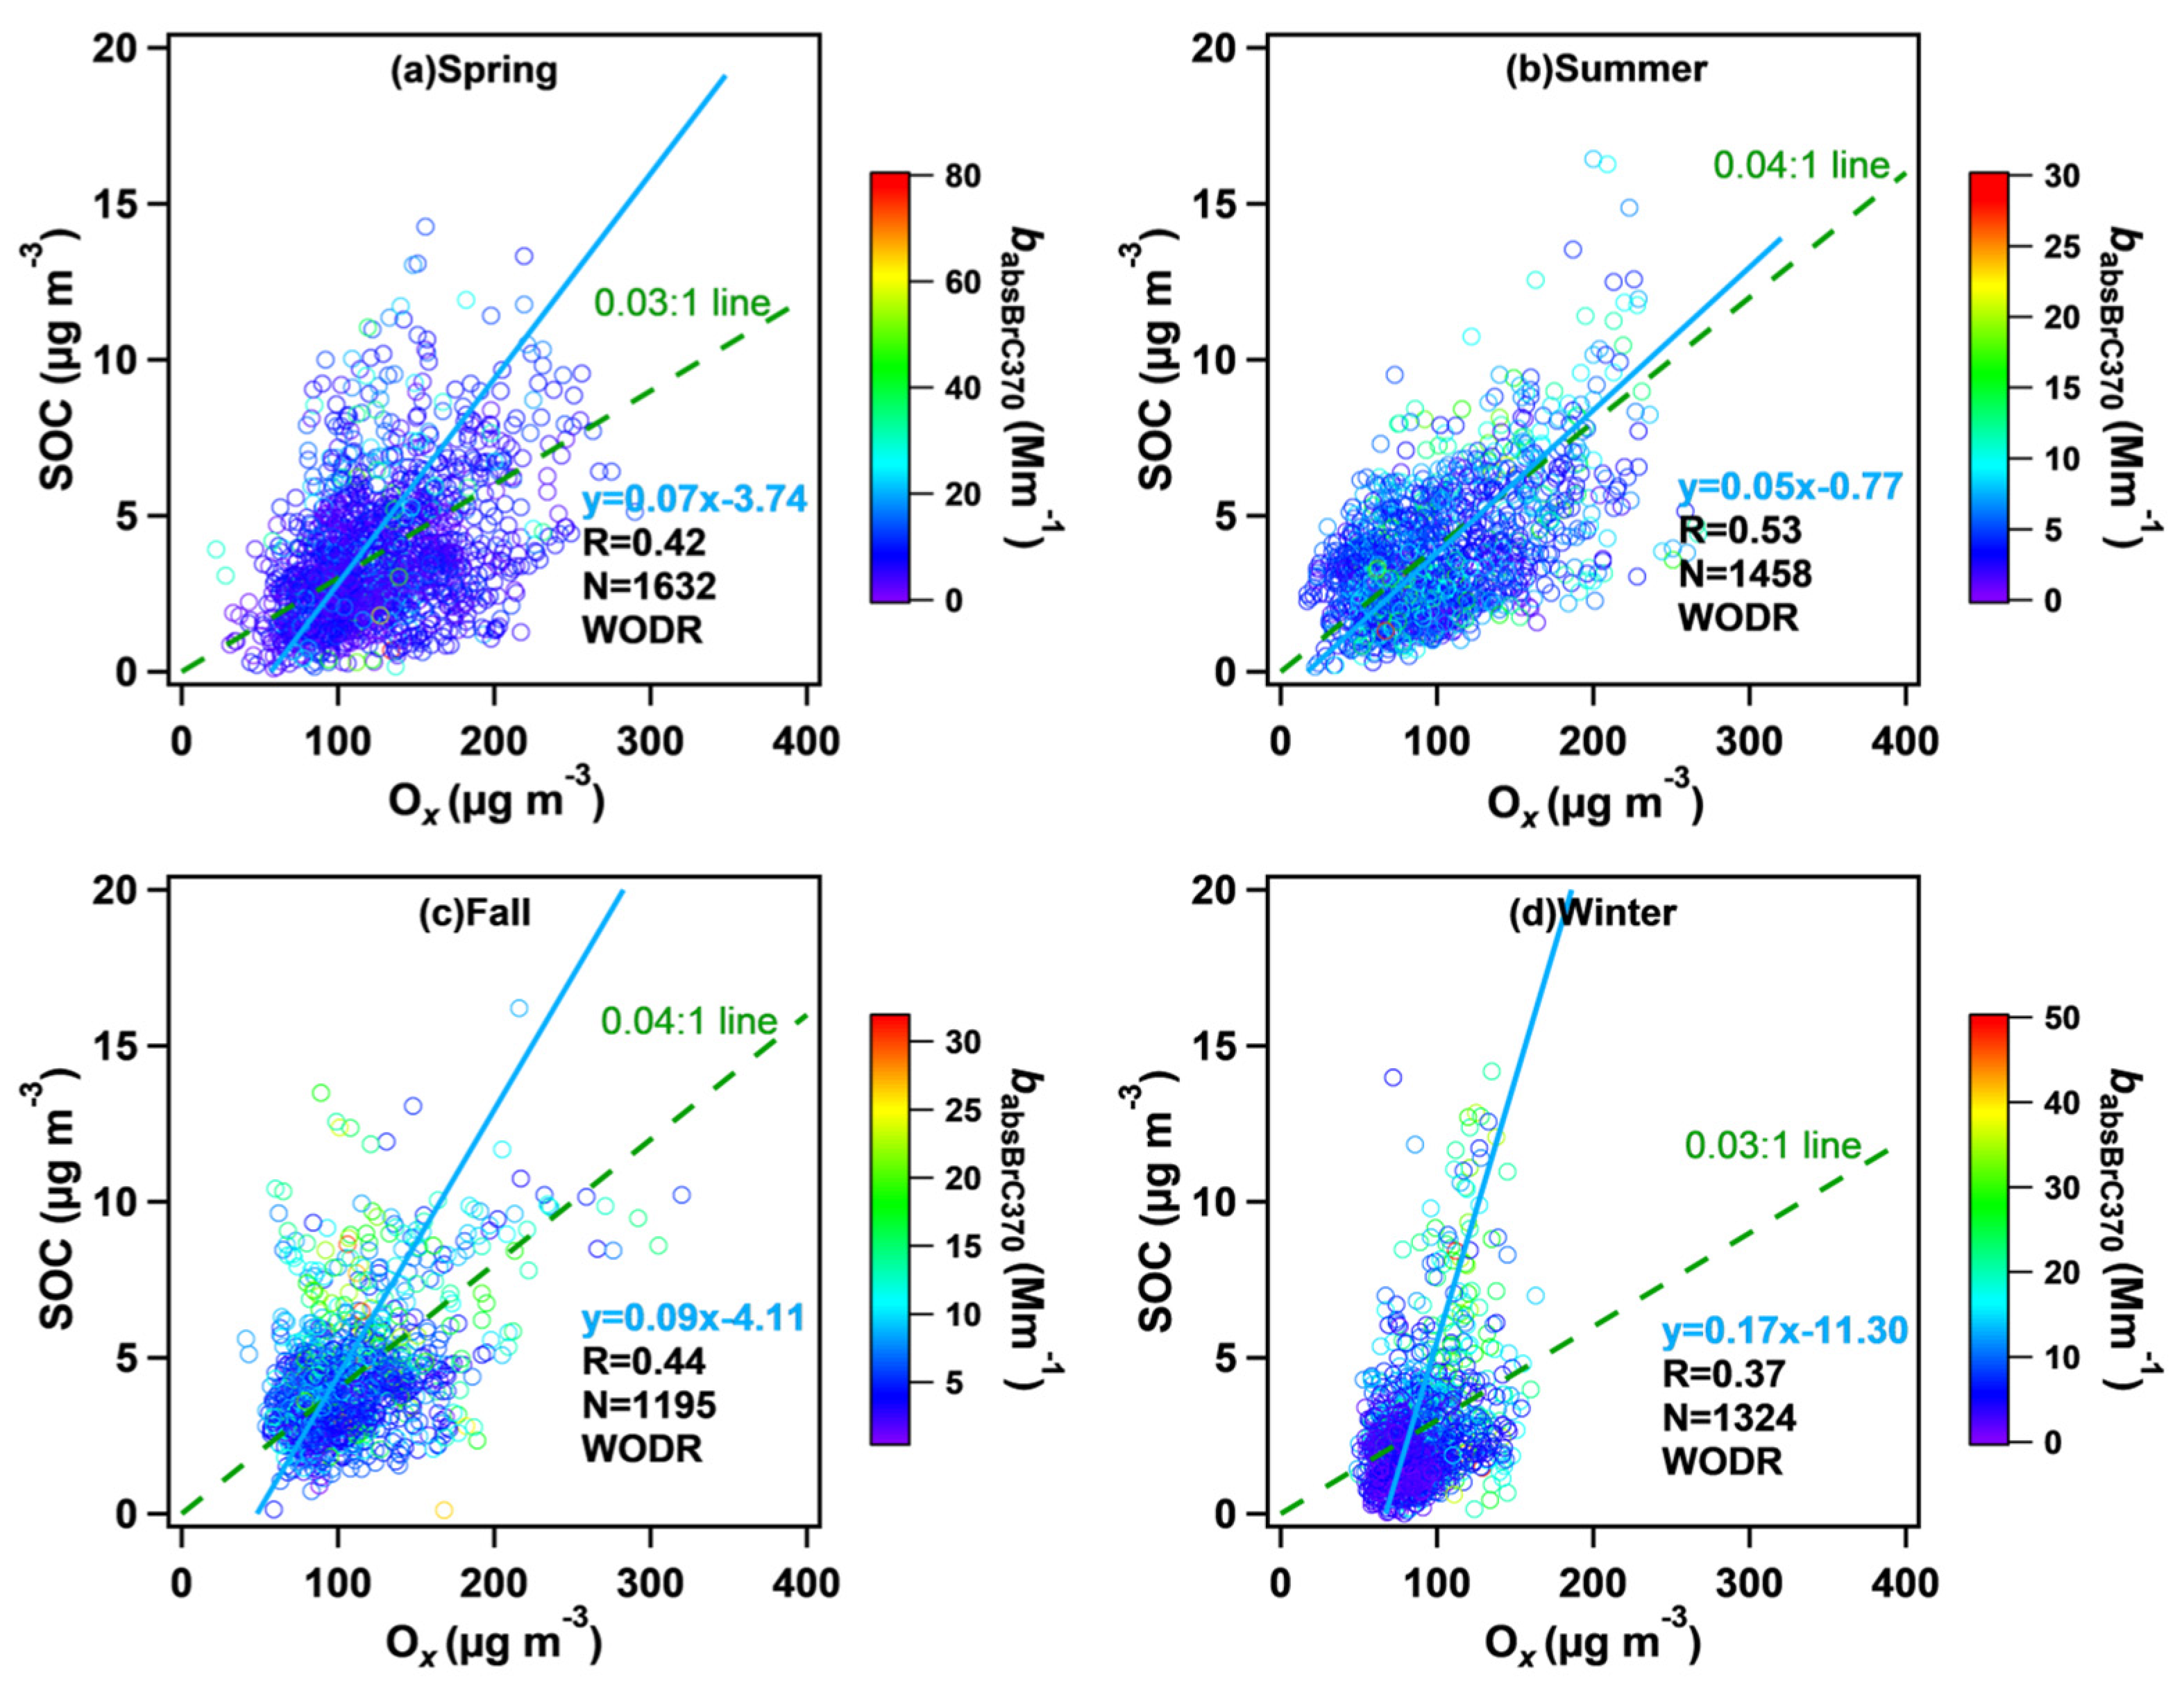
3.2.2. The Effect of Photochemistry on the Light Absorption of BrC

Figure S3 shows that the SOC concentrations were higher in summer and fall. On the other hand, positive correlations between SOC and Ox were observed in these two seasons, with r values of 0.53 and 0.44, respectively (Figure 7). The implication is that photochemical processes did play a significant role in SOC production in both summer and fall. However, it shows a great enhancement of BrC absorption in fall but decreased BrC absorption in summer (Figure 4). The implication is that the mechanism of SOC production is different, or, in other words, the composition is different in those two seasons, so more field investigations should be conducted. In comparison, SOC shows a negligible correlation with RH (Figure S4), in line with photochemistry being the dominant pathway of SOC production in both summer and fall.

3.3. Source Apportionment of BrC

3.3.1. PMF Analysis

The source apportionment of BrC was performed by using the PMF model (EPA PMF 5.0). The results for different seasons are shown in Figure 8. Biomass-burning-related, vehicle-related, sulfate-related, nitrate-related, and dust-related sources were the main contributors to BrC.
The first factor is represented by high contributions of Cl and K+; these species are commonly deemed as emissions associated with biomass burning [48,49]. The contributions of this factor to the light absorption of BrC vary from 5.4% (winter) to 11.4% (spring), indicating that the contribution of biomass burning to BrC is more important in spring. Factor 2 is identified as vehicle-related emissions, with high mass loadings of OC and EC. OC and EC are major pollutants from gasoline and diesel combustion [50,51]. The contributions of factor 2 to the light absorption of BrC range from 65.8% (spring) to 77.2% (fall), and it shows the highest value in all seasons. Figure S5 indicates that vehicle-related BrC accounts for a large proportion of the five factors. It should be noted that the sampling site is located at South Gate Station, urban Suzhou, which is a transportation hub (Figure S6). Thus, factor 2 was identified as a vehicle-related factor.
The main components defining factor 3 are SO42− and NH4+, and this is generally denoted as a sulfate-related factor. The contributions of this factor to the light absorption of BrC vary from 7.3% (summer) to 13.8% (winter). Factor 4 is characterized by high mass loadings of NO3 and NH4+, and is generally denoted as a nitrate-related factor. The contributions of factor 4 to the light absorption of BrC vary from 0.6% (fall) to 4.6% (spring). Many reports suggested that SO42−, NO3, and NH4+ were derived mainly from the conversion processes of gas to particle. The chemical profile of factor 5 is mainly characterized by Ca2+, Mg2+, and Na+, which are generally derived from dust [52]. Therefore, factor 5 is denoted as a dust-related factor, the contributions of which to the light absorption of BrC range from 4.0% (fall and winter) to 8.9% (summer). Overall, the vehicle-related factor was the highest contributor to the light absorption of BrC in Suzhou in the year 2021, followed by the sulfate-related factor, the BB-related factor, the dust-related factor, and the nitrate-related factor.

3.3.2. PSCF Analysis

To investigate the potential advection of BrC, PSCF analysis was applied in this study. Figure 9 shows the potential sources of BrC in different seasons. In spring, bBrC was mainly affected by the air mass from the south. In summer, it was dominated by air mass from the south. In fall, it was affected by air mass from the northwest, while it has much more complex sources in winter, e.g., from three different directions. The SOC concentrations were higher in summer and autumn, but the chemical composition of SOC produced by different potential regional pollution sources varied (Figure 9), which may have caused great differences in the absorption coefficient values (Figure 6a). According to the influence degree of the potential source areas, the sequence was winter > spring > fall > summer. At the same time, PSCF analyses of POC, SOC, SO42−, and NO3 were also conducted in this study (Figure S7). In summer, the potential sources of BrC were mainly affected by regional transportation, while in winter, its potential sources were mainly affected by long-distance transmission.

4. Conclusions

Suzhou is one of the most polluted industrial cities in the YRD. This study presents real-time measurements of BrC light absorption in the years 2020 to 2021. Overall, the absorption coefficient and AAE of BrC both showed the highest values in winter and the lowest values in summer. The MAC values of primary brown carbon were significantly higher than those of secondary brown carbon, suggesting photochemical oxidation could weaken the light absorption of aged BrC. The photochemical process was confirmed to play a significant role in SOC production in both summer and fall. However, it was shown to greatly enhance BrC absorption in fall but decrease BrC absorption in summer, suggesting the mechanism of SOC production is different, and more field investigations should be conducted in those seasons in the future.
The results of PMF showed that vehicle emissions had a great influence on the light absorption of BrC. The PSCF analysis showed that the air mass from the south was the potential source of BrC pollution in Suzhou. The potential sources of BrC were mainly affected by certain types of regional transportation in summer, while its potential sources were mainly affected by long-distance transmission in winter. However, due to the lack of molecular characterization in this study, it is impossible to explain which components contribute more to the light absorption of BrC. It is necessary to combine molecular composition with the light absorption properties of BrC in future work.
The results of this study suggested that control measures for reducing vehicle emissions should be adopted to decrease the probability of haze occurrence; meanwhile, it could provide scientific support for developing effective strategies to improve air quality.

Supplementary Materials

The following supporting information can be downloaded at https://www.mdpi.com/article/10.3390/atmos15040421/s1: Table S1: MAC for BC corresponding to AE31 has been provided by the manufacturer. The compensation parameter (f) as a function of wavelength for aethalometer AE31; Figure S1: Temporal variations in meteorological parameters: hourly averaged concentrations of gas and major PM2.5 species and absorption coefficients of BrC and BC at 370 nm; Figure S2: Potential source areas for CO and NO2 in winter. The color code denotes the PSCF probability; Figure S3: Seasonal variations in mass concentrations and mass fractions of POC and SOC; Figure S4: Scatter plot of SOC and RH all year round; Figure S5: The proportion of BrC in five factors; Figure S6: Location of the sampling site and surrounding region; Figure S7: Potential source areas for POC, SOC, SO42−, and NO3 in four seasons. The color code denotes the PSCF probability.

Author Contributions

Conceptualization, J.W.; methodology, X.G., N.Z., J.W. and E.A.; validation, J.W. and E.A.; formal analysis, S.X.; data curation, S.X., Y.L. and N.Z.; writing—original draft preparation, S.X.; writing—review and editing, S.X.; supervision, J.W.; project administration, J.W.; funding acquisition, J.W. All authors have read and agreed to the published version of the manuscript.

Funding

This research was funded by the National Natural Science Foundation of China (Grant 22276099).

Institutional Review Board Statement

Not applicable.

Informed Consent Statement

Not applicable.

Data Availability Statement

The data presented in this study are available on request from the corresponding author. The data are not publicly available due to privacy.

Acknowledgments

We acknowledge all the anonymous reviewers for their comments to improve the original manuscript.

Conflicts of Interest

The authors declare no conflicts of interest.

References

  1. Kirchstetter, T.W.; Novakov, T.; Hobbs, P.V. Evidence that the spectral dependence of light absorption by aerosols is affected by organic carbon. J. Geophys. Res.-Atmos. 2004, 109, D21208. [Google Scholar] [CrossRef]
  2. Andreae, M.O.; Gelencsér, A. Black carbon or brown carbon? The nature of light-absorbing carbonaceous aerosols. Atmos. Chem. Phys. 2006, 6, 3131–3148. [Google Scholar] [CrossRef]
  3. Alexander, D.T.L.; Crozier, P.A.; Anderson, J.R. Brown carbon spheres in East Asian outflow and their optical properties. Science 2008, 321, 833–836. [Google Scholar] [CrossRef] [PubMed]
  4. Saleh, R. From measurements to models: Toward accurate representation of brown carbon in climate calculations. Curr. Pollut. Rep. 2020, 6, 90–104. [Google Scholar] [CrossRef]
  5. Mok, J.; Krotkov, N.A.; Arola, A.; Torres, O.; Jethva, H.; Andrade, M.; Labow, G.; Eck, T.F.; Li, Z.; Dickerson, R.R.; et al. Impacts of brown carbon from biomass burning on surface UV and ozone photochemistry in the Amazon Basin. Sci. Rep. 2016, 6, 36940. [Google Scholar] [CrossRef] [PubMed]
  6. Liu, J.; Bergin, M.; Guo, H.; King, L.; Kotra, N.; Edgerton, E.; Weber, R. Size-resolved measurements of brown carbon in water and methanol extracts and estimates of their contribution to ambient fine-particle light absorption. Atmos. Chem. Phys. 2013, 13, 12389–12404. [Google Scholar] [CrossRef]
  7. Xu, B.; Fan, M.; Lu, X.; Zhang, Z.; Li, M.; Tao, J.; Chen, L.; Song, S. Light absorption properties and source contributions of black and brown carbon in Guangxi, southern China. Atmos. Res. 2024, 302, 107317. [Google Scholar] [CrossRef]
  8. Wang, H.; Su, Y.; Liu, Y.; Xie, F.; Zhou, X.; Yu, R.; Lü, C.; He, J. Water-soluble brown carbon in atmospheric aerosols from the resource-dependent cities: Optical properties, chemical compositions and sources. J. Environ. Sci. 2024, 138, 74–87. [Google Scholar] [CrossRef]
  9. Cheng, Y.; He, K.b.; Du, Z.y.; Engling, G.; Liu, J.m.; Ma, Y.l.; Zheng, M.; Weber, R.J. The characteristics of brown carbon aerosol during winter in Beijing. Atmos. Environ. 2016, 127, 355–364. [Google Scholar] [CrossRef]
  10. Satish, R.; Shamjad, P.; Thamban, N.; Tripathi, S.; Rastogi, N. Temporal characteristics of brown carbon over the central Indo-Gangetic Plain. Environ. Sci. Technol. 2017, 51, 6765–6772. [Google Scholar] [CrossRef]
  11. Yan, C.; Zheng, M.; Bosch, C.; Andersson, A.; Desyaterik, Y.; Sullivan, A.P.; Collett, J.L.; Zhao, B.; Wang, S.; He, K. Important fossil source contribution to brown carbon in Beijing during winter. Sci. Rep. 2017, 7, 43182. [Google Scholar] [CrossRef] [PubMed]
  12. Fan, X.; Wei, S.; Zhu, M.; Song, J.; Peng, P. Comprehensive characterization of humic-like substances in smoke PM2.5 emitted from the combustion of biomass materials and fossil fuels. Atmos. Chem. Phys. 2016, 16, 13321–13340. [Google Scholar] [CrossRef]
  13. Schnitzler, E.G.; Gerrebos, N.G.; Carter, T.S.; Huang, Y.; Heald, C.L.; Bertram, A.K.; Abbatt, J.P. Rate of atmospheric brown carbon whitening governed by environmental conditions. Proc. Natl. Acad. Sci. USA 2022, 119, e2205610119. [Google Scholar] [CrossRef] [PubMed]
  14. Gilardoni, S.; Massoli, P.; Paglione, M.; Giulianelli, L.; Carbone, C.; Rinaldi, M.; Decesari, S.; Sandrini, S.; Costabile, F.; Gobbi, G.P. Direct observation of aqueous secondary organic aerosol from biomass-burning emissions. Proc. Natl. Acad. Sci. USA 2016, 113, 10013–10018. [Google Scholar] [CrossRef] [PubMed]
  15. Wang, J.; Ye, J.; Zhang, Q.; Zhao, J.; Wu, Y.; Li, J.; Liu, D.; Li, W.; Zhang, Y.; Wu, C. Aqueous production of secondary organic aerosol from fossil-fuel emissions in winter Beijing haze. Proc. Natl. Acad. Sci. USA 2021, 118, e2022179118. [Google Scholar] [CrossRef] [PubMed]
  16. Zhong, M.; Xu, J.; Wang, H.; Gao, L.; Zhu, H.; Zhai, L.; Zhang, X.; Zhao, W. Characterizing water-soluble brown carbon in fine particles in four typical cities in northwestern China during wintertime: Integrating optical properties with chemical processes. Atmos. Chem. Phys. 2023, 23, 12609–12630. [Google Scholar] [CrossRef]
  17. Mo, Y.; Li, J.; Cheng, Z.; Zhong, G.; Zhu, S.; Tian, C.; Chen, Y.; Zhang, G. Dual carbon isotope-based source apportionment and light absorption properties of water-soluble organic carbon in PM2.5 over China. J. Geophys. Res.-Atmos. 2021, 126, e2020JD033920. [Google Scholar] [CrossRef]
  18. Zhang, X.; Lin, Y.H.; Surratt, J.D.; Weber, R.J. Sources, composition and absorption Ångstrom exponent of light-absorbing organic components in aerosol extracts from the Los Angeles Basin. Environ. Sci. Technol. 2013, 47, 3685–3693. [Google Scholar] [CrossRef] [PubMed]
  19. Li, X.; Yang, Y.; Liu, S.; Zhao, Q.; Wang, G.; Wang, Y. Light absorption properties of brown carbon (BrC) in autumn and winter in Beijing: Composition, formation and contribution of nitrated aromatic compounds. Atmos. Environ. 2020, 223, 117289. [Google Scholar] [CrossRef]
  20. Yuan, W.; Huang, R.J.; Yang, L.; Guo, J.; Chen, Z.; Duan, J.; Wang, T.; Ni, H.; Han, Y.; Li, Y. Characterization of the light-absorbing properties, chromophore composition and sources of brown carbon aerosol in Xi’an, northwestern China. Atmos. Chem. 2020, 20, 5129–5144. [Google Scholar] [CrossRef]
  21. Shen, Z.; Lei, Y.; Zhang, L.; Zhang, Q.; Zeng, Y.; Tao, J.; Zhu, C.; Cao, J.; Xu, H.; Liu, S. Methanol extracted brown carbon in PM2.5 Over Xi’an, China: Seasonal variation of optical properties and sources identification. Aerosol Sci. Eng. 2017, 1, 57–65. [Google Scholar] [CrossRef]
  22. Yuan, J.F.; Huang, X.F.; Cao, L.M.; Cui, J.; Zhu, Q.; Huang, C.N.; Lan, Z.J.; He, L.Y. Light absorption of brown carbon aerosol in the PRD region of China. Atmos. Chem. Phys. 2016, 16, 1433–1443. [Google Scholar] [CrossRef]
  23. Xie, M.; Chen, X.; Hays, M.D.; Lewandowski, M.; Offenberg, J.; Kleindienst, T.E.; Holder, A.L. Light absorption of secondary organic aerosol: Composition and contribution of nitroaromatic compounds. Environ. Sci. Technol. 2017, 51, 11607–11616. [Google Scholar] [CrossRef] [PubMed]
  24. Li, Y.; Zhu, B.; Lei, Y.; Li, C.; Wang, H.; Huang, C.; Zhou, M.; Miao, Q.; Wei, H.; Wu, Y.; et al. Characteristics, formation, and sources of PM2.5 in 2020 in Suzhou, Yangtze River Delta, China. Environ. Res. 2022, 212, 113545. [Google Scholar] [CrossRef] [PubMed]
  25. Yang, J.; Au, W.C.; Law, H.; Lam, C.H.; Nah, T. Formation and evolution of brown carbon during aqueous-phase nitrate-mediated photooxidation of guaiacol and 5-nitroguaiacol. Atmos. Environ. 2021, 254, 118401. [Google Scholar] [CrossRef]
  26. Chen, Y.; Ge, X.; Chen, H.; Xie, X.; Chen, Y.; Wang, J.; Ye, Z.; Bao, M.; Zhang, Y.; Chen, M. Seasonal light absorption properties of water-soluble brown carbon in atmospheric fine particles in Nanjing, China. Atmos. Environ. 2018, 187, 230–240. [Google Scholar] [CrossRef]
  27. Zhang, L.; Son, J.H.; Bai, Z.; Zhang, W.; Li, L.; Wang, L.; Chen, J. Characterizing atmospheric brown carbon and its emission sources during wintertime in Shanghai, China. Atmosphere 2022, 13, 991. [Google Scholar] [CrossRef]
  28. Zhao, Y.; Wu, C.; Wang, Y.Q.; Chen, Y.B.; Lü, S.J.; Wang, F.L.; Du, W.; Liu, S.J.; Ding, Z.J.; Wang, G.H. Pollution characteristics and sources of wintertime atmospheric brown carbon at a background site of the Yangtze River Delta Region in China. Environ. Sci. 2021, 42, 3127–3135. [Google Scholar] [CrossRef]
  29. Zhang, Q.; Shen, Z.; Zhang, T.; Kong, S.; Lei, Y.; Wang, Q.; Tao, J.; Zhang, R.; Wei, P.; Wei, C. Spatial distribution and sources of winter black carbon and brown carbon in six Chinese megacities. Sci. Total Environ. 2021, 762, 143075. [Google Scholar] [CrossRef]
  30. Tian, M.; Wang, H.; Chen, Y.; Yang, F.; Zhang, X.; Zou, Q.; Zhang, R.; Ma, Y.; He, K. Characteristics of aerosol pollution during heavy haze events in Suzhou, China. Atmos. Chem. Phys. 2016, 16, 7357–7371. [Google Scholar] [CrossRef]
  31. Rajesh, T.A.; Ramachandran, S. Black carbon aerosol mass concentration, absorption and single scattering albedo from single and dual spot aethalometers: Radiative implications. J. Aerosol Sci. 2018, 119, 77–90. [Google Scholar] [CrossRef]
  32. Weingartner, E.; Saathoff, H.; Schnaiter, M.; Streit, N.; Bitnar, B.; Baltensperger, U. Absorption of light by soot particles: Determination of the absorption coefficient by means of aethalometers. J. Aerosol Sci. 2003, 34, 1445–1463. [Google Scholar] [CrossRef]
  33. Wang, F.; Zhang, X.; Yue, X.; Song, M.; Zhang, G.; Ming, J. Black carbon: The concentration and sources study at the Nam Co Lake, the Tibetan Plateau from 2015 to 2016. Atmosphere 2020, 11, 624. [Google Scholar] [CrossRef]
  34. Sandradewi, J.; Prévôt, A.S.; Szidat, S.; Perron, N.; Alfarra, M.R.; Lanz, V.A.; Weingartner, E.; Baltensperger, U. Using aerosol light absorption measurements for the quantitative determination of wood burning and traffic emission contributions to particulate matter. Environ. Sci. Technol. 2008, 42, 3316–3323. [Google Scholar] [CrossRef]
  35. Zhang, Y.; Wang, Q.; Tian, J.; Li, Y.; Liu, H.; Ran, W.; Han, Y.; Prévôt, A.S.; Cao, J. Impact of COVID-19 lockdown on the optical properties and radiative effects of urban brown carbon aerosol. Geosci. Front. 2022, 13, 101320. [Google Scholar] [CrossRef]
  36. Pani, S.K.; Lin, N.H.; Griffith, S.M.; Chantara, S.; Lee, C.T.; Thepnuan, D.; Tsai, Y.I. Brown carbon light absorption over an urban environment in northern peninsular Southeast Asia. Environ. Pollut. 2021, 276, 116735. [Google Scholar] [CrossRef]
  37. Xie, C.; Xu, W.; Wang, J.; Wang, Q.; Liu, D.; Tang, G.; Chen, P.; Du, W.; Zhao, J.; Zhang, Y. Vertical characterization of aerosol optical properties and brown carbon in winter in urban Beijing, China. Atmos. Chem. Phys. 2019, 19, 165–179. [Google Scholar] [CrossRef]
  38. Qin, Y.M.; Tan, H.B.; Li, Y.J.; Li, Z.J.; Schurman, M.I.; Liu, L.; Wu, C.; Chan, C.K. Chemical characteristics of brown carbon in atmospheric particles at a suburban site near Guangzhou, China. Atmos. Chem. Phys. 2018, 18, 16409–16418. [Google Scholar] [CrossRef]
  39. Wu, C.; Wu, D.; Yu, J.Z. Estimation and uncertainty analysis of secondary organic carbon using 1 year of hourly organic and elemental carbon data. J. Geophys. Res.-Atmos. 2019, 124, 2774–2795. [Google Scholar] [CrossRef]
  40. Lei, Y.; Shen, Z.; Tang, Z.; Zhang, Q.; Sun, J.; Ma, Y.; Wu, X.; Qin, Y.; Xu, H.; Zhang, R. Aerosols chemical composition, light extinction, and source apportionment near a desert margin city, Yulin, China. PeerJ 2020, 8, e8447. [Google Scholar] [CrossRef]
  41. Zhu, C.S.; Qu, Y.; Dai, W.T.; Zhang, N.N.; Zhang, Z.S.; Cao, J.J. Nonnegligible biogenic organic aerosol and the correlations with light absorption at three high altitude locations in the Qinghai-Tibetan Plateau. Atmos. Environ. 2022, 291, 119394. [Google Scholar] [CrossRef]
  42. Zong, Z.; Wang, X.; Tian, C.; Chen, Y.; Fu, S.; Qu, L.; Ji, L.; Li, J.; Zhang, G. PMF and PSCF based source apportionment of PM2.5 at a regional background site in North China. Atmos. Res. 2018, 203, 207–215. [Google Scholar] [CrossRef]
  43. Li, Z.; Tan, H.; Zheng, J.; Liu, L.; Qin, Y.; Wang, N.; Li, F.; Li, Y.; Cai, M.; Ma, Y. Light absorption properties and potential sources of particulate brown carbon in the Pearl River Delta region of China. Atmos. Chem. Phys. 2019, 19, 11669–11685. [Google Scholar] [CrossRef]
  44. Cao, N.; Chen, L.; Liu, Y.; Wang, J.; Yang, S.; Su, D.; Mi, K.; Gao, S.; Zhang, H. Spatiotemporal distribution, light absorption characteristics, and source apportionments of black and brown carbon in China. Sci. Total Environ. 2024, 919, 170796. [Google Scholar] [CrossRef] [PubMed]
  45. Lack, D.; Langridge, J. On the attribution of black and brown carbon light absorption using the Ångström exponent. Atmos. Chem. Phys. 2013, 13, 10535–10543. [Google Scholar] [CrossRef]
  46. Schnaiter, M.; Wurm, G. Experiments on light scattering and extinction by small, micrometer-sized aggregates of spheres. Appl. Opt. 2002, 41, 1175–1180. [Google Scholar] [CrossRef] [PubMed]
  47. Li, C.; Yan, F.; Kang, S.; Chen, P.; Hu, Z.; Gao, S.; Qu, B.; Sillanpää, M. Light absorption characteristics of carbonaceous aerosols in two remote stations of the southern fringe of the Tibetan Plateau, China. Atmos. Environ. 2016, 143, 79–85. [Google Scholar] [CrossRef]
  48. Silva, P.J.; Liu, D.Y.; Noble, C.A.; Prather, K.A. Size and chemical characterization of individual particles resulting from biomass burning of local Southern California species. Environ. Sci. Technol. 1999, 33, 3068–3076. [Google Scholar] [CrossRef]
  49. Zhang, N.; Maung, M.W.; Win, M.S.; Feng, J.; Yao, X. Carbonaceous aerosol and inorganic ions of PM2.5 in Yangon and Mandalay of Myanmar: Seasonal and spatial variations in composition and sources. Atmos. Pollut. Res. 2022, 13, 101444. [Google Scholar] [CrossRef]
  50. Feng, T.; Wang, F.; Yang, F.; Li, Z.; Lu, P.; Guo, Z. Carbonaceous aerosols in urban Chongqing, China: Seasonal variation, source apportionment, and long-range transport. Chemosphere 2021, 285, 131462. [Google Scholar] [CrossRef]
  51. Wang, G.; Cheng, S.; Li, J.; Lang, J.; Wen, W.; Yang, X.; Tian, L. Source apportionment and seasonal variation of PM2.5 carbonaceous aerosol in the Beijing-Tianjin-Hebei Region of China. Environ. Monit. Assess. 2015, 187, 143. [Google Scholar] [CrossRef] [PubMed]
  52. Thepnuan, D.; Chantara, S.; Lee, C.T.; Lin, N.H.; Tsai, Y.I. Molecular markers for biomass burning associated with the characterization of PM2.5 and component sources during dry season haze episodes in Upper South East Asia. Sci. Total Environ. 2018, 658, 708–722. [Google Scholar] [CrossRef] [PubMed]
Figure 1. (a) Average light absorption and (b) contribution of BC and BrC to the total light absorption at 370 nm.
Atmosphere 15 00421 g001
Figure 2. (a) Average light absorption of BrC in wavelength of 370–660 nm and (b) the frequency distributions of contributions of BrC to the total light absorption coefficient at 370 nm.
Atmosphere 15 00421 g002
Figure 3. The frequency distributions of AAE values of BrC in four seasons.
Atmosphere 15 00421 g003
Figure 4. MAC of different organic and inorganic components as a function of wavelength.
Atmosphere 15 00421 g004
Figure 5. (a) Light absorption and (b) the corresponding proportions of BrC in different PM2.5 concentration ranges at wavelengths of 370–660 nm.
Atmosphere 15 00421 g005
Figure 6. (a) Seasonal average light absorption coefficients and (b) the corresponding proportions of BrC at 370 nm at four different stages.
Atmosphere 15 00421 g006
Figure 7. Scatter plot of SOC, Ox, and light absorption coefficients of BrC at 370 nm.
Atmosphere 15 00421 g007
Figure 8. Source profiles resolved from positive matrix factorization (PMF) and the respective contribution of the different sources to babs370 in four seasons.
Atmosphere 15 00421 g008
Figure 9. Potential source areas for BrC during spring, summer, fall, and winter. The color code denotes the PSCF probability.
Atmosphere 15 00421 g009
Disclaimer/Publisher’s Note: The statements, opinions and data contained in all publications are solely those of the individual author(s) and contributor(s) and not of MDPI and/or the editor(s). MDPI and/or the editor(s) disclaim responsibility for any injury to people or property resulting from any ideas, methods, instructions or products referred to in the content.

