Distribution and Storage Characteristics of Soil Organic Carbon in Tidal Wetland of Dandou Sea, Guangxi
Abstract
:1. Introduction
2. Materials and Methods
2.1. Study Area
2.2. Data Source
2.2.1. Sentinel–2 Data
2.2.2. DEM Data
2.2.3. Existing Tidal Wetland Datasets
| Dataset Name | Data Author | Type | Year | Resolution |
|---|---|---|---|---|
| World Atlas of Mangroves (WAM) | Spalding et al. [37] | Mangrove | 2010 | 1:1,000,000 |
| Global Mangrove Watch (GMW v3.0) | Bunting et al. [34] | 1996–2020 | 30 m | |
| A global biophysical typology of mangroves (GBTM) | Worthington et al. [38] | 1996–2016 | 30 m | |
| Global Mangrove Classification Products (GMCP) | Xiao et al. [39] | 2018–2020 | 10 m | |
| Global distribution of mangroves USGS (GDM_USGS) | Giri et al. [40] | 2011 | 30 m | |
| Spatial distribution of S. alterniflora in China | Mao et al. and Liu et al. [41,42,43] | Salt marsh | 2015 | 30 m |
| Guangxi distribution of S. alterniflora | Huang [44] | 2009–2020 | 30 m | |
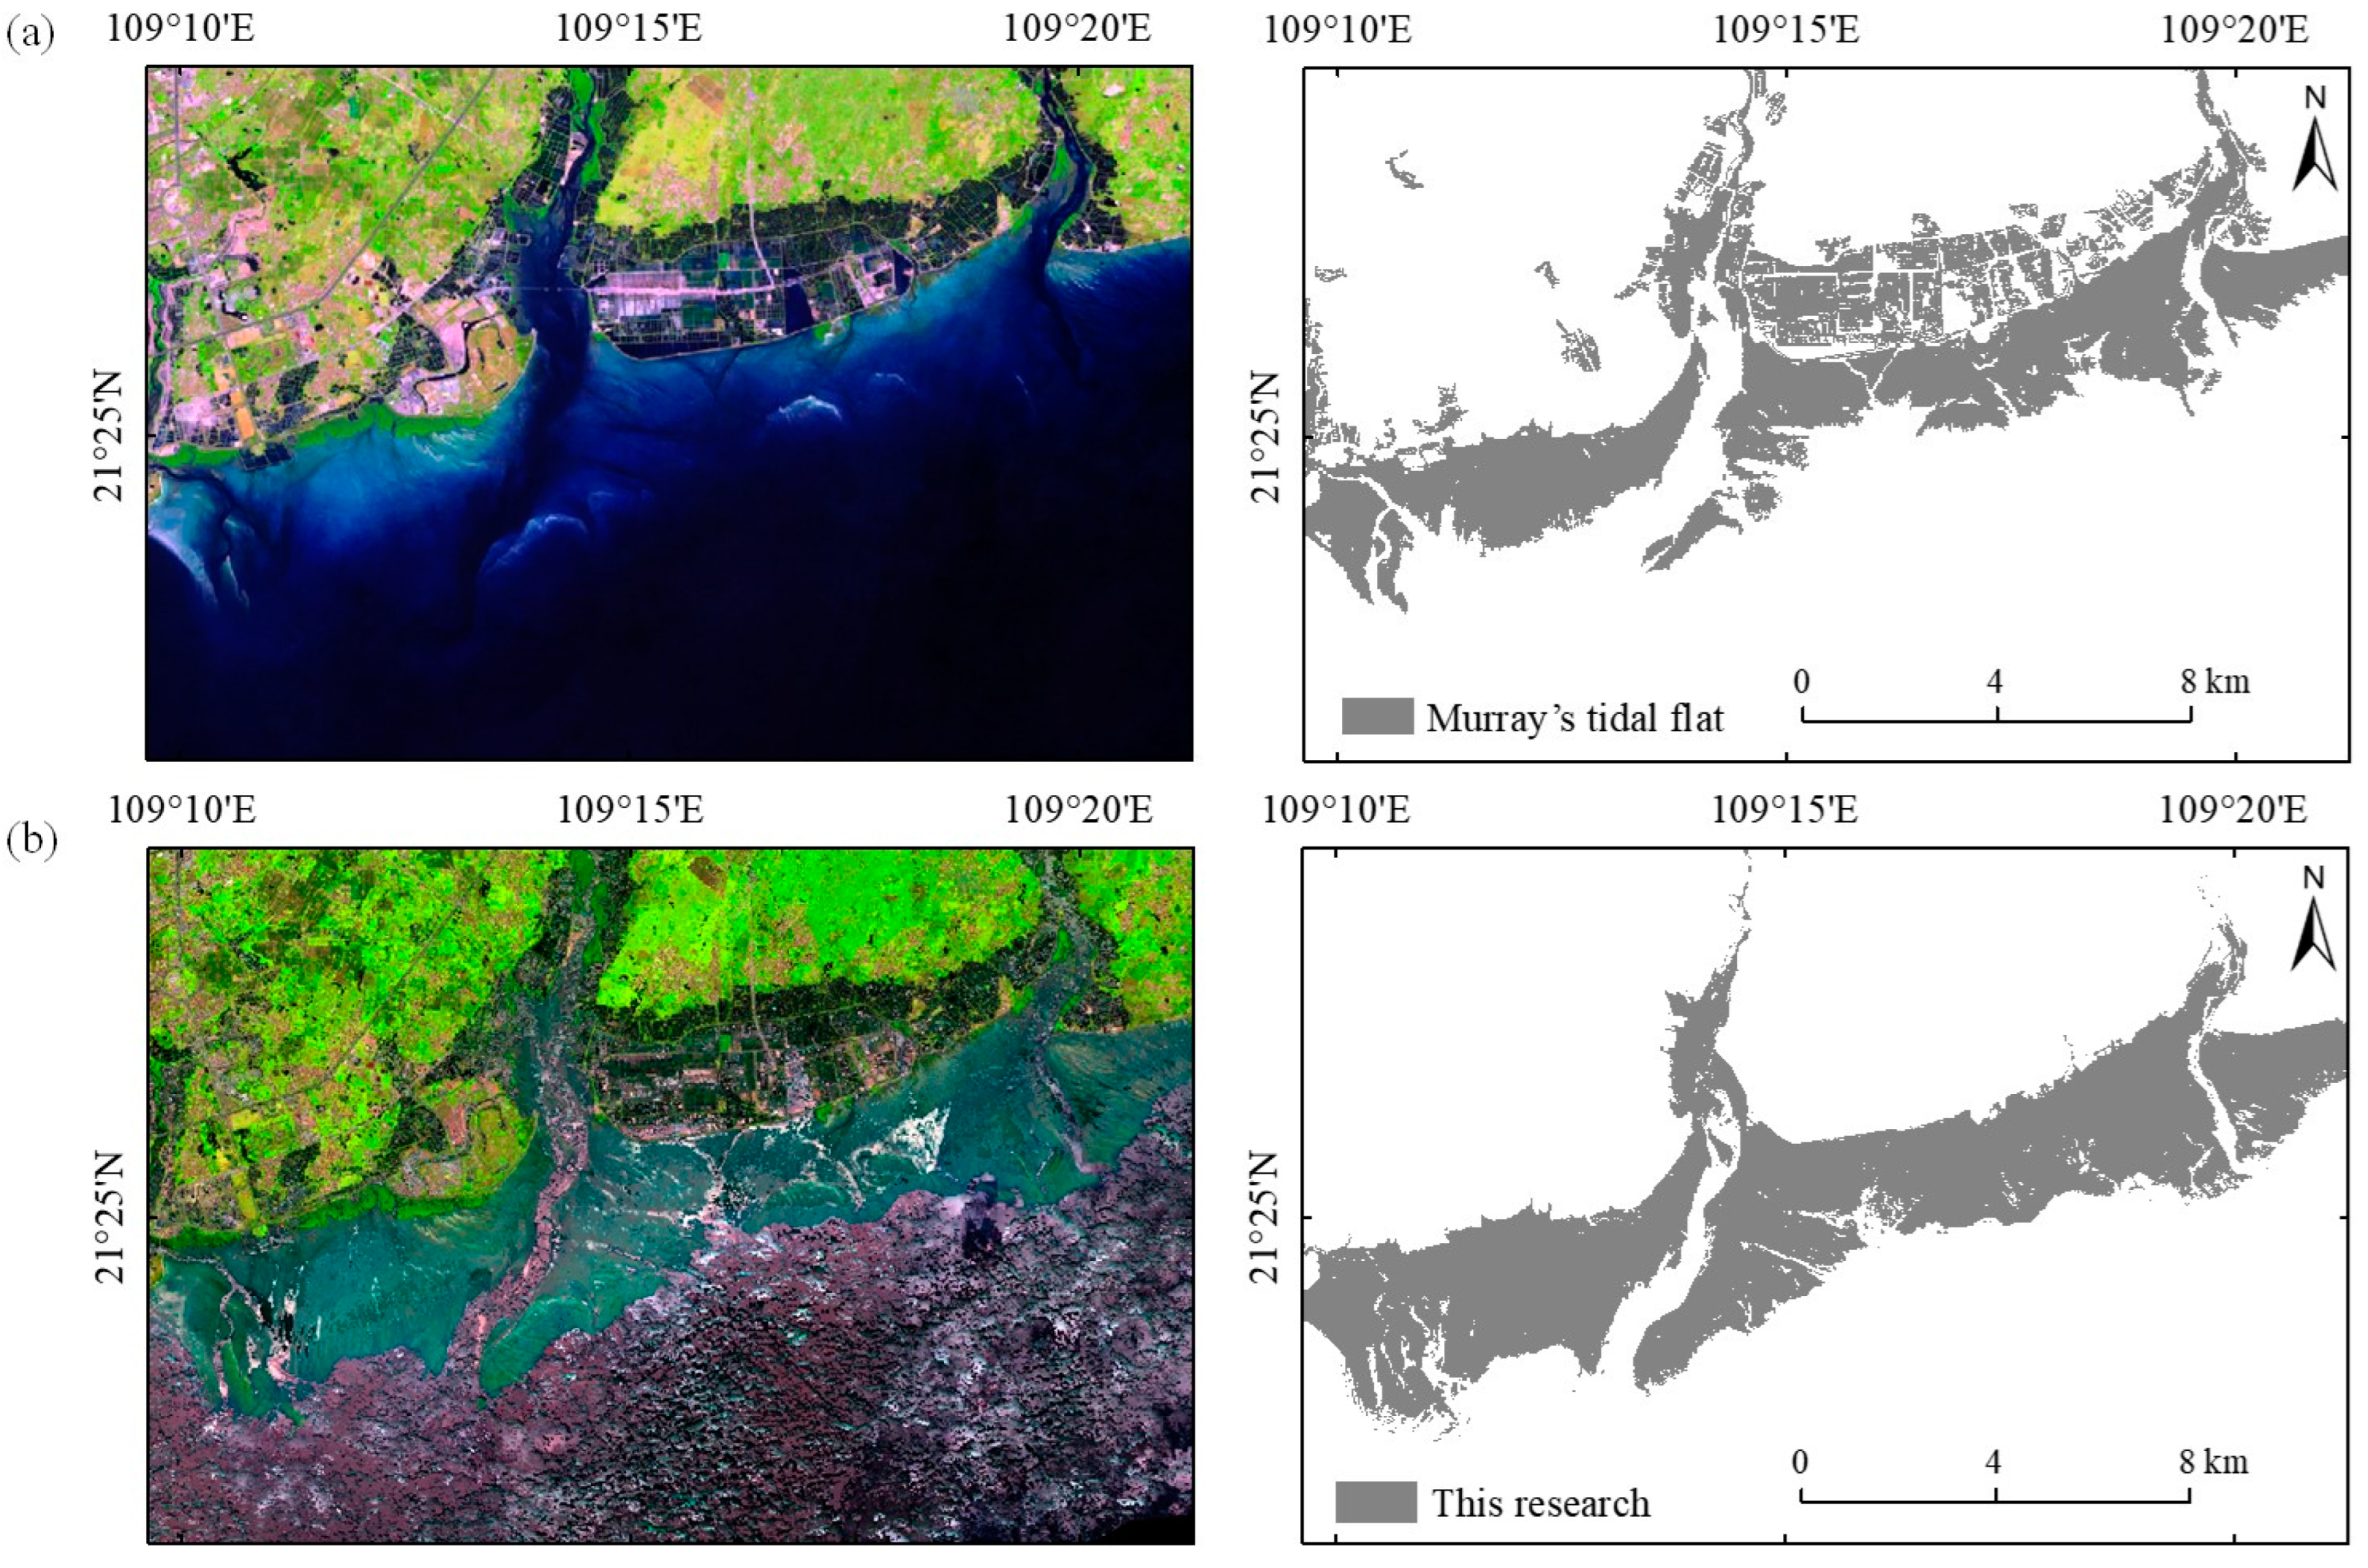
| Global distribution of tidal flat wetland ecosystems | Murray et al. [33] | Tidal flat | 1999–2019 | 30 m |
2.3. Collection of Sample Points and Determination of the Maximum Extent of Tidal Wetlands
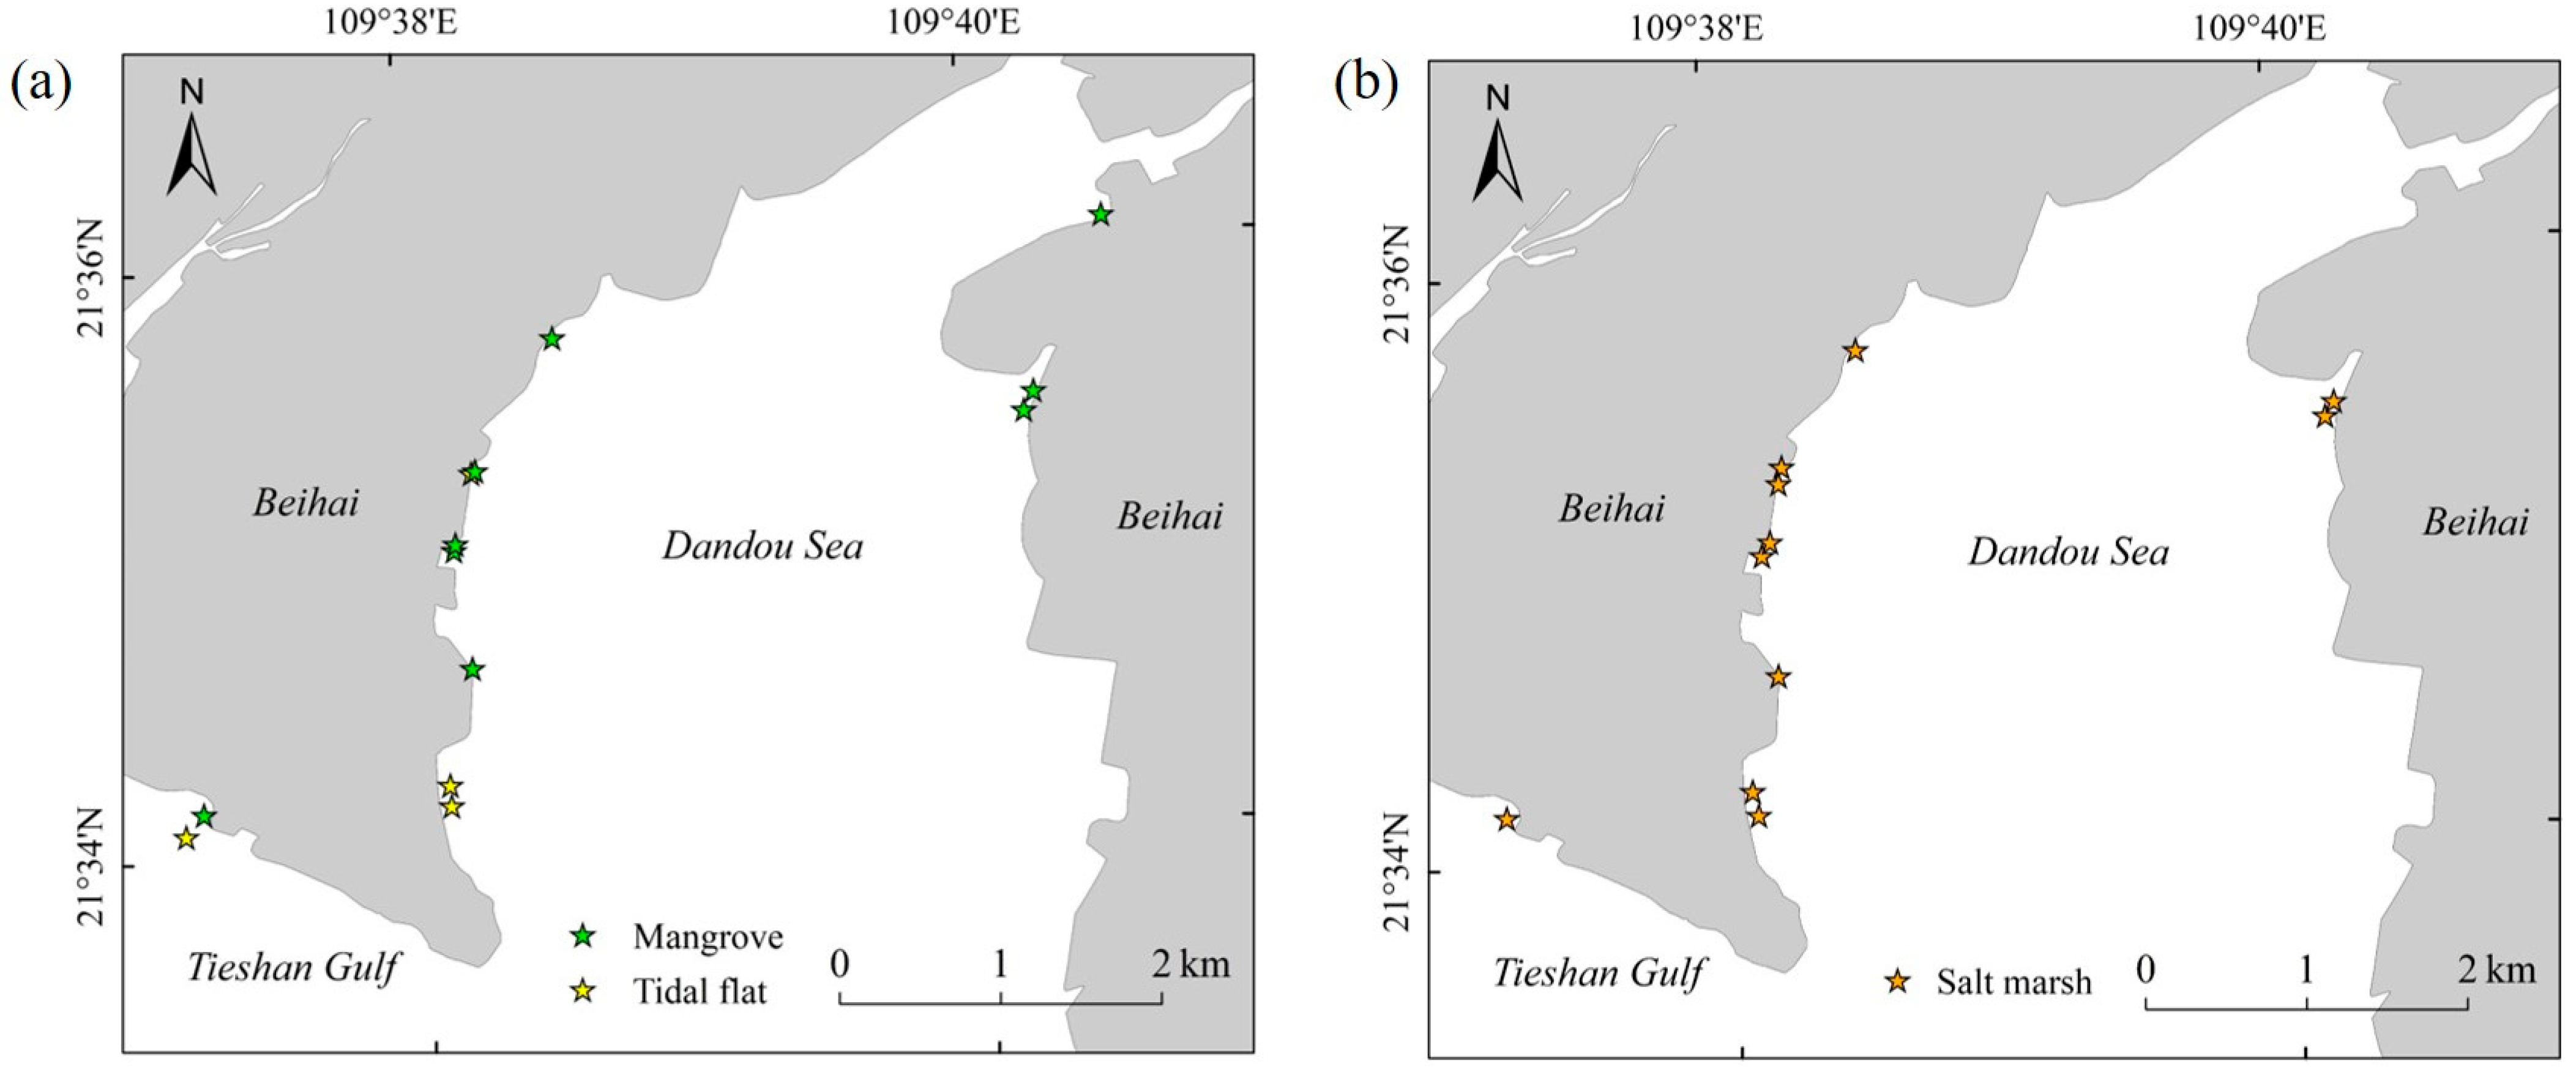
2.3.1. Determination of Tidal Wetland Sample Points and Maximum Range
2.3.2. Obtaining Non-Wetland Stable Sample Points from Previous Land Cover Products
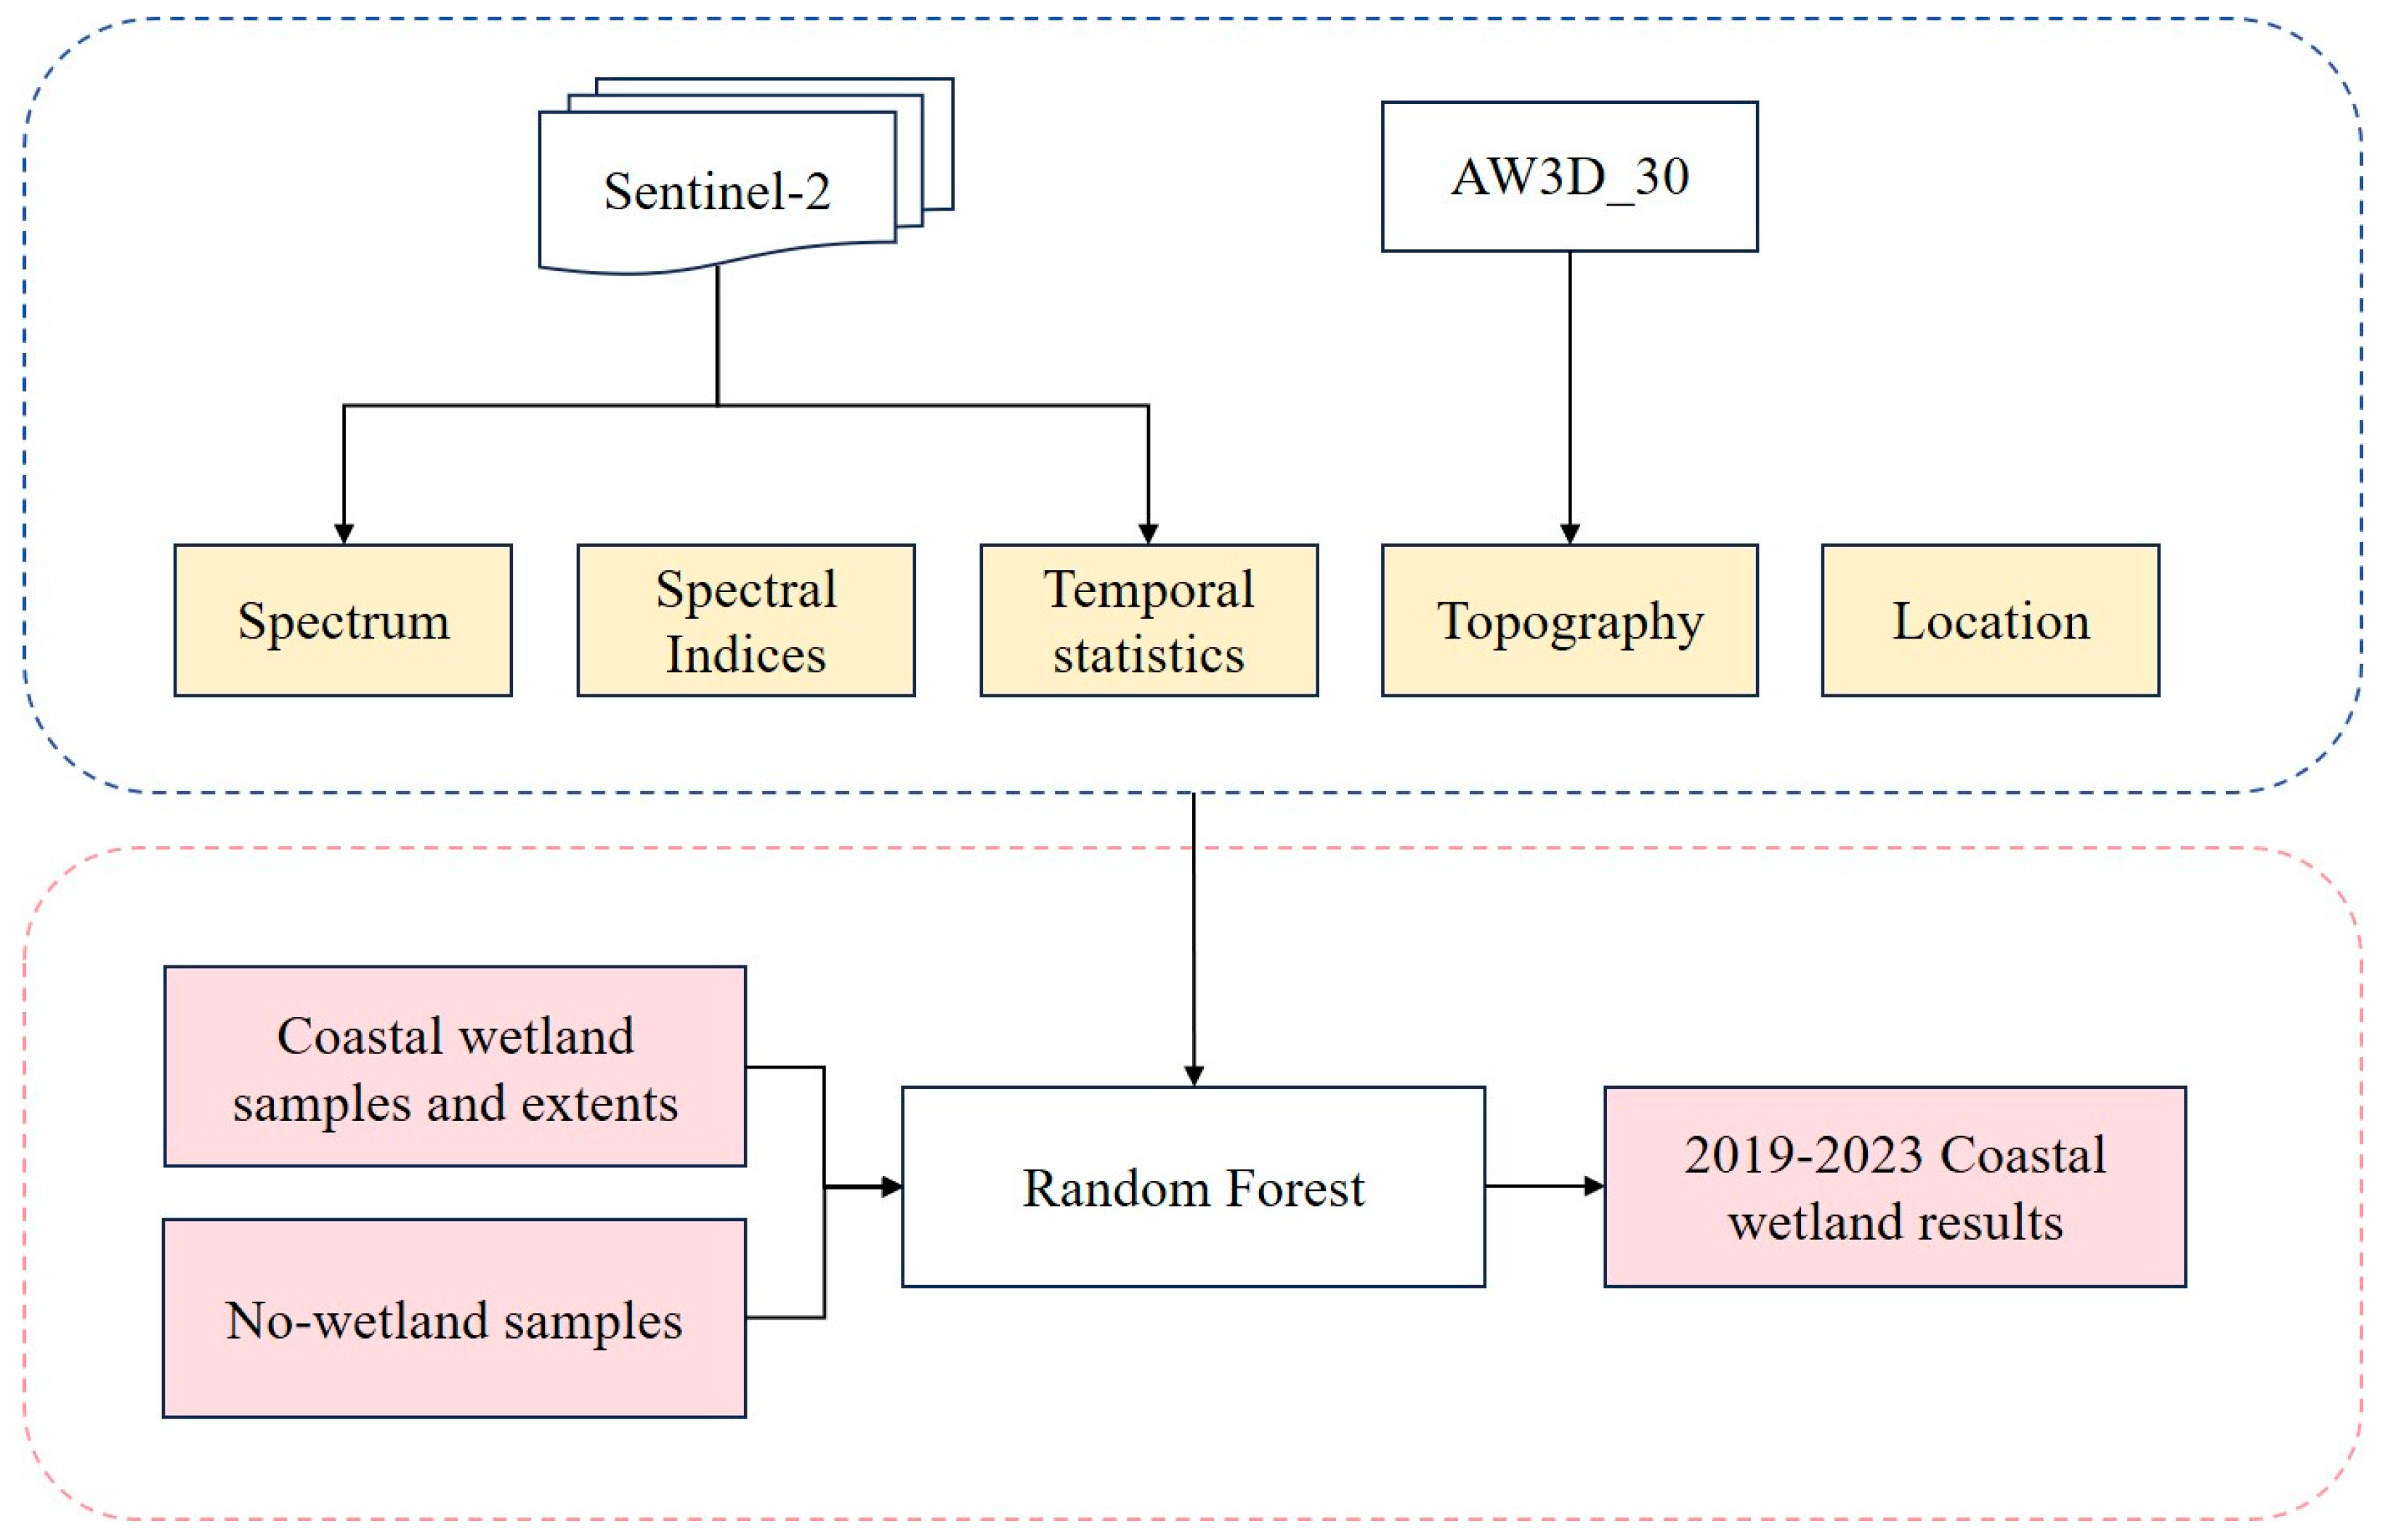
2.4. Methods
2.4.1. Calculation of Spectral Indices
2.4.2. Generation of Water Levels and Phenological Characteristics
2.4.3. Random Forest Algorithm
2.5. Sediment Sampling and Sample Treatment
2.6. Data Analysis
3. Results
3.1. Accuracy Assessment
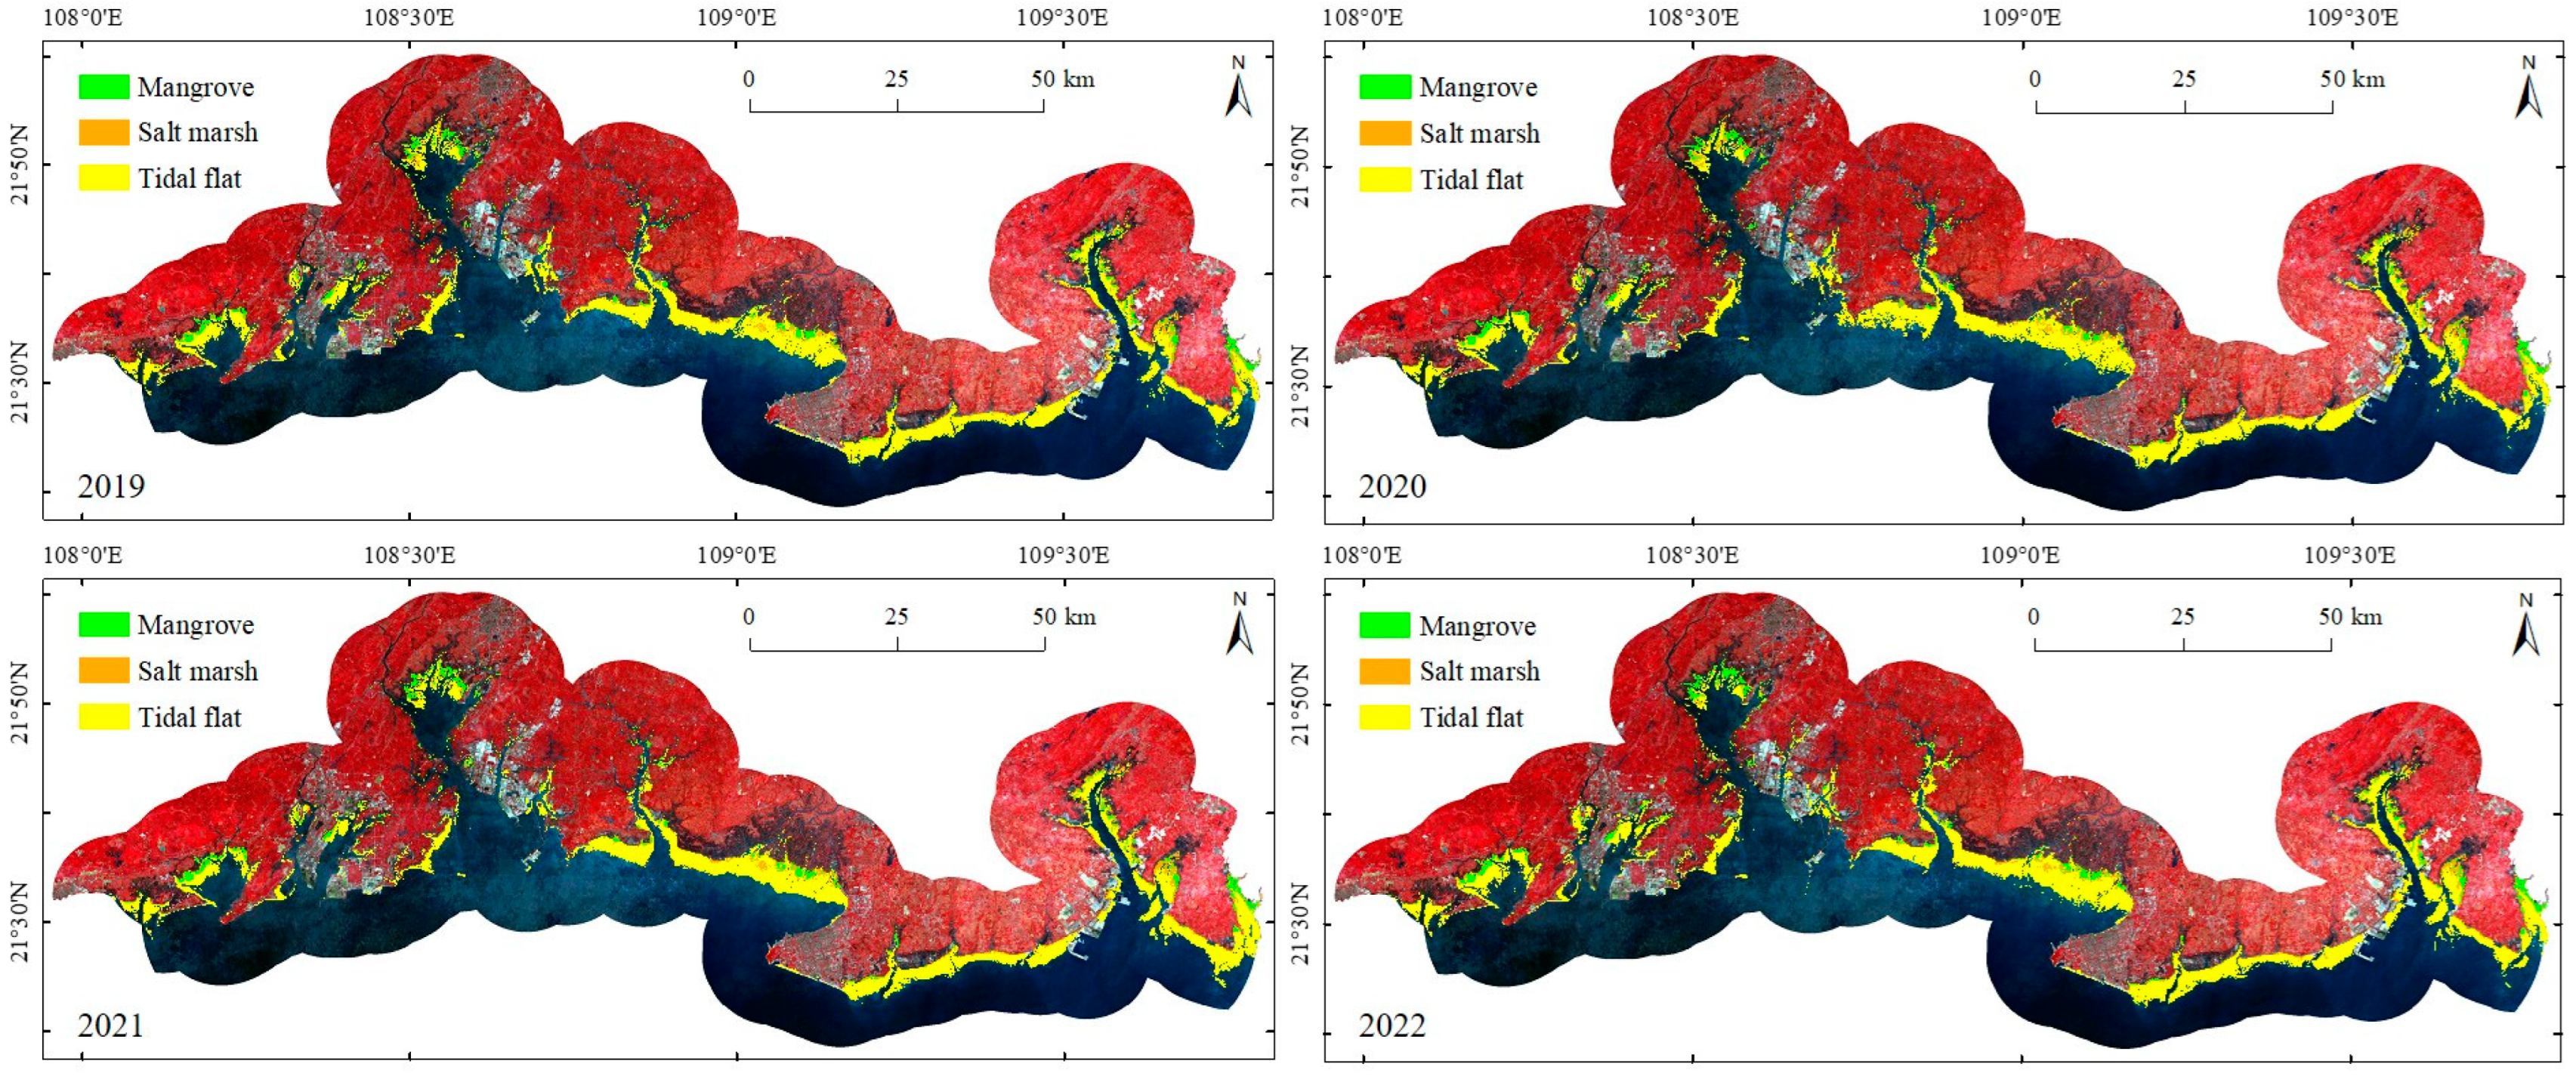
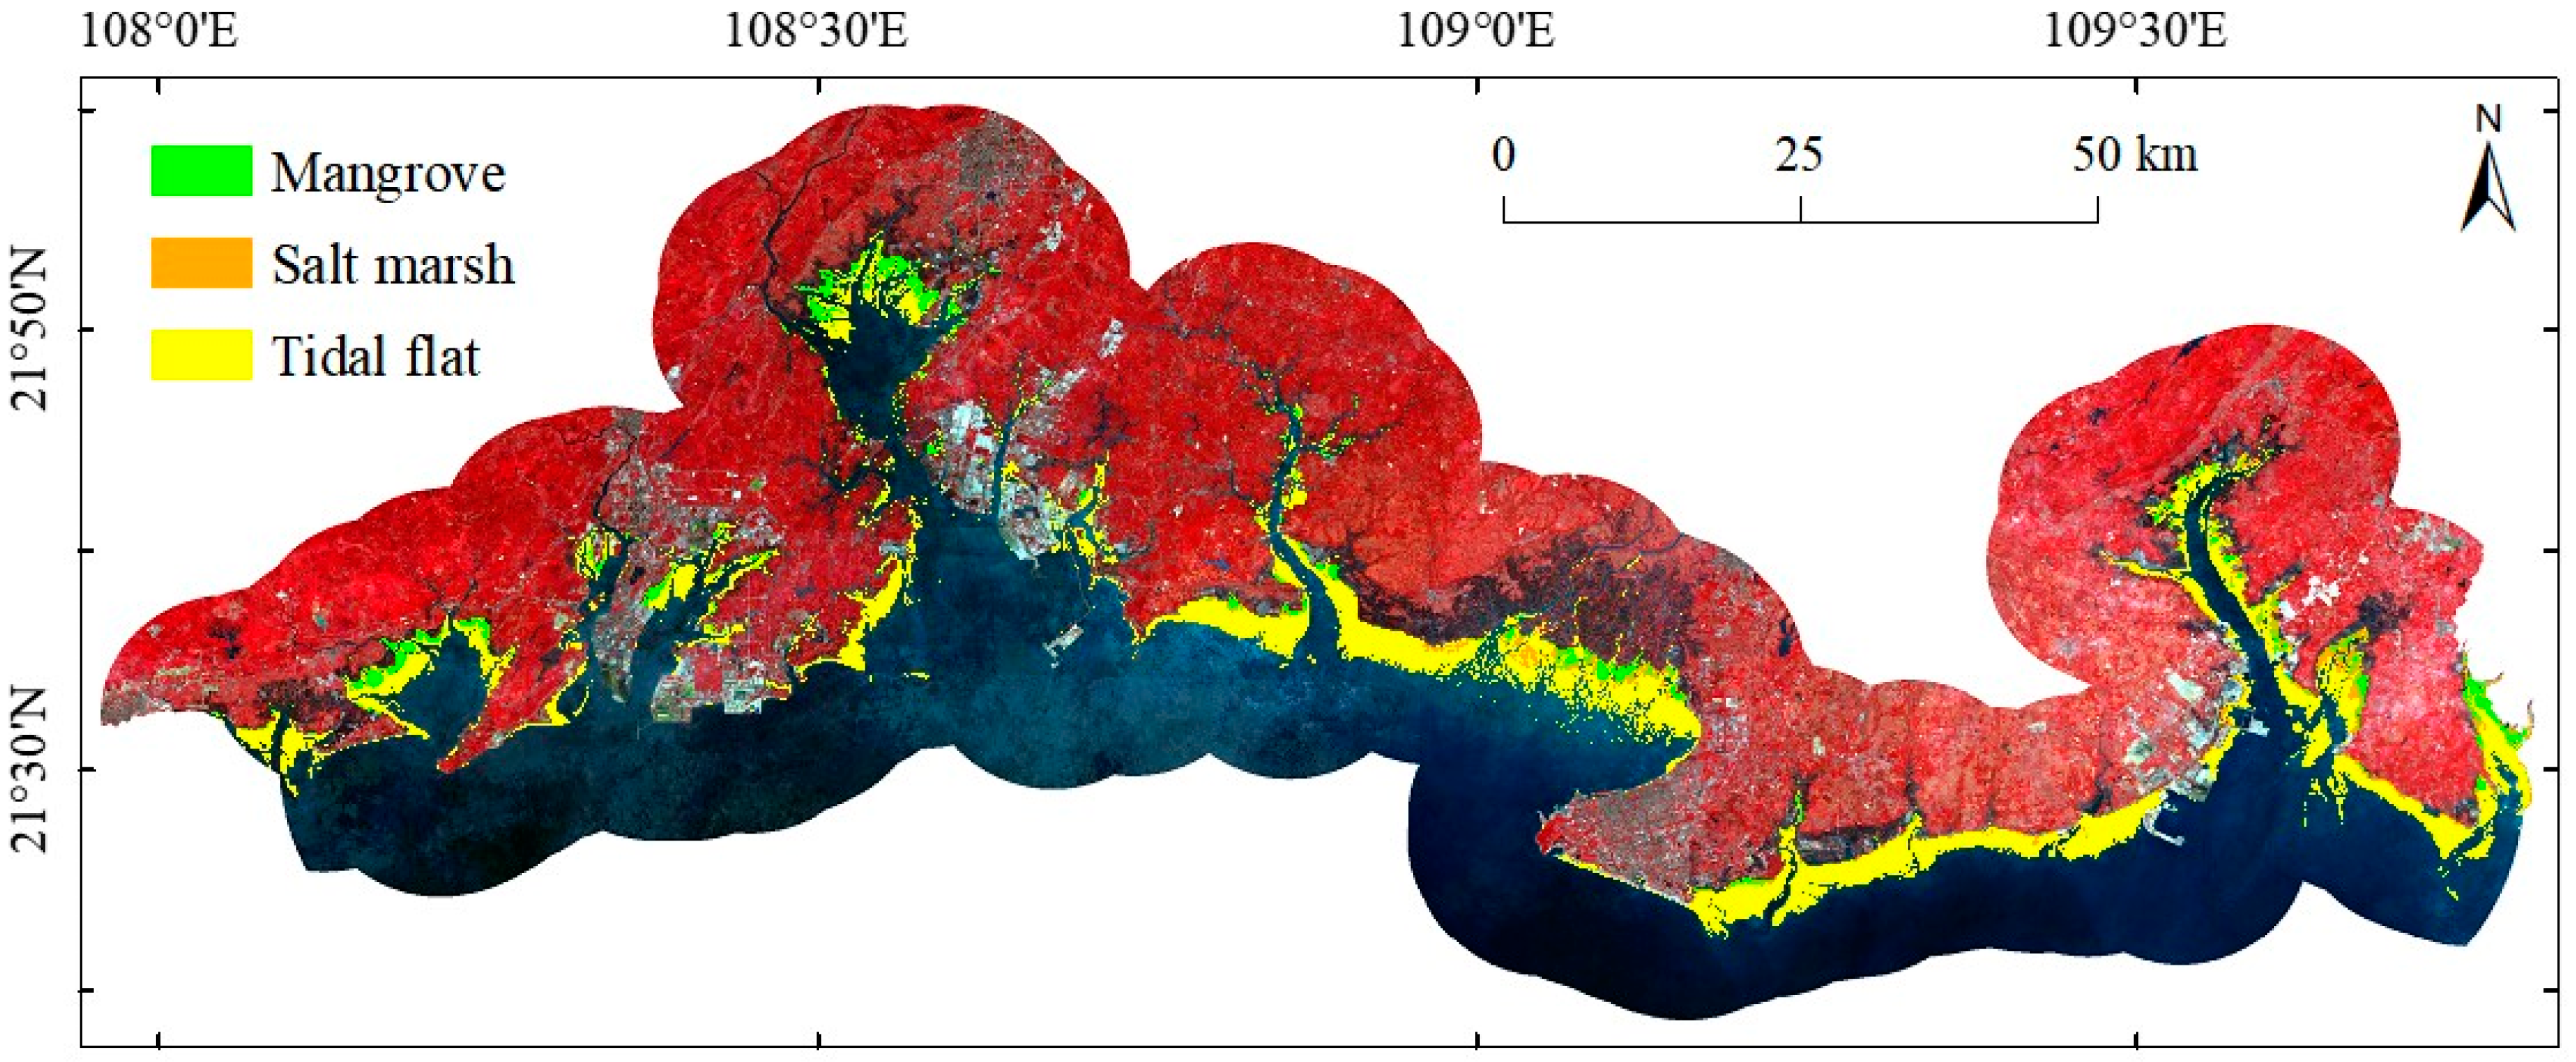
3.2. Spatial Pattern of Coastal Tidal Wetlands in Guangxi
3.3. Distribution Characteristics of SOC in Different Habitat Types
3.4. Characteristics of SOCS in Different Habitat Types
3.5. Correlation between SOCS, SOC, Their Components, and Various Factors
4. Discussion
4.1. Comparison with Other Tidal Wetland Data
4.2. Differences in the Distribution of SOC and SOCS among Different Habitat Types
5. Conclusions
Author Contributions
Funding
Institutional Review Board Statement
Informed Consent Statement
Data Availability Statement
Acknowledgments
Conflicts of Interest
Appendix A
| Abbreviation | Definition |
|---|---|
| BD | Bulk density |
| EC | Electrical conductivity |
| EOC | Easily oxidizable organic carbon |
| EVI | Enhanced Vegetation Index |
| GEE | Google Earth Engine |
| LSWI | Land Surface Water Index |
| MC | Moisture content |
| mNDWI | Modified Normalized Difference Water Index |
| MVI | Mangrove Vegetation Index |
| NDVI | Normalized Difference Vegetation Index |
| NDWI | Normalized Water Difference Index |
| NIR | Near-infrared |
| PA | Producer accuracy |
| POC | Particulate organic carbon |
| RF | Random forest |
| S. alterniflora | Spartina alterniflora |
| SOC | Soil organic carbon |
| SOCS | Soil organic carbon stock |
| SWIR1 | Shortwave infrared band 1 |
| UA | User accuracy |
| Mathematical Symbol | Meaning | Source of Mathematical Symbols |
|---|---|---|
| BDi | The soil BD in i soil depth (g/cm3) | Formula (12) |
| Ci | Carbon mass fraction in i soil depth (g/kg) | Formula (12) |
| China S. alterniflora | Spatial distribution of S. alterniflora in China data | Formula (2) |
| DW | The soil dry weight | Formula (10) |
| Ei | Thickness of soil in i soil depth (cm) | Formula (12) |
| FW | The soil fresh weight | Formula (10) |
| g | The fresh weight of ring knife soil (g) | Formula (11) |
| Guangxi S. alterniflorat | The distribution data of S. alterniflora in Guangxi for year, t | Formula (2) |
| Linecoastal 10 km | A 10 km buffer zone towards the sea | Formula (3) |
| MaxExtentMangrove | The maximum extent of mangrove | Formula (1) |
| MaxExtentSalt marsh | The maximum extent of salt marsh | Formula (2) |
| MaxExtentTidal flat | The maximum extent of tidal flat | Formula (3) |
| MGBTM | A global biophysical typology of mangroves data | Formula (1) |
| MGDM_USGS | Global distribution of mangroves USGS | |
| MGMCP | Global Mangrove Classification Products data | |
| MGMW | Global Mangrove Watch data | |
| MWAM | World Atlas of Mangroves data | |
| n | The number of soil depth layers | Formula (12) |
| Tidal flatt | The global tidal wetland ecosystem distribution data for year, t | Formula (3) |
| v | The ring knife volume (100 cm3) | Formula (11) |
| ρBlue | The blue band in the Sentinel–2 images | Formula (8) |
| ρGreen | The green band in the Sentinel–2 images | Formulas (5), (6) and (9) |
| ρRed | The red band in the Sentinel–2 images | Formulas (4) and (8) |
| ρNIR | The near-infrared band in the Sentinel–2 images | Formulas (4), (5) and (7)–(9) |
| ρSWIR1 | The shortwave infrared band 1 in the Sentinel–2 images | Formulas (6), (7) and (9) |
| Type | Mangrove | Salt Marsh | Tidal Flat | Other | PA |
|---|---|---|---|---|---|
| Mangrove | 277 | 1 | 0 | 0 | 0.987 |
| Salt marsh | 0 | 204 | 4 | 5 | 0.958 |
| Tidal flat | 0 | 6 | 231 | 10 | 0.935 |
| Other | 2 | 0 | 4 | 393 | 0.985 |
| UA | 0.991 | 0.976 | 0.947 | 0.958 |
| Type | Mangrove | Salt Marsh | Tidal Flat | Other | PA |
|---|---|---|---|---|---|
| Mangrove | 239 | 0 | 0 | 0 | 1 |
| Salt marsh | 1 | 230 | 4 | 2 | 0.970 |
| Tidal flat | 0 | 4 | 261 | 1 | 0.981 |
| Other | 1 | 1 | 2 | 425 | 0.991 |
| UA | 0.992 | 0.979 | 0.978 | 0.993 |
| Type | Mangrove | Salt Marsh | Tidal Flat | Other | PA |
|---|---|---|---|---|---|
| Mangrove | 237 | 2 | 1 | 0 | 0.988 |
| Salt marsh | 0 | 228 | 2 | 3 | 0.979 |
| Tidal flat | 0 | 7 | 227 | 5 | 0.950 |
| Other | 0 | 0 | 5 | 437 | |
| UA | 0.988 | 0.970 | 0.974 | 0.975 |
| Type | Mangrove | Salt Marsh | Tidal Flat | Other | PA |
|---|---|---|---|---|---|
| Mangrove | 216 | 0 | 0 | 1 | 0.991 |
| Salt marsh | 2 | 244 | 6 | 8 | 0.938 |
| Tidal flat | 0 | 10 | 219 | 3 | 0.961 |
| Other | 1 | 2 | 11 | 414 | 0.965 |
| UA | 0.986 | 0.953 | 0.928 | 0.972 |
| Type | Mangrove | Salt Marsh | Tidal Flat | Other | PA |
|---|---|---|---|---|---|
| Mangrove | 240 | 0 | 0 | 0 | 1 |
| Salt marsh | 0 | 224 | 5 | 0 | 0.961 |
| Tidal flat | 0 | 0 | 220 | 2 | 0.991 |
| Other | 0 | 0 | 2 | 444 | 0.995 |
| UA | 1 | 1 | 0.969 | 0.987 |
| BD | MC | pH | EC | SOC | SOCS | EOC | POC | DOC | |
|---|---|---|---|---|---|---|---|---|---|
| BD | 1 | ||||||||
| MC | −0.990 ** | 1 | |||||||
| pH | −0.726 * | 0.816 ** | 1 | ||||||
| EC | 0.246 | −0.107 | 0.488 | 1 | |||||
| SOC | 0.399 | −0.265 | 0.342 | 0.987 ** | 1 | ||||
| SOCS | 0.577 * | −0.456 | 0.143 | 0.934 ** | 0.979 ** | 1 | |||
| EOC | 0.016 | 0.126 | 0.676 * | 0.973 ** | 0.923 ** | 0.826 ** | 1 | ||
| POC | 0.547 * | −0.424 | 0.178 | 0.946 ** | 0.986 ** | 0.999 ** | 0.845 ** | 1 | |
| DOC | 0.958 ** | −0.989 ** | −0.893 ** | −0.043 | 0.118 | 0.318 | −0.272 | 0.284 | 1 |
| BD | MC | pH | EC | SOC | SOCS | EOC | POC | DOC | |
|---|---|---|---|---|---|---|---|---|---|
| BD | 1 | ||||||||
| MC | −0.808 ** | 1 | |||||||
| pH | −0.104 | −0.502 * | 1 | ||||||
| EC | −0.570 * | 0.945 ** | −0.757 * | 1 | |||||
| SOC | −0.591 * | 0.953 ** | −0.740 * | 1.000 ** | 1 | ||||
| SOCS | −0.596 * | 0.955 ** | −0.736 * | 1.000 ** | 1.000 ** | 1 | |||
| EOC | −0.176 | 0.722 * | −0.961 ** | 0.909 ** | 0.898 ** | 0.895 ** | 1 | ||
| POC | −0.667 * | 0.978 ** | −0.672 * | 0.992 ** | 0.995 ** | 0.996 ** | 0.851 ** | 1 | |
| DOC | −0.999 ** | 0.839 ** | 0.050 * | 0.614 * | 0.635 * | 0.639 * | 0.229 | 0.706 * | 1 |
| BD | MC | pH | EC | SOC | SOCS | EOC | POC | DOC | |
|---|---|---|---|---|---|---|---|---|---|
| BD | 1 | ||||||||
| MC | −0.959 ** | 1 | |||||||
| pH | 0.672 * | −0.435 | 1 | ||||||
| EC | −0.377 | 0.623 * | 0.433 | 1 | |||||
| SOC | 0.965 ** | −1.000 ** | 0.455 | −0.606 * | 1 | ||||
| SOCS | 0.947 ** | −0.999 ** | 0.400 | −0.653 * | 0.998 ** | 1 | |||
| EOC | 0.867 ** | −0.691 * | 0.952 ** | 0.135 | 0.707 * | 0.662 * | 1 | ||
| POC | 0.934 ** | −0.795 * | 0.892 ** | −0.021 | 0.808 ** | 0.771 * | 0.988 ** | 1 | |
| DOC | 0.929 ** | −0.786 * | 0.899 ** | −0.006 | 0.799 * | 0.761 * | 0.990 ** | 1.000 ** | 1 |
References
- Luo, Y.; Li, Y.; Zhang, H. Soil and Environment in Yellow River Delta, 1st ed.; Science Press: Beijing, China, 2017; p. 5. [Google Scholar]
- Guo, J.; Ma, Y.; Ding, C.; Zhao, H.; Cheng, Z.; Yan, G.; You, Z. Impacts of Tidal Oscillations on Coastal Groundwater System in Reclaimed Land. J. Mar. Sci. Eng. 2023, 11, 2019. [Google Scholar] [CrossRef]
- Wang, X.; Zhang, H.; Han, G. Carbon Cycle and “Blue Carbon” Potential in China’s Coastal Zone. Bull. Chin. Acad. Sci. 2016, 31, 1218–1225. [Google Scholar] [CrossRef]
- Wang, R.; Zhang, M.; Wu, H.; Li, Y. Analysis on Wetland Definition and Classification of the Wetland Conservation Law of the People’s Republic of China. Wetl. Sci. 2022, 20, 404–412. [Google Scholar] [CrossRef]
- UNEP-WCMC; UNEP; IUCN. Protected Planet Report 2020; United Nations Environment Programme: Nairobi, Kenya, 2021.
- Ma, K.; Zhang, Y.; Tang, S.; Liu, J. Spatial Distribution of Soil Organic Carbon in the Zoige Alpine Wetland, Northeastern Qinghai–Tibet Plateau. Catena 2016, 144, 102–108. [Google Scholar] [CrossRef]
- Lehner, B.; Döll, P. Development and Validation of a Global Database of Lakes, Reservoirs and Wetlands. J. Hydrol. 2004, 296, 1–22. [Google Scholar] [CrossRef]
- Erwin, K.L. Wetlands and Global Climate Change: The Role of Wetland Restoration in a Changing World. Wetl. Ecol. Manag. 2009, 17, 71–84. [Google Scholar] [CrossRef]
- Lehmann, J. A Handful of Carbon. Nature 2007, 447, 143–144. [Google Scholar] [CrossRef]
- Kirwan, M.L.; Blum, L.K. Enhanced Decomposition Offsets Enhanced Productivity and Soil Carbon Accumulation in Coastal Wetlands Responding to Climate Change. Biogeosciences 2011, 8, 987–993. [Google Scholar] [CrossRef]
- Cao, Q.; Wang, R.; Zhang, H.; Ge, X.; Liu, J. Distribution of Organic Carbon in the Sediments of Xinxue River and the Xinxue River Constructed Wetland, China. PLoS ONE 2015, 10, e0134713. [Google Scholar] [CrossRef]
- Lehmann, J.; Kleber, M. The Contentious Nature of Soil Organic Matter. Nature 2015, 528, 60–68. [Google Scholar] [CrossRef]
- Luo, Z.; Feng, W.; Luo, Y.; Baldock, J.; Wang, E. Soil Organic Carbon Dynamics Jointly Controlled by Climate, Carbon Inputs, Soil Properties and Soil Carbon Fractions. Glob. Chang. Biol. 2017, 23, 4430–4439. [Google Scholar] [CrossRef]
- Zhao, H.; Jia, J.; Zhao, Q.; Wang, J.; Gao, Y.; Huang, Y.; Chen, G. Soil Organic Carbon Stabilization and Associated Mineral Protection in Typical Coastal Wetlands under Different Hydrologic Conditions. Front. Mar. Sci. 2022, 9, 1031561. [Google Scholar] [CrossRef]
- Averill, C.; Turner, B.L.; Finzi, A.C. Mycorrhiza-Mediated Competition between Plants and Decomposers Drives Soil Carbon Storage. Nature 2014, 505, 543–545. [Google Scholar] [CrossRef]
- Jobbágy, E.G.; Jackson, R.B. The Vertical Distribution of Soil Organic Carbon and its Relation to Climate and Vegetation. Ecol. Appl. 2000, 10, 423–436. [Google Scholar] [CrossRef]
- Lal, R. Soil Carbon Sequestration Impacts on Global Climate Change and Food Security. Science 2004, 304, 1623–1627. [Google Scholar] [CrossRef]
- Ji, H.; Han, J.; Xue, J.; Hatten, J.A.; Wang, M.; Guo, Y.; Li, P. Soil Organic Carbon Pool and Chemical Composition under Different Types of Land Use in Wetland: Implication for Carbon Sequestration in Wetlands. Sci. Total Environ. 2020, 716, 136996. [Google Scholar] [CrossRef]
- Vaughn, D.R.; Bianchi, T.S.; Shields, M.R.; Kenney, W.F.; Osborne, T.Z. Increased Organic Carbon Burial in Northern Florida Mangrove-Salt Marsh Transition Zones. Glob. Biogeochem. Cycles 2020, 34, e2019GB006334. [Google Scholar] [CrossRef]
- Weiss, C.; Weiss, J.; Boy, J.; Iskandar, I.; Mikutta, R.; Guggenberger, G. Soil Organic Carbon Stocks in Estuarine and Marine Mangrove Ecosystems Are Driven by Nutrient Colimitation of P and N. Ecol. Evol. 2016, 6, 5043–5056. [Google Scholar] [CrossRef]
- De Jong Cleyndert, G.; Cuni-Sanchez, A.; Seki, H.A.; Shirima, D.D.; Munishi, P.K.T.; Burgess, N.; Calders, K.; Marchant, R. The Effects of Seaward Distance on above and below Ground Carbon Stocks in Estuarine Mangrove Ecosystems. Carbon Balance Manag. 2020, 15, 27. [Google Scholar] [CrossRef]
- Kauffman, J.B.; Heider, C.; Cole, T.G.; Dwire, K.A.; Donato, D.C. Ecosystem Carbon Stocks of Micronesian Mangrove Forests. Wetlands 2011, 31, 343–352. [Google Scholar] [CrossRef]
- Donato, D.C.; Kauffman, J.B.; Murdiyarso, D.; Kurnianto, S.; Stidham, M.; Kanninen, M. Mangroves among the Most Carbon-Rich Forests in the Tropics. Nat. Geosci. 2011, 4, 293–297. [Google Scholar] [CrossRef]
- Kida, M.; Tomotsune, M.; Iimura, Y.; Kinjo, K.; Ohtsuka, T.; Fujitake, N. High Salinity Leads to Accumulation of Soil Organic Carbon in Mangrove Soil. Chemosphere 2017, 177, 51–55. [Google Scholar] [CrossRef]
- Sun, H.; Jiang, J.; Cui, L.; Feng, W.; Wang, Y.; Zhang, J. Soil Organic Carbon Stabilization Mechanisms in a Subtropical Mangrove and Salt Marsh Ecosystems. Sci. Total Environ. 2019, 673, 502–510. [Google Scholar] [CrossRef]
- Wang, F.; Guo, R.; Zhang, N.; Yang, S.; Cao, W. Soil Organic Carbon Storages and Bacterial Communities along a Restored Mangrove Soil Chronosequence in the Jiulong River Estuary: From Tidal Flats to Mangrove Afforestation. Fundam. Res. 2023, 3, 880–889. [Google Scholar] [CrossRef]
- Eid, E.M.; Arshad, M.; Shaltout, K.H.; El-Sheikh, M.A.; Alfarhan, A.H.; Picó, Y.; Barcelo, D. Effect of the Conversion of Mangroves into Shrimp Farms on Carbon Stock in the Sediment along the Southern Red Sea Coast, Saudi Arabia. Environ. Res. 2019, 176, 108536. [Google Scholar] [CrossRef]
- Wang, Q.; Wen, Y.; Zhao, B.; Hong, H.; Liao, R.; Li, J.; Liu, J.; Lu, H.; Yan, C. Coastal Soil Texture Controls Soil Organic Carbon Distribution and Storage of Mangroves in China. Catena 2021, 207, 105709. [Google Scholar] [CrossRef]
- Zhu, Z.; Wang, S.; Woodcock, C.E. Improvement and Expansion of the Fmask Algorithm: Cloud, Cloud Shadow, and Snow Detection for Landsats 4–7, 8, and Sentinel 2 Images. Remote Sens. Environ. 2015, 159, 269–277. [Google Scholar] [CrossRef]
- Takaku, J.; Tadono, T.; Tsutsui, K. Generation of High Resolution Global DSM from ALOS PRISM. Int. Arch. Photogramm. Remote Sens. Spat. Inf. Sci. 2014, 40, 243–248. [Google Scholar] [CrossRef]
- Tadono, T.; Ishida, H.; Oda, F.; Naito, S.; Minakawa, K.; Iwamoto, H. Precise Global DEM Generation by ALOS PRISM. ISPRS Ann. Photogramm. Remote Sens. Spatial Inf. Sci. 2014, 2, 71–76. [Google Scholar] [CrossRef]
- Tadono, T.; Nagai, H.; Ishida, H.; Oda, F.; Naito, S.; Minakawa, K.; Iwamoto, H. Generation of the 30 m-mesh Global Digital Surface Model by ALOS PRISM. Int. Arch. Photogramm. Remote Sens. Spatial Inf. Sci. 2016, 41, 157–162. [Google Scholar] [CrossRef]
- Murray, N.J.; Worthington, T.A.; Bunting, P.; Duce, S.; Hagger, V.; Lovelock, C.E.; Lucas, R.; Saunders, M.I.; Sheaves, M.; Spalding, M.; et al. High-Resolution Mapping of Losses and Gains of Earth’s Tidal Wetlands. Science 2022, 376, 744–749. [Google Scholar] [CrossRef]
- Bunting, P.; Rosenqvist, A.; Hilarides, L.; Lucas, R.M.; Thomas, N.; Tadono, T.; Worthington, T.A.; Spalding, M.; Murray, N.J.; Rebelo, L.-M. Global Mangrove Extent Change 1996–2020: Global Mangrove Watch Version 3.0. Remote Sens. 2022, 14, 3657. [Google Scholar] [CrossRef]
- Zhang, X.; Liu, L.; Chen, X.; Gao, Y.; Xie, S.; Mi, J. GLC_FCS30: Global Land-Cover Product with Fine Classification System at 30 m Using Time-Series Landsat Imagery. Earth Syst. Sci. Data 2021, 13, 2753–2776. [Google Scholar] [CrossRef]
- Chen, J.; Chen, J.; Liao, A.; Cao, X.; Chen, L.; Chen, X.; He, C.; Han, G.; Peng, S.; Lu, M.; et al. Global Land Cover Mapping at 30m Resolution: A POK-Based Operational Approach. ISPRS J. Photogramm. Remote Sens. 2015, 103, 7–27. [Google Scholar] [CrossRef]
- Spalding, M. World Atlas of Mangroves; Routledge, A Collaborative Project of ITTO, ISME, FAO, UNEP-WCMC, UNESCO-MAB, UNU-INWEH and TNC; Earthscan: London, UK, 2010. [Google Scholar] [CrossRef]
- Worthington, T.A.; Zu Ermgassen, P.S.E.; Friess, D.A.; Krauss, K.W.; Lovelock, C.E.; Thorley, J.; Tingey, R.; Woodroffe, C.D.; Bunting, P.; Cormier, N.; et al. A Global Biophysical Typology of Mangroves and Its Relevance for Ecosystem Structure and Deforestation. Sci. Rep. 2020, 10, 14652. [Google Scholar] [CrossRef]
- Xiao, H.; Su, F.; Fu, D.; Yu, H.; Ju, C.; Pan, T.; Kang, L. 10-m Global Mangrove Classification Products of 2018-2020 Based on Big Data. V1. Sci. Data Bank 2021. [Google Scholar] [CrossRef]
- Giri, C.; Ochieng, E.; Tieszen, L.L.; Zhu, Z.; Singh, A.; Loveland, T.; Masek, J.; Duke, N. Status and Distribution of Mangrove Forests of the World Using Earth Observation Satellite Data. Glob. Ecol. Biogeogr. 2011, 20, 154–159. [Google Scholar] [CrossRef]
- Mao, D.; Wang, Z.; Du, B.; Li, L.; Tian, Y.; Jia, M.; Zeng, Y.; Song, K.; Jiang, M.; Wang, Y. National Wetland Mapping in China: A New Product Resulting from Object-Based and Hierarchical Classification of Landsat 8 OLI Images. ISPRS J. Photogramm. Remote Sens. 2020, 164, 11–25. [Google Scholar] [CrossRef]
- Mao, D.; Liu, M.; Wang, Z.; Li, L.; Man, W.; Jia, M.; Zhang, Y. Rapid Invasion of Spartina Alterniflora in the Coastal Zone of Mainland China: Spatiotemporal Patterns and Human Prevention. Sensors 2019, 19, 2308. [Google Scholar] [CrossRef]
- Liu, M.; Mao, D.; Wang, Z.; Li, L.; Man, W.; Jia, M.; Ren, C.; Zhang, Y. Rapid Invasion of Spartina Alterniflora in the Coastal Zone of Mainland China: New Observations from Landsat OLI Images. Remote Sens. 2018, 10, 1933. [Google Scholar] [CrossRef]
- Huang, Y. Remote Sensing Monitoring and Driving Factors of Spartina Alterniflora Invasion in Guangxi Coastal Zone. Master’s Thesis, Guangxi University, Nanning, China, 2022. [Google Scholar]
- Lu, Y.; Dai, L.; Yan, G.; Huo, Z.; Chen, W.; Lan, J.; Zhang, C.; Xu, Q.; Deng, S.; Chen, J. Effects of Various Land Utilization Types on Groundwater at Different Temporal Scales: A Case Study of Huocheng Plain, Xinjiang, China. Front. Environ. Sci. 2023, 11, 1225916. [Google Scholar] [CrossRef]
- Tucker, C.J. Red and Photographic Infrared Linear Combinations for Monitoring Vegetation. Remote Sens. Environ. 1979, 8, 127–150. [Google Scholar] [CrossRef]
- Xu, H. Modification of Normalised Difference Water Index (NDWI) to Enhance Open Water Features in Remotely Sensed Imagery. Int. J. Remote Sens. 2006, 27, 3025–3033. [Google Scholar] [CrossRef]
- Gao, B. NDWI—A Normalized Difference Water Index for Remote Sensing of Vegetation Liquid Water from Space. Remote Sens. Environ. 1996, 58, 257–266. [Google Scholar] [CrossRef]
- Zhang, X.; Liu, L.; Zhao, T.; Chen, X.; Lin, S.; Wang, J.; Mi, J.; Liu, W. GWL_FCS30: A Global 30 m Wetland Map with a Fine Classification System Using Multi-Sourced and Time-Series Remote Sensing Imagery in 2020. Earth Syst. Sci. Data 2023, 15, 265–293. [Google Scholar] [CrossRef]
- Baloloy, A.B.; Blanco, A.C.; Ana, R.R.C.S.; Nadaoka, K. Development and Application of a New Mangrove Vegetation Index (MVI) for Rapid and Accurate Mangrove Mapping. ISPRS J. Photogramm. Remote Sens. 2020, 166, 95–117. [Google Scholar] [CrossRef]
- Zhang, Z.; Xu, N.; Li, Y.; Li, Y. Sub-Continental-Scale Mapping of Tidal Wetland Composition for East Asia: A Novel Algorithm Integrating Satellite Tide-Level and Phenological Features. Remote Sens. Environ. 2022, 269, 112799. [Google Scholar] [CrossRef]
- Ludwig, C.; Walli, A.; Schleicher, C.; Weichselbaum, J.; Riffler, M. A Highly Automated Algorithm for Wetland Detection Using Multi-Temporal Optical Satellite Data. Remote Sens. Environ. 2019, 224, 333–351. [Google Scholar] [CrossRef]
- Li, Z.; Chen, H.; White, J.C.; Wulder, M.A.; Hermosilla, T. Discriminating Treed and Non-Treed Wetlands in Boreal Ecosystems Using Time Series Sentinel-1 Data. Int. J. Appl. Earth Obs. Geoinf. 2020, 85, 102007. [Google Scholar] [CrossRef]
- Zhang, X.; Liu, L.; Chen, X.; Gao, Y.; Jiang, M. Automatically Monitoring Impervious Surfaces Using Spectral Generalization and Time Series Landsat Imagery from 1985 to 2020 in the Yangtze River Delta. J. Remote Sens. 2021, 2021, 9873816. [Google Scholar] [CrossRef]
- Hansen, M.C.; Egorov, A.; Potapov, P.V.; Stehman, S.V.; Tyukavina, A.; Turubanova, S.A.; Roy, D.P.; Goetz, S.J.; Loveland, T.R.; Ju, J.; et al. Monitoring Conterminous United States (CONUS) Land Cover Change with Web-Enabled Landsat Data (WELD). Remote Sens. Environ. 2014, 140, 466–484. [Google Scholar] [CrossRef]
- Zhang, H.K.; Roy, D.P. Using the 500 m MODIS Land Cover Product to Derive a Consistent Continental Scale 30 m Landsat Land Cover Classification. Remote Sens. Environ. 2017, 197, 15–34. [Google Scholar] [CrossRef]
- Azzari, G.; Lobell, D.B. Landsat-Based Classification in the Cloud: An Opportunity for a Paradigm Shift in Land Cover Monitoring. Remote Sens. Environ. 2017, 202, 64–74. [Google Scholar] [CrossRef]
- Ng, W.-T.; Rima, P.; Einzmann, K.; Immitzer, M.; Atzberger, C.; Eckert, S. Assessing the Potential of Sentinel-2 and Pléiades Data for the Detection of Prosopis and Vachellia Spp. in Kenya. Remote Sens. 2017, 9, 74. [Google Scholar] [CrossRef]
- Bunting, P.; Rosenqvist, A.; Hilarides, L.; Lucas, R.M.; Thomas, N. Global Mangrove Watch: Updated 2010 Mangrove Forest Extent (v2.5). Remote Sens. 2022, 14, 1034. [Google Scholar] [CrossRef]
- Zhang, J. Study on Vegetation Succession and Soil Organic Carbon Distribution in Yancheng Coastal Wetland. Master’s Thesis, Nanjing Normal University, Nanjing, China, 2019. [Google Scholar]
- Arunrat, N.; Sansupa, C.; Kongsurakan, P.; Sereenonchai, S.; Hatano, R. Soil Microbial Diversity and Community Composition in Rice–Fish Co-Culture and Rice Monoculture Farming System. Biology 2022, 11, 1242. [Google Scholar] [CrossRef] [PubMed]
- Chu, M.; Xiao, X.; Ding, Y.; Zhao, M. Sediment Organic Matter and Carbon Stock Associated with a Mangrove Reserve in Danzhou Bay, Hainan, China. Mar. Sci. 2021, 45, 22–31. [Google Scholar]
- Xiao, Y.; Huang, Z.; Wu, H.; Lu, X. Compositions and Contents of Active Organic Carbon in Different Wetland Soils in Sanjiang Plain, Northeast China. Acta Ecol. Sin. 2015, 35, 7625–7633. [Google Scholar] [CrossRef]
- Arunrat, N.; Sansupa, C.; Sereenonchai, S.; Hatano, R. Short-Term Response of Soil Bacterial and Fungal Communities to Fire in Rotational Shifting Cultivation, Northern Thailand. Appl. Soil Ecol. 2024, 196, 105303. [Google Scholar] [CrossRef]
- Xu, W.; Qiao, M. Soil Carbon Contents in Relation to Soil Physicochemical Properties in Arid Regions of China. J. Desert Res. 2014, 34, 1558–1561. [Google Scholar] [CrossRef]
- Zhou, C.; Ma, H. Distribution of Labile Orhanic Carbon in Soil as Affected by Vegetation Typical of Sygera Mountains, Tibet, China. Acta Pedol. Sin. 2013, 50, 1246–1251. [Google Scholar] [CrossRef]



| Year | Imaging Time Range | The Number of Available Images (Scenes) |
|---|---|---|
| 2019 | 1 January 2019–31 December 2019 | 412 |
| 2020 | 1 January 2020–31 December 2020 | 451 |
| 2021 | 1 January 2021–31 December 2021 | 490 |
| 2022 | 1 January 2022–31 December 2022 | 363 |
| 2023 | 1 January 2023–31 December 2023 | 381 |
| Band Name | Wavelength (nm) | Spatial Resolution (m) |
|---|---|---|
| Blue | 496.6 | 10 |
| Green | 560 | 10 |
| Red | 664.5 | 10 |
| NIR | 835.1 | 10 |
| SWIR1 | 1613.7 | 20 |
| SWIR2 | 2202.4 | 20 |
| Type | Features | Description | Number | Source |
|---|---|---|---|---|
| Spectrum | Blue, Green, Red, NIR, SWIR1, SWIR2, Blue_NDVIMax, Green_NDVIMax, Red _NDVIMax, NIR _NDVIMax, SWIR1_NDVIMax, SWIR2_NDVIMax, Blue_NDWIMax, Green_NDWIMax, Red _NDWIMax, NIR _NDWIMax, SWIR1_NDWIMax, SWIR2_NDWIMax | The 15th, 30th, 50th, 70th, and 85th percentile values for the 6 base bands of all images available during the study period, as well as the maximum NDVI and the maximum NDWI | 42 | Sentinel–2 |
| Spectral Indices | NDVI, NDWI, mNDWI, LSWI, EVI, MVI, NDWI _NDVIMax, mNDWI _NDVIMax, LSWI _NDVIMax, EVI _NDVIMax, MVI _NDVIMax, NDVI _NDWIMax, mNDWI _NDWIMax, LSWI _NDWIMax, EVI _NDWIMax, MWI _NDVIMax | The 15th, 30th, 50th, 70th, and 85th percentiles of the 6 spectral indices for all images available during the study period, as well as the maximum NDVI and the maximum NDWI | 40 | Sentinel–2 |
| Temporal statistics | NDVI_StdDev, NDWI_StdDev, mNDWI_StdDev, LSWI_StdDev, EVI_StdDev, MVI_StdDev | Standard deviation of NDVI, NDWI, mNDWI, LSWI, EVI and MVI | 6 | Sentinel–2 |
| Topography | Elevation, slope and aspect | Slope and aspect calculated from the AW3D_30 data | 3 | AW3D_30 |
| Location | Longitude and latitude | Longitude and latitude for each pixel | 2 | N/A |
| Monitoring Program | Analytical Method | Instrument | According to the Standard |
|---|---|---|---|
| pH | Potentiometry | pH–meter | HJ962–2018 |
| MC | Gravimetric method | – | GB17378.5–2007 |
| BD | Cutting-ring method | Cutting ring | NY/T1121.4–2006 |
| EC | Conductivity meter method | Conductivity meter | F–HZ–DZ–DXS–0006 |
| Year | 2019 | 2020 | 2021 | 2022 | 2023 |
|---|---|---|---|---|---|
| Overall accuracy (%) | 96.88 | 98.63 | 97.66 | 96.31 | 98.86 |
| Kappa | 0.95 | 0.98 | 0.97 | 0.95 | 0.98 |
| Mangrove (ha) | Salt Marsh (ha) | Tidal Flat (ha) | Total (ha) | |
|---|---|---|---|---|
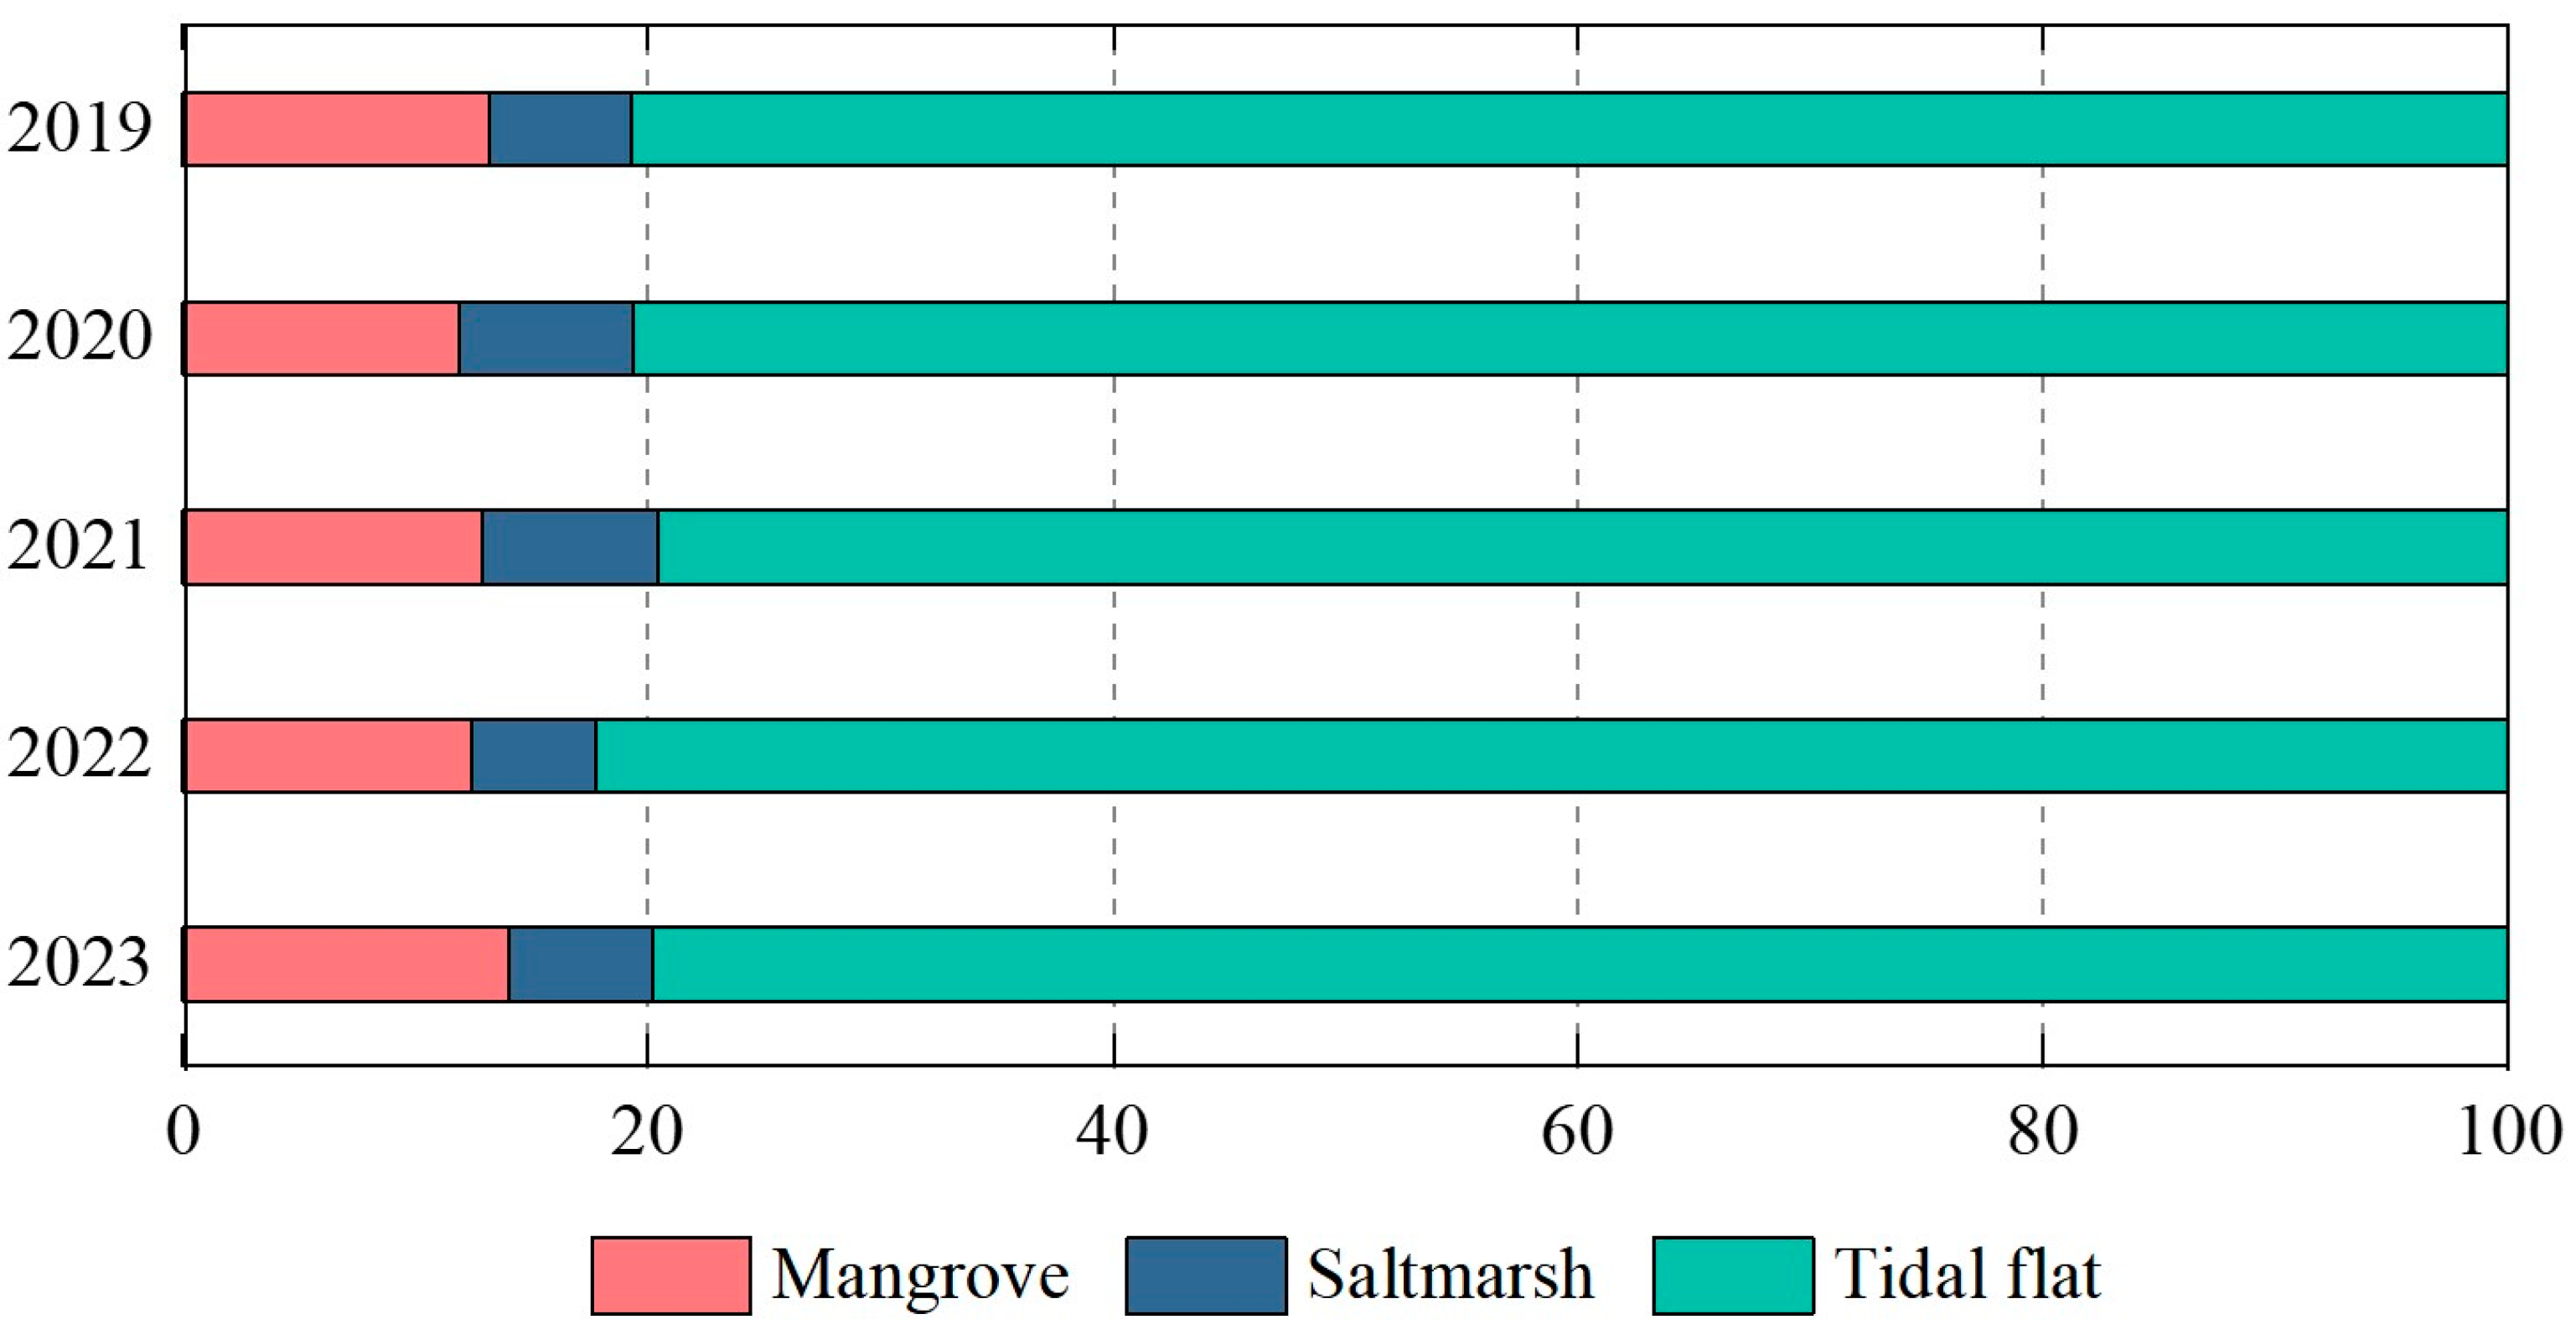
| 2019 | 7274.41 | 3414.55 | 44,633.90 | 55,322.86 |
| 2020 | 6932.94 | 4429.53 | 47,232.70 | 58,595.17 |
| 2021 | 7322.94 | 4320.15 | 45,284.10 | 56,927.19 |
| 2022 | 7505.67 | 3234.21 | 49,829.60 | 60,569.48 |
| 2023 | 7558.60 | 3301.55 | 42,920.70 | 53,780.85 |
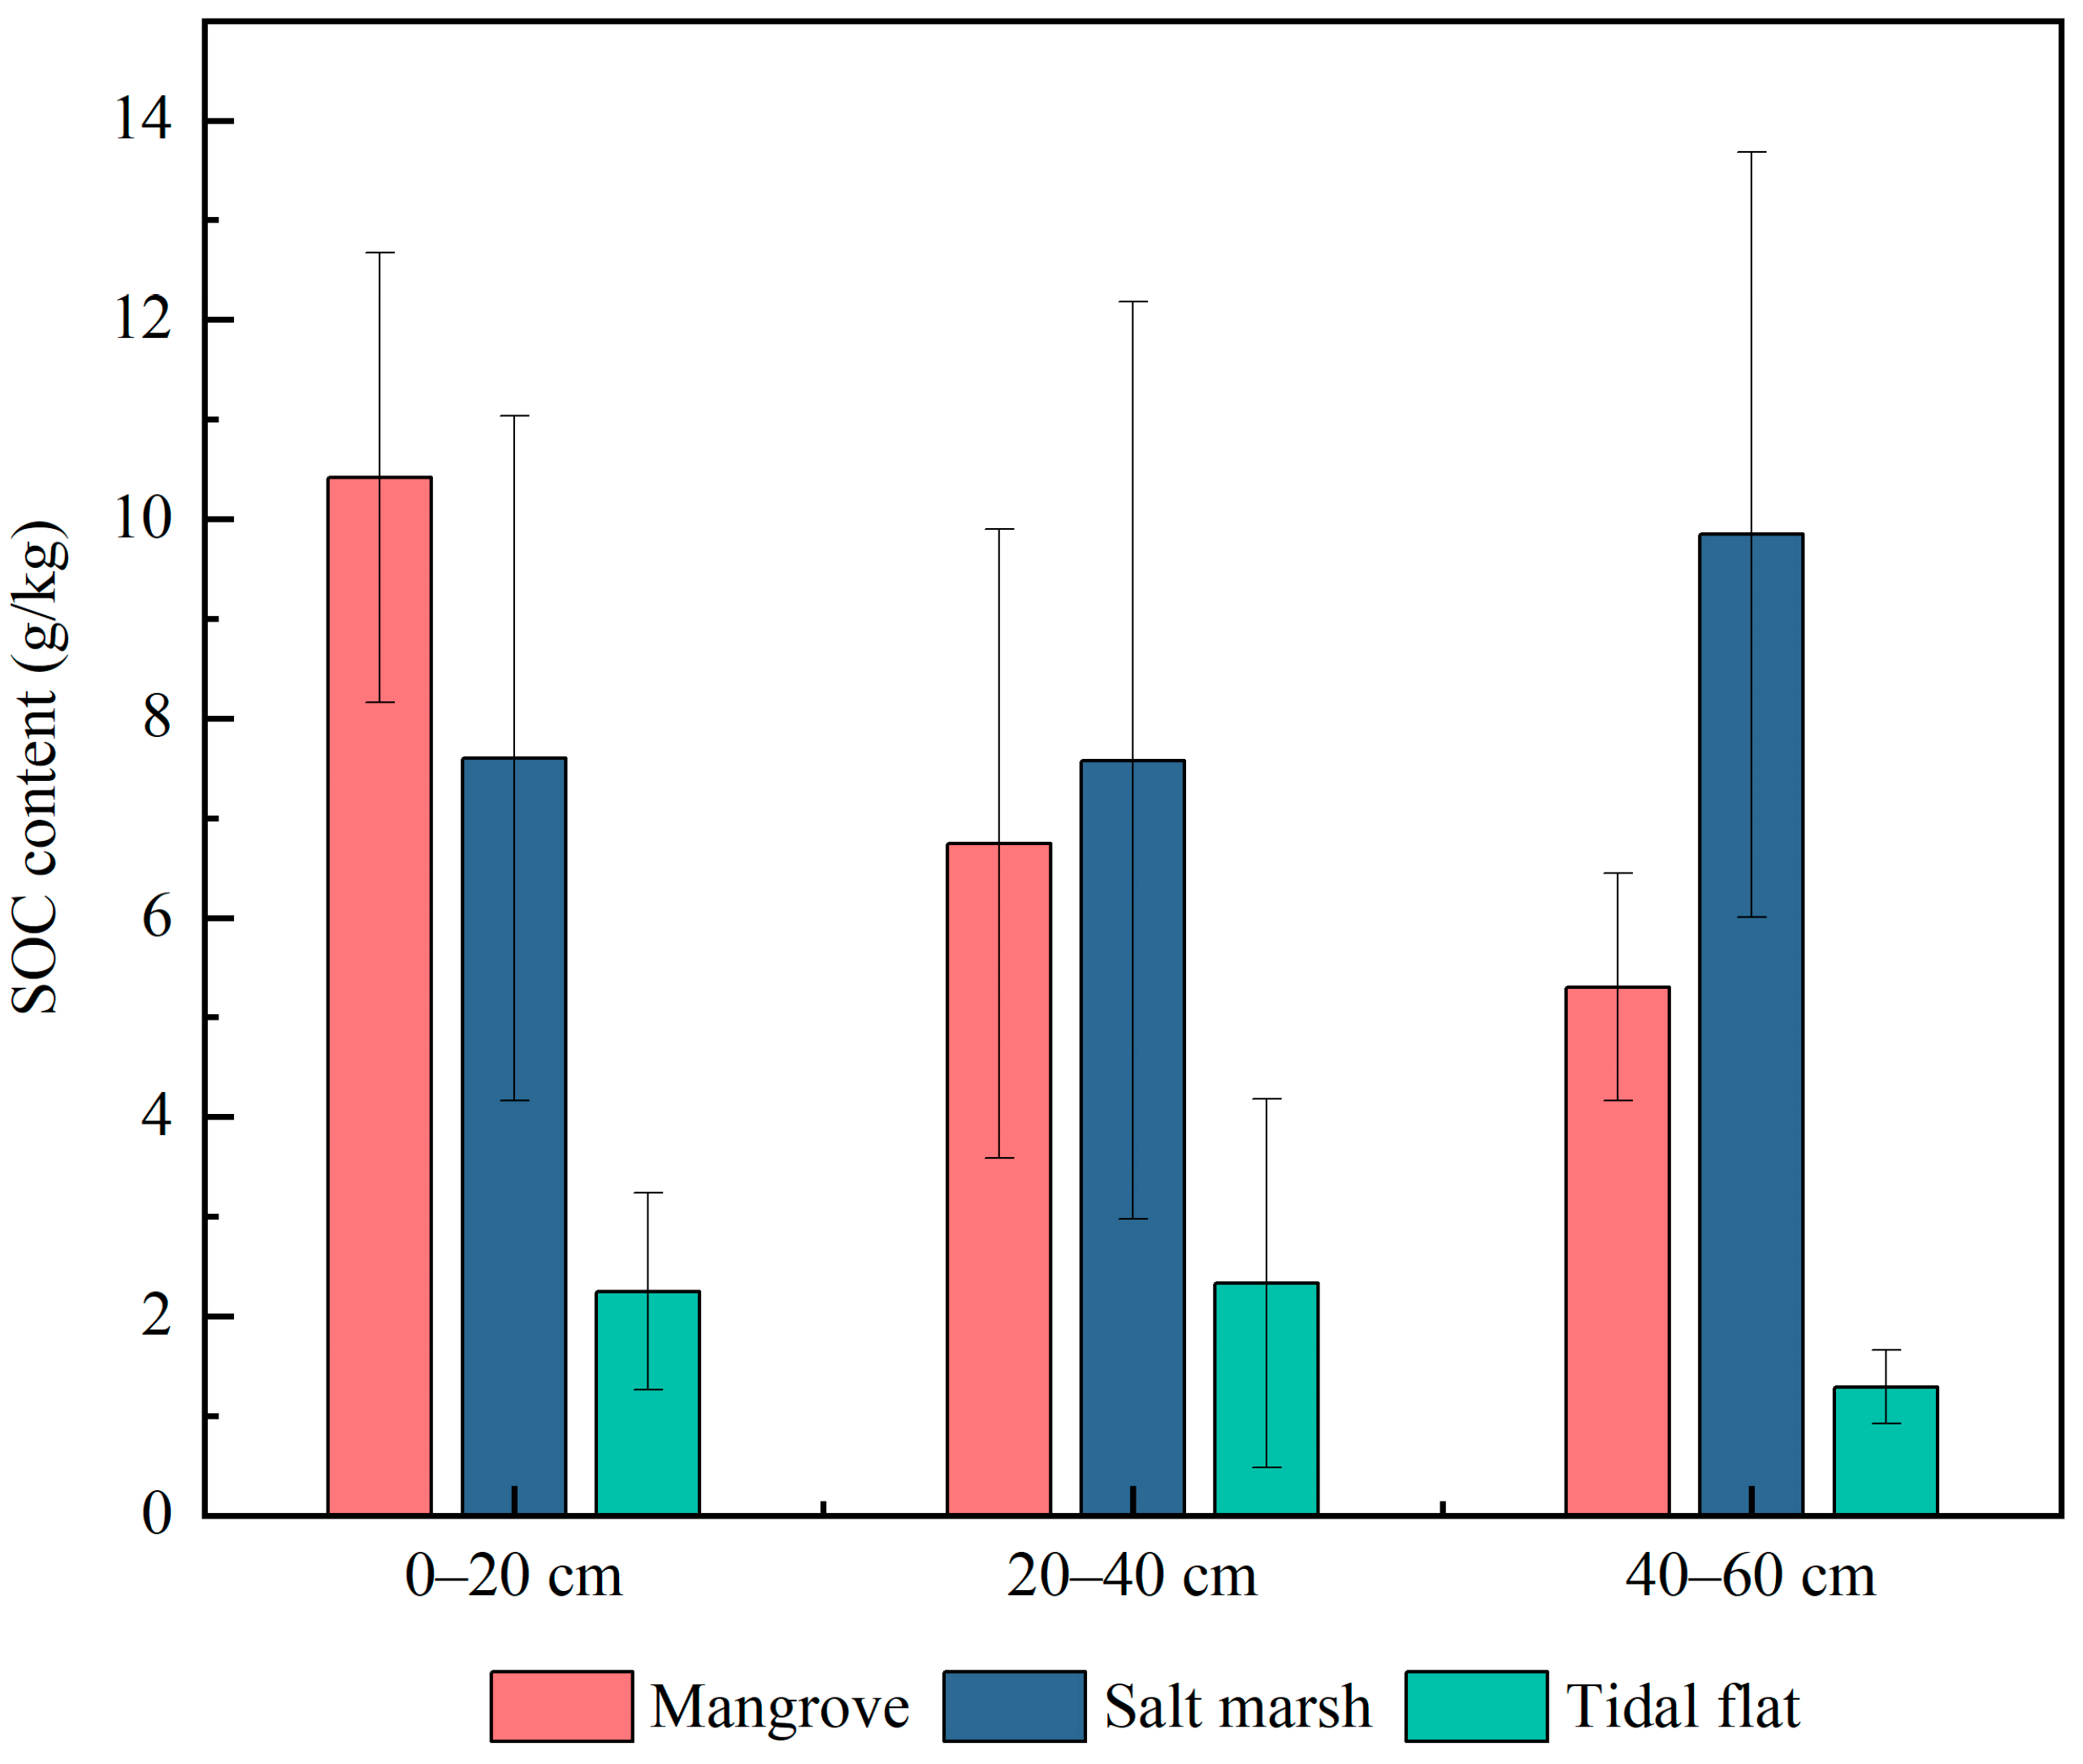
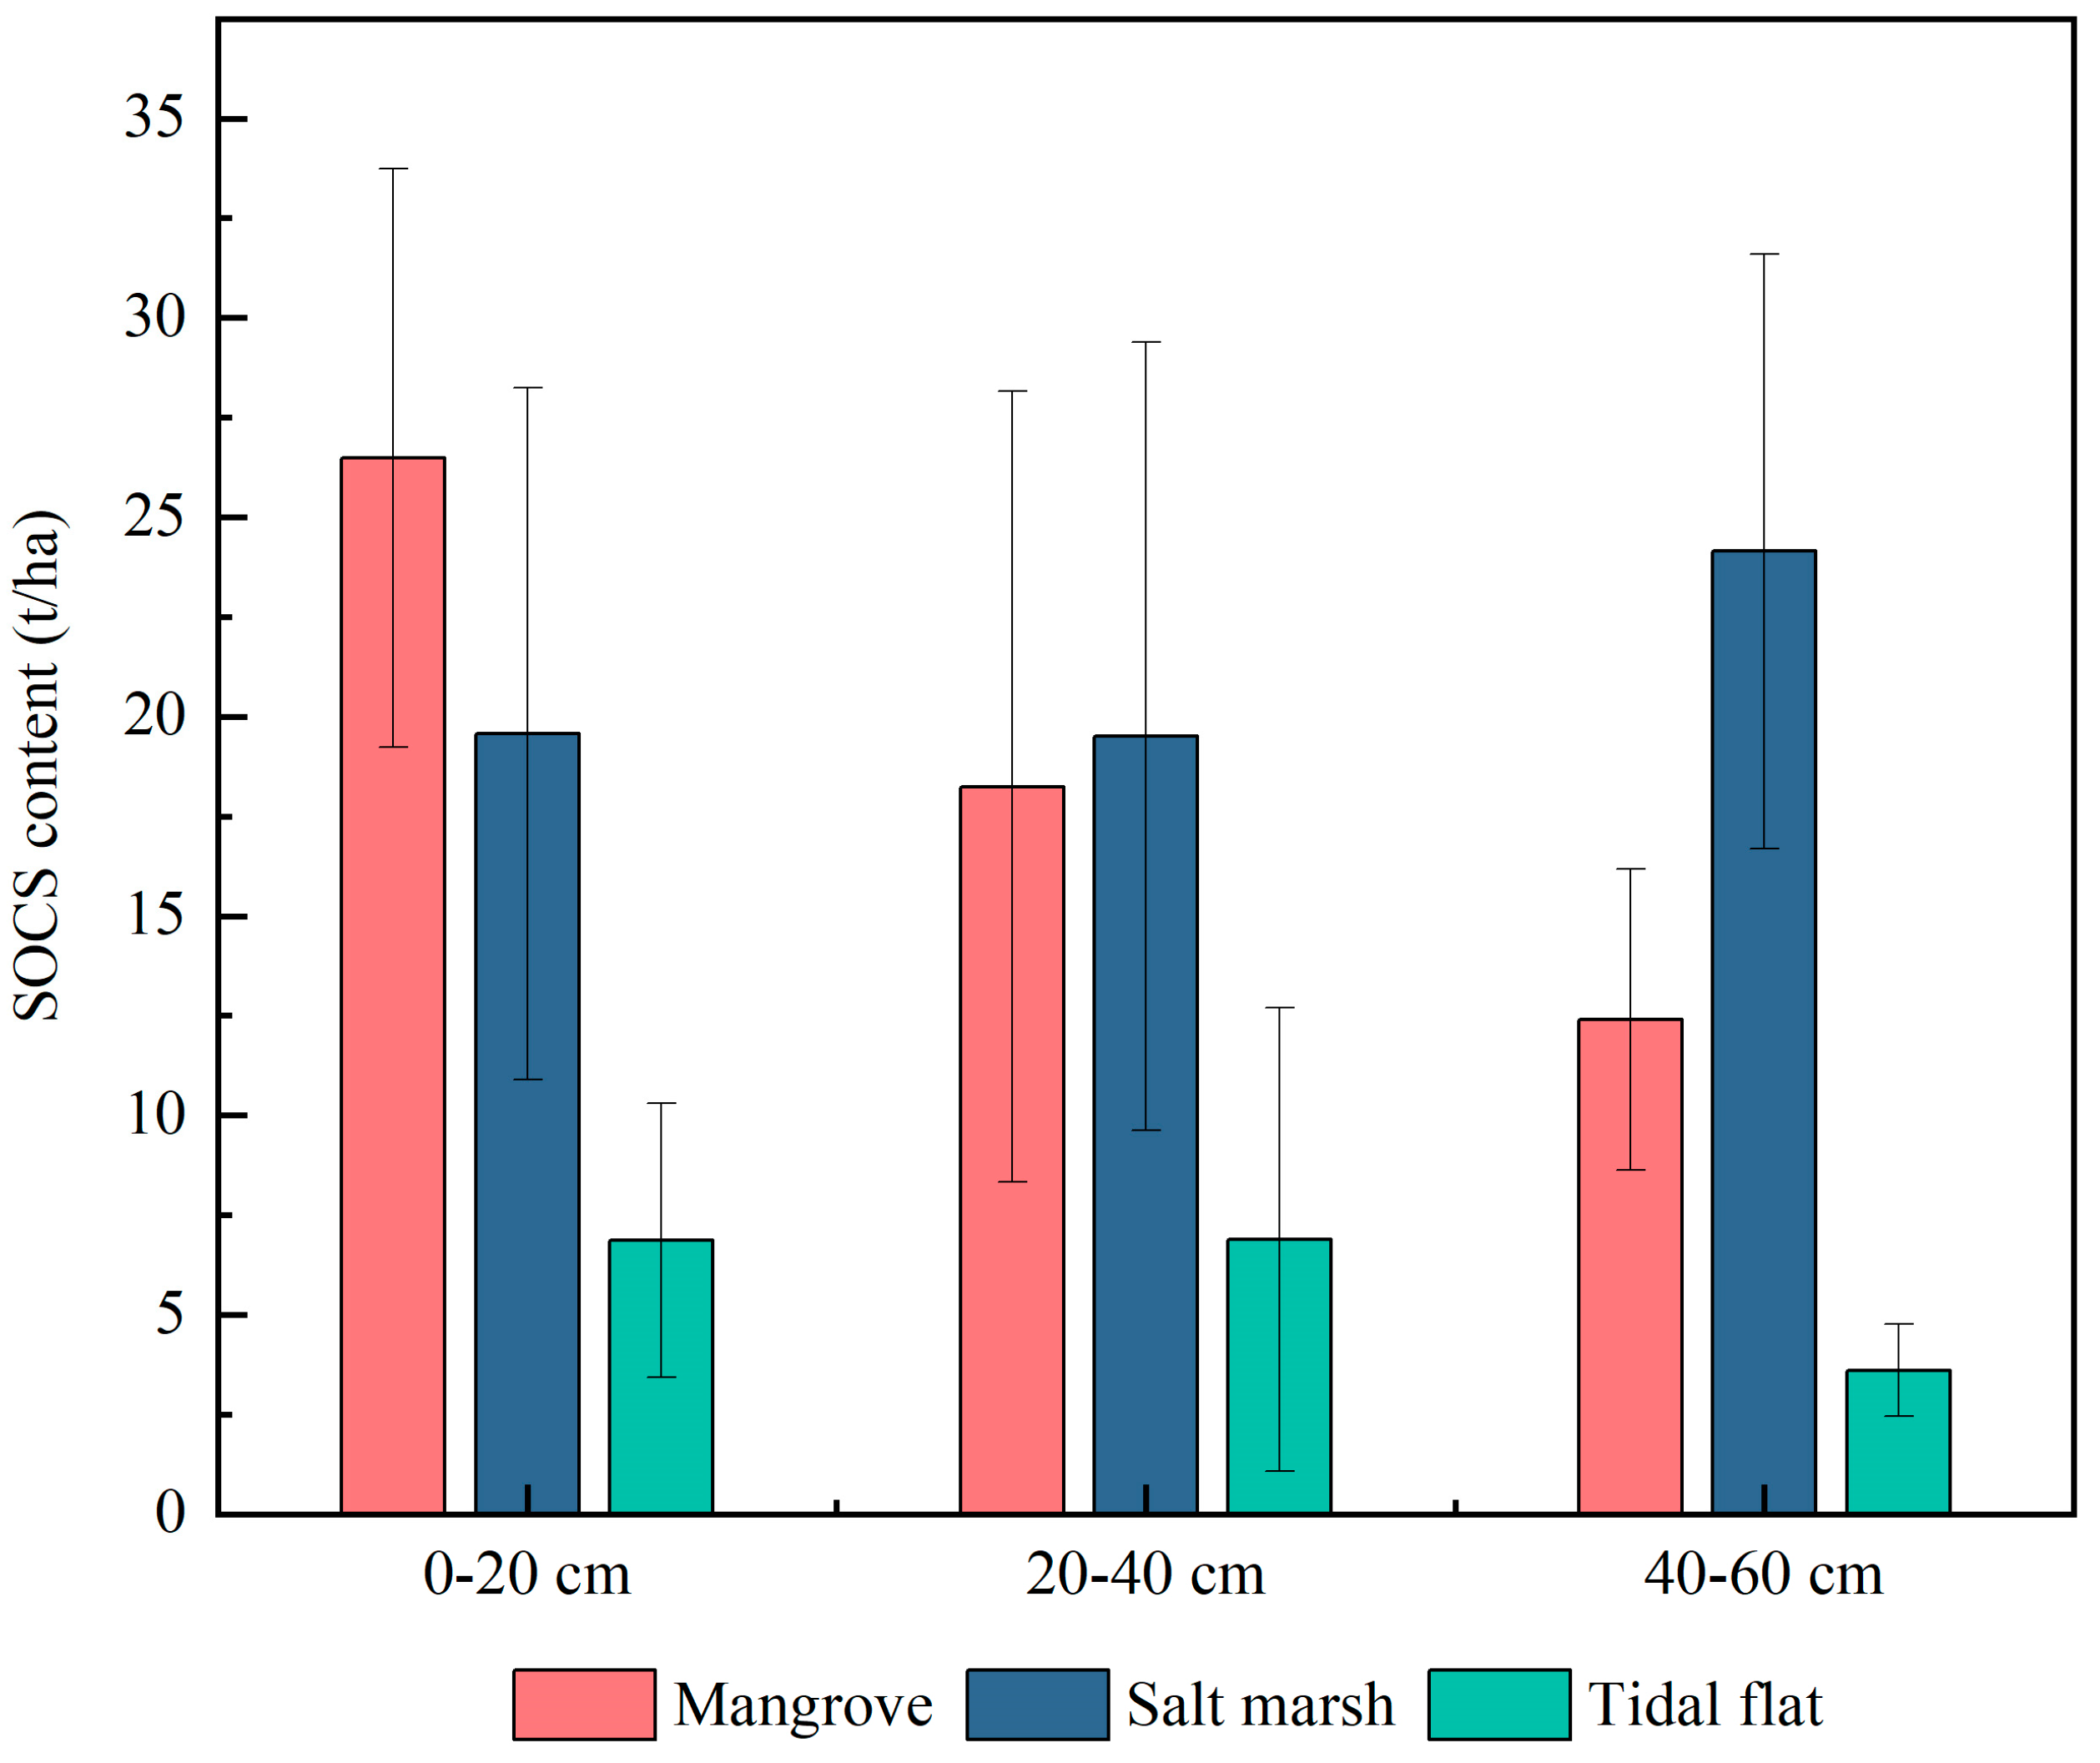
| Type | Sediment Depth (cm) | BD (g/cm3) | MC (%) | pH | EC (μs/cm) | SOC (g/kg) | EOC (g/kg) | POC (g/kg) | DOC (g/kg) | SOCS (t/ha) |
|---|---|---|---|---|---|---|---|---|---|---|
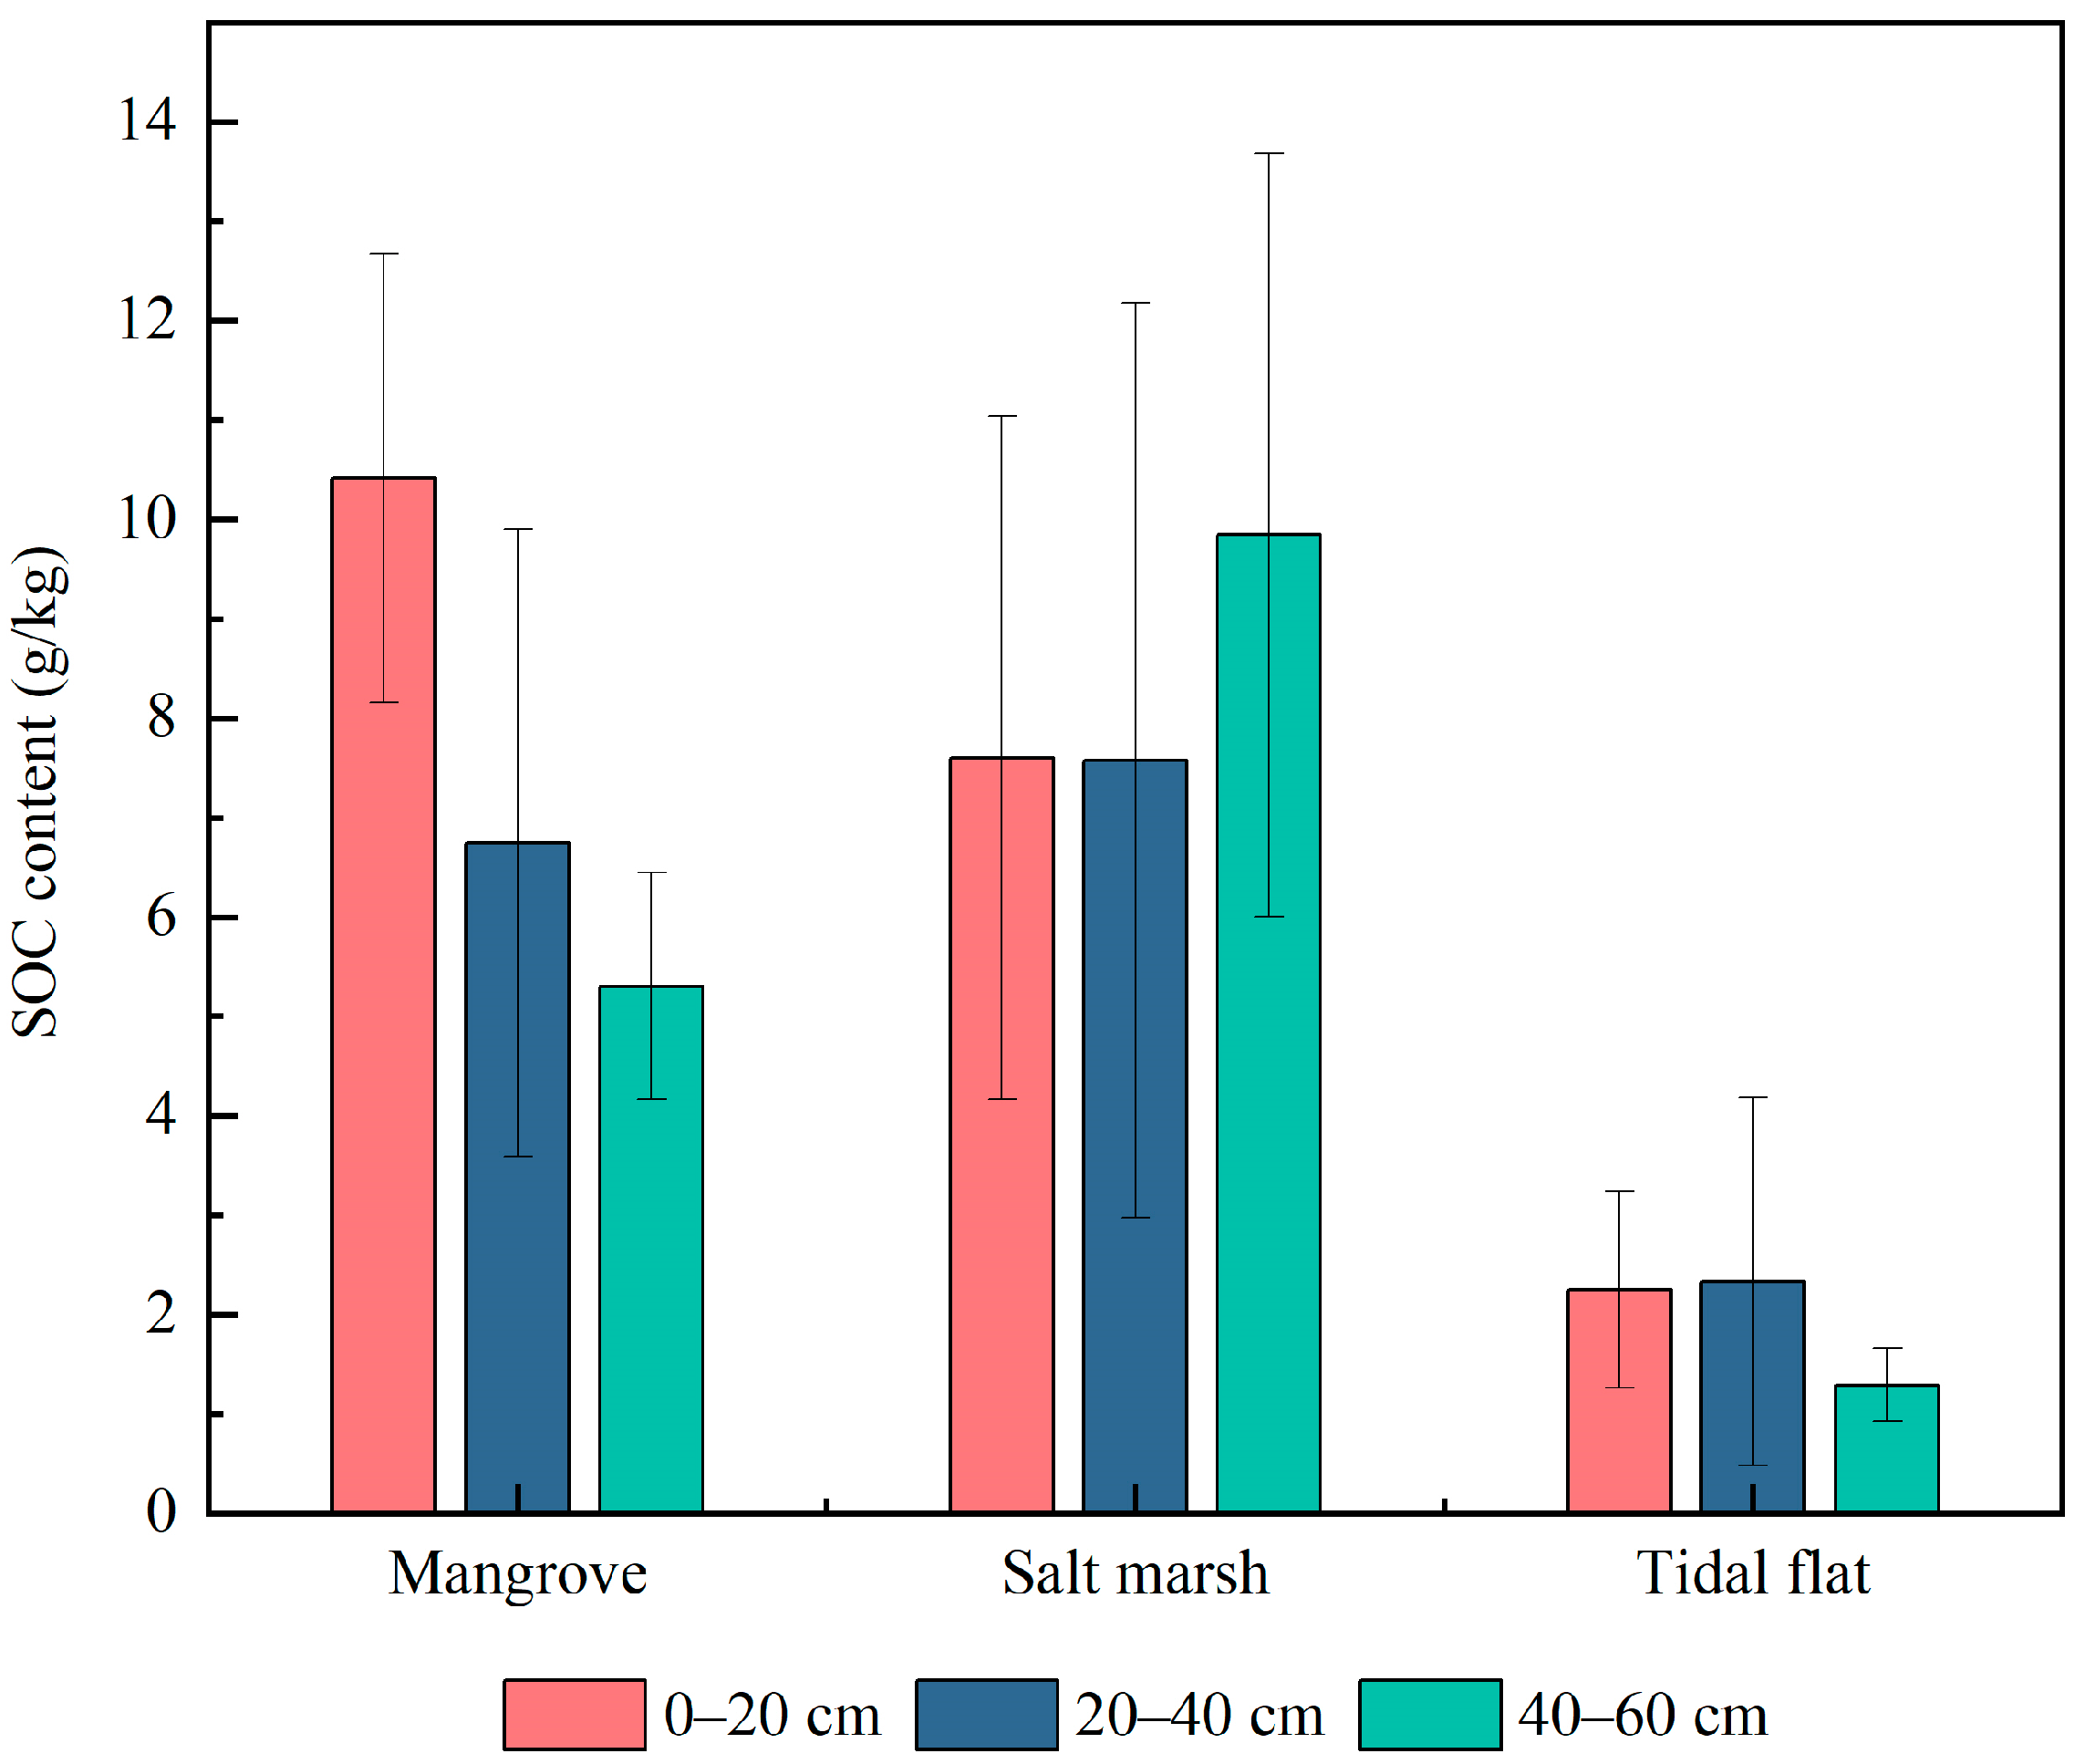
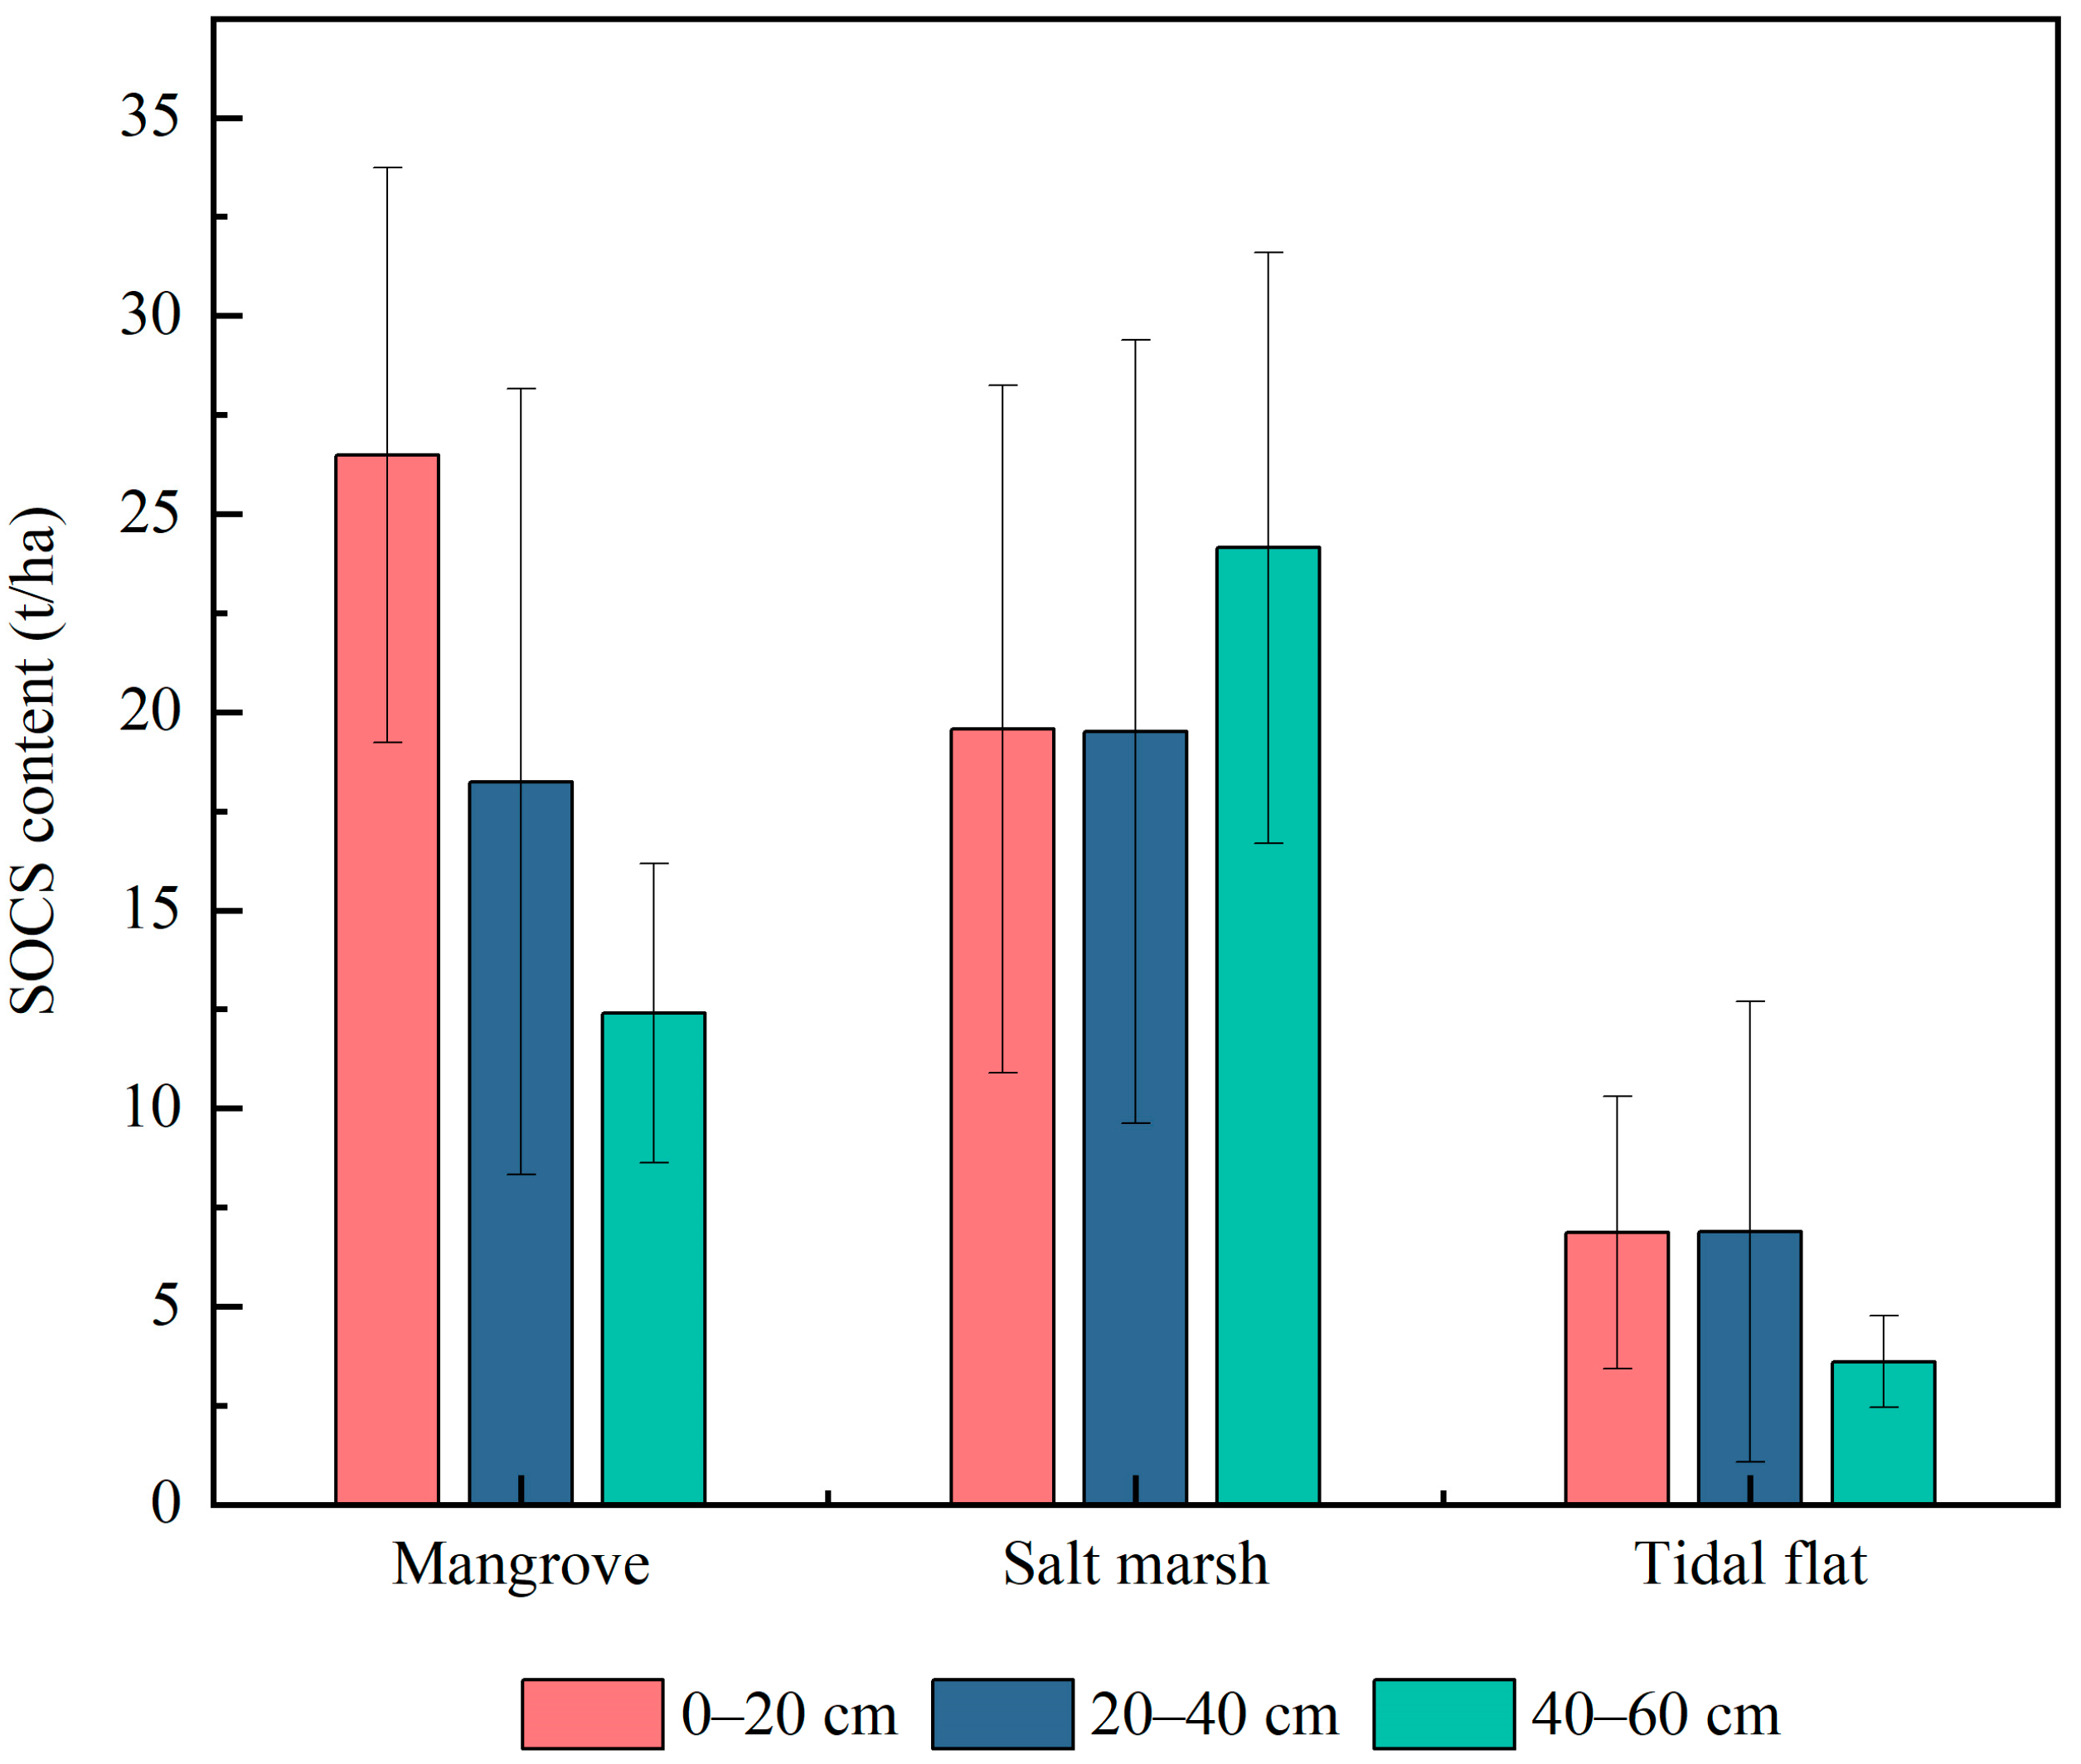
| Mangrove | 0–20 cm | 1.26 ± 0.13 | 42.16 ± 9.26 | 6.32 ± 0.55 | 3.04 ± 0.48 | 10.42 ± 2.40 | 2.13 ± 1 | 7.76 ± 1.26 | 0.21 ± 0.21 | 26.48 ± 7.25 |
| 20–40 cm | 1.31 ± 0.2 | 37.19 ± 12.2 | 5.33 ± 2.1 | 2.61 ± 1.1 | 6.47 ± 3.16 | 1.48 ± 0.89 | 5.26 ± 2.41 | 0.41 ± 0.72 | 18.24 ± 9.91 | |
| 40–60 cm | 1.16 ± 0.18 | 48.04 ± 2.57 | 6.27 ± 0.19 | 2.58 ± 0.04 | 5.30 ± 1.14 | 1.6 ± 0.09 | 3.71 ± 1.06 | 0.07 ± 0.03 | 12.41 ± 3.77 | |
| Salt marsh | 0–20 cm | 1.29 ± 0.15 | 35.25 ± 11.68 | 6.26 ± 1.06 | 3.08 ± 0.44 | 7.60 ± 3.44 | 1.32 ± 0.96 | 6.28 ± 3.00 | 0.18 ± 0.13 | 19.58 ± 8.68 |
| 20–40 cm | 1.37 ± 0.21 | 33.36 ± 15.49 | 5.79 ± 1.44 | 3.09 ± 0.49 | 7.58 ± 4.60 | 1.52 ± 1.02 | 6.05 ± 3.75 | 0.13 ± 0.12 | 19.51 ± 9.88 | |
| 40–60 cm | 1.28 ± 0.23 | 39.32 ± 15.58 | 5.57 ± 1.19 | 3.56 ± 0.91 | 9.84 ± 3.84 | 1.78 ± 1.05 | 8.06 ± 3.23 | 0.19 ± 0.12 | 24.15 ± 7.45 | |
| Tidal flat | 0–20 cm | 1.49 ± 0.11 | 26.97 ± 8.58 | 6.55 ± 0.62 | 2.99 ± 0.83 | 2.25 ± 0.99 | 0.33 ± 0.34 | 1.92 ± 0.66 | 0.08 ± 0.02 | 6.86 ± 3.44 |
| 20–40 cm | 1.56 ± 0.16 | 26.71 ± 4.31 | 7.01 ± 0.79 | 3.26 ± 0.42 | 2.33 ± 1.85 | 1.08 ± 0.62 | 3.39 ± 2.45 | 0.16 ± 0.09 | 6.89 ± 5.80 | |
| 40–60 cm | 1.35 ± 0.02 | 31.63 ± 0.63 | 6.61 ± 0.21 | 3.33 ± 0.41 | 1.29 ± 0.37 | 0.14 ± 0.08 | 1.14 ± 0.45 | 0.04 ± 0.03 | 3.61 ± 1.16 |
| BD | MC | pH | EC | SOC | SOCS | EOC | POC | DOC | |
|---|---|---|---|---|---|---|---|---|---|
| BD | 1 | ||||||||
| MC | −0.943 ** | 1 | |||||||
| pH | 0.503 * | −0.436 | 1 | ||||||
| EC | 0.350 | −0.412 | 0.205 | 1 | |||||
| SOC | −0.591 * | 0.616 * | −0.637 * | 0.034 | 1 | ||||
| SOCS | −0.544 * | 0.566 * | −0.658 * | 0.011 | 0.995 ** | 1 | |||
| EOC | −0.559 * | 0.705 * | −0.509 * | −0.172 | 0.894 ** | 0.884 ** | 1 | ||
| POC | −0.447 | 0.492 | −0.594 * | 0.142 | 0.976 ** | 0.978 ** | 0.89 ** | 1 | |
| DOC | −0.115 | 0.155 | −0.640 * | −0.298 | 0.467 | 0.538 * | 0.499 * | 0.520 * | 1 |
Disclaimer/Publisher’s Note: The statements, opinions and data contained in all publications are solely those of the individual author(s) and contributor(s) and not of MDPI and/or the editor(s). MDPI and/or the editor(s) disclaim responsibility for any injury to people or property resulting from any ideas, methods, instructions or products referred to in the content. |
© 2024 by the authors. Licensee MDPI, Basel, Switzerland. This article is an open access article distributed under the terms and conditions of the Creative Commons Attribution (CC BY) license (https://creativecommons.org/licenses/by/4.0/).
Share and Cite
Wang, M.; Yao, H.; Huang, Z.; Liu, Y.; Chen, M.; Zhong, M.; Qiao, J. Distribution and Storage Characteristics of Soil Organic Carbon in Tidal Wetland of Dandou Sea, Guangxi. Atmosphere 2024, 15, 431. https://doi.org/10.3390/atmos15040431
Wang M, Yao H, Huang Z, Liu Y, Chen M, Zhong M, Qiao J. Distribution and Storage Characteristics of Soil Organic Carbon in Tidal Wetland of Dandou Sea, Guangxi. Atmosphere. 2024; 15(4):431. https://doi.org/10.3390/atmos15040431
Chicago/Turabian StyleWang, Mengsi, Huanmei Yao, Zengshiqi Huang, Yin Liu, Meijun Chen, Maoyuan Zhong, and Junchao Qiao. 2024. "Distribution and Storage Characteristics of Soil Organic Carbon in Tidal Wetland of Dandou Sea, Guangxi" Atmosphere 15, no. 4: 431. https://doi.org/10.3390/atmos15040431
APA StyleWang, M., Yao, H., Huang, Z., Liu, Y., Chen, M., Zhong, M., & Qiao, J. (2024). Distribution and Storage Characteristics of Soil Organic Carbon in Tidal Wetland of Dandou Sea, Guangxi. Atmosphere, 15(4), 431. https://doi.org/10.3390/atmos15040431


