Abstract
Recent climatic changes, most evident in air temperature, also significantly impact sensible conditions, particularly affecting the human body during the summer season in urban areas. This study utilized hourly values of air temperature (t, °C) and relative humidity (RH, %) for 2008–2022 obtained from nine measurement points located in the city of Poznań. The measurement network was set up and supported by the Department of Meteorology and Climatology of Adam Mickiewicz University in Poznań. Based on these data, thermal conditions were characterized using the Humidex (HD), as well as “hot days” (Tmax > 30 °C) and heat waves determined based on them. The conducted research revealed variability in thermal conditions across the city. The highest average Tmax (27.4 °C) and HD values (31.3 °C), as well as the greatest average number of hot days (15 days), were recorded in the compact, dense city center. In contrast, the lowest values (respectively: 25.9 °C, 27.5 °C, 8 days) were observed in areas with a significantly greater proportion of green spaces located further from the center. Furthermore, significant trends of change were observed: an annual average Tmax increase of 1.2–1.6 °C/decade and HD values showing an increase of 1.5–3.0 °C/decade. This study also highlighted the noteworthy impact of urbanization and the presence of urban greenery on the frequency and total duration of heat waves. Between 2008 and 2022, the area of compact development experienced 26 heat waves lasting a total of 115 days, whereas the area with a high proportion of greenery recorded 14 cases and 55 days, respectively. The longest recorded heat wave, spanning 9 days, occurred in July 2010. Individual heat waves identified based on Tmax (>30 °C) may exhibit significant variations in terms of perceived conditions, as indicated by HD.
1. Introduction
One of the manifestations of progressing climate warming is the increasingly frequent occurrence of heat waves that pose a threat to human health and life. Some of the most severe heat waves in Europe were recorded in 2003 and 2010 [1,2,3,4]. According to the WMO Report [5], these two heat waves caused the death of ~128,000 people (80% of all deaths related to high air temperature values in the years 1970–2019). These heat waves were described as “mega heat waves” by Barriopedro et al. [6]. They resulted in exceeding 500-year seasonal record air temperatures over around 50% of the territory of Europe. In recent years, intensive heat waves in Europe also occurred in 2015, 2018, 2019, and 2021 [7,8,9,10,11,12].
The inconvenience of heat waves is particularly strong in urbanized areas where population size has increased over recent decades. It is estimated that in 2022, 57% of the population of the Earth lived in cities, and by 2050, the value will have reached 70% [13]. Cities are characterized by their own separate climate resulting from the effect of urban development and land use on atmospheric conditions. In comparison to suburban areas, the climate of the city shows a decrease in insolation, air humidity, and wind speed and increased air pollution and cloudiness; greater atmospheric precipitation; and more days with fine precipitation, fog, and higher air temperature [14]. In highly urbanized areas, air temperature values can reach several degrees Celsius greater than in rural areas [15,16,17]. Moreover, contemporary climate change has been shown to raise the urban temperature, intensifying severe heat events and increasing their frequency, duration, and strength, thereby raising the risk of heat exposure [18,19] and negatively influencing aging societies’ health and urban environment [20,21,22]. Research has shown an increase in deaths during heat waves in cities in comparison to non-urban areas due to the intensification of the urban heat island effect (UHI) [23,24,25,26]. The consequence is the occurrence of heat stress not only by day but also by night, and therefore a reduction in the time available for the regeneration of the organism by night, leading to serious biometeorological stress on the organism.
The following decades are expected to bring further worsening of biometeorological conditions in urbanized areas in the summer because forecasts point to an increase in the frequency of hot weather. According to Lhotka et al. [27], in Central Europe at the end of the 21st century, three to four heat waves will occur per summer, and strong heat waves will probably be a regular phenomenon. A similar direction of changes was evidenced by Junk et al. [28], who investigated future changes in three cities in Europe (London, Luxemburg, and Rome). Their study showed that the greatest changes in the average duration of heat waves, as well as in the duration of the longest heat waves, will be recorded in Rome. In the territory of Poland, an intensive increase in Tmax and a related increase in the frequency of hot days should also be expected in the next few decades. The southern and western regions of the country will be particularly affected [29].
Research concerning weather and climate conditions based on in situ measurements in urban areas is scarce due to the limited availability of data. This type of research in Poznań was conducted in the context of both heat waves [30] and cold waves [31] but also in reference to the phenomenon of urban heat islands [32,33]. The said research was based both on measurement data obtained from nine points located in areas representing various local climates and on satellite data.
To explore the connections between urban structure and local climate, researchers have devised various classifications [34]. These include the FRAISE (“Flux Ratio-Active Index Surface Exchange”) scheme [35], which is built upon the Surface Energy Balance (SEB) scheme. The classifications used include Urban Climatic Maps (UCMaps), constructed with information on land use, topography, and climatic data, and the Urban Climate Zone (UCZ) [36]. Stewart and Oke [37] expanded the UCZ scheme and introduced the concept of a Local Climate Zone (LCZ). LCZs are defined as areas exhibiting uniform characteristics in terms of urban morphology, land use, urban material, and urban metabolism, along with a distinctive air temperature regime under calm and clear skies [37]. The present study employed the LCZ classification, which has been widely used in previous urban climate studies. For example, it has been employed to estimate correlations between urban morphology and the urban heat island [38,39,40] and to assess the impact of LCZ changes on land surface temperature [41,42,43]. Additionally, it has been applied in works focusing on the methodology of classifying urban areas [43,44,45,46,47]. Moreover, the LCZ classification has found utility in studies examining heat and cold waves in urban areas [48,49].
Next to the determination of climate conditions in the city, it is important to determine biometeorological conditions, especially those during extreme situations such as heat waves. The Humidex (HD) index was used despite its limitations, which arise from the fact that it considers only two meteorological elements and does not take into account factors such as wind or solar radiation. However, in situations where there is insufficient input data to calculate more advanced indicators, this simplicity of the HD becomes, in a way, its advantage. Due to this simplicity, the Humidex has found adoption in various global regions. Notable instances include its utilization in Iran [50], Europe [51], the Czech Republic [52], Greece [53], Canada [54], and Italy [55,56].
This study holds particular significance for vulnerable populations, especially the elderly, individuals with chronic illnesses, children, and weather-sensitive people. These groups are highly susceptible to fluctuations in air temperature and heat waves [57]. Furthermore, the impact of biometeorological conditions extends beyond humans, affecting both plants and animals. These living organisms require water and shaded areas to mitigate the adverse effects of high temperatures. Moreover, this study highlights the influence of urbanization and local urban climates on the frequency and duration of heat waves. Given the broader context of climate change, monitoring heat waves in every city is becoming increasingly vital. It is imperative for decision makers to prioritize this aspect as a fundamental requirement for developing strategies in future architectural plans. Additionally, the development of sustainable spatial planning strategies is a key factor in mitigating the effect of local climate change and providing optimal biometeorological conditions for city dwellers [58].
The aims of this study were as follows:
- To characterize summer thermal conditions in Poznań (including the frequency of hot events), considering their spatial variability and temporal fluctuations;
- To determine the spatial variability in bioclimatic conditions based on HD in the city;
- To assess the biometeorological conditions during heat waves and to evaluate heat stress related to high-temperature and high-humidity conditions in different types of LCZs in Poznań.
2. Study Area, Data, and Methods
2.1. Study Area
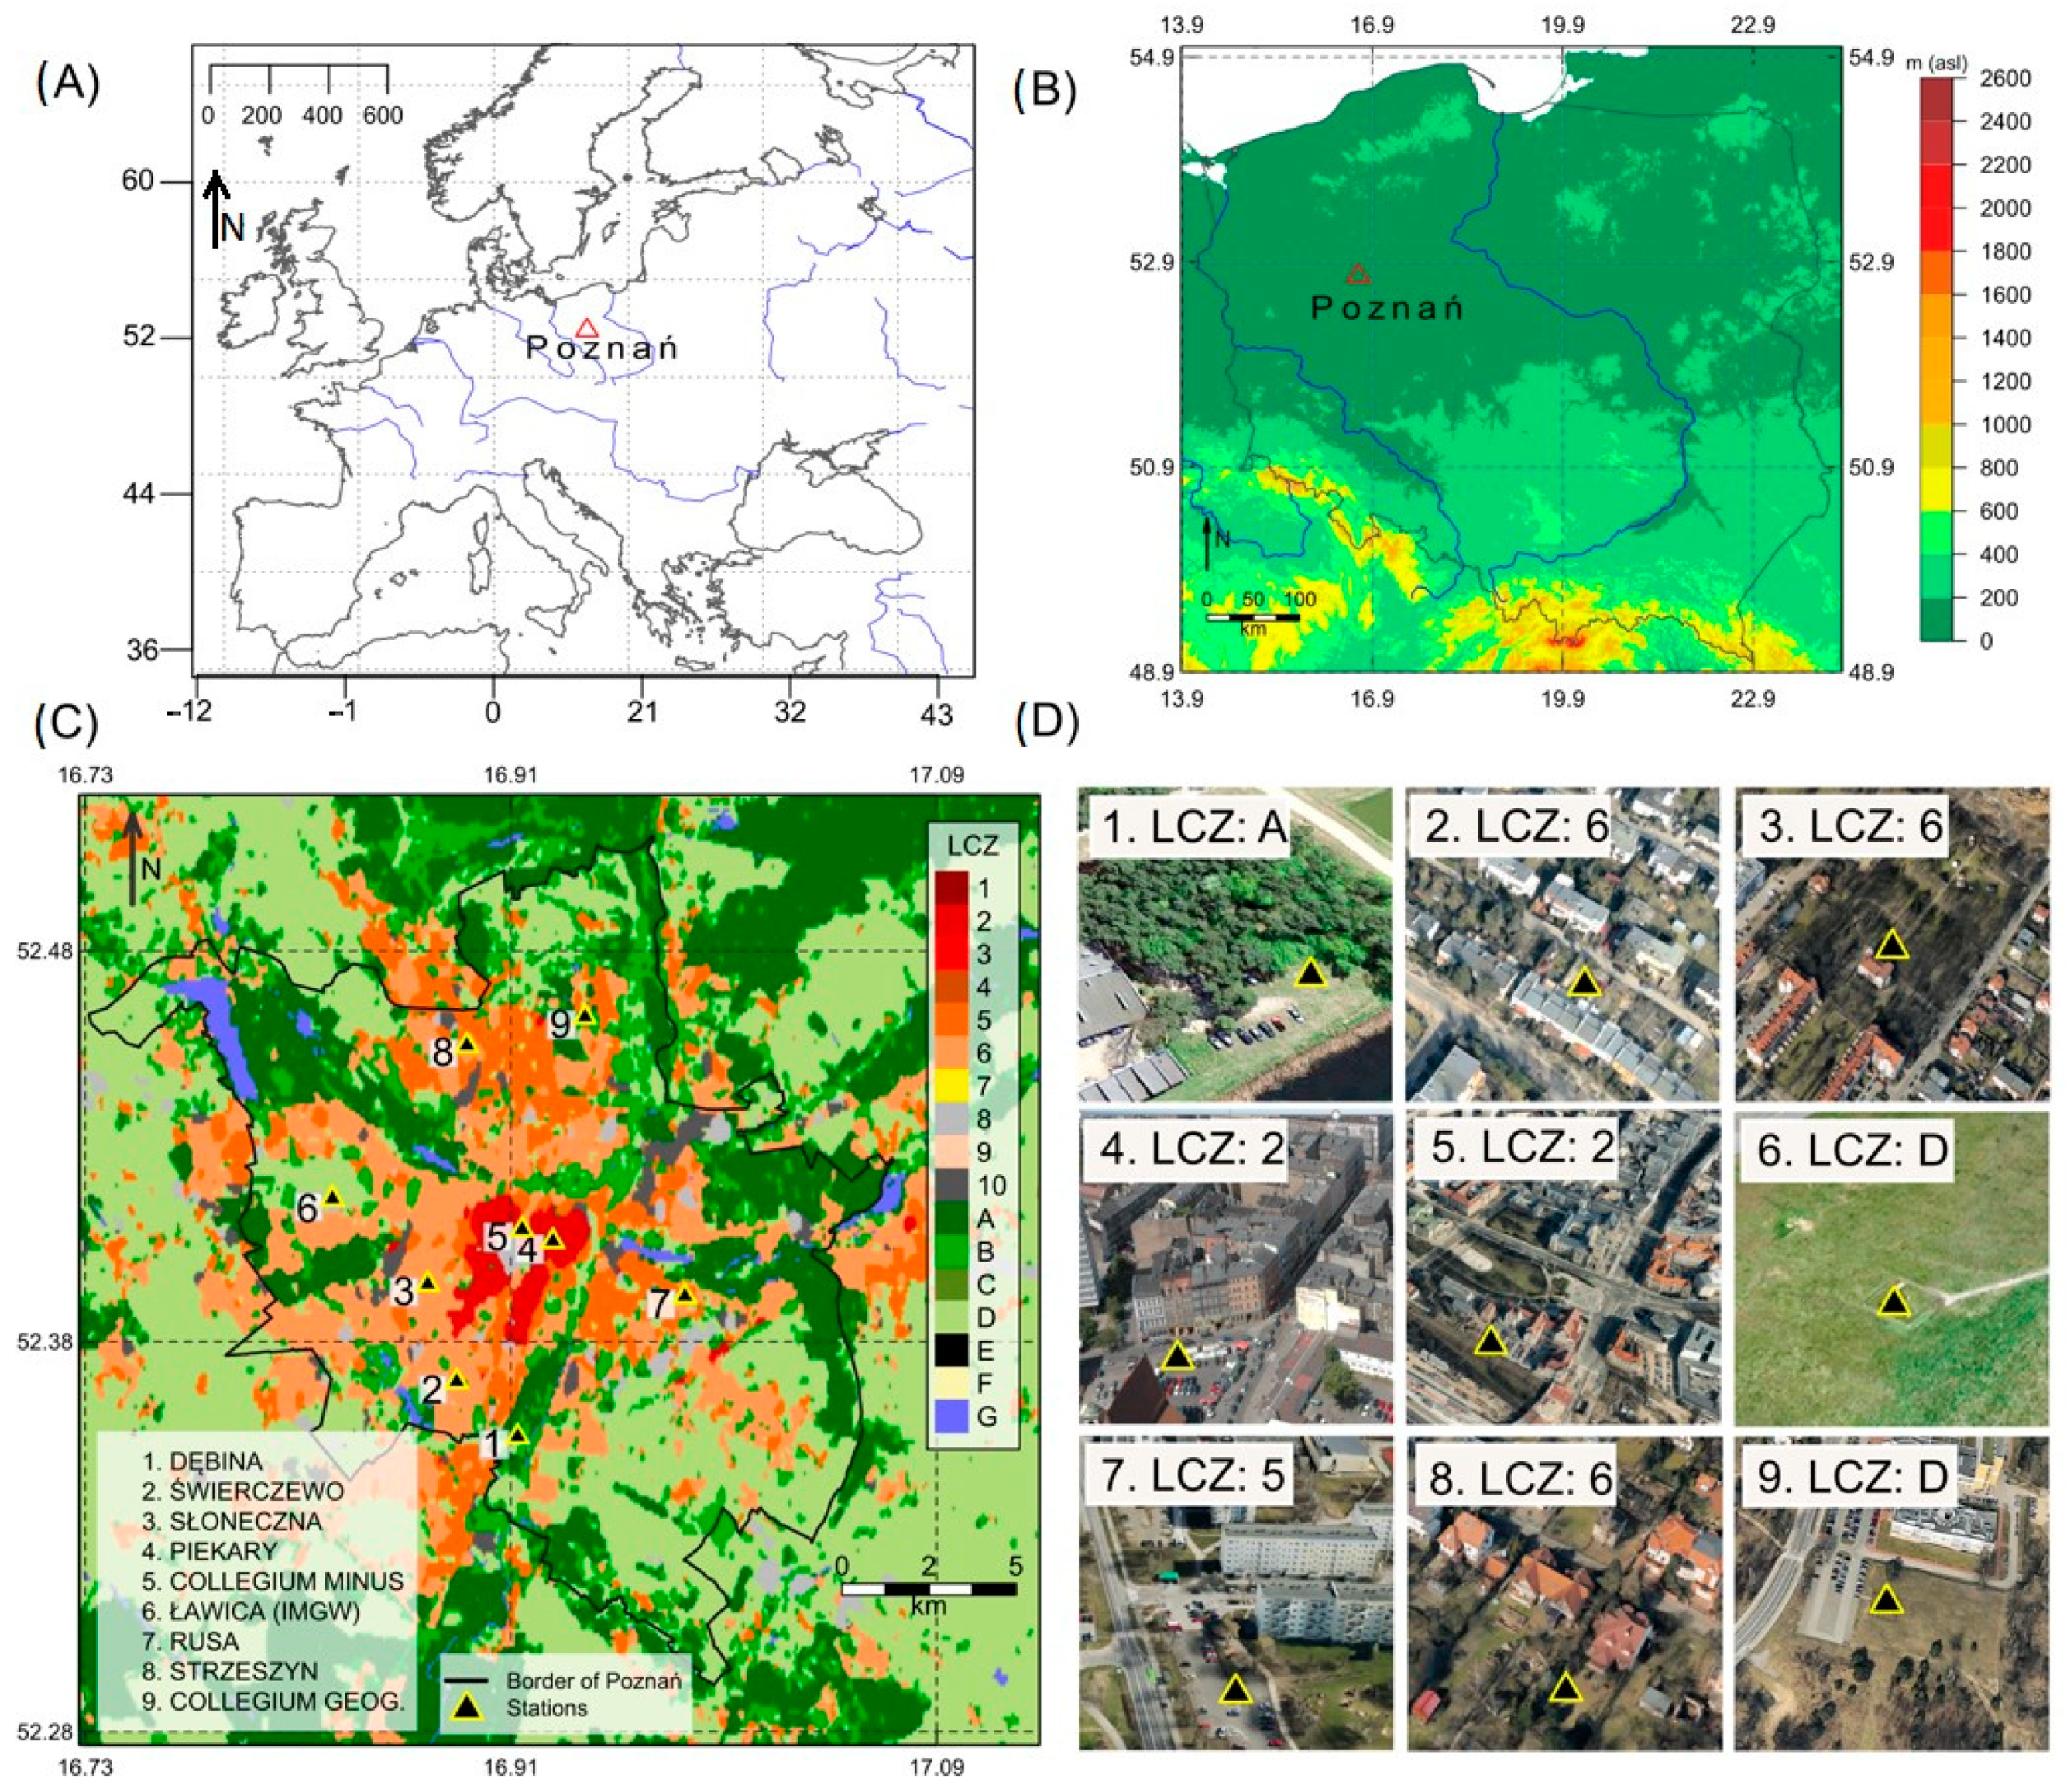
Poznań is located in western Poland (Figure 1), within the Wielkopolskie Lakeland, an extensive microregion in central Wielkopolska and south-eastern Kujawy [59]. As of 31 December 2020, the surface area of the city was 262 km2, and it was inhabited by 532,048 people [60]. The population density was 2 031 persons per 1 km2. Poznań is the fifth largest city in Poland in terms of population size. Approximately 4.3% of the city covered areas with exceptional environmental values under legal protection, of which the greatest share was of ecological ground, followed by areas of protected landscape and nature reserves. The forest cover in the city was 13.7% [60].
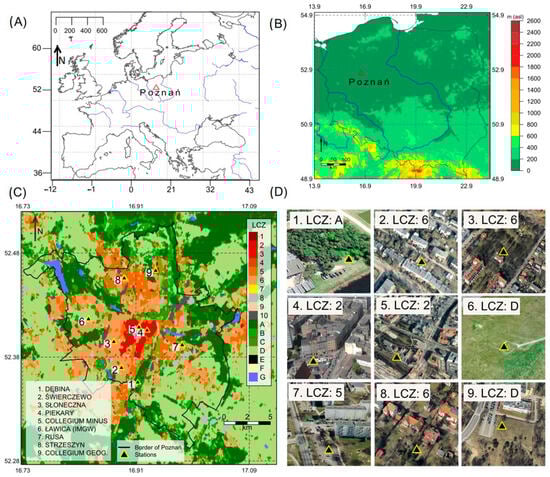
Figure 1.
Location of study area (A,B) and position of measuring points (1–9) on the map (C) and its aerial visualization (D, https://www.google.com/maps, accessed on 1 March 2024). The Local Climate Zone classes in Poznań for the year 2023 (full LCZ color scale legend): 1. Compact high-rise, 2. Compact mid-rise, 3. Compact low-rise, 4. Open high-rise, 5. Open mid-rise, 6. Open low-rise, 7. Lightweight low-rise, 8. Large low-rise, 9. Sparsely built, 10. Heavy industry, A. Dense trees, B. Scattered trees, C. Bush, scrub, D. Low plants, E. Bare rock or paved, F. Bare soil or sand, G. Water.
According to the Köppen–Geiger classification of climates [61], Poznań is located in type Cfb, i.e., a humid, moderately warm climate. In the years 1991–2020, the average annual air temperature was 9.4 °C [62]. On average, the coldest month was January, with an average temperature of −0.4 °C, and the warmest was July, with an average temperature of 19.5 °C. The highest observed air temperature reached 38.0 °C, recorded on 26 June 2019 [62]. Not being exceptional among other Central European cities, Poznań has experienced warming that has accelerated in recent decades. The rate of the increase in mean annual temperature since the beginning of systematic measurement in 1948 equaled 0.11 °C/decade. A similar long-term increasing trend of ~1 °C per 100 years was detected in Switzerland [63], Czech Republic [64], Northern Europe [65,66], and in other Polish cities e.g., [67], and they are all consistent with the Northern Hemisphere land temperature trends [68]. In Poznań, warming accelerated after 1987, and the rate of changes amounted to 0.46 °C/decade. The strongest trend in recent decades was observed in summer (0.75 °C/decade) and autumn (0.61 °C/decade), with lower values for spring (0.46 °C/decade) and winter (0.05 °C/decade) [69]. A break in the long-term trend at the turn of 1980s and 1990s was also detected in other Polish cities (e.g., Wrocław [70]), while over the Northern Hemisphere, an acceleration was detected earlier e.g., [71]. The amplification in warming in Poland in the last three decades is connected with a large reduction in aerosols and a diminishing of their cooling effect, which is due to the economic transformation of the early 1990s [72].
The annual average difference in air temperature between urban and rural areas in Poznań (Canopy Layer Urban Heat Island, CLUHI) is 1.0 °C. However, during daytime and night-time hours, this difference extends to 0.9 and 1.2 °C, respectively. Notably, higher mean values (ranging from 1.5 to 1.6 °C) are observed during nights in the spring and summer, and the maximum intensity of the CLUHI in the summer season can even reach 6.2 °C. The annual average CLUHI in Poznań is quite similar to that of other Polish cities, such as Wrocław, Toruń, Warszawa, Łódź, and Kraków [32].
Average annual precipitation total in Poznań amounts to 538.9 mm [73]. On average, the lowest precipitation total was recorded in February (30.7 mm) and the highest in July (84.4 mm). In the years 1991–2020, snow cover persisted for an average of 28 days [74]. The measurement points (Figure 1) are located in the center and at various distances from the city center, representing selected types of the city’s local climate. Piekary and Collegium Minus are situated in the oldest part of the city, in its center, with mid-rise compact urban structures (LCZ 2). Rusa, situated to the east of the center, represents open areas with mid-rise building height (LCZ 5). Słoneczna, Strzeszyn, and Świerczewo are of the same type, with low-rise buildings situated in open structures and a significant presence of greenery (LCZ 6). However, they are located in different parts of the city, respectively, to the west, north, and south of the city center. Ławica and Collegium Geographicum represent areas with low vegetation, located to the west and relatively close to the center (Ławica) and to the north, significantly farther from the city center (Collegium Geographicum). Dębina is an area of local climate associated with forested areas (LCZ A). It is an area with the highest proportion of vegetation, situated far south of the city center.
2.2. Data and Methods
The continuous expansion of urban areas and its impacts on city dwellers has led to the development of a methodology for standardizing research on urban climate. The Local Climate Zones (LCZ) classification developed by Stewart and Oke [37] was used in this study. The LCZ classification delineates local climates within a city, considering the unique expressions of climate patterns influenced by specific land-use and land-cover (LULC) characteristics. Comprising 17 typological units based on the height and density of surface structures and cover, the LCZ classification considers elements such as building surface fraction, aspect ratio, sky view factor, impervious/pervious surface factor, the geometric mean height of roughness elements, and terrain roughness class [37]. In our study, we aimed to establish Local Climate Zones (LCZ) in Poznań for the year 2023 with a resolution of 100 m × 100 m, as illustrated in Figure 1. The World Urban Database and Access Portal Tools (WUDAPTs) were employed for this purpose. They provide the procedure and an online generator to conduct LCZ classification in a straightforward and objective manner, utilizing readily available and free Landsat data [44,47,75].
This study was based on hourly values of air temperature (t, °C) and relative humidity (RH, %) obtained for nine measurement points located in the city of Poznań (Figure 1). The measurement network was organized and supported by the Department of Meteorology and Climatology of Adam Mickiewicz University in Poznań. The data used in the study were obtained for summer (June–August) for the period 2008–2022. The choice of the multiannual period was determined by data availability. Data for eight measurement points were gathered from the resources of the Department of Meteorology and Climatology of the University of Adam Mickiewicz in Poznań. Air temperature and humidity were measured 2 m above ground level using certified data loggers (HOBO U23-001A) placed in a solar radiation shield (M-RSA) with a one-hour resolution. The equipment parameters meet achievable measurement uncertainty standards [76]. The data for Poznań-Ławica (WMO id 12330 synoptic station) were obtained from the resources of the Institute of Meteorology and Water Management—National Research Institute (IMGW-PIB). Meteorological data collected as part of the measurement network operation in the Poznań area undergo a thorough examination before being transferred to the historical database. Initially, a quantitative assessment was conducted, followed by subsequent qualitative checks. This involves statistical testing and comparison with values obtained from the official IMGW-PIB network. Additionally, it used the standard normal homogeneity test (SNHT) to identify change points in normal variables.
Based on the data, the maximum daily air temperature (Tmax) was determined for each measurement point. Then, average Tmax (°C) was calculated for particular seasons and for the multiannual period. The next step involved the identification of hot days, i.e., days with Tmax >30 °C, among which heat waves were designated. A heat wave was defined as a sequence of at least three hot days. Despite their occurrence in many regions of the world, heat waves do not have a concise and universal definition, and they are defined on the basis of various criteria [77]. Two groups of definitions predominate in the literature. The first group is of definitions based on arbitrary thresholds—that is, specific air temperature values. The most common definition from this group is the definition adopted in these studies. Such assumptions were adopted in works from Central Europe [78,79]. Adopting these definitions reveals the spatial variability of climatic conditions in the analyzed area. The second group is of definitions referring to relative thresholds. Most of the definitions in this group are based on the criterion of extreme weather events as proposed by the IPCC [80]: a weather event that is so rare within a particular area and in the particular season that it lies within the 10th or 90th percentile of an observed probability density function or rarer.
Changes in Tmax were assessed using linear regression, and the significance of the trends was examined by Student’s t-test. In turn, for the assessment of trends in the number of hot days, the non-parametric Mann–Kendall test and Sen’s method were used. The significance of trends was assessed at the level α = 0.05. The determination of biometeorological conditions employed the Humidex (HD), introduced by Masterton and Richardson [81]. It is an empirical heat-stress index formulated as a linear combination of air temperature (t in °C) and the vapor pressure of water (ρ in hPa). It can be treated as a measure of perceived temperature, particularly on hot days [82]. A drawback of the index is that it neglects solar radiation and wind speed, which can intensify or mitigate the thermal stress on humans. The calculation of the index employed the program BioKlima 2.6 [83]. The index is expressed in °C and involves five levels of thermo-humidity discomfort (Table 1).

Table 1.
Threshold values of the HD [82].
The index is calculated based on the following formula:
where
HD = t + 0.5555 × (ρ10),
t—air temperature in °C;
ρ—vapor pressure of water in hPa.
HD calculations used approximations to express vapor pressure of water (ρ, hPa) via relative humidity (RH, %) according to the following formula [84]:
where
ρ = 6.112 × 10[(7.5 t)/(237.7 + t)] RH/100
t—air temperature in °C;
RH—relative humidity in %.
The next step involved the calculation of the average value of the HD in particular seasons and in the multiannual period for 12:00 UTC. This time of day is commonly applied in biometeorological/bioclimatic research because it, on average, corresponds with the time of the greatest activity of people in a day. Next, the occurrence of particular categories of discomfort in summer was determined. It was followed by the calculation of the average value of the HD for individual heat waves and determination of categories of discomfort during heat waves. Moreover, for selected heat waves, the daily variation of the HD was determined in detail.
3. Results
3.1. Characteristics of Climatic Conditions
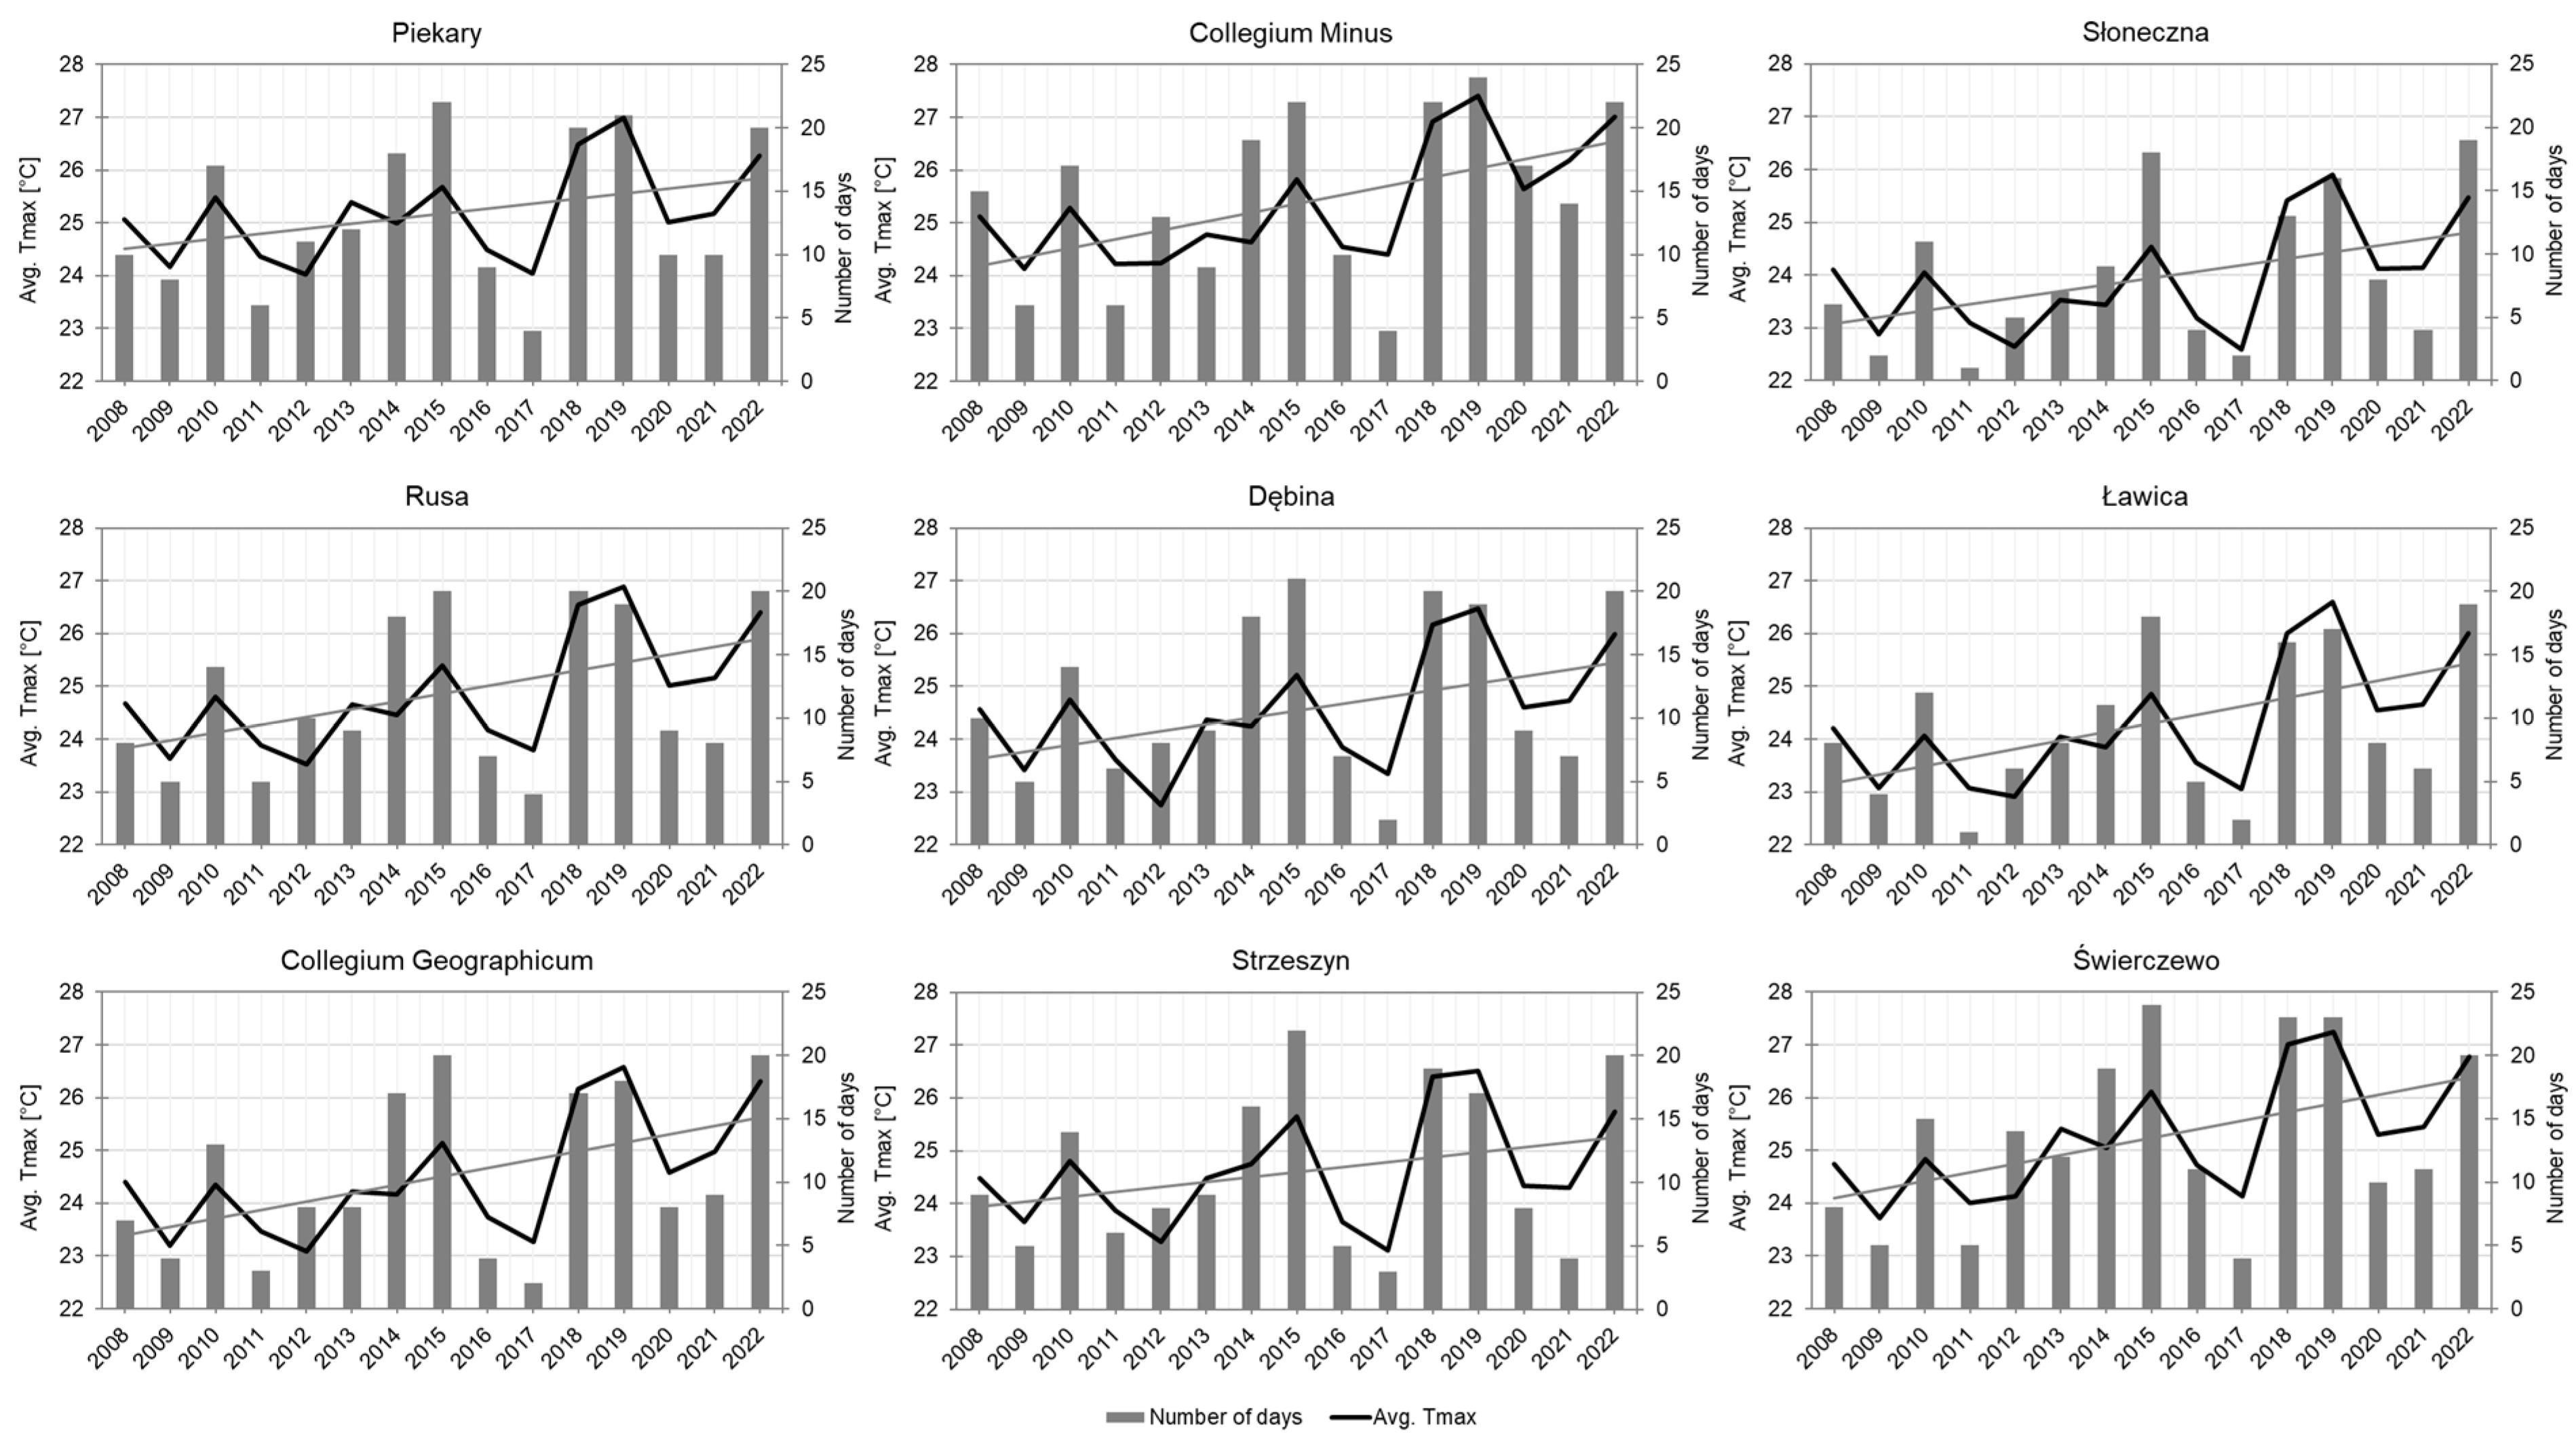
In the period 2008–2022, in summer, the average Tmax in Poznań was 24.7 °C. The value was variable across the city and ranged from 23.9 °C in Słoneczna to 25.4 °C in Collegium Minus. In the multiannual period, three summers stood out for having the lowest average Tmax values, namely, 2009, 2012, and 2017 (Figure 2), when the average Tmax for the entire city did not exceed 24.0 °C. The lowest value was recorded in 2012, when the average Tmax was 23.5 °C, although, in individual measurement points, it ranged from 22.6 °C in Słoneczna to 24.1 °C in Collegium Minus (Table 2). In that year, five out of nine points recorded the lowest value in the entire multiannual period. The highest average Tmax was observed in 2019, reaching 26.7 °C and varying across the city from 25.9 °C in Słoneczna to 27.4 °C in Collegium Minus. In all points, the average for the season was the highest in the study period. This study evidenced a considerable increase in average Tmax in summer that was statistically significant in seven out of nine points. The most intensive changes were recorded in the warmest point, namely, Collegium Minus (1.7 °C/decade).

Figure 2.
Course of average Tmax (and trend line) and number of hot days in the summer in Poznań in the years 2008–2022.
Table 2.
Characteristics of thermal conditions in Poznań in the period 2008–2022.
The average number of hot days in Poznań in the period 2008–2022 was 12, although considerable variability was observed across the city. On average, the fewest hot days were observed in Słoneczna, 8 days, and the most in Collegium Minus, 15 days (Table 2). In each measurement point in the analyzed multiannual period, at least one hot day was observed. In seven out of nine points, the fewest hot days were recorded in the summer of 2017 (Figure 2). Their number at the time varied from two days in Dębina, Słoneczna, Ławica, and Collegium Geographicum to four days in Piekary, Collegium Minus, Świerczewo, and Rusa. At two points (Słoneczna, Ławica), the lowest number (only one day) of the analyzed days was recorded in 2011. Considering the highest number of hot days in a season, two seasons particularly stand out, namely, 2015 and 2022. In the summer of 2015, in six out of nine points, the highest seasonal number of hot days in the multiannual period was recorded. That summer, the number of hot days varied from 18 in Ławica and Słoneczna to 24 in Świerczewo. The determined increase in mean Tmax in summer translated into an increase in the number of hot days, although the changes were not statistically significant. The greatest increase in the number of such days occurred at the point with the most intensive increase in Tmax, namely, in Piekary.
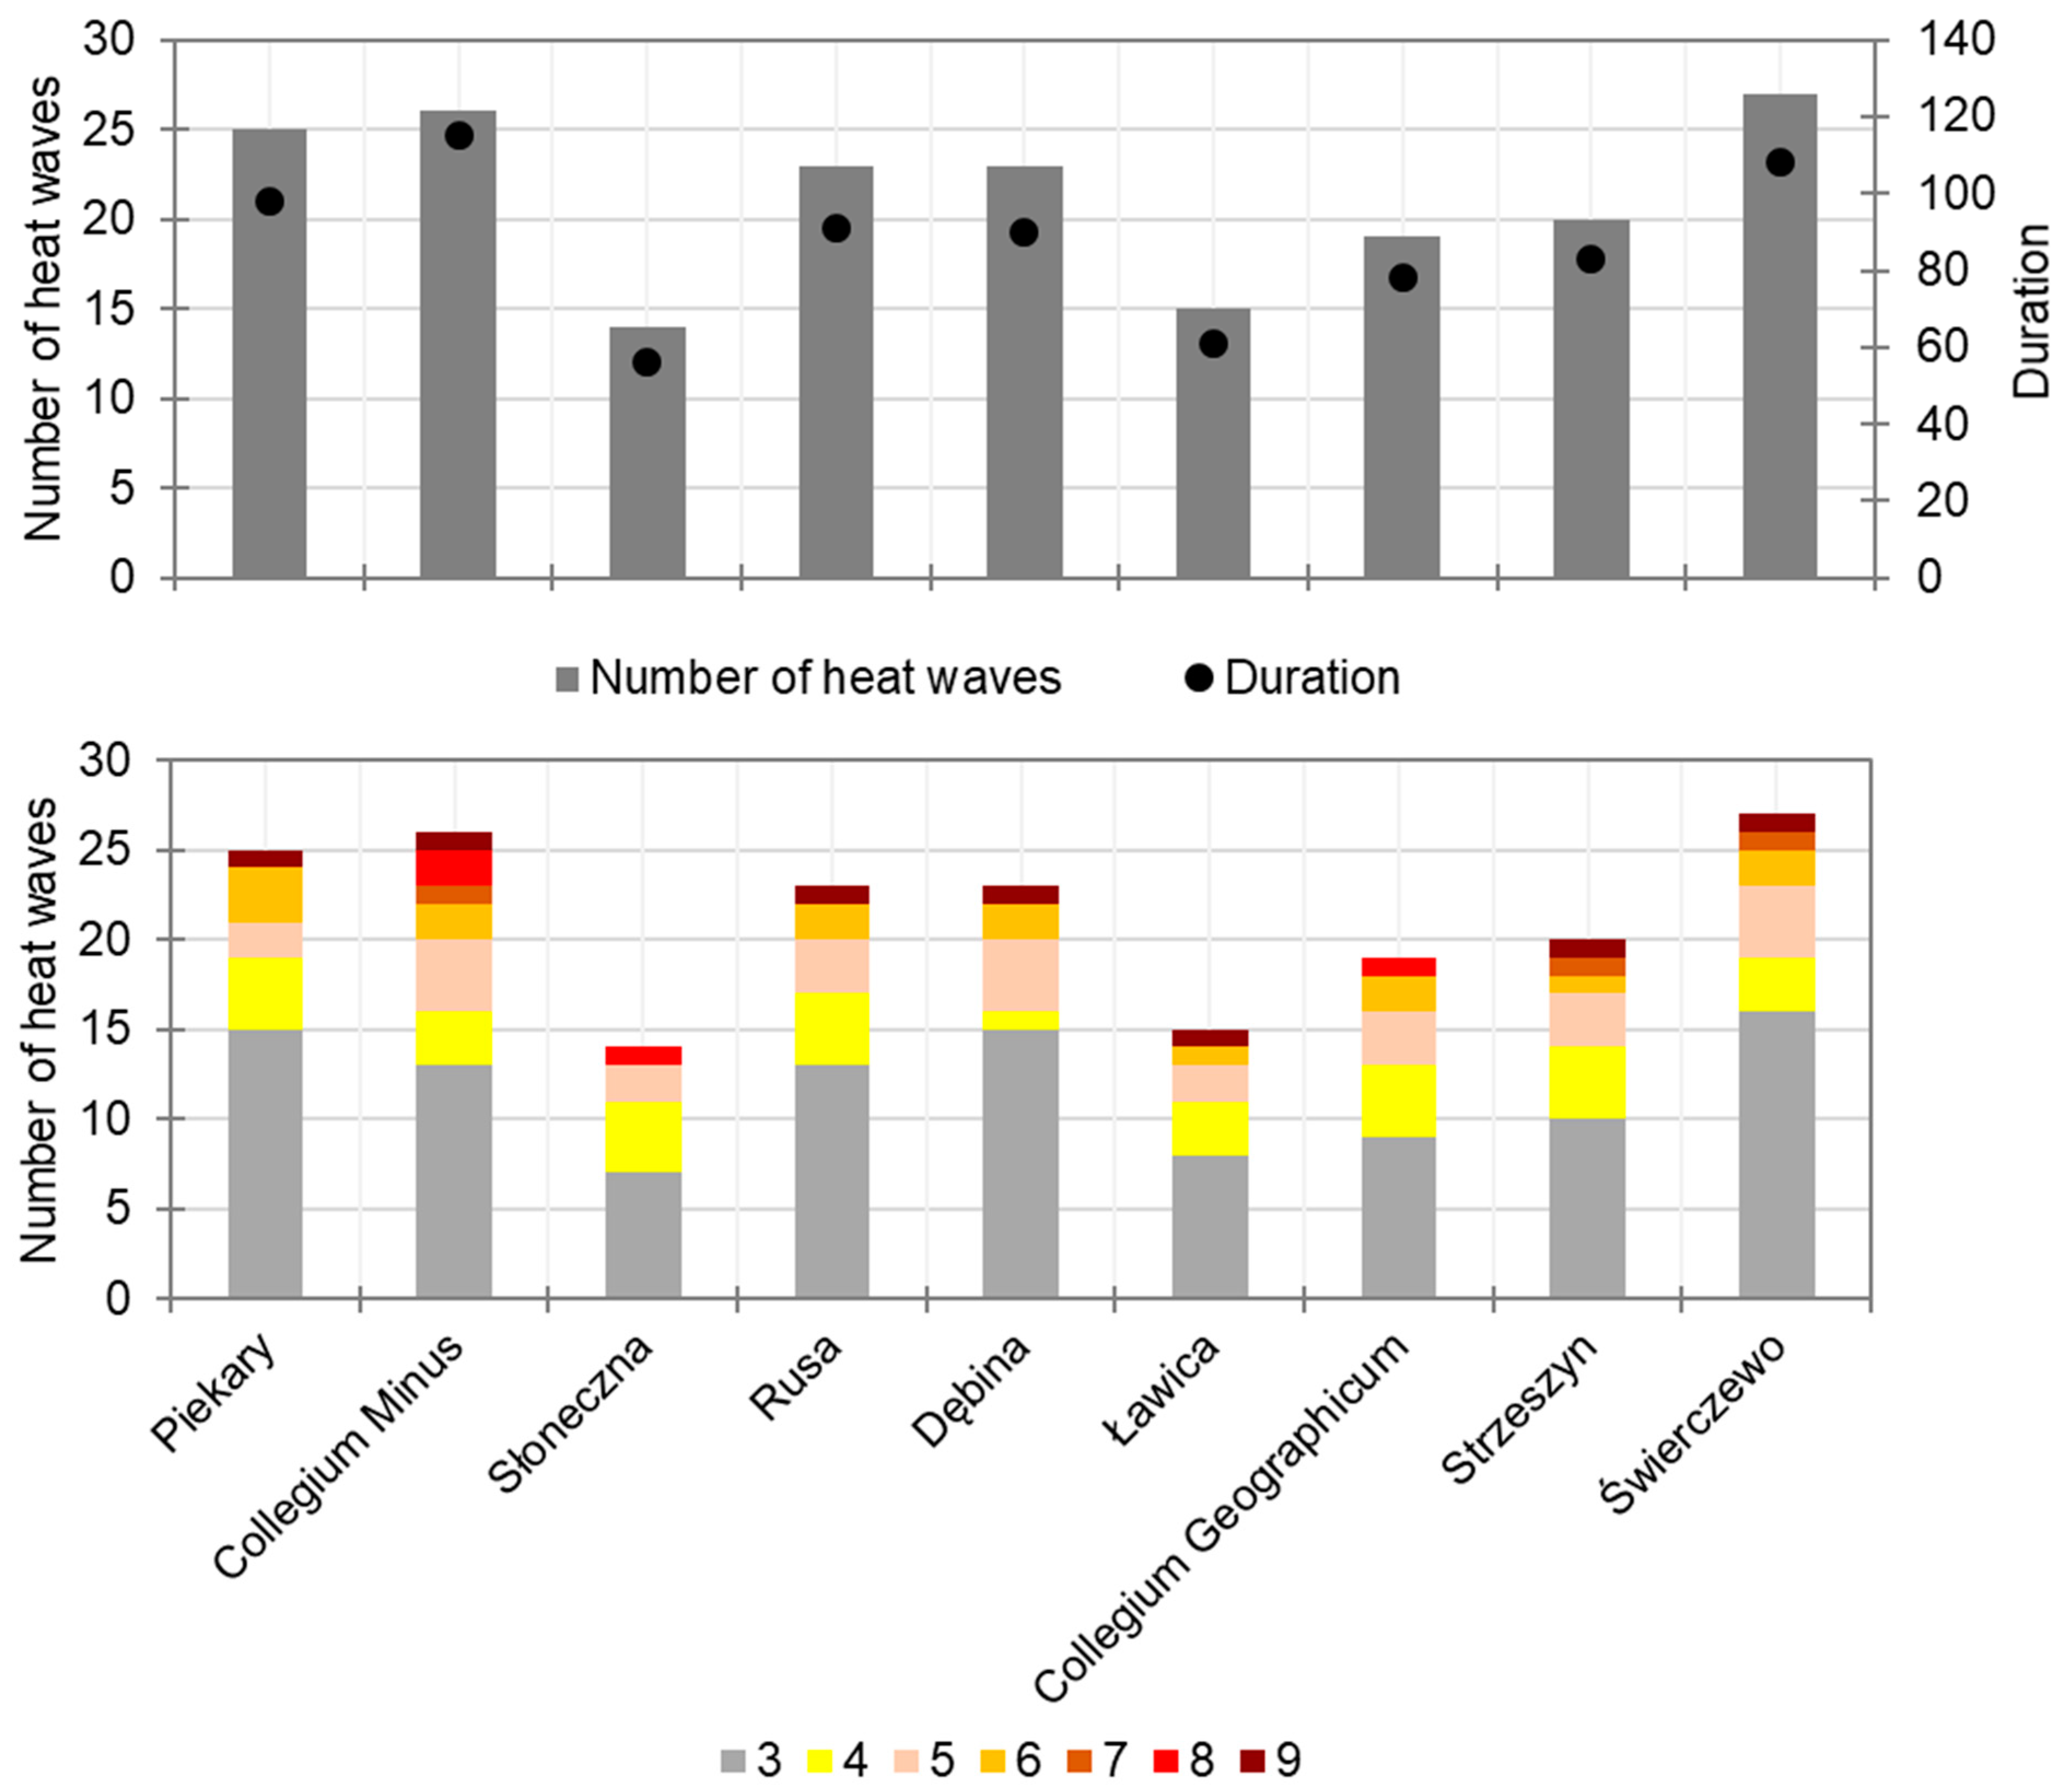
The occurrence of heat waves across the city was variable, like the occurrence of hot days alone. The highest number of heat waves was recorded in Świerczewo, with 27 occurrences lasting a total of 108 days, and one less was observed in the city center (i.e., in Piekary), with 26 occurrences, but with the longest total, at 115 days (Table 3, Figure 3). The average HW duration reached 4.4 days in Piekary. In other sites, it amounted to about 4 days. The lowest number of heat waves with the shortest total duration was recorded in Słoneczna (14 occurrences lasting for a total of 55 days). In the analyzed period, 12 heat waves were recorded simultaneously at all measurement points, although, in many cases, they differed in duration. In the remaining cases, heat waves occurred only at some of the measurement points. Moreover, four situations were recorded where the heat wave occurred at only one point, i.e., in 2015 (Świerczewo), 2016 (Świerczewo), 2019 (Collegium Minus), and 2019 (Świerczewo). In the study period, at all points, the most common type of heat waves by duration was usually the shortest, i.e., 3-day heat waves (Figure 3), accounting for a share from 47.4% of all waves at Collegium Geographicum to 65.2% of all waves in Dębina. At most points, 4- and 5-day waves were the next most frequent. At all points, the longest heat wave occurred in 2010. In Collegium Geographicum and Słoneczna, the wave began on 10 July, and in the remaining measurement points, it began one day earlier—on 9 July. The wave ended throughout the city on 17 July.
Table 3.
Characteristics of the occurrence of heat waves in Poznań in the years 2008–2022.

Figure 3.
Number and duration of heat waves (top diagram), and number of heat waves by duration (bottom diagram) in Poznań in the years 2008–2022.
3.2. Characteristics of Bioclimatic Conditions
In the period 2008–2022, the average HD in Poznań was 27.3 °C. At individual measurement points, the average value of the index varied from 25.3 °C in Ławica to 28.0 °C in Piekary (Table 4). Throughout the city, the lowest and highest average HD was recorded in the same seasons, namely, in 2008 (25.1 °C) and 2019 (30.0 °C), respectively. In the former season, the lowest values varied from 24.1 °C in Ławica to 25.4 °C in Piekary. In the latter season, the values were considerably higher and ranged from 27.5 °C in Ławica to 31.3 °C in Collegium Minus. In the study period, an increase in HD was determined, and it was statistically significant at all measurement points. The most intensive changes were recorded in Rusa, reaching 3.0 °C/decade.
Table 4.
Characteristics of biometeorological conditions in the summer in Poznań in the years 2008–2022.
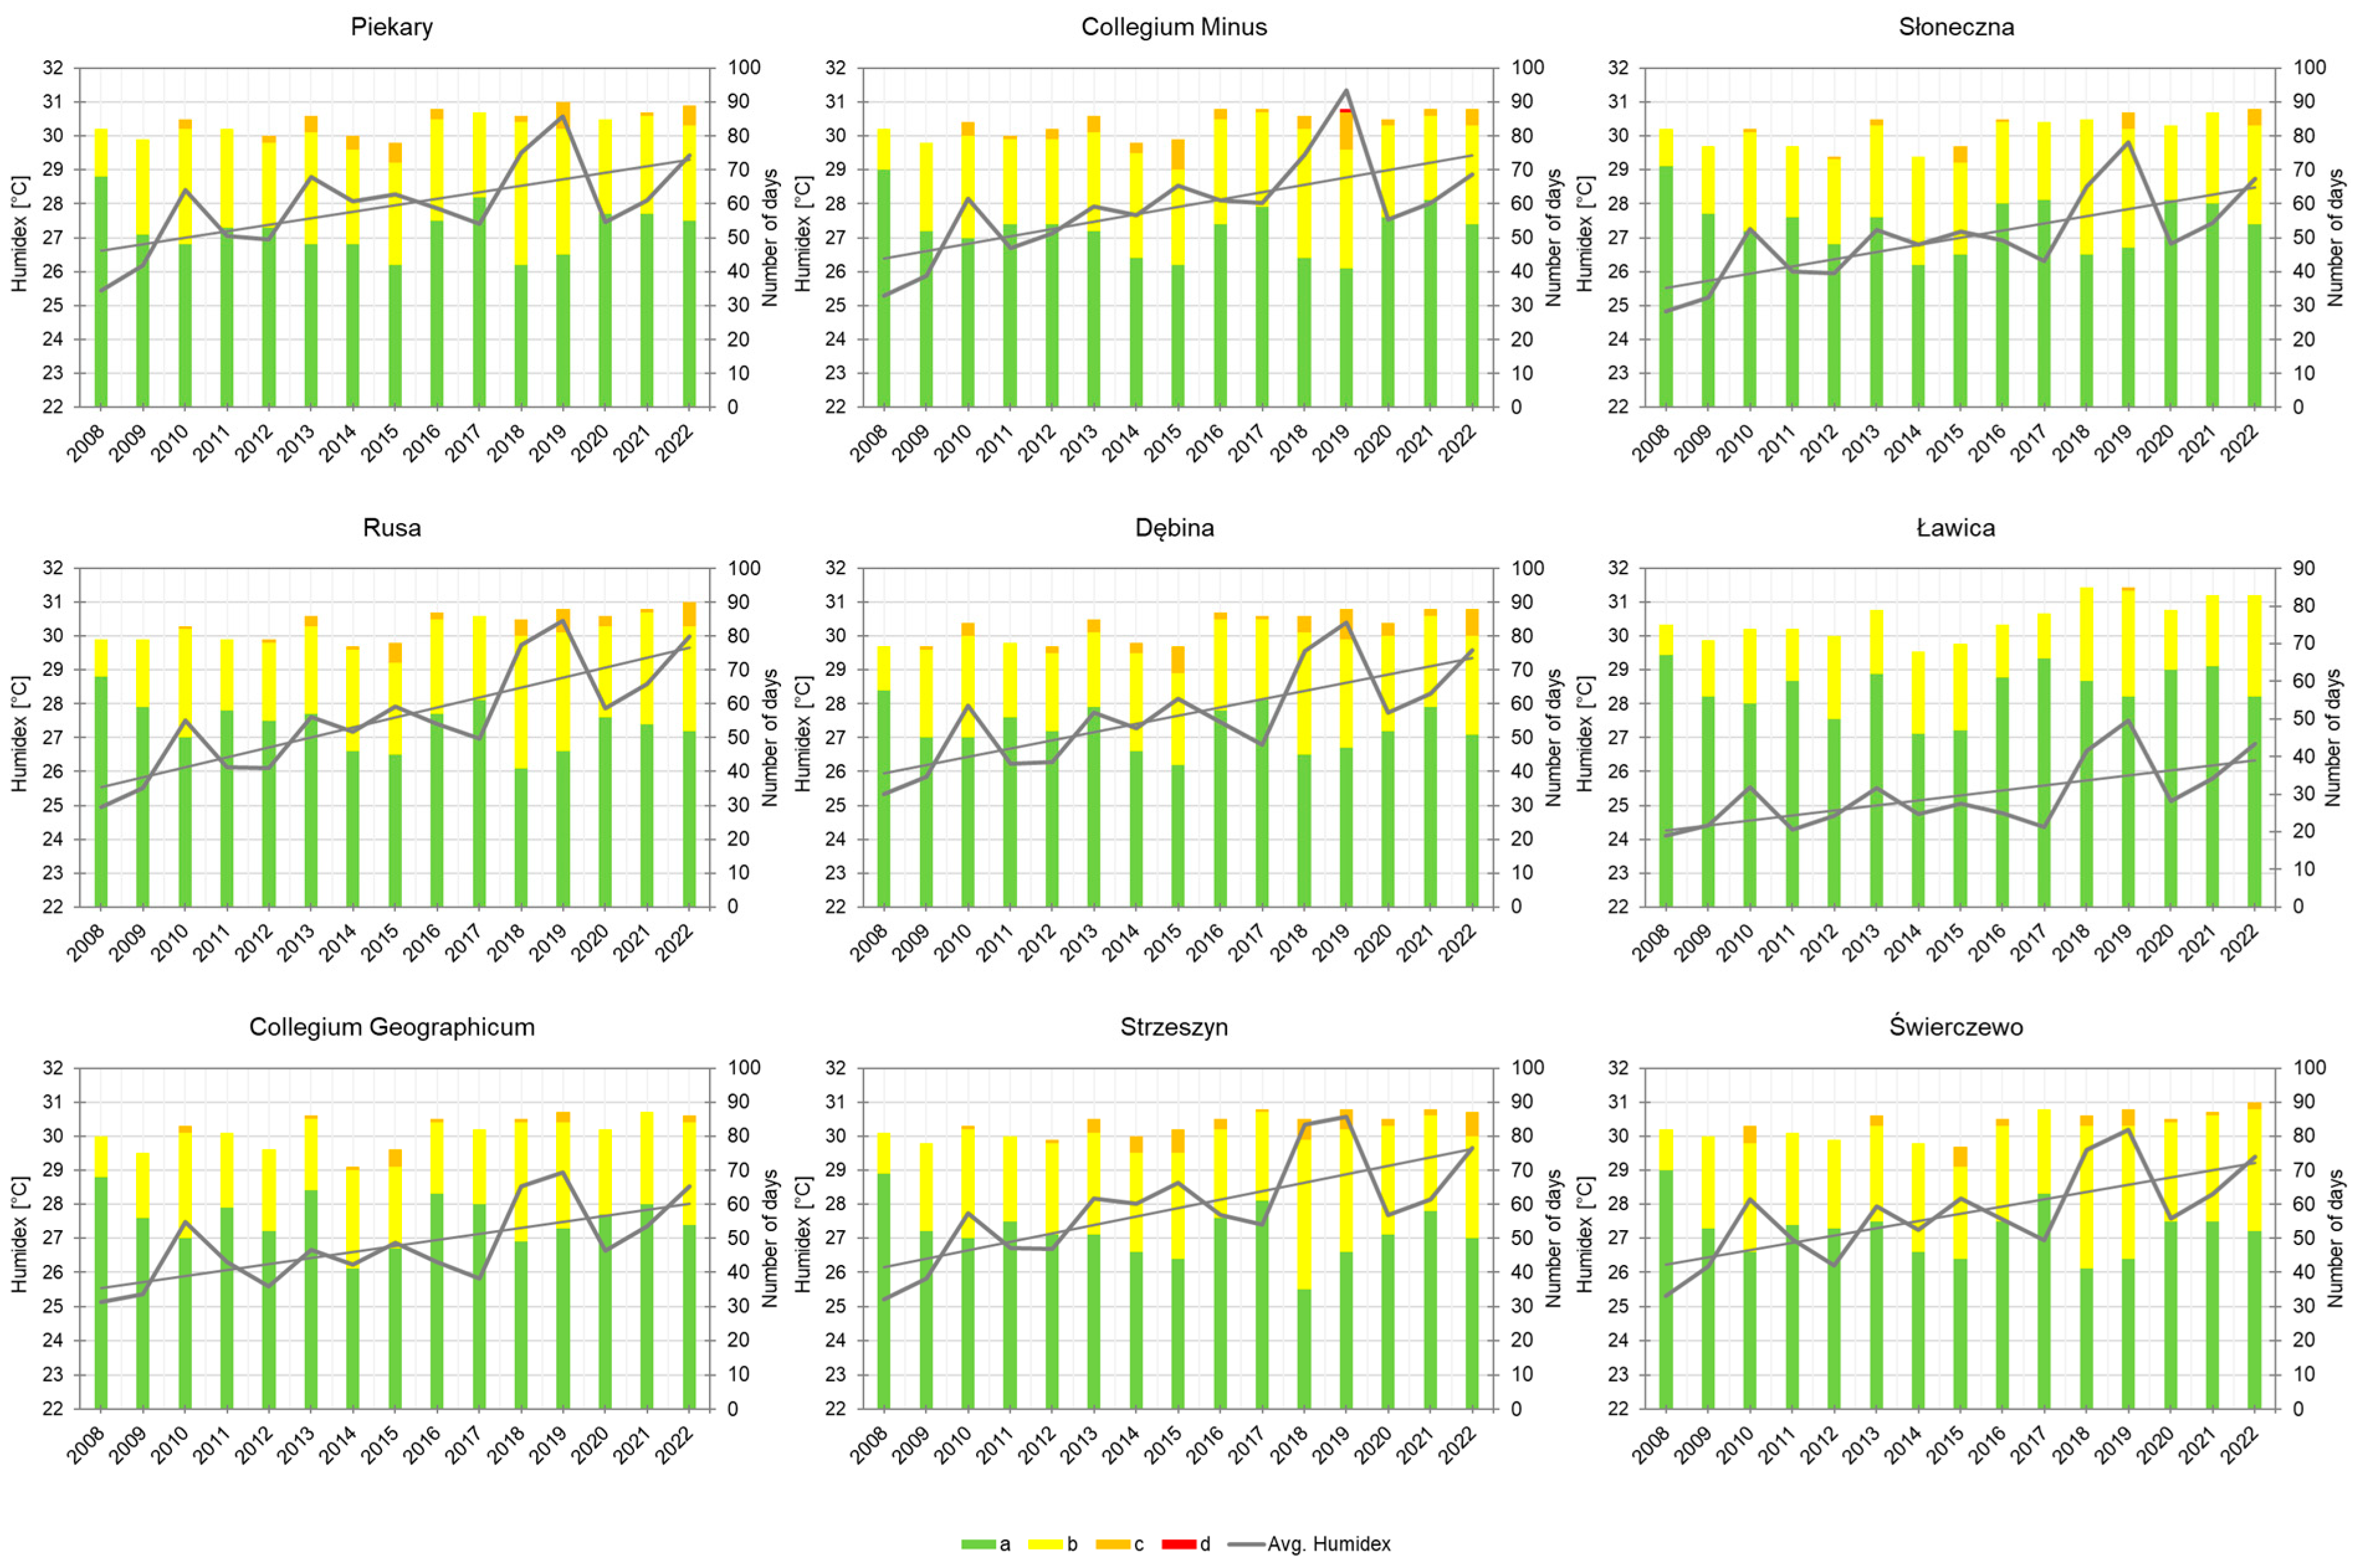
In the summer of the analyzed years, days with comfortable conditions were usually recorded (Figure 4). Such days constituted 56.2% in Strzeszyn up to 62.9% of all days in the season in Ławica. The share of days with slight discomfort was somewhat lower, ranging from 20.4% in Ławica to 32% of all days in the season in Świerczewo. Days with great discomfort occurred rarely, and their share in all days in the season varied from 0.1% in Ławica to 3.8% in Collegium Minus and Dębina. Only in Collegium Minus was a day with dangerous conditions in terms of discomfort recorded. The 2008 season stood out in the multiannual period. In that season, the highest number of comfortable days in a single season in the multiannual period was recorded across the city. Their share varied from 69.6% in Dębina to 77.2% in Słoneczna. In the same season, the lowest number of days with slight discomfort was recorded. Their share varied from 8.7% in Ławica to 15.2% in Piekary. No days with discomfort greater than slight were recorded at any of the measurement points. At particular measurement points, comfortable days were most seldom in one of the aforementioned seasons of 2014, 2015, 2018, or 2019. The smallest share of comfortable days ranged from 38.0% in Strzeszyn (2018) to 50.0% in Ławica (2014). Days with slight discomfort were recorded in the highest numbers (except for one measurement point) in 2018. In individual parts of the city, the highest share of the said days in the study period varied from 30.4% in Ławica (2019) to 47.8% in Strzeszyn (2018). Days with high discomfort were recorded considerably more seldom, and their highest number was observed in individual points in one of the following seasons: 2015, 2019, and 2022. Moreover, one day with dangerous discomfort was recorded in Collegium Minus in 2019.
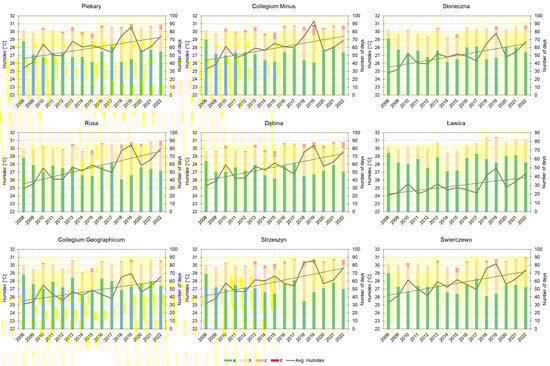
Figure 4.
Course of average HD (and trend line) and number of days in particular intervals of the HD (a—20.0–29.9 °C; b—30.0–39.9 °C; c—40.0–45.9 °C, d—46.0–54.0 °C) in the summer in Poznań in the years 2008–2022.
The average HD during the recorded heat waves in Poznań was 37.7 °C, and, at particular measurement points, it varied from 34.8°C in Ławica to 38.8°C in Dębina (Table 5). Equally high values (≥38.0 °C) were observed in Strzeszyn, Rusa, Piekary, and Collegium Minus. At all measurement points, a heat wave with the lowest average index value was confirmed in July 2008. During that heat wave, the average HD varied from 31.8 °C in Ławica to 33.8 °C in Dębina. At eight out of nine measurement points, a heat wave with the highest average index value occurred in August 2015. At particular measurement points, the value varied from 36.7 °C in Ławica to 42.8°C in Dębina. The highest HD values on individual days comprising heat waves were considerably higher and varied from 38.7 °C in Ławica (8 August 2015) to 46.0 °C in Collegium Minus (26 June 2019).
Table 5.
Characteristics of biometeorological conditions during heat waves in Poznań in the years 2008–2022.
During heat waves, days with slight discomfort were primarily recorded (Figure 5). The share of such days varied from 61.1% in Dębina to 96.7% in Ławica. The share of days with great discomfort was lower, ranging from 0% in Ławica to 38.9% in Dębina. At three measurement points (Collegium Minus, Collegium Geographicum, and Ławica), comfortable days were recorded during heat waves, and at one point (Collegium Minus), a day with dangerous conditions was recorded.
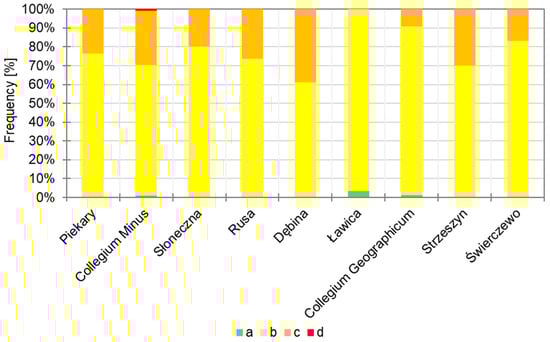
Figure 5.
Frequency of occurrence of days in particular intervals of the HD (a—20.0–29.9 °C; b—30.0–39.9 °C; c—40.0–45.9 °C, d—46.0–54.0 °C) during heat waves in Poznań in the years 2008–2022.
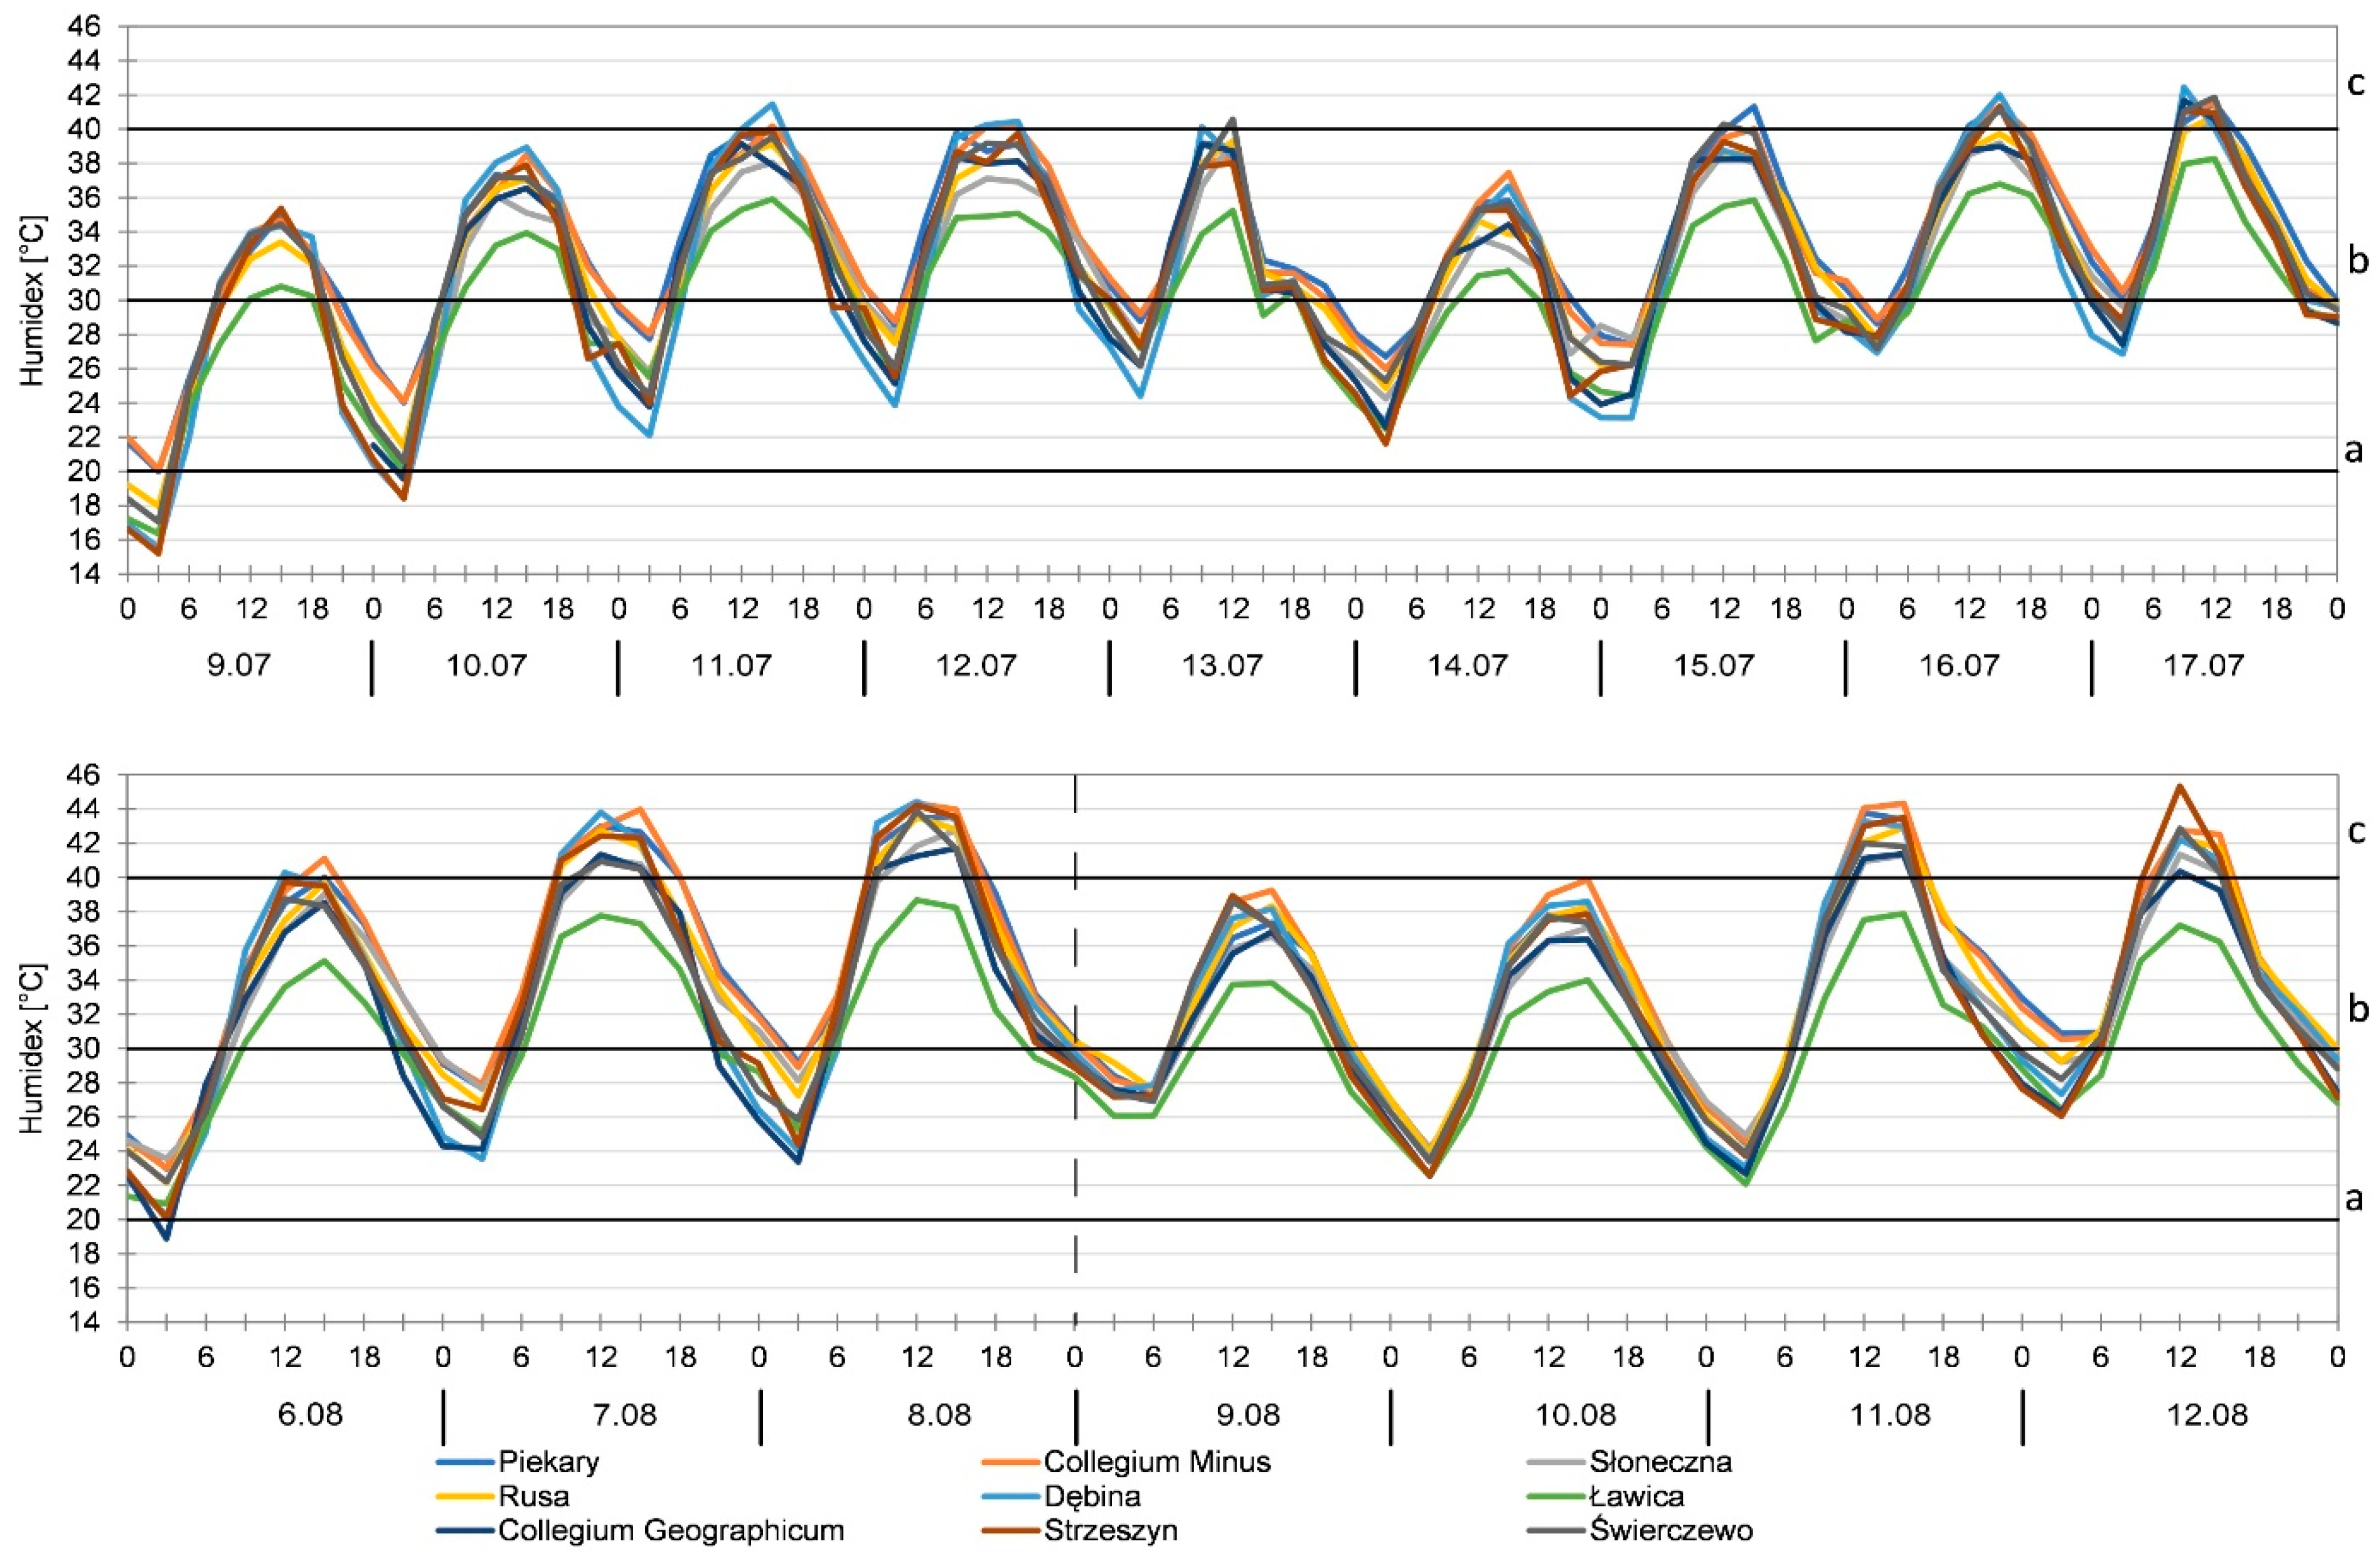
A detailed analysis was performed for two heat waves, namely, the longest wave in the analyzed multiannual period and the wave with the highest average HD. The former heat wave began on 9 July at all but two measurement points and ended everywhere on 17 July (Figure 6). At those two points (Collegium Geographicum and Słoneczna), it started one day later, on 10 July. The average Tmax for the wave varied from 32.3 °C in Ławica to 33.8 °C in Piekary. At most points, the highest Tmax was recorded on 12 July. The average HD for the wave ranged from 34.5 °C in Ławica to 38.5 °C in Świerczewo. At all measurement points, by day, conditions with slight and great discomfort were recorded. By night, the conditions were milder and corresponded with comfortable conditions. Only on 9 and 10 July in some parts of the city did HD values remain below comfortable conditions. At eight out of nine measurement points, the highest index value was recorded on the last day of the heat wave, i.e., 17 July, mostly at 12:00 UTC. At that time, the values varied from 38.3 °C in Ławica to 41.9 °C in Świerczewo. The airport station stood out in the city for having recorded the lowest daytime HD values throughout the heat wave.
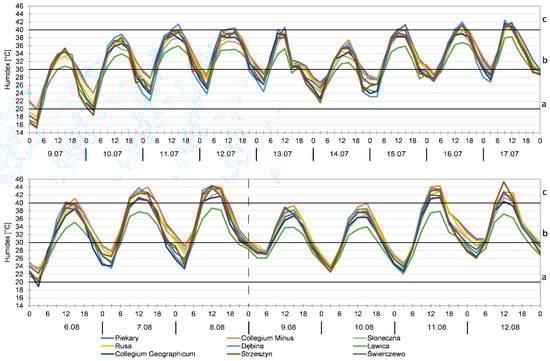
Figure 6.
Course of HD (a—20.0–29.9 °C; b—30.0–39.9 °C; c—40.0–45.9 °C) during the heat wave in 2010 (the longest heat wave) and 2015 (the heat wave with the highest average the HD).
The second of the analyzed heat waves was characterized by the highest average HD (in eight out of nine measurement points). The wave started on 6 August and lasted until 8 August, and at three points (Collegium Minus, Strzeszyn, and Świerczewo), it lasted until 12 August (Figure 6). The average Tmax for this heat wave ranged from 33.8 °C in Strzeszyn to 35.3 °C in Collegium Geographicum and Piekary. The highest Tmax was recorded on August 8, varying from 36.8 °C in Słoneczna to 38.0 °C in Świerczewo. The average HD for this wave changed from 36.7 °C in Ławica to 42.8 °C in Dębina. At all measurement points by day, conditions with slight and great discomfort were recorded. By night, however, conditions were milder and corresponded to comfortable conditions. The situation was slightly different on the night of 11 to 12 August in Collegium Minus and Piekary, where HD values remained in the range of slight discomfort. At seven out of eight measurement points, the highest index values were recorded on 8 August at 12:00 or 15:00 UTC. The highest value was recorded in Dębina, reaching 44.4 °C at 12:00 UTC. Meanwhile, in Strzeszyn, the highest HD value was 45.3 °C on 12 August at 12:00 UTC. As mentioned, at three points, the heat wave lasted seven days, while at other points, it was divided into two waves, which was associated with the cooling recorded on 9 August. In these points, Tmax fell below 30.0 °C. This situation was caused by the passage of a cold atmospheric front over Poland on 9 August and the advection of polar maritime air. Previously, tropical air masses remained over the studied area.
4. Discussion
Despite the growing number of studies on urban climate, there is still a lack of comprehensive research assessing both air temperature and bioclimatic conditions at the local climate scale [75]. The impact of LULC on the city’s local climate, as defined by LCZ, is evident in various aspects. Primarily, studies based on stationary and mobile measurements indicate a clear correlation between air temperature and individual LCZ classes [74,85,86]. With increasing building density, air temperature rises, leading to higher values in compact LCZs compared to other classes [34,87,88]. This study demonstrated analogous relationships. Furthermore, the obtained results show maximum average Tmax values in the city center’s most highly urbanized areas (represented in Poznań by the Collegium Minus and Piekary sites) and the minimum average Tmax values in the green areas distant from the city center (represented by Słoneczna), which are consistent with previous studies from Poznań [30,31,33] and other cities in Poland such as Kraków [89] and Warszawa [90]. The cooling effect of vegetation has also been found in other cities [91,92,93]. This effect results from the difference in energy balance in green areas compared to anthropogenic surfaces and has become fundamental in the development of urban cooling strategies in recent years [94]. Among these strategies, two have gained significant recognition and are currently being implemented in numerous cities. These strategies involve increasing urban reflectivity and enhancing urban vegetation. Both approaches aim to address a key factor contributing to specific urban climate phenomena, particularly the UHI effect [91]. This factor relates to the tendency of urban materials to possess properties that lead to elevated temperatures, including lower moisture contents, diminished thermal roughness lengths, and reduced surface albedos. The first strategy, by boosting the reflectivity of urban surfaces, effectively redirects solar radiation away, preventing its conversion into heat. In the second strategy, the proliferation of vegetation facilitates enhanced evapotranspiration, converting absorbed solar radiation into latent heat rather than sensible heat.
The extent and distribution of LCZ resulting from LULC govern the size and magnitude of the air and surface urban heat island, which, in turn, significantly influence various aspects of the urban environment, such as energy consumption, pollution, phenological phases, snow cover, human health, and bioclimatic conditions [75,95]. Most studies indicate that heat waves favor more intensified outdoor thermal discomfort in urban areas due to the CLUHI effect [48]. As evidenced by Półrolniczak et al. [32], the CLUHI phenomenon is common in Poznań. The authors showed that summer is the most favorable season for the formation of CLUHI, and under appropriate conditions, CLUHI exceeded 4 °C, sometimes reaching nearly 7 °C. As shown by satellite images, the variation in thermal conditions during selected days of heat waves was significant [30]. As shown in this research, during heat waves, the highest air temperature was recorded in heavily transformed parts of the city, i.e., in the built-up city center with industrial, commercial, and communication areas, while the lowest air temperature was characteristic of natural areas such as dense trees and areas with low vegetation. Particularly noteworthy was the summer of 2019, during which the highest average seasonal Tmax was recorded in all measurement points. This season stood out for its extreme thermal conditions [8,96,97] as well as biometeorological conditions [98] in Poland and Central Europe. June was particularly notable during that summer. Sulikowska and Wypych [8], based on reports from local meteorological services, showed that, in this month, many places registered record-breaking values of maximum air temperature in June, such as Spain, Germany, Poland, and the Czech Republic. The same was true of the 2015 season, which was pointed out in this study as exceptionally hot in Poznań, with one of the most powerful heat waves in this region in recent decades having been observed. In Poland, this particularly affected the central and southern regions of the country [99,100,101]. Due to the prevalence and wide scope of heat waves, it is also essential to emphasize the significance of vegetation in cities. As indicated by our research, the absolute maximum Tmax during the hottest heat wave in 2019 in areas with a significant presence of vegetation may be as much as 1.5 °C lower. Furthermore, in the future, these differences will be even more pronounced due to the considerably greater Tmax trend in densely built-up areas. In conclusion, the earlier formulated conclusions regarding the importance of vegetation in urbanized areas can be confirmed, and we can additionally highlight the growing significance of vegetation for climate improvement and the mitigation of climate effects in the city.
Biometeorological conditions in Poznań determined based on the HD also showed temporal and spatial variability. During the summer, in general, the most common were comfortable days, followed by days with slight and significant discomfort. The lowest average HD was recorded in the 2008 season, and the highest average HD was recorded in 2019. The 2019 season stood out in the multiannual period in terms of various biometeorological indices such as the Universal Thermal Climate Index (UTCI) [98] and the Physiologically Equivalent Temperature (PET) [102].
During heat waves, biometeorological conditions deteriorate significantly. Their spatial pattern was similar to thermal conditions, and days with slight discomfort were most frequently recorded in all LCZs. According to earlier studies [100,103,104] based on other biometeorological indices (UTCI, PET), during heat waves in this part of Europe, days with strong and very strong/extreme heat stress were most commonly recorded.
The city center is characterized by bioclimatic conditions causing great discomfort during the extremely hot summer days. Such conditions pose a significant burden on the human body. According to the study by Gabriel and Endlicher [23], an increase in mortality during extreme heat waves (1994, 2006) was observed in Berlin and Brandenburg in areas with dense construction, where biometeorological conditions were extremely unfavorable due to heat stress. Current research has shown that the elderly are most at risk under these conditions, and in these age groups, the highest percentage of additional deaths was recorded in many regions of Europe during heat waves [1,2,23,26,105].
5. Conclusions
The conducted research showed variability of thermal and bioclimatic conditions across the city of Poznań. The average Tmax was highest in the city center, in areas with dense urban development, whereas it was lowest in areas further from the center, with loose infrastructure and a significant proportion of green spaces. There was a similar pattern of spatial variation in bioclimatic conditions during heat waves in Poznań, expressed by the combined thermal/humidity heat-stress index (HD). The occurrence of heat waves themselves was both temporally and spatially variable across the city; however, their longest total duration was recorded in the city center.
In terms of both Tmax and the HD, biometeorological conditions were most burdensome in the areas of the city that are most urbanized and most heavily transformed by human activity. In such places, during the ongoing heat waves, many days with conditions causing great bioclimatic discomfort were recorded. In the exceptionally hot summer of 2019, there was even one day with dangerous biometeorological conditions in the Poznań city center. Biometeorological conditions are safer, even during severe heat waves, in the outskirts of the city and in its green areas.
The increase in the frequency of heat waves, combined with an aging society, will require appropriate actions to improve cities’ architecture by increasing the share of green areas and the protection of the most vulnerable social groups from adverse biometeorological conditions. Moreover, further research on the local climate is essential, as individual LCZs in the city may exhibit distinct thermal and biothermal conditions. These conditions can vary among LCZs of the same type due to differences in their locations (distance from the center) or immediate proximity to another LCZ. This aspect remains relatively under-researched and requires further analysis in future studies.
Author Contributions
Conceptualization, A.M.T., M.P. and E.B.; methodology, A.M.T., M.P. and E.B.; formal analysis, A.M.T. and M.P.; investigation, A.M.T. and M.P.; writing—original draft preparation, A.M.T., M.P. and E.B.; writing—review and editing, A.M.T., M.P. and E.B.; visualization, A.M.T. and M.P. All authors have read and agreed to the published version of the manuscript.
Funding
This work was supported by the National Science Centre, Poland (grant number UMO-2020/37/B/ST10/00217).
Institutional Review Board Statement
Not applicable.
Informed Consent Statement
Not applicable.
Data Availability Statement
The data presented in this study are available on request from the corresponding author. The data are not publicly available due to the data are part of an ongoing study.
Conflicts of Interest
The authors declare no conflicts of interest.
References
- Michelozzi, P.; de Donato, F.; Accetta, G.; Forastiere, F.; D’Ovidio, M.; Perucci, C.; Kalkstein, L.S. Impact of heat waves on mortality—Rome, Italy, June–August 2003. Morb. Mortal. Wkly. Rep. 2004, 53, 369–371. [Google Scholar]
- Vandentorren, S.; Suzan, R.; Medina, S.; Pascal, M.; Maulpoix, A.; Cohen, J.C.; Ledrans, M. Mortality in 13 French Cities During the August 2003 Heat Wave. Am. J. Public Health 2004, 94, 1518–1520. [Google Scholar] [CrossRef] [PubMed]
- Grumm, R.H. The Central European and Russian heat event of July—August 2010. Bull. Am. Meteorol. Soc. 2011, 92, 1285–1296. [Google Scholar] [CrossRef]
- Otto, F.E.L.; Massey, N.; Van Oldenborgh, G.J.; Jones, R.G.; Allan, M.R. Reconciling two approaches to attribution of the 2010 Russian heat wave. Geophys. Res. Lett. 2012, 39, L04702. [Google Scholar] [CrossRef]
- WMO Report. Available online: https://library.wmo.int/records/item/57564-wmo-atlas-of-mortality-and-economic-losses-from-weather-climate-and-water-extremes-1970-2019 (accessed on 10 November 2023).
- Barriopedro, D.; Fischer, E.M.; Luterbacher, J.; Trigo, R.M.; García-Herrera, R. The hot summer of 2010: Redrawing the temperature record map of Europe. Science 2011, 332, 220–224. [Google Scholar] [CrossRef] [PubMed]
- Hoy, A.; Hänsel, S.; Maugeri, M. An endless summer: 2018 heat episodes in Europe in the context of secular temperature variability and change. Int. J. Climatol. 2020, 40, 6315–6336. [Google Scholar] [CrossRef]
- Sulikowska, A.; Wypych, A. How Unusual Were June 2019 Temperatures in the Context of European Climatology? Atmosphere 2020, 11, 697. [Google Scholar] [CrossRef]
- Tomczyk, A.M.; Bednorz, E. The extreme year—analysis of thermal conditions in Poland in 2018. Theor. Appl. Climatol. 2020, 139, 251–260. [Google Scholar] [CrossRef]
- Yiou, P.; Cattiaux, J.; Faranda, D.; Kadygrov, N.; Jézéquel, A.; Naveau, P.; Ribes, A.; Robin, Y.; Thao, S.; van Oldenborgh, G.J.; et al. Analyses of the Northern European summer heatwave of 2018. Bull. Am. Meteorol. Soc. 2020, 101, S35–S40. [Google Scholar] [CrossRef]
- Zahradníček, P.; Brázdil, R.; Štěpánek, P.; Trnka, M. Reflections of global warming in trends of temperature characteristics in the Czech Republic, 1961–2019. Int. J. Climatol. 2021, 41, 1211–1229. [Google Scholar] [CrossRef]
- Lhotka, O.; Kyselý, J. The 2021 European Heat Wave in the Context of Past Major Heat Waves. Earth Space Sci. 2022, 9, e2022EA002567. [Google Scholar] [CrossRef]
- Available online: https://www.worldbank.org/en/topic/urbandevelopment/overview (accessed on 10 November 2023).
- Niedźwiedź, T. (Ed.) Dictionary of Meteorology; Polish Geophysical Society; IMGW: Warszawa, Poland, 2003; p. 495. [Google Scholar]
- Błażejczyk, A.; Błażejczyk, K.; Baranowski, J.; Kuchcik, M. Heat stress mortality and desired adaptation responses of healthcare system in Poland. Int. J. Biometeorol. 2018, 62, 307–318. [Google Scholar] [CrossRef] [PubMed]
- Naumann, G.; Russo, S.; Formetta, G.; Ibarreta, D.; Forzieri, G.; Girardello, M.; Feyen, L. Global Warming and Human Impacts of Heat and Cold Extremes in the EU; Publications Office of the European Union: Luxembourg, 2020. [Google Scholar]
- Borg, M.A.; Xiang, J.; Anikeeva, O.; Pisaniello, D.; Hansen, A.; Zander, K.; Dear, K.; Sim, M.R.; Bi, P. Occupational heat stress and economic burden: A review of global evidence. Environ. Res. 2021, 195, 110781. [Google Scholar] [CrossRef] [PubMed]
- Lorencová, E.K.; Whitham, C.E.L.; Bašta, P.; Harmáčková, Z.V.; Štěpánek, P.; Zahradníček, P.; Farda, A.; Vačkář, D. Participatory climate change impact assessment in three Czech cities: The case of heatwaves. Sustainability 2018, 10, 1906. [Google Scholar] [CrossRef]
- Zhang, Y.; Ayyub, B.M. Urban Heat Projections in a Changing Climate: Washington, DC, Case Study. ASCE-ASME J. Risk Uncertain. Eng. Syst. Part A Civ. Eng. 2018, 4, 04018032. [Google Scholar] [CrossRef]
- Oke, T.R.; Mills, G.; Christen, A.; Voogt, J.A. Urban Climates; Cambridge University Press: Cambridge, UK, 2017. [Google Scholar]
- IPCC. Climate Change 2021: The Physical Science Basis. Contribution of Working Group I to the Sixth Assessment Report of the Intergovernmental Panel on Climate Change; IPCC: Geneva, Switzerland, 2021. [Google Scholar]
- Zhang, G.; Zeng, G.; Liang, X.Z.; Huang, C. Increasing heat risk in China’s urban agglomerations. Environ. Res. Lett. 2021, 16, 064073. [Google Scholar] [CrossRef]
- Gabriel, K.M.A.; Endlicher, W.R. Urban and rural mortality rates during heat waves in Berlin and Brandenburg, Germany. Environ. Pollut. 2011, 159, 2044–2050. [Google Scholar] [CrossRef] [PubMed]
- Heaviside, C.; Vardoulakis, S.; Cai, X.M. Attribution of mortality to the urban heat island during heatwaves in the West Midlands, UK. Environ. Health 2016, 15, 49–59. [Google Scholar] [CrossRef]
- Wouters, H.; De Ridder, K.; Poelmans, L.; Willems, P.; Brouwers, J.; Hosseinzadehtalaei, P.; Tabari, H.; Vanden Broucke, S.; van Lipzig, N.P.M.; Demuzere, M. Heat stress increase under climate change twice as large in cities as in rural areas: A study for a densely populated midlatitude maritime region. Geophys. Res. Lett. 2017, 44, 8997–9007. [Google Scholar] [CrossRef]
- Graczyk, D.; Kundzewicz, Z.W.; Choryński, A.; Førland, E.J.; Pińskwar, I.; Szwed, M. Heat-related mortality during hot summers in Polish cities. Theor. Appl. Climatol. 2019, 136, 1259–1273. [Google Scholar] [CrossRef]
- Lhotka, O.; Kyselý, J.; Farda, A. Climate change scenarios of heat waves in Central Europe and their uncertainties. Theor. Appl. Climatol. 2018, 131, 1043–1054. [Google Scholar] [CrossRef]
- Junk, J.; Goergen, K.; Krein, A. Future heat waves in different European capitals based on climate change indicators. Int. J. Environ. Res. Public Health 2019, 19, 3959. [Google Scholar] [CrossRef] [PubMed]
- Tomczyk, A.M.; Piniewski, M.; Eini, M.R.; Bednorz, E. Projections of changes in maximum air temperature and hot days in Poland. Int. J. Climatol. 2022, 42, 5242–5254. [Google Scholar] [CrossRef]
- Półrolniczak, M.; Tomczyk, A.M.; Kolendowicz, L. Thermal Conditions in the City of Poznań (Poland) during Selected Heat Waves. Atmosphere 2018, 9, 11. [Google Scholar] [CrossRef]
- Tomczyk, A.M.; Półrolniczak, M.; Kolendowicz, L. Cold Waves in Poznań (Poland) and Thermal Conditions in the City during Selected Cold Waves. Atmosphere 2018, 9, 208. [Google Scholar] [CrossRef]
- Półrolniczak, M.; Kolendowicz, L.; Majkowska, A.; Czernecki, B. The influence of atmospheric circulation on the intensity of urban heat island and urban cold island in Poznań, Poland. Theor. Appl. Climatol. 2017, 127, 611–625. [Google Scholar] [CrossRef]
- Majkowska, A.; Kolendowicz, L.; Półrolniczak, M.; Hauke, J.; Czernecki, B. The urban heat island in the city of Poznań as derived from Landsat 5 TM. Theor. Appl. Climatol. 2017, 128, 769–783. [Google Scholar] [CrossRef]
- Leconte, F.; Bouyer, J.; Claverie, R.; Pétrissans, M. Using Local Climate Zone scheme for UHI assessment: Evaluation of the method using mobile measurements. Build. Environ. 2015, 83, 39–49. [Google Scholar] [CrossRef]
- Loridan, T.; Grimmond, C. Characterisation of energy flux partitioning in urban environments: Links with surface seasonal properties. J. Appl. Meteorol. Climatol. 2012, 51, 219–241. [Google Scholar] [CrossRef]
- Oke, T. Initial Guidance to Obtain Representative Meteorological Observations at Urban Sites; World Meteorological Organization: Geneva, Switzerland, 2004; Volume 81. [Google Scholar]
- Stewart, I.; Oke, T. Local Climate Zones for urban temperature studies. Bull. Am. Meteorol. Soc. 2012, 93, 1879–1900. [Google Scholar] [CrossRef]
- Ardiyansyah, A.; Munir, A.; Gabric, A. The Utilization of Land Surface Temperature Information as an Input for Coastal City. IOP Conf. Ser. Earth Environ. Sci. 2021, 921, 012004. [Google Scholar] [CrossRef]
- Cao, Q.; Huang, H.; Hong, Y.; Huang, X.; Wang, S.; Wang, L.; Wang, L. Modeling intra-urban differences in thermal environments and heat stress based on local climate zones in central Wuhan. Build. Environ. 2022, 225, 109625. [Google Scholar] [CrossRef]
- Xiang, Y.; Cen, Q.; Peng, C.; Huang, C.; Wu, C.; Teng, M.; Zhou, Z. Surface urban heat island mitigation network construction utilizing source-sink theory and local climate zones. Build. Environ. 2023, 243, 110717. [Google Scholar] [CrossRef]
- Cilek, M.U.; Cilek, A. Analyses of land surface temperature (LST) variability among local climate zones (LCZs) comparing Landsat-8 and ENVI-met model data. Sustain. Cities Soc. 2021, 69, 102877. [Google Scholar] [CrossRef]
- Zhao, Z.; Sharifi, A.; Dong, X.; Shen, L.; He, B.J. Spatial variability and temporal heterogeneity of surface urban heat island patterns and the suitability of local climate zones for land surface temperature characterization. Remote Sens. 2021, 13, 4338. [Google Scholar] [CrossRef]
- Mushore, T.D.; Mutanga, O.; Odindi, J. Determining the Influence of Long Term Urban Growth on Surface Urban Heat Islands Using Local Climate Zones and Intensity Analysis Techniques. Remote Sens. 2022, 14, 2060. [Google Scholar] [CrossRef]
- Bechtel, B.; Alexander, P.J.; Böhner, J.; Ching, J.; Conrad, O.; Feddema, J.; Mills, G.; See, L.; Stewart, I. Mapping Local Climate Zones for a Worldwide Database of the Form and Function of Cities. ISPRS Int. J. Geo-Inf. 2015, 4, 199–219. [Google Scholar] [CrossRef]
- Oliveira, A.; Lopes, A.; Niza, S. Local climate zones classification method from Copernicus land monitoring service datasets: An ArcGIS-based toolbox. MethodsX 2020, 7, 101150. [Google Scholar] [CrossRef] [PubMed]
- Oliveira, A.; Lopes, A.; Niza, S. Local climate zones in five southern European cities: An improved GIS-based classification method based on Copernicus data. Urban Clim. 2020, 33, 100631. [Google Scholar] [CrossRef]
- Demuzere, M.; Kittner, J.; Bechtel, B. LCZ Generator: A Web Application to Create Local Climate Zone Maps. Front. Environ. Sci. 2021, 9, 637455. [Google Scholar] [CrossRef]
- Janků, Z.; Dobrovolný, P. Heat Waves Amplify the Urban Canopy Heat Island in Brno, Czechia. Meteorology 2022, 1, 477–494. [Google Scholar] [CrossRef]
- Yi, C.; Kwon, H.G.; Yang, H. Spatial temperature differences in local climate zones of Seoul metropolitan area during a heatwave. Urban Clim. 2022, 41, 101012. [Google Scholar] [CrossRef]
- Golbabaei, F.; Heidari, H.; Shamsipour, A. The assessment of thermal conditions using humidex in different weather conditions: A case in different climates of Iran. J. Health Sci. Surveill. Syst. 2021, 9, 127–134. [Google Scholar]
- Scoccimarro, E.; Fogli, P.G.; Gualdi, S. The role of humidity in determining scenarios of perceived temperature extremes in Europe. Environ. Res. Lett. 2017, 12, 114029. [Google Scholar] [CrossRef]
- Středová, H.; Středa, T.; Litschmann, T. Smart tools of urban climate evaluation for smart spatial planning. Morav. Geogr. Rep. 2015, 23, 47–57. [Google Scholar] [CrossRef]
- Giannopoulou, K.; Livada, I.; Santamouris, M. The influence of air temperature and humidity on human thermal comfort over the greater Athens area. Sustain. Cities Soc. 2014, 10, 184–194. [Google Scholar] [CrossRef]
- Mekis, É.; Vincent, L.A.; Shephard, M.W.; Xuebin, Z. Observed trends in severe weather conditions based on humidex, wind chill, and heavy rainfall events in Canada for 1953–2012. Atmos. Ocean. 2015, 53, 383–397. [Google Scholar] [CrossRef]
- Alfano, F.R.D.A.; Palella, B.I.; Riccio, G. Thermal environment assessment reliability using temperature—Humidity indices. Ind. Health 2010, 49, 95–106. [Google Scholar] [CrossRef] [PubMed]
- Infusino, E.; Caloiero, T.; Fusto, F.; Calderaro, G.; Brutto, A.; Tagarelli, G. Characterization of the 2017 summer heat waves and their effects on the population of an area of southern Italy. Int. J. Environ. Res. Public Health 2021, 18, 970. [Google Scholar] [CrossRef]
- Godfrey, R.; Julien, M. Urbanisation and Health. Clin. Med. J. R. Coll. Physicians Lond. 2005, 5, 137–141. [Google Scholar] [CrossRef]
- Mauree, D.; Naboni, E.; Coccolo, S.; Perera, A.T.D.; Nik, V.M.; Scartezzini, J.L. A Review of Assessment Methods for the Urban Environment and Its Energy Sustainability to Guarantee Climate Adaptation of Future Cities. Renew. Sustain. Energy Rev. 2019, 112, 733–746. [Google Scholar] [CrossRef]
- Richling, A.; Solon, J.; Macias, A.; Balon, J.; Borzyszkowski, J.; Kistowski, M. (Eds.) Regionalna Geografia Fizyczna Polski; Bogucki Wydawnictwo Naukowe: Poznań, Poland, 2021. [Google Scholar]
- Główny Urząd Statystyczny. Rocznik Statystyczny Rzeczypospolitej Polskiej; Główny Urząd Statystyczny: Ciechanow, Poland, 2023. [Google Scholar]
- Kottek, M.; Grieser, J.; Beck, C.; Rudolf, B.; Rubel, F. World map of the Koppen-Geiger climate classification updated. Meteorol. Z. 2006, 15, 259–263. [Google Scholar] [CrossRef] [PubMed]
- Tomczyk, A.M. Temperatura powietrza. In Atlas klimatu Polski (1991–2020); Tomczyk, A.M., Bednorz, E., Eds.; Bogucki Wydawnictwo Naukowe: Poznań, Poland, 2022. [Google Scholar]
- Rebetez, M.; Reinhard, M. Monthly air temperature trends in Switzerland 1901–2000 and 1975–2004. Theor. Appl. Climatol. 2008, 91, 27–34. [Google Scholar] [CrossRef]
- Dobrovolnỳ, P.; Brázdil, R.; Valášek, H.; Kotyza, O.; Macková, J.; Halíčková, M. A standard paleoclimatological approach to temperature reconstruction in historical climatology: An example from the Czech Republic, AD 1718–2007. Int. J. Climatol. 2009, 29, 1478–1492. [Google Scholar] [CrossRef]
- Leijonhufvud, L.; Wilson, R.; Moberg, A.; Söderberg, J.; Retsö, D.; Söderlind, U. Five centuries of Stockholm winter/spring temperatures reconstructed from documentary evidence and instrumental observations. Clim. Chang. 2010, 101, 109–141. [Google Scholar] [CrossRef]
- Mikkonen, S.; Laine, M.; Mäkelä, H.; Gregow, H.; Tuomenvirta, H.; Lahtinen, M.; Laaksonen, A. Trends in the average temperature in Finland, 1847–2013. Stoch. Environ. Res. Risk A 2015, 29, 1521–1529. [Google Scholar] [CrossRef]
- Pospieszyńska, A.; Przybylak, R. Air temperature changes in Toruń (central Poland) from 1871 to 2010. Theor. Appl. Climatol. 2019, 135, 707–724. [Google Scholar] [CrossRef]
- NOAA. Available online: https://www.ncei.noaa.gov/access/monitoring/climate-at-a-glance/global/time-series (accessed on 20 January 2024).
- Kolendowicz, L.; Czernecki, B.; Półrolniczak, M.; Taszarek, M.; Tomczyk, A.M.; Szyga-Pluta, K. Homogenization of air temperature and its long-term trends in Poznań (Poland) for the period 1848–2016. Theor. Appl. Climatol. 2019, 136, 1357–1370. [Google Scholar] [CrossRef]
- Bryś, K.; Bryś, T. Reconstruction of the 217-year (1791–2007) Wrocław air temperature and precipitation series. Bull. Geogr. Phys. Geogr. 2010, 3, 121–171. [Google Scholar] [CrossRef]
- Werner, R.; Valev, D.; Danov, D.; Guineva, V. Study of structural break points in global and hemispheric temperature series by piecewise regression. Adv. Space Res. 2015, 56, 2323–2334. [Google Scholar] [CrossRef]
- Markowicz, K.M.; Zawadzka-Manko, O.; Posyniak, M. A large reduction of direct aerosol cooling over Poland in the last decades. Int. J. Climatol. 2022, 42, 4129–4146. [Google Scholar] [CrossRef]
- Bednorz, E. Opady atmosferyczne. In Atlas Klimatu Polski (1991–2020); Tomczyk, A.M., Bednorz, E., Eds.; Bogucki Wydawnictwo Naukowe: Poznań, Poland, 2022. [Google Scholar]
- Bednorz, E. Pokrywa śnieżna. In Atlas Klimatu Polski (1991–2020); Tomczyk, A.M., Bednorz, E., Eds.; Bogucki Wydawnictwo Naukowe: Poznań, Poland, 2022. [Google Scholar]
- Fricke, A.C.; Pongrácz, B.R.; Unger, A.J. Comparison of Daily and Monthly Intra-urban Thermal Reactions Based on LCZ Classification Using Surface and Air Temperature Data. Geogr. Pannonica 2022, 26, 1–11. [Google Scholar] [CrossRef]
- World Meteorological Organization. Guide to Instruments and Methods of Observation; World Meteorological Organization—WMO: Geneva, Switzerland, 2018. [Google Scholar]
- Perkins, S.E.; Alexander, L.V. On the measurement of heat waves. J. Clim. 2013, 26, 4500–4517. [Google Scholar] [CrossRef]
- Kyselý, J. Temporal fluctuations in heat waves at Prague–Klementinum, the Czech Republic, from 1901–1997 and their relationships to atmospheric circulation. Int. J. Climatol. 2002, 22, 33–50. [Google Scholar] [CrossRef]
- Porębska, M.; Zdunek, M. Analysis of extreme temperature events in Central Europe related to high pressure blocking situations in 2001–2011. Meteorol. Z. 2013, 22, 533–540. [Google Scholar] [CrossRef] [PubMed]
- IPCC. Climate Change 2007 the Physical Science Basis. Contribution of Working Group I to the Fourth Assessment Report of the Intergovernmental Panel in Climate Change; Cambridge University Press: Cambridge, UK, 2007. [Google Scholar]
- Masterton, J.M.; Richardson, F.A. Humidex: A Method of Quantifying Human Discomfort Due to Excessive Heat and Humidity; Environment Canada, Atmospheric Environment: Gatineau, QC, Canada, 1979.
- Koźmiński, C.; Michalska, B. Bioclimatology Exercises; Wydawnictwo Naukowe Uniwersytetu Szczecińskiego: Szczecin, Poland, 2013. [Google Scholar]
- Błażejczyk, K.; Błażejczyk, M. BioKlima Ver.2.6; Polish Academy of Sciences: Warsaw, Poland, 2006. [Google Scholar]
- Diaconescu, E.; Sankare, H.; Chow, K.; Murdock, T.Q.; Cannon, A.J. A short note on the use of daily climate data to calculate Humidex heat-stress indices. Int. J. Climatol. 2023, 43, 837–849. [Google Scholar] [CrossRef]
- Beck, C.; Straub, A.; Breitner, S.; Cyrys, J.; Philipp, A.; Rathmann, J.; Jacobeit, J. Air temperature characteristics of local climate zones in the Augsburg urban area (Bavaria, southern Germany) under varying synoptic conditions. Urban Clim. 2018, 25, 152–166. [Google Scholar] [CrossRef]
- Oxoli, D.; Ronchetti, G.; Minghini, M.; Molinari, M.E.; Lotfian, M.; Sona, G.; Brovelli, M.A. Measuring urban land cover influence on air temperature through multiple Geo-Data—The case of Milan, Italy. ISPRS Int. J. Geo-Inf. 2018, 7, 421. [Google Scholar] [CrossRef]
- Stewart, I.D.; Oke, T.R.; Krayenhoff, E.S. Evaluation of the ‘local climate zone’scheme using temperature observations and model simulations. Int. J. Climatol. 2014, 34, 1062–1080. [Google Scholar] [CrossRef]
- Skarbit, N.; Gál, T.; Unger, J. Airborne surface temperature differences of the different Local Climate Zones in the urban area of a medium sized city. In Proceedings of the 2015 Joint Urban Remote Sensing Event (JURSE), Lausanne, Switzerland, 30 March–1 April 2015. [Google Scholar]
- Walawender, J. Application of LANDSAT satellite data and GIS techniques for estimation of thermal conditions in urban area (using an example of Krakow agglomeration). Pr. Geogr. 2009, 122, 81–98. [Google Scholar]
- Kuchcik, M.; Błażejczyk, K.; Milewski, P.; Szmyd, J. Urban climate research in Warsaw: The results of microclimatic network measurements. Geogr. Pol. 2014, 87, 491–504. [Google Scholar] [CrossRef]
- Mackey, C.W.; Lee, X.; Smith, R.B. Remotely Sensing the Cooling Effects of City Scale Efforts to Reduce Urban Heat Island. Build. Environ. 2012, 49, 348–358. [Google Scholar] [CrossRef]
- Norton, B.A.; Coutts, A.M.; Livesley, S.J.; Harris, R.J.; Hunter, A.M.; Williams, N.S.G. Planning for Cooler Cities: A Framework to Prioritise Green Infrastructure to Mitigate High Temperatures in Urban Landscapes. Landsc. Urban Plan. 2015, 134, 127–138. [Google Scholar] [CrossRef]
- Aram, F.; Higueras García, E.; Solgi, E.; Mansournia, S. Urban Green Space Cooling Effect in Cities. Heliyon 2019, 5, e01339. [Google Scholar] [CrossRef] [PubMed]
- Gago, E.J.; Roldan, J.; Pacheco-Torres, R.; Ordóñez, J. The City and Urban Heat Islands: A Review of Strategies to Mitigate Adverse Effects. Renew. Sustain. Energy Rev. 2013, 25, 749–758. [Google Scholar] [CrossRef]
- Ichim, P.; Sfîcă, L. The influence of urban climate on bioclimatic conditions in the city of Iași, Romania. Sustainability 2022, 12, 9652. [Google Scholar] [CrossRef]
- Ma, F.; Yuan, X.; Jiao, Y.; Ji, P. Unprecedented Europe Heat in June–July 2019: Risk in the Historical and Future Context. Geophys. Res. Lett. 2020, 47, L087809. [Google Scholar] [CrossRef]
- Matzarakis, A.; Muthers, S.; Graw, K. Thermische Belastung von Bewohnern in Städten bei Hitzewellen am Beispiel von Freiburg (Breisgau). Bundesgesundheitsbl. 2020, 63, 1004–1012. [Google Scholar] [CrossRef] [PubMed]
- Tomczyk, A.M. Bioclimatic Conditions of June 2019 in Poland on a Multi-Year Background (1966–2019). Atmosphere 2021, 12, 1117. [Google Scholar] [CrossRef]
- Krzyżewska, A.; Dyer, J. The August 2015 mega-heatwave in Poland in the context of past events. Weather 2018, 73, 207–214. [Google Scholar] [CrossRef]
- Tomczyk, A.M.; Bednorz, E. Heat waves in Central Europe and tropospheric anomalies of temperature and geopotential heights. Int. J. Climatol. 2019, 39, 4189–4205. [Google Scholar] [CrossRef]
- Tomczyk, A.M.; Bednorz, E.; Matzarakis, A. Human-biometeorological conditions during heat waves in Poland. Int. J. Climatol. 2020, 40, 5043–5055. [Google Scholar] [CrossRef]
- Tomczyk, A.M.; Matzarakis, A. Characteristic of bioclimatic conditions in Poland based on Physiologically Equivalent Temperature. Int. J. Biometeorol. 2023, 67, 1991–2009. [Google Scholar] [CrossRef] [PubMed]
- Shevchenko, O.; Snizhko, S.; Zapototskyi, S.; Matzarakis, A. Biometeorological Conditions during the August 2015 Mega-Heat Wave and the Summer 2010 Mega-Heat Wave in Ukraine. Atmosphere 2022, 13, 99. [Google Scholar] [CrossRef]
- Tomczyk, A.M.; Bednorz, E. Thermal stress during heat waves and cold spells in Poland. Weather Clim. Extremes 2023, 42, 100612. [Google Scholar] [CrossRef]
- Kuchcik, M. Mortality and thermal environment (UTCI) in Poland—Long-term, multi-city study. Int. J. Biometeorol. 2021, 65, 1529–1541. [Google Scholar] [CrossRef]

Disclaimer/Publisher’s Note: The statements, opinions and data contained in all publications are solely those of the individual author(s) and contributor(s) and not of MDPI and/or the editor(s). MDPI and/or the editor(s) disclaim responsibility for any injury to people or property resulting from any ideas, methods, instructions or products referred to in the content. |
© 2024 by the authors. Licensee MDPI, Basel, Switzerland. This article is an open access article distributed under the terms and conditions of the Creative Commons Attribution (CC BY) license (https://creativecommons.org/licenses/by/4.0/).