Article

Characteristics of Soil Temperature Change in Lhasa in the Face of Climate Change

1
School of Hydraulic and Electric-Power, Heilongjiang University, Harbin 150080, China
2
Institute of Groundwater in Cold Regions, Heilongjiang University, Harbin 150080, China
3
International Joint Laboratory of Hydrology and Hydraulic Engineering in Cold Regions of Heilongjiang Province (International Cooperation), Harbin 150080, China
4
Melnikov Permafrost Institute of the Siberian Branch of the Russian Academy of Science, Yakutsk 677000, Russia
5
Faculty of Geology and Survey, North-Eastern Federal University, Yakutsk 677000, Russia
*
Author to whom correspondence should be addressed.
Atmosphere 2024, 15(4), 450; https://doi.org/10.3390/atmos15040450
Submission received: 15 February 2024 / Revised: 29 March 2024 / Accepted: 31 March 2024 / Published: 4 April 2024
(This article belongs to the Section Biosphere/Hydrosphere/Land–Atmosphere Interactions)

Abstract

:
Soil temperature is an important index of climate change, and the analysis of soil temperature change is of great significance for understanding climate change and ecohydrological processes. This study was based on the measured meteorological data of a meteorological station, combined with the soil temperature data of 0–10, 10–40, 40–100 and 100–200 cm from the Global Land Data Assimilation System (GLDAS-NOAH). The Mann–Kendall test, wavelet analysis, linear tendency estimation and other methods were used to analyze the variability, periodicity and trend of soil temperature in Lhasa from 2006 to 2022. The results showed that the soil temperature of different soil layers had abrupt changes in annual and seasonal time series, and all showed a warming phenomenon after abrupt changes. In terms of periodicity, the average annual soil temperature of different soil layers has similar periodic changes, and the periodic oscillation is strong around 10a, which is the main cycle of soil temperature change. The soil temperature in Lhasa showed a significant rising trend in the interannual and seasonal time series, and the average annual rising trend of soil temperature was greater than that of air temperature. The correlation between soil temperature and mean air temperature (MAT), maximum air temperature (Tmax), minimum air temperature (Tmin) and snow depth (SD) was investigated by Pearson correlation analysis. Soil temperature in spring, autumn and winter had a strong correlation with MAT, Tmax and Tmin, showing a significant positive correlation. The negative correlation between soil temperature and SD in 0–40 cm soil in spring and winter was more severe. The research results show that Lhasa has experienced a rise in air temperature and soil temperature in the past 17 years, and reveal the specific changes in soil temperature in Lhasa against the background of climate change. These findings have reference significance for understanding the impact of climate change on the natural environment.

1. Introduction

Soil temperature is a key parameter to characterize thermal properties and soil water content, and often reflects climate change through its impact on surface energy and water budget [1]. The change in soil temperature against the background of global warming will also have corresponding effects on the natural environment, such as atmospheric circulation, topography and hydrological conditions [2]. In other words, changes in soil temperature also affect the connections between plants and soil biota, which in turn affect plant root activity [3]. Since soil temperature changes continuously affect ecosystems, timely understanding of soil temperature changes is very important for predicting future changes in the natural world [4], which can effectively reduce climate risks. Considering soil temperature effects in agricultural soil research can enhance transferability from artificial and experimental conditions to natural environmental conditions [5]. As the climate change on the surface of the earth continues to spread down to the ground, heat exchange will also change and then affect the surrounding ground thermal state, so it is of high importance to study the dynamic change law of soil temperature in the constantly changing environment [6].
Climate change has a drastic impact on the natural world, and strong climate change will directly affect crop yield, water consumption, biodiversity and soil health [7], which has aroused great concern in the world [8]. Most experts around the world are studying the link between climate change and soil temperature. For example, Balybina [9] studied the dynamic change in annual mean thermal conditions of 3.2 m soil layer in outer Baikal, Russia, and determined the changing trend of seasonal cumulative soil temperature of positive and negative temperatures. Goncharova [10] evaluated the influence of snow on soil thermal state in western Siberia. The results showed that a snow thickness of 20 cm had a significant thermal insulation effect, and a snow thickness above 20 cm had the greatest effect on soil temperature change. When Tsilingiridis [11] explored the relationship between soil temperature and air temperature in northern Greece, he found a good connection between the two. By comparing the calculated value with the measured value, it was found that there was a good fit. Qian [12] analyzed the trend of soil temperature at different depths in Canada and the observed atmospheric variables, and found that the warming trend of soil temperature is related to the change trend of air temperature and snow depth.
Many domestic experts are also increasingly interested in soil temperature changes against the background of climate change. For example, Wang [13] found that soil temperature changes in northeast China and east-northwest China showed a significant upward trend during 1970–2000, and soil temperature and air temperature changes had a significant positive correlation. Guo et al. [14] found that the seasonal variation of surface soil temperature in the Qinghai–Tibet Plateau will affect the surface–atmosphere heat exchange, because soil temperature in this region is mainly controlled by air temperature, while the response of deep soil temperature to air temperature is relatively weak, and the surface soil temperature is more susceptible to the impact of climate change. Wu [15] analyzed the recent changes in active layer thickness, underground temperature, surface temperature of near-frozen soil, and frozen soil temperature at depths of 6 and 8 m by using the monitoring data of stations on the Qinghai–Tibet Plateau, and found that their changes were in good consistency with air temperature changes. Qin [16] used the Mann–Kendall test to study the annual and seasonal spatio-temporal changes of the Qinghai–Tibet Plateau from 1980 to 2017, and found that the temperature of deep soil had an increasing trend, but it was lower than that of shallow soil. The warming rate of the first layer temperature was significantly lower than that of the deep layer temperature in autumn and winter. Huang [17] showed that due to the lack of sufficient observational data covering space and time, it is difficult to use observational data from stations to study regional changes. However, the current reanalysis products such as GLDAS-NOAH have continuity and sufficient spatio-temporal coverage, which is conducive to the study of soil temperature. Yang [18] evaluated the soil temperature and soil moisture performance of four kinds of reanalysis products, and the statistical results showed that GLDAS-NOAH was a Noah model driven by the global land data assimilation system and ranked the highest in the simulation of soil temperature. Therefore, this paper adopted GLDAS-NOAH soil temperature data for reanalysis with good reliability.
With an average elevation of more than 4500 m, the Qinghai–Tibet Plateau is the highest plateau in the world [19]. Also known as the Water Tower of Asia, it is the source of Asia’s major rivers [20]. Studies have shown that the annual average air temperature rise rate of the Tibetan Plateau exceeds the temperature rise rate of the same latitude zone, and it is considered as one of the key regions to cope with climate change [21]. Lhasa is located in the central and southern part of the Qinghai–Tibet Plateau, which is one of the most developed areas in Tibet [22]. The Qinghai–Tibet Plateau has a special topographic structure and a high altitude, so there are few temperature observations from meteorological stations [23]. Most of the observed temperature data are from the eastern and central regions of the Qinghai–Tibet Plateau. The temperature data used in this paper are from the meteorological station of Lhasa City in the central region. Therefore, we used reanalysis data to study the characteristics of annual and seasonal time series changes in soil temperature in Lhasa City, and analyzed the reanalysis data according to the observation data. The results will provide references for understanding environmental effects in the context of climate change.

2. Materials and Methods
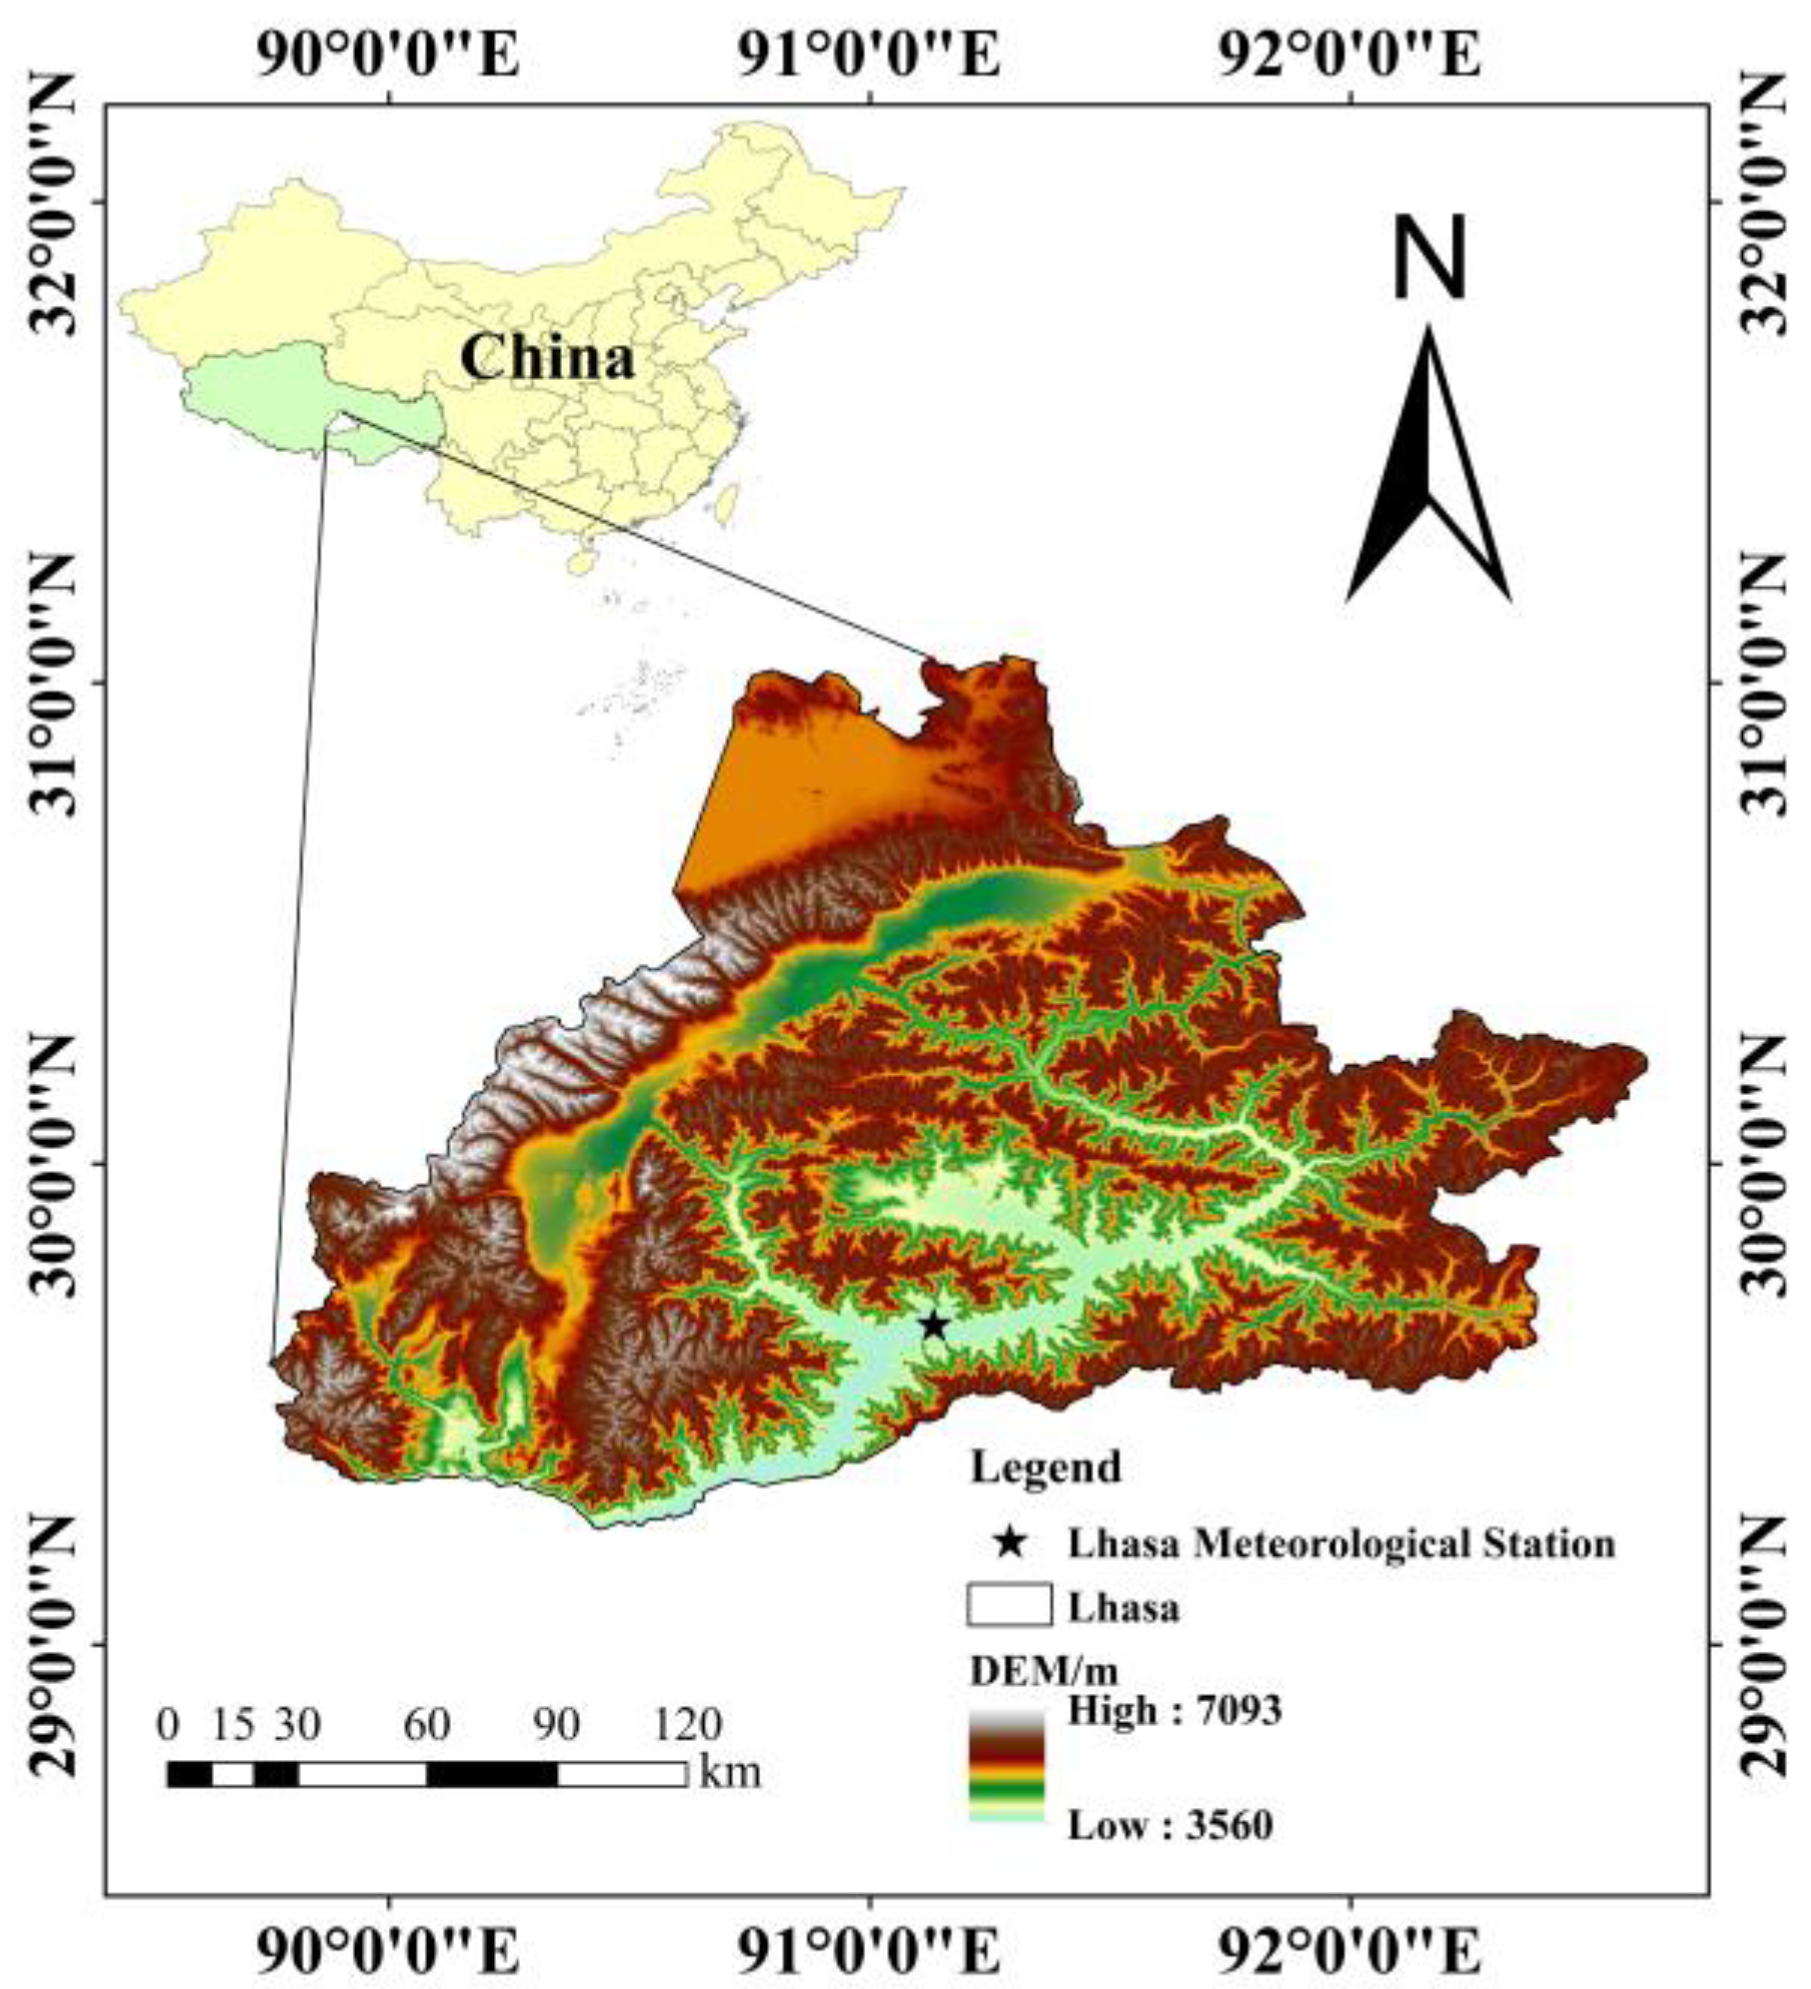
2.1. Study Area

Lhasa is located in southwest China and the middle of the Qinghai–Tibet Plateau [24]. The location of meteorological station in Lhasa is shown in Figure 1. The administrative area of the city spans 277 km from east to west and 202 km from north to south, covering an area of 29,640 km2. The climate belongs to the plateau temperate semi-arid monsoon climate area. With sunny weather throughout the year, the sunshine time can reach more than 3000 h, and the annual precipitation is between 200–510 mm. Lhasa is 3650 m above sea level [25,26].

2.2. Data Source

Meteorological data from 2006 to 2022 were derived from the actual measurements of the meteorological station in Lhasa, Tibet Autonomous Region, including excerpts of air temperature, wind speed and humidity, with satisfactory data completeness (less than 5% missing data per year).
Soil temperature and snow depth data are from NASA’s Goddard earth science data information and service center (http://disc.gsfc.nasa.gov, accessed on 15 October 2023), GLDAS-NOAH data set. GLDAS data are integrated from a large number of observation-based data and performed globally at multiple resolutions [27]. The time frequency of the data used is calculated on a monthly basis, from January 2006 to December 2022, and the spatial resolution is 0.25° × 0.25°. The soil temperature at 0–10, 10–40, 40–100 and 100–200 cm depth was recorded as ST1, ST2, ST3 and ST4, respectively. In this study, the ArcGIS10.6 software was used to reanalyze the data, obtaining the monthly mean value of soil temperature products, and creating seasonal and annual time series based on the monthly data.

2.3. Methods

The change rate of soil temperature in 0–10 cm, 10–40 cm, 40–100 cm and 100–200 cm soil layers in Lhasa was analyzed by a linear tendency estimation method. The Mann–Kendall test was used to test the abrupt change in annual mean soil temperature and seasonal mean soil temperature in each layer. Through wavelet analysis and MATLAB R2018a software, the annual average soil temperature cycle of each layer was calculated. The correlation between soil temperature and meteorological factors was analyzed by SPSS.

2.3.1. Linear Tendency Estimation Method

A certain climate variable with sample size n is represented by xi, and the corresponding period of xi is represented by ti [28], and a unary linear regression formula is constructed between xi and ti:
x i = a + b t i ,   i = 1 , 2 ,   ,   n
A linear equation is selected to describe quantitatively the relationship between x and its corresponding period t, where b is the regression coefficient, representing the trend of climate variables changing over time. When b > 0, the sequence increases. When b < 0, the sequence tends to decrease. When b = 0, there is no change, and a is a constant which can be obtained by the least square method [29]. In this paper, b × 10 is used to represent the climate tendency rate, and the unit is °C/10a.
b = i = 1 n x i t i 1 n i = 1 n x i i = 1 n t i i = 1 n t i 2 1 n i = 1 n t i a = x ¯ b t ¯

2.3.2. Mann–Kendall Nonparametric Test

The Mann–Kendall trend test method is widely used in the analysis of the change trend of time series of climate factors [30]. In this paper, the Mann–Kendall trend test method based on MATLAB is used to analyze the mutability of soil temperature, and the sequence is constructed for the time series x with n samples:
s k = i = 1 k r i , k = 2,3 , . . . , n
The value of ri is as follows:
r i = + 1 x i > x j + 0 x i x j j = 1,2 , . . . ,
The number of sk at i time is greater than that at j time, and under the condition that the random independence of the time series is assumed, the statistic is defined as:
U F k = s k E s k v a r s k , k = 1,2 , . . . , n
In the statistic UF1 = 0, E(sk), var(sk) are the mean and variance of the cumulative sk, when x1, x2 ... are independent of each other and their distribution is consistent, as shown in the following expression [31]:
v a r s k = k k 1 2 k + 5 72 E s k = k k 1 4 k = 2,3 , . . . , n
UF and UB statistics are important indicators used to measure data trends in the MK test. UF statistics are used to measure the difference between the number of ascending and descending extreme values in the data series. The UB statistic is used to measure the time interval between extremes, that is, the sum of the absolute values of the difference in the number of intervals between the previous rising extreme and the next falling extreme [32]. UFk and UBk are placed on the same chart with the critical line. If UFk fluctuates at the critical boundary, it indicates that there is no significant trend of change in the series; if UFk exceeds 0, it indicates that the development direction of the series is upward. On the contrary, if UFk is less than 0, it indicates that the direction of development of the sequence is declining. When UFk and UBk intersect on the critical boundary, it is the moment of mutation, that is, the mutation point [33].

2.3.3. Wavelet Analysis

By decomposing the time series into the time frequency domain, wavelet analysis can obtain the significant wave pattern of the time series, namely the periodic dynamic change, and the time pattern of the periodic dynamic change, reflecting its changing trend [34]. Its expression is as follows:
c m o r ( x ) = σ 2 i π x F e x 2 F b π F b
In the formula, Fb is the frequency band width coefficient; Fe is the central frequency of wavelet; π, e is a constant. The wavelet square difference is var:
v a r ( a ) = ω f ( a , b ) 2 d b
var is a distribution diagram of variation with time period a, called the wavelet square difference distribution diagram, which can be used to determine the relative intensity and main period of oscillation of different oscillation periods [35]. In this paper, the periodic variation of soil temperature is analyzed according to the wavelet real part diagram and the wavelet square difference diagram.

2.3.4. Pearson Correlation Coefficient

The Pearson correlation coefficient method is used to measure whether two data sets are in a straight line. In the field of statistics, it is used to measure the linear relationship between fixed variables and evaluate the correlation between the two variables [36]. The Pearson correlation coefficient method was used to calculate the correlation between soil temperature and meteorological factors in different soil layers. The formula is as follows:
r = i n X i X ¯ Y i Y ¯ i n X i X ¯ 2 i n Y i Y ¯ 2
where r is the correlation coefficient, and its value is between −1 and 1. When r > 0, it means positive correlation, when r < 0, it means negative correlation, and when r = 0, it means no correlation. Xi and Yi represent the values of the two variables in the sample, respectively, and X ¯ and Y ¯ represent the average values of the two variables, respectively.

3. Results

3.1. Time Variation of Soil Temperature

3.1.1. Mutability Analysis

As can be seen from Figure 2 and Table 1, the average annual and seasonal soil temperature in general changed from cooler to warmer, showing an upward trend. The UF and UB statistical curves of annual average soil temperature ST1 and ST2 intersect after 2007, and the intersection position was above the significant threshold, that is, ST1 and ST2 mutated in 2007. ST3 and ST4 mutated in 2008, the mutation point passed the significance test of α = 0.05, and UF showed an upward trend. In 2008, the spring soil temperature at all depths had abrupt changes. In summer, ST1, ST2 and ST4 also mutated in 2008, while ST3 mutated in 2007, 2019 and 2021. The intersection point of UF and UB where ST1 and ST2 appeared in autumn soil temperature was 2009, and the intersection point of ST3 and ST4 was 2008, both of which were upward mutations. In winter, both ST1 and ST2 mutated in 2007, and ST3 and ST4 mutated in 2013. In summary, both annual and seasonal soil temperature showed a warming phenomenon after abrupt change.

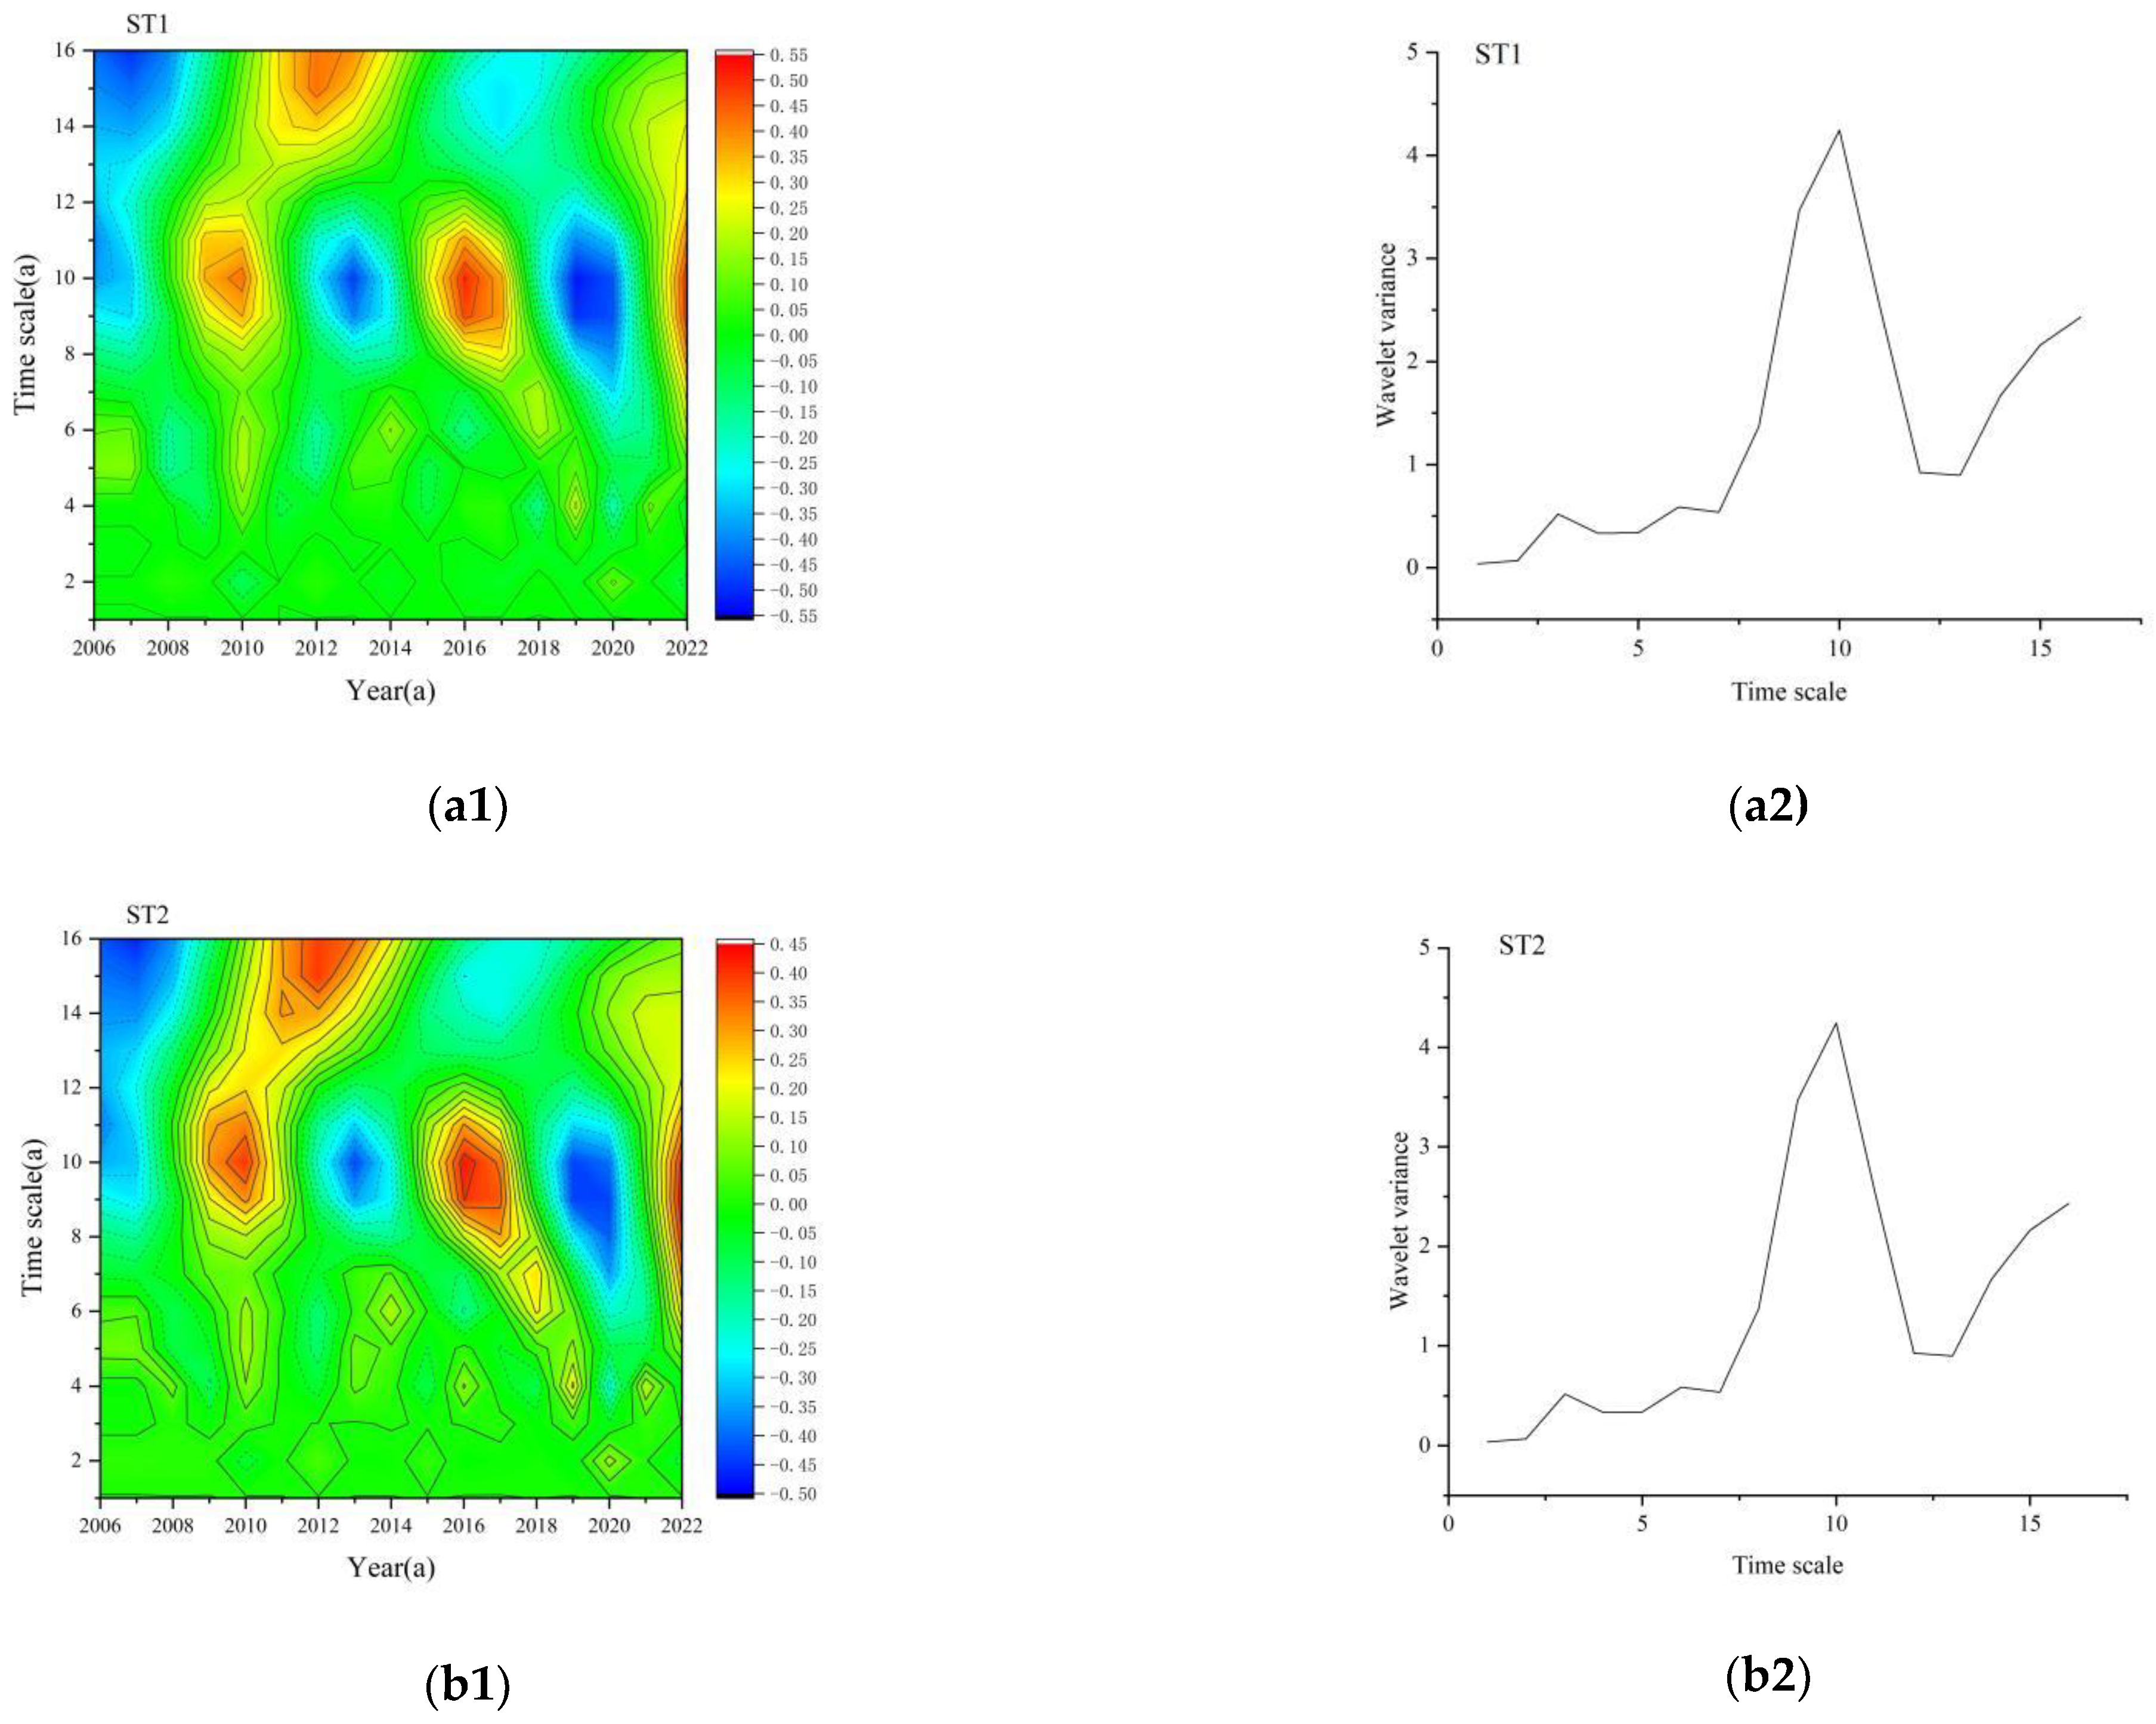
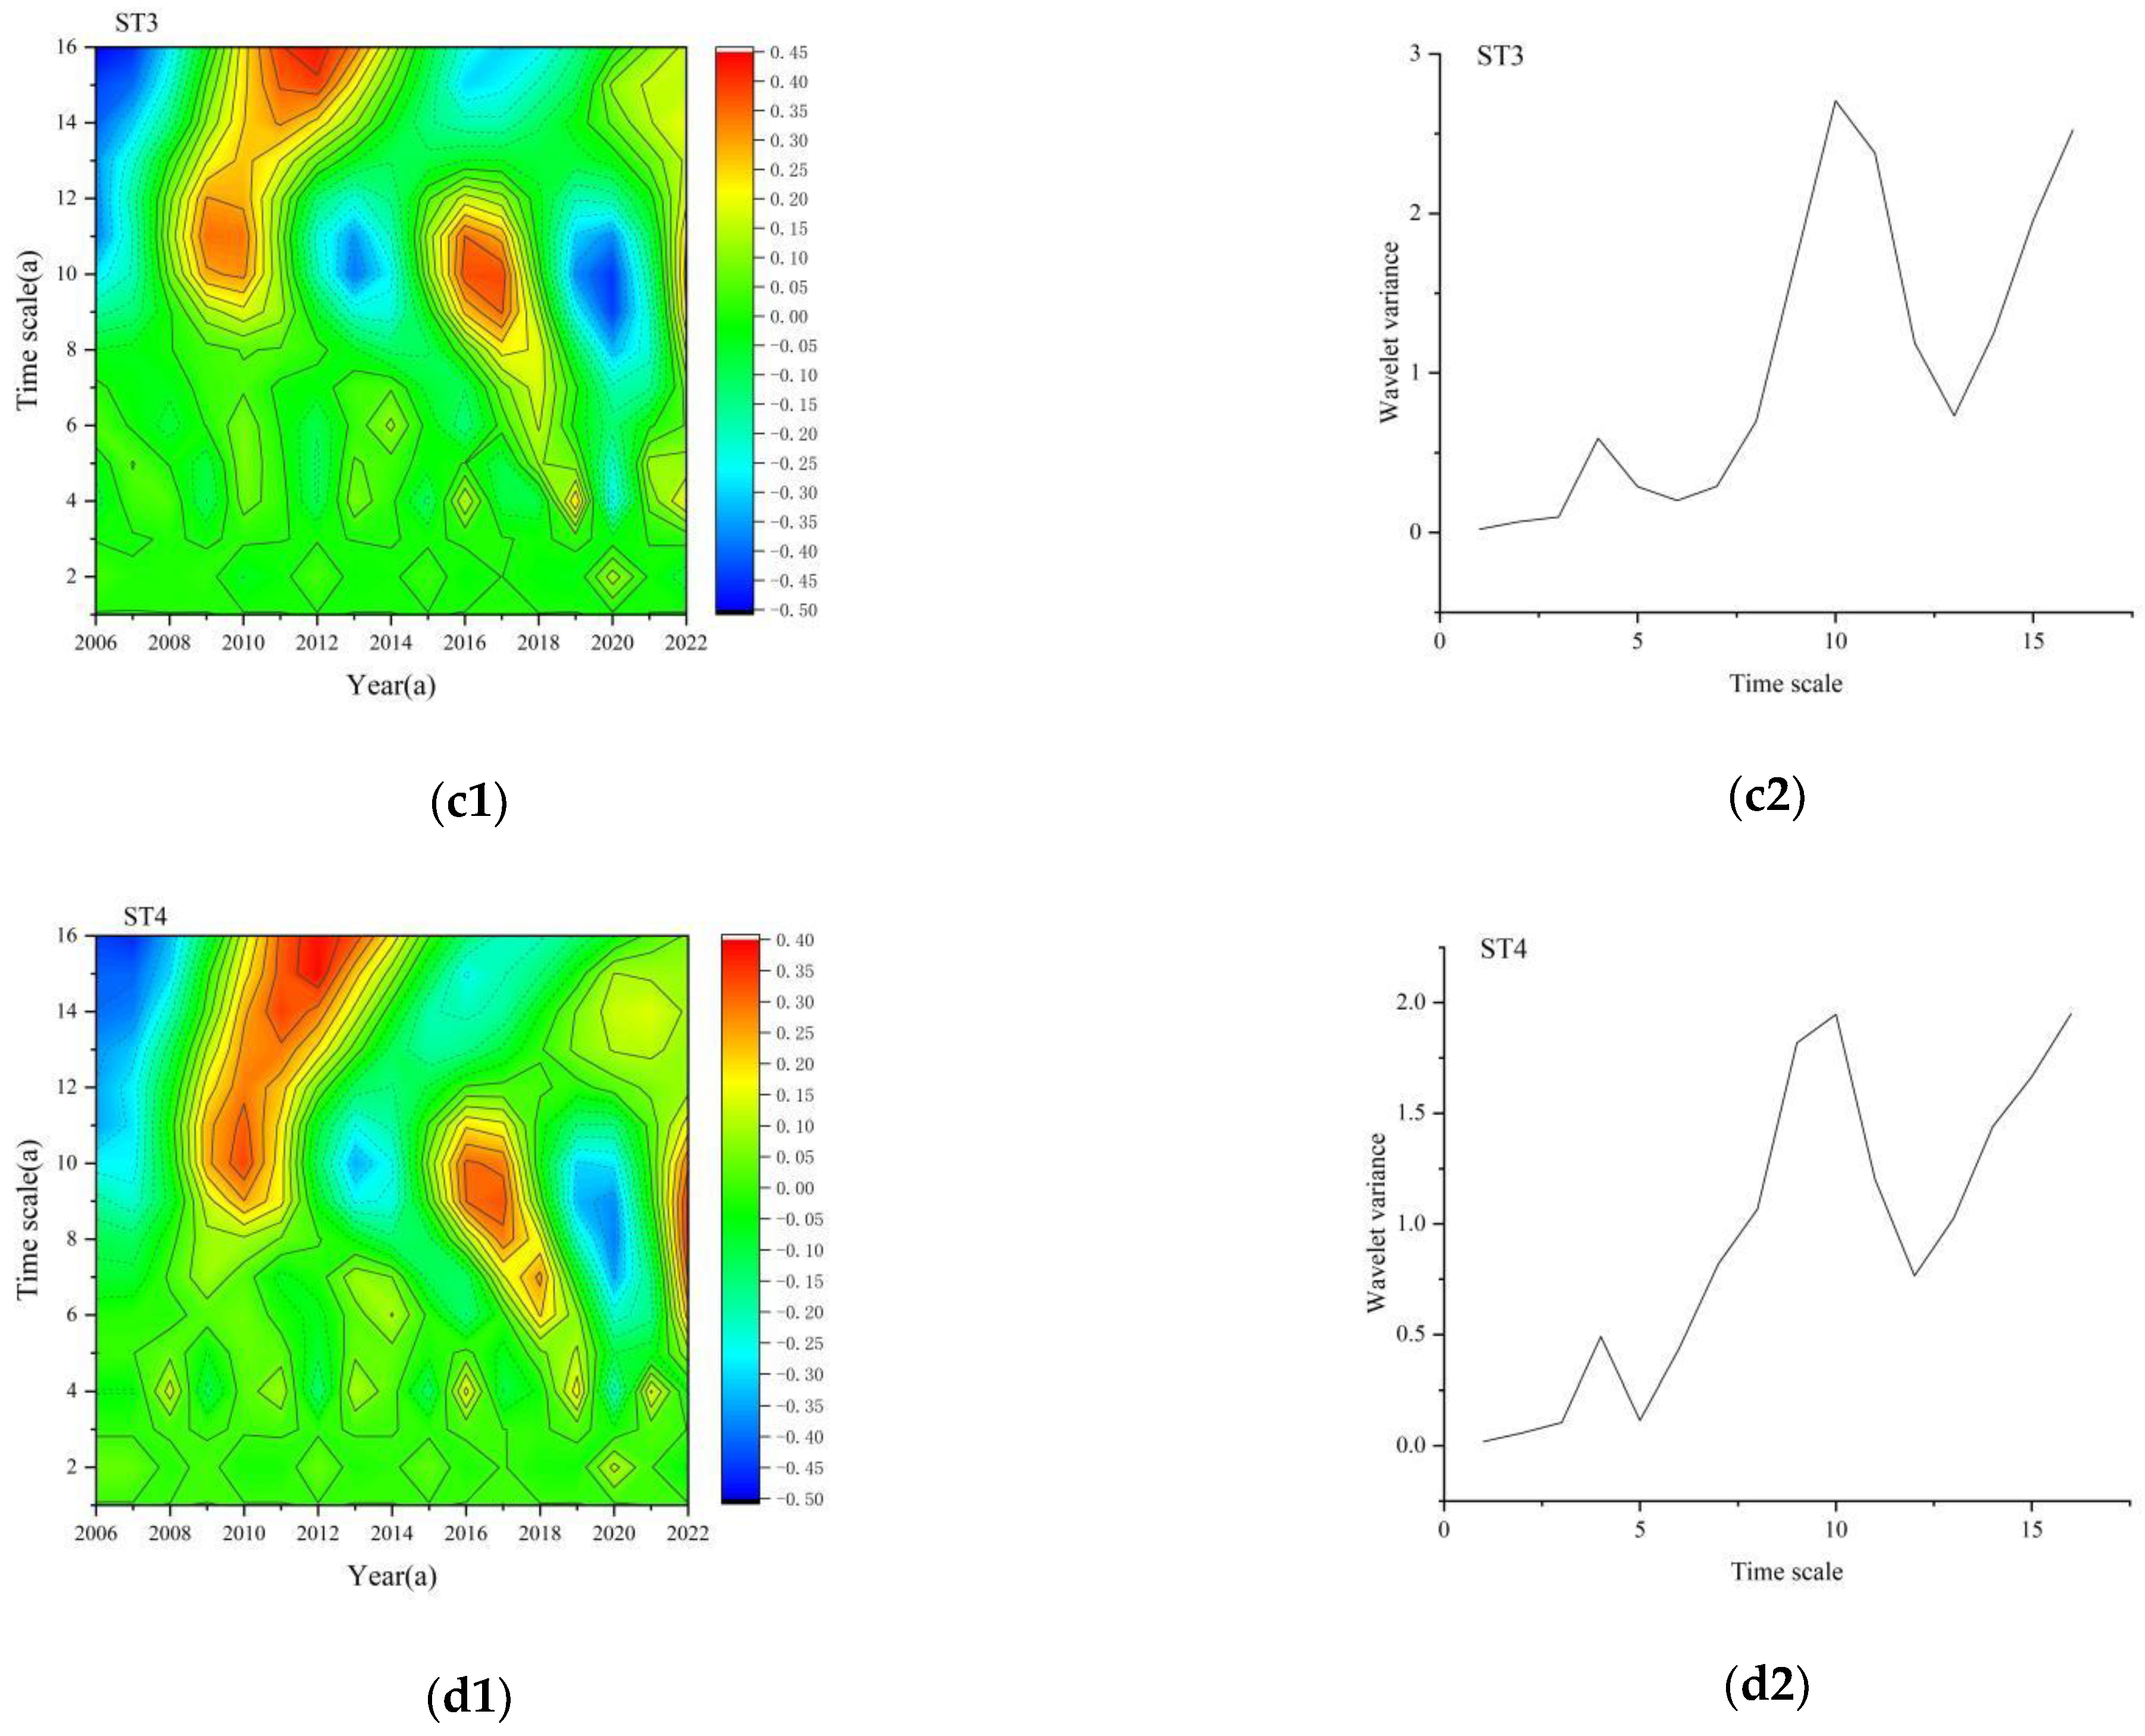
3.1.2. Periodic Analysis

In order to analyze the periodic change in annual mean soil temperature in Lhasa in time series and understand its trend, this paper analyzed the periodic change characteristics based on the series data of mean soil temperature in Lhasa from 2006 to 2022 based on the wavelet function, and found that soil temperature changes at different depths showed significant periodic characteristics. It can be seen from Figure 3(a1,a2) that there are two peaks in the inter-annual variation of ST1, corresponding to two change periods, respectively, in the scales 6a and 10a. Periodic changes are mainly reflected in the two time scales, 3–7a and 9–11a, among which 9–11a has two positive and negative alternating transformations. It can be seen from Figure 3(b1,b2) that there are two peaks of ST2 yearly variation, corresponding to two change cycles, which are the 4a scale and 10a scale, respectively. Periodic changes are mainly reflected in two time scales, 3–5a and 8–11a, among which 8–11a changes are more intense after 2012, and there are two positive and negative alternating changes. It can be seen from Figure 3(c1,c2) that there are two peaks in the inter-annual variation of ST3, corresponding to two change cycles, which are the 3a scale and 10a scale, respectively. The periodic changes are mainly reflected in two time scales, 3–5a and 9–12a, in which 9–12a has two positive and negative alternating transformations. It can be seen from Figure 3(d1,d2) that there are two peaks in the inter-annual variation of ST4, corresponding to two change cycles, which are the 4a scale and 10a scale, respectively. Periodic changes are mainly reflected in two time scales, 3–5a and 9–11a, among which 9–11a has two positive and negative alternating transformations. The wavelet square difference of ST1–ST4 has a large wave peak at one time node, corresponding to the 10a time scale, indicating that the periodic oscillation around 10a is strong and contributes greatly to the wavelet square difference, which is the main period of soil temperature change in the Lhasa area.

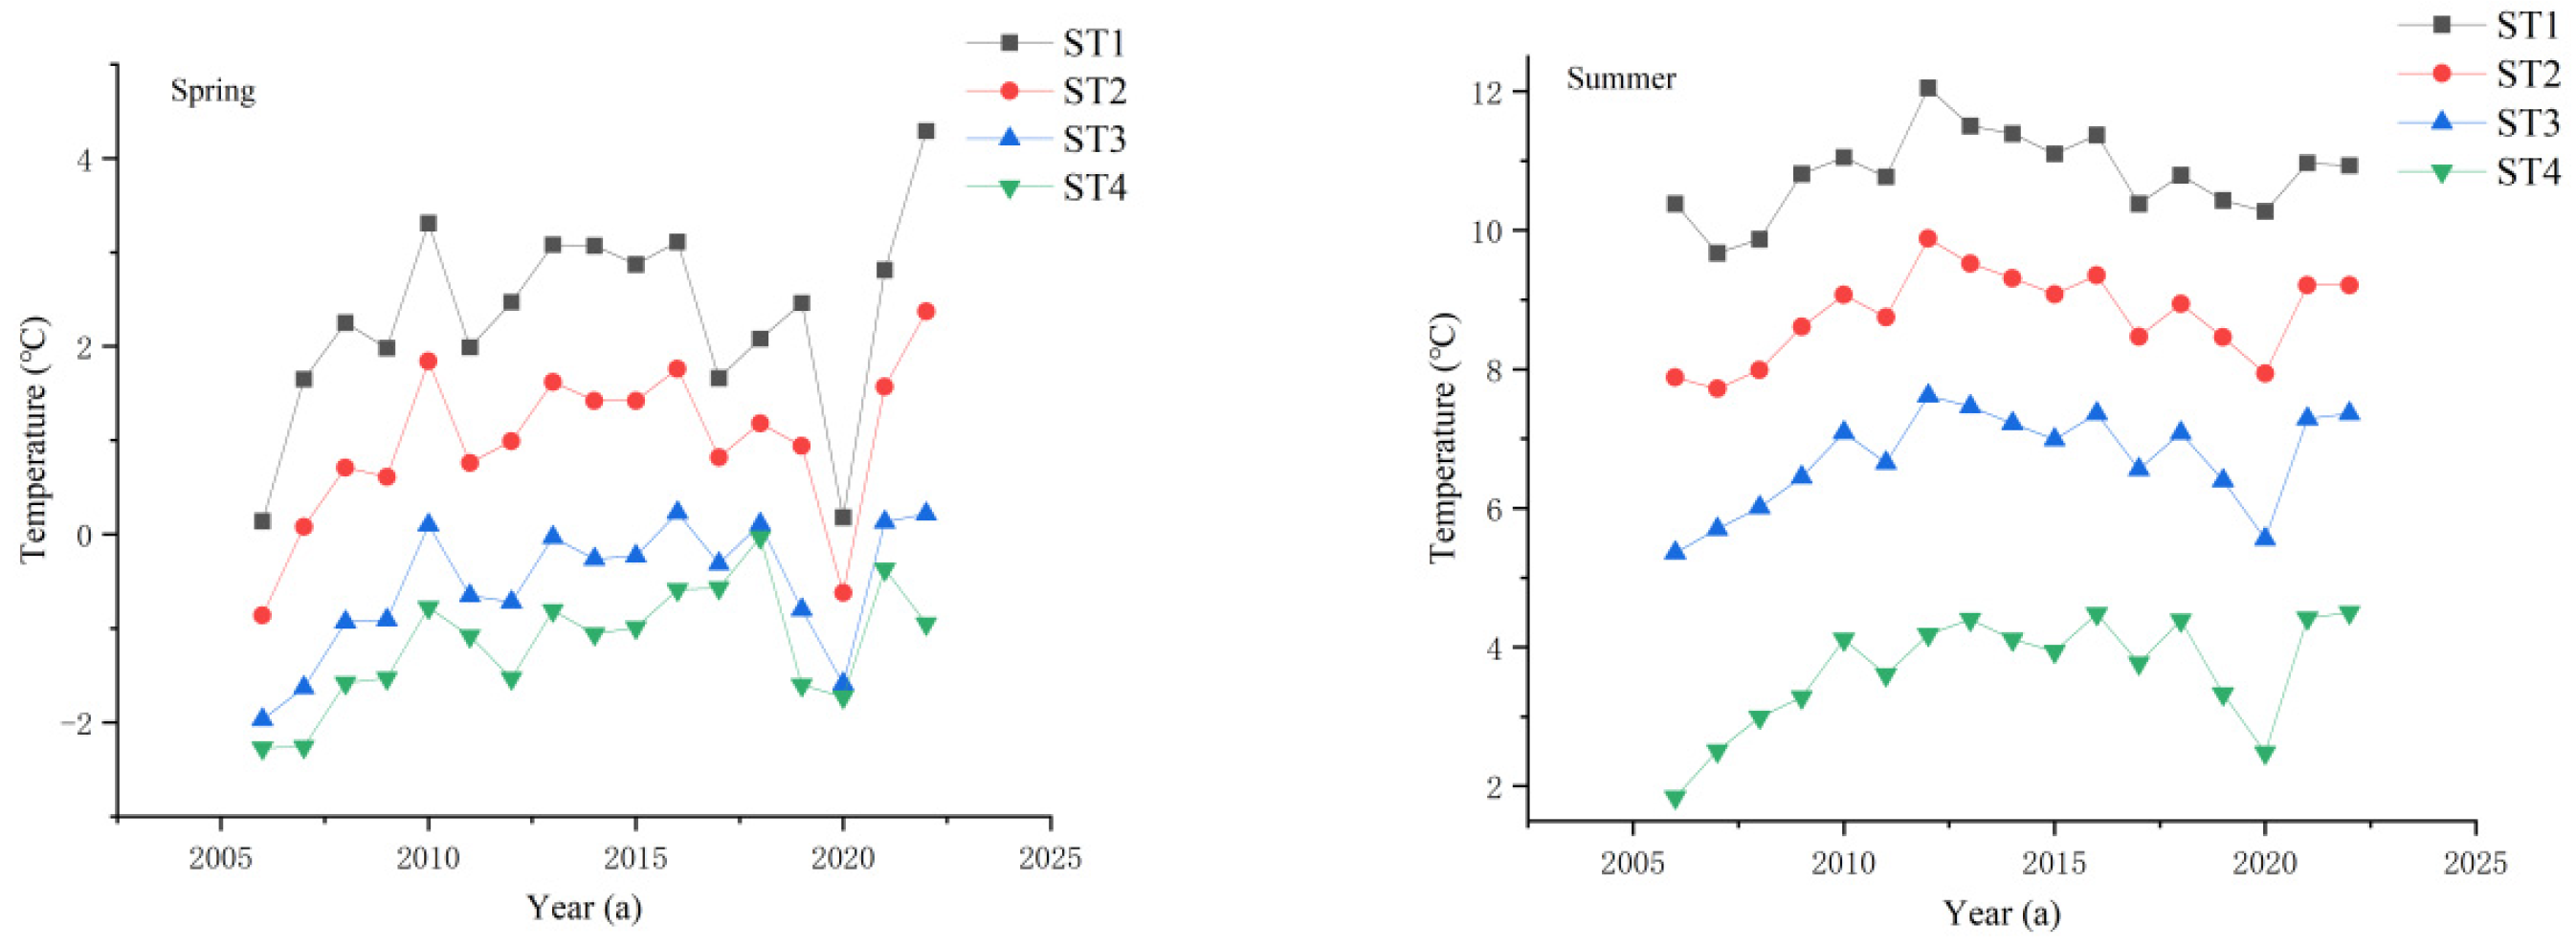
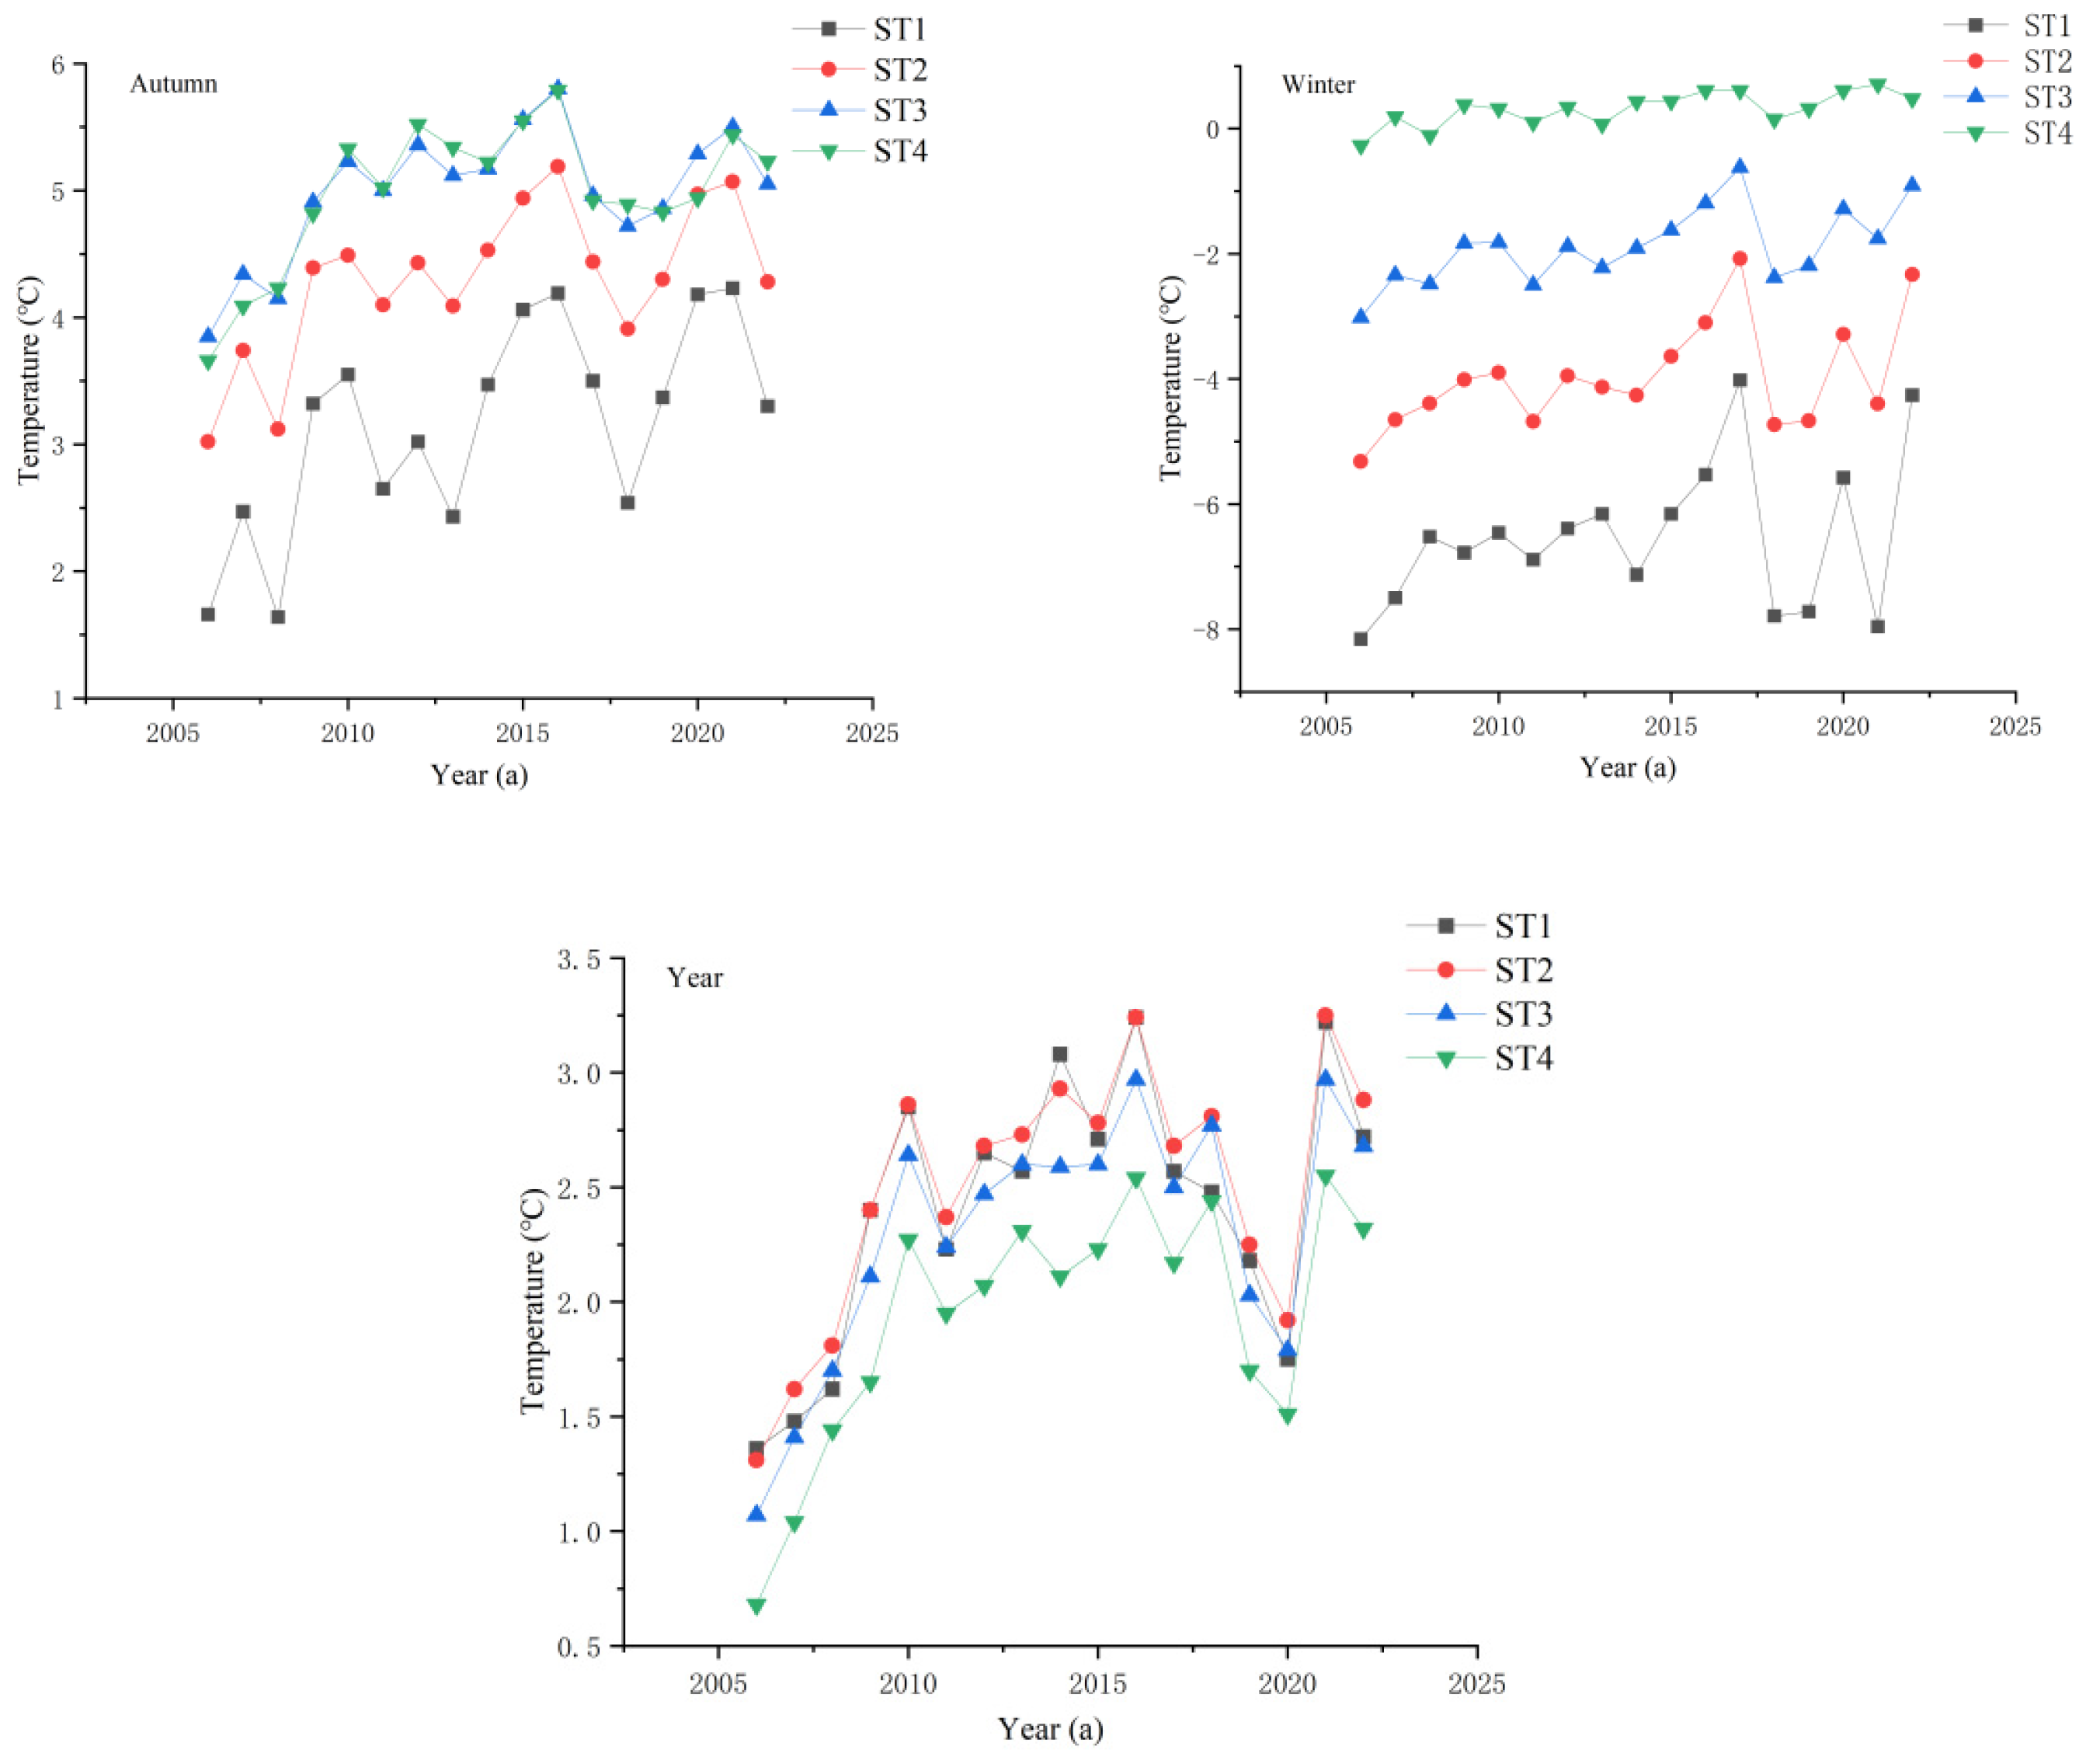
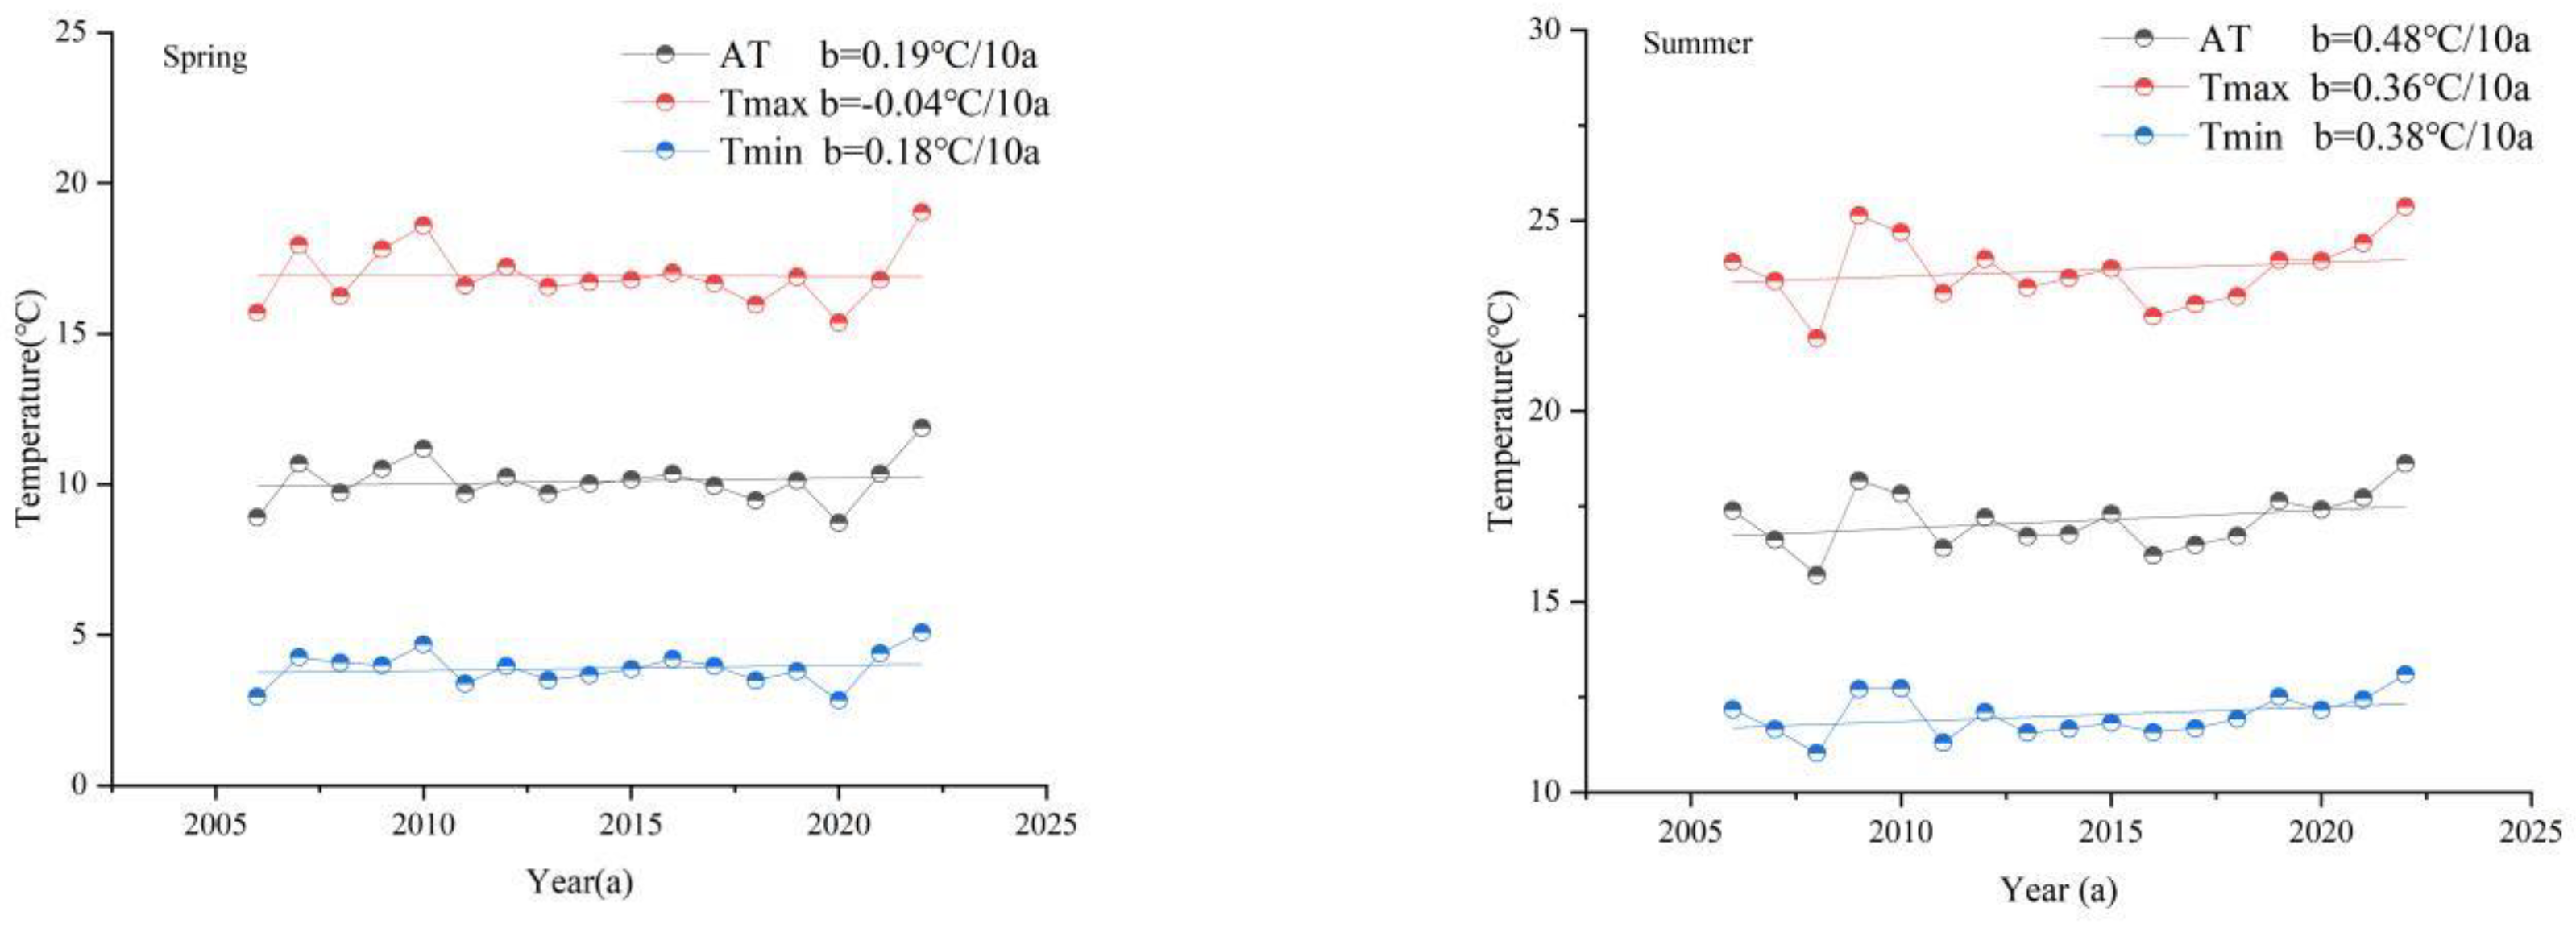
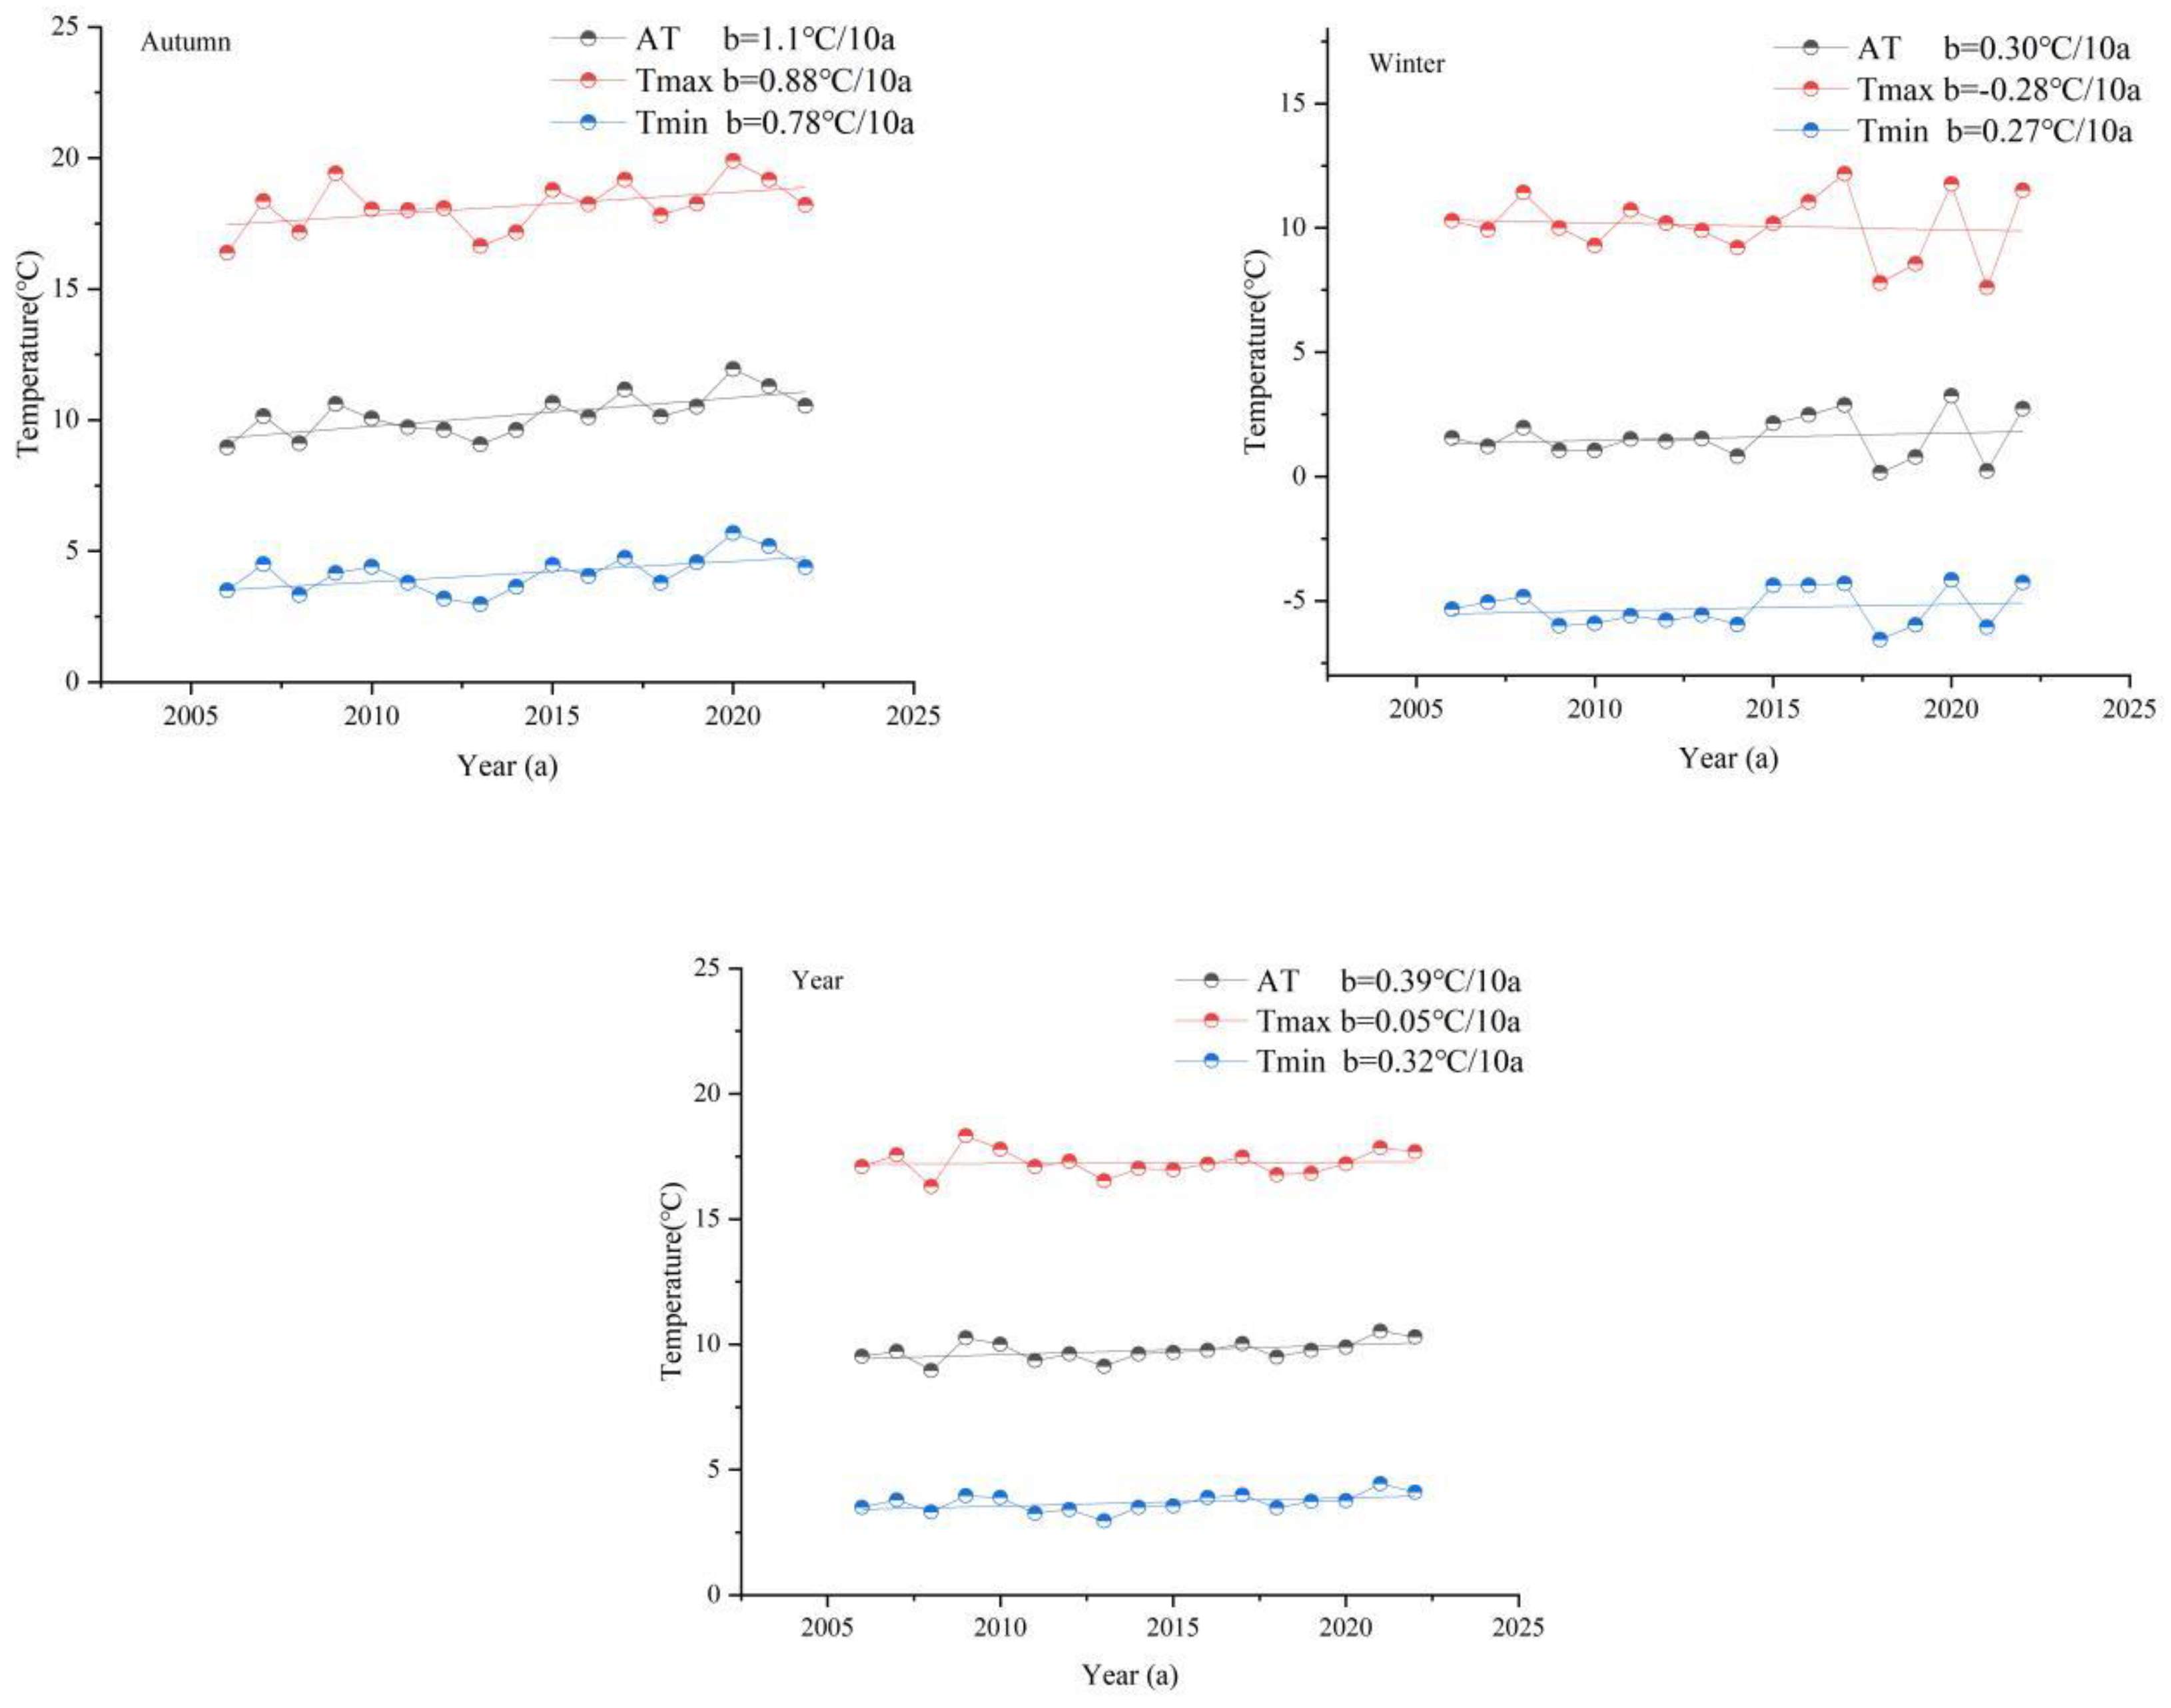
3.1.3. Trend Analysis

The definition of seasons in the study is as follows: spring is from March to May; summer is from June to August; autumn is September–November; winter is December–February of the following year. In general, the soil temperature in Lhasa showed a rising trend in the four seasons in the recent 17 years, but there were differences in soil temperature in different seasons and different depths. As shown in Table 2, the trend rate of soil temperature in spring presented as ST3 > ST4 > ST2 > ST1. In summer, the soil temperature tendency rate showed ST4 > ST3 > ST2 > ST1. In autumn, the soil temperature tendency rate showed ST1 > ST2 > ST3 > ST4. In winter, the soil temperature tendency rate showed ST2 > ST1 > ST3 > ST4. The average annual soil temperature tendency rate showed ST4 > ST3 > ST2 > ST1. ST3 and ST4 changed sharply in spring and summer, while ST1 and ST2 increased significantly in autumn and winter. In summary, seasonal soil temperature in Lhasa showed a trend of increasing fluctuation, among which ST1 had the fastest temperature increase in autumn (1.1 °C/10a) and the slowest temperature increase in summer (0.25 °C/10a), ST2 and ST3 had the largest contribution rate of temperature increase in winter, and ST4 had the largest contribution rate of temperature increase in summer. From the perspective of interannual variation, the fastest rising soil temperature was ST4 (0.65 °C/10a), which increased from 0.68 °C in 2006 to 2.27 °C in 2010.
The annual and seasonal changes in soil temperature in Lhasa are shown in Figure 4. The spring soil temperature presents a sharp rising trend in 2020, especially in the 0–10 cm soil layer. The variation trends of soil temperature at different depths in summer were very similar, showing a downward trend in 2018 and an upward trend in 2020, and the warming rate also increased with the increase in depth. This suggests that summer soil warming is more common in 100–200 cm deep soil. The variation of soil temperature in autumn was large, and the highest value of ST4 in 2016 was 5.79 °C, which was 4.15 °C different from the lowest value of ST1 in 2008 (1.64 °C). In winter, the variation of ST4 was relatively stable, which was similar to that of the other three depths. In spring and summer, soil temperature decreases with increasing depth. In autumn and winter, soil temperature increases with depth, and stratification becomes more defined as depth increases. From summer to autumn, ST1 is warmer than ST4. As a result, heat travels from the surface to the depths, and the soil is in a state of absorbing energy. From autumn to winter, the temperature of ST4 is higher than that of ST1. The energy path is reversed, from the deep soil to the surface, and the soil becomes a source of heat.

3.2. Response of Soil Temperature to Climate Change

3.2.1. Response of Soil Temperature to Air Temperature Change

From 2006 to 2022, the annual and seasonal time series air temperature (including mean air temperature MAT, maximum air temperature Tmax and minimum air temperature Tmin) in Lhasa showed a significant upward trend (Figure 5), and the changes in MAT, Tmax and Tmin were very similar. On the annual scale, Tmin showed a more prominent upward trend than Tmax, with trends of 0.32 °C/10a and 0.05 °C/10a, respectively. Compared with soil temperature, the annual average rising trend of soil temperature in the 0–200 cm soil layer (0.58–0.65 °C/10a) was greater than that of air temperature (0.39 °C/10a). On the seasonal scale, the variation trend of MAT in summer (0.48 °C/10a) and autumn (1.1 °C/10a) was greater than that in spring (0.19 °C/10a) and winter (0.30 °C/10a), and the variation trend of ST1 and MAT in autumn was consistent, both of which were the seasons with the largest temperature increase.
The correlation analysis of seasonal average soil temperature and air temperature in each layer is shown in Table 3. The overall effect of air temperature on soil temperature is consistent, showing a significant positive correlation, although this relationship is weaker in individual seasons than in other seasons, and the correlation of MAT, Tmax and Tmin is very similar. The correlation coefficients between soil temperature and MAT, Tmax and Tmin gradually decreased with the increase in soil depth, indicating that the sensitivity of soil temperature to air temperature decreased with the increase in soil depth, and the seasonal average soil temperature and air temperature showed a significant positive correlation. In spring, the correlation between soil temperature and air temperature was strong, ST1 and ST2 showed the strongest correlation with MAT, Tmax and Tmin (the highest R = 0.783 **), while ST3 showed a weak correlation with MAT and Tmin, but the correlation coefficients were greater than 0.5, showing a significant correlation. There was a strong correlation between soil temperature and air temperature in autumn, and ST1 and ST2 had the strongest correlation with MAT, Tmax and Tmin (the highest R = 0.771 **). There was a strong correlation between soil temperature and air temperature in winter, and ST1 and ST2 showed the strongest correlation with MAT, Tmax and Tmin (the highest R = 0.826 **). According to the correlation coefficient analysis, MAT, Tmax and Tmin have a good correlation with the surface soil temperature in all seasons, and the correlation between the soil temperature and air temperature at 0–10 cm is the strongest. The influence of air temperature on the deep soil temperature is weaker than that on the near surface soil temperature, and the correlation between air temperature and the soil temperature in all layers is greater in spring, autumn and winter. The results indicated that the response of soil temperature to air temperature was weak with the increasing of soil depth, and the sensible heat flux was small. The shallow layer was more sensitive and the sensible heat flux was large, and the heat exchange decreased with the increasing of soil depth.

3.2.2. Response of Soil Temperature to Snow Depth Change

Snow cover affects the surface thermal state and near-surface air, and plays an irreplaceable role in the study of the interaction between soil temperature and climate change [12]. In Lhasa, snow depth (SD) varies greatly from year to year. Table 3 shows the response relationship between soil temperature and SD in seasonal time series, and the correlation between ST1 and ST2 and SD is more significant in seasonal time series. The negative correlation between the two meteorological variables in 0–10 cm soil in spring and winter is more intense, and the correlation coefficient between ST1 and SD in spring is R = −0.636 **. This relationship is more associated with the heat insulation of soil layer by snowfall, which increases soil temperature. The thermal insulation effect of snow cover mainly occurs in winter, and the soil temperature of the 100–200 cm soil layer is higher in winter, and the reduction in snow cover will also reduce the thermal insulation of the underlying soil surface.

4. Discussion

Changes in soil temperature affect biochemical processes at and below the surface of the soil [37]. Because the data covering space or time are not extensive, the relevant studies on soil temperature are less numerous than on other meteorological variables [38]. Based on the meteorological data of Lhasa and the reanalysis data of the Global Land Data Assimilation System (GLDAS-NOAH), this paper makes an analysis. Lhasa is in the seasonal frozen soil region [39]. Studies have shown that the change in soil temperature in seasonal frozen areas will have a significant impact on the balance of surface energy and water, and then affect weather and climate, etc. [40]. Therefore, this study analyzed the change characteristics of soil temperature in Lhasa, which will also help relevant departments to design solutions to mitigate the impact of climate change on the ecosystem of Lhasa in the future.
In this paper, the annual and seasonal time series of soil temperature in Lhasa showed a significant increase, and the trend rate of soil temperature in summer showed ST4 > ST3 > ST2 > ST1. The study found that the summer soil warming more often occurred in the deep soil of 100–200 cm, and the warming in the surface soil took some time to reach the deep soil. After warming, deep soil receives heat and stays warm for a period of time. Several factors may affect this observation result, including high albedo, insulation effect and soil moisture content related to snowmelt. In addition, the thermal insulation effect of snow depth will further affect the heat conduction of temperature and thus affect the temperature of near-deep soil [41]. When Shen [42] studied the vegetation growth on the Qinghai–Tibet Plateau, he found that the rate of soil temperature warming in other seasons was higher than that in summer, possibly because vegetation growing in summer would weaken the surface warming, which was consistent with our finding that the climate tendency rate of ST1 in summer was the smallest. Grünberg [43] also found that vegetation type would determine summer surface soil temperature when studying vegetation and soil temperature in the tundra of northwestern Canada. In the analysis of soil temperature variation in Poyang Lake Basin, Zhan [44] found that soil temperature increased fastest in spring and slowest in summer. This is not completely consistent with the results reflected in our study of seasonal soil temperature in Lhasa (the soil temperature increases the fastest in autumn and the slowest in summer). Due to the differences in the depth of soil temperature analysis and the geographical location of the study area, the results are somewhat complicated, but we all found that the slowest increase was in summer soil temperature.
In terms of climate change, Li [45] found in his study on the freeze–thaw cycle of shallow soil on the Qinghai–Tibet Plateau that the beginning of the freezing day in this region is delayed by 2.2 days every 10 years, and the end of the freezing day is advanced by 3.2 days every 10 years. The number of freezing days decreases by 5.2 days per decade, and air temperature is the main factor affecting the freeze–thaw cycle on the Qinghai–Tibet Plateau. Therefore, it is expected that there is a certain relationship between soil temperature and climate variables, but at the local or specific site scale, there are many factors that can affect soil temperature. Currently, soil temperature has been proved by some studies to be affected by changes in average air temperature and precipitation [46]. According to the correlation analysis between seasonal average soil temperature and air temperature of each layer, there is a significant positive correlation between seasonal average soil temperature and air temperature, which is consistent with the long-term change in soil temperature in Nanchang from 1961 to 2018 analyzed by Zhan [47]. His results show that there is a close correlation between the change in air temperature and the soil temperature at the depth of 0–320 cm. Zhu [40] studied the spatio-temporal variation characteristics of annual soil temperature at 0, 5, 10, 15, 20 and 40 cm depth on the Qinghai–Tibet Plateau and found that soil temperature was generally higher than surface air temperature. Du [24] observed that seasonal mean soil temperature near the surface (top 40 cm) observed in Lhasa, Tibet, China, showed a larger upward trend (0.43–0.66 °C/10 years), and indicated that the upward trend of soil temperature was greater than that of air temperature during the same period. In our study, the soil temperature and average air temperature in Lhasa City during 2006–2022 still followed the previous variation rules, and similar results were also found in Northern Ireland [46]. Cuo [48] found the reason for the rise in soil temperature when studying the degradation of frozen soil in the northern Tibetan Plateau, which was mainly caused by the increase in daily maximum air temperature and internal heat conduction of soil. On the basis of this study, it is necessary to further explore the effects of long-term changes in soil temperature at different depths on the freeze–thaw cycle in the Tibetan Plateau, and to study the internal relationship between these changes and surface hydrological processes. Yu [10] found that snow cover thickness plays a key role in the formation of soil climate in winter, snow cover formation has an impact on soil temperature, and the inter-annual fluctuation of snow cover thickness may lead to significant inter-annual changes in soil thermal state. This is in line with the thinking of this paper. There is a significant negative correlation between soil temperature and snow thickness in the 0–10 cm soil layer in spring and winter. This relationship is more related to the heat insulation of the soil layer by snowfall, which results in the difference between soil temperature and air temperature.
Changes in soil temperature associated with climate warming will lead to changes in topographic and hydrological conditions, including changes in vegetation distribution and growth rate [49]. Therefore, the analysis of soil temperature trend depths is helpful to understand the influence of climate change on surface energy processes and regional environment. Based on the observation data and reanalysis data, the annual and seasonal variation trend, mutability and periodicity of soil temperature, as well as the influence of soil temperature on air temperature and snow depth, were analyzed. The results also well indicate that the variation of soil temperature in Lhasa in the past 17 years is closely related to meteorological factors, which is also one of the main reasons for soil temperature rise. With the increase in soil temperature and air temperature, it is conducive to the growth of crops [43]. To study the characteristics of soil temperature change in Lhasa City and the meteorological factors behind it is a key scientific problem to understand the land-surface hydrology process, earth-air energy exchange and crop productivity in the Qinghai–Tibet Plateau.

5. Conclusions

This paper mainly studied the trend of soil temperature change in Lhasa from 2006 to 2022, and analyzed the correlation between soil temperature and various climatic factors (including MAT, Tmax, Tmin and SD) in this area. By understanding the relationship between soil temperature and climate factors in Lhasa City, we can infer the influence of soil temperature change on air temperature and snow depth, which then affect the climate. These findings could inform the relevant agriculture and forestry sectors in Lhasa and other regions of China experiencing similar environmental trends. In this study, the Mann–Kendall test, linear tendency estimation, wavelet analysis and Pearson correlation analysis were used to analyze the periodicity, mutability, trend and correlation of soil temperature change in Lhasa City, and the effects of MAT, Tmax, Tmin and SD on soil temperature were discussed. Specifically, the soil temperature and air temperature in Lhasa are on the rise, which is in line with the current global warming background. Air temperature and soil temperature showed a significant positive correlation in spring, autumn and winter, while ST1 and ST2 showed a negative correlation with SD in the region, which was due to the thermal insulation phenomenon of the soil layer caused by snowfall, which affected the change in soil temperature. However, air temperature and snow depth can only represent part of the climate factors. Future studies will aim to explore the relationship between precipitation and other climate factors and soil temperature and changes in the surface water heat exchange process, so as to better understand the impact on the natural environment against the background of climate change.

Author Contributions

Conceptualization, M.J. and C.D.; methodology, H.Y.; software, M.J.; validation, C.D., M.Y. and X.F.; formal analysis, R.L.; investigation, M.Y.; resources, C.D.; data curation, M.Y.; writing—original draft preparation, M.J.; writing—review and editing, H.Y. and R.L.; visualization, M.J. and X.F. All authors have read and agreed to the published version of the manuscript.

Funding

This study was supported by the Yunnan Provincial Key Laboratory of International Rivers and Transboundary Ecological Security Open Fund (2022KF03); Nanjing Hydraulic Research Institute commissioned a research project on hydrological and ecological monitoring in cold areas; key technologies of hydrological forecasting and risk control of Linhai reservoir(LHSK-KYHT02-2024).

Institutional Review Board Statement

Not applicable.

Informed Consent Statement

Not applicable.

Data Availability Statement

Publicly available datasets were analyzed in this study. The data available online here: http://disc.gsfc.nasa.gov, accessed on 15 October 2023.

Conflicts of Interest

The authors declare no conflicts of interest.

References

  1. Koster, R.D.; Guo, Z.C.; Yang, R.Q.; Dirmeyer, P.A.; Mitchell, K.; Puma, M.J. On the Nature of Soil Moisture in Land Surface Models. J. Clim. 2009, 22, 4322–4335. [Google Scholar] [CrossRef]
  2. Zhang, Y.L.; Cheng, G.D.; Li, X.; Jin, H.J.; Yang, D.W.; Flerchinger, G.N.; Chang, X.L.; Bense, V.F.; Han, X.J.; Liang, J. Influences of Frozen Ground and Climate Change on Hydrological Processes in an Alpine Watershed: A Case Study in the Upstream Area of the Hei’he River, Northwest China. Permafr. Periglac. Process. 2017, 28, 420–432. [Google Scholar] [CrossRef]
  3. Zhang, Y.; Chen, W.; Smith, S.L.; Riseborough, D.W.; Cihlar, J. Soil temperature in Canada during the twentieth century: Complex responses to atmospheric climate change. J. Geophys. Res. Atmos. 2005, 110. [Google Scholar] [CrossRef]
  4. Wundram, D.; Pape, R.; Löffler, J. Alpine Soil Temperature Variability at Multiple Scales. Arct. Antarct. Alp. Res. 2010, 42, 117–128. [Google Scholar] [CrossRef]
  5. Ullah, A.; Bano, A.; Khan, N. Climate Change and Salinity Effects on Crops and Chemical Communication between Plants and Plant Growth-Promoting Microorganisms under Stress. Front. Sustain. Food Syst. 2021, 5, 618092. [Google Scholar] [CrossRef]
  6. Zhang, T.; Barry, R.G.; Gilichinsky, D.; Bykhovets, S.S.; Sorokovikov, V.A.; Change, Y.J.C. An amplified signal of climatic change in soil temperatures during the last century at Irkutsk, Russia. Clim. Chang. 2001, 49, 41–76. [Google Scholar] [CrossRef]
  7. Corwin, D.L. Climate change impacts on soil salinity in agricultural areas. Eur. J. Soil Sci. 2021, 72, 842–862. [Google Scholar] [CrossRef]
  8. Malhi, Y.; Franklin, J.; Seddon, N.; Solan, M.; Turner, M.G.; Field, C.B.; Knowlton, N. Climate change and ecosystems: Threats, opportunities and solutions. Philos. Trans. R. Soc. B Biol. Sci. 2020, 375, 20190104. [Google Scholar] [CrossRef]
  9. Balybina, A.S.; Trofimova, I.E. Soil Temperature Dynamics in Transbaikalia under Changing Climate Conditions. Russ. Meteorol. Hydrol. 2019, 44, 712–717. [Google Scholar] [CrossRef]
  10. Goncharova, O.Y.; Matyshak, G.V.; Epstein, H.E.; Sefilian, A.R.; Bobrik, A.A. Influence of snow cover on soil temperatures: Meso- and micro-scale topographic effects (a case study from the northern West Siberia discontinuous permafrost zone). Catena 2019, 183, 104224. [Google Scholar] [CrossRef]
  11. Tsilingiridis, G.; Papakostas, K. Investigating the relationship between air and ground temperature variations in shallow depths in northern Greece. Energy 2014, 73, 1007–1016. [Google Scholar] [CrossRef]
  12. Qian, B.D.; Gregorich, E.G.; Gameda, S.; Hopkins, D.W.; Wang, X.L.L. Observed soil temperature trends associated with climate change in Canada. J. Geophys. Res.-Atmos. 2011, 116, D0210. [Google Scholar] [CrossRef]
  13. Wang, X.; Guo, W.; Zhong, Z.; Cui, X. Long Term Trends of Soil Moisture and Temperature Change in East China in Relationship with Climate Background. Adv. Earth Sci. 2009, 24, 181–191. [Google Scholar] [CrossRef]
  14. Guo, D.; Li, D.; Liu, G.J.Q.S. Simulated change in soil temperature on the Tibetan Plateau from 1901 to 2010. Quat. Sci. 2017, 37, 1102–1110. [Google Scholar] [CrossRef]
  15. Qingbai, W.; Yongzhi, L. Ground temperature monitoring and its recent change in Qinghai–Tibet Plateau. Cold Reg. Sci. Technol. 2004, 38, 85–92. [Google Scholar] [CrossRef]
  16. Qin, Y.H.; Liu, W.F.; Guo, Z.H.; Xue, S.B. Spatial and temporal variations in soil temperatures over the Qinghai-Tibet Plateau from 1980 to 2017 based on reanalysis products. Theor. Appl. Climatol. 2020, 140, 1055–1069. [Google Scholar] [CrossRef]
  17. Huang, F.; Zhan, W.F.; Ju, W.M.; Wang, Z.H. Improved reconstruction of soil thermal field using two-depth measurements of soil temperature. J. Hydrol. 2014, 519, 711–719. [Google Scholar] [CrossRef]
  18. Yang, S.H.; Li, R.; Wu, T.H.; Hu, G.J.; Xiao, Y.; Du, Y.Z.; Zhu, X.F.; Ni, J.; Ma, J.J.; Zhang, Y.X.; et al. Evaluation of reanalysis soil temperature and soil moisture products in permafrost regions on the Qinghai-Tibetan Plateau. Geoderma 2020, 377, 114583. [Google Scholar] [CrossRef]
  19. Duan, A.; Xiao, Z.J. Does the climate warming hiatus exist over the Tibetan Plateau? Sci. Rep. 2015, 5, 13711. [Google Scholar] [CrossRef]
  20. Lin, L.; Gao, M.; Liu, J.T.; Wang, J.R.; Wang, S.H.; Chen, X.; Liu, H. Understanding the effects of climate warming on streamflow and active groundwater storage in an alpine catchment: The upper Lhasa River. Hydrol. Earth Syst. Sci. 2020, 24, 1145–1157. [Google Scholar] [CrossRef]
  21. Liu, X.; Chen, B. Climatic warming in the Tibetan Plateau during recent decades. Int. J. Climatol. J. R. Meteorol. Soc. 2000, 20, 1729–1742. [Google Scholar] [CrossRef]
  22. Liu, J.T.; Gao, Z.J.; Wang, M.; Li, Y.Z.; Ma, Y.Y.; Shi, M.J.; Zhang, H.Y. Study on the dynamic characteristics of groundwater in the valley plain of Lhasa City. Environ. Earth Sci. 2018, 77, 646. [Google Scholar] [CrossRef]
  23. Wei, N.N.; Ma, C.L.; Liu, J.W.; Wang, G.H.; Liu, W.; Zhuoga, D.Q.; Xiao, D.T.; Yao, J. Size-Segregated Characteristics of Carbonaceous Aerosols during the Monsoon and Non-Monsoon Seasons in Lhasa in the Tibetan Plateau. Atmosphere 2019, 10, 157. [Google Scholar] [CrossRef]
  24. Du, J.; Li, C.; Liao, J.; Lhak, P.; Lu, H. Responses of Climatic Change on Soil Temperature at Shallow Layers in Lhasa from 1961 to 2005. Meteorol. Mon. 2007, 33, 61–67. [Google Scholar] [CrossRef]
  25. Chen, T.T.; Lang, W.; Chan, E.; Philipp, C.H. Lhasa: Urbanising China in the frontier regions. Cities 2018, 74, 343–353. [Google Scholar] [CrossRef]
  26. Li, N.; Zhou, C.Y.; Zhao, P. The Validation of Soil Moisture from Various Sources and Its Influence Factors in the Tibetan Plateau. Remote Sens. 2022, 14, 4109. [Google Scholar] [CrossRef]
  27. Ji, L.; Senay, G.B.; Verdin, J.P. Evaluation of the Global Land Data Assimilation System (GLDAS) Air Temperature Data Products. J. Hydrometeorol. 2015, 16, 2463–2480. [Google Scholar] [CrossRef]
  28. Liebl, D.; Rameseder, S.; Rust, C. Improving Estimation in Functional Linear Regression with Points of Impact: Insights into Google AdWords. J. Comput. Graph. Stat. 2020, 29, 814–826. [Google Scholar] [CrossRef]
  29. Wang, S.J.; Zhang, X.L. Long-term trend analysis for temperature in the Jinsha River Basin in China. Theor. Appl. Climatol. 2012, 109, 591–603. [Google Scholar] [CrossRef]
  30. Basarir, A.; Arman, H.; Hussein, S.; Murad, A.; Aldahan, A.; Al-Abri, M.A. Trend Detection in Climate Change Indicators Using Non-Parametric Statistics: A Case Study of Abu Dhabi, United Arab Emirates. Acta Phys. Pol. A 2017, 132, 655–657. [Google Scholar] [CrossRef]
  31. Bora, S.L.; Bhuyan, K.; Hazarika, P.J.; Gogoi, J.; Goswami, K. Analysis of rainfall trend using non-parametric methods and innovative trend analysis during 1901–2020 in seven states of North East India. Curr. Sci. 2022, 122, 801–811. [Google Scholar] [CrossRef]
  32. Cunderlik, J.M.; Burn, D.H. Non-stationary pooled flood frequency analysis. J. Hydrol. 2003, 276, 210–223. [Google Scholar] [CrossRef]
  33. Hamed, K.H.; Ramachandra Rao, A. A modified Mann-Kendall trend test for autocorrelated data. J. Hydrol. 1998, 204, 182–196. [Google Scholar] [CrossRef]
  34. Volvach, A.; Kurbasova, G.; Volvach, L. Wavelets in the analysis of local time series of the Earth’s surface air. Heliyon 2024, 10, e23237. [Google Scholar] [CrossRef]
  35. Rouyer, T.; Fromentin, J.M.; Stenseth, N.C.; Cazelles, B. Analysing multiple time series and extending significance testing in wavelet analysis. Mar. Ecol. Prog. Ser. 2008, 359, 11–23. [Google Scholar] [CrossRef]
  36. Edelmann, D.; Móri, T.F.; Székely, G.J. On relationships between the Pearson and the distance correlation coefficients. Stat. Probab. Lett. 2021, 169, 108960. [Google Scholar] [CrossRef]
  37. Liu, Y.; Wang, L.; Liu, B.H.; Henderson, M. Observed changes in shallow soil temperatures in Northeast China, 1960–2007. Clim. Res. 2016, 67, 31–42. [Google Scholar] [CrossRef]
  38. Chen, X.G.; Li, Y.; Chau, H.W.; Zhao, H.C.; Li, M.; Lei, T.J.; Zou, Y.F. The spatiotemporal variations of soil water content and soil temperature and the influences of precipitation and air temperature at the daily, monthly, and annual timescales in China. Theor. Appl. Climatol. 2020, 140, 429–451. [Google Scholar] [CrossRef]
  39. Fang, X.W.; Luo, S.Q.; Lyu, S.H. Observed soil temperature trends associated with climate change in the Tibetan Plateau, 1960–2014. Theor. Appl. Climatol. 2019, 135, 169–181. [Google Scholar] [CrossRef]
  40. Zhu, F.X.; Cuo, L.; Zhang, Y.X.; Luo, J.J.; Lettenmaier, D.P.; Lin, Y.M.; Liu, Z. Spatiotemporal variations of annual shallow soil temperature on the Tibetan Plateau during 1983–2013. Clim. Dyn. 2018, 51, 2209–2227. [Google Scholar] [CrossRef]
  41. Fassnacht, S.R.; Brown, K.S.J.; Blumberg, E.J.; Moreno, J.I.L.; Covino, T.P.; Kappas, M.; Huang, Y.; Leone, V.; Kashipazha, A.H. Distribution of snow depth variability. Front. Earth Sci. 2018, 12, 683–692. [Google Scholar] [CrossRef]
  42. Shen, M.G.; Piao, S.L.; Jeong, S.J.; Zhou, L.M.; Zeng, Z.Z.; Ciais, P.; Chen, D.L.; Huang, M.T.; Jin, C.S.; Li, L.Z.X.; et al. Evaporative cooling over the Tibetan Plateau induced by vegetation growth. Proc. Natl. Acad. Sci. USA 2015, 112, 9299–9304. [Google Scholar] [CrossRef]
  43. Grünberg, I.; Wilcox, E.J.; Zwieback, S.; Marsh, P.; Boike, J. Linking tundra vegetation, snow, soil temperature, and permafrost. Biogeosciences 2020, 17, 4261–4279. [Google Scholar] [CrossRef]
  44. Zhan, M.J.; Xia, L.J.; Zhan, L.F.; Wang, Y.H. Evaluation and Analysis of Soil Temperature Data over Poyang Lake Basin, China. Adv. Meteorol. 2020, 2020, 8839111. [Google Scholar] [CrossRef]
  45. Li, N.; Cuo, L.; Zhang, Y.X. On the freeze-thaw cycles of shallow soil and connections with environmental factors over the Tibetan Plateau. Clim. Dyn. 2021, 57, 3183–3206. [Google Scholar] [CrossRef]
  46. García-Suárez, A.M.; Butler, C.J. Soil temperatures at Armagh observatory, Northern Ireland, from 1904 to 2002. Int. J. Climatol. J. R. Meteorol. Soc. 2006, 26, 1075–1089. [Google Scholar] [CrossRef]
  47. Zhan, M.J.; Xia, L.J.; Zhan, L.F.; Wang, Y.H. Recognition of Changes in Air and Soil Temperatures at a Station Typical of China’s Subtropical Monsoon Region (1961–2018). Adv. Meteorol. 2019, 2019, 6927045. [Google Scholar] [CrossRef]
  48. Cuo, L.; Zhang, Y.X.; Bohn, T.J.; Zhao, L.; Li, J.L.; Liu, Q.M.; Zhou, B.R. Frozen soil degradation and its effects on surface hydrology in the northern Tibetan Plateau. J. Geophys. Res. -Atmos. 2015, 120, 8276–8298. [Google Scholar] [CrossRef]
  49. Li, X.; Cheng, G.; Lu, L.J.A.A.; Research, A. Spatial Analysis of Air Temperature in the Qinghai-Tibet Plateau. Arct. Antarct. Alp. Res. 2005, 37, 246–252. [Google Scholar] [CrossRef]
Figure 1. Study area and the meteorological station location.
Atmosphere 15 00450 g001
Figure 2. MK trend and mutation of average annual soil temperature in Lhasa.
Atmosphere 15 00450 g002
Figure 3. Periodic changes of soil temperature at different depths in Lhasa: contour maps of real part of wavelet coefficients (a1) ST1, (b1) ST2, (c1) ST3, (d1) ST4; Wavelet variance plot (a2) ST1, (b2) ST2, (c2) ST3, (d2) ST4.
Atmosphere 15 00450 g003aAtmosphere 15 00450 g003b
Figure 4. Seasonal variation trend of soil temperature in Lhasa.
Atmosphere 15 00450 g004aAtmosphere 15 00450 g004b
Figure 5. Annual and seasonal time series variation trend of air temperature in Lhasa.
Atmosphere 15 00450 g005aAtmosphere 15 00450 g005b
Table 1. Abrupt change in annual and seasonal soil temperature in Lhasa.
IndexSpringSummerAutumnWinterYear
ST12008, 2018, 2019, 20212008, 2019, 20202009, 2010, 2011, 20132007, 20212007
ST22008, 2019, 2020200820092007, 2018, 20192007
ST320082007, 2019, 202120082009, 2010, 20132008
ST420082008, 2020200820132008
Table 2. Climatic tendency rate of soil temperature in Lhasa.
Climate Trend Rate
(°C/Decade)
SpringSummerAutumnWinterYear
ST10.650.251.10.830.58
ST20.700.420.760.870.63
ST30.720.560.580.780.64
ST40.710.820.610.380.65
Table 3. Correlation between soil temperature and meteorological factors in Lhasa.
SeasonMeteorological FactorST1ST2ST3ST4
SpringMAT0.783 **0.706 **0.506 *0.203
Tmax0.673 **0.581 *0.3650.061
Tmin0.767 **0.716 **0.551 *0.288
SD−0.636 **−0.489 *−0.2490.119
SummerMAT0.1870.1620.1190.077
Tmax0.2190.1830.1310.066
Tmin0.1590.1520.1330.113
SD−0.522 *−0.569 *−0.576 *−0.543 *
AutumnMAT0.771 **0.676 **0.4610.288
Tmax0.731 **0.666 **0.4780.306
Tmin0.690 **0.554 *0.3060.105
SD−0.519 *−0.379−0.163−0.033
WinterMAT0.826 **0.730 **0.596 *0.232
Tmax0.771 **0.619 **0.4380.029
Tmin0.738 **0.683 **0.576 *0.265
SD−0.585 *−0.419−0.2380.131
Note: ** The correlation was significant at 0.01 level (double-tailed); * The correlation was significant at the 0.05 level (double-tailed).
Disclaimer/Publisher’s Note: The statements, opinions and data contained in all publications are solely those of the individual author(s) and contributor(s) and not of MDPI and/or the editor(s). MDPI and/or the editor(s) disclaim responsibility for any injury to people or property resulting from any ideas, methods, instructions or products referred to in the content.

