Article

Forecasting the Mitigation Potential of Greenhouse Gas Emissions in Shenzhen through Municipal Solid Waste Treatment: A Combined Weight Forecasting Model

1
Tianjin Zhongxinde Metal Structure Co., Ltd., Tianjin 300380, China
2
School of Management, Tianjin University of Technology, Tianjin 300384, China
*
Author to whom correspondence should be addressed.
Atmosphere 2024, 15(4), 507; https://doi.org/10.3390/atmos15040507
Submission received: 21 March 2024 / Revised: 11 April 2024 / Accepted: 15 April 2024 / Published: 20 April 2024
(This article belongs to the Section Atmospheric Techniques, Instruments, and Modeling)

Abstract

:
As a significant source of anthropogenic greenhouse gas emissions, the municipal solid waste sector’s greenhouse gas emission mode remains unknown, hampering effective decision-making on possible greenhouse gas emission reductions. Rapid urbanization and economic growth have resulted in massive volumes of municipal solid trash. As a result, identifying emission reduction routes for municipal solid waste treatment is critical. In this research, we investigate the potential of municipal solid waste treatment methods in lowering greenhouse gas (GHG) emissions in Shenzhen, a typical Chinese major city. The results showed that the combined treatment of 58% incineration, 2% landfill, and 40% anaerobic digestion (AD) had the lowest greenhouse gas emissions of about 5.91 million tons under all scenarios. The implementation of waste sorting and anaerobic digestion treatment of organic municipal solid waste after separate collection can reduce greenhouse gas emissions by simply increasing the incineration ratio.

1. Introduction

Given that global climate change has emerged as a paramount environmental challenge in contemporary times [1] and that greenhouse gas (GHG) emissions from municipal solid waste (MSW) constitute a significant anthropogenic source, there is a growing imperative for comprehending the influence of MSW treatment on GHG emissions. China has ascended to become the world’s foremost producer of MSW, contributing to approximately 13% of the global MSW volume [2]. In 2019, China’s cumulative MSW reached 242.06 million tons, a stark increase compared to the 7.5 million tons in 1949. Furthermore, China has held the unenviable title of the world’s largest carbon emitter since 2007, with 85% of its domestic energy-related carbon emissions concentrated in urban areas [3]. To advance the endeavor of constructing low-carbon cities, it is imperative to meticulously devise urban domestic waste treatment strategies that offer efficacious pathways for carbon emission mitigation. Shenzhen stands as one of China’s prominent megacities, characterized by rapid economic growth. With population expansion and urbanization acceleration, greenhouse gas emissions stemming from domestic waste landfill treatment in such urban centers are on a continued ascent. Waste incineration constitutes a pivotal component of low-carbon waste treatment. In contrast to landfilling, elevating the share of incineration in domestic waste treatment represents a favorable course of action. The proportion of waste incineration in the environmentally safe treatment of urban waste nationwide exceeds 50% and is poised for further enhancement in the future. Presently, waste incineration stands as the predominant and environmentally sound method for domestic waste treatment. Incineration offers the benefits of high treatment efficiency, a modest spatial footprint, and a comparatively minimal environmental footprint, aligning well with the imperative to reduce and render harmless urban domestic waste. The harnessing of thermal energy generated through waste incineration facilitates waste recycling, an approach that has gained increasing adoption and promotion in recent years. Hence, there exists an exigent need to investigate the greenhouse gas mitigation potential within domestic waste treatment in Shenzhen, which has implications for reducing greenhouse gas emissions in the waste treatment sector. Such efforts can wield a significant influence on emission reduction through the application of low-carbon strategies.
The primary purpose of trash treatment is to reduce residential waste and treat it as a resource. Incineration, landfill, and mechanical biological treatment are now the most extensively utilized municipal solid waste treatment processes. The heat created by incineration may be used to generate power, reducing greenhouse gas emissions [4]. Landfills emit significant volumes of greenhouse gases and limiting the quantity of gases released from landfills at the source, as well as collecting and using waste gases, can help to minimize landfill emissions. Organic MSW is created by anaerobic fermentation and may be utilized to generate electricity [5]. Through enhanced treatment, all three procedures can minimize carbon gas emissions. Despite the fact that several studies have been conducted to investigate strategies to minimize carbon emissions from municipal solid waste disposal, it is unclear which treatment method is best suited for the sustainable management of Chinese cities. As a result, this paper suggests three possible scenarios for combining incineration, landfill, and biological treatments and addresses the calculation of greenhouse gas emissions under these scenarios, providing a novel method for predicting greenhouse gas emissions.
This study’s key contribution consists of three aspects:
(1)
A combination weight prediction model was developed to accurately anticipate the quantity of municipal solid garbage created from 2023 to 2030;
(2)
Various scenario combinations were given to assess the carbon-reduction potential of incineration, landfill, and biological treatment;
(3)
A carbon emission reduction optimization strategy suited for the development of low-carbon municipal solid waste management in Shenzhen and similar cities is presented based on the emission reduction potential.

2. Literature Review

2.1. Research on MSW Treatment

Global interest has been drawn to studies on the greenhouse gas emission reduction potential and emission reduction routes for municipal solid waste treatment. Incineration, landfill, and bioconversion are the three primary methods extensively employed in sustainable municipal solid waste management and simultaneous energy production. Incineration has the ability to cut trash by 75% and waste volume by 90%, while the heat created by garbage incineration may be utilized to generate energy, lowering greenhouse gas emissions. However, incineration emits harmful compounds such as dioxins and heavy metals during operation, resulting in secondary damage to the environment, and incineration has specific criteria for the calorific value of municipal solid waste [6]. Landfill is one of the most common waste treatment options in poor nations [7]. However, it is hazardous to the environment, human health, land degradation, and groundwater contamination. Anaerobic digestion (AD) is the process by which microbial breakdown of organic biodegradable material produces biogas under anaerobic circumstances [8]. The output of biogas in AD is determined by many factors and matrix compositions, and the biogas generated typically comprises 50–75% methane, 25–50% carbon dioxide, and 1–15% other gases [9]. In terms of municipal solid waste management, this strategy outperforms landfills [10] and produces less greenhouse gases [11]. At the same time, AD technology produces biogas that may be utilized to generate electricity.
Incineration has a lower environmental effect than other disposal options, such as open dumping and landfilling. Because of the numerous benefits of incineration, several nations have adopted this technology for sustainable municipal solid waste management and energy recovery [12]. Incineration is currently the most important treatment technology in Shenzhen’s municipal solid waste treatment, accounting for approximately 68%, landfill accounting for approximately 11%, and biological kitchen waste treatment accounting for the remainder (https://www.sz.gov.cn/zfgb/2022/gb1249/content/post_9932684.html, accessed on 1 July 2021). However, some studies that have analyzed the composition of waste in various countries have discovered that the organic components of municipal solid waste have a high water content and low calorific value, making them unsuitable for combustion, and have concluded that anaerobic digestion is the best waste management technology for developing countries [13]. As a result, based on the existing state of municipal solid waste treatment in Shenzhen, this study suggests three potential combination scenarios to determine which combination of treatment techniques provides the most environmental advantages.

2.2. Research on Greenhouse Gas Emission Accounting

Previous studies have used a variety of methods to study the determinants of urban GHG emissions change in China, including the LMDI method, STIRPAT model, input–output model, and regression and correlation statistical analysis [14,15,16,17]. Systems analysis is a useful tool for integrating promising waste management strategies [18]. The LEAP (Low Emission Analysis Platform), established using sector analysis methods, is closely combined with scenario analysis methods and can be used to predict medium- and long-term energy supply, energy supply conversion, energy terminal demand, and pollutant gas emissions under different development conditions. Mancini employed an industrial symbiosis-based approach to optimize the heat provided by the waste-to-energy (WTE) plant to increase the production of AD biogas and make it suitable for use in public transportation, thereby reducing GHG emissions [19]. LCA is a tool to optimize process operating conditions for decision-making [20]. Dastjerdi used the LCA approach to assess the potential of WTE technology for residual waste management in New South Wales, where incineration and AD technology can develop considerable energy from residual waste and mitigate GHG emissions [21]. System dynamics (SD) is a method to calculate the complex effects of environmental and economic factors. Xiao et al. adopted the SD method to integrate social and economic factors, population factors, and policy measures and simulate their dynamic impact on MSW with a strong dynamic [22]. Most studies use a single model for GHG emissions simulation, but this is insufficient given the inherent limitations of each single model. Therefore, a Combined Weight Forecasting Model (CWFM) is proposed to predict the amount of MSW to 2030, and three scenarios are prepared by using different combinations of incineration, AD, and landfill. The estimation of GHG emissions under these scenarios is discussed, which provides a new way for GHG emission prediction.

2.3. MSW Prediction Models
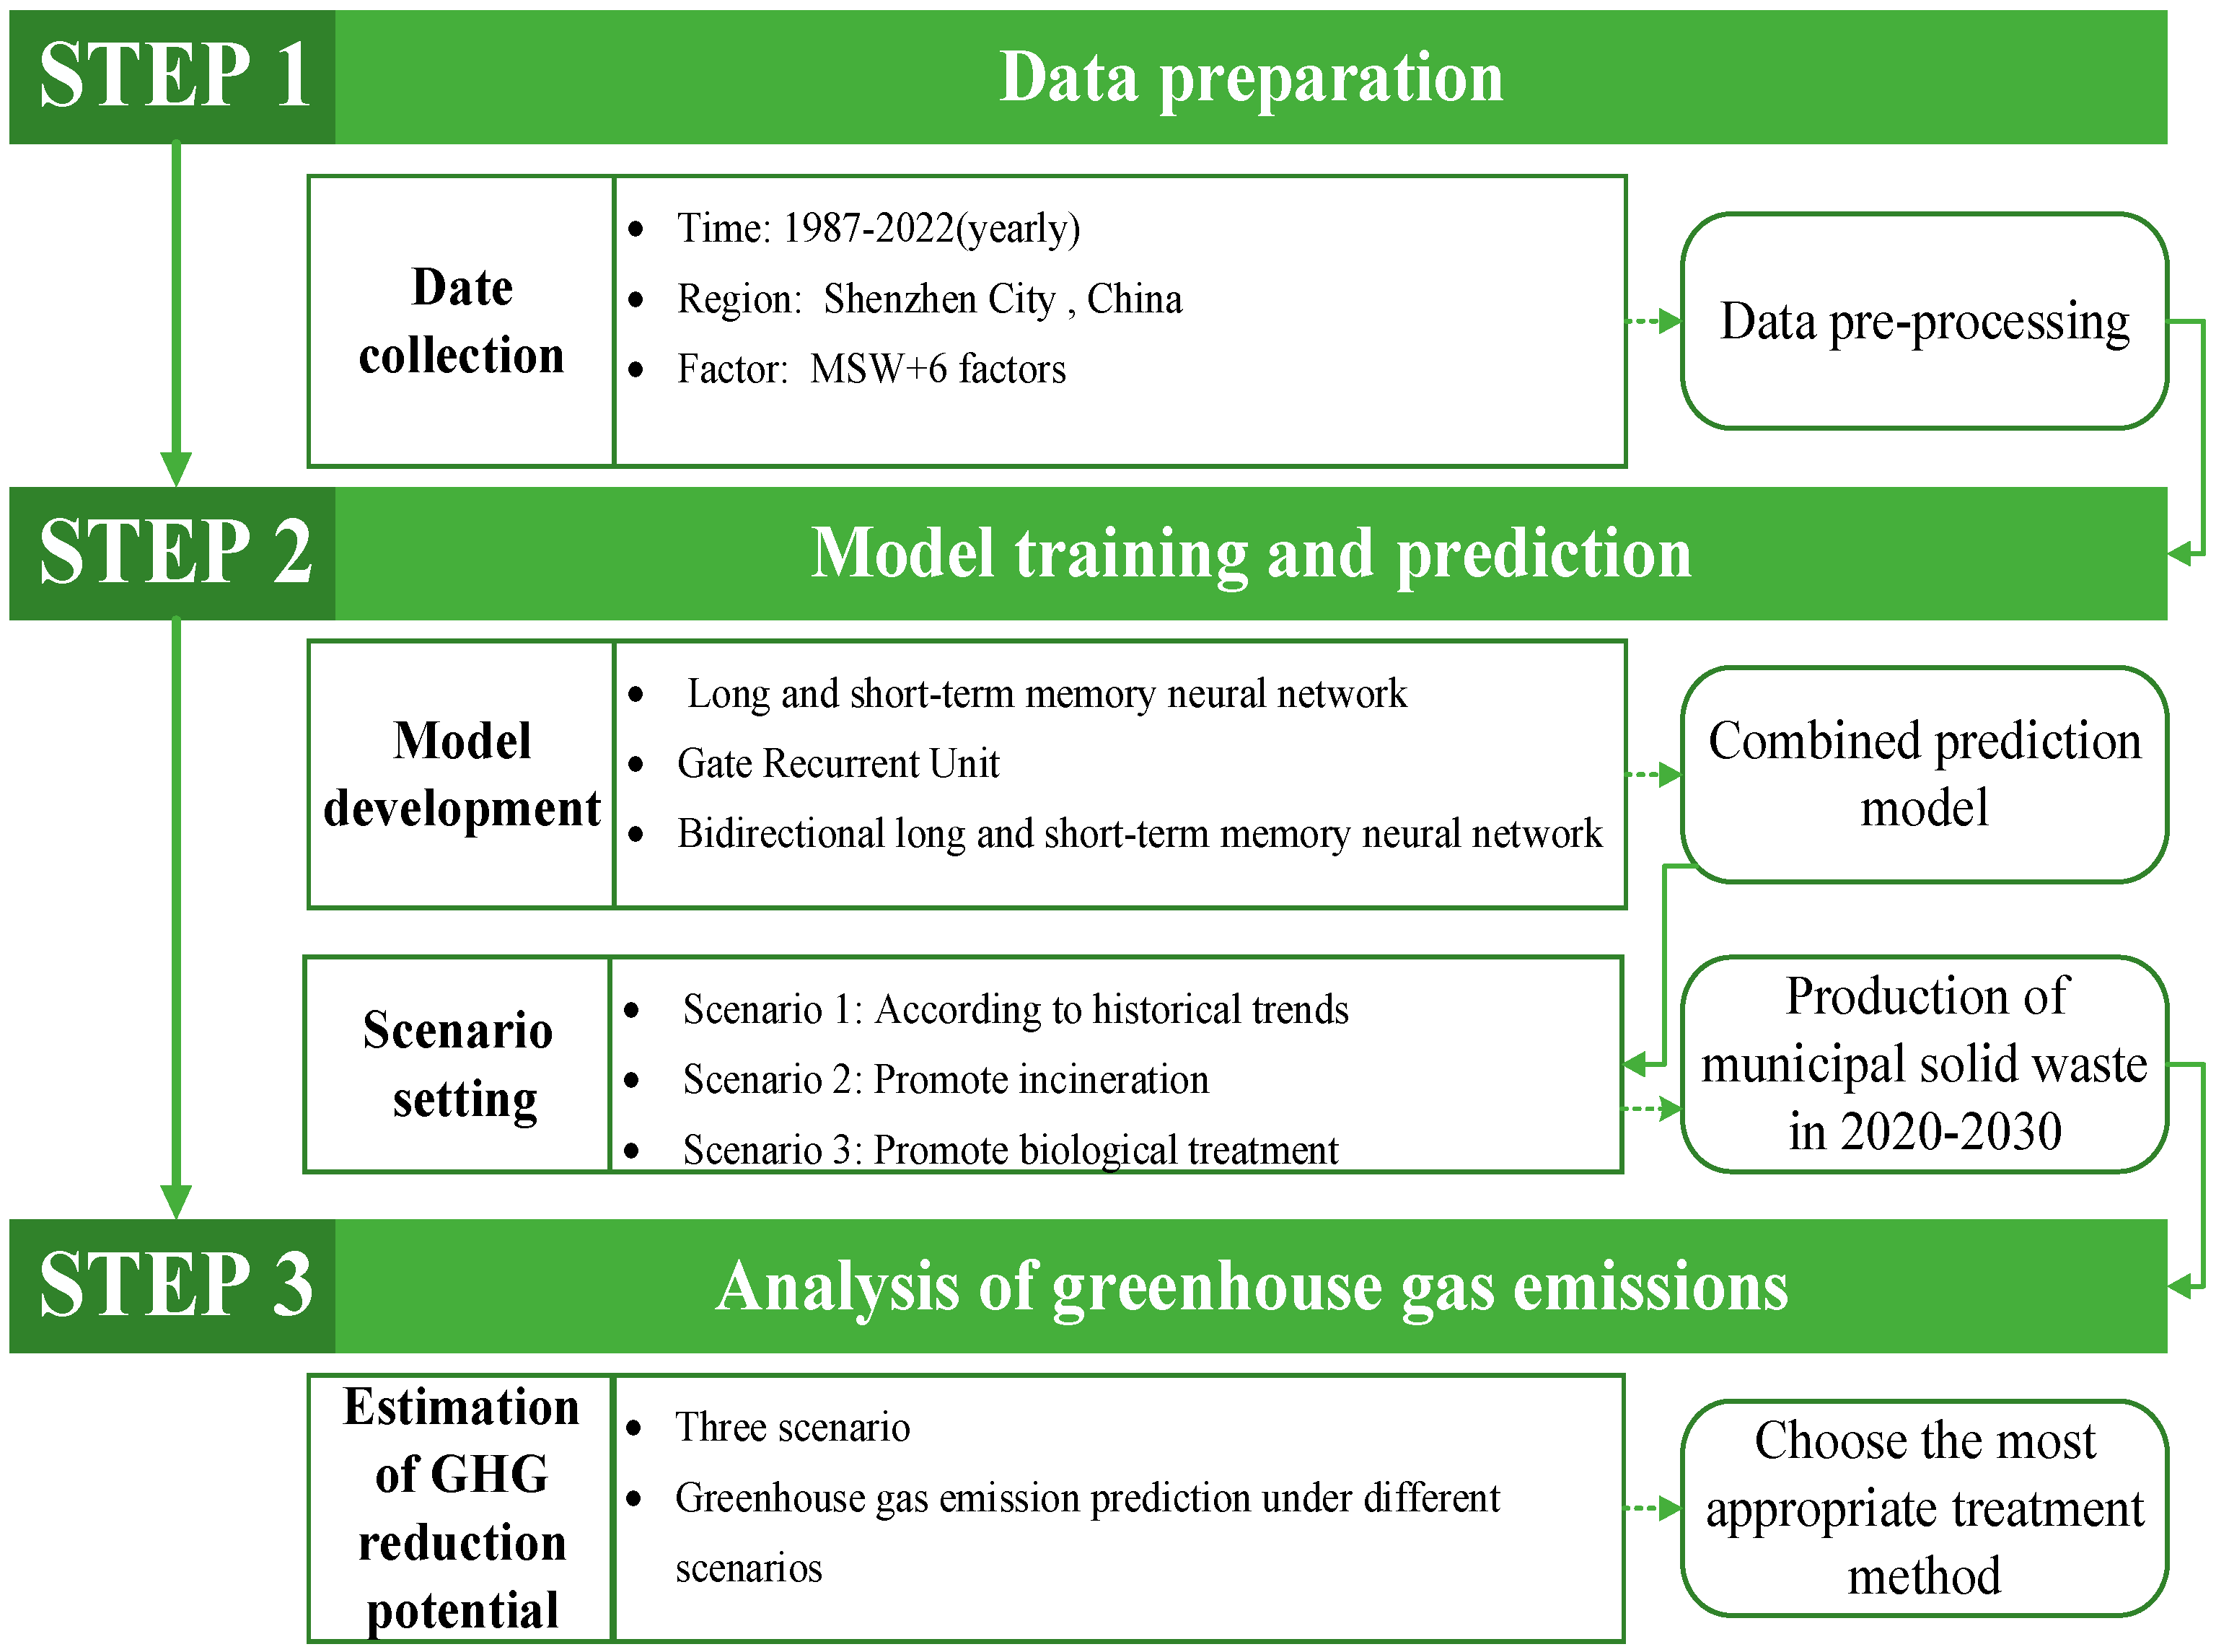
The main models used by scholars to predict MSW generation include traditional statistical models and machine learning models [23]. Among them, traditional statistics are widely used in predicting the relationship between socioeconomic factors and the amount of municipal solid waste generated [24]. Jiang et al. proposed a probabilistic model-driven statistical learning method, which combines wavelet denoising, Gaussian mixture model, and hidden Markov model, and verified that the model can effectively solve the prediction problem of urban waste production [25]. Taking Xiamen as an example, some scholars used SARIMA and gray system theory to predict the amount of MSW generated on multiple time scales. The results showed that the model has good robustness, can better fit and predict the seasonal and annual dynamics of MSW production on monthly, medium-term, and long-term time scales, and achieves the expected accuracy [26]. Scholars often use support vector machines (SVM), decision trees (DT), and genetic algorithms (GA) to predict the amount of municipal solid waste in the medium to long term, but their ability to predict the amount of municipal solid waste may deviate. In order to improve the accuracy of prediction, scholars have introduced a hierarchical model of artificial neural networks (ANN) in time series analysis. Its complex structure enables a nonlinear mapping ability and strong self-learning ability in the neural network [27]. Fan et al. developed and optimized an artificial neural network model for urban solid waste prediction and concluded that the regional difference in urban solid waste prediction is greater in the east–west direction than in the north–south direction. Although the accuracy of neural network prediction is very high, considering that the input data must be continuous and effective, there is still a practical problem: it is difficult to make long-term predictions. To overcome these shortcomings, with the expansion of data dimensions and breakthroughs in training methods, deep learning, as a powerful method for automatically learning feature representations from data, has shown good performance in solving nonlinear, time-varying, multi-source, and multi-objective problems. Therefore, deep learning has great potential for application in the field of MSWM [28]. Recursive neural networks (RNN) are typical deep learning algorithms that are mainly used to describe the dynamic behavior of time series data, but they have problems with gradient disappearance and explosion and lack long-term memory capabilities. To overcome these shortcomings, researchers have developed many deep learning methods to upgrade to traditional artificial neural networks [29], including the long short-term memory (LSTM) widely used in time series analysis. Due to the limitations of traditional neural network applications and insufficient understanding of time changes, it has become a bottleneck in the prediction and management of urban domestic waste.
A single model often contains only one aspect of information and cannot extract sufficient data information. In order to improve the prediction accuracy of nonlinear complex systems, the composite weight combination prediction model with multidimensional information will further reduce the model error [30]. The purpose of adopting a combined forecasting model is to maximize the collection of information and fully mine useful information in the data to improve the forecasting accuracy of the model. Different prediction models reveal the evolution rules of prediction objects from different perspectives and levels to a certain extent [31] and can fully and effectively utilize the advantages of various prediction models to establish a composite weight combination prediction model with nonlinear prediction performance in a multidimensional influencing factor environment. For the prediction of domestic waste clearing and transportation volume disturbed by many complex influencing factors, using a composite weight combination prediction model that can achieve inflection point prediction and nonlinear approximation prediction function can more accurately predict the timing [32]. Therefore, this study proposes a combined weight prediction model based on LSTM, GRU, and BiLSTM. Based on the obtained input data set, a proportional domestic waste treatment scenario is designed to predict the amount of domestic waste generated in Shenzhen and explore the greenhouse gas emission reduction potential of different waste treatment methods, leading to optimization strategies for optimizing carbon emission reduction in domestic waste, in order to facilitate the efficient and quantitative reduction in domestic waste and provide a strong scientific basis for urban environmental health management departments and domestic waste treatment enterprises when formulating relevant planning strategies.
This study has three advantages. First, the integrated prediction model of the combined model was not used to forecast municipal solid waste. The combined model was used to forecast how much municipal solid garbage would be created. Second, to ensure the models’ prediction capability, three neural network models with good prediction accuracy and computational efficiency were chosen for weight combination. Third, a unique combination scenario of municipal solid waste treatment technologies should be presented to assess the greenhouse gas emission potential of residential trash under various future scenarios, providing useful insights for domestic waste management.

3. Methods and Data

3.1. Data Collection and Preprocessing

This study collected and integrated 287 sets of data on Shenzhen’s socioeconomic status and urban domestic waste, including GDP, total retail sales of social consumer goods, per capita disposable income, per capita consumption expenditure, actual passenger capacity, permanent resident population, and urban domestic waste clearance. The data were sourced from the China Statistical Yearbook and the Shenzhen Statistical Yearbook. Due to random errors occurring during the collection of these statistical data, different data scales can lead to significant numerical differences. This study conducted data preprocessing to help erase invalid data samples and eliminate the impact of dimensions, improving the accuracy of prediction.

3.2. Prediction Model

3.2.1. Single Models

Long Short-Term Memory (LSTM) is a sort of recurrent neural network (RNN) that can remember values from past steps and apply them in the future. The major goal is to overcome the problem of gradient vanishing and gradient explosion throughout the extended sequence training procedure. LSTMs outperform conventional RNNs in extended sequences. LSTM adds input gates, forgetting gates, and output gates to the traditional RNN structure, which can decide whether to retain information based on the importance of the allocated data, which solves the long-term dependence problem of traditional RNN prediction, but it is difficult to train due to the large number of parameters. The one-way LSTM model normally uses past information to derive follow-up information; however, in time series forecasting, prediction accuracy may be enhanced by taking into account the prediction time’s information rules. The theory of a Bi-Directional Long Short-Term Memory (Bi-LSTM) neural network was created in response to the inadequacies of LSTM in the external theory of temporal serialization. The Bi-LSTM neural network combines the output results of the forward and reverse input sequences using two LSTM neural networks, the forward calculation implicit vector and the backward calculation hidden vector [33].
GRU, proposed by Cho et al., is comparable to LSTM but has a lower gate count. The GRU combines the LSTM’s input gate and forgetting gate into a single gate known as the update gate. Furthermore, there is no distinct cell state since it simply depends on a hidden state to repeat memory transfers between cells [34]. To overcome the leakage gradient problem in the GRU, both the reset gate and the update gate are utilized, which are two vectors that influence the flow of information in the network/layer to the desired output with a simpler structure [35]. While single models are quite flexible and have strong predictive accuracy, they have certain limits. For starters, they rely on massive volumes of data that reflect various operational circumstances. A minor misrepresentation of the input data might cause a large difference in the output value. Second, there is a lack of suitable generic techniques for hyperparameter tuning and data initialization, resulting in overfitting, underfitting, and local optimization issues [36]. Because some control techniques rely on the accuracy of predictions, these constraints may have an impact on the real-time implementation of these models in field applications. To circumvent these restrictions, the notion of combinatorial models is developed.

3.2.2. The Framework of the CWFM Model

Considering the nonlinear characteristics of long-term time series data, adopting a composite weight combination prediction model that can achieve inflection point prediction with a nonlinear approximation prediction function can achieve more accurate prediction throughout the process. The combination prediction model maximizes the advantages of a single prediction model, overcomes shortcomings, and improves the accuracy of prediction and the stability of prediction results [37]. This study constructed a combined weight prediction model based on the fusion of LSTM, GRU, and BI-LSTM. A single model suitable for different characteristics of garbage clearing volume and input data was used for prediction, and then these single models were appropriately combined with weights to build a combined model. Finally, the established combined model was applied to predict the long-term garbage removal volume accurately. It can accurately extract sample information from individual prediction models and can also reduce the interference of individual prediction models by various random factors, thereby improving the prediction accuracy of the overall model. The relevant theoretical basis and calculation formula are as follows:
For the same prediction problem, m prediction models are selected to predict, representing the predicted value of the ith model (j = 1, 2, …), Xt represents the predicted value of the combined model at time t, Wi is the weight coefficient of the ith prediction model that satisfies i = 1 m w i =1. The predicted values obtained from CWFM are shown below:
X ^ t = i = 1 m W i x ^ i = W 1 x ^ 1 + W 2 x ^ 2 + + W n x ^ n
The prediction error of a single model is expressed as follows:
e i t = x i t x ^ i t
where eit represents the prediction error of model i at time t, xit represents the real value of model i at time t, and x ^ i t represents the predicted value of model i at time t.
The CWFM error is expressed as follows:
E t = X t X ^ t
where E t is the prediction error of CWFM at time t, Xt is the predicted value of CWFM at time t, and X ^ t is the real value of CWFM at time t.
In CWFM, when the calculation methods of the weight of a single model are different, the prediction results and accuracy of the CWFM constructed will be different, so it is very important to select a reasonable weight calculation method. At present, there are many calculation methods for weight, such as the gray correlation coefficient method [38], rough set theory [39], Bayes method [40], Shapley value method [41], and so on. Considering the actual situation and the complexity of the calculation, the inverse variance method was chosen in this paper. The method selected in this paper was the inverse variance method. The prediction error of a single model was used to calculate the sum of squares of errors of a single model, and the larger sum of squares of errors in a single model was given a smaller weight. On the contrary, the smaller sum of squares of errors in a single model was given a larger weight. If the sum of squares of errors in its combined forecasting model is minimized, this weight selection can minimize the inaccuracy in the estimation of the combined effects. The calculation formula is as follows:
W i = D i 1 / i = 1 m D i 1 , i = 1 n w i = 1
where D i represents the sum of error squares of single model i, and is defined as follows:
D i = i = 1 m x i t x ^ i t 2 , ( i = 1 , 2 , )
where x i t , x ^ i t represent the same as in Formula (2).
The research steps are shown in Figure 1.

3.3. GHG Emissions from MSW Treatment

This study calculated GHG emissions through accounting methods for greenhouse gases in the industry from MSW incineration, anaerobic digestion, and landfill in Shenzhen. This study did not consider GHG emissions from MSW transport, which may be affected by the topographic environment, as these emissions only account for a small proportion of total GHG emissions from MSW [42]. Carbon dioxide produced by biowaste decomposition was ignored [43]. If it was assumed that temporary waste storage was not considered to emit GHG. Methane (CH4) and nitrous oxide (N2O) were 25 kg CO2, respectively, -eq/kg CH4 and 265 kg CO2 -eq/kg N2O [44]. The direct and indirect GHG emissions of MSW considered in this study are listed in Table 1.

3.3.1. Incineration

GHG emissions from incineration include direct and indirect emissions. Indirect emissions come from water and oil use, while direct GHG emissions include CO2 (incineration of CO2) and N2O (incineration of N2O). As shown in Equations (6)–(9), GHG emissions can be reduced by implementing electric recovery.
I n c i n e r a t i o n = G H G d i r e c t + G H G i n d i r e c t = ( I n c i n e r a t i o n c o 2 + I n c i n e r a t i o n N 2 O × 265 ) + G H G i n d i r e c t
I n c i n e r a t i o n c o 2 = i ( W × d m i × C F i × F C F i × O F i × 44 12 )
I n c i n e r a t i o n N 2 O = i ( W × E F W T E N 2 O ) × 1 0 6
G H G i n d i r e c t = ( W w a t e r × E F w a t e r ) + ( W o i l × E F o i l ) ( W e l × E F e l )
The dmi and CFi are described in Table 1, respectively. In 2019, FCFi was 37.99%, representing the molecular weight ratio of CO2 to C. I indicates the type of waste incineration or biomass treatment. For indirect GHG emissions, water (Iwater), oil (Ioil), and electricity generation (Iel) were multiplied by their emission factors, as described in Table 1. With regard to GHG emissions, parameters for biochemical treatment are derived from IPCC guidelines 2006. The parameters used to calculate GHG emissions from landfills and incinerators were collected from the Provincial GHG Inventory Compilation Guide (Trial) (Development and Reform Commission of Shenzhen Municipality, Shenzhen, China, 2011).

3.3.2. Biochemical Treatment

Direct GHG emissions and the presence of biomass treatment capacity. GHG emitted by biochemical treatment is as follows:
B I O = I N C I N E R A T I O N + A D = ( G H G d i r e c t + G H G i n d i r e c t ) + ( G H G A D e A D )
G H G A D = ( G H G A D C H 4 × 28 ) + ( W × D O C × D O C f × F × 44 12 ) × 89 %
G H G A D C H 4 = i ( W × E F A D C H 4 ) × 1 0 6
This represents 89% of the proportion of biomass residue that is burned after biomass treatment without recovery. The electric energy generated by biomass processing mainly comes from CH4 gas, and the calculation formula is as follows:
e A D = W × E F A D C H 4 × A D e l

3.3.3. Landfill

As shown in Table 2, the main GHG emitted by landfills is CH4 (landfill gas [LFG]CH4). GHG emissions from landfills were calculated based on the nature of MSW (IPCC, 2006)
L F G ( C H 4 ) t = ( W × M C F × D O C × D O C f × F × 16 12 R ) × ( 1 O X )
where is the molecular weight ratio of CH4 to C. The total GHG emissions from landfills were calculated as follows:
L F G = L F G C H 4 × 25
CH4 has a GWP of 25.

3.4. Scenario Setting

In 2019, China incinerated 121.742 million tons of domestic waste, accounting for 50.7 percent of the total, exceeding sanitary landfills for the first time. With waste incineration as the main body, resource conversion as the priority, and sanitary landfills as the bottom of the solid waste terminal treatment pattern taking shape, sanitary landfills as the bottom of the domestic waste disposal guarantee disposal facilities will exist forever. Based on the characteristics of GHG emissions in the process of MSW treatment in Shenzhen, Table 2 designs three MSW management schemes in Shenzhen from 2020 to 2030.
The urban domestic waste disposal structure designed in Scenario 1 is more in line with the current situation of Shenzhen’s disposal ratio. In 2020, the city collected and disposed of 6.67 million tons of domestic waste, incinerated 6.23 million tons and disposed of 440,000 tons in landfills. By using MSW heat power generation, Shenzhen has had an advantage in recent years, as the main mode of municipal waste disposal has been changed from landfill to incineration. Its main advantage is reducing the total amount of municipal waste. In addition, biochemical treatment (anaerobic digestion) technology to deal with food waste is also being gradually implemented. Scenario 1, therefore, assumes that the waste incineration rate is maintained at 68.1%, the landfill rate is controlled to 10.8%, and the anaerobic digestion rate is 21.8%.
Scenario 2 aims to compare the treatment structure of MSW in Scenario 1, subject to future policy support. According to the 14th Five-Year Plan for Domestic Waste Disposal in Guangdong Province, by 2030, cities in the Pearl River Delta region will strive to achieve nearly “zero landfill” for primary domestic waste, and the waste incineration rate will reach more than 90%. To date, the anaerobic digestion technology has not been widely used in Shenzhen. Therefore, the waste incineration rate in Scenario 2 is set at 90% to analyze the potential of a high incineration rate to reduce GHG emissions, while the landfill rate is controlled at 2% and the anaerobic digestion rate at 8%. Waste incineration minimizes the volume and weight of waste, solving problems such as large waste footprints, and the incineration process also generates energy that can be used for electricity generation and other purposes.
Scenario 3 implements garbage classification, collects and bio-treats biodegradable organic household and kitchen waste separately, and incinerates the rest. As anaerobic digestion technology matures and becomes more widely used in Shenzhen in the future, the treatment of MSW is expected to achieve nearly “zero landfill”. It is expected that by 2030, organic municipal solid waste will account for 40% of MSW in Shenzhen, so Scenario 3 assumes that the anaerobic digestion rate will be 40%, the landfill rate will be controlled at 2%, and the incineration rate will be maintained at 58%. Anaerobic digestion of food waste not only recovers energy but also reduces the amount of sludge generated, greatly alleviating the environmental impact of MSW.

4. Results and Discussion

4.1. Model Accuracy

By comparing the prediction results of the LSTM, GRU, and BI-LSTM models, it was found that the three models were all suitable for the prediction of actual domestic garbage, but there were some differences in the results, which was due to the influence of external interference. The single prediction model failed to give full play to its advantages, resulting in the difference between the theoretical predicted value and the actual predicted value, which reduced the final prediction accuracy. The CWFM can determine the weight of each model according to the actual predicted value, which ensures the effective combination of the advantages of the three prediction methods, thus reducing the risk of a single prediction model. In this paper, the inverse variance and simple weighting methods were used to calculate the weight coefficients of the three prediction models, and the combined weight model was constructed to predict the MSW.
The LSTM, GRU, and BiLSTM neural networks contain four parameters that affect the prediction accuracy of the model, including the learning rate, the time step of each layer, the number of Hidden layers of each layer, and the number of training epochs. When the number of Hidden layers gradually increases, the number of Hidden layer neurons has little effect on the results, and the prediction error curve is relatively stable. In the training process of the model, the setting of a single parameter is different, but other parameters are the same so as to find the best prediction model. Each parameter setting in the proposed model is shown in Table 3, Table 4 and Table 5. The process steps of adjusting parameters are as follows: (1) Adjust the three-model architecture suitable for time series prediction and test the applicability of the model architecture to the data set. (2) The optimal number of Hidden layers is determined according to the size of the data set. (3) According to the data characteristics of the data set, the optimal activation function is selected from the four types of sigmoid, tanh, relu, and linear functions. (4) The learning rate value, time step, and batch size are determined by grid search. At the beginning of the experiment, the default super parameter setting is used to observe the change in loss, preliminarily determine the range of each super parameter, and then adjust the parameters. For each super parameter, we only adjust one parameter each time and then observe the loss change until the optimal parameter is determined. The final calculation results are shown in Table 6.
Three assessment metrics were chosen for this study: Mean Absolute Percentage Error (MAPE), Root Mean Square Error (RMSE), and Mean Absolute Error (MAE) in order to evaluate the validity and accuracy of the proposed MSW prediction model. These criteria were employed to assess the model’s capacity to fit the data and its predicted performance. The difference between the simulated and modeled data was calculated using MAPE, RMSE, and MAE. The values are equal to 0 when the expected and actual values coincide exactly, and they range from 0 to +∞. The value increases with increasing mistakes. We employed the most recent deep learning techniques along with established machine learning strategies like Support Vector Regression (SVR), Grey Correlation Analysis, and Support Vector Regression (GRA-SVR) models to assess and analyze the predictive power of the combined LSTM, GRU, and Bi-LSTM models. The control groups were the Gated Recurrent Unit of Choice (GRU), Gated Recurrent Unit Grey Correlation Analysis (GRA-GRU) combination models, and the Long Short-Term Memory Network (LSTM). Table 7 displays these findings.
The combined LSTM-GRU-BiLSTM model had the lowest prediction error and the highest forecast accuracy among the eight prediction models, with the SVR model having the largest prediction error. In comparison to LSTM-GRU-BiLSTM, GRA-LSTM, GRA-GRU, and GRA-SVR, respectively, the prediction errors of BiLSTM, LSTM, GRU, and SVR were larger. Following the SVR and GRU algorithms, where the MAE, MAPE, and RMSE of the SVR and GRU algorithms were, respectively, 0.35, 24.62%, 0.36, and 0.34, 20.75%, 0.32, the GRA-SVR model had the second-highest prediction errors. Even with less variability, GRA-GRU performed better than the GRU model. Both the LSTM-GRU-BiLSTM and the GRA-LSTM models obtained better results than the BiLSTM model. For LSTM-GRU-BiLSTM, the corresponding values for MAE, MAPE, and RMSE were 0.22, 4.12, and 0.21. When compared to other models, the combined LSTM-GRU-BiLSTM model had the lowest prediction error.

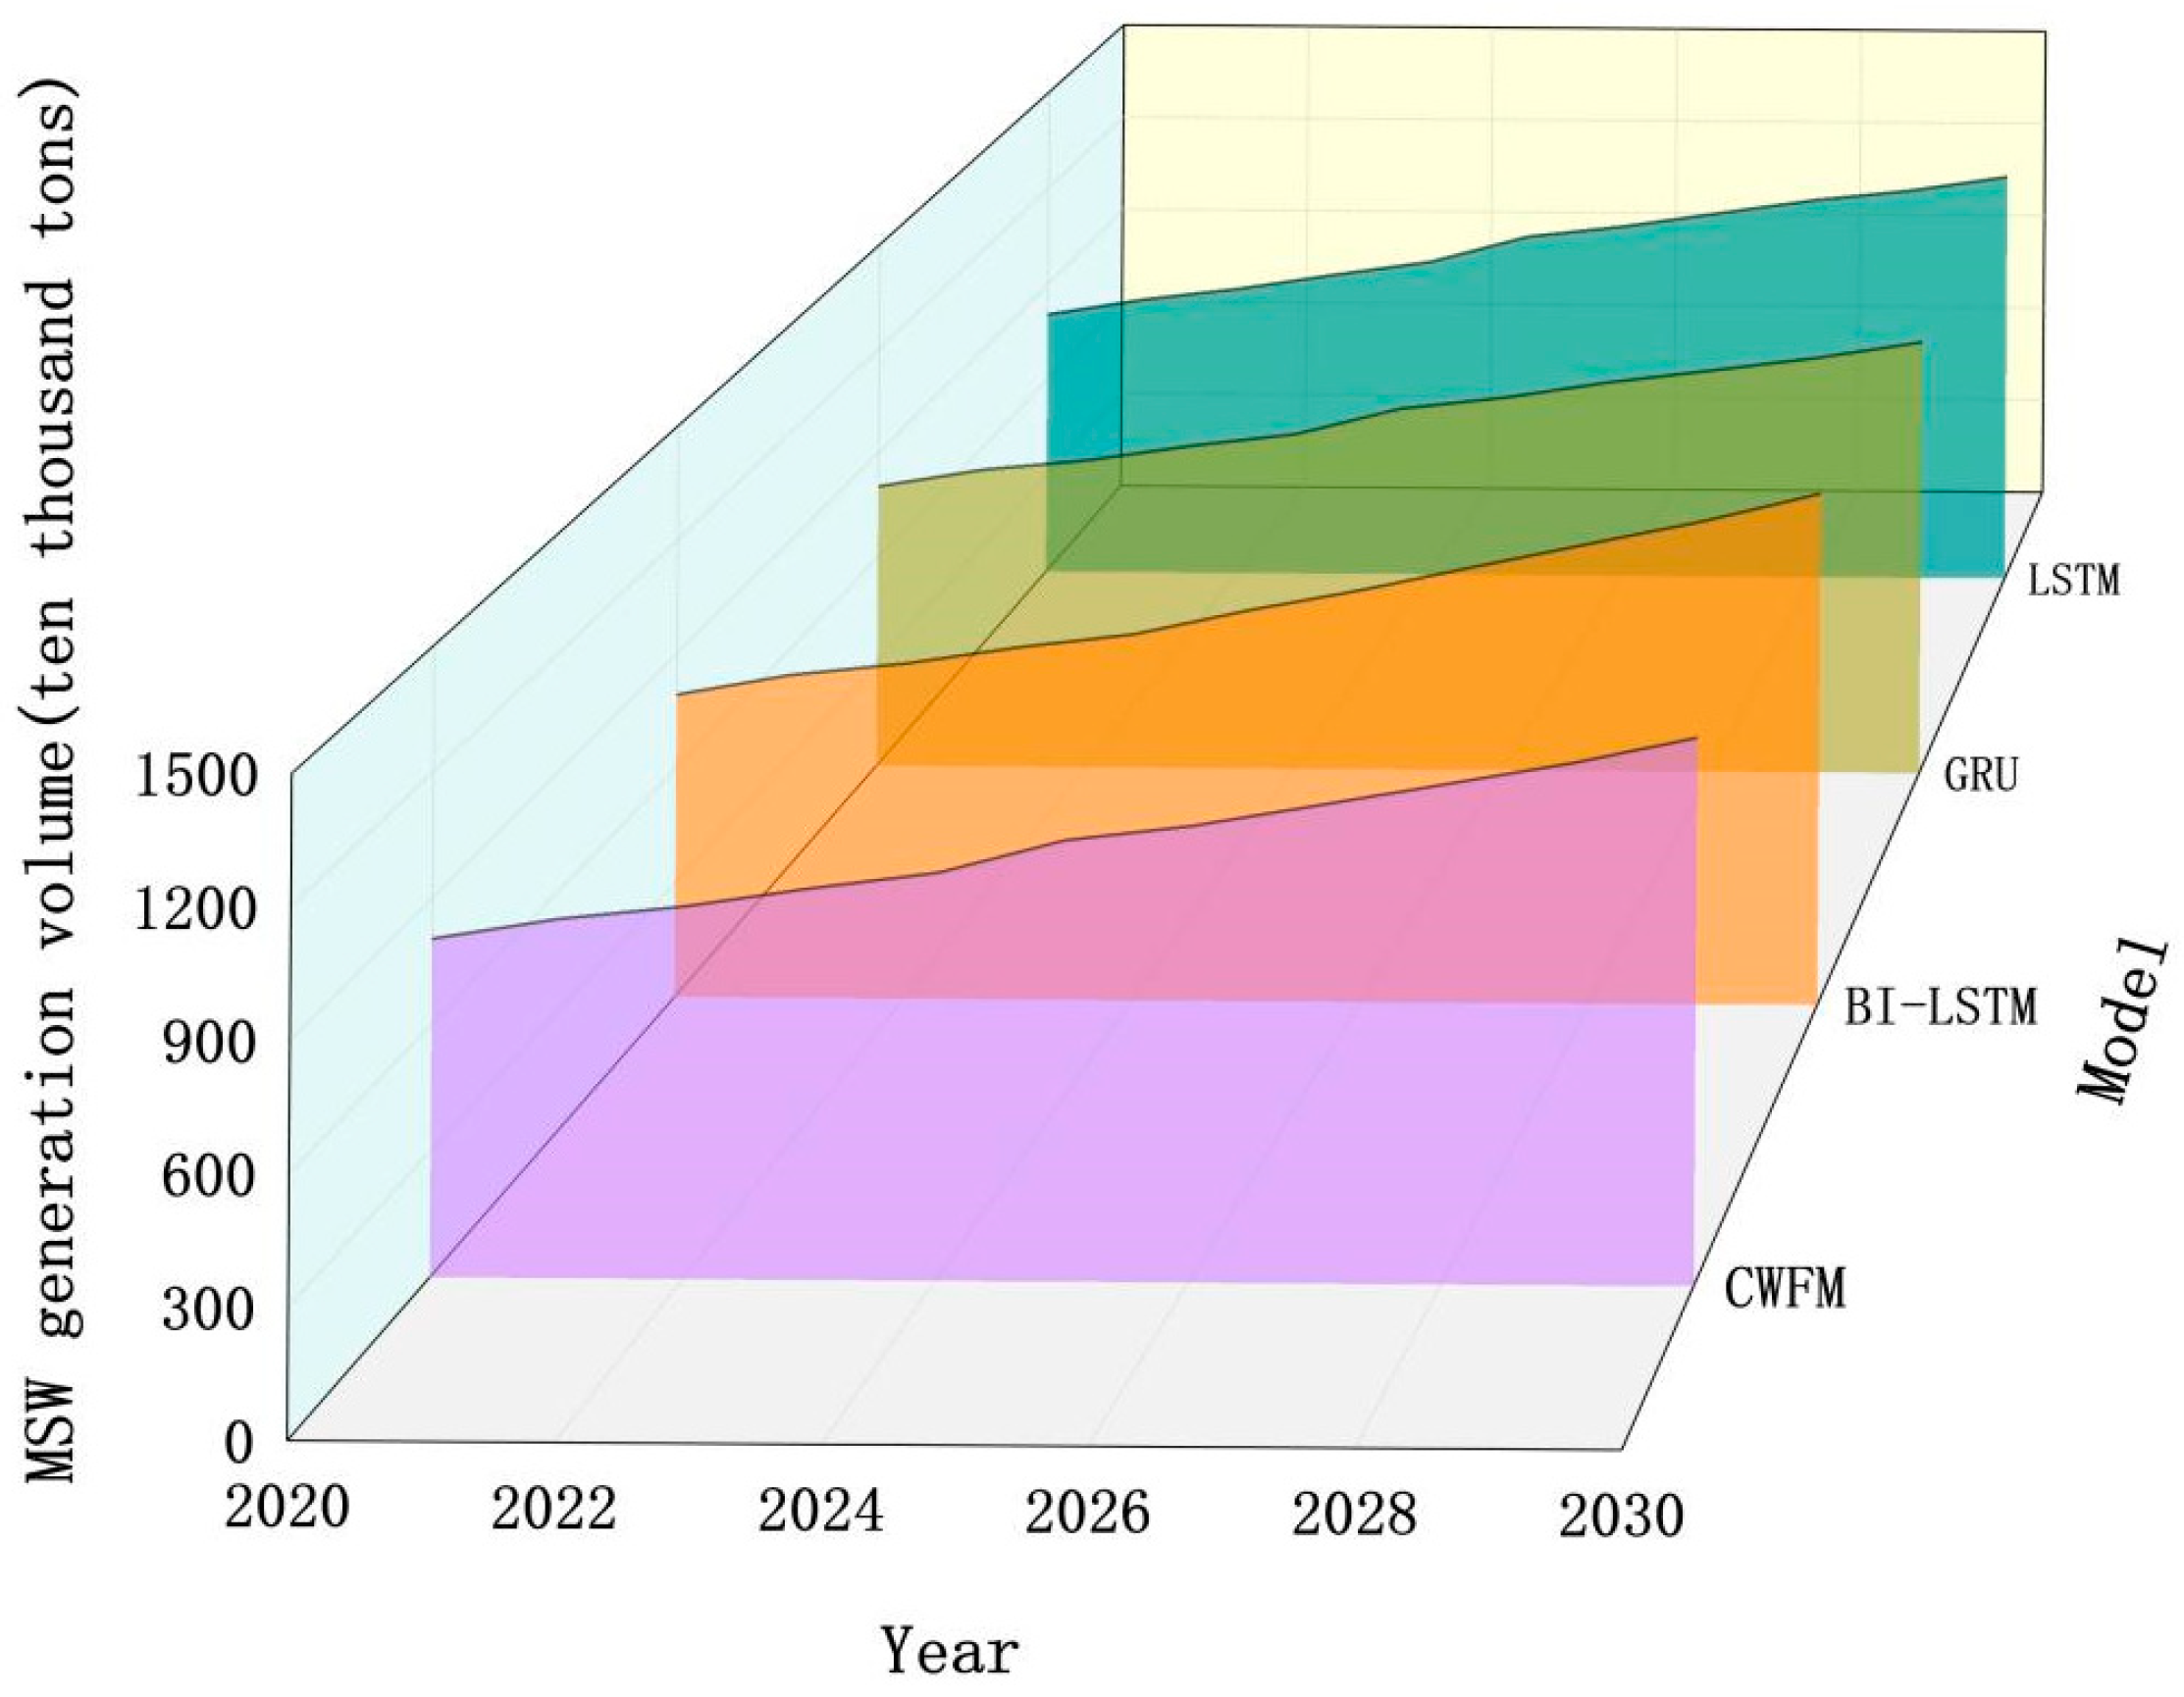
4.2. Predicted MSW Generation

Combined with the historical data of the six indicators and the related planning of macroeconomic, social consumption, and population indicators, the characteristic change trend of each indicator was reasonably analyzed, the benchmark scenario was set, and the value of each indicator was calculated according to the benchmark scenario, so as to effectively predict the amount of MSW production. Based on economic development, this study established a baseline scenario to predict the MSW production in Shenzhen from 2020 to 2030. The baseline growth scenario, based on the average year-on-year growth rate of each indicator from 1978 to 2019, is more in line with the current development situation, and the trend of each indicator feature from 2020 to 2030 is more accurate. The data sequence growth rate in the baseline scenario is shown in Table 8.
Because the predicted data are in good agreement with the historical data, this model can be used to forecast the future MSW. In this study, three different individual models were used to predict the experimental objects, and then these individual models were integrated with the appropriate weight allocation criteria. It was found that the CWFM model had the highest prediction accuracy, and the CWFM combined model was used to predict the MSW production in Shenzhen from 2020 to 2030 in 11 years. The index characteristics of the above reference scenario were input into the optimal prediction model to reasonably predict the MSW production in Shenzhen. The forecast results of MSW production under different circumstances are shown in Figure 2. The forecast results showed that the amount of MSW in Shenzhen will rise gently in the future, from 8.03 million tons in 2020 to 13.01 million tons in 2030.
In order to solve the urban living garbage issue to speed up growth and promote economic and social development in a new stage of development, it is necessary to accelerate the living garbage classification of classified collection, transport, and the construction of facilities for treating the garbage. Further, to close the treatment capacity gap and improve the urban environmental infrastructure together with the ecological environment, it is necessary to modernize the treatment capacity, promote the formation of domestic waste classification and treatment systems compatible with economic and social development, and comprehensively promote the construction of incineration treatment facilities. In areas where the daily garbage collection volume exceeds 300 tons, it is necessary to speed up the development of garbage treatment mainly through incineration, build appropriately advanced incineration treatment facilities commensurate with the daily garbage collection volume, and basically achieve “zero landfill” of native domestic garbage by 2023.

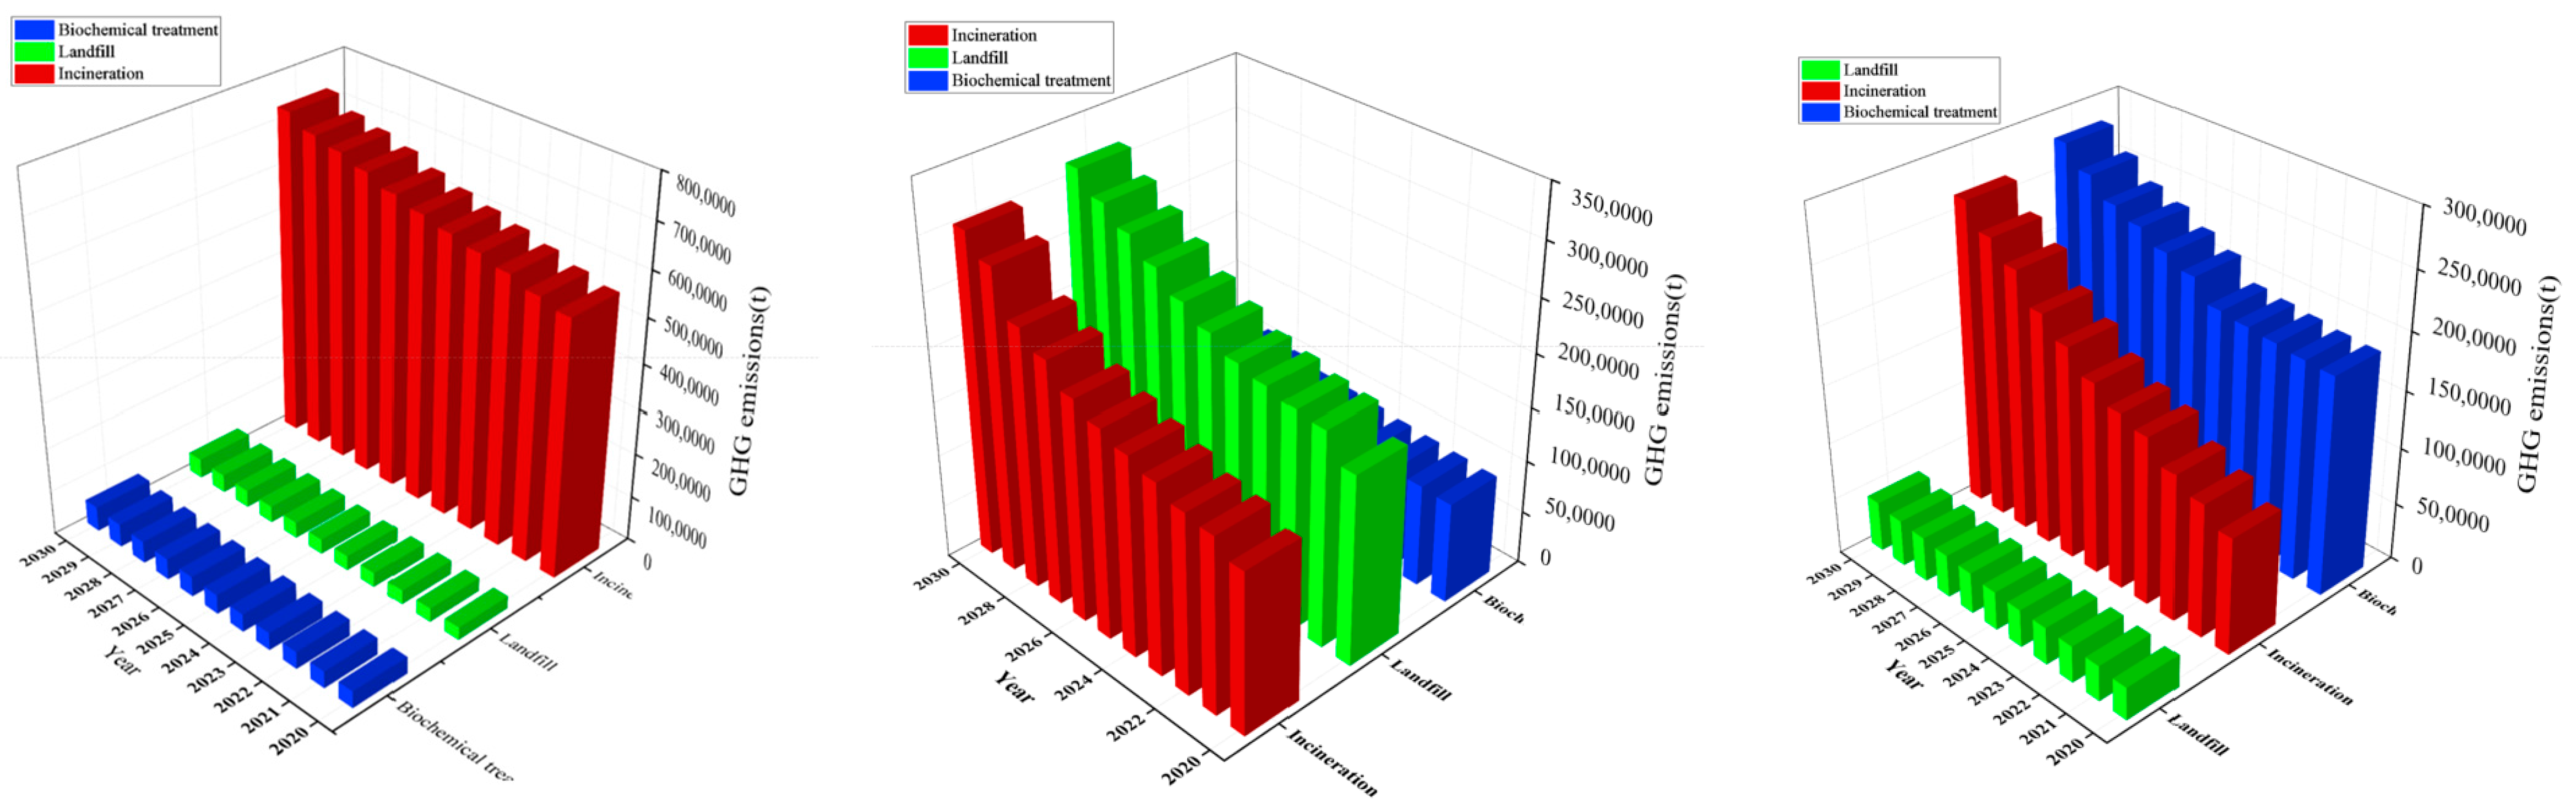
4.3. GHG Emission Estimations

The amount of each treatment method under the three scenarios was obtained with the intention of calculating GHGs later, based on the 2020–2030 MSW generation reported above and the present scenario ratios of the three basic waste treatment methods. The most incinerated, most biochemically treated (anaerobic digested), and least quantity of sanitary landfill was seen in Scenario 1. The amount of incineration, anaerobic digestion (biochemical treatment), and sanitary landfill was lowest in Scenario 2, and the amount of incineration was largest in Scenario 2. For specific numbers, refer to Figure 3. Scenario 3 involved the most incineration, the second-highest quantity of biochemical treatment (anaerobic digestion), and the least amount of sanitary landfill.
This work computed the relevant yearly GHG emissions from biochemical treatment, incineration, and landfill in Shenzhen between 2020 and 2030, as shown in Figure 4, based on three scenario evaluations. According to the findings, Scenario 1’s municipal domestic waste treatment will result in the highest greenhouse gas emissions in 2030 (3.16 million tons from landfill), followed by 3.03 million tons from incineration, and 1.43 million tons from biochemical treatment. GHG emissions from MSW treatment in 2030 will be 2.81 million tons from landfill, followed by 2.66 million tons for waste incineration, and 0.44 million tons for landfill under Scenario 3. In Scenario 2, the GHG emissions from MSW treatment in 2030 will be 7.36 million tons from waste incineration, 0.56 million tons from biochemical treatment, and 0.44 million tons from landfill.
One of China’s most important challenges is lowering GHG emissions in the face of incredibly complex environmental and societal forces. Potential scenarios for reducing GHG emissions can be computed using the data above and the scenario assumptions shown in Figure 4. The total cumulative GHG emissions in 2030 under the three alternative scenarios will be 7.62 million tons, 8.36 million tons, and 5.91 million tons, respectively, assuming abatement measures are not taken into consideration starting in 2020. It can be concluded that Scenario 2 is the scenario with the weaker GHG abatement potential of MSW, which indicates that the current situation of MSW treatment in Shenzhen is not optimized and needs to be further improved. Scenario 1 is a scenario with a weak GHG reduction potential for MSW. Scenario 1 is a scenario with an average potential for GHG emission reduction from MSW. Compared to Scenario 2, a reduction in waste incineration and an appropriate increase in biochemical treatment would be conducive to GHG emission reduction. Scenario 3 is the scenario with the strongest GHG reduction potential for MSW, suggesting that controlling landfills and enhancing bioremediation technologies and their wider application will make a greater contribution to GHG reduction. The cumulative GHG emission of Scenario 3 is 5.91 million tons, which is 22.49% less than that of Scenario 2, which implies that the biochemical treatment enhancement and the control of waste incineration and landfilling have a significant impact on GHG emission in Shenzhen. In summary, different MSW treatment structures lead to slightly different GHG emissions, and Shenzhen should promote a low-carbon mix of different MSW treatment structures, and it is crucial for the Shenzhen government and policymakers to combine mitigation strategies for different emission reduction aspects.

4.4. Analysis of GHG Emissions Reduction Potential

As previous findings have shown, domestic waste can be managed more efficiently to generate energy through the use of different technologies, but these technologies also release greenhouse gases into the environment. Figure 5 shows the total GHG emissions under the three scenarios for MSW in Shenzhen between 2020 and 2030, with Scenario 2 having a high proportion of incinerated waste and showing the highest GHG emissions.
In Scenario 1, assuming that 68.1% of the city’s MSW is incinerated, 10.8% is landfilled, and 21.1% is biochemically treated, a total of 7.62 million tons of GHGs will be emitted, with incineration and landfilling generating the higher amount of GHGs, at 3.03 million tons and 3.16 million tons, respectively. Although landfills account for only 10.8% of the municipal waste treatment structure, the amount of GHGs emitted by landfilling will still be very high. In fact, the GHG emissions from landfills are higher than those from incineration even though the percentage of the waste stream to landfill is significantly lower, which shows that incineration is more effective in reducing GHG emissions from domestic waste treatment. Further, the incineration of combustible wastes has a higher potential for power generation, which reduces the demand for electricity from the power grid. Therefore, in the future, Shenzhen should continue to optimize the structure of MSW disposal and adjust the landfill rate to achieve efficient carbon reduction.
In Scenario 2, 2% and 8% of the waste is treated by landfill and biochemical treatment, with GHG emissions of only 0.44 million tons and 0.56 million tons. However, 90% of the MSW will be managed by incineration, with a higher emission rate of 7.36 million tons, which is higher than the GHG emissions under Scenario 1. Although Scenario 1 mentions that landfill produces more GHGs than incineration, GHG emissions are also gradually increasing due to the decrease in the biochemical treatment rate. Therefore, too high a rate of waste incineration does not reduce GHG emissions, in contrast to biochemical treatment, which is worth promoting. Overall, Shenzhen still needs to consider the waste treatment rate further to reach the optimal level.
In Scenario 3, assuming a waste incineration rate of 58% and a biochemical treatment rate of 40%, corresponding to GHG emissions of 2.66 million tons and 2.81 million tons, respectively, the results showed that allocating the appropriate proportion of domestic waste to each technology is very favorable to potential GHG emission reductions. It is noteworthy that Scenario 3 showed the highest reduction in GHG emissions, followed by Scenario 1, which can be attributed to the application of incineration and biochemical treatment technologies. These findings suggest that incineration of MSW can reduce GHG emissions by about 3.5 million tons of CO2-eq. Zhou et al., 2018 showed that the combined treatment of MSW through AD and incineration can reduce GHG emissions, and the GHG generation is relatively low.
It should be noted that the conversion and utilization of MSW is an end-of-pipe disposal, regardless of the method. While exploring and optimizing this part of the technology, attention should also be paid to full life-cycle management, source reduction, and process resourcing. At present, some developed countries, with the help of market-mediated, government-regulated science and technology shares and other ways, have gradually formed a solid waste collection, recycling, processing, and sales system industry. In China, the related industry is in a key stage of technology attack and commercial application development, and it is necessary to establish a sound standardization system on the research method, technology process, product circulation, etc., to accelerate the construction of a complete industrial chain, in order to promote the synergistic goal of pollution reduction and carbon reduction at an early date in the solid waste treatment industry.

5. Conclusions

The amount of municipal domestic garbage generated in China is rising due to the economy’s rapid development and the population’s growth in cities, and the system for treating this waste is constantly being optimized. Environmental health and energy departments can plan future development and encourage urban development in an environmentally friendly and efficient manner by utilizing accurate waste generation predictions, logical analysis of the structure of municipal domestic waste treatment, and greenhouse gas emission estimation. In order to predict the quantity of municipal domestic waste produced in Shenzhen, this study established a combined weight prediction model. Six impact indicators were gathered and used as prediction model input variables. Then, using the greenhouse gas emission calculation formulas for municipal domestic waste incineration, landfill, and biochemical treatment, the study reasonably estimated the greenhouse gas emissions from municipal domestic waste in Shenzhen. We derived the following results from the experiment:
(1)
Based on related research by scholars on the generation of urban domestic waste, it is determined that six indicators—urban GDP, total retail sales of consumer goods, monthly disposable income per capita, monthly consumption expenditure per capita, actual number of passengers carried at year-end, and resident population at year-end—have some correlation with the generation of urban domestic waste and can be used as input variables in a model to accurately predict the amount of waste generated in urban areas;
(2)
A combined LSTM-GRU-BiLSTM model was suggested in this work to forecast the quantity of urban household garbage produced in Shenzhen. According to the experimental findings, this combined model’s MAE, MAPE, and RMSE were, respectively, 0.22, 4.12%, and 0.21. This model can more precisely forecast the quantity of MSW created than machine learning and a single prediction model;
(3)
Shenzhen is expected to generate 12.72 million tons of municipal domestic garbage by 2030, according to the combined LSTM-GRU-BiLSTM model, and 5.91 million tons of greenhouse gas emissions could arise from treating Shenzhen MSW in different proportions that include 58% incineration, 2% landfilling, and 40% biochemical treatment.
This study found that the treatment structure of MSW has a direct impact on GHG emissions and that biochemical treatment (anaerobic digestion) technology is able to reduce GHG emissions and mitigate the greenhouse effect compared to traditional landfill and incineration. It is crucial to strengthen the overall management of municipal waste to reduce greenhouse gas emissions from municipal waste. Therefore, a reasonable reduction in the landfill rate to achieve near-zero landfill, as well as controlling the incineration rate, improving the level of anaerobic digestion technology, and fully implementing biochemical treatment of rubbish are the main means of reducing greenhouse gas emissions from municipal waste in Shenzhen in the future. In addition, local governments should play a leading role in initiating various efforts. As the biochemical treatment technology is not yet mature and incineration is still the main waste treatment method, local government should consider the actual local situation and formulate more appropriate regulations for the management of municipal domestic waste. There are also necessary financial subsidies to support the construction of relevant infrastructure, such as waste collection sites and waste recycling facilities. In addition, capacity-building activities should be organized to raise public awareness and knowledge on waste separation.
There are still certain restrictions on this study, which estimated Shenzhen’s potential for greenhouse gas emissions and the output of MSW. Although this study chose six pertinent indicators to represent the impact of urban domestic trash in Shenzhen, the indicators chosen are not sufficiently complete due to data availability and other factors that could affect the prediction accuracy. Furthermore, this analysis forecasts Shenzhen’s urban household trash and does not adequately account for the effects of circumstances like waste resourcing. In order to fully examine the influence of each form of indicator on MSW, we will, therefore, incorporate more types of indicators and more thorough data in future studies, which will enhance the model’s accuracy. Additionally, future research will center on the composition of MSW.

Author Contributions

X.Z. performed the data analysis and writing; B.L. performed the formal analysis; N.Z. performed the validation. All authors have read and agreed to the published version of the manuscript.

Funding

This research received no external funding.

Institutional Review Board Statement

Not applicable.

Informed Consent Statement

Not applicable.

Data Availability Statement

The original contributions presented in the study are included in the article material, further inquiries can be directed to the corresponding author.

Conflicts of Interest

Xia Zhang is an General Manager of Tianjin Zhongxinde Metal Structure Co. Ltd. The paper reflects the views of the scientist and not the company.

References

  1. Lou, Z.; Cai, B.-F.; Zhu, N.; Zhao, Y.; Geng, Y.; Yu, B.; Chen, W. Greenhouse Gas Emission Inventories from Waste Sector in China during 1949–2013 and Its Mitigation Potential. J. Clean. Prod. 2017, 157, 118–124. [Google Scholar] [CrossRef]
  2. Hong, J.; Chen, Y.; Wang, M.; Ye, L.; Qi, C.; Yuan, H.; Zheng, T.; Li, X. Intensification of Municipal Solid Waste Disposal in China. Renew. Sustain. Energy Rev. 2017, 69, 168–176. [Google Scholar] [CrossRef]
  3. Kang, Y.; Yang, Q.; Wang, L.; Chen, Y.; Lin, G.; Huang, J.; Yang, H.; Chen, H. China’s Changing City-Level Greenhouse Gas Emissions From Municipal Solid Waste Treatment and Driving Factors. Resour. Conserv. Recycl. 2022, 180, 106168. [Google Scholar] [CrossRef]
  4. Istrate, I.R.; Galvez-Martos, J.L.; Vázquez, D.; Guillén-Gosálbez, G.; Dufour, J. Prospective Analysis of the Optimal Capacity, Economics and Carbon Footprint of Energy Recovery From Municipal Solid Waste Incineration. Resour. Conserv. Recycl. 2023, 193, 106943. [Google Scholar] [CrossRef]
  5. Chaianong, A.; Pharino, C. How to Design an Area-Based Prioritization of Biogas Production from Organic Municipal Solid Waste? Evidence from Thailand. Waste Manag. 2022, 138, 243–252. [Google Scholar] [CrossRef]
  6. Istrate, I.-R.; Galvez-Martos, J.-L.; Dufour, J. The Impact of Incineration Phase-Out on Municipal Solid Waste Landfilling and Life Cycle Environmental Performance: Case Study of Madrid, Spain. Sci. Total. Environ. 2021, 755, 142537. [Google Scholar] [CrossRef]
  7. Adnan, A.; Mahmud, S.; Uddin, M.R.; Modi, A.; Ehsan, M.M.; Salehin, S. Energy, Exergy, Exergoeconomic, and Environmental (4E) Analyses of Thermal Power Plants for Municipal Solid Waste to Energy Application in Bangladesh. Waste Manag. 2021, 134, 136–148. [Google Scholar] [CrossRef]
  8. Manesh, M.K.; Rezazadeh, A.; Kabiri, S. A Feasibility Study on the Potential, Economic, and Environmental Advantages of Biogas Production from Poultry Manure in Iran. Renew. Energy 2020, 159, 87–106. [Google Scholar] [CrossRef]
  9. Van Fan, Y.; Klemeš, J.J.; Lee, C.T.; Perry, S. Anaerobic Digestion of Municipal Solid Waste: Energy and Carbon Emission Footprint. J. Environ. Manag. 2018, 223, 888–897. [Google Scholar] [CrossRef]
  10. Surendra, K.; Takara, D.; Hashimoto, A.G.; Khanal, S.K. Biogas as a Sustainable Energy Source for Developing Countries: Opportunities and Challenges. Renew. Sustain. Energy Rev. 2014, 31, 846–859. [Google Scholar] [CrossRef]
  11. Dastjerdi, B.; Strezov, V.; Kumar, R.; Behnia, M. An Evaluation of the Potential of Waste to Energy Technologies for Residual Solid Waste in New South Wales, Australia. Renew. Sustain. Energy Rev. 2019, 115, 109398. [Google Scholar] [CrossRef]
  12. Kamboj, S. Biogas From Kitchen Food Waste: Estimation, Applications and Economic Analysis. Int. J. Res. Eng. Appl. Manag. (IJREAM) 2018, 4, 409–416. [Google Scholar]
  13. Khan, I. Waste to Biogas through Anaerobic Digestion: Hydrogen Production Potential in the Developing World—A Case of Bangladesh. Int. J. Hydrogen Energy 2020, 45, 15951–15962. [Google Scholar] [CrossRef]
  14. Shen, L.; Wu, Y.; Lou, Y.; Zeng, D.; Shuai, C.; Song, X. What Drives the Carbon Emission in the Chinese Cities?—A Case of Pilot Low Carbon City of Beijing. J. Clean. Prod. 2018, 174, 343–354. [Google Scholar] [CrossRef]
  15. Wang, Q.; Zhao, M.; Li, R. Decoupling Sectoral Economic Output from Carbon Emissions on City Level: A Comparative Study of Beijing and Shanghai, China. J. Clean. Prod. 2019, 209, 126–133. [Google Scholar] [CrossRef]
  16. Yang, Y.; Bao, W.; Xie, G.H. Estimate of Restaurant Food Waste and Its Biogas Production Potential in China. J. Clean. Prod. 2019, 211, 309–320. [Google Scholar] [CrossRef]
  17. Zhang, Y.; Shuai, C.; Bian, J.; Chen, X.; Wu, Y.; Shen, L. Socioeconomic Factors of PM2.5 Concentrations in 152 Chinese Cities: Decomposition Analysis Using LMDI. J. Clean. Prod. 2019, 218, 96–107. [Google Scholar] [CrossRef]
  18. Seadon, J.K. Sustainable Waste Management Systems. J. Clean. Prod. 2010, 18, 1639–1651. [Google Scholar] [CrossRef]
  19. Mancini, G.; Luciano, A.; Bolzonella, D.; Fatone, F.; Viotti, P.; Fino, D. A Water-Waste-Energy Nexus Approach to Bridge the Sustainability Gap in Landfill-Based Waste Management Regions. Renew. Sustain. Energy Rev. 2021, 137, 110441. [Google Scholar] [CrossRef]
  20. Toniolo, S.; Mazzi, A.; Garato, V.G.; Aguiari, F.; Scipioni, A. Assessing the “Design Paradox” with Life Cycle Assessment: A Case Study of a Municipal Solid Waste Incineration Plant. Resour. Conserv. Recycl. 2014, 91, 109–116. [Google Scholar] [CrossRef]
  21. Xiao, S.; Dong, H.; Geng, Y.; Tian, X.; Liu, C.; Li, H. Policy Impacts on Municipal Solid Waste Management in Shanghai: A System Dynamics Model Analysis. J. Clean. Prod. 2020, 262, 121366. [Google Scholar] [CrossRef]
  22. Niu, D.; Wu, F.; Dai, S.; He, S.; Wu, B. Detection of Long-Term Effect in Forecasting Municipal Solid Waste Using a Long Short-Term Memory Neural Network. J. Clean. Prod. 2021, 290, 125187. [Google Scholar] [CrossRef]
  23. Taguem, E.M.; Mennicken, L.; Romain, A.-C. Quantile Regression with a Metal Oxide Sensors Array for Methane Prediction over a Municipal Solid Waste Treatment Plant. Sens. Actuators B Chem. 2021, 334, 129590. [Google Scholar] [CrossRef]
  24. Jiang, L.; Liao, H. Network Consensus Analysis of Probabilistic Linguistic Preference Relations for Group Decision Making and Its Application in Urban Household Waste Classification. J. Clean. Prod. 2021, 278, 122766. [Google Scholar] [CrossRef]
  25. Xu, Z.; Lv, Z.; Chu, B.; Li, J. Fast Autoregressive Tensor Decomposition for Online Real-time Traffic Flow Prediction. Knowl.-Based Syst. 2023, 282, 111125. [Google Scholar] [CrossRef]
  26. Hanandeh, S.M. Introducing Mathematical Modeling to Estimate Pavement Quality Index of Flexible Pavements Based on Genetic Algorithm and Artificial Neural Networks. Case Stud. Constr. Mater. 2022, 16, e00991. [Google Scholar] [CrossRef]
  27. Lin, K.; Zhao, Y.; Kuo, J.-H. Deep Learning Hybrid Predictions for the Amount of Municipal Solid Waste: A Case Study in Shanghai. Chemosphere 2022, 307, 136119. [Google Scholar] [CrossRef]
  28. Kujawa, S.; Mazurkiewicz, J.; Czekała, W. Using Convolutional Neural Networks to Classify the Maturity of Compost Based on Sewage Sludge and Rapeseed Straw. J. Clean. Prod. 2020, 258, 120814. [Google Scholar] [CrossRef]
  29. Yuan, J.; Zhou, Z.; Huang, K.; Han, Z.; Wang, C.; Lu, S. Analysis and Evaluation of the Operation Data for Achieving an on-Demand Heating Consumption Prediction Model of District Heating Substation. Energy 2021, 214, 118872. [Google Scholar] [CrossRef]
  30. Wang, P.; Si, F.; Cao, Y.; Shao, Z.; Ren, S. Prediction of Superheated Steam Temperature for Thermal Power Plants Using a Novel Integrated Method Based on the Hybrid Model and Attention Mechanism. Appl. Therm. Eng. 2021, 203, 117899. [Google Scholar] [CrossRef]
  31. Rahman, A.; Smith, A.D. Predicting Heating Demand and Sizing a Stratified Thermal Storage Tank Using Deep Learning Algorithms. Appl. Energy 2018, 228, 108–121. [Google Scholar] [CrossRef]
  32. Xiao, Q.; Liang, F.; Ning, M.; Zhang, Q.; Bi, J.; He, K.; Lei, Y.; Liu, Y. The Long-Term Trend of PM2.5-Related Mortality in China: The Effects of Source Data Selection. Chemosphere 2021, 263, 127894. [Google Scholar] [CrossRef]
  33. Wang, M.; Ying, F. Point and Interval Prediction for Significant Wave Height Based on LSTM-GRU and KDE. Ocean Eng. 2023, 289, 116247. [Google Scholar] [CrossRef]
  34. Zarzycki, K.; Lawryńczuk, M. Physics-Informed Hybrid GRU Neural Networks for MPC Prediction. IFAC-PapersOnLine 2023, 56, 8726–8731. [Google Scholar] [CrossRef]
  35. Chalal, M.L.; Benachir, M.; White, M.; Shrahily, R. Energy Planning and Forecasting Approaches for Supporting Physical Improvement Strategies in the Building Sector: A Review. Renew. Sustain. Energy Rev. 2016, 64, 761–776. [Google Scholar] [CrossRef]
  36. Suryanarayana, G.; Lago, J.; Geysen, D.; Aleksiejuk, P.; Johansson, C. Thermal Load Forecasting in District Heating Networks Using Deep Learning and Advanced Feature Selection Methods. Energy 2018, 157, 141–149. [Google Scholar] [CrossRef]
  37. Long, X.; Wu, S.; Wang, J.; Wu, P.; Wang, Z. Urban Water Environment Carrying Capacity Based on VPOSR-Coefficient of Variation-Grey Correlation Model: A Case of Beijing, China. Ecol. Indic. 2022, 138, 108863. [Google Scholar] [CrossRef]
  38. Fatima, A.; Javaid, I. Rough Set Theory Applied to Finite Dimensional Vector Spaces. Inf. Sci. 2024, 659, 120072. [Google Scholar] [CrossRef]
  39. Bavar, M.S.; Naderan, A.; Saffarzadeh, M. Evaluating the Spatial Effects of Environmental Influencing Factors On the Frequency of Urban Crashes Using the Spatial Bayes Method Based On Euclidean Distance and Contiguity. Transp. Eng. 2023, 12, 100181. [Google Scholar] [CrossRef]
  40. Touati, S.; Radjef, M.S.; Sais, L. A Bayesian Monte Carlo Method for Computing the Shapley Value: Application to Weighted Voting and Bin Packing Games. Comput. Oper. Res. 2021, 125, 105094. [Google Scholar] [CrossRef]
  41. Yang, D.; Xu, L.; Gao, X.; Guo, Q.; Huang, N. Inventories and Reduction Scenarios of Urban Waste-Related Greenhouse Gas Emissions for Management Potential. Sci. Total Environ. 2018, 626, 727–736. [Google Scholar] [CrossRef] [PubMed]
  42. Lou, X.; Nair, J. The Impact of Landfilling and Composting on Greenhouse Gas Emissions—A Review. Bioresour. Technol. 2009, 100, 3792–3798. [Google Scholar] [CrossRef] [PubMed]
  43. IPCC. Climate Change. In Contribution of Working Group I to the Fifth Assessment Report of the Intergovernmental Panel on Climate Change; Edited by The Physical Science Basis, 1535; IPCC: London, UK; New York, NY, USA, 2013. [Google Scholar]
  44. Chen, Y.-C.; Liu, H.-M. Evaluation of Greenhouse Gas Emissions and the Feed-in Tariff System of Waste-to-Energy Facilities Using a System Dynamics Model. Sci. Total Environ. 2021, 792, 148445. [Google Scholar] [CrossRef] [PubMed]
Figure 1. Logical structure diagram of this research.
Atmosphere 15 00507 g001
Figure 2. Prediction results of MSW production under different models.
Atmosphere 15 00507 g002
Figure 3. The number of each treatment method in the three scenarios.
Atmosphere 15 00507 g003
Figure 4. Annual GHG emissions from different treatment methods under three Scenarios during 2020–2030.
Atmosphere 15 00507 g004
Figure 5. Total GHG emissions under three MSW in Shenzhen from 2020 to 2030.
Atmosphere 15 00507 g005
Table 1. GHG emissions generated by different MSW treatment methods.
Category LandfillIncinerationBiochemical Treatment
Direct GHG emissionsCO2 *
CH4 (GWP = 25)* *
N2O (GWP = 265) *
Indirect GHG emissionsElectricity **
Diesel *
Water *
Capacity (t/y)_500,00050,000
* represent the types of contamination included in the MSW treatment process.
Table 2. Proportion of domestic garbage treatment methods.
ScenariosIncineration Rate (%)Landfill Rate (%)Biochemical Treatment Rate (%)
Scenario 168.110.821.1
Scenario 29028
Scenario 358240
Table 3. Parameter setting for the LSTM neural network.
ModelTime StepLearn RateBatch_SizeHidden_LayerEpochMape (%)
LSTM20.01232500014.2
20.001264500013.6
20.0001264500013
20.000126410,00010.2
20.0001312810,00012.6
Table 4. Parameter setting for the GRU neural network.
ModelTime StepLearn RateBatch_SizeHidden_LayerEpochMape (%)
GRU20.01232500015.2
20.001264500014.6
20.0001264500012.3
20.000126410,00015.2
20.0001312810,00016.2
Table 5. Parameter setting for the BiLSTM neural network.
ModelTime StepLearn RateBatch_SizeHidden_LayerEpochMape (%)
BiLSTM20.01232500014.2
20.001264500013.6
20.000126450008.1
20.000126410,00010.24
20.0001312810,00012.6
Table 6. The results of the CWFM based on the inverse variance method.
YearMSW
True
Value
LSTMGRUBi-LSTMCWFMCWFM
MAPE
(%)
Forecasting
Value
WeightForecasting
Value
WeightForecasting
Value
WeightForecasting
Value
2013522405.680.14403.210.13572.230.73544.094.12
2014541598.860.04553.310.93607.270.03556.73
2015575541.390.72689.410.06638.820.22571.7
2016572675.540.14708.550.07615.170.79630.53
2017619670.550.39682.390.26673.820.35674.76
2018702627.640.04671.870.23720.720.73705.72
2019760644.480.05733.660.68810.240.27749.86
Average weight 0.22 0.34 0.44
Table 7. Comparison of model accuracy.
ModelMAEMAPE (%)RMSE
CWFM0.224.120.21
GRA-LSTM0.248.950.22
GRA-GRU0.3214.330.31
BiLSTM0.249.580.22
LSTM0.2413.980.24
GRU0.3420.750.32
Table 8. Growth rate of each indicator in the benchmark scenario.
Scene CategoryTotal Retail Sales of Consumer GoodsBuses are Available at the End of the YearYear-End Resident PopulationGross Regional ProductAverage per Capita Monthly Household Disposable IncomeThe Average Person’s Monthly Consumption Expenditure
Baseline scenario0.00160.02430.01800.02030.02000.0480
Disclaimer/Publisher’s Note: The statements, opinions and data contained in all publications are solely those of the individual author(s) and contributor(s) and not of MDPI and/or the editor(s). MDPI and/or the editor(s) disclaim responsibility for any injury to people or property resulting from any ideas, methods, instructions or products referred to in the content.

