Article

Evaluating Phoenix Metropolitan Area Ozone Behavior Using Ground-Based Sampling, Modeling, and Satellite Retrievals

by
Jason A. Miech
1,
Pierre Herckes
1,
Matthew P. Fraser
2,*,
Avelino F. Arellano
3,4,
Mohammad Amin Mirrezaei
3,4 and
Yafang Guo
3,4
1
School of Molecular Sciences, Arizona State University, Tempe, AZ 85287, USA
2
School of Sustainable Engineering and the Built Environment, Ira A. Fulton Schools of Engineering, Arizona State University, Tempe, AZ 85287, USA
3
Department of Chemical and Environmental Engineering, University of Arizona, Tucson, AZ 85721, USA
4
Department of Hydrology and Atmospheric Sciences, University of Arizona, Tucson, AZ 85721, USA
*
Author to whom correspondence should be addressed.
Atmosphere 2024, 15(5), 555; https://doi.org/10.3390/atmos15050555
Submission received: 5 April 2024 / Revised: 18 April 2024 / Accepted: 24 April 2024 / Published: 30 April 2024
(This article belongs to the Section Air Quality)

Abstract

:
An oxidizing and harmful pollutant gas, tropospheric ozone is a product of a complex set of photochemical reactions that can make it difficult to enact effective control measures. A better understanding of its precursors including volatile organic compounds (VOCs) and nitrogen oxides (NOx) and their spatial distribution can enable policymakers to focus their control efforts. In this study we used low-cost sensors (LCSs) to increase the spatial resolution of an existing NO2 monitoring network in addition to VOC sampling to better understand summer ozone formation in Maricopa County, Arizona, and observed that afternoon O3 values at the downwind sites were significantly correlated, ~0.27, to the morning NO2 × rate values at the urban sites. Additionally, we looked at the impact of wildfire smoke on ozone exceedances and compared non-smoke days to smoke days. The average O3 on smoke days was approximately 20% higher than on non-smoke days, however, the average NO2 concentration multiplied by estimated photolysis rate (NO2 × rate) values were only 2% higher on smoke days. Finally, we evaluated the ozone sensitivity of the region by calculating HCHO/NO2 ratios using three different datasets: ground, satellite, and model. Although the satellite dataset produced higher HCHO/NO2 ratios than the other datasets, when the proper regime thresholds are applied the three datasets consistently show transition and VOC-limited O3 production regimes over the Phoenix metro area. This suggests a need to implement more VOC emission controls in order to reach O3 attainment in the county.

1. Introduction

Despite decades of effort to control precursor emissions, ground-level ozone (O3) in Maricopa County, Arizona still periodically exceeds the U.S Environmental Protection Agency (EPA) National Ambient Air Quality Standards (NAAQS) values, resulting in non-attainment for the region. For example, in 2021 the county experienced 50 days with at least one ozone monitor exceeding the 2015 8-h NAAQS [1]. In addition to the regulatory issues that arise with these exceedances, members of the population such as those with asthma and outdoor workers can experience undue airway inflammation and oxidative stress [2].
Tropospheric ozone forms from complex atmospheric chemistry involving NOx and VOCs. These reactions have been studied and defined by [3,4,5] to name a few. In summary, reactive VOCs (RH) react with hydroxyl radicals (OH) to form organic radicals (R∙), which then combine with molecular oxygen to form peroxy radicals (RO2∙), aided by either N2 or O2 (M). These peroxy radicals can then react with nitric oxide (NO) to form NO2 and organic nitrates such as RONO2 and RO2NO2. NO2 will then be photodissociated during the day to form ground-state oxygen atoms (O(3P)) and re-form NO. These ground-state oxygen atoms can combine with molecular oxygen to form ozone. To complete the chain reaction, the ozone can be photodissociated to form an excited oxygen atom (O(1D)), which can react with water vapor to reform hydroxyl radicals. Due to this complex set of reactions, ozone formation is not directly proportional to the initial concentrations of VOCs and NOx [6]. Instead, one needs to consider the relationship between ozone and the initial mixture of VOCs and NOx. Under certain mixture conditions, the maximum ozone concentration can be either VOC-limited or NOx-limited, therefore it is crucial to understand the VOC/NOx regime prior to implementing either VOC or NOx control strategies.
While most monitoring networks do operate ozone and NOx monitors, there are fewer VOC measurements available to make these sorts of assessments [7]. One solution is to use chemical models to assess O3 emission sensitivity, such as 0-dimensional box models [8,9], with a focus on chemistry or chemical transport models (CTM), which are designed to capture all of the primary mechanisms influencing ozone. CTM models can be classified into regional chemical transport models such as CMAQ [10,11,12], CAMx [13,14], WRF-chem [15,16,17,18,19], CHIMERE [20,21], and global or larger regional scale models such as GEOS-Chem [7,22,23,24] and MOZART/CAM-Chem [25]. However, Sillman et al. [26] demonstrated an alternative approach by identifying species ratios that steadily assume different values under VOC-limited and NOx-limited conditions, specifically HCHO/NOy, which has since been simplified to HCHO/NO2 due to the availability of NO2 satellite retrievals [27,28,29,30,31]. With this ratio, secondary HCHO is used as a tracer for VOCs, as it is often correlated with VOC reactivity and the formation of peroxy radicals while NO2 is used as a tracer for total reactive nitrogen [26]. For HCHO/NO2 ratios < 1 the ozone sensitivities can be classified as VOC-limited, while higher ratios are representative of NOx-limited regimes, with the exact value believed to be region dependent and including a transition regime in between that is sensitive to both [28]. Using satellite indicators comes with uncertainty, including the error in satellite retrievals and defining thresholds for NOx/VOC-limited regimes. In this regard, based on previous studies, space-based indicators are more reliable in polluted regions [24,26,27,28]. In addition, the thresholds recommended by Duncan et al. [28] which were the basis for several studies over the US, are based on the modeled and observed HCHO columns, NO2 columns, and surface O3. The coarse model resolution and lack of surface measurement validation make the recent study by Jin et al. [32], which introduced new thresholds (<3.2 for VOC-limited and >4.1 for NOx-limited) for using the Ozone Monitoring Instrument (OMI) satellite HCHO/NO2 ratio as an indicator for surface ozone production, a more precise approach [33].
In addition to local emissions of ozone precursors, ozone concentrations can also be impacted by exceptional events such as wildfire smoke [34,35,36]. In addition to producing PM, NOx, CO, and CO2, these smoke plumes can also transport HCHO, terpenes, and a variety of other VOCs [37]. Jaffe et al. [38] found that in maximum fire years between 1987 and 2004 the daytime mean ozone in the Western U.S. was enhanced by 8.8 ppbv. Jaffe et al. [39] furthered this work by using statistical model residual (SMR) combined with Weather and Research Forecasting Modeling with Chemistry (WRF-CHEM), Community Multiscale Air Quality (CMAQ), and air mass trajectories (HYSPLIT dispersion modeling) to estimate the contribution of individual wildfire smoke events on ozone concentrations.
This work seeks to characterize the spatial distribution of ozone formation in Maricopa County by using a low-cost NO2 sensor (LCS) network in conjunction with VOC measurements from canister sampling and a Photochemical Assessment Monitoring Station (PAMS) site. First, 13 sites were given preliminary classifications of being NO2 elevated (possible source of NOx emissions), O3 elevated (sites with the highest O3 concentrations), and sites with equivalent NO2 and O3 concentrations. We then calculated the NO2 photolysis rate at each site to get a better idea of the photochemical trends occurring at each site. These results were then used to perform correlation analysis on all site combinations to identify trends between sites, i.e., upwind vs downwind sites. Finally, VOC data, specifically HCHO, was used to further investigate the impact of wildfire smoke on ozone and to characterize ozone sensitivity in Maricopa County. Our ground results were compared to WRF-CHEM model results and satellite retrievals from TROPOMI. Maricopa County is ideal for this type of study as it has a reasonably developed monitoring network, is relatively cloud free for satellite retrievals, and is isolated enough to minimize modeling complications.

2. Materials and Methods

2.1. LCS Data

LCS hourly NO2 data was collected at 12 sites around Maricopa County from April 2021 to October 2021 using Clarity Node-S sensors. Their deployment and calibration are detailed in [40,41], while Figure 1 details the locations of all measurements used in this study. The Clarity Node-S sensors have a nominal NO2 range of 0–3000 ppb, a resolution of 1 ppb, and an optimal R2 of 0.83 and root-mean-square error of <8 ppb [42]. These LCSs were essential to the study as they provided hourly NO2 measurements at nine sites that do not typically make these measurements, specifically the South Phoenix, North Phoenix, Blue Point, West Chandler, South Scottsdale, Pinnacle Peak, Cave Creek, Dysart, and Mesa sites. To summarize, during the 5-month deployment period the LCSs were periodically rotated between collocation sites (MCAQD sites that measure O3 and NO2) and deployment sites (MCAQD sites that only measure O3). The data collected at the collocation sites was used to update the LCS calibration during the deployment periods. This calibration included corrections for temperature, relative humidity, ozone, and diurnal differences.

2.2. Reference Monitor Data

This study used data from 13 different reference monitoring sites around Maricopa County to improve and supplement LCS data. For the MCAQD sites, the NO2 FRM instrument at the West Phoenix site was a Thermo Scientific 42iQ NO-NO2-NOx Analyzer (ThermoFisher Scientific, Franklin, MA, USA), while the Buckeye and Central Phoenix sites had a Teledyne-API T200 (Teledyne API, San Diego, CA, USA), all chemiluminescence based instruments. All 12 sites had a Teledyne-API T400 (Teledyne API, San Diego, CA, USA) to measure ozone via UV absorption. Data from these instruments were obtained from MCAQD at a one-hour resolution. For the Phoenix JLG supersite (AQS ID: 04-013-9997) run by AZDEQ, the FEM NO2 instrument was a Teledyne T500U (Teledyne API, San Diego, CA, USA) and the FEM O3 instrument was a Teledyne-API T400 (Teledyne API, San Diego, CA, USA). This data was also obtained from MCAQD at a one-hour resolution. All times are shown in local time which is Mountain Standard Time.

2.3. VOC Data

The 24-h VOC canister sampling was conducted by MCAQD at the Buckeye, North Phoenix, Pinnacle Peak, and Mesa sites using the EPA’s 6-day schedule (detailed in Table S1). These samples were tested for carbonyls via EPA Compendium Method TO-11A and for speciated non-methane organic compounds by GC-FID by Eastern Research Group (ERG) (Morrisville, NC, USA).
Photochemical Assessment Monitoring Stations (PAMS) data was also obtained from the Phoenix JLG supersite via MCAQD. Carbonyls were sampled by an ATEC 8000 on three sequential 8-h samples on a 1-in-3 days schedule and measured by ERG via EPA Compendium Method TO-11A. Hourly averaged VOCs were measured by a CAS-Chromatotec FID (Chromatotec Group, Houston, TX, USA). HCHO concentrations were converted from μg/m3 to ppb using the molecular weight, ambient temperature measured at each site, and the barometric pressure from Phoenix JLG.

2.4. Satellite Data

The Tropospheric Monitoring Instrument (TROPOMI) Level 2 tropospheric column observations of NO2 and HCHO version 2 data, obtained from the NASA Goddard Earth Sciences Data and Information Services Center, were used to analyze the changes in ozone precursors across time and space [43,44]. TROPOMI is an ultraviolet-visible-near-infrared and shortwave spectrometer positioned in a nadir view configuration on the S5P satellite, allowing it to collect daily data on various atmospheric trace elements, including NO2 and HCHO, with a spatial resolution of approximately 5.5 × 3.5 square kilometers at nadir [45,46]. The overpass time of TROPOMI over Phoenix occurs in the early afternoon, ~12:00–14:00 (exact dates and times are listed in Table S2), when O3 photochemical production reaches its peak, making it suitable for detecting the O3 formation sensitivity [32]. The data used in this study were subjected to quality control with a QA value > 0.50 for HCHO and QA value > 0.75 for NO2 [47,48]. In order to show the temporal change of the TROPOMI tropospheric NO2 and HCHO columns over the selected PAMS sites, the distance between the quality-controlled TROPOMI pixels and the PAMS sites was filtered to be less than 5 km and for illustration of the spatial distribution of the data, they were gridded to a resolution of 0.07° × 0.07°.

2.5. WRF-CHEM Modeling

The Weather Research Forecasting with Chemistry (WRF-Chem) [49] model is a fully coupled meteorology–chemistry transport model developed by the National Center for Atmospheric Research (NCAR). This study uses WRF-Chem v4.4 to simulate ozone in Arizona. The Model for Ozone and Related Chemical Tracers (MOZART-4, [50]) is selected for the gas-phase chemistry, coupled with the Goddard Chemistry Aerosol Radiation and Transport (GOCART, [51]) for aerosol chemistry with wet scavenging enabled. The standard MOZART-4 mechanism includes 85 gas-phase species, 12 bulk aerosol compounds, 39 photolysis, and 157 gas-phase reactions, and also includes an updated isoprene oxidation scheme and a better treatment of volatile organic compounds, with three lumped species to represent alkanes and alkenes with four or more carbon atoms and aromatic compounds (called BIGALK, BIGENE and TOLUENE) [50]. The new updated TUV photolysis option, based on standalone TUV version 5.3, is employed to calculate the photolysis rates. Initial and lateral boundary conditions are supplied every six hours from the Global Forecast System (GFS) with a horizonal grid spacing of 1° for meteorology and Community Atmosphere Model with Chemistry (CAM-Chem) [52,53] for chemistry. Biogenic emissions are calculated online with the Model of Emissions of Gases and Aerosols from Nature (MEGAN, v2.1) using the simulated meteorological conditions while running WRF-Chem [54]. Note that MEGAN v2.1 currently is only compatible with the CLM4 (Community Land Model Version 4, [55]) land surface model. The following key physics settings are also employed; Morrison double-moment microphysics [56], RRTMG for long and short-wave radiation [57], Eta Similarity for surface layer physics [58], the Unified Noah Land Surface Model [59], the Yonsei University (YSU) planetary boundary layer (PBL) scheme [60], and the Grell–Freitas cumulus parameterization scheme [61]. The model is configured with two nested grid domains consisting of 9 km (271 × 394) and 3 km (349 × 313) horizontal grid spacing along with 34 vertical levels covering western and southwest United States (centered on the state of Arizona), respectively. Note that the WRF-Chem simulations only cover a one-month period (June 2021) consisting of a total of 33 simulation days, including a three-day spin-up in late May.

3. Results and Discussion

3.1. Preliminary Site Classification

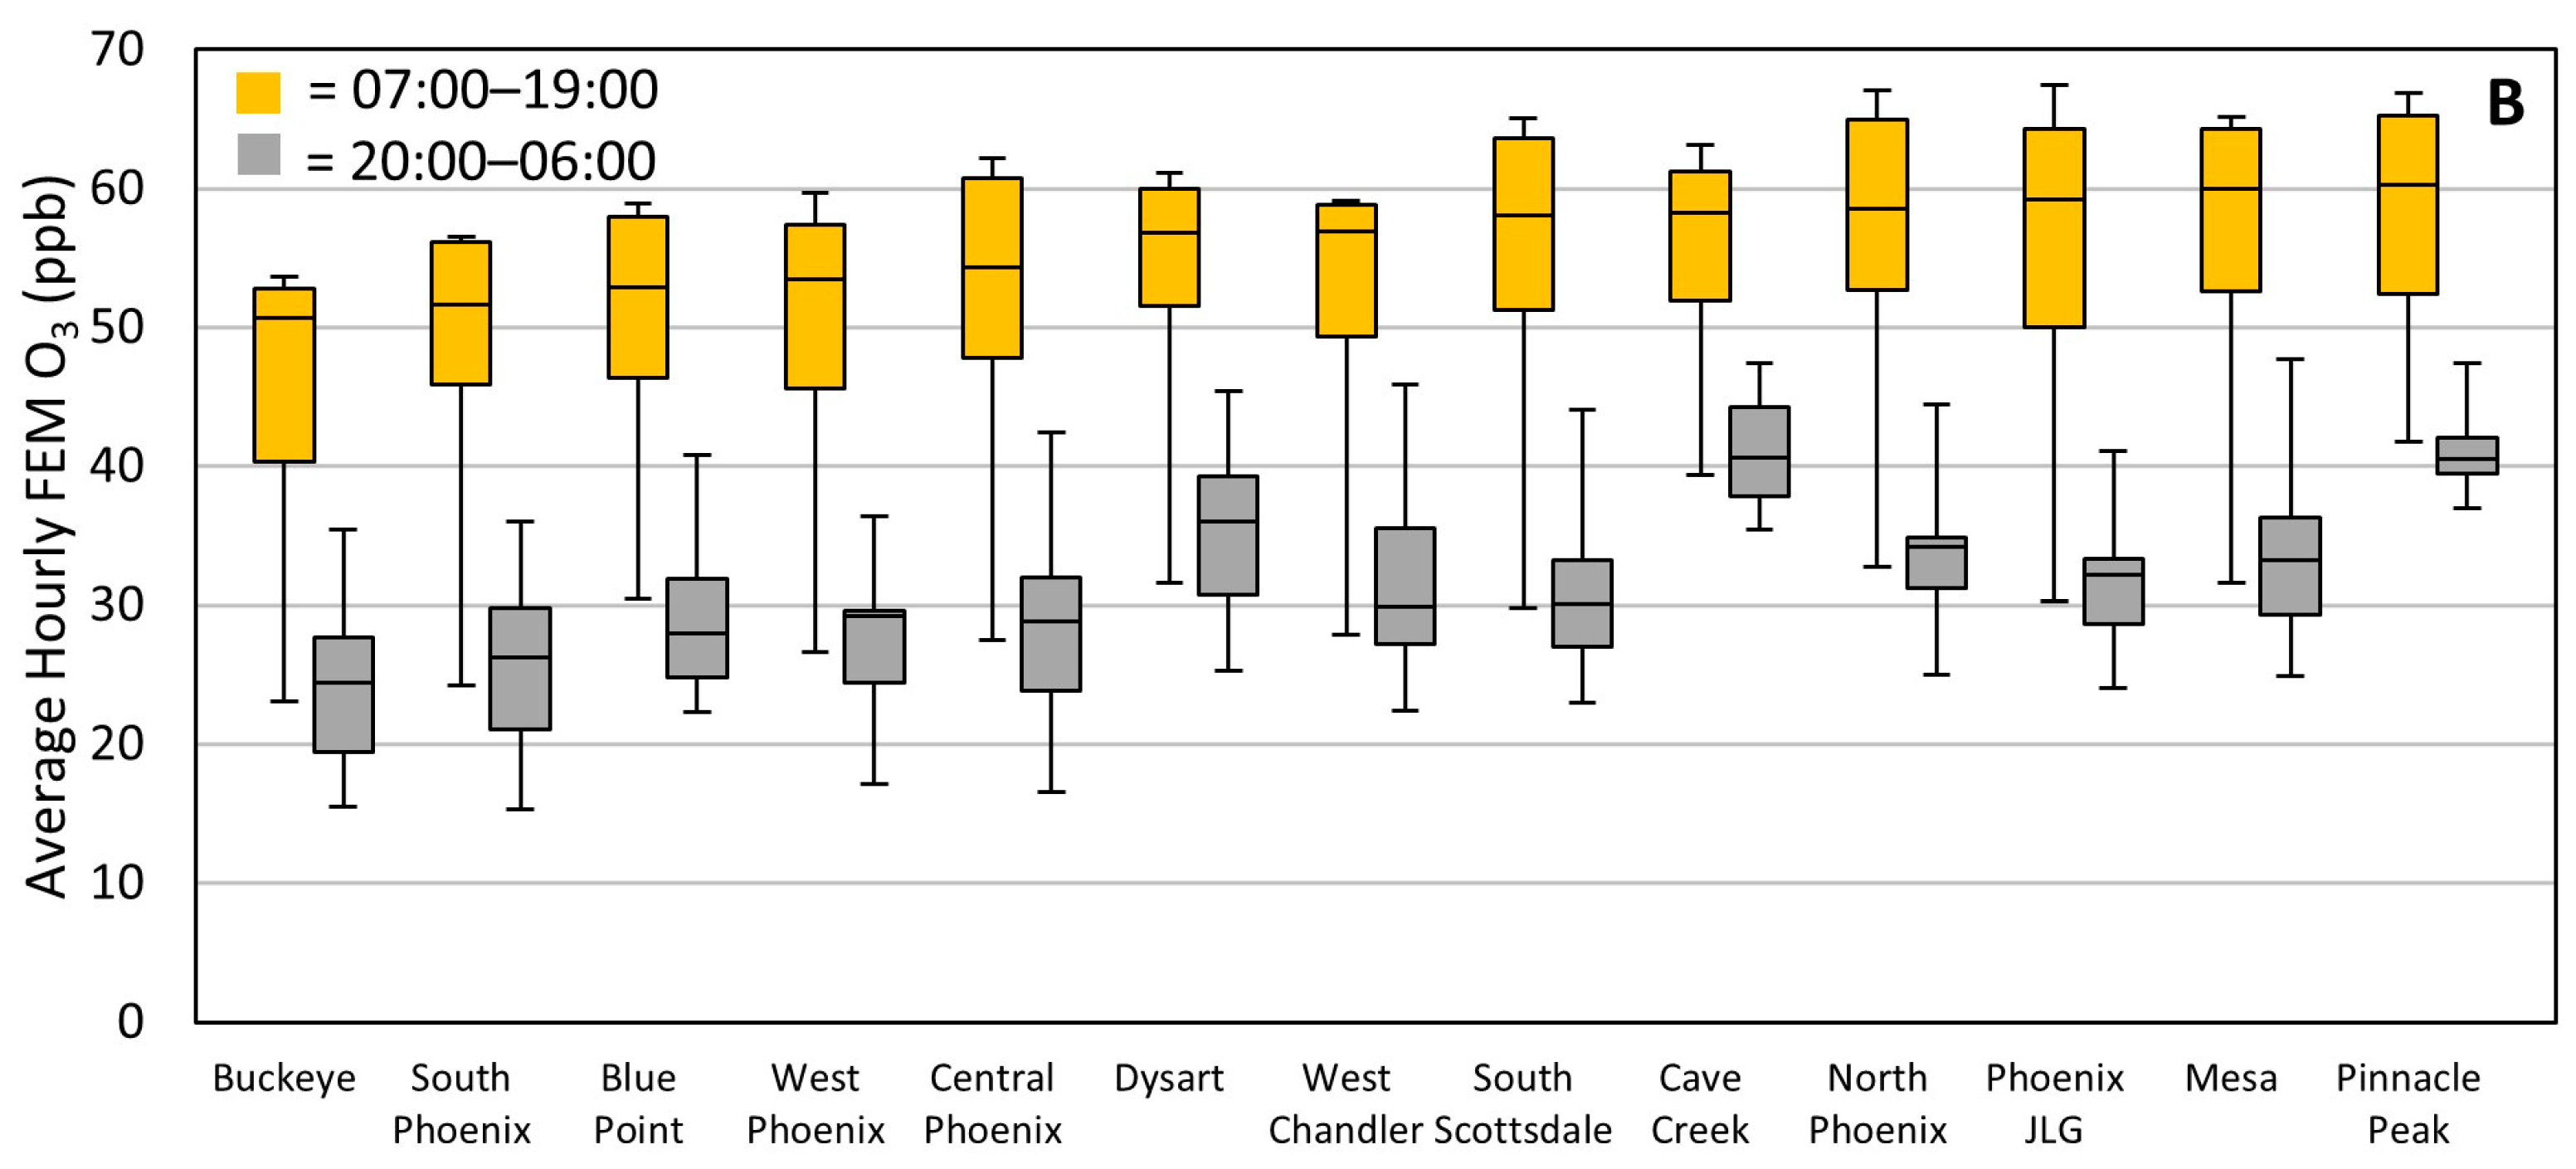
To aid local regulatory agencies in identifying locations in need of emission control measures we set out to identify the NO2 & O3 regimes at the 13 sites and establish a basic classification scheme. First, we calculated the average NO2 and O3 at each hour for the 13 sites (see Tables S3 and S4) to look at possible site-wide diurnal trends, with box and whisker plots shown in Figure 2. We found that the average NO2 values appear to peak between 04:00 and 06:00 with South Phoenix (SP), Central Phoenix (CP), and West Phoenix (WP) having the highest averages, while Phoenix JLG (JLG) and Cave Creek (CC) have the lowest. For the average O3, there is a peak between 13:00 and 15:00 with Phoenix JLG, North Phoenix (NP), Pinnacle Peak (PP), and South Scottsdale (SS) exhibiting the highest values and Buckeye (B) the lowest.
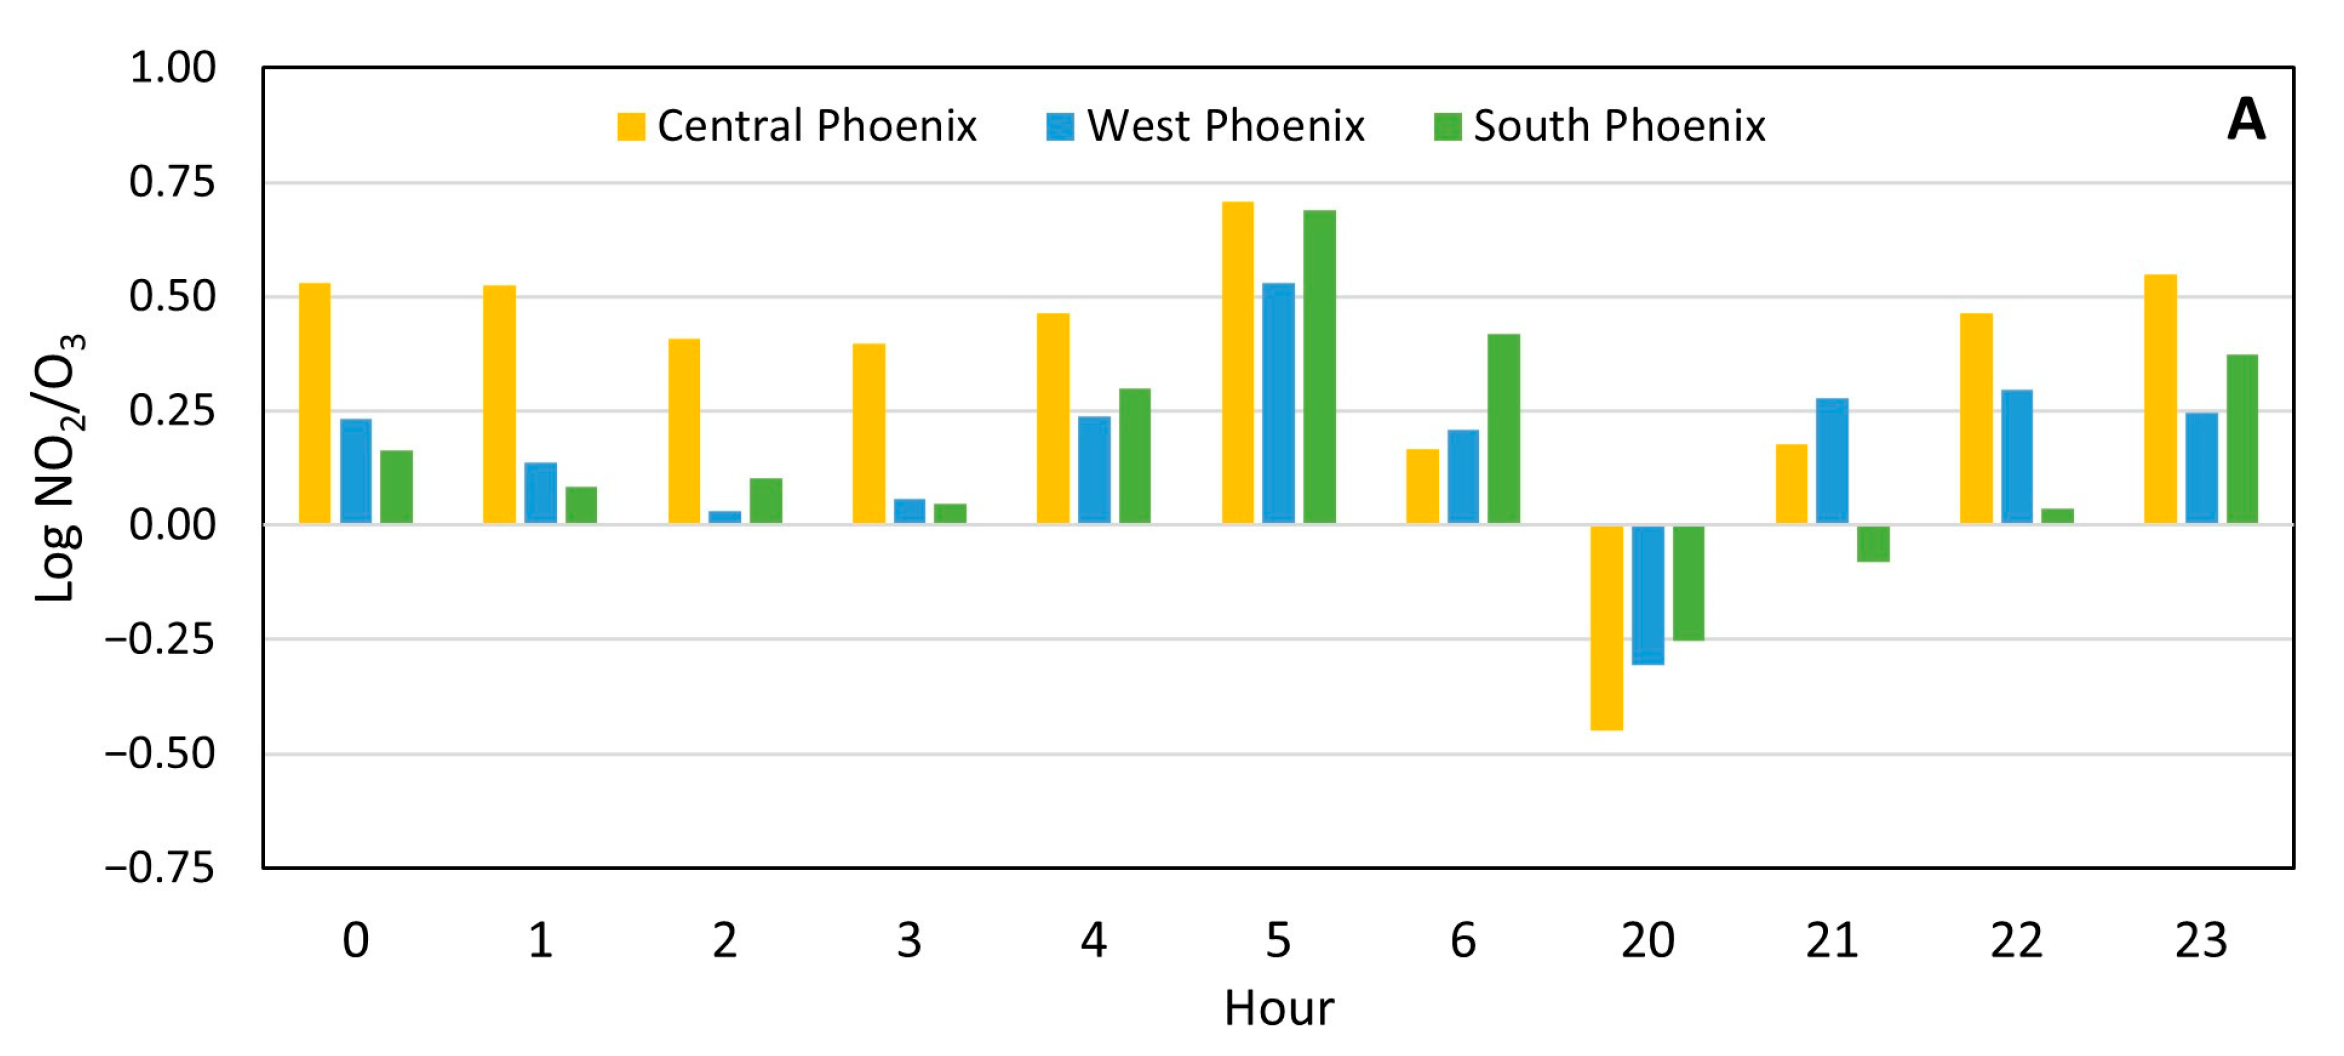
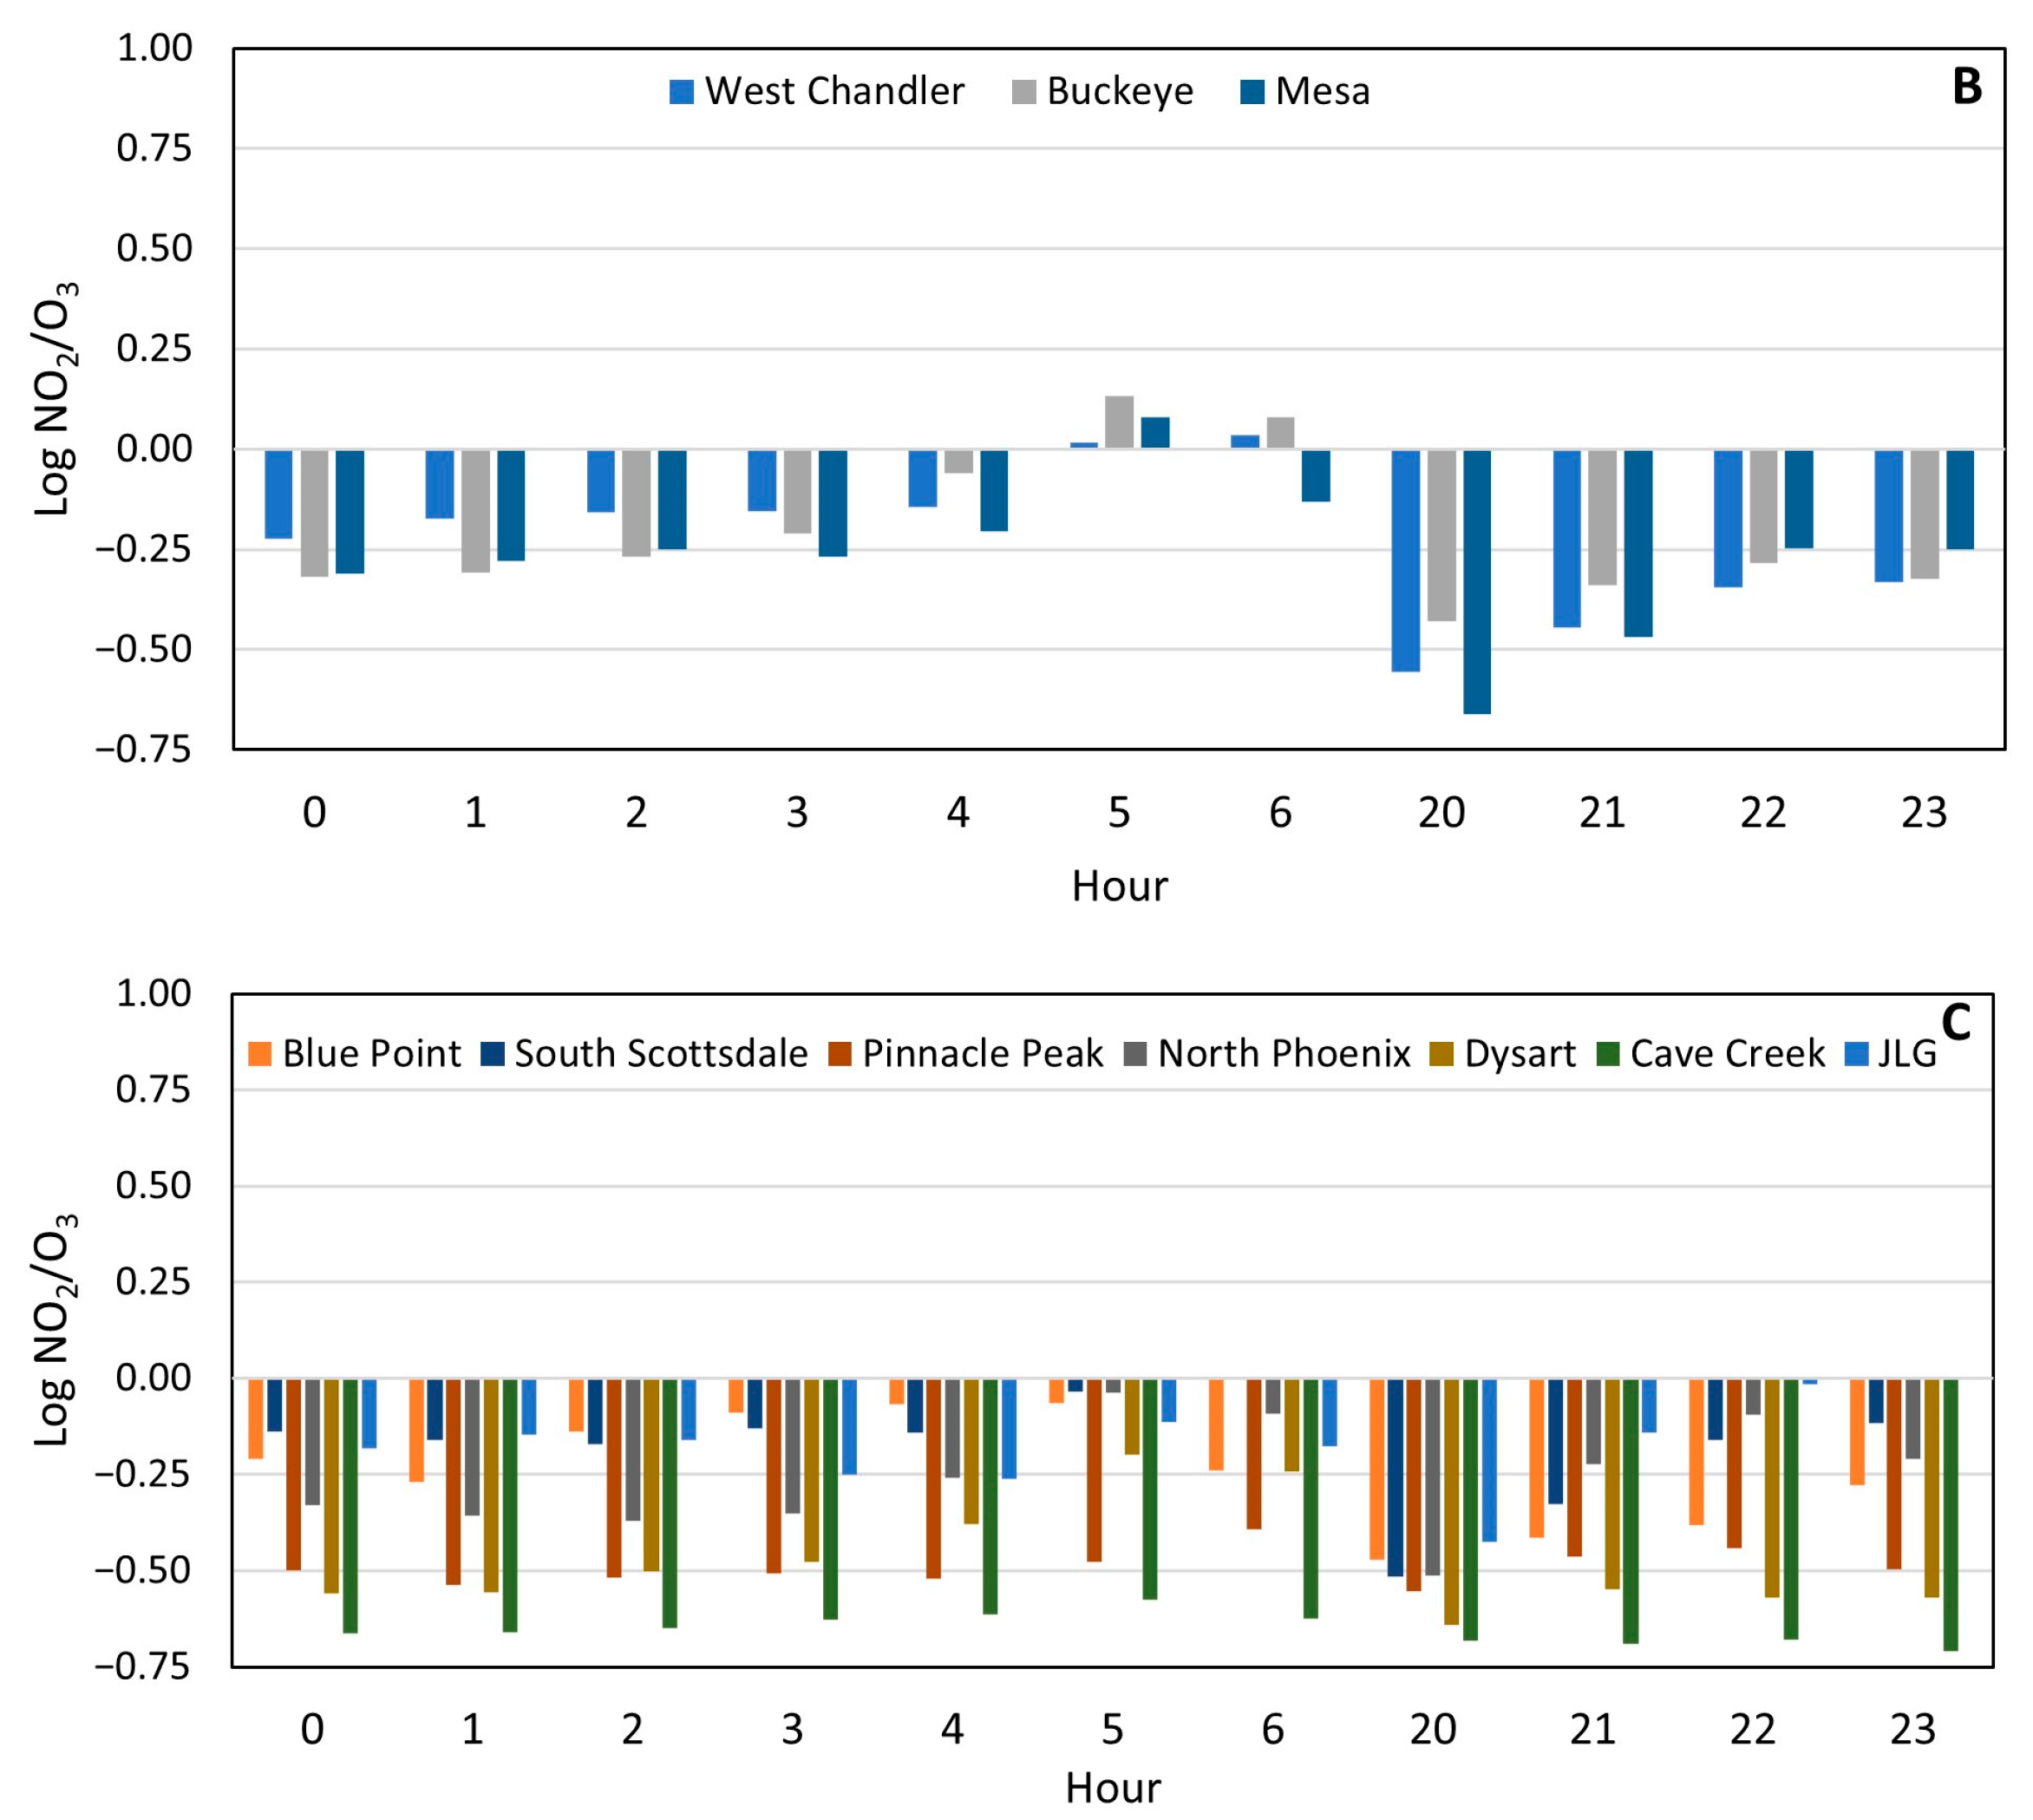
To better understand the relationship between NO2 and O3, we calculated the average log NO2/O3 values for each hour and site (see Figure 3). Using these values, we were able to divide up the sites into three categories: (1) NO2 elevated, (2) equivalent NO2 and O3, and (3) O3 elevated. Central Phoenix, South Phoenix, and West Phoenix all had log NO2/O3 values above one during morning and night-time hours and can be categorized as NO2 elevated. West Chandler (WC), Mesa (M), and Buckeye had log NO2/O3 values around one during the morning hours and can be categorized as equivalent NO2 and O3. Blue Point (BP), Cave Creek, Dysart (D), North Phoenix, Phoenix JLG, Pinnacle Peak, and South Scottsdale did not have any log NO2/O3 values greater than one and can be categorized as O3 elevated. These ozone-elevated sites may not be producing enough NOx during the night to fully react with the O3 produced throughout the day. On the other hand, the NO2-elevated sites may be producing more NOx during the night than the other sites, and/or ozone is being transported away from those sites.
To get a better understanding of the sites’ photochemistry leading to ozone formation, we calculated the product of NO2 concentration and photolysis rate (NO2 × rate). The full photolysis rate calculations are shown in the Supplementary Materials. WRF-Chem was also used to model these parameters and was able to capture a similar diurnal variation of the photolysis rate, with magnitudes comparable to the observed calculated values (Figure S2). This product is known to be one of the first steps in the chemical reaction mechanism leading to ground-level ozone accumulation [62]. By examining these values across each hour, we saw that the ozone-forming potential (when only NO2 is considered) was at a maximum in the morning hours, with West Phoenix and Central Phoenix consistently having the highest NO2 × rate at around 09:00 and Cave Creek, Pinnacle Peak, and South Scottsdale the lowest (Figure S3).
Additionally, we calculated the correlation coefficients between peak morning NO2 × rate and peak afternoon ozone concentration for all site combinations. The peak hours for NO2 × rate and ozone were chosen for each site based on Figures S4–S16. Table S5 shows the correlation coefficients for the whole deployment period for all site combinations with statistically significant correlations (p < 0.05) in black and insignificant ones in red. From Table S5 we see that the Buckeye NO2 × rate is significantly correlated to all sites’ afternoon ozone peaks, however, Buckeye has some of the lowest NO2 concentrations among the 13 sites. Therefore, Buckeye could possibly be representing a regional background signal. Additionally, the North Phoenix afternoon ozone is significantly correlated to all sites’ NO2 × rate except for Cave Creek, Blue Point, and Mesa, indicating that North Phoenix ozone is influenced by many sources possibly due to its central location and local winds (wind rose shown in Figure S17). Furthermore, afternoon Pinnacle Peak, Cave Creek, and Blue Point ozone concentrations are significantly correlated to the morning NO2 × rate values of upwind urban core sites such as Central Phoenix, West Phoenix, South Phoenix, Phoenix JLG, and North Phoenix. Conversely, the NO2 × rate values of Blue Point and Cave Creek are not significantly correlated to any sites’ afternoon ozone, namely, these downwind sites do not seem to be influencing the upwind sites’ ozone production. Finally, the Mesa, Central Phoenix, West Phoenix, and South Scottsdale ozone concentrations are only correlated to Buckeye and Pinnacle Peak NO2 × rate values suggesting possible background sources. This pattern is consistent with simulations from WRF-Chem (Figure S18) where O3 across Buckeye, JLG Supersite, and Pinnacle Peak is highest in the early afternoon (high photolysis rate, Figure S2). This is strongly correlated with increased NO2 during morning rush hours (emissions) and subsequent decrease at noon due to high photochemistry activities (NO2 × rate, Figure S2). Changes in NO2 are accompanied by changes in temperature-dependent HCHO levels, which also decrease during noon (chemical loss). Changes in O3 and its precursors over the sites during the day are also influenced by (a) boundary layer mixing which peaks at noon; and (b) prevailing southwesterly winds which transport background O3 and its precursors to Metro Phoenix. We note that levels of NO2 and VOCs also increase during late afternoon which could be related to afternoon rush hours.

3.2. Effects of Wildfire Smoke on O3 Exceedances

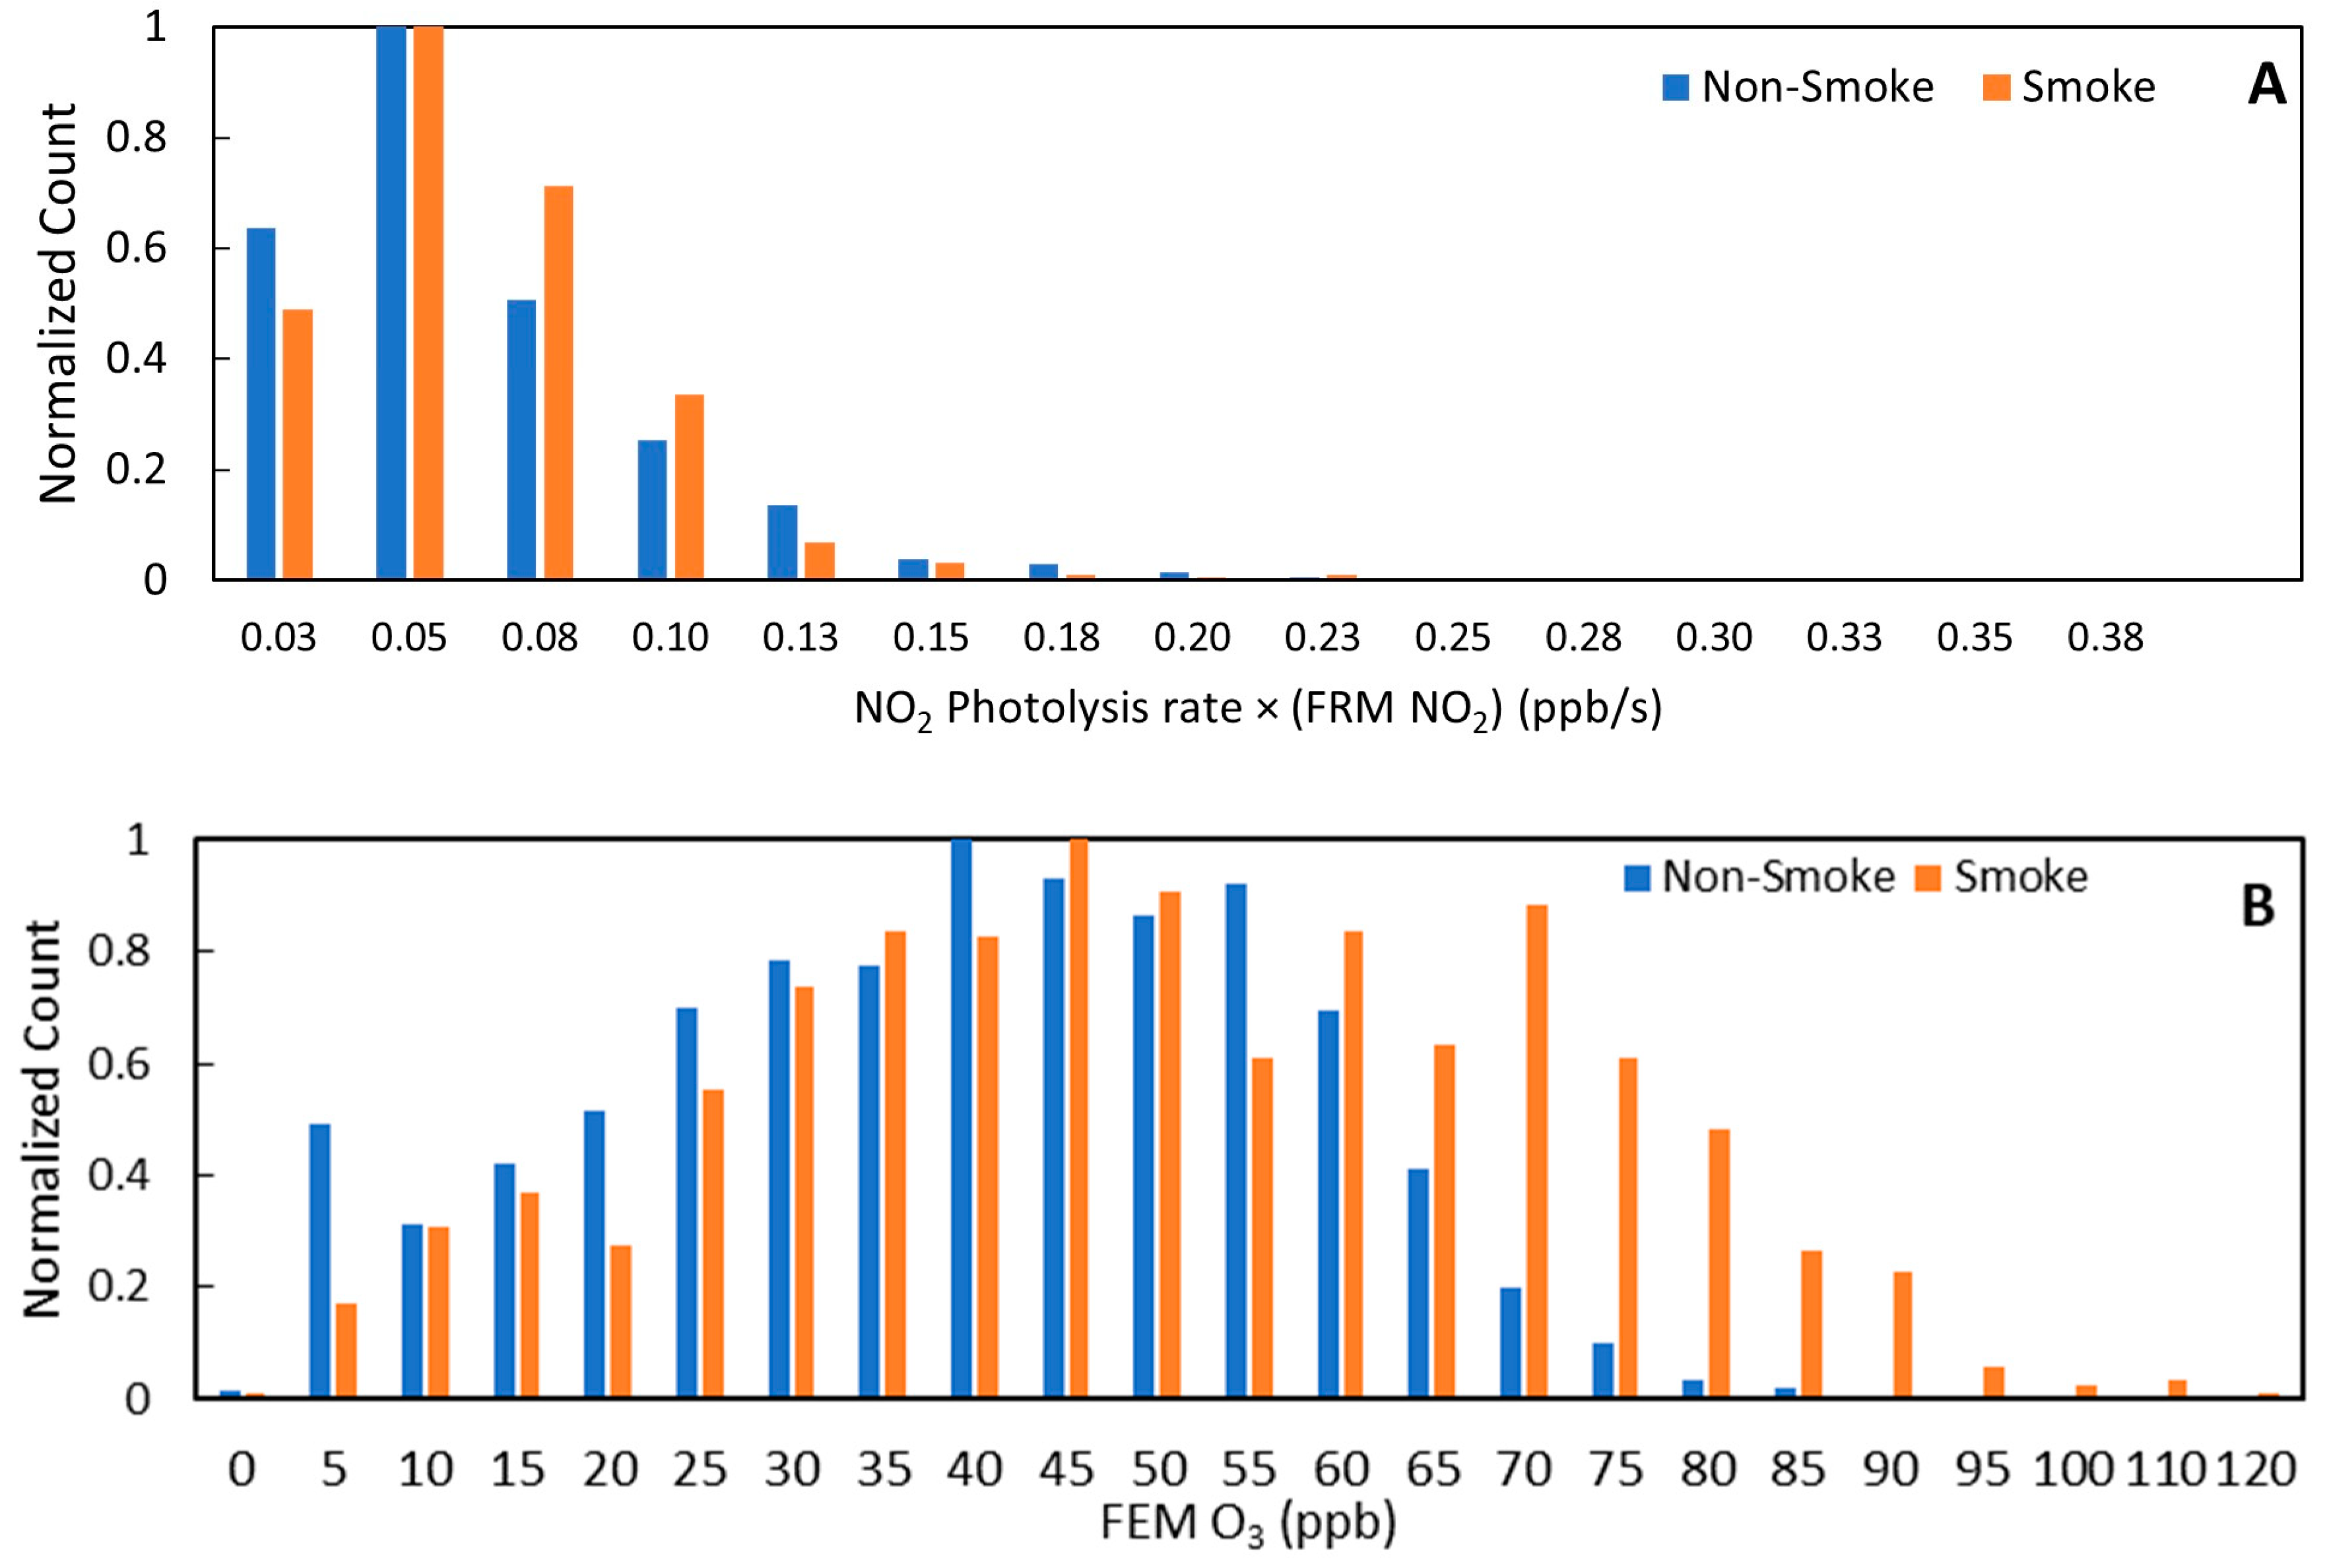
In addition to studying the whole deployment period, we also stratified the data into exceptional event days (days flagged by MCAQD as likely influenced by wildfire smoke) and regular (non-smoke) days based on times over the summer when MCAQD have shown evidence of wildfire smoke intrusion impacting local air quality (see list in Supplementary Materials). Such evidence can include satellite imagery, HYSPLIT back trajectories, NOAA Hazard Mapping System smoke products, and National Weather Service forecast reports. On 38 of the 39 labeled exceptional event days, there were also ozone exceedances at various county sites. Of the 50 days with ozone exceedances throughout the summer, only 12 occurred on non-smoke days. Figure 4 demonstrates the difference between the smoke and non-smoke days at Central Phoenix for NO2 × rate and ozone. In terms of NO2 × rate values, Figure 4A, the non-smoke days have slightly higher values in the morning; however, they are not significantly different. Regarding ozone, Figure 4B, the smoke days have higher ozone values in the afternoon with a distribution shifted to higher values on smoke days, which is a significant difference.
To get a better idea of county-wide trends, we performed the same correlation coefficient calculation for smoke, non-smoke, and non-smoke ozone exceedance days (see Tables S6–S8). On smoke days, there is a decrease in correlation between sites’ NO2 × rate values and ozone except for Dysart and Cave Creek, which may indicate that the transported wildfire smoke was directed towards the majority of the sites. The influx of transported ozone and VOCs from the smoke seems to contributing more to ozone production than local production sources. On non-smoke days there is an increase in correlation between all sites, especially NO2 × rate values at urban sites with all other sites’ ozone. However, for non-smoke days with ozone exceedances, only the Central Phoenix NO2 × rate is consistently correlated with ozone from other sites. Additionally, some rural sites such as Pinnacle Peak, Blue Point, and Cave Creek have negative correlation coefficients, but most are insignificant. Finally, an analysis of the NO2 photolysis rates between non-smoke and smoke days did not reveal any significant differences (p < 0.05). In short, the non-smoke day ozone exceedance analysis reinforces Central Phoenix as a center of local emissions and production, while the smoke day analysis indicates that smoke days have exceedances more associated with the transport of smoke-related ozone and its precursors than local precursor emissions and ozone production.

3.3. Ozone Production Sensitivity from HCHO/NO2

3.3.1. Ground Sampling

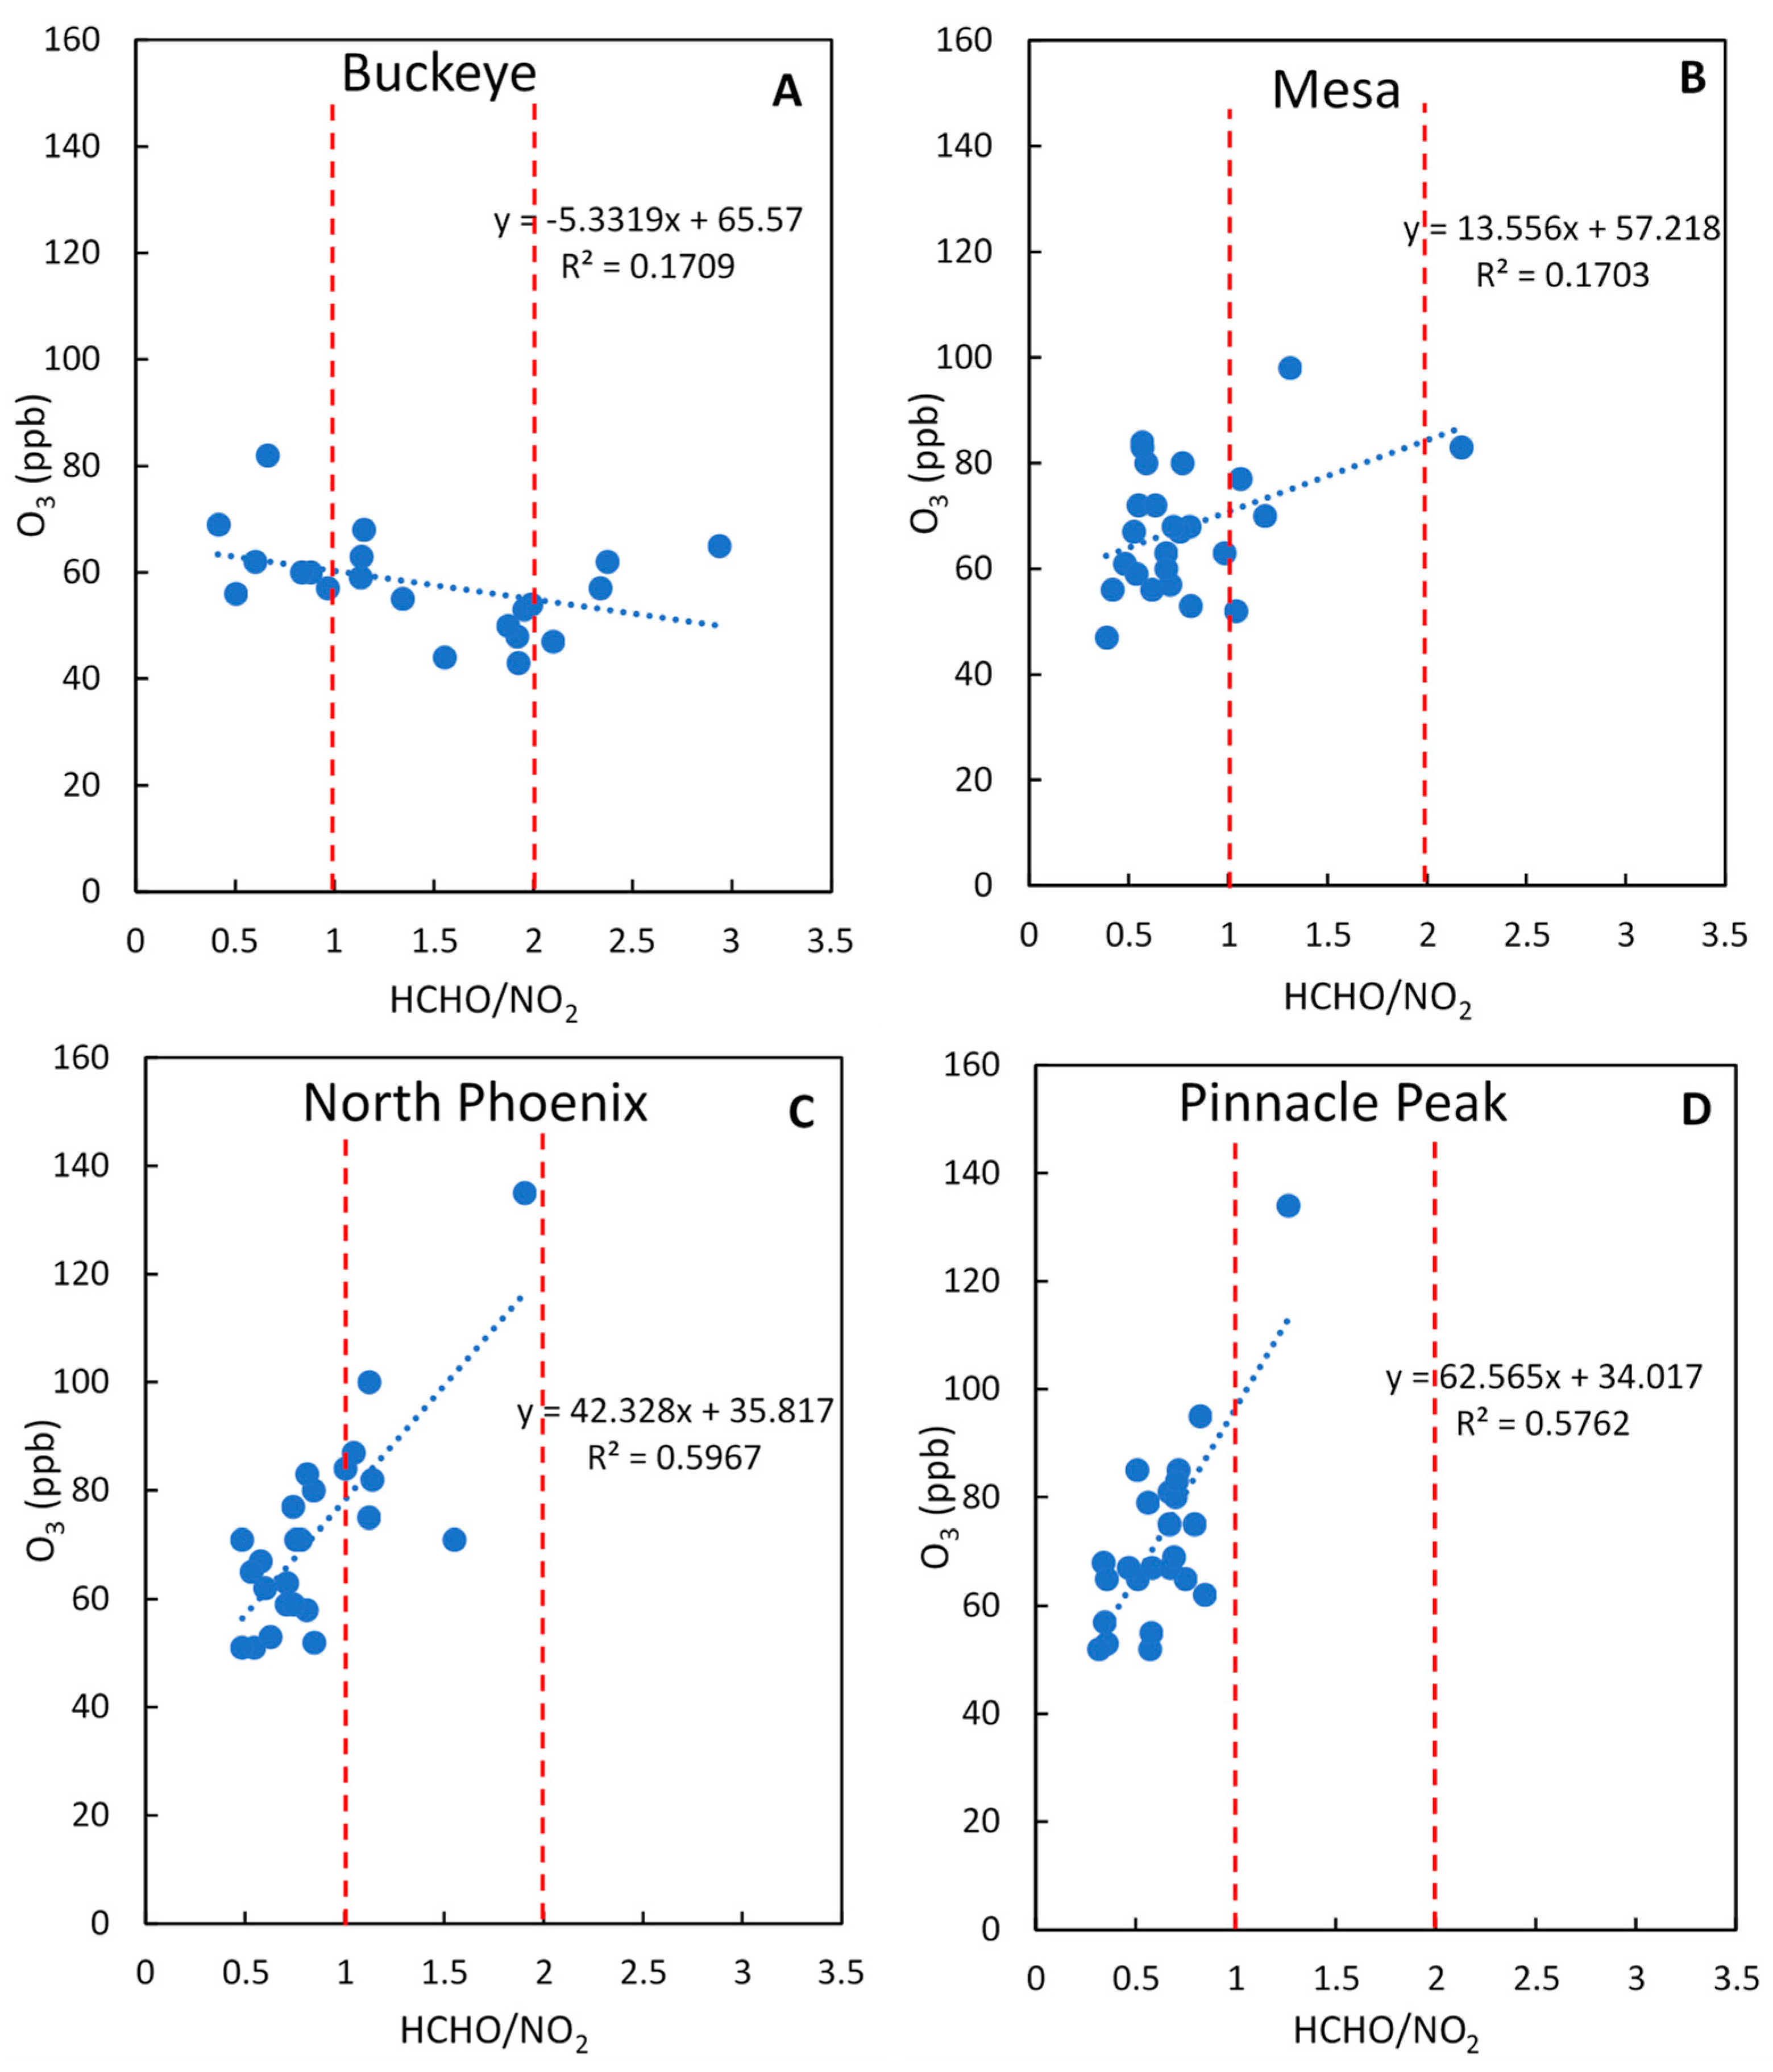
To further investigate photochemical production of O3 in Maricopa County, we incorporated VOC data into our previous NO2 analysis. Due to the scarcity of available VOC data, in terms of speciation, and spatial and temporal resolution, we focused on a method that approximates VOC oxidation by using HCHO as a proxy. From the summer canister sampling and PAMS data, we were only able to employ this method at five sites: Buckeye, Mesa, North Phoenix, Pinnacle Peak, and Phoenix JLG. Since we only had 24-h averaged HCHO data for Buckeye, Mesa, North Phoenix, and Pinnacle Peak we used the 12:00 NO2 values to calculate the HCHO/NO2 ratios and maximum O3 to examine ozone sensitivity. Figure 5 shows the plots of maximum O3 versus the HCHO/NO2 ratio, where the Pearson correlation coefficients are −0.41 for Buckeye (p > 0.05), 0.43 for Mesa (p < 0.05), 0.77 for North Phoenix (p < 0.05), and 0.77 for Pinnacle Peak (p < 0.05). Both North Phoenix and Pinnacle Peak have high correlations of maximum ozone and HCHO/NO2, while the majority of their HCHO/NO2 ratios are below 1, which is consistent with a VOC-limited ozone sensitivity [28]. Mesa has a lower correlation but the HCHO/NO2 ratios still suggest VOC-limited. Buckeye displays completely different behavior than these other sites, as the correlation is negative and the HCHO/NO2 values are higher, indicating a transition or even NOx-limited regime. This difference in behavior is consistent as Buckeye is upwind of typical urban VOC and NOx emissions as compared to the other sites. Another explanation may be that due to the lack of VOC emissions, the primary HCHO signal is more prominent than the secondary HCHO signal, influencing the effectiveness of the HCHO/NO2 ratio at the Buckeye site.
At the Phoenix JLG site, we had slightly more measurement days (30) and a higher time resolution (8 h) for HCHO; therefore, we were able to divide the data into three time periods, shown in Figure 6. Here it is clear that in the early morning and late evening, the ozone sensitivity at Phoenix JLG is VOC-limited, which makes sense since a precursor to HCHO, isoprene, is only emitted by plants during daylight, and NO2 concentrations increase at night as NO continues to react with HO2 and residual O3 and NO2 no longer photodissociates (Figure S19). However, during daytime hours the ozone sensitivity is higher in the transition and NOx-limited regimes. This is consistent with results from other studies that show urban areas will begin the day as VOC-limited and transition to NOx-limited around midday [6,28]. It should be noted that with 24-h averaged data for the other four sites, we are not able to detect this diurnal trend. While Phoenix JLG and Buckeye are at times both in transition to NOx-limited regimes and experience similar NO2 concentrations, Phoenix JLG O3 concentrations are regularly higher than Buckeye’s. One explanation could be the transport of O3 and/or precursors from the more polluted sites like Central Phoenix and West Phoenix to the Phoenix JLG site.
We also analyzed the impact of smoke on ozone sensitivity, also shown in Figure 6, as the smoke-impacted days experience slightly higher ozone concentrations than non-smoke days. Additionally, Figure 7 shows that the Phoenix JLG HCHO/NO2 ratio on smoke days is shifted higher (i.e., more NOx-limited), than on non-smoke days, which is also observed at the other four sites. This would indicate that wildfire smoke is introducing more VOCs to a typically VOC-limited airmass, increasing ozone production. For example, in Figure 8 the maximum HCHO at all sites occurs on 15 June, which is a MCAQD exceptional event day for smoke influence. NOAA HYSPLIT air mass modeling does indicate that smoke from the Telegraph wildfire in Globe, Arizona was transported to Phoenix on 15 June, Figure S20. The Telegraph fire was situated about 50 miles from downtown Phoenix and burned a total of over 150,000 acres, mostly shrub and grass.

3.3.2. Satellite Data

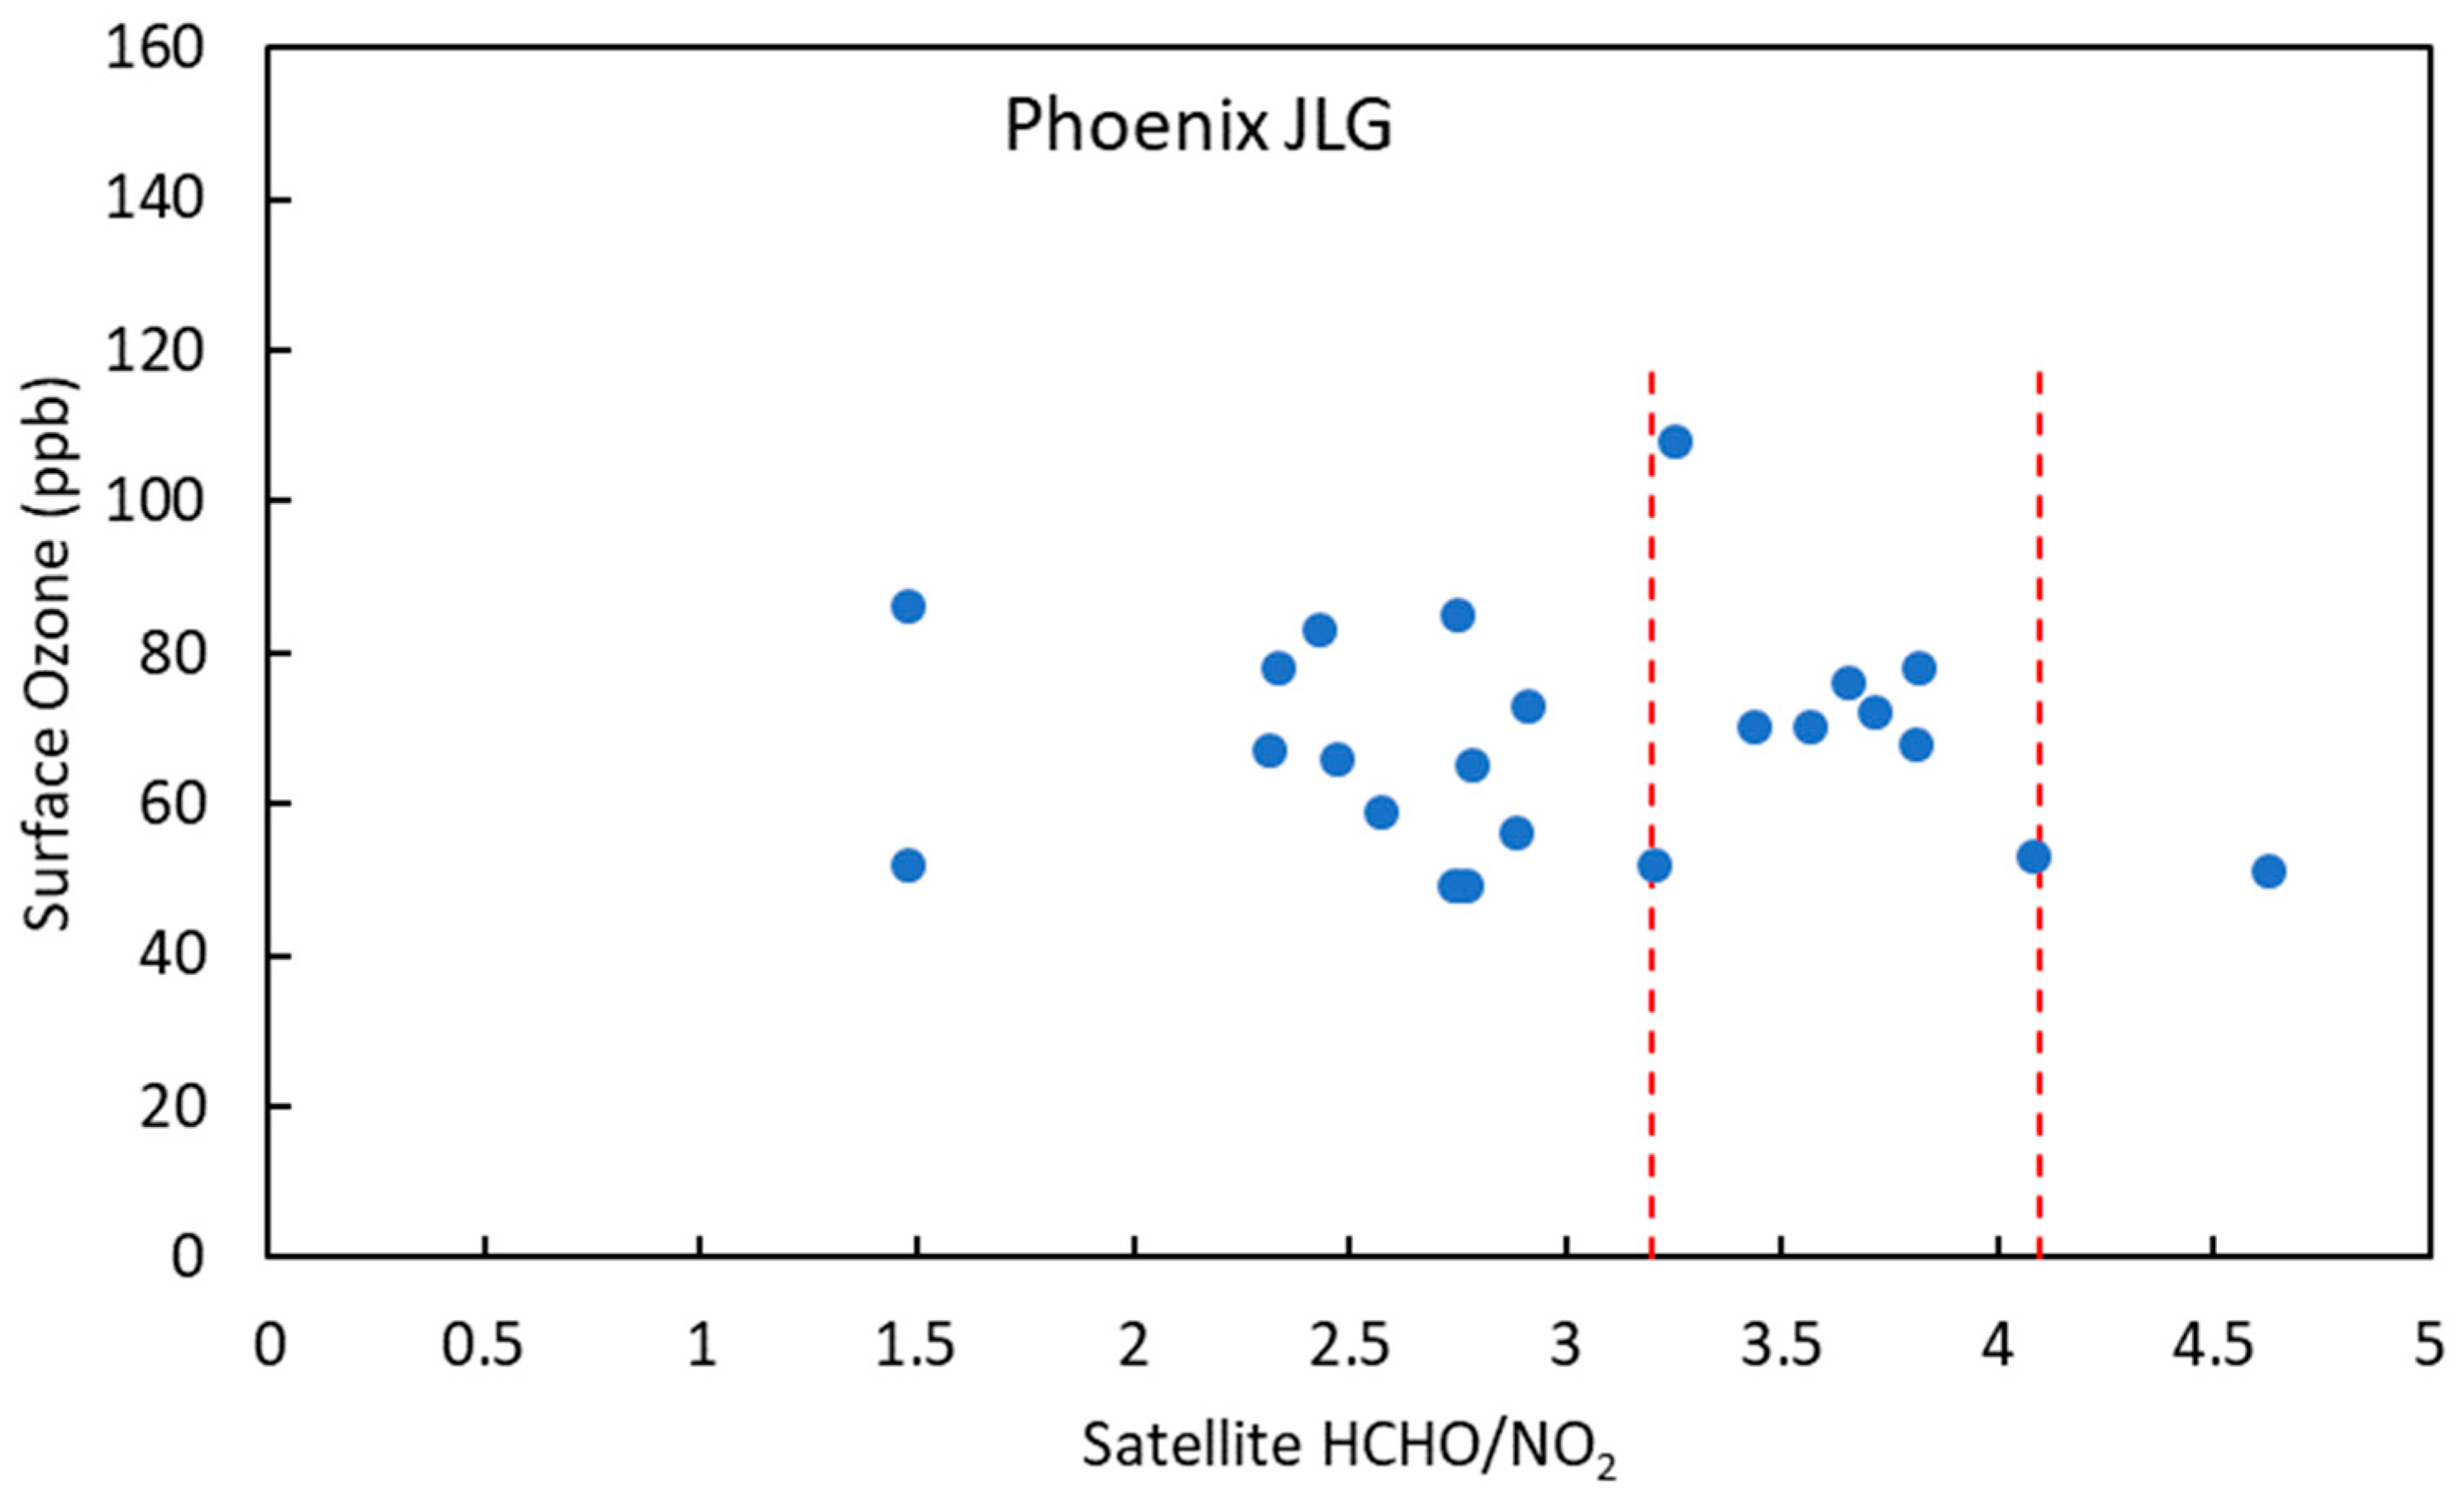
NO2 and HCHO column number densities from TROPOMI satellite retrievals were extracted for the dates and times shown in Table S2. As the space-based indicator of surface ozone production is more reliable in polluted areas, our HCHO/NO2 analysis is focused on only the Phoenix JLG site. According to the study by Jin et al., HCHO/NO2 tropospheric column ratios below 3.2 suggest VOC-sensitive ozone production; ratios between 3.2 and 4.1 define the transition zone; and ratios exceeding 4.1 represent the NOx-sensitive regime [32]. For the Phoenix JLG site, according to TROPOMI HCHO/NO2 tropospheric columns, most of the days in our study period are in transition and VOC-limited regimes, as shown in Figure 9.
Due to a limited number of days with available satellite retrievals, a comprehensive analysis of the impact of smoke on satellite HCHO/NO2 was not possible. We present here instead the satellite HCHO/NO2 for the 15 June smoke day, where ozone concentrations reached summer maximums at many sites. Figure 10 compares the average HCHO and NO2 column densities over all dates versus 15 June over the Phoenix metro area. For HCHO on an average day there are slightly higher values east of the Phoenix JLG site (12 × 1015 molecules cm−2), however for 15 June all three sites experienced a significant increase (JLG: 92%, Buckeye: 53%, Pinnacle Peak: 67%) relative to period-average values. For NO2, on an average day there is a much clearer spatial trend with higher values in the Phoenix metro area around Phoenix JLG (5 × 10¹⁵ molecules cm−2) with more extensive and elevated densities on 15 June (JLG: 63%, Buckeye: 47%, Pinnacle Peak: 12%). We find that Phoenix JLG had higher than normal HCHO/NO2 ratios on 15 June consistent with ground-based ratios, suggesting elevated VOCs relative to NO2 during this smoke event.

3.3.3. WRF-CHEM Modeling

Figure 11A shows the simulated surface HCHO/NO2 ratios versus surface O3 for Phoenix JLG in four-hour time blocks. From this modeled data, we see a clear diurnal trend of higher O3 concentrations and HCHO/NO2 ratios during the afternoon from 12:00–15:00 and lower values at night, with an overall correlation of 0.51. Most ratios are below 1, indicating a VOC-limited regime approaching the transition regime at midday, again a similar diurnal trend to what has been reported in the literature. Figure 11B shows the simulated HCHO/NO2 ratios versus O3 for the Buckeye site. At this site, there appears to be a limited trend with O3, with a correlation of only 0.39. However, the HCHO/NO2 ratios do increase during the day, largely above 2 indicating NOx-limited regimes, with some data points in the 04:00–07:00 time-frame transition and VOC-limited regimes. During the day Pinnacle Peak (shown in Figure 11C) also appears to be NOx-limited as HCHO/NO2 ratios are largely above 2 with a correlation with O3 of 0.44. The full modeled HCHO/NO2 diurnal cycles are shown in Figure S21. When comparing the average modeled ratios of smoke days versus non-smoke days, all three sites had increased ratios on smoke days, but these increases did not result in a change in the ozone sensitivity regime.

3.3.4. Intercomparison

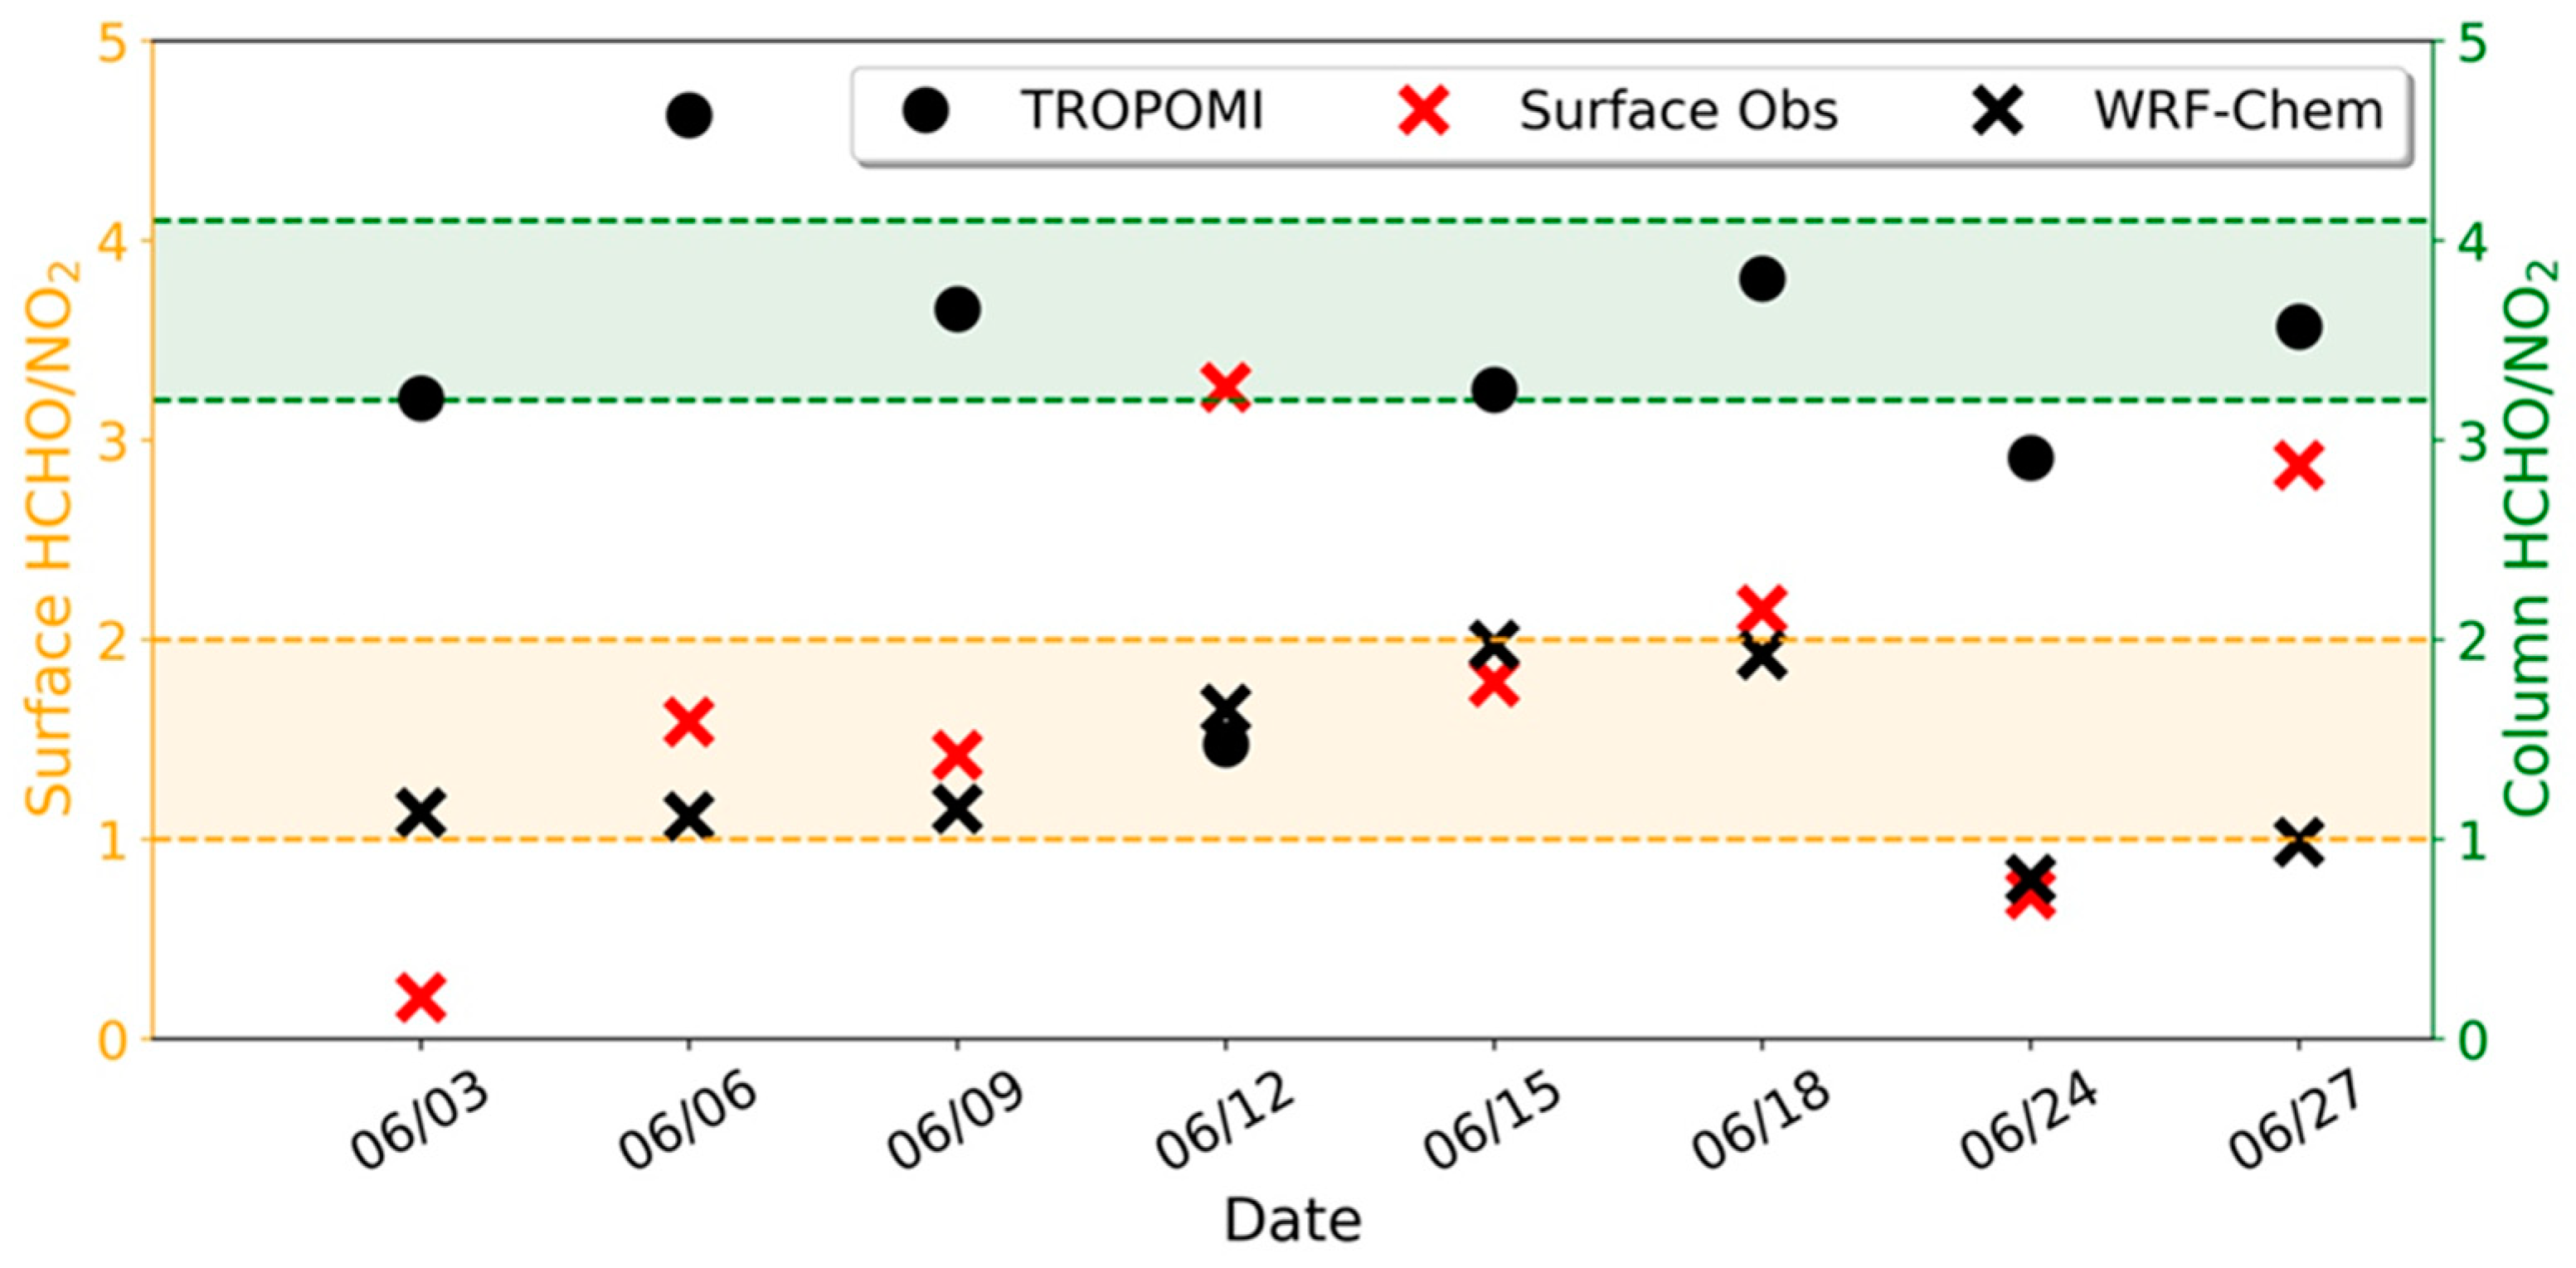
From the surface data, many of the sites are in the VOC-limited regime except for Buckeye (transition/NOx-limited), and Phoenix JLG (transition/NOx-limited during the day). While there were significant positive correlations between ozone and HCHO/NO2 at Pinnacle Peak and Phoenix JLG, Buckeye had an insignificant negative correlation. With the satellite data, since using satellite HCHO/NO2 is limited to urban (polluted) areas, data over the Phoenix JLG site was compared. It should be noted that different thresholds should be considered for satellite tropospheric columns and surface/model surface ratios. In particular, the thresholds suggested by Duncan et al. [28], which are based on model simulations of boundary layer concentrations, are suitable for comparison with modeled and observed surface ratios, while thresholds from Jin et al. [32], which are based on an intercomparison of satellite HCHO/NO2 ratios against surface measurements, are more appropriate for satellite HCHO/NO2 column ratios (e.g., [33]). Here we performed an intercomparison of HCHO/NO2 at the JLG supersite between PAMS surface observations, WRF-Chem simulated surface results, and TROPOMI column HCHO/NO2, as shown in Figure 12. The ratios from PAMS observations and WRF-Chem are derived with the 8-h HCHO at 12:00 and NO2 concentrations at 12:00 on available dates. We found that TROPOMI HCHO/NO2 tropospheric columns showed transition and VOC-limited regimes over the Phoenix JLG site. The use of satellite indicators to determine ozone chemical production regimes is subject to inherent uncertainties. These include errors in satellite data retrievals, the absence of vertically resolved data, coarser spatial and temporal sampling, and the established thresholds for categorizing regimes as either NOx-limited or VOC-limited [31]. Furthermore, given that HCHO sampling occurred every 8 h and the NO2 values were averaged over the same 8-h periods, these are not precisely synchronized with the TROPOMI satellite overpass times. Therefore, the most reliable method of comparison may be to examine the trends. From this perspective in the early afternoon, the ratios derived from surface measurements and WRF-Chem simulation are indicating a transition to NOx-limited regime, while the satellite column retrievals denote a transition to VOC-limited regime. However, when the full dataset is examined for surface measurements and WRF-Chem simulation at Phoenix JLG the majority of ratios are also VOC-limited.
As shown in Figure 11, on average the modeled HCHO/NO2 ratios from Buckeye and Pinnacle Peak are in the NOx-limited regimes, while Phoenix JLG is VOC-limited, indicating an underestimation of HCHO/NO2. We attribute this discrepancy on one hand to an overestimation of WRF-Chem at low NO2 concentrations and an underestimation at high NO2 concentrations in the Phoenix JLG site, with an average overestimation of 2.3 ppb (Figure S22). Guo et al. [63] found that WRF-Chem overestimates the nighttime NO2 and underestimates NO2 during the daytime over Phoenix. The model was performed using NEI 2017 (the latest available dataset for WRF-Chem input) and applied for the year 2021. We acknowledge the presence of bias, especially in light of emission changes during the COVID-19 period. We have published a more detailed model evaluation paper [62]. It is conceivable that NO2 levels may be even lower (further underestimated) than in the current runs when NEI emissions are scaled to match NO2 reduction due to the COVID-19 lockdown. On the other hand, WRF-Chem failed to capture large HCHO and NO2 concentrations at the Phoenix JLG site compared to the PAMS data (Figures S22 and S23). This is likely due to the misrepresentation of smoke/fire activities and locations during June 2021 near Phoenix. Other reasons for this underestimation include the choices of initial and boundary conditions in the model, along with the planetary boundary parameterization scheme, including winds and boundary layer mixing.
In terms of smoke impact, all five sites with sampled data saw HCHO/NO2 ratio increases on smoke days compared to non-smoke days, with an average increase of 39% across the entire study period due to increased HCHO. This trend is also observed with the modeled data where sites saw an average HCHO/NO2 increase of 20% on smoke days compared to non-smoke days (for the June 2021 period). For the satellite data, we see an increase of 14% in HCHO/NO2 at Phoenix JLG during the 15 June smoke event, due to more elevated HCHO relative to NO2. Looking at the individual components, the NO2 on smoke days for the sampled and modeled data (albeit limited to the June 2021 period) is comparable to non-smoke days. Comparison with satellite NO2 columns is only limited to a single event (15 June), where NO2 columns increased by 40% on average across 3 sites.

4. Conclusions

The focus of this work was to take advantage of an LCS NO2 network in Maricopa County to obtain a better understanding of the spatial and temporal patterns of ozone formation and its precursors. This analysis is important for justifying exceptional events designations, locating sources of precursor emissions, and understanding ozone sensitivity regimes. First, the log NO2/O3 values from each site were used to classify them as NO2 (precursor)-elevated, O3-elevated, or a mix. As expected, downtown/urban sites such as Central Phoenix were more NO2 elevated, and downwind sites such as Cave Creek were O3 elevated. These results were further supported by correlation analysis between afternoon O3 values and morning NO2 × rate (used to better account for NO2 photochemistry), where afternoon O3 values at downwind sites were significantly correlated (~0.27) to morning NO2 × rate values at urban sites, especially with Central Phoenix on ozone exceedance days (non-smoke).
The influence of smoke was also considered, as county-labeled smoke days had similar NO2 × rate values as non-smoke days (2% higher) but overall higher ozone concentrations (20% higher), which is corroborated by the correlation analysis as there were lower insignificant correlations between NO2 × rate values and O3 on smoke days compared to non-smoke. To better understand this ozone sensitivity, VOC data was incorporated into the analysis, specifically HCHO, as it has been shown to be a good proxy for VOC radical chemistry. Using this HCHO data we were able to see a large peak in HCHO on the 15 June smoke day in both the surface and satellite datasets, indicating a change to the initial ozone precursor mixture, resulting in summer maximum ozone concentrations.
The HCHO/NO2 ratio was also used to quantitatively determine ozone sensitivity at the sites. The ratios were compared on smoke and non-smoke days and the ratio appears to be shifted higher, more towards NOx-limited, on smoke days, again consistent with VOC transport on these days, and supported by the satellite data. In terms of individual sites, while mixed results were seen at the upwind background site, the other three sites’ ozone was significantly correlated to HCHO/NO2, with ratios below 1 indicating VOC-limited ozone sensitivity. However, at Phoenix JLG we were able to measure HCHO/NO2 ratios at different hours in the day and observed that the ratio was larger, and more NOx-limited, during daylight compared to night, which is consistent with other results in the literature. This information is important for regulators, especially those managing O3 non-attainment areas, as identifying areas with problematic emissions sources and the nature of their airmass O3 production sensitivity can aid in implementing more effective control measures. For example, if an area is consistently NOx-limited it is beneficial to implement emission controls such as switching from coal power plants to natural gas. However, if NOx emissions are reduced in a VOC-limited regime the control measure will have less of an impact on total O3 production compared to reducing VOC emissions.
As not all areas will measure both NO2 and HCHO, modeling or satellite measurements can be an alternative to determine ozone production sensitivity. We compared the surface calculated ratios with TROPOMI satellite and WRF-Chem model simulations. With the satellite data, only one site had enough quality data for comparison: Phoenix JLG. The satellite data had higher HCHO/NO2 ratios compared to the surface but as the thresholds for satellite data should be considered different from surface/model data, the overall ozone sensitivity regime of VOC-limited/transition at the Phoenix JLG site was comparable between the different methods. Additionally, the satellite data measured larger NO2 column densities on smoke days compared to non-smoke leading to a decrease in HCHO/NO2, which was not observed in the ground or modeled data. However, the satellite did not detect as many NOx-limited days as the surface or modeled datasets; this may be explained by the limited temporal span and resolution of the method. Discrepancies between satellite-calculated ratios and surface/model ratios can also be explained by the inherent nature of column density measurements which are unable to resolve tropospheric species from other layers in the atmosphere.
The WRF-Chem data allowed for better temporal resolution, but our comparison was limited by our VOC sampling frequency. Both the model and surface datasets were able to capture the diurnal effect of HCHO/NO2 increasing throughout the day, transitioning to a NOx-limited sensitivity in the early afternoon. We were also able to compare three sites, Phoenix JLG, Pinnacle Peak, and Buckeye. For the more urban sites, both the model and surface ratios indicated they were VOC-limited during the night and had higher ratios (transition to NOx) during the day. However, the model failed to accurately capture the ratios seen in the surface measurements at Buckeye and Pinnacle Peak. The modeled ratios were several times higher than the ratios seen in the surface data. While the surface ratios indicated a largely VOC-limited sensitivity at Pinnacle Peak, the modeled ratios spanned from VOC-limited to NOx-limited with ratio values reaching 7.6. For Buckeye, both the surface and modeled ratios included values in the VOC and NOx-limited regimes, however, the maximum ratio for the modeled dataset was 12.6 and 2.9 for the surface dataset. Some of this may be explained by the lack of temporal resolution in the VOC samples for the Buckeye and Pinnacle Peak sites, as their HCHO/NO2 ratio is more of a 24-h average that will not capture any of the extremes.
In terms of individual components, the model overestimated NO2 and underestimated HCHO at Phoenix JLG leading to an underestimation of HCHO/NO2 ratios compared to the sampled data. This is most likely due to differences in prescribed emissions (NEI2017) in WRF-Chem than actual emissions after COVID-19. However, the sampled and modeled HCHO and NO2 on smoke days were comparable. A future study looking at the biogenic VOC emissions with the MEGAN model, especially isoprene, can help us better understand the HCHO formation, such as the diurnal variation, and improve the WRF-Chem performance. Future studies could perhaps pair modeled HCHO data with real NO2 measurements to ensure more frequent HCHO and more reliable NO2 measurements or establish a combined HCHO and NO2 measurement network consisting of low-cost sensors.
As Phoenix Arizona is one of the most populous cities in the United States, it is a serious public health issue that it lies in an O3 non-attainment area. Therefore, it is crucial that air quality regulators understand the ozone chemistry occurring in the region. A better understanding starts with more comprehensive measurements of ozone precursors, including NO2 and VOCs. In this study, we leveraged surface measurements from air monitoring stations and low-cost sensors, satellite retrievals, and WRF-Chem model results to better examine the relationship between ozone and its precursors and how outside factors, such as wildfire smoke, may impact it. This study found that the Phoenix metro area is VOC-limited, but during the early afternoon and especially with the presence of smoke the ozone sensitivity will shift to NOx-limited. Overall, while this study was able to make some conclusions regarding ozone formation in Maricopa County Arizona, future studies could still greatly benefit from more HCHO (and other speciated VOC) measurements made at all 13 sites at more frequent (1-h) time resolution.

Supplementary Materials

The following supporting information can be downloaded at: https://www.mdpi.com/article/10.3390/atmos15050555/s1, Table S1: Canister sampling dates and analysis performed at the four MCAQD sites; Table S2. Dates and times of TROPOMI retrievals; Photolysis Rate Calculations; Figure S1. Box and whisker plot for the calculated NO2 photolysis rates at West Phoenix during the study period; Figure S2. WRF-Chem simulated monthly mean diurnal variation of NO2 photolysis rate and NO2 concentration (top), and NO2 × Rate (bottom) at three selected sites: JLG supersite, Pinnacle Peak, and Buckeye during June 2021; Figure S3. Box and whisker plots for the NO2 × rate for the 13 sites at various hours; Table S3. Average Hourly NO2 for each site; Table S4. Average Hourly FEM O3 for each site; Figure S4. NO2 × Rate (A) and O3 (B) values versus hour for Pinnacle Peak for all days, ozone exceedance days, 06/11, and 06/15; Figure S5. NO2 × Rate (A) and O3 (B) values versus hour for Cave Creek for all days, ozone exceedance days, 06/11, and 06/15; Figure S6. NO2 × Rate (A) and O3 (B) values versus hour for Blue Point for all days, ozone exceedance days, 06/11, and 06/15; Figure S7. NO2 × Rate (A) and O3 (B) values versus hour for Mesa for all days, ozone exceedance days, 06/11, and 06/15; Figure S8. NO2 × Rate (A) and O3 (B) values versus hour for West Chandler for all days, ozone exceedance days, 06/11, and 06/15; Figure S9. NO2 × Rate (A) and O3 (B) values versus hour for South Scottsdale for all days, ozone exceedance days, 06/11, and 06/15; Figure S10. NO2 × Rate (A) and O3 (B) values versus hour for Dysart for all days, ozone exceedance days, 06/11, and 06/15; Figure S11. NO2 × Rate (A) and O3 (B) values versus hour for South Phoenix for all days, ozone exceedance days, 06/11, and 06/15; Figure S12. NO2 × Rate (A) and O3 (B) values versus hour for Buckeye for all days, ozone exceedance days, 06/11, and 06/15; Figure S13. NO2 × Rate (A) and O3 (B) values versus hour for Phoenix JLG for all days, ozone exceedance days, 06/11, and 06/15; Figure S14. NO2 × Rate (A) and O3 (B) values versus hour for North Phoenix for all days, ozone exceedance days, 06/11, and 06/15; Figure S15. NO2 × Rate (A) and O3 (B) values versus hour for Central Phoenix for all days, ozone exceedance days, 06/11, and 06/15; Figure S16. NO2 × Rate (A) and O3 (B) values versus hour for West Phoenix for all days, ozone exceedance days, 06/11, and 06/15. Figure S17. Wind Rose for the North Phoenix site, wind speed in knots; Figure S18. WRF-Chem simulated monthly mean of hourly O3, NO2, HCHO, and wind speed/direction averaged over 6 hours time period during the day: 00:00–05:00, 06:00–11:00, 12:00–17:00, 18:00–23:00 in June 2021. Table S5. Correlation coefficients between morning NO2 × Rate (row) and afternoon O3 (column) for the whole deployment period for all site combinations with the peak hour listed to site abbreviation Table S6. Correlation coefficients between morning NO2 × Rate (row) and afternoon O3 (column) for smoke days for all site combinations with the peak hour listed to site abbreviation. Table S7. Correlation coefficients between morning NO2 × Rate (row) and afternoon O3 (column) for non-smoke days for all site combinations with the peak hour listed to site abbreviation. Table S8. Correlation coefficients between morning NO2 × Rate (row) and afternoon O3 (column) for non-smoke days with ozone exceedances for all site combinations with the peak hour listed to site abbreviation; Figure S19. NO2 (A) and isoprene (B) concentrations by hour at Phoenix JLG; Figure S20. HYSPLIT air mass trajectory model from 15 June 2021; Figure S21. Box and whisker plots for WRF-Chem HCHO/NO2 diurnal cycles for the Phoenix JLG (A), Buckeye (B), and Pinnacle Peak (C) sites; Figure S22. Sampled NO2 from the Phoenix JLG site versus WRF-CHEM modeled NO2 averaged to match the samples’ time periods; Figure S23. Sampled HCHO from the Phoenix JLG site versus WRF-CHEM modeled HCHO averaged to match the samples’ time periods [64,65,66,67].

Author Contributions

Conceptualization, M.P.F. and P.H.; methodology, M.P.F., P.H., J.A.M. and A.F.A.; formal analysis, J.A.M., M.A.M. and Y.G.; investigation, J.A.M., M.A.M. and Y.G.; resources, M.P.F., P.H. and A.F.A.; writing—original draft preparation, J.A.M.; writing—review and editing, M.P.F., P.H., A.F.A., M.A.M. and Y.G.; visualization, J.A.M., M.A.M. and Y.G.; supervision, M.P.F., P.H. and A.F.A.; project administration, M.P.F. and P.H.; funding acquisition, M.P.F., P.H. and A.F.A. All authors have read and agreed to the published version of the manuscript.

Funding

This work was funded by the Maricopa County Air Quality Department and the Arizona Board of Regents (ABOR) Regent’s Grant from the Technology and Research Initiative Fund (TRIF).

Institutional Review Board Statement

Not applicable.

Informed Consent Statement

Not applicable.

Data Availability Statement

The TROPOMI satellite data are publicly available from https://doi.org/10.5270/S5P-vg1i7t0 (accessed on 25 June 2022) and https://doi.org/10.5270/S5P-9bnp8q8 (accessed on 25 June 2022). The WRF-Chem model version 4.4 is available for download from ZENODO (doi:10.5281/zenodo.10479471) and publicly available at NCAR https://www2.mmm.ucar.edu/wrf/users/download/get_source.html (last access: 25 June 2022). The model outputs, ADEQ forecast, and CMAQ reanalysis datasets can be provided upon request to the corresponding author. The sensor data are not publicly available due to confidentiality agreements with the agencies but requests can be evaluated on a case by case basis.

Acknowledgments

The authors would like to thank Kanchana Chandrakanthan, Joshua Uebelherr, Quincy Stewart, and Megan Gaitan for their support with this project’s field work.

Conflicts of Interest

The authors declare no conflicts of interest.

References

  1. Maricopa County Air Quality Department. 2022 Air Monitoring Network Plan. 2022. Available online: https://www.maricopa.gov/DocumentCenter/View/76136/2022-Air-Monitoring-Network-Plan_Final?bidId= (accessed on 4 April 2024).
  2. U.S. Environmental Protection Agency; U.S. EPA. Integrated Science Assessment (ISA) for Ozone and Related Photochemical Oxidants. 2020. Available online: https://www.epa.gov/isa/integrated-science-assessment-isa-ozone-and-related-photochemical-oxidants (accessed on 4 April 2024).
  3. Crutzen, P.J. The influence of nitrogen oxides on the atmospheric ozone content. Q. J. R. Meteorol. Soc. 1970, 96, 320–325. [Google Scholar] [CrossRef]
  4. Chameides, W.L. The photochemical role of tropospheric nitrogen oxides. Geophys. Res. Lett. 1978, 5, 17–20. [Google Scholar] [CrossRef]
  5. National Research Council. Rethinking the Ozone Problem in Urban and Regional Air Pollution; National Academy Press: Washington, DC, USA, 1991.
  6. Milford, J.B.; Gao, D.; Sillman, S.; Blossey, P.; Russell, A.G. Total reactive nitrogen (NOy) as an indicator of the sensitivity of ozone to reductions in hydrocarbon and NOx emissions. J. Geophys. Res. Atmos. 1994, 99, 3533–3542. [Google Scholar] [CrossRef]
  7. Ashok, A.; Barrett, S.R.H. Adjoint-based computation of U.S. nationwide ozone exposure isopleths. Atmos. Environ. 2016, 133, 68–80. [Google Scholar] [CrossRef]
  8. Qian, Y.; Henneman, L.R.F.; Mulholland, J.A.; Russell, A.G. Empirical Development of Ozone Isopleths: Applications to Los Angeles. Environ. Sci. Technol. Lett. 2019, 6, 294–299. [Google Scholar] [CrossRef]
  9. Liu, C.; Zhang, L.; Wen, Y.; Shi, K. Sensitivity analysis of O3 formation to its precursors-Multifractal approach. Atmos. Environ. 2021, 251, 118275. [Google Scholar] [CrossRef]
  10. Chang, C.-Y.; Faust, E.; Hou, X.; Lee, P.; Kim, H.C.; Hedquist, B.C.; Liao, K.-J. Investigating ambient ozone formation regimes in neighboring cities of shale plays in the Northeast United States using photochemical modeling and satellite retrievals. Atmos. Environ. 2016, 142, 152–170. [Google Scholar] [CrossRef]
  11. Park, S.-Y.; Park, C.; Yoo, J.-W.; Lee, S.-H.; Lee, H.W. Adjoint sensitivity of inland ozone to its precursors and meteorological and chemical influences. Atmos. Environ. 2018, 192, 104–115. [Google Scholar] [CrossRef]
  12. Wang, N.; Lyu, X.; Deng, X.; Huang, X.; Jiang, F.; Ding, A. Aggravating O3 pollution due to NOx emission control in Eastern China. Sci. Total Environ. 2019, 677, 732–744. [Google Scholar] [CrossRef]
  13. Oikonomakis, E.; Aksoyoglu, S.; Ciarelli, G.; Baltensperger, U.; Prévot, A.S.H. Low modeled ozone production suggests underestimation of precursor emissions (especially NOx) in Europe. Atmos. Chem. Phys. 2018, 18, 2175–2198. [Google Scholar] [CrossRef]
  14. Dunker, A.M.; Wilson, G.; Bates, J.T.; Yarwood, G. Chemical Sensitivity Analysis and Uncertainty Analysis of Ozone Production in the Comprehensive Air Quality Model with Extensions Applied to Eastern Texas. Environ. Sci. Technol. 2020, 54, 5391–5399. [Google Scholar] [CrossRef]
  15. Mar, K.A.; Ojha, N.; Pozzer, A.; Butler, T.M. Ozone air quality simulations with WRF-Chem (v3.5.1) over Europe: Model evaluation and chemical mechanism comparison. Geosci. Model Dev. 2016, 9, 3699–3728. [Google Scholar] [CrossRef]
  16. Pfister, G.; Wang, C.; Barth, M.; Flocke, F.; Vizuete, W.; Walters, S. Chemical Characteristics and Ozone Production in the Northern Colorado Front Range. J. Geophys. Res. Atmos. 2019, 124, 13397–13419. [Google Scholar] [CrossRef]
  17. Xu, J.; Tie, X.; Gao, W.; Lin, Y.; Fu, Q. Measurement and model analyses of the ozone variation during 2006 to 2015 and its response to emission change in megacity Shanghai, China. Atmos. Chem. Phys. 2019, 19, 9017–9035. [Google Scholar] [CrossRef]
  18. Thorp, T.; Arnold, S.R.; Pope, R.J.; Spracklen, D.V.; Conibear, L.; Knote, C.; Arshinov, M.; Belan, B.; Asmi, E.; Laurila, T.; et al. Late-spring and summertime tropospheric ozone and NO2 in western Siberia and the Russian Arctic: Regional model evaluation and sensitivities. Atmos. Chem. Phys. 2021, 21, 4677–4697. [Google Scholar] [CrossRef]
  19. Abdi-Oskouei, M.; Roozitalab, B.; Stanier, C.O.; Christiansen, M.; Pfister, G.; Pierce, R.B.; McDonald, B.C.; Adelman, Z.; Janseen, M.; Dickens, A.F.; et al. The Impact of Volatile Chemical Products, Other VOCs, and NOx on Peak Ozone in the Lake Michigan Region. J. Geophys. Res. Atmos. 2022, 127, e2022JD037042. [Google Scholar] [CrossRef]
  20. Honoré, C.; Vautard, R.; Beekmann, M. Low and high NOx chemical regimes in an urban environment. Environ. Model. Softw. 2000, 15, 559–564. [Google Scholar] [CrossRef]
  21. Menut, L.; Bessagnet, B.; Briant, R.; Cholakian, A.; Couvidat, F.; Mailler, S.; Pennel, R.; Siour, G.; Tuccella, P.; Turquety, S.; et al. The CHIMERE v2020r1 online chemistry-transport model. Geosci. Model Dev. 2021, 14, 6781–6811. [Google Scholar] [CrossRef]
  22. Jin, X.; Fiore, A.M.; Murray, L.T.; Valin, L.C.; Lamsal, L.N.; Duncan, B.N.; Boersma, F.; De Smedt, I.; Abad, G.G.; Chance, K.; et al. Evaluating a Space-Based Indicator of Surface Ozone-NOx-VOC Sensitivity Over Midlatitude Source Regions and Application to Decadal Trends. J. Geophys. Res. Atmos. 2017, 122, 10439–10461. [Google Scholar] [CrossRef]
  23. Moiseenko, K.B.; Shtabkin, Y.A.; Berezina, E.V.; Skorokhod, A.I. Regional Photochemical Surface-Ozone Sources in Europe and Western Siberia. Izvestiya Atmos. Ocean. Phys. 2018, 54, 545–557. [Google Scholar] [CrossRef]
  24. Wang, W.; Ronald Van Der, R.; Ding, J.; Van Weele, M.; Cheng, T. Spatial and temporal changes of the ozone sensitivity in China based on satellite and ground-based observations. Atmos. Chem. Phys. 2021, 21, 7253–7269. [Google Scholar] [CrossRef]
  25. Emmons, L.K.; Hess, P.G.; Lamarque, J.-F.; Pfister, G.G. Tagged ozone mechanism for MOZART-4, CAM-chem and other chemical transport models. Geosci. Model Dev. 2012, 5, 1531–1542. [Google Scholar] [CrossRef]
  26. Sillman, S. The use of NOy, H2O2, and HNO3 as indicators for ozone-NOx-hydrocarbon sensitivity in urban locations. J. Geophys. Res. 1995, 100, 14175–14188. [Google Scholar] [CrossRef]
  27. Martin, R.V.; Fiore, A.M.; Van Donkelaar, A. Space-based diagnosis of surface ozone sensitivity to anthropogenic emissions. Geophys. Res. Lett. 2004, 31, L06120. [Google Scholar] [CrossRef]
  28. Duncan, B.N.; Yoshida, Y.; Olson, J.R.; Sillman, S.; Martin, R.V.; Lamsal, L.; Hu, Y.; Pickering, K.E.; Retscher, C.; Allen, D.J.; et al. Application of OMI Observations to a Space-Based Indicator of NOx and VOC Controls on Surface Ozone Formation. Atmos. Environ. 2010, 44, 2213–2223. [Google Scholar] [CrossRef]
  29. Schroeder, J.R.; Crawford, J.H.; Fried, A.; Walega, J.; Weinheimer, A.; Wisthaler, A.; Müller, M.; Mikoviny, T.; Chen, G.; Shook, M.; et al. New insights into the column CH2O/NO2 ratio as an indicator of near-surface ozone sensitivity. J. Geophys. Res. Atmos. 2017, 122, 8885–8907. [Google Scholar] [CrossRef]
  30. Souri, A.H.; Nowlan, C.R.; Wolfe, G.M.; Lamsal, L.N.; Chan Miller, C.E.; Abad, G.G.; Janz, S.J.; Fried, A.; Blake, D.R.; Weinheimer, A.J.; et al. Revisiting the effectiveness of HCHO/NO2 ratios for inferring ozone sensitivity to its precursors using high resolution airborne remote sensing observations in a high ozone episode during the KORUS-AQ campaign. Atmos. Environ. 2020, 224, 117341. [Google Scholar] [CrossRef]
  31. Souri, A.H.; Johnson, M.S.; Wolfe, G.M.; Crawford, J.H.; Fried, A.; Wisthaler, A.; Brune, W.H.; Blake, D.R.; Weinheimer, A.J.; Verhoelst, T.; et al. Characterization of errors in satellite-based HCHO/NO2 tropospheric column ratios with respect to chemistry, column-to-PBL translation, spatial representation, and retrieval uncertainties. Atmos. Chem. Phys. 2023, 23, 1963–1986. [Google Scholar] [CrossRef]
  32. Jin, X.; Fiore, A.; Boersma, F.; De Smedt, I.; Valin, L. Inferring Changes in Summertime Surface Ozone-NOx-VOC Chemistry over U.S. Urban Areas from Two Decades of Satellite and Ground-Based Observations. Environ. Sci. Technol. 2020, 54, 6518–6529. [Google Scholar] [CrossRef]
  33. Acdan, J.; Vermeuel, M.; Bertram, T.H.; Pierce, R.B. Observation-Based Analyses of the Sensitivity of Ozone Formation in the Lake Michigan Region to NOx and VOC Emissions. University of Wisconsin-Madison, Space Science and Engineering Center. 2020. Available online: https://www.ladco.org/wp-content/uploads/Projects/Ozone/2020_WI-DNR_OBM_Analysis/Blanchard_Final-Report_Sep2020.pdf (accessed on 4 April 2024).
  34. Müller, M.; Anderson, B.E.; Beyersdorf, A.J.; Crawford, J.H.; Diskin, G.S.; Eichler, P.; Fried, A.; Keutsch, F.N.; Mikoviny, T.; Thornhill, K.L.; et al. In situ measurements and modeling of reactive trace gases in a small biomass burning plume. Atmos. Chem. Phys. 2016, 16, 3813–3824. [Google Scholar] [CrossRef]
  35. Robinson, M.A.; Decker, Z.C.J.; Barsanti, K.C.; Coggon, M.M.; Flocke, F.M.; Franchin, A.; Fredrickson, C.D.; Gilman, J.B.; Gkatzelis, G.I.; Holmes, C.D.; et al. Variability and Time of Day Dependence of Ozone Photochemistry in Western Wildfire Plumes. Environ. Sci. Technol. 2021, 55, 10280–10290. [Google Scholar] [CrossRef] [PubMed]
  36. Wolfe, G.M.; Hanisco, T.F.; Arkinson, H.L.; Blake, D.R.; Wisthaler, A.; Mikoviny, T.; Ryerson, T.B.; Pollack, I.; Peischl, J.; Wennberg, P.O.; et al. Photochemical Evolution of the 2013 California Rim Fire: Synergistic Impacts of Reactive Hydrocarbons and Enhanced Oxidants. Atmos. Chem. Phys. 2022, 22, 4253–4275. [Google Scholar] [CrossRef]
  37. Andreae, M.O. Emission of trace gases and aerosols from biomass burning—An updated assessment. Atmos. Chem. Phys. 2019, 19, 8523–8546. [Google Scholar] [CrossRef]
  38. Jaffe, D.; Chand, D.; Hafner, W.; Westerling, A.; Spracklen, D. Influence of Fires on O3 Concentrations in the Western U.S. Environ. Sci. Technol. 2008, 42, 5885–5891. [Google Scholar] [CrossRef] [PubMed]
  39. Jaffe, D.; Wigder, N.; Downey, N.; Pfister, G.; Boynard, A.; Reid, S.B. Impact of Wildfires on Ozone Exceptional Events in the Western U.S. Environ. Sci. Technol. 2013, 47, 11065–11072. [Google Scholar] [CrossRef] [PubMed]
  40. Miech, J.A.; Stanton, L.; Gao, M.; Micalizzi, P.; Uebelherr, J.; Herckes, P.; Fraser, M.P. Calibration of low-cost NO2 sensors through environmental factor correction. Toxics 2021, 9, 281. [Google Scholar] [CrossRef] [PubMed]
  41. Miech, J.A.; Stanton, L.; Gao, M.; Micalizzi, P.; Uebelherr, J.; Herckes, P.; Fraser, M.P. In situ drift correction for a low-cost NO2 sensor network. Environ. Sci. Atmos. 2023, 3, 894–904. [Google Scholar] [CrossRef]
  42. Clarity. Clarity Node-S Technical Specifications V5. Available online: https://click.clarity.io/hubfs/Marketing%20Assets%20-%20PDFs/Product%20and%20Specification%20Sheets/Node-S%20Specifications%20Sheet.pdf?_ga=2.265223695.1874688595.1714159474-1436656120.1713376847&_gac=1.88362601.1713376850.CjwKCAjw5v2wBhBrEiwAXDDoJTPaOwAqRys1cwkPsu9vlR2-z-BFJl01w68iI0epak4QuB_QRtE7YBoC5gIQAvD_BwE (accessed on 31 January 2024).
  43. Copernicus Sentinel Data Processed by ESA, German Aerospace Center (DLR). 2020. Sentinel-5P TROPOMI Tropospheric Formaldehyde HCHO 1-Orbit L2 5.5 km × 3.5 km, Greenbelt, MD, USA, Goddard Earth Sciences Data and Information Services Center (GES DISC). Available online: https://sentinels.copernicus.eu/web/sentinel/data-products/-/asset_publisher/fp37fc19FN8F/content/sentinel-5-precursor-level-2-formaldehyde (accessed on 15 April 2023).
  44. Copernicus Sentinel Data Processed by ESA, Koninklijk Nederlands Meteorologisch Instituut (KNMI). 2021. Sentinel-5P TROPOMI Tropospheric NO2 1-Orbit L2 5.5 km × 3.5 km, Greenbelt, MD, USA, Goddard Earth Sciences Data and Information Services Center (GES DI). Available online: https://sentinels.copernicus.eu/web/sentinel/data-products/-/asset_publisher/fp37fc19FN8F/content/sentinel-5-precursor-level-2-nitrogen-dioxide (accessed on 15 April 2023).
  45. Ludewig, A.; Kleipool, Q.; Bartstra, R.; Landzaat, R.; Leloux, J.; Loots, E.; Meijering, P.; Van Der Plas, E.; Rozemeijer, N.; Vonk, F.; et al. In-flight calibration results of the TROPOMI payload on board the Sentinel-5 Precursor satellite. Atmos. Meas. Tech. 2020, 13, 3561–3580. [Google Scholar] [CrossRef]
  46. Van Geffen, J.; Boersma, K.F.; Eskes, H.; Sneep, M.; ter Linden, M.; Zara, M.; Veefkind, J.P. S5P TROPOMI NO2 slant column retrieval: Method, stability, uncertainties and comparisons with OMI. Atmos. Meas. Tech. 2020, 13, 1315–1335. [Google Scholar] [CrossRef]
  47. De Smedt, I.; Romahn, F.; Eichmann, K.-U.U. S5P Mission Performance Centre Formaldehyde [L2_HCHO__] Readme. 2023. Available online: https://sentinels.copernicus.eu/documents/247904/3541451/Sentinel-5P-Formaldehyde-Readme.pdf (accessed on 15 April 2023).
  48. Eskes, H.J.; Eichmann, K.-U.U. S5P Mission Performance Centre Nitrogen Dioxide [L2__NO2___] Readme. 2023. Available online: https://sentinel.esa.int/documents/247904/3541451/Sentinel-5P-Nitrogen-Dioxide-Level-2-Product-Readme-File.pdf (accessed on 15 April 2023).
  49. Grell, G.A.; Peckham, S.E.; Schmitz, R.; McKeen, S.A.; Frost, G.; Skamarock, W.C.; Eder, B. Fully coupled “online” chemistry within the WRF model. Atmos. Environ. 2005, 39, 6957–6975. [Google Scholar] [CrossRef]
  50. Emmons, L.K.; Walters, S.; Hess, P.G.; Lamarque, J.-F.; Pfister, G.G.; Fillmore, D.; Granier, C.; Guenther, A.; Kinnison, D.; Laepple, T.; et al. Description and evaluation of the Model for Ozone and Related chemical Tracers, version 4 (MOZART-4). Geosci. Model Dev. 2010, 3, 43–67. [Google Scholar] [CrossRef]
  51. Chin, M.; Ginoux, P.; Kinne, S.; Torres, O.; Holben, B.N.; Duncan, B.N.; Martin, R.V.; Logan, J.A.; Higurashi, A.; Nakajima, T. Tropospheric aerosol optical thickness from the GOCART model and comparisons with satellite and sun photometer measurements. J. Atmos. Sci. 2002, 59, 461–483. [Google Scholar] [CrossRef]
  52. Lamarque, J.-F.; Emmons, L.K.; Hess, P.G.; Kinnison, D.E.; Tilmes, S.; Vitt, F.; Heald, C.L.; Holland, E.A.; Lauritzen, P.H.; Neu, J.; et al. CAM-chem: Description and evaluation of interactive atmospheric chemistry in the Community Earth System Model. Geosci. Model Dev. 2012, 5, 369–411. [Google Scholar] [CrossRef]
  53. Tilmes, S.; Lamarque, J.-F.; Emmons, L.K.; Kinnison, D.E.; Ma, P.-L.; Liu, X.; Ghan, S.; Bardeen, C.; Arnold, S.; Deeter, M.; et al. Description and evaluation of tropospheric chemistry and aerosols in the Community Earth System Model (CESM1.2). Geosci. Model Dev. 2015, 8, 1395–1426. [Google Scholar] [CrossRef]
  54. Guenther, A.; Karl, T.; Harley, P.; Wiedinmyer, C.; Palmer, P.I.; Geron, C. Estimates of global terrestrial isoprene emissions using MEGAN (Model of Emissions of Gases and Aerosols from Nature). Atmos. Chem. Phys. 2006, 6, 3181–3210, Erratum in Atmos. Chem. Phys. 2007, 7, 4327. [Google Scholar] [CrossRef]
  55. Oleson, K.W.; Lawrence, D.M.; Bonan, G.B.; Flanner, M.G.; Kluzek, E.; Lawrence, P.J.; Levis, S.; Swenson, S.C.; Thornton, P.E.; Zeng, X. Technical Description of Version 4.0 of the Community Land Model (CLM) (No. NCAR/TN-478+STR); University Corporation for Atmospheric Research: Boulder, CO, USA, 2010. [Google Scholar] [CrossRef]
  56. Morrison, H.; Thompson, G.; Tatarskii, V. Impact of cloud microphysics on the development of trailing stratiform precipitation in a simulated squall line: Comparison of one- and two-moment schemes. Mon. Weather Rev. 2009, 137, 991–1007. [Google Scholar] [CrossRef]
  57. Iacono, M.J.; Delamere, J.S.; Mlawer, E.J.; Shephard, M.W.; Clough, S.A.; Collins, W.D. Radiative forcing by long-lived greenhouse gases: Calculations with the AER radiative transfer models. J. Geophys. Res. 2008, 113, D13103. [Google Scholar] [CrossRef]
  58. Monin, A.S.; Obukhov, A.M. Basic laws of turbulent mixing in the surface layer of the atmosphere. Contrib. Geophys. Inst. Acad. Sci. USSR 1954, 151, e187. [Google Scholar]
  59. Tewari, M.; Chen, F.; Wang, W.; Dudhia, J.; LeMone, M.A.; Mitchell, K.; Ek, M.; Gayno, G.; Wegiel, J.; Cuenca, R.H. Implementation and verification of the unified noah land surface model in the WRF model. Bull. Am. Meteorol. Soc. 2004, 14, 2165–2170. [Google Scholar]
  60. Hong, S. A new stable boundary-layer mixing scheme and its impact on the simulated East Asian summer monsoon. Q. J. R. Meteorol. Soc. 2010, 136, 1481–1496. [Google Scholar] [CrossRef]
  61. Grell, G.A.; Freitas, S.R. A scale and aerosol aware stochastic convective parameterization for weather and air quality modeling. Atmos. Chem. Phys. 2014, 14, 5233–5250. [Google Scholar] [CrossRef]
  62. Seinfeld, J.H.; Pandis, S.N. Atmospheric Chemistry and Physics: From Air Pollution to Climate Change, 2nd ed.; Wiley: Hoboken, NJ, USA, 2006. [Google Scholar]
  63. Guo, Y.; Roychoudhury, C.; Mirrezaei, M.A.; Kumar, R.; Sorooshian, A.; Arellano, A.F. Investigating Ground-Level Ozone Pollution in Semi-Arid and Arid Regions of Arizona Using WRF-Chem v4. 4 Modeling. Geosci. Model Dev. Discuss. 2024; preprint. [Google Scholar] [CrossRef]
  64. Finlayson-Pitts, B.J.; Pitts, J.N. Chemistry of the Upper and Lower Atmosphere: Theory, Experiments and Application, 1st ed.; Academic Press: Cambridge, MA, USA, 2000. [Google Scholar]
  65. McKenzie, R.; Johnston, P.; Hofzumahaus, A.; Kraus, A.; Madronich, S.; Cantrell, C.; Calvert, J.; Shetter, R. Relationship between photolysis frequencies derived from spectroscopic measurements of actinic fluxes and irradiances during the IPMMI campaign. J. Geophys. Res. Atmos. 2002, 107, ACH-1. [Google Scholar] [CrossRef]
  66. Parrish, D.D.; Murphy, P.C.; Albritton, D.L.; Fehsenfeld, F.C. The measurement of the photodissociation rate of NO2 in the atmosphere. Atmos. Environ. (1967) 1983, 17, 1365. [Google Scholar] [CrossRef]
  67. Barnard, J.C.; Chapman, E.G.; Fast, J.D.; Schmelzer, J.R.; Slusser, J.R.; Shetter, R.E. An evaluation of the FAST-J photolysis algorithm for predicting nitrogen dioxide photolysis rates under clear and cloudy sky conditions. Atmos. Environ. 2004, 38, 3393. [Google Scholar] [CrossRef]
Figure 1. Map of LCS deployment sites (squares), LCS collocation sites (circles), VOC canister sites (blue) and PAMS site (red triangle). Daily wind barbs shown for select sites.
Atmosphere 15 00555 g001
Figure 2. Box and whisker plots for the average hourly NO2 (A) and FEM O3 (B) for the 13 sites for day (07:00–19:00) and night (20:00–06:00). The lines within the boxes represent the medians, the interquartile range is the range of the boxes with the top representing the 75th and the bottom the 25th percentile. The whiskers represent the maximum and minimum values in the data. The Buckeye, Central Phoenix, and West Phoenix NO2 values were taken from the FRM instruments, Phoenix JLG from the FEM instrument, while the other sites use the ASU-calibrated data.
Atmosphere 15 00555 g002aAtmosphere 15 00555 g002b
Figure 3. Average log NO2/O3 values for the NO2 elevated sites (A), equivalent NO2 and O3 sites (B), and O3 elevated sites (C) for each hour for the 13 sites.
Atmosphere 15 00555 g003aAtmosphere 15 00555 g003b
Figure 4. Normalized histograms of Central Phoenix NO2 × rate (A) and O3 (B) values for non-smoke and smoke days.
Atmosphere 15 00555 g004
Figure 5. Maximum ozone concentrations versus 24-h HCHO/12:00 NO2 for Buckeye (A), Mesa (B), North Phoenix (C), and Pinnacle Peak (D) for 26 days in summer 2021. Vertical lines represent regime transitions.
Atmosphere 15 00555 g005
Figure 6. Average ozone concentrations versus 8-h HCHO/average NO2 for Phoenix JLG for 4 a.m. (04:00–11:00), 12 p.m. (12:00–19:00), and 8 p.m. (20:00–03:00). Non-smoke days are solid circles, while smoke days are rings. Vertical lines represent regime transitions.
Atmosphere 15 00555 g006
Figure 7. Normalized histogram of HCHO/NO2 values for non-smoke and smoke days at Phoenix JLG.
Atmosphere 15 00555 g007
Figure 8. 24-h HCHO measurements for the five sites, with the red line highlighting the 15 June smoke day.
Atmosphere 15 00555 g008
Figure 9. Early-afternoon (12–3 pm) satellite HCHO/NO2 column ratios versus average surface ozone (12–3 pm) for Phoenix JLG (July–August 2021). Vertical lines represent regime transitions.
Atmosphere 15 00555 g009
Figure 10. Averaged HCHO (a,d) and NO2 (b,e) satellite column densities, HCHO/NO2 ratio (c,f) over the Phoenix metro area for all available dates (ac) and 15 June (df). The location of three sites (Buckeye: green circle, Pinnacle Peak: magenta square, Phoenix/JLG: blue triangle) are superimposed.
Atmosphere 15 00555 g010
Figure 11. WRF-CHEM simulated surface O3 versus surface HCHO/NO2 for the Phoenix JLG (A), Buckeye (B), and Pinnacle Peak (C) sites in four-hour time blocks. Vertical lines represent regime transitions.
Atmosphere 15 00555 g011
Figure 12. Phoenix JLG sampled HCHO/NO2 ratios with satellite HCHO/NO2 column ratios and WRF-CHEM modeled surface HCHO/NO2 ratios. Orange and green lines represent ozone sensitivity thresholds for surface ratio (left axis) and satellite columnar ratio (right axis), respectively. Orange and green shadings represent the transition regimes for surface and column ratios.
Atmosphere 15 00555 g012
Disclaimer/Publisher’s Note: The statements, opinions and data contained in all publications are solely those of the individual author(s) and contributor(s) and not of MDPI and/or the editor(s). MDPI and/or the editor(s) disclaim responsibility for any injury to people or property resulting from any ideas, methods, instructions or products referred to in the content.