Rainfall Potential and Consequences on Structural Soil Degradation of the Most Important Agricultural Region of Mexico
Abstract
:1. Introduction
2. Materials and Methods
2.1. Study Area
2.2. Historical Significance and Challenges
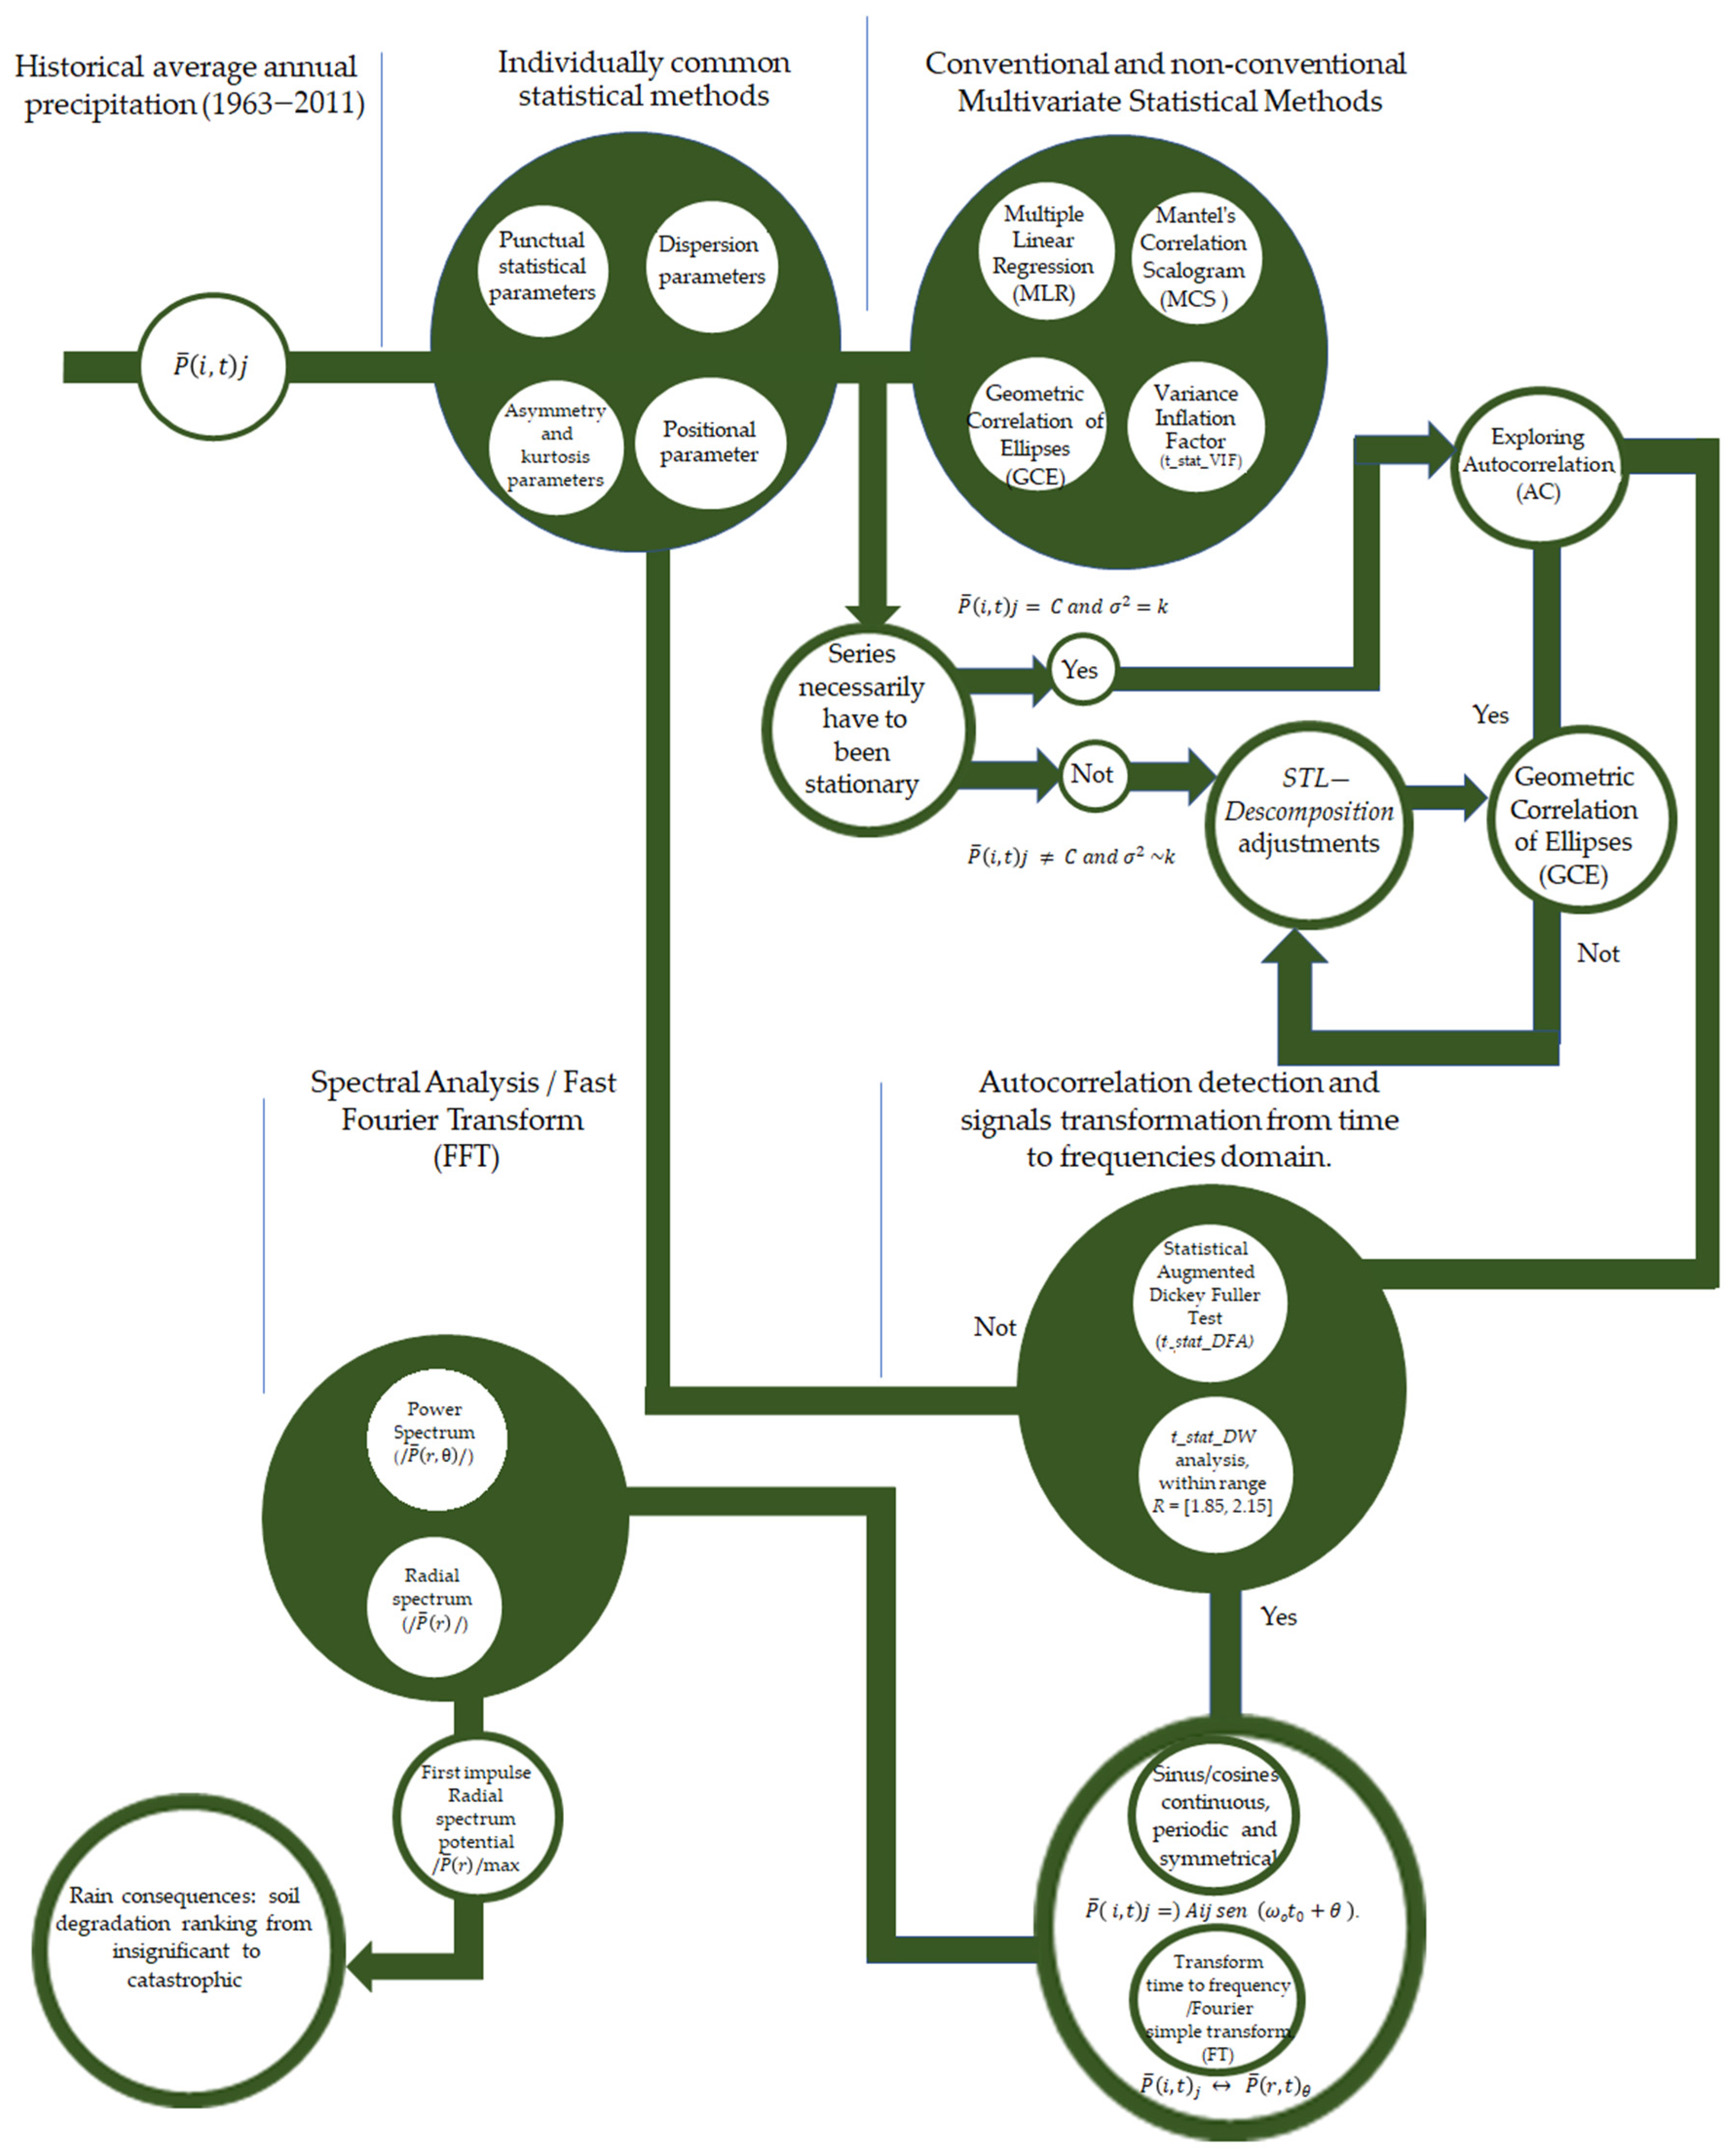
2.3. Analysis of Rainfall-Induced Soil Degradation and Stationarity Condition
2.4. Assessment of Dataset Continuity
2.5. Correlation Modelling and Randomness in the Dataset
2.6. Individual Statistical Diagnoses: Conventional and Non-Conventional Multivariate Methods for AC Detection
2.7. MLR Analysis
2.8. Mantel’s Correlation Scalogram (MCS) Analysis
2.9. Geometric Correlation of Ellipses (GCE) Analysis
2.10. Variance Inflation Factor (t_stat_VIF) Analysis
2.11. Elimination of AC and Seasonality Assessment: Augmented Dickey–Fuller Test (t_stat_DFA) Analysis and Durbin–Watson Test (t_stat_DW)
2.12. Outlier Correction and Wave Representation for Spectral Analysis
2.13. Interpolation and Consequence Severity Scale
2.14. Data Compilation and Software Utilization
3. Results
4. Discussion
5. Conclusions
Author Contributions
Funding
Institutional Review Board Statement
Informed Consent Statement
Data Availability Statement
Acknowledgments
Conflicts of Interest
References
- Godfray, H.C.J.; Beddington, J.R.; Crute, I.R.; Haddad, L.; Lawrence, L.; Muir, J.F.; Pretty, J.; Robinson, S.; Thomas, S.M.; Toulmin, C. Food security: The challenge of feeding 9 billion people. Science 2010, 32, 812–818. [Google Scholar] [CrossRef] [PubMed]
- Pérez, V.A.; Leyva Trinidad, D.A.; Gómez, M.F. Challenges and proposals to achieve food security by the year 2050. Mex. J. Agric. Sci. 2018, 9, 175–189. [Google Scholar]
- Cruz, C.; Balboltin, C.; Paz, F.; Etchevers, F.V.; Krasilnikov, P. Morphogenetic Variability of Soils in Mexico and its relationship with the National Physiographic Model. In Proceedings of the XVII Latin American Congress of Soil Science, Leon Guanajuato, Mexico, 17–21 September 2007; Available online: http://www.madrimasd.org/blogs/universo/2007/06/22/68351 (accessed on 25 September 2023).
- WGR. WORKING Group IUSS. World reference base for soil resources 2014. Update 2015. International soil classification system for soil nomenclature and the creation of soil map legends. In Reports on World Soil Resources 106; FAO: Rome, Italy, 2016; Available online: https://www.fao.org/publications/card/es/c/942e424c-85a9-411d-a739-22d5f8b6cc41/ (accessed on 25 September 2023).
- Semarnat e INEGI. Iniciativa Latinoamericana y Caribeña para el Desarrollo Sostenible. Indicadores de Seguimiento en México 2012. CDMX. 2014. Available online: https://biblioteca.semarnat.gob.mx/janium/Documentos/Ciga/Libros2011/CD001652.pdf (accessed on 13 January 2023).
- Valle, G.A.C. Maguey (Agave salmiana) y Nopal (Opuntia robusta) en el Parque Ecológico Cubitos. Doctoral Dissertation, Universidad Nacional Autónoma de México, Mexico City, Mexico, 2021. Available online: https://ru.dgb.unam.mx/bitstream/20.500.14330/TES01000814847/3/0814847.pdf (accessed on 13 October 2023).
- INEGI. Guía Para la Interpretación de Cartografía de Erosión del Suelo Escala 1:250 000; Serie I; Instituto Nacional de Estadística y Geografía: Aguascalientes, Mexico, 2014; Available online: https://www.inegi.org.mx/contenidos/productos/prod_serv/contenidos/espanol/bvinegi/productos/nueva_estruc/702825231606.pdf (accessed on 15 December 2022).
- Laborde, D.; Mamun, A.; Martin, W.; Piñeiro, V.; Vos, R. Agricultural subsidies and global greenhouse gas emissions. Nat. Commun. 2021, 12, 2601. [Google Scholar] [CrossRef]
- Menegat, S.; Ledo, A.; Tirado, R. Greenhouse gas emissions from global production and use of nitrogen synthetic fertilisers in agriculture. Sci. Rep. 2022, 12, 14490. [Google Scholar] [CrossRef] [PubMed]
- Corvalan, C.; Hales, S.; McMichael, A.J. Ecosystems and Human Well-Being: Health Synthesis; World Health Organization: Geneva, Switzerland, 2005; 56p, ISBN 92415663095. Available online: https://books.google.com.mx/books?hl=es&lr=&id=vKIXu2Z–9QsC&oi=fnd&pg=PP8&dq=10.%09Corvalan,+C.%3B+Hales,+S.%3B+McMichael,+A.J.+Ecosystems+and+Human+Well-Being:+Health+Synthesis%3B+World+Health+Organization:&ots=uAyIGwT9lc&sig=CcdxHC5aOJDQl7DXcRNFiGaaShs#v=onepage&q&f=false (accessed on 21 March 2023).
- Healy, R.G.; Rosenberg, J.S. Land Use and the States, 2nd ed.; Imprint RFF Press Routledge: New York, NY, USA, 2013; 284p. [Google Scholar] [CrossRef]
- Thomaier, S.; Specht, K.; Henckel, D.; Dierich, A.; Siebert, R.; Freisinger, U.B.; Sawicka, M. Farming in and on Urban Buildings: Present Practice and Specific Novelties of Zero-Acreage Farming (ZFarming). Renew. Agric. Food Syst. 2015, 30, 43–54. [Google Scholar] [CrossRef]
- Despommier, D. The Vertical Farm: Feeding the World in the 21st Century; Thomas Dunne Books: New York, NY, USA, 2010; 305p, ISBN 9780312611392/03126113902010. Available online: https://search.worldcat.org/es/title/653476308 (accessed on 25 March 2023).
- Shakoor, A.; Dar, A.A.; Arif, M.S.; Farooq, T.H.; Yasmeen, T.; Shahzad, S.M.; Ashraf, M. Do soil conservation practices exceed their relevance as a countermeasure to greenhouse gases emissions and increase crop productivity in agriculture? Sci. Total Environ. 2022, 805, 150337. [Google Scholar] [CrossRef] [PubMed]
- Chataut, G.; Bhatta, B.; Joshi, D.; Subedi, K.; Kafle, K. Greenhouse gases emission from agricultural soil: A review. J. Agric. Food Res. 2023, 11, 100533. [Google Scholar] [CrossRef]
- Rosales-Martínez, F.; Casanova-Pérez, L.; Flota-Bañuelos, C.; Fraire-Cordero, S.; Rosales-Martínez, V. Irrigated Agriculture as an Adaptation Strategy Against Climate Change: A Review. J. Agric. Sci. 2023, 15, 6. [Google Scholar] [CrossRef]
- Tanentzap, A.J.; Lamb, A.; Walker, S.T.; Farme, A. Resolving Conflicts between Agriculture and the Natural Environment. PLOS Biol. 2015, 13, e1002242. [Google Scholar] [CrossRef] [PubMed]
- NGS. Environmental Impacts of Agricultural Modifications. 2022. Available online: https://education.nationalgeographic.org/resource/environmental-impacts-agricultural-modifications/7th-grade/ (accessed on 6 February 2023).
- Alvarado, A.A. Cotton in Northern Mexico (1920–1970): Regional Impacts of a Strategic Crop; The College of the Northern Border: Tijuana, Mexico, 2013; 358p, Available online: https://colef.repositorioinstitucional.mx/jspui/bitstream/1014/601/2/Algod%C3%B3n%20en%20el%20norte-%C3%BAltimo.pdf (accessed on 22 May 2022).
- Maleksaeidi, H.; Keshavarz, M.; Karami, E.; Eslamian, S. Climate change and drought: Building resilience for an unpredictable future. In Handbook of Drought and Water Scarcity; CRC Press: Boca Raton, FL, USA, 2017; Volume 1, pp. 63–186. [Google Scholar] [CrossRef]
- Gómez, D.G. Análisis Espectral: Consideraciones teóricas y aplicabilidad. Econ. Soc. 2001, 6, 45–60. [Google Scholar]
- Pacheco, P.R.; Ordoñez, G. Construcción de un indicador adelantado a partir del Método Espectral. In El Caso de la Inflación en Costa Rica 1978–1993; Serie Comentarios Sobre Asuntos Económico; Banco Central de Costa Rica: San José, Costa Rica, 1995. [Google Scholar]
- Carrillo, G.C. Fundamentals of Fourier Analysis; Departamento de Enxeñería Eléctrica, Escola Técnica Superior de Enxeñeiros Industriáis, University of Vigo: Vigo, España, 2003; 160p, Available online: http://grupo_ene.webs.uvigo.es/wordpress/publicaciones/Apuntes_Fourier.pdf (accessed on 15 April 2022).
- Stein, M.L. Interpolation of Spatial Data: Some Theory for Kriging; Springer: New York, NY, USA, 1999; 247p, Available online: https://www.researchgate.net/publication/ (accessed on 12 July 2023).
- Karagiannis, T.; Molle, M.; Faloutsos, M. Long-range dependence ten years of Internet traffic aforé donde dice so A modeling. IEEE Internet Comput. 2004, 8, 57–64. [Google Scholar] [CrossRef]
- Kermarrec, G.; Lösler, M.; Guerrier, S.; Schön, S. The variance inflation factor to account for correlations in likelihood ratio tests: Deformation analysis with terrestrial laser scanners. J. Geod. 2022, 96, 18. [Google Scholar] [CrossRef]
- Tunissen, P.; Amiri-Simkooei, A. Least-squares variance component estimation. J. Geod. 2008, 82, 65–82. [Google Scholar] [CrossRef]
- Koch, K.R. Beispiele zur Parameterschätzung, zur Festlegung von Konfidenzregionen und zur Hypothesenprüfung; Nr. 87; Mitteilungen aus den Geodätischen Instituten der Rheinischen Friedrich-Wilhelms-Universität: Bonn, Germany, 2000; 382p, Available online: https://docplayer.org/64375859-Parameterschaetzung-und-hypothesentests-in-linearen-modellen.html (accessed on 10 September 2023).
- Jäger, R.; Müller, T.; Saler, H.; Schwäble, R. Klassische und Robuste Ausgleichungsverfahren—Ein Leitfaden für Ausbildung und Praxis von Geodäten und Geoinformatikern; Wichmann: Heidelberg, Germany, 2005; 11p, Available online: https://link.springer.com/chapter/10.1007/978-3-540-38596-7_37 (accessed on 26 November 2023).
- Niebles, V.A. Estimación de los datos Estadísticos Sobre la Población Flotante como Lineamientos para el Ordenamiento Territorial. Doctoral Thesis, Facultad de Ingeniería y Ciencias Básicas Fundación Universidad los Libertadores, Bogotá, Colombia, 2018. [Google Scholar]
- Thompson, M.B. A Comparison of Methods for Computing AC Time; Technical Report No. 1007; University of Toronto: Toronto, ON, Canada, 2010; 8p. [Google Scholar] [CrossRef]
- Wang, G. The 95% confidence interval for GNSS-derived site velocities. J. Surv. Eng. 2022, 148, 04021030. [Google Scholar] [CrossRef]
- Dickinson, R.E. Climate sensitivity. Adv. Geophys. 1985, 28, 99–129. [Google Scholar] [CrossRef]
- Kamenkovich, I.; Cheng, W.; Schmid, C.; Harrison, D.E. Effects of eddies on an ocean observing system with profiling floats: Idealized simulations of the Argo array. J. Geophys. Res. 2011, 116, C06003. [Google Scholar] [CrossRef]
- Vallejos, R.; Acosta, J. The effective sample size for multivariate spatial processes with an application to soil contamination. Nat. Resour. Model. 2021, 34, 24. [Google Scholar] [CrossRef]
- Neitzel, F. Generalization of total least-squares on example of unweighted and weighted 2d similarity transformation. J. Geod. 2010, 84, 751–762. [Google Scholar] [CrossRef]
- Zuehlke, T.; Kassekert, A. Algorithmic Errors in the Estimation of Tobit II Models and the Corresponding Failure to Recognize Selection Bias; Department of Economics, Florida State University: Tallahassee, FL, USA, 2008; 27p, Available online: http://www.asasrms.org/Proceedings/y2008/Files/302576.pdf (accessed on 15 April 2023).
- Neumann, I.; Kutterer, H. Congruence tests and outlier detection in deformation analysis with respect to observation imprecision. J. Appl. Geod. 2007, 1, 1–7. [Google Scholar] [CrossRef]
- Bach, F.; Jordan, M. Learning Graphical Models for Stationary Time Series. IEEE Trans. Signal Process. 2004, 52, 2189–2199. [Google Scholar] [CrossRef]
- Emery, X. Conditioning simulations of Gaussian random fields by ordinary kriging. Math. Geol. 2007, 39, 607–623. [Google Scholar] [CrossRef]
- Goovaerts, P. Geostatistics for Natural Resources Evaluation; Oxford University Press: New York, NY, USA, 1997. [Google Scholar] [CrossRef]
- Mirás-Avalos, J.M.; Paz-González, A.; Vidal-Vázquez, E.; Sande-Fouz, P. Mapping monthly rainfall data in Galicia (NW Spain) using inverse distances and geostatistical methods. Adv. Geosci. 2007, 10, 51–57. [Google Scholar] [CrossRef]
- Rogelis, M.C.; Werner, M.G.F. Spatial interpolation for real-time rainfall field estimation in areas with complex topography. J. Hydrometeorol. 2013, 14, 85–104. [Google Scholar] [CrossRef]
- Sánchez, M.; Gallego, D.; Lamela, H. Overdrive Short Pulse High Peak Power Diode Lasers without Catastrophic Optical Damage. IEEE Photonics J. 2021, 13, 1500507. [Google Scholar] [CrossRef]
- López, J.V. Propuesta Metodológica para el Rediseño de una Red Meteorológica en un Sector de la Región Andina Colombiana. Publicaciones Investig. 2014, 8, 55–76. [Google Scholar] [CrossRef]
- Chen, J. Environmental Economics: Definition, Importance, and Example. Investopedia. 2022. Available online: https://www.investopedia.com/terms/e/environmental-economics.asp (accessed on 1 January 2024).
- Word Meteorological Organization (WMO). State of the Global Climate 2023; World Meteorological Organization: Geneva, Switzerland, 2024; 76p, Available online: https://storymaps.arcgis.com/stories/2545ecd62e594005bb196b0ba962d7cb/print (accessed on 23 May 2022).
- Cuervo-Robayo, A.P.; Ureta, C.; Gómez-Albores, M.A.; Meneses-Mosquera, A.K.; Téllez-Valdés, O.; Martínez-Meyer, E. One hundred years of climate change in Mexico. PLoS ONE 2020, 15, e0209808. [Google Scholar] [CrossRef]
- Gheysari, M.; Sadegh, S.H.; Loescher, H.W.; Amiri, S.; Zareian, M.J.; Majidi, M.M.; Asgarinia, P.; Payero, J.O. Comparison of deficit irrigation management strategies on root, plant growth and biomass productivity of silage maize. Agric. Water Manag. 2017, 182, 126–138. [Google Scholar] [CrossRef]
- Trout, T.J.; DeJonge, K.C. Water productivity of maize in the US high plains. Irrig. Sci. 2017, 35, 251–266. [Google Scholar] [CrossRef]
- Ioris, A.A.R.; Irigaray, C.T.; Girard, P. Institutional responses to climate change: Opportunities and barriers for adaptation in the Pantanal and the Upper Paraguay River Basin. Clim. Change 2014, 127, 139–151. [Google Scholar] [CrossRef]
- Zhou, B.; Lu, N. Correlation between Atterberg limits and soil adsorptive water. J. Geotech. Geoenviron. Eng. 2021, 147, 04020162. [Google Scholar] [CrossRef]
- Santini, N.S.; Cuervo-Robayo, A.P.; Adame, M.F. Agricultural Land Degradation in Mexico. In Impact of Agriculture on Soil Degradation I. The Handbook of Environmental Chemistry; Pereira, P., Muñoz-Rojas, M., Bogunovic, I., Zhao, W., Eds.; Springer: Cham, Switzerland, 2022; Volume 120. [Google Scholar] [CrossRef]
- Caloiero, T.; Pellicone, G.; Modica, G.; Guagliardi, I. Comparative Analysis of Different Spatial Interpolation Methods Applied to Monthly Rainfall as Support for Landscape Management. Appl. Sci. 2021, 11, 9566. [Google Scholar] [CrossRef]
- Moreno, A.B. Soil conservation and sustainable development, utopia or possibility in Mexico? Terra Latinoam. 1998, 16, 173–179. [Google Scholar]

| Higuera Zaragoza | Ahome | Los Mochis | Mochicahui | Bocatoma | Las Estacas | Presa Josefa Ortiz | El Fuerte | Presa Miguel Hgo. | Yecorato | Choix | Huites | Ocoroni | El Carrizo | Topolobampo | Ruiz Cortínez | |
|---|---|---|---|---|---|---|---|---|---|---|---|---|---|---|---|---|
| 87.10 | 68.20 | 10.00 | 26.60 | 180.00 | 152.00 | 209.60 | 338.20 | 276.80 | 506.90 | 27.40 | 418.50 | 264.50 | 127.30 | 69.50 | 164.00 | |
| 905.80 | 1228.40 | 683.70 | 551.50 | 737.10 | 724.20 | 895.20 | 1122.00 | 993.20 | 1042.50 | 1417.60 | 1357.40 | 821.00 | 729.50 | 953.00 | 797.90 | |
| 311.69 | 398.66 | 329.27 | 261.00 | 446.91 | 434.79 | 507.84 | 593.56 | 613.00 | 811.22 | 737.29 | 809.46 | 562.10 | 371.42 | 347.89 | 408.45 | |
| 282.30 | 365.00 | 328.80 | 264.18 | 421.60 | 431.99 | 500.76 | 581.50 | 580.10 | 816.10 | 733.70 | 805.43 | 556.57 | 383.10 | 341.12 | 375.60 | |
| Rabs | 905.80 | 1228.40 | 683.70 | 551.50 | 737.10 | 724.20 | 895.20 | 1122.00 | 993.20 | 1042.50 | 1417.60 | 1357.40 | 821.00 | 729.50 | 953.00 | 797.90 |
| σ | 138.83 | 205.44 | 144.59 | 112.78 | 147.77 | 109.99 | 127.54 | 153.47 | 153.21 | 134.84 | 228.42 | 213.40 | 109.37 | 120.08 | 159.95 | 147.22 |
| σ2 | 19,273.46 | 42,205.03 | 20,906.51 | 12,719.91 | 21,835.74 | 12,097.66 | 16,265.98 | 23,553.16 | 23,472.22 | 18,181.87 | 52,174.74 | 45,537.87 | 11,962.57 | 14,418.70 | 25,585.30 | 21,673.28 |
| CV | 818.70 | 1296.60 | 683.70 | 578.10 | 917.10 | 876.20 | 1104.80 | 1460.20 | 1270.00 | 1549.40 | 1445.00 | 1775.90 | 1085.50 | 856.80 | 1022.50 | 961.90 |
| R | 0.09 | 1.00 | 0.04 | 0.04 | 0.03 | 0.001 | 0.01 | 0.01 | 0.01 | 0.002 | 0.01 | 0.0002 | 0.00 | 0.11 | 0.03 | 0.05 |
| R2 | 0.45 | 0.52 | 0.44 | 0.43 | 0.33 | 0.25 | 0.25 | 0.26 | 0.25 | 0.17 | 0.31 | 0.26 | 0.19 | 0.32 | 0.46 | 0.36 |
| 1.63 | 1.61 | 0.34 | 0.06 | 0.23 | 0.24 | 0.65 | 1.16 | 0.34 | −0.12 | 0.10 | 0.43 | −0.16 | 0.34 | 0.96 | 0.85 | |
| 5.53 | 4.81 | −0.24 | 0.51 | −0.90 | 0.23 | 1.60 | 2.29 | −0.26 | −0.68 | 1.90 | 0.29 | 1.10 | 0.41 | 2.83 | 0.38 | |
| Q25th | 227.50 | 248.30 | 198.00 | 193.90 | 332.00 | 344.70 | 413.30 | 493.90 | 493.80 | 714.80 | 590.50 | 633.50 | 502.60 | 255.80 | 223.60 | 304.40 |
| Q75th | 367.80 | 496.27 | 430.20 | 314.30 | 576.80 | 531.90 | 568.80 | 669.20 | 746.00 | 908.70 | 894.10 | 945.00 | 619.81 | 443.87 | 438.40 | 469.10 |
| Multiple Linear Regression (RLM)/Dependent Variable: AHOME Method: Least Squares | ||||
|---|---|---|---|---|
| Sample: 1961–2011 | Included Observations: 51 | |||
| Variable | Coefficient | Std. Error | t-Statistic | Prob. |
| C | 281.08 | 283.59 | 0.99 | 0.33 |
| Ahome | 0.13 | 0.39 | 0.34 | 0.74 |
| Bocatoma | 0.13 | 0.24 | 0.53 | 0.60 |
| Choix | 0.46 | 0.38 | 1.23 | 0.23 |
| El Carrizo | −0.09 | 0.44 | −0.20 | 0.84 |
| El Fuerte | 0.35 | 0.41 | 0.85 | 0.40 |
| Higuera Zaragoza | −0.13 | 0.24 | −0.56 | 0.58 |
| Huites | −0.18 | 0.46 | −0.38 | 0.71 |
| Las Estacas | −0.30 | 0.49 | −0.62 | 0.54 |
| Los Mochis | 0.33 | 0.38 | 0.86 | 0.40 |
| Mochicahui | −0.01 | 0.30 | −0.04 | 0.97 |
| Presa Josefa Ortiz | 0.12 | 0.47 | 0.26 | 0.79 |
| Presa Miguel Hidalgo | −0.35 | 0.42 | −0.84 | 0.41 |
| Ruiz Cortínez | 0.23 | 0.36 | 0.65 | 0.52 |
| Topolobampo | 0.17 | 0.30 | 0.59 | 0.56 |
| Yecorato | −0.08 | 0.30 | −0.26 | 0.80 |
| R-squared | 0.21 | Mean dependent var. | 398.65 | |
| Adjusted R-squared | −0.12 | S.D. dependent var. | 205.43 | |
| S.E. of regression | 217.73 | Akaike info criterion | 13.85 | |
| Sum squared resid. | 1,659,201 | Schwarz criterion | 14.46 | |
| Log likelihood | −337.31 | Hannan–Quinn criteria | 14.08 | |
| F-statistic | 0.63 | Durbin–Watson stat (t_stat_DW) | 1.71 | |
| Prob (F-statistic) | 0.85 | |||
| Multiple Linear Regression (RLM)/Dependent Variable: AHOME Method: Least Squares | ||||
|---|---|---|---|---|
| Sample: 1961–2011 | Included Observations: 51 | |||
| Variable | Coefficient | Std. Error | t-Statistic | Prob. |
| C | 428.81 | 144.62 | 2.97 | 0.01 |
| Ahome | 0.00 | 0.10 | 0.00 | 1.00 |
| Bocatoma | −0.02 | 0.22 | −0.07 | 0.95 |
| Choix | −0.01 | 0.14 | −0.05 | 0.96 |
| El Carrizo | −0.14 | 0.21 | −0.66 | 0.52 |
| El Fuerte | −0.09 | 0.24 | −0.36 | 0.72 |
| Higuera Zaragoza | −0.14 | 0.24 | −0.58 | 0.57 |
| Huites | −0.08 | 0.13 | −0.61 | 0.54 |
| Las Estacas | 0.00 | 0.26 | 0.01 | 0.99 |
| Los Mochis | −0.12 | 0.29 | −0.40 | 0.69 |
| Mochicahui | 0.19 | 0.22 | 0.83 | 0.41 |
| Presa Josefa Ortiz | 0.08 | 0.26 | 0.31 | 0.76 |
| Presa Miguel Hidalgo | 0.09 | 0.24 | 0.37 | 0.72 |
| Ruiz Cortínez | 0.21 | 0.21 | 1.00 | 0.32 |
| Topolobampo | 0.00 | 0.17 | −0.02 | 0.98 |
| Yecorato | 0.20 | 0.16 | 1.23 | 0.23 |
| R-squared | 0.12 | Mean dependent var. | 562.10 | |
| Adjusted R-squared | −0.26 | S.D. dependent var. | 109.37 | |
| S.E. of regression | 122.67 | Akaike info criterion | 12.70 | |
| Sum squared resid. | 526,68 | Schwarz criterion | 13.31 | |
| Log likelihood | −308.05 | Hannan–Quinn criteria | 12.93 | |
| F-statistic | 0.32 | Durbin–Watson stat (t_stat_DW) | 1.89 | |
| Prob (F-statistic) | 0.99 | |||
| Variance Inflation Factors (t_stat_VIF) 1961–2011 Included Observations: 51 | |||
|---|---|---|---|
| j | Coefficient Variance | Uncentered VIF | Centered VIF |
| C | 20,915.97 | 70.89 | NA * |
| Ahome | 0.01 | 6.29 | 1.30 |
| Bocatoma | 0.05 | 37.89 | 3.67 |
| Choix | 0.02 | 37.15 | 3.10 |
| El Carrizo | 0.04 | 22.86 | 2.12 |
| El Fuerte | 0.06 | 73.86 | 4.46 |
| Higuera Zaragoza | 0.06 | 22.12 | 3.41 |
| Huites | 0.02 | 41.50 | 2.59 |
| Las Estacas | 0.07 | 46.83 | 2.76 |
| Los Mochis | 0.08 | 36.26 | 5.72 |
| Mochicahui | 0.05 | 13.56 | 2.09 |
| Presa Josefa Ortiz | 0.07 | 61.76 | 3.60 |
| Presa Miguel Hidalgo | 0.06 | 79.19 | 4.57 |
| Ruiz Cortínez | 0.05 | 28.99 | 3.28 |
| Topolobampo | 0.03 | 14.63 | 2.49 |
| Yecorato | 0.03 | 61.16 | 1.61 |
| Augmented Dickey–Fuller Test Statistic | ||||
|---|---|---|---|---|
| Test on Null Hypothesis: Variable Has a Unit Root | ||||
| Exogenous: Constant, Linear Trend | ||||
| Lag Length: 0 (Automatic—Based on SIC, maxlag = 10) | ||||
| Sample: 1961–2011 | Included Observations: 51 | |||
| 5% Test Critical Value = −3.5 | ||||
| Number | Variable | t_stat_DW * | t_stat_DFA ** | p (Value) *** |
| 1 | Ahome | 2.02 | −6.25 | 0.01 |
| 2 | Bocatoma | 1.99 | −7 | 0.01 |
| 3 | Choix | 1.95 | −6.06 | 0.01 |
| 4 | El Carrizo | 1.97 | −6.27 | 0.01 |
| 5 | El Fuerte | 2 | 5.82 | 0.01 |
| 6 | Higuera Zaragoza | 1.96 | −7.005 | 0.04 |
| 7 | Huites | 1.96 | −7.07 | 0.00 |
| 8 | Las Estacas | 2.12 | −5.02 | 0.00 |
| 9 | Los Mochis | 1.98 | −5.93 | 0.00 |
| 10 | Mochicahui | 2.03 | −4.4 | 0.00 |
| 11 | Ocoroni | 1.83 | −6.02 | 0.00 |
| 12 | Presa Josefa Ortiz | 2.12 | −4.94 | 0.00 |
| 13 | Presa Miguel Hidalgo | 1.97 | −6.99 | 0.00 |
| 14 | Ruiz Cortínez | 1.95 | −5.51 | 0.00 |
| 15 | Topolobampo | 2.01 | −6.84 | 0.00 |
| 16 | Yecorato | 1.92 | −6.29 | 0.02 |
| Augmented Dickey–Fuller Unit Root Test on PRECIP | ||||
| Null Hypothesis: PRECIP Has a Unit Root Exogenous: Constant, Linear Trend | ||||
| Lag Length: 0 (Automatic—Based on SIC, maxlag = 10) | ||||
| t-Statistic | p (value) | |||
| Augmented Dickey—Fuller Test Statistic | −5.69 | 0.01 | ||
| Test critical values: | 1% level | −4.15 | ||
| 5% level | −3.50 | |||
| 10% level | −3.18 | |||
| Dependent Variable: D(PRECIP) | ||||
| Method: Least Squares | ||||
| Sample (adjusted): 1962–2011 | ||||
| Included observations: 50 after adjustments | ||||
| Variable | Coefficient | Std. Error | t-Statistic | Prob. |
| PRECIP(-1) | −0.81 | 0.14 | −5.69 | 0 |
| C | 390.14 | 73.16 | 5.33 | 0 |
| @TREND(“1961”) | −0.02 | 0.88 | −0.02 | 0.98 |
| R-squared | 0.40 | Mean dependent var. | −0.10 | |
| Adjusted R-squared | 0.38 | S.D. dependent var. | 115.25 | |
| S.E. of regression | 90.52 | Akaike info criterion | 11.90 | |
| Sum squared resid | 38,517 | Schwarz criterion | 12.02 | |
| Log likelihood | −294.68 | Hannan–Quinn criteria | 11.95 | |
| F-statistic | 16.21 | Durbin–Watson stat | 1.99 | |
| Prob(F-statistic) | 0 | |||
Disclaimer/Publisher’s Note: The statements, opinions and data contained in all publications are solely those of the individual author(s) and contributor(s) and not of MDPI and/or the editor(s). MDPI and/or the editor(s) disclaim responsibility for any injury to people or property resulting from any ideas, methods, instructions or products referred to in the content. |
© 2024 by the authors. Licensee MDPI, Basel, Switzerland. This article is an open access article distributed under the terms and conditions of the Creative Commons Attribution (CC BY) license (https://creativecommons.org/licenses/by/4.0/).
Share and Cite
Norzagaray Campos, M.; Muñoz Sevilla, P.; Montiel Montoya, J.; Llanes Cárdenas, O.; Ladrón de Guevara Torres, M.; Serrano García, L.A. Rainfall Potential and Consequences on Structural Soil Degradation of the Most Important Agricultural Region of Mexico. Atmosphere 2024, 15, 581. https://doi.org/10.3390/atmos15050581
Norzagaray Campos M, Muñoz Sevilla P, Montiel Montoya J, Llanes Cárdenas O, Ladrón de Guevara Torres M, Serrano García LA. Rainfall Potential and Consequences on Structural Soil Degradation of the Most Important Agricultural Region of Mexico. Atmosphere. 2024; 15(5):581. https://doi.org/10.3390/atmos15050581
Chicago/Turabian StyleNorzagaray Campos, Mariano, Patricia Muñoz Sevilla, Jorge Montiel Montoya, Omar Llanes Cárdenas, María Ladrón de Guevara Torres, and Luz Arcelia Serrano García. 2024. "Rainfall Potential and Consequences on Structural Soil Degradation of the Most Important Agricultural Region of Mexico" Atmosphere 15, no. 5: 581. https://doi.org/10.3390/atmos15050581
APA StyleNorzagaray Campos, M., Muñoz Sevilla, P., Montiel Montoya, J., Llanes Cárdenas, O., Ladrón de Guevara Torres, M., & Serrano García, L. A. (2024). Rainfall Potential and Consequences on Structural Soil Degradation of the Most Important Agricultural Region of Mexico. Atmosphere, 15(5), 581. https://doi.org/10.3390/atmos15050581


