Article

Resonant Forcing by Solar Declination of Rossby Waves at the Tropopause and Implications in Extreme Events, Precipitation, and Heat Waves—Part 1: Theory

by
Jean-Louis Pinault
Independent Researcher, 96, Rue du Port David, 45370 Dry, France
Atmosphere 2024, 15(5), 608; https://doi.org/10.3390/atmos15050608
Submission received: 17 April 2024 / Accepted: 8 May 2024 / Published: 17 May 2024
(This article belongs to the Special Issue Prediction and Modeling of Extreme Weather Events)

Abstract

:
The purpose of this first article is to provide a physical basis for atmospheric Rossby waves at the tropopause to clarify their properties and improve our knowledge of their role in the genesis of extreme precipitation and heat waves. By analogy with the oceanic Rossby waves, the role played by the pycnocline in ocean Rossby waves is replaced here by the interface between the polar jet and the ascending air column at the meeting of the polar and Ferrel cell circulation or between the subtropical jet and the descending air column at the meeting of the Ferrel and Hadley cell circulation. In both cases, the Rossby waves are suitable for being resonantly forced in harmonic modes by tuning their natural period to the forcing period. Here, the forcing period is one year as a result of the variation in insolation due to solar declination. A search for cause-and-effect relationships is performed from the joint representation of the amplitude and phase of (1) the velocity of the cold or warm modulated airflows at 250 mb resulting from Rossby waves, (2) the geopotential height at 500 mb, and (3) the precipitation rate or ground air temperature. This is for the dominant harmonic mode whose period can be 1/16, 1/32, or 1/64 year, which reflects the intra-seasonal variations in the rising and falling air columns at the meeting of the polar, Ferrel, and Hadley cell circulation. Harmonics determine the duration of blocking. Two case studies referring to extreme cold and heat waves are presented. Dual cyclone–anticyclone systems seem to favor extreme events. They are formed by two joint vortices of opposite signs reversing over a period, concomitantly with the involved modulated airflows at the tropopause. A second article will be oriented toward (1) the examination of different case studies in order to ascertain the common characteristics of Rossby wave patterns leading to extreme events and (2) a map of the globe revealing future trends in the occurrence of extreme events.

1. Introduction

In the context of climate change, the study of extreme precipitation events (EPEs) as well as heatwaves takes on crucial importance given their socio-economic impacts. Two essential questions arise: Are these events predictable and under what conditions? Is the increase in their frequency and intensity linked to global warming? The number of scientific articles published in recent decades that attempt to answer these two questions is considerable.
The scientific community has recently experienced a resurgence of interest in Rossby waves, largely focused on their links to extreme weather events, e.g., [1,2,3]. Rossby waves exert a strong influence on local weather conditions in mid-latitudes [4]. The complexity and diversity of the climatic and meteorological phenomena involved has given rise to numerous studies showing that Rossby waves at the tropopause have a determining role in the formation of extreme events, whether precipitation or heatwaves. The atmospheric planetary wave pattern forms a snake over the Earth, leading to persistent surface weather systems and often resulting in extreme events [5]. They are one of the most important sources of weather disturbances in mid-latitudes [6].
Extreme weather events can result from Rossby waves with anomalously high stationarity/persistence, e.g., [7,8,9,10,11,12], and/or abnormally high amplitude, e.g., [13,14,15,16,17,18]. The persistence of quasi-stationary Rossby waves can lead to extreme events, such as multiple days of rain leading to flooding or prolonged heat waves.
Theoretical studies and case studies have qualitatively investigated the surface response to upper atmospheric Rossby waves and their feedback [5,7,19,20,21,22]. A quantitative study of the effects of Rossby waves on meteorological scales near the ocean surface is focused on Rossby waves with time scales of approximately 6 to 8 days and spatial scales of approximately 3500 to 6500 km [23]. According to these studies, Rossby wave-induced surface cold/warm advection in the upper atmosphere significantly modifies surface heat fluxes, which plays a key role in the development of cyclones in association with changes in latent heat fluxes [24].
The amplification of short-wavelength waves (resonant waves caused by quasi-resonant amplification) is thought to reflect the effect of anthropogenic forces due to Arctic warming [25] and may explain extreme weather events in the north and south hemispheres [26,27,28]. Some studies have focused on a resonant oceanic response to stochastic atmospheric forcing [29,30,31].
Studies focus on heat waves. In recent decades, a series of heat waves have occurred in the mid-latitudes of both hemispheres, including the European heat wave in 2003 [32], the Russian heat wave in 2010 [33], and other heat waves occurring more frequently in recent years [34,35,36,37,38]. In June–August 2022, unprecedented heatwaves hit a wide range of mid-latitude regions, including China, North America, Europe, etc. Studies have also shown that these extreme weather conditions are expected to occur more frequently [39,40,41,42,43].
The current knowledge is far from sufficient to understand the physical mechanism behind extreme weather phenomena and their evolution in the context of climate change. Thermodynamic effects, blocking, and planetary wave activity all contribute to extreme summer weather [1,7,13,44,45,46,47]. Quantifying their relative contributions is challenging but motivates research [38,48].
A new approach is proposed, based on the resonant forcing of Rossby waves by the solar declination. Such Rossby waves can be highlighted by filtering the wind velocity at the tropopause within period ranges characteristic of their natural periods. The resulting modulated airflows (MAs) have a key role in the genesis of extreme events, whether precipitation or heat waves, which is proven from the construction of a chain of cause-and-effect relationships. By focusing on links in the chain from upper atmospheric conditions to surface extremes, it may be possible to better understand the nature of the links to persistent surface weather events and their representation in models [49].

2. Materials and Methods

2.1. Data

The NCEP/DOE Reanalysis II data are provided by the National Oceanic and Atmospheric Administration (NOAA) PSL, Boulder, CO, USA, from their website at https://psl.noaa.gov, accessed on 13 May 2024. The daily gridded data from 1979 to now [50] are available at https://www.psl.noaa.gov/data/gridded/data.ncep.reanalysis2.html, accessed on 13 May 2024.
They include the wind velocity as a function of atmospheric pressure (17 levels), 2.5-degree latitude × 2.5-degree longitude; the precipitation rate, 0.5-degree latitude × 0.5-degree longitude; the air temperature at 2 m, 1.875-degree latitude × 1.875-degree longitude; and the geopotential height as a function of atmospheric pressure (17 levels), 2.5-degree latitude × 2.5-degree longitude.

2.2. Wavelet Analysis

A wavelet analysis of the absolute value of wind speed is used to highlight oscillations in their speed. Here, the cross-wavelet analysis of the wind speed compared to a temporal reference is carried out in predetermined period ranges to represent paired maps, one being the maximum amplitude of the wind speed whatever the date of its occurrence during a period and the other being the phase. The time reference presents a single non-zero value on the date from which the phase is determined [51].
Considering a particular period range, the simultaneous representation of the amplitude and phase of the upper-altitude wind velocity makes it possible to date the speed anomalies observed from the offset (the phase) relative to the time reference. By convention, the phase corresponds to a velocity anomaly oriented toward the east. If the MA speed reaches its maximum at time t while it moves eastward, the speed reaches a maximum half a period earlier/later when the airflow moves westward, with the same amplitude. These properties apply to all the variables that will be considered to characterize extreme events.

2.3. Equations of Motion of Rossby Waves

The purpose of this section is to provide a physical basis for atmospheric Rossby waves at the tropopause. From there, the little-known properties of MAs associated with resonantly forced Rossby waves will be highlighted, opening new perspectives in understanding the phenomena leading to the formation of extreme meteorological events.
By analogy with the oceanic Rossby waves, our work is based on the vertical motion of the interfaces at the meeting of the Ferrel and Hadley cell circulation or at the meeting of the polar and Ferrel cell circulation. The role played by the pycnocline in ocean Rossby waves is replaced here by the interface of the polar jet above the ascending air column at the meeting of the polar and Ferrel cell circulation or by the interface above the descending air column at the meeting of the Ferrel and Hadley cell circulation as far as the subtropical jet is concerned. In both cases, the Rossby waves are suitable for being resonantly forced by tuning their natural period to the forcing period. Here, the forcing period is one year as a result of the variation in insolation due to solar declination. The tuning results from the adjustment of the jet stream meandering.
By forming cold drops, that is, a weather phenomenon involving cool air that floats over warmer areas in the atmosphere [52], Rossby waves at the tropopause favor an upward motion of moist air due to diabatic heating. They can initiate a positive potential vorticity accompanied by a convergent inflow. Due to positive feedback involving increased latent heating, this can lead to large-scale strong ascent [53].
Rossby waves, whether oceanic or atmospheric, have the ability to tune their natural period to the forcing period. Like ocean Rossby waves that form where the western boundary currents leave the continents, atmospheric Rossby waves form in the polar and subtropical jet streams. In both cases, they owe their existence to the stratification of the fluid and the variation with the latitude of the Coriolis frequency f = 2 Ω sin φ ( Ω is the rotation rate of the Earth and φ is the latitude). Ocean Rossby waves move along the pycnocline, that is, the boundary between the warm upper layer and the denser cold deeper part of the ocean. In the case of the polar and subtropical jet streams, Rossby waves move along the upper limit of the rising/sinking air at the meeting of the polar and Ferrel circulation cells or the Ferrel and Hadley circulation cells.
Whether it is the polar or subtropical jet stream, Rossby waves are characterized by the vertical movement of the interface, as well as the zonal and meridional MA velocities. As concerns the polar jet stream, Rossby waves are defined from the altitude H p , i of the interface and the velocities u p , i and v p , i of the zonal and meridional MAs (the index i is used to differentiate the different Rossby waves according to their period). These variables become H s t , i , u s t , i , and v s t , i for the subtropical jet stream.
Atmospheric heating by solar radiation promotes air rising where the polar and Ferrel circulation cells meet, which increases the altitude H p , i of the interface. Conversely, atmospheric heating by solar radiation promotes air sinking where the Ferrel and Hadley circulation cells meet, which decreases the altitude H s t , i of the interface. Consequently, the interface height of the polar and subtropical MAs varies in opposite phases according to the seasons.
Using the β-plane approximation and neglecting the compressibility and the thermal expansion of air, which is supposed inviscid, as well as the response of the stratosphere to solar declination, consider the effect of solar irradiation on jet streams, the only forcing term in the equations of motion of Rossby waves embedded in the jets. In Cartesian coordinates, the forced versions of linearized primitive equations, that traduce momentum (1), (2) and continuity (3) equations of two superposed fluids of different densities, with the potential vorticity Equation (4) that follows from the previous ones (the subscripts are removed) are as follows:
u / t β y v = g η / x
υ / t + β y u = g η / y
η t + T u x + v y = E
t ξ f η / T + β v = f E T
where η is the modulation of the interface height H , T is the thickness of the jet stream, f = β y where f is the Coriolis frequency, and g is the acceleration of gravity. ξ = v / x u / y is the relative vorticity. The forcing term E is the ascending/descending speed of the interface under the effect of solar irradiation depending on whether it is the polar or subtropical jet stream. E is a periodic function having a maximum in the boreal/austral summer and a minimum in the boreal/austral winter.
The solution { η ,   u ,   v } presents singularities highlighting resonances [52,54,55]. So, this ill-posed problem is regularized when the Rayleigh friction is considered. The velocity v x ,   y ,   t of the meridional MA is in phase with the forcing, whereas the velocity u x ,   y ,   t of the zonal MA is in quadrature, as well as the modulation η x ,   y ,   t of the interface height H x ,   y ,   t . Because the equations of motion are linearized, the amplitudes of the modulated meridional and zonal airflows u and v are proportional to the amplitude of the modulation η of the interface.
At mid-latitudes, the gradient of the Coriolis frequency is β = 2 Ω / R cos φ 0 and the Coriolis frequency is f 0 = 2 Ω sin φ 0 at the central latitude ( Ω is the rotation rate of the Earth, R is the radius of the Earth, and φ 0 is the central latitude in the local Mercator projection). The Coriolis frequency f is expanded with respect to y such that f = f 0 + β y . Thus, the dispersion relation is, in the case of long planetary waves, approximated by [56]:
ω / k = β c 2 / f 0 2 = c 2 cos φ 0 / 2 Ω R sin 2 φ 0
where c is the phase velocity of Rossby waves along the equator. ω / k is the phase velocity of Rossby waves at latitude φ 0 , ω is the pulsation, and k the wave number.

2.4. Quasi-Stationary Rossby Waves Resonantly Forced

Quasi-stationary waves form when the westward phase velocity of the Rossby waves is lower than the eastward velocity of the background flows in which they are embedded so that the resulting waves seem to propagate around the Earth to the east. But for these quasi-stationary waves to last over time, their natural period must coincide with the forcing period. Indeed, in the opposite case, the fundamental Rossby wave would be irreparably destroyed over time when the forcing comes to oppose the movement of the wave. Under these conditions, the forcing becomes resonant and the fundamental Rossby wave captures the maximum solar irradiance energy.
The properties of quasi-stationary Rossby waves result from the superposition of waves of different periods and on the optimal conditions for the stability of the dynamic system. Without solving the equations of motion, the coupling between the N harmonic oscillators that represent the N superposed Rossby waves can be interpreted from the following system of Caldirola–Kanai Oscillators [57,58]:
M i ϕ ¨ l + γ M i ϕ ˙ i + j = 1 N J i j ϕ i ϕ j = I i cos Ω t
where ϕ i is indifferently H p , i , u p , i , H s t , i , or u s t , i ; Μ i is the mass of air displaced during a cycle resulting from the quasi-geostrophic motion of the ith oscillator; γ is the damping parameter referring to the Rayleigh friction; and J i j measures the coupling strength between the oscillators i and j . I i is the amplitude of the forcing, with pulsation Ω , of the ith oscillator. Let us put ϕ i = u p , i or ϕ i = u s t , i in Equation (6); the restoring force j = 1 N J i j ϕ i ϕ j depends on the zonal velocity difference between the oscillators. It cancels when ϕ i ϕ j because there is no friction.
The interaction energy of the jth oscillator is given by [56,58]:
E j t = i < j J i j cos ( ω i t ω j t )
where ω i is the pulsations of the oscillators i .
When the pulsations are such that ω i = n i Ω where n i is an integer, then the time-averaged energy E j ¯ tends to zero as the time increases, which means that each oscillator receives as much energy from the other oscillators as it gives up. In other words, the harmonicity of the oscillator system ensures that it remains stable over time. Furthermore, the system of Rossby waves tends to return to optimal conditions of stability after having moved away from them by acting on the meandering of the jet so as to lengthen or, on the contrary, shorten the propagation time during a revolution in order to retore the resonance conditions.
These resonance conditions apply to the annual forcing period resulting from the variation in solar irradiance due to solar declination. The apparent wavelength of the quasi-stationary waves must coincide with an integer number of the length of the meandering interfaces traveling around the Earth, at the meeting of the polar and Ferrel circulation cells or the Ferrel and Hadley circulation cells. Because the average latitudes of jet streams determine the distance traveled around the Earth as well as the phase velocity of Rossby waves from the dispersion relation (5), it has a driving role in the tuning of the natural period to the forcing period. Consequently, Rossby waves interact on an adjustment variable that determines the duration of the course around the Earth. This adjustment variable is none other than the sinuosity of jet streams. In addition to the fact that the length of the path is determined by the meanders, Rossby waves slow down as they approach the pole and speed up as they move away from it (5).
Because the distance traveled by the polar and subtropical MAs around the Earth differ, as does the latitude, the resonance conditions are not the same. The similarity ratio of the periods of polar and subtropical Rossby waves obtained from the circumference of the parallels at 30 and 60° N or S, and the celerity of the Rossby waves deduced from the dispersion relation (5), is equal to 3, exactly, if the Earth is assumed to be a perfect sphere. In the absence of jet streams, the subtropical Rossby wave would make three turns, while the polar wave would make only one. Being embedded into their respective meandering jet stream in which they propagate against the stream, the subtropical Rossby wave travels fewer revolutions than the polar Rossby wave. However, the number of revolutions made during a period by the polar Rossby wave appears to be a multiple of the number of revolutions made by the subtropical Rossby wave. This observation is suggested by the synchronization that occurs regularly between the two quasi-stationary waves when their modulated speeds form two anomalies in opposite phases, seemingly at the same longitude. As we will see, such a pairing favors the emergence of EPEs or heat waves.

3. Results

3.1. Warm and Cold Airflows

Whether it is the polar or subtropical MA, the fundamental Rossby wave is annual so that it resonates with the period of forcing resulting from the solar declination. Embedded in the sinuous jets, they appear to propagate eastward (Section 2.4), describing several revolutions for one year. Their apparent wavelength is an integer number of revolutions that fulfills the conditions of harmonicity (Figure 1).
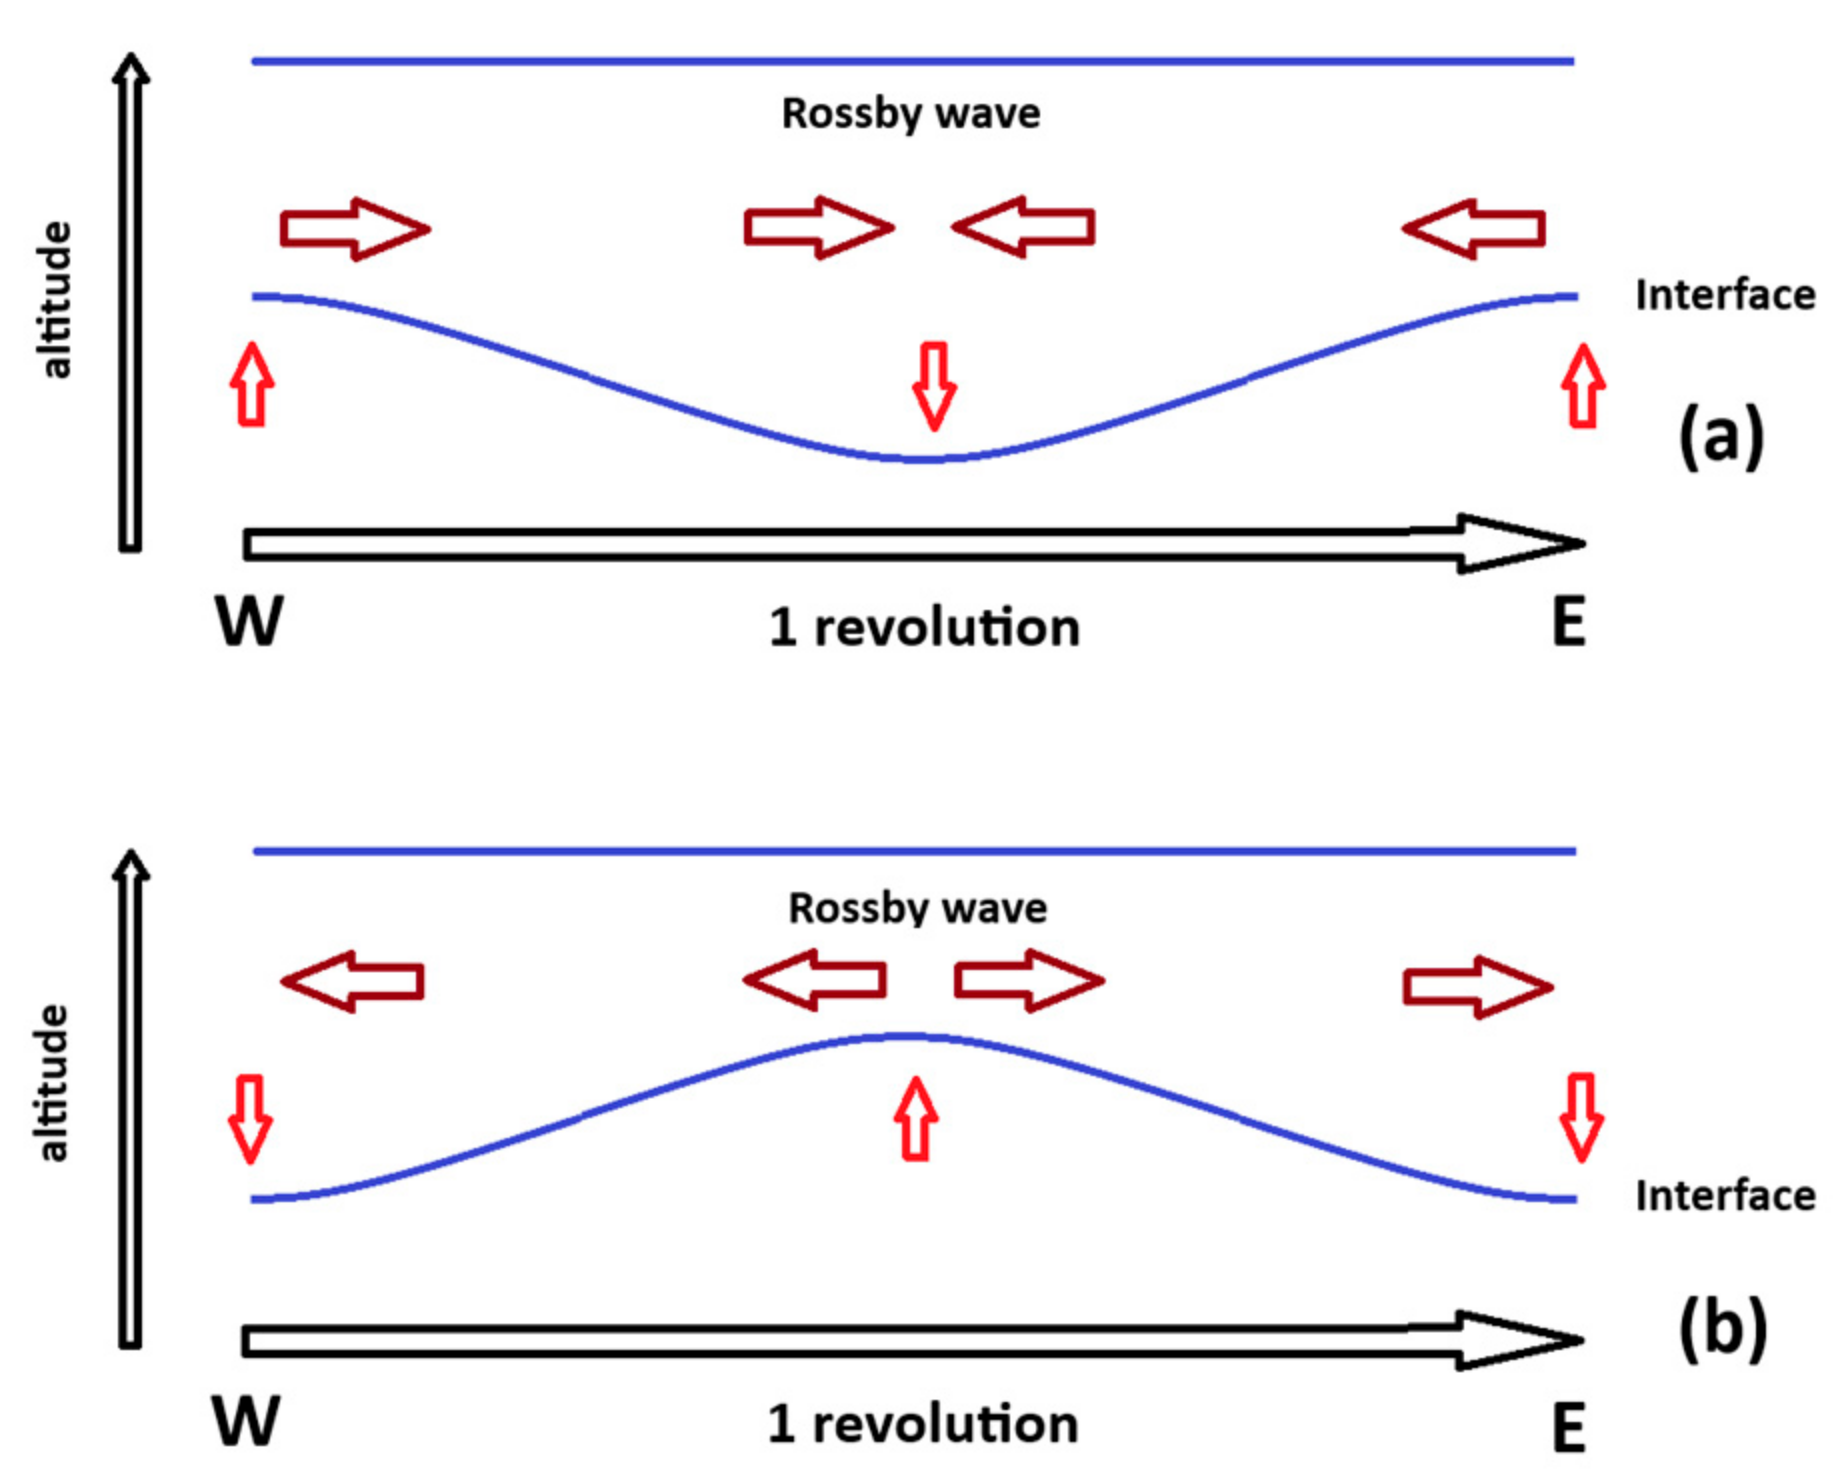
Among the different harmonics, let us consider the one for which the apparent wavelength coincides with the path traveled during one revolution (Figure 2). Regarding the subtropical airflow, the interface of the Ferrel and Hadley cells lowers as the temperature increases and rises when the temperature decreases so that the variation in the antinode is in phase with the temperature. Regarding the polar airflow, the phenomena are reversed so that the interface of the polar and Ferrel cells rises as the temperature increases and lowers when the temperature decreases so that the variation in the antinode is in opposite phases with the temperature. These properties inherited from the annual fundamental wave remain true for each of the harmonics, which reflect the intra-seasonal variations in the rising and falling air columns at the meeting of the polar, Ferrel, and Hadley cell circulation.

3.1.1. The Northern Hemisphere

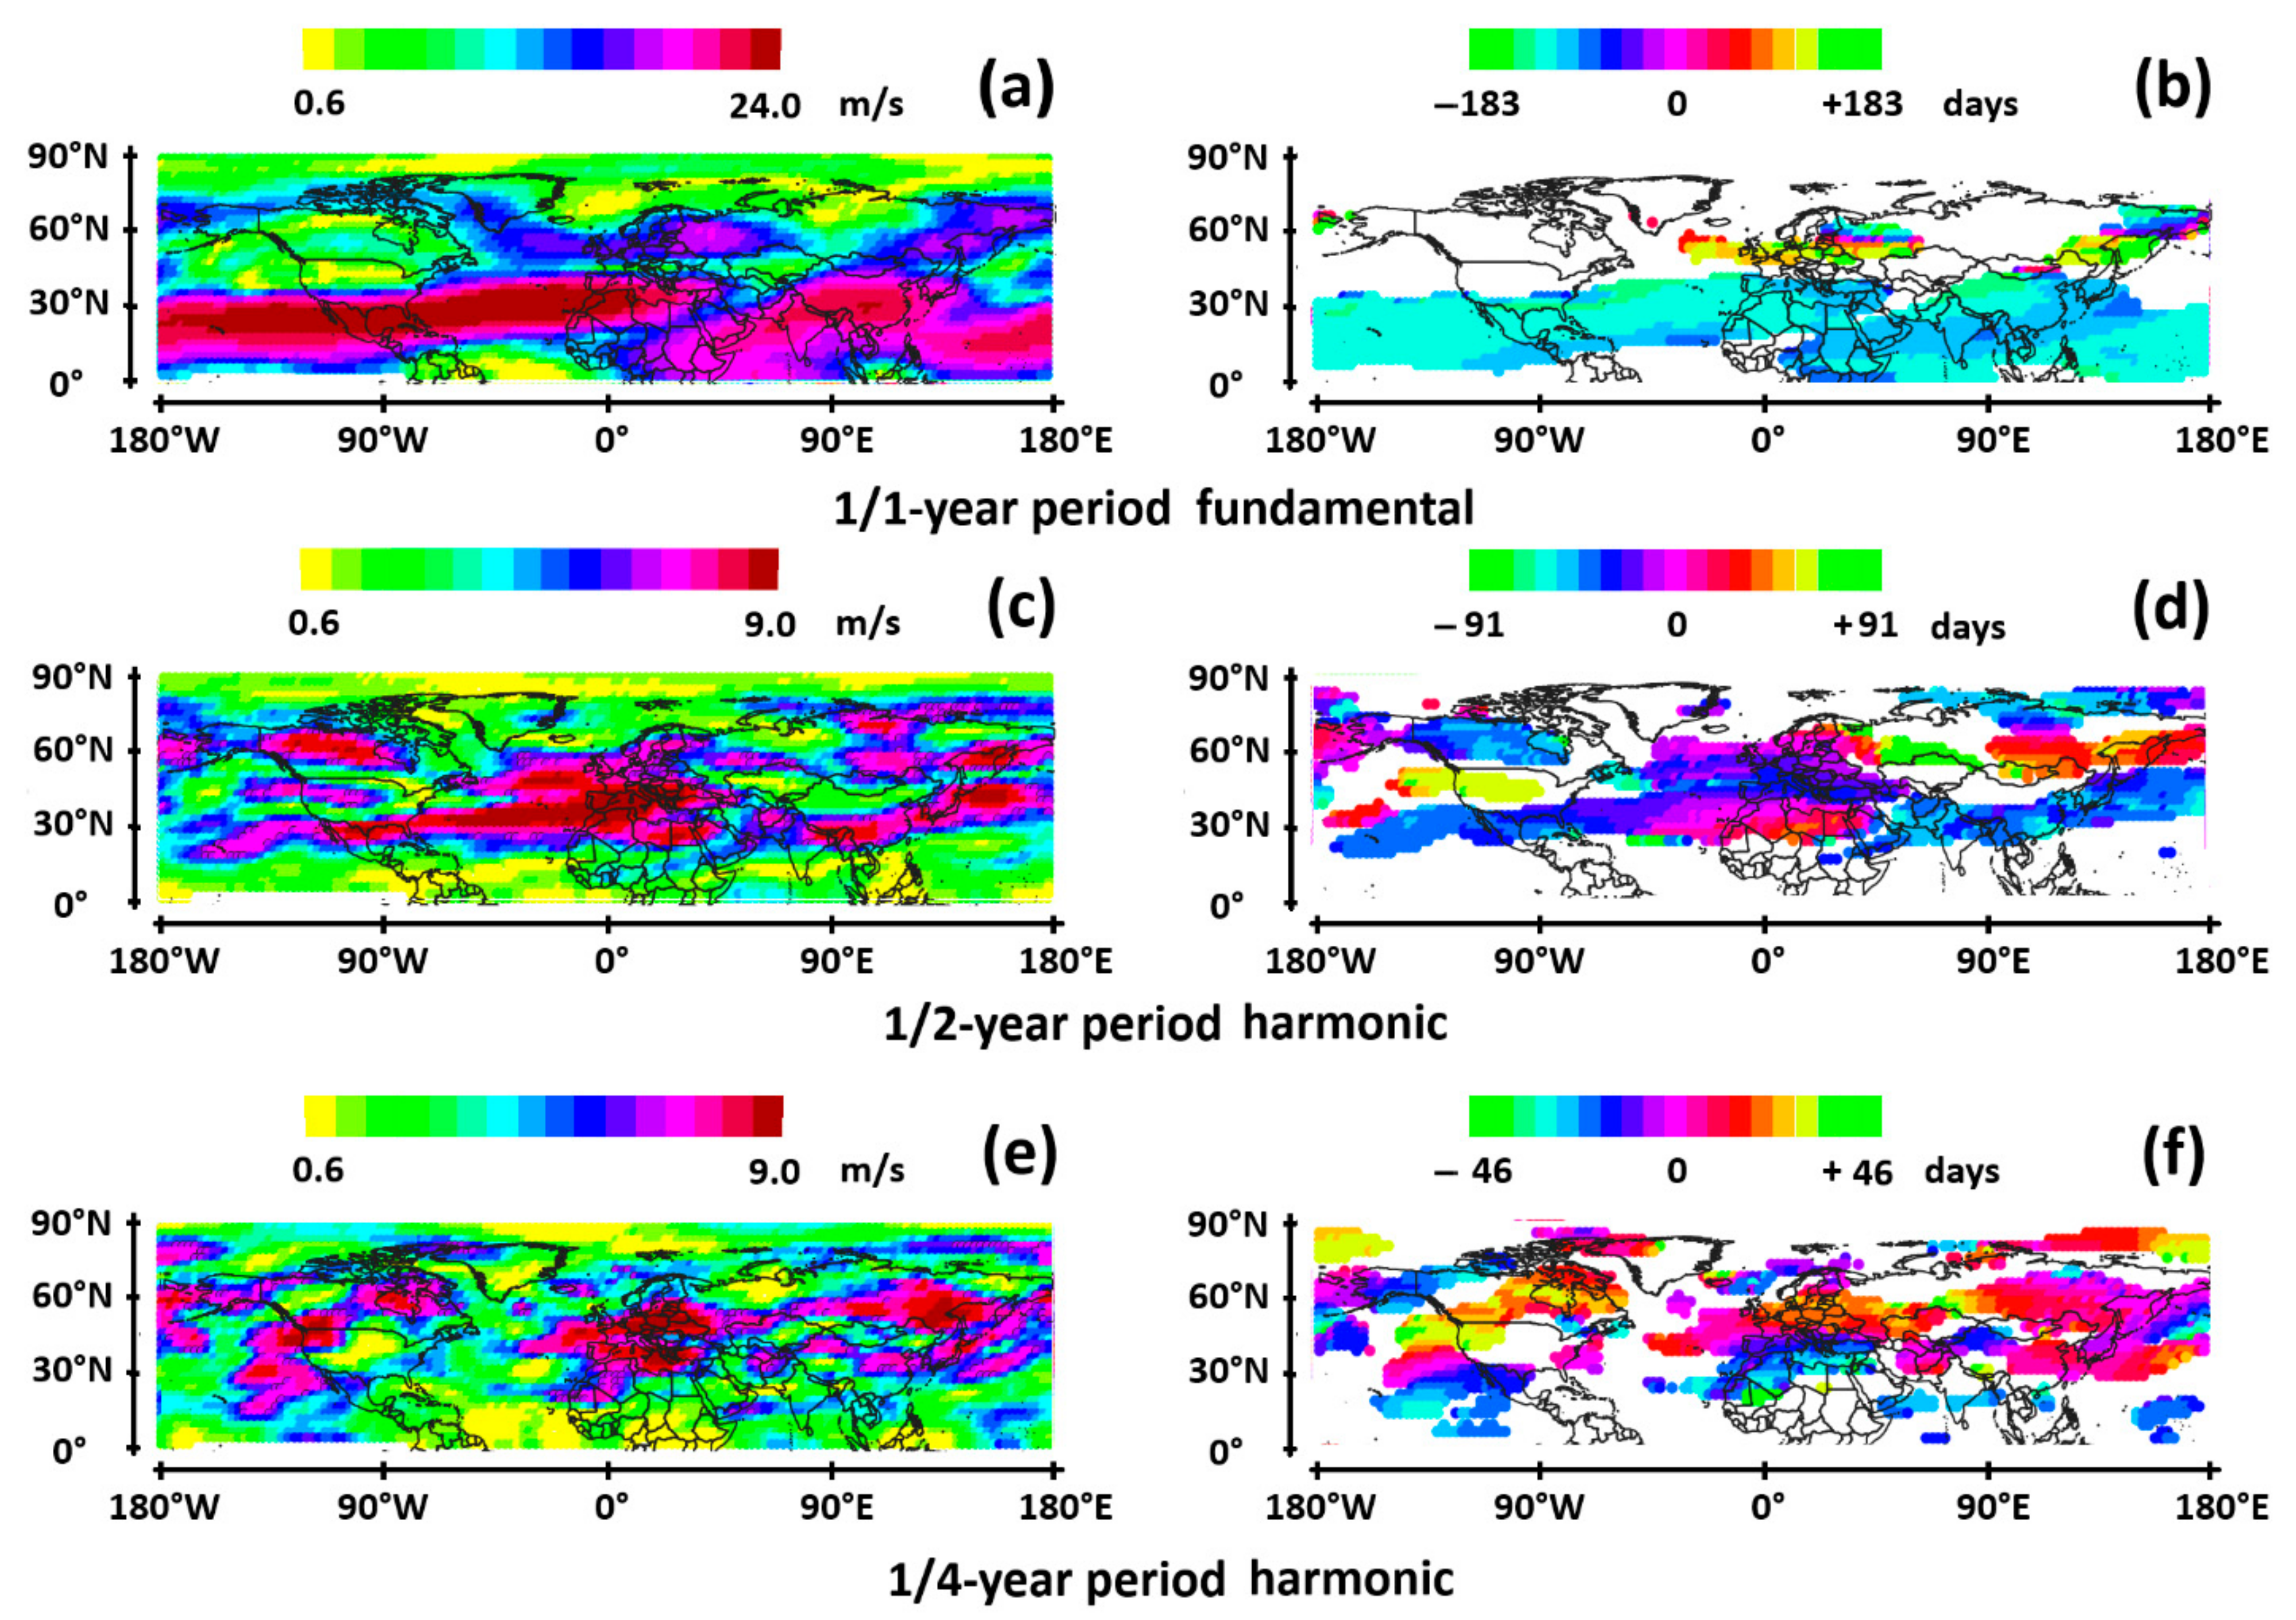
In the northern hemisphere, the amplitude and phase of the zonal MA u of the fundamental wave whose period coincides with the forcing period, that is, one year, is represented in Figure 3a,b in the period range 274–548 days. The maximum velocity of the subtropical MA is high, i.e., 24 m/s, which occurs approximately 4 months before the reference date, i.e., 6 June 2005, that is to say, in the middle of winter 2004–2005. The uniformity of the phase shows that the apparent wavelength makes several revolutions. The polar MA, which is weaker, has an indeterminate phase.
The uniformity of the phase of the subtropical MA indicates that the apparent wavelength of the stationary Rossby wave describes several revolutions during a period so that the interface appears to rise and lower uniformly over a period. It is on this harmonic whose natural period coincides with the forcing period that the resonant forcing resulting from the declination of the sun is most efficient. In the winter, the subtropical MA reaches its maximum speed, and the interface reaches its maximum under the effect of low temperatures.
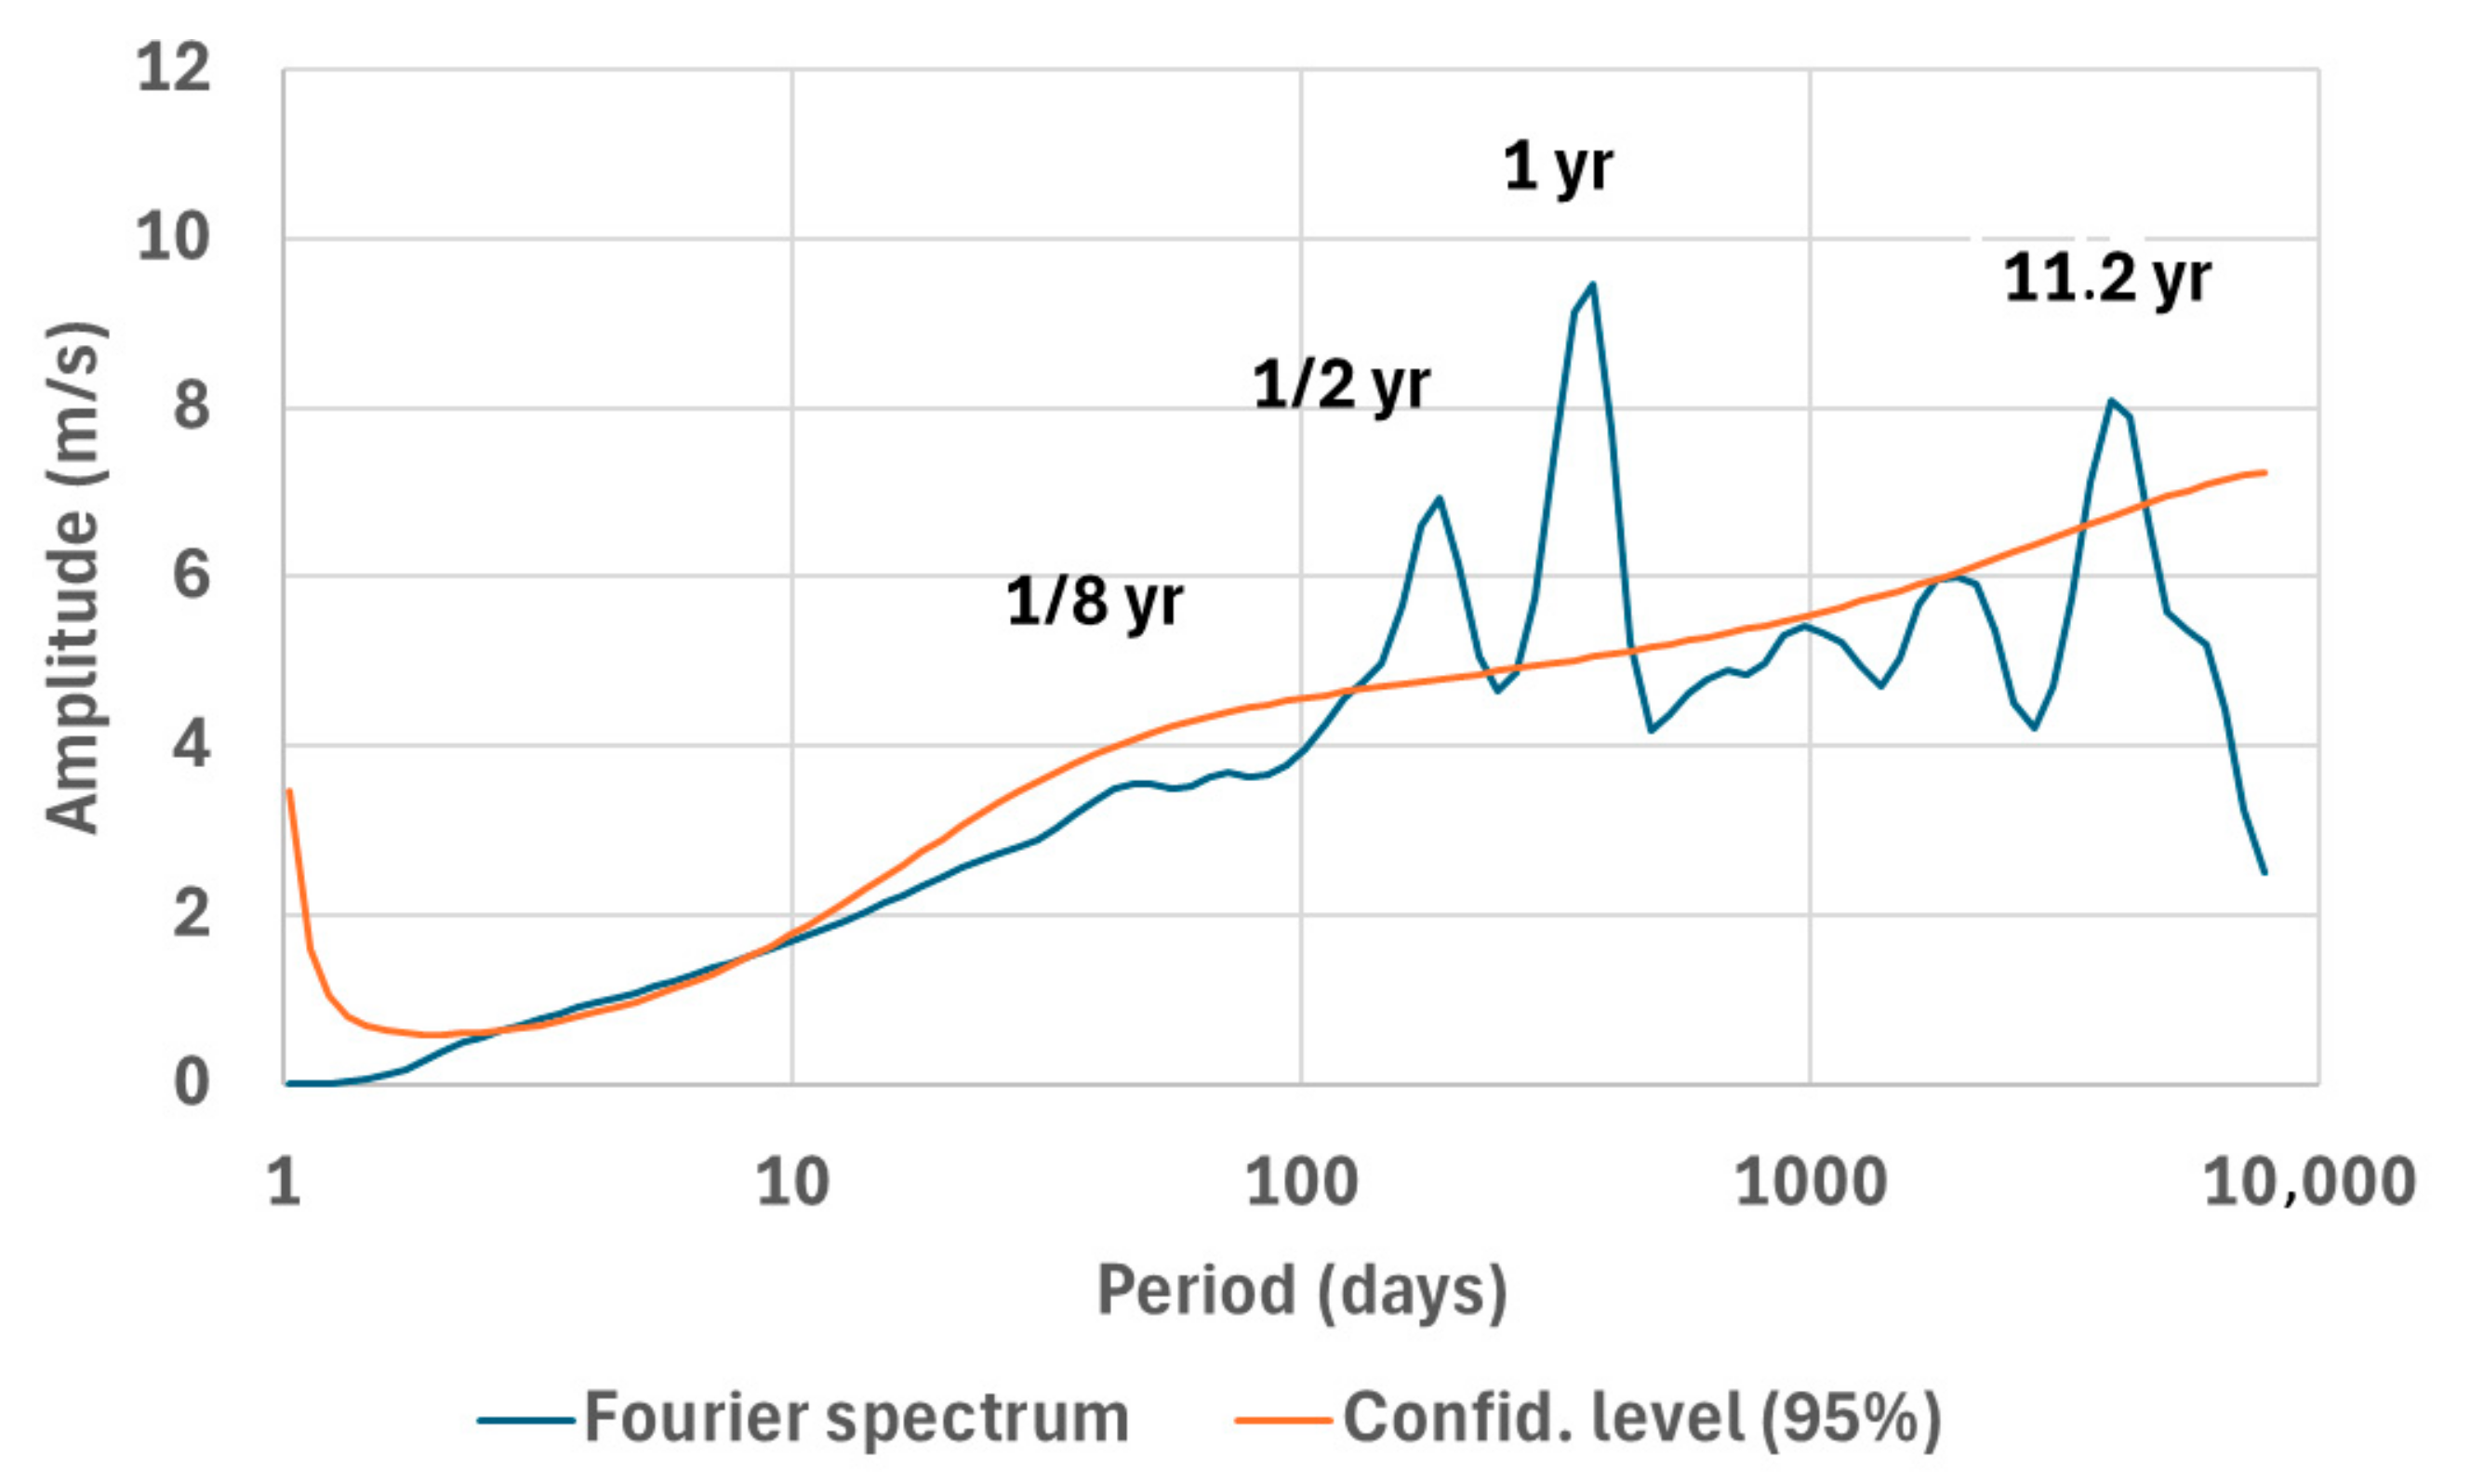
In Figure 4, the Fourier spectrum of the wind velocity at 250 mb averaged over a region of Northern Europe representative of the polar jet stream highlights the harmonic whose period is half a year. On the other hand, a peak at 11.2 years is evidence of the solar cycle, which highlights the propensity of Rossby waves to resonate. This statement results from the resolution of the three visible peaks whose periods are 1/2-, 1-, and 11.2 years, reflecting the seasonal, annual, and solar cycles.
As shown in Figure 3c,d, the 1/2-year-period harmonic defined in the 137–274-day-period range shows, again, a predominance of the subtropical MA over the polar MA. Propagating mainly centered on latitude 30° N, the subtropical MA forms a broad meander above Europe and the Atlantic. Its phase remains uniform around the Earth, which reveals the presence of a single velocity anomaly. Consequently, the subtropical Rossby half-wave makes several revolutions. The polar MA cannot be identified as such because the amplitude and phase of the velocity anomalies are too fragmented.
Regarding the 1/4-year-period harmonic defined in the period range 68–137 days (Figure 3e,f), the speeds of the polar and subtropical MAs are comparable. The phase inversions of the subtropical MA at the antinodes 90° E and nearly 180° show that the velocity anomalies are at the nodes of the quasi-stationary wave whose apparent wavelength makes one revolution. The maximum speeds are in opposite phases on opposite sides of 90° E. One can conclude that the apparent wavelength of the annual subtropical Rossby wave circles the Earth four times. On the other hand, the phase of the polar wave remains approximately uniform because it makes several rotations when the subtropical wave only makes one. Two velocity anomalies of the polar and subtropical waves, in opposite phases, are located nearly at the same longitude over Europe and the Atlantic.

3.1.2. The Southern Hemisphere

At the end of spring/beginning of summer, the velocity anomalies produced by the polar and subtropical Rossby waves have similarities in both hemispheres. As shown in Figure 5, here again the large-scale structuring of the fundamental subtropical wave and its 1/2-year period harmonic highlight a single velocity anomaly.
Likewise, the polar and subtropical MAs reach comparable speeds as far as the 1/4-year-period harmonic is concerned. The phase of the polar wave that remains parallel to the Antarctic continent is approximately uniform throughout the complete revolution. Two antinodes can be identified by the phase inversion of the subtropical MA at 45° S, 90° W and nearly 45° S, 90° E. These observations suggest that, again, the apparent wavelength of the annual subtropical Rossby wave makes four revolutions.

3.2. First Case Study: Flood in Japan (July 2012)

During 11–14 July 2012, deadly floods and landslides triggered by a series of unprecedented heavy rains hit Kyushu, Japan. A weather trough with positive height anomalies appeared, the center of which moved to the north of Japan over this period, which might cause wind anomalies and whereby lots of water vapor was transported to the Kyushu area [59]. The most impacted regions were South Korea and the south of Japan.
For each case study, a synthetic figure is composed of three paired maps. They represent, in characteristic period ranges, the amplitude and phase, relative to a reference date slightly ahead of the date of occurrence of the EPE; the wind speed anomalies at 250 mb; the geopotential height anomalies at 500 mb; and the precipitation rate. Wind speed anomalies provide information on the spatial and temporal patterns of Rossby waves at the tropopause. The geopotential height anomalies show how low- and high-pressure systems form in connection with wind speed anomalies. The precipitation rate provides information on the coalescence of low-pressure systems and the location of ascending columns in connection with the structuring of large-scale cyclonic systems.
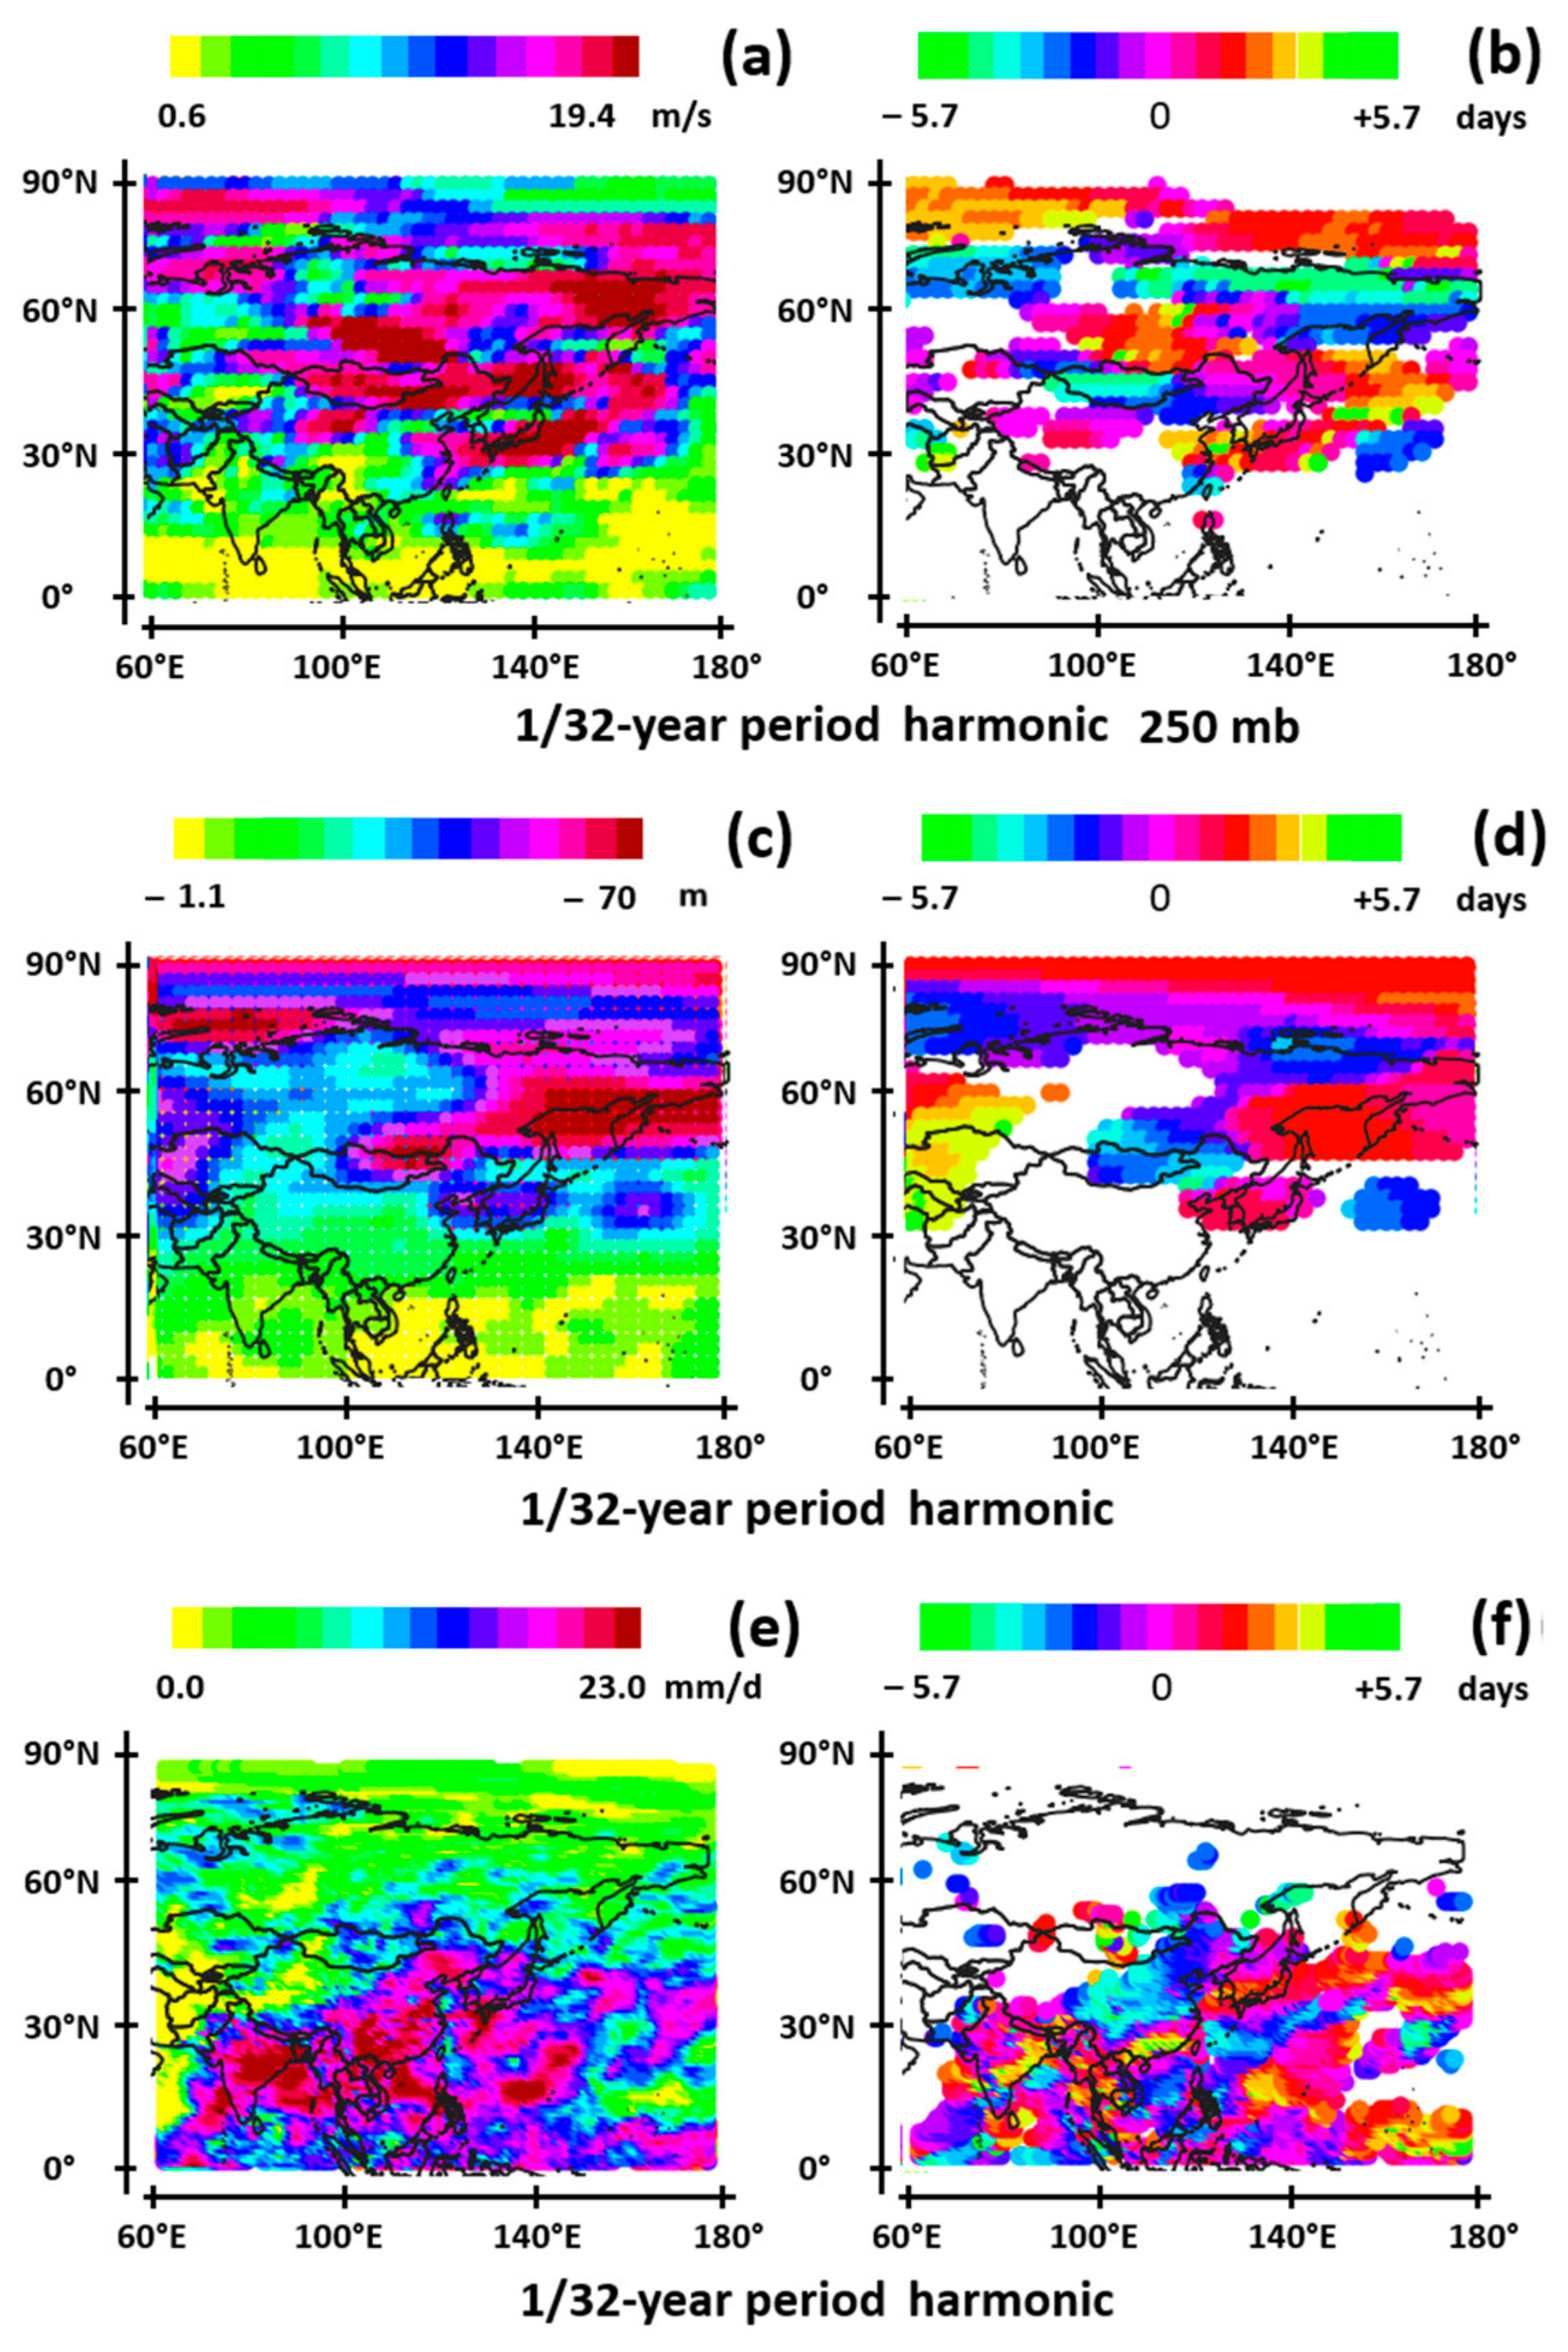
As an example, Figure 6 is devoted to an EPE that occurred in Japan in the summer 2012. It shows the wind velocity at 250 mb (a,b), the geopotential height at 500 mb (c,d), and the precipitation rate (e,f) on 12 July 2012. Whether polar or subtropical MAs, the wind speed anomalies represented in Figure 6a,b obtained by filtering the wind speed at 250 mb concern cold airflows. But on the date of occurrence of the EPE, the airflow may be cold or warm depending on its phase represented in Figure 6b. Indeed, this results from the principle according to which any cold airflow on a certain date is warm half a period earlier/later. This principle applies for geopotential height. Any low-pressure system becomes a high-pressure system half a period earlier/later so that the period range selected reveals the duration of the blocking as well as the natural period of the dynamic system. The choice of phase colors makes it possible to identify the coherence of the phenomena observed through the wind velocity anomalies, the geopotential height, and the precipitation rate. A cold airflow produces a low-pressure system and heavy rain concomitantly so that the color of the phase is “preserved” from one anomaly to another.
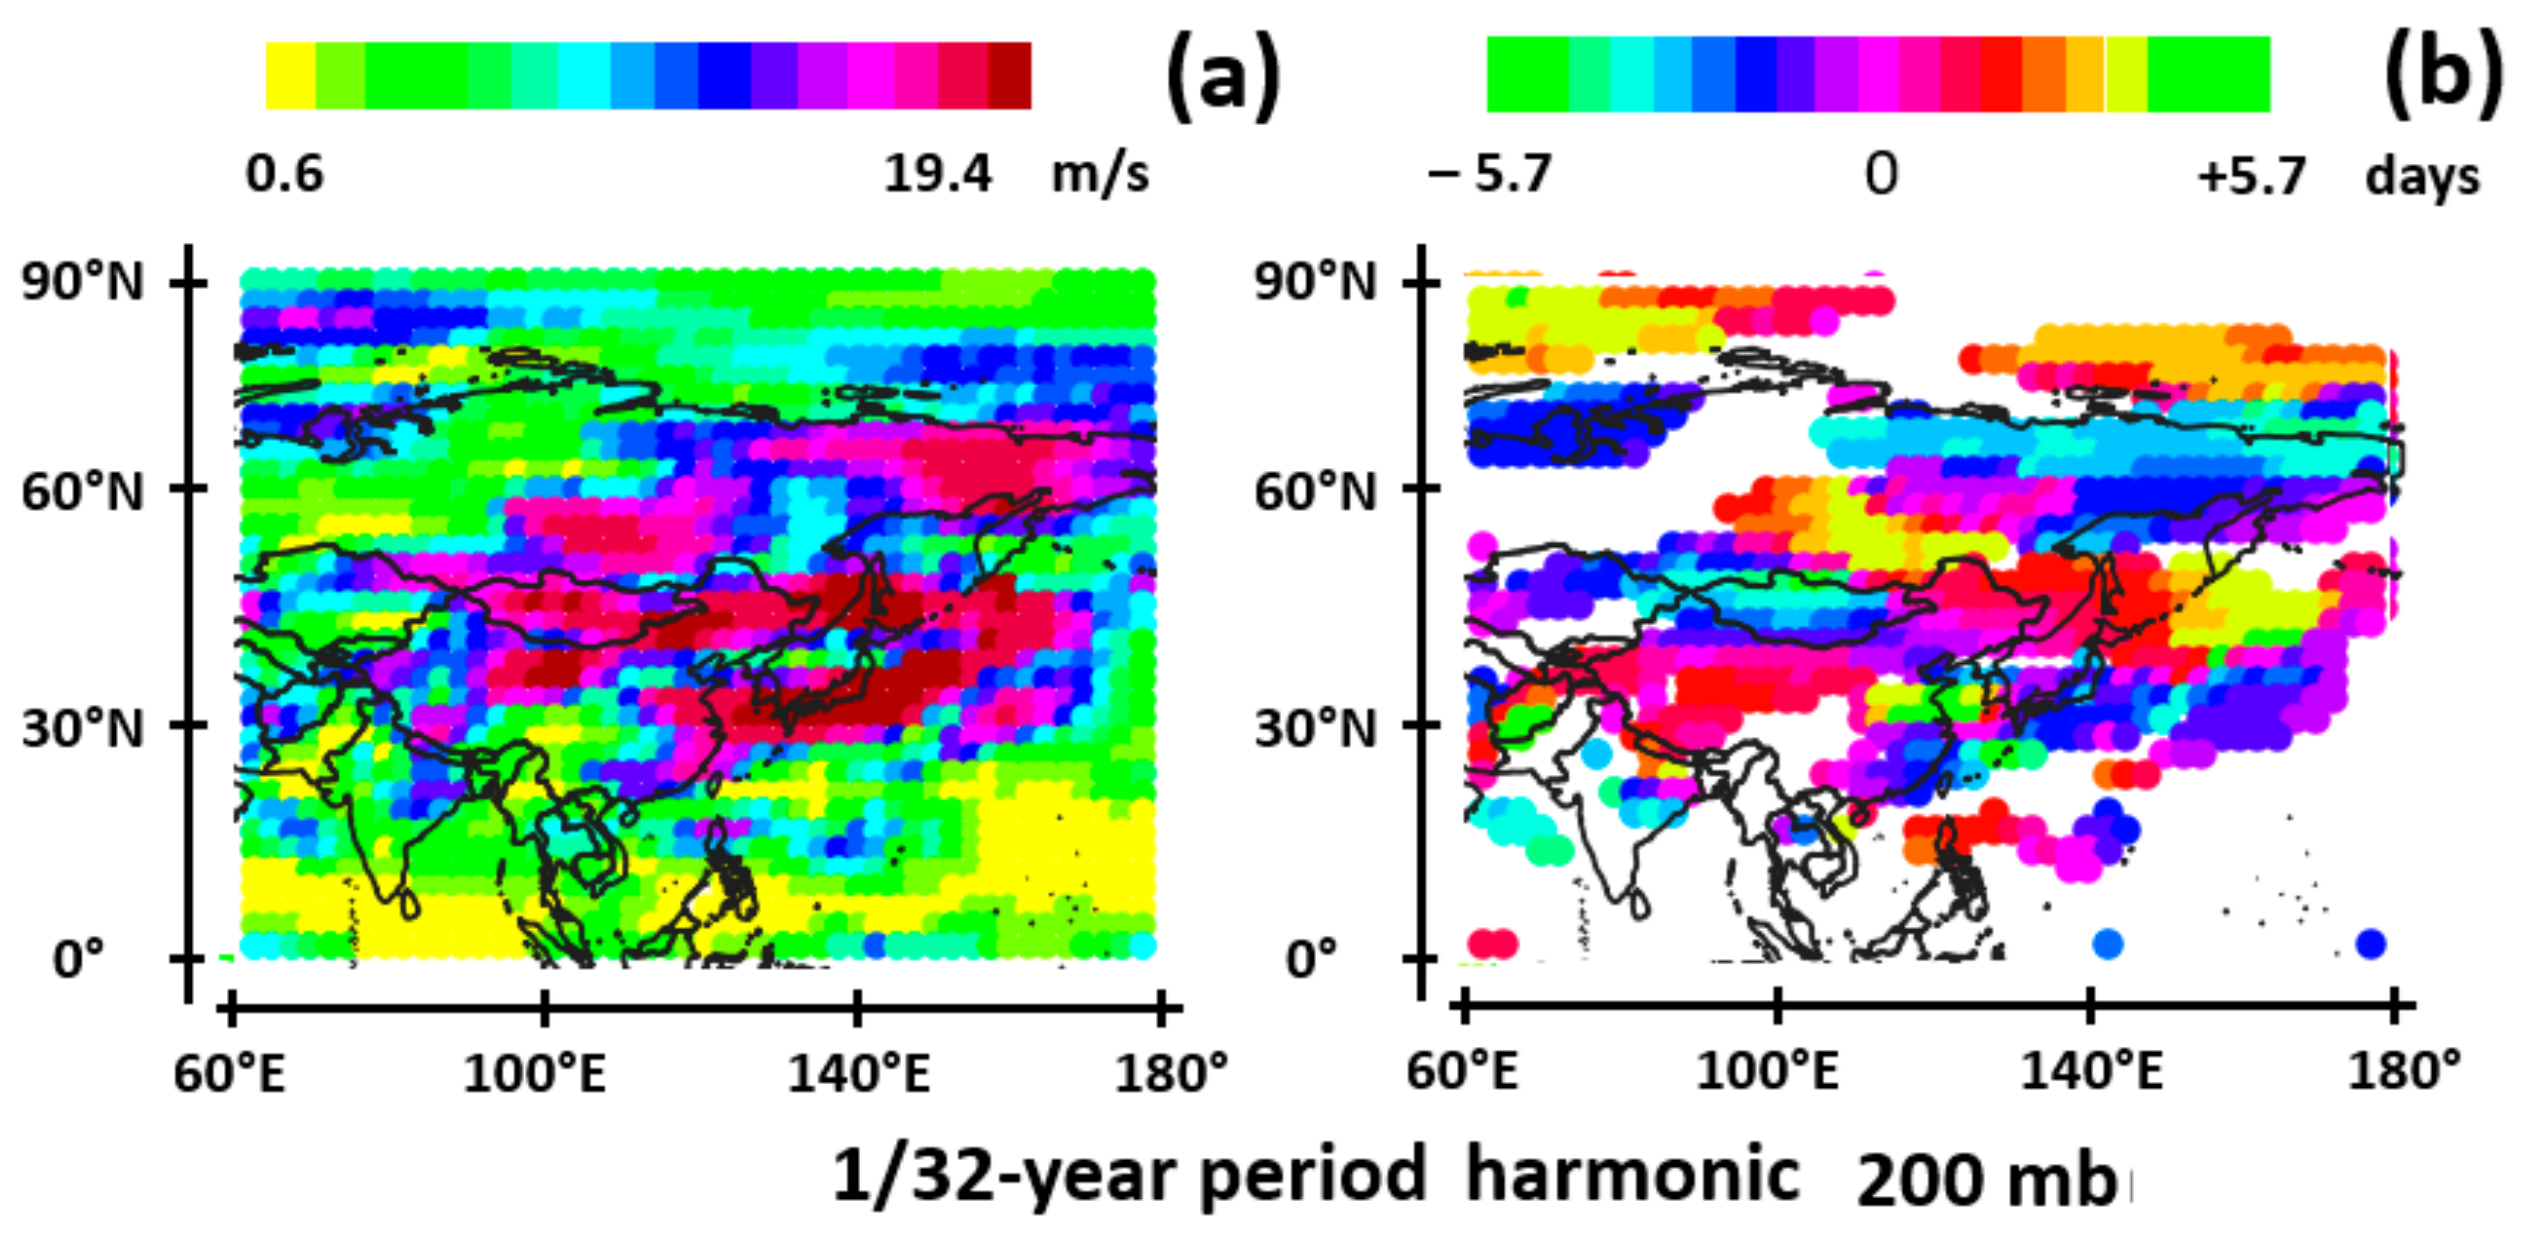
The 1/32-year-period harmonic represented in Figure 6 is the most representative harmonic. The selection criteria for the different harmonics (Table 1) correspond to the maximum amplitude of the wind speed anomalies. Regarding the wind velocity, the choice of the layer at 250 mb, rather than 200 mb as is usual, is motivated by the fact that the Rossby wave above the tropospheric polar vortex is more evident at 250 mb than at 200 mb (phase in red above 80° N in Figure 6a,b and Figure 7) without the other Rossby waves being significantly affected.
The reference date (12 July 2012) is slightly ahead of the date of occurrence of the EPE, south of Japan. The 1/32-year-period harmonic of the MA speed corresponds to a resonance of subtropical and polar Rossby waves. They are highlighted by the high MA speed in the period range 8.56 to 17.1 days. The polar MA nearly 60° N (phase in blue) is coldest nearly 3 days before the reference date, which means that it is warmest half a period later. On the other hand, the subtropical MA between 30 and 60° N (phase mostly in red) is coldest nearly 3 days after the reference date. West of longitude 120° E, the subtropical MA is subject to a phase inversion at the antinode (phase segment in blue). Figure 6b also shows a zonal band nearly 80° N (phase in red-orange) 3 days later compared to the reference date. Being in phase with the subtropical band (phase in red), this band results from Rossby waves located above the tropospheric polar vortex: both interfaces rise or lower concomitantly.
The phases in the MA velocities and geopotential height maps highlight a spatial and temporal coherence between these two variables. More precisely, low-pressure systems (phases in red in Figure 6d) result from MAs above the polar vortex, as well as subtropical MAs in its eastern part. High-pressure systems (phases in blue in Figure 6d), on the other hand, result from both the polar and subtropical MAs where phase inversion occurs at the antinode (phase segment in blue centered on latitude 45° N). A dual cyclone–anticyclone system, that is, the association of two joint vortices of opposite signs, cyclone and anticyclone, which reverse over a period, is centered on latitude 50° N (phases in red and blue in Figure 6d).
Two episodes of precipitation occur in the first 3 days before the reference date (phase in blue) mainly over eastern China (Figure 6e,f). This episode is in phase with the westernmost vortex of the dual cyclone–anticyclone system while having shifted toward the south. Secondly, precipitations occur 3 days after the reference date (phase in red) in the south and east of China, including Japan. They are in phase with the easternmost vortex of the dual cyclone–anticyclone system while also having shifted toward the south. Precipitation over Japan results from the dual cyclone–anticyclone system shifting southward, which favors sustained moisture-laden northerly winds from the Pacific toward Japan. The upward movement of air over Japan is favored by the concomitant cold drop centered at latitude 35° N, over Japan (phase in red in Figure 6b).
Rossby waves on 12 July 2012 at the tropopause between longitudes 60° E and 180° are represented in Figure 8. Over the tropospheric polar vortex, the Rossby wave cannot exist close to the pole because the gradient of the Coriolis frequency is zero.

3.3. Second Case Study: Heatwave in Europe (July–August 2015)

Two heatwaves hit Europe in recent decades, in July–August 2003 and July–August 2015 [60]. The first struck all of Europe, more particularly the eastern part of France and the western part of Germany, as well as North Africa. The second spared northern Europe but hit mid-latitude Europe as far as western Asia, concentrating mainly on central Europe.
As shown in Figure 9a,b, in the period range 17.1 to 34.2 days, the MA above the tropospheric polar vortex is highlighted by a zonal band (phase in magenta), centered on latitude 75° N. The polar MA is highlighted by a zonal band (phase in blue), centered on latitude 70° N, and the subtropical MA by an extensive band (phase in orange) between latitudes 30° N and 60° N. The southernmost band (phase in blue) is likely the MA above the ITCZ displaced northward over West Africa.
Whether polar or subtropical MAs, the wind speed anomalies represented in Figure 9a,b obtained by filtering the wind speed at 250 mb concern warm airflows, which are warmest on the dates indicated by their phase. The MA above the polar vortex is warmest on the reference date, the polar MA and the MA above the ITCZ are warmest 6 days before the reference date, and the subtropical MA is warmest 6 days after the reference date.
Here again, the choice of phase colors makes it possible to identify the coherence of the phenomena observed through the wind velocity anomalies, the geopotential height (Figure 9c,d), and the air temperature at the ground (Figure 9e,f). A warm airflow produces a high-pressure system and heatwave concomitantly so that the color of the phase is “preserved” from one anomaly to another. The spatial and temporal coherence between the three pairs of figures highlights the formation of a dual cyclone–anticyclone system with an early anticyclone, 6 days before the reference date (that is, a cyclone half a period later), represented by a zonal band centered on latitude 60° N (phase in blue in Figure 9c,d), which is attributable to the polar MA. A vast anticyclone forms a dozen days later, that is to say, after half a period, to the south of the previous vortex, between latitudes 30° N and 55° N (phase in orange). It is attributable to the subtropical MA.
The dual cyclone–anticyclone system results in ground air temperature anomalies being shifted southward in two stages. The earliest anticyclone (the northernmost vortex) of the dual system results in a concomitant heat dome represented by a warm arc over northern Europe (phase in blue in Figure 9e,f). The latest heat dome is represented by a warm arc south of the previous one, nearly concomitant with the latest anticyclone (the southernmost vortex) of the dual system, and the subtropical MA over southwestern and central Europe (phase in red). It extends between longitudes 20° W and 50° E and between latitudes 40° N and 60° N.

4. Discussion

These two case studies are essentially intended for the presentation of the methodological approach because other case studies are needed to ascertain the relevance of the causal relationships between the different variables. This is what we propose to do in future work by applying the method to extreme events representative of their evolution in time and space. Indeed, the method presented in this article facilitates the search for cause-and-effect relationships thanks to the joint representation of the amplitude and the phase of the different variables according to the harmonic modes. By choosing the reference date close to the date of occurrence of the extreme event, the wind speed phase indicates when the MAs are warmest or coldest. The color of the phase is “preserved” from one anomaly to another.
It now appears that, for certain harmonic modes, a temporal and spatial coherence exists between the temperature of the MAs produced by Rossby waves at the tropopause, the geopotential height, and the extreme event, whether precipitation rate or ground air temperature anomalies. We deduce that a resonance phenomenon occurs for the harmonic mode corresponding to the maximum amplitude of the speeds of the MAs at the tropopause.
But one question remains. How does the response of the troposphere to the resonant forcing in harmonic modes of Rossby waves at the tropopause result in extreme events? It seems that the formation of a dual cyclone–anticyclone system favors such events. Dual systems made up of two conjoined vortices of opposite signs have the property of reversing over a period, concomitantly with the MAs at the tropopause. There could be an air mass transfer between the high- and the low-pressure systems during the reversal process. In the case of a cold spell, an extreme event could occur if the forming anticyclonic system transfers moist air to the forming cyclonic system at the end of the inversion process. In the case of a heat wave, an extreme event could occur if the forming cyclonic system transfers warm dry air to the forming anticyclonic system at the beginning of the inversion process. In the first case, the extreme precipitation episode would result from the transfer of humid air and latent heat into the cyclonic system. In the second case, the heat dome would result from the transfer of dry air into the anticyclonic system, favoring clear skies.

5. Conclusions

In a nutshell, the main results obtained are as follows:
  • From a conceptual approach of polar and subtropical Rossby waves embedded in the jet streams, within a characteristic period range, the polar and subtropical MAs are warm or cold depending on their direction of propagation. They are generally in opposite phases. Similar stationary Rossby waves are also evidenced above the tropospheric polar vortex and, more sporadically, over the inter-tropical convergence zone (ITCZ) in the summer.
  • The Rossby waves are resonantly forced by the variations in solar irradiance due to solar declination. This assertion arises from the wavelet spectrum of harmonics of the wind velocity at 250 mb. The adjustment variable to tune the natural period of the Rossby waves to the forcing period is the meandering of the MAs. Due to the formation of cold drops according to harmonic modes, Rossby waves play an essential role in the genesis of EPEs. The duration of the blocking is a half-period of the harmonic involved.
  • Rossby waves are also evidenced above the descending air column, at the center of the tropospheric polar vortex, as well as above the ascending air column of the ITCZ.

Funding

This research received no external funding.

Institutional Review Board Statement

Not applicable.

Informed Consent Statement

Not applicable.

Data Availability Statement

No new data were created.

Conflicts of Interest

The authors declare no conflicts of interest.

References

  1. Palmer, T.N. Climate extremes and the role of dynamics. Proc. Natl. Acad. Sci. USA 2013, 110, 5281–5282. [Google Scholar] [CrossRef] [PubMed]
  2. Hoskins, B.J.; Woollings, T. Persistent extratropical regimes and climate extremes. Curr. Clim. Change Rep. 2015, 1, 115–124. [Google Scholar] [CrossRef]
  3. Wirth, V.; Riemer, M.; Chang, E.K.M.; Martius, O. Rossby wave packets on the midlatitude waveguide—A review. Mon. Weather Rev. 2018, 146, 1965–2001. [Google Scholar] [CrossRef]
  4. Holton, J.R. An Introduction to Dynamic Meteorology, 3rd ed.; Academic Press: San Diego, CA, USA, 1992; 511p. [Google Scholar]
  5. Kornhuber, K.; Coumou, D.; Vogel, E.; Lesk, C.; Donges, J.F.; Lehmann, J.; Horton, R.M. Amplified Rossby waves enhance risk of concurrent heatwaves in major breadbasket regions. Nat. Clim. Change 2019, 10, 48–53. [Google Scholar] [CrossRef]
  6. Hoskins, B.J.; McIntyre, M.E.; Robertson, A.W. On the use and significance of isentropic potential vorticity maps. Q. J. R. Meteorol. Soc. 1985, 111, 877–946. [Google Scholar] [CrossRef]
  7. Schubert, S.; Wang, H.; Suárez, M.J. Warm season subseasonal variability and climate extremes in the Northern hemisphere: The role of stationary Rossby waves. J. Clim. 2011, 24, 4773–4792. [Google Scholar] [CrossRef]
  8. Trenberth, K.E.; Fasullo, J.T. Climate extremes and climate change: The Russian heat wave and other climate extremes of 2010. J. Geophys. Res. 2012, 117, D17103. [Google Scholar] [CrossRef]
  9. Teng, H.; Branstator, G.; Wang, H.; Meehl, G.A.; Washington, W.M. Probability of US heat waves affected by a subseasonal planetary wave pattern. Nat. Geosci. 2013, 6, 1056–1061. [Google Scholar] [CrossRef]
  10. Chen, G.; Lu, J.; Burrows, D.A.; Leung, L.R. Local finite-amplitude wave activity as an objective diagnostic of midlatitude extreme weather. Geophys. Res. Lett. 2015, 42, 10952–10960. [Google Scholar] [CrossRef]
  11. Wolf, G.; Brayshaw, D.J.; Klingaman, N.P.; Czaja, A. Quasi-stationary waves and their impact on European weather and extreme events. Q. J. R. Meteorol. Soc. 2018, 144, 2431–2448. [Google Scholar] [CrossRef]
  12. Röthlisberger, M.; Frossard, L.; Bosart, L.F.; Keyser, D.; Martius, O. Recurrent synoptic scale Rossby wave patterns and their effect on the persistence of cold and hot spells. J. Clim. 2019, 32, 3207–3226. [Google Scholar] [CrossRef]
  13. Petoukhov, V.; Rahmstorf, S.; Petri, S.; Schellnhuber, H.J. Quasi-resonant amplification of planetary waves and recent Northern Hemisphere weather extremes. Proc. Natl. Acad. Sci. USA 2013, 110, 5336–5341. [Google Scholar] [CrossRef] [PubMed]
  14. Blackburn, M.; Methven, J.; Roberts, N. Large-scale context for the UK floods in summer 2007. Weather 2008, 63, 280–288. [Google Scholar] [CrossRef]
  15. Screen, J.A.; Simmonds, I. Amplified mid-latitude planetary waves favour particular regional weather extremes. Nat. Clim. Change 2014, 4, 704–709. [Google Scholar] [CrossRef]
  16. McKinnon, K.A.; Rhines, A.; Tingley, M.P.; Huybers, P. Long-lead predictions of eastern United States hot days from Pacific sea surface temperatures. Nat. Geosci. 2016, 9, 389–394. [Google Scholar] [CrossRef]
  17. Röthlisberger, M.; Pfahl, S.; Martius, O. Regional-scale jet waviness modulates the occurrence of midlatitude weather extremes. Geophys. Res. Lett. 2016, 43, 2016GL070944. [Google Scholar] [CrossRef]
  18. Rodrigues, R.R.; Woollings, T. Impact of atmospheric blocking on South America in austral summer. J. Clim. 2017, 30, 1821–1837. [Google Scholar] [CrossRef]
  19. Davis, C.A. A potential-vorticity diagnosis of the importance of initial structure and condensational heating in observed extratropical cyclogenesis. Mon. Weather Rev. 1992, 120, 2409–2428. [Google Scholar] [CrossRef]
  20. Romero, R. Sensitivity of a heavy-rain-producing western Mediterranean cyclone to embedded potential-vorticity anomalies. Q. J. R. Meteorol. Soc. 2001, 127, 2559–2597. [Google Scholar] [CrossRef]
  21. Ahmadi-Givi, F.; Graig, G.C.; Plant, R.S. The dynamics of a midlatitude cyclone with very strong latent-heat release. Q. J. R. Meteorol. Soc. 2004, 130, 295–323. [Google Scholar] [CrossRef]
  22. Romero, R. A method for quantifying the impacts and interactions of potential-vorticity anomalies in extratropical cyclones. Q. J. R. Meteorol. Soc. 2008, 134, 385–402. [Google Scholar] [CrossRef]
  23. Kim, K.-Y.; Na, H.; Jhun, J.-G. Oceanic response to midlatitude Rossby waves aloft and its feedback in the lower atmosphere in winter Northern Hemisphere. J. Geophys. Res. 2012, 117, D07110. [Google Scholar] [CrossRef]
  24. Davis, C.A.; Emanuel, K.A. Potential vorticity diagnostics of cyclogenesis. Mon. Weather Rev. 1991, 119, 1929–1953. [Google Scholar] [CrossRef]
  25. Horton, R.M.; Mankin, J.S.; Lesk, C.; Coffel, E.; Raymond, C. A review of recent Advances in research on extreme heat events. Curr. Clim. Change Rep. 2016, 2, 242–259. [Google Scholar] [CrossRef]
  26. Kornhuber, K.; Petoukhov, V.; Petri, S.; Rahmstorf, S.; Coumou, D. Evidence for wave resonance as a key mechanism for generating high-amplitude quasi-stationary waves in boreal summer. Clim. Dyn. 2017, 49, 1961–1979. [Google Scholar] [CrossRef]
  27. Petoukhov, V.; Petri, S.; Rahmstorf, S.; Coumou, D.; Kornhuber, K.; Schellnhuber, H.J. Role of quasiresonant planetary wave dynamics in recent boreal spring-to-autumn extreme events. Proc. Natl. Acad. Sci. USA 2016, 113, 6862–6867. [Google Scholar] [CrossRef] [PubMed]
  28. He, Y.; Zhu, X.; Sheng, Z.; He, M. Resonant waves play an important role in the increasing heat waves in Northern Hemisphere mid-latitudes under global warming. Geophys. Res. Lett. 2023, 50, e2023GL104839. [Google Scholar] [CrossRef]
  29. Frankignoul, C.; Müller, P. Quasi-geostrophic response of an infiniteβ-plane ocean to stochastic forcing by the atmosphere. J. Phys. Oceanogr. 1979, 9, 104–127. [Google Scholar] [CrossRef]
  30. Willebrand, J.; Philander, S.G.H.; Pacanowski, R.C. The oceanic response to large-scale atmospheric disturbances. J. Phys. Oceanogr. 1980, 10, 411–429. [Google Scholar] [CrossRef]
  31. Müller, P.; Frankignoul, C. Direct atmospheric forcing of geostrophic eddies. J. Phys. Oceanogr. 1981, 11, 287–308. [Google Scholar] [CrossRef]
  32. Stott, P.A.; Stone, D.A.; Allen, M.R. Human contribution to the European heatwave of 2003. Nature 2004, 432, 610–614. [Google Scholar] [CrossRef]
  33. Otto, F.E.L.; Massey, N.; van Oldenborgh, G.J.; Jones, R.G.; Allen, M.R. Reconciling two approaches to attribution of the 2010 Russian heat wave. Geophys. Res. Lett. 2012, 39. [Google Scholar] [CrossRef]
  34. Dong, B.; Sutton, R.T.; Shaffrey, L.C.; Wilcox, L.J. The 2015 European heat wave. Bull. Am. Meteorol. Soc. 2016, 97, S57–S62. [Google Scholar] [CrossRef]
  35. Kornhuber, K.; Osprey, S.M.; Coumou, D.; Petri, S.; Petoukhov, V.; Rahmstorf, S.; Gray, L.J. Extreme weather events in early summer 2018 connected by a recurrent hemispheric wave-7 pattern. Environ. Res. Lett. 2019, 14, 054002. [Google Scholar] [CrossRef]
  36. Mitchell, D.M.; Kornhuber, K.; Huntingford, C.; Uhe, P. The day the 2003 European heatwave record was broken. Lancet Planet. Health 2019, 3, e290–e292. [Google Scholar] [CrossRef] [PubMed]
  37. Rosner, B.; Benedict, I.; van Heerwaarden, C.; Weerts, A.; Hazeleger, W.; Bissoli, P.; Trachte, K. The long heat wave and drought in Europe in 2018 [in “State of the Climate in 2018”]. Bull. Am. Meteorol. Soc. 2019, 100, S222–S223. [Google Scholar]
  38. Vautard, R.; Yiou, P.; Otto FE, L.; Stott, P.A.; Christidis, N.; van Oldenborgh, G.J.; Schaller, N. Attribution of human-induced dynamical and thermodynamical contributions in extreme weather events. Environ. Res. Lett. 2016, 11, 114009. [Google Scholar] [CrossRef]
  39. Amengual, A.; Homar, V.; Romero, R.; Brooks, H.; Ramis, C.; Gordaliza, M.; Alonso, S. Projections of heat waves with high impact on human health in Europe. Glob. Planet. Change 2014, 119, 71–84. [Google Scholar] [CrossRef]
  40. Field, C.B.; Barros, V.; Stocker, T.F.; Qin, D.; Dokken, D.J.; Ebi, K.L.; Mastrandrea, M.D.; Mach, K.J.; Plattner, G.-K.; Allen, S.K.; et al. (Eds.) Managing the Risks of Extreme Events and Disasters to Advance Climate Change Adaptation; Cambridge University Press: Cambridge, UK, 2012; 582p. [Google Scholar]
  41. King, A.D.; Harrington, L.J. The inequality of climate change from 1.5 to 2 °C of global warming. Geophys. Res. Lett. 2018, 45, 5030–5033. [Google Scholar] [CrossRef]
  42. Perkins-Kirkpatrick, S.E.; Lewis, S.C. Increasing trends in regional heatwaves. Nat. Commun. 2020, 11, 3357. [Google Scholar] [CrossRef]
  43. Rogers, C.D.W.; Kornhuber, K.; Perkins-Kirkpatrick, S.E.; Loikith, P.C.; Singh, D. Six-fold increase in historical Northern Hemisphere concurrent large heatwaves driven by warming and changing atmospheric circulations. J. Clim. 2021, 35, 1063–1078. [Google Scholar] [CrossRef]
  44. Chan, P.W.; Catto, J.L.; Collins, M. Heatwave–blocking relation change likely dominates over decrease in blocking frequency under global warming. Npj Clim. Atmos. Sci. 2022, 5, 68. [Google Scholar] [CrossRef]
  45. Ogi, M.; Yamazaki, K.; Tachibana, Y. The summer northern annular mode and abnormal summer weather in 2003. Geophys. Res. Lett. 2005, 32, L04706. [Google Scholar] [CrossRef]
  46. Tachibana, Y.; Nakamura, T.; Komiya, H.; Takahashi, M. Abrupt evolution of the summer Northern Hemisphere annular mode and its association with blocking. J. Geophys. Res. 2010, 115, D12125. [Google Scholar] [CrossRef]
  47. Xu, P.; Wang, L.; Vallis, G.K.; Geen, R.; Screen, J.A.; Wu, P.; Ding, S.; Huang, P.; Chen, W. Amplified waveguide teleconnections along the polar front jet favor summer temperature extremes over Northern Eurasia. Geophys. Res. Lett. 2021, 48, e2021GL093735. [Google Scholar] [CrossRef]
  48. Xu, P.; Wang, L.; Huang, P.; Chen, W. Disentangling dynamical and thermodynamical contributions to the record-breaking heatwave over Central Europe in June 2019. Atmos. Res. 2021, 252, 105446. [Google Scholar] [CrossRef]
  49. White, R.H.; Kornhuber, K.; Martius, O.; Wirth, V. From Atmospheric Waves to Heatwaves a Waveguide Perspective for Understanding and Predicting Concurrent, Persistent, and Extreme Extratropical Weather. Am. Meteorol. Soc. 2022, 103, E923–E935. [Google Scholar] [CrossRef]
  50. Kanamitsu, M.; Ebisuzaki, W.; Woollen, J.; Yang, S.-K.; Hnilo, J.J.; Fiorino, M.; Potter, G.L. NCEP-DOE AMIP-II Reanalysis (R-2). Bull. Am. Meteorol. Soc. 2002, 83, 1631–1643. [Google Scholar] [CrossRef]
  51. Pinault, J.-L. Long Wave Resonance in Tropical Oceans and Implications on Climate: The Atlantic Ocean. Pure Appl. Geophys. 2013, 170, 1913–1930. [Google Scholar] [CrossRef]
  52. Available online: https://www.weatherandradar.co.uk/weather-news/weather-explained-video-what-is-a-cold-drop--7zpm19glZwvxDiTfYroIlJ (accessed on 13 May 2024).
  53. Nie, J.; Sobel, A.H.; Shaevitz, D.A.; Wang, S. Dynamic amplification of extreme precipitation sensitivity. Proc. Natl. Acad. Sci. USA 2018, 115, 9467–9472. [Google Scholar] [CrossRef]
  54. Pinault, J.-L. Resonance of baroclinic waves in the tropical oceans: The Indian Ocean and the far western Pacific. Dyn. Atmos. Ocean. 2020, 89, 101119. [Google Scholar] [CrossRef]
  55. Pinault, J.-L. A Review of the Role of the Oceanic Rossby Waves in Climate Variability. J. Mar. Sci. Eng. 2022, 10, 493. [Google Scholar] [CrossRef]
  56. Gill, A.E. Atmosphere-Ocean Dynamics; International Geophysics Series; Academic Press: Cambridge, MA, USA, 1982; 662p. [Google Scholar]
  57. Pinault, J.-L. Resonantly Forced Baroclinic Waves in the Oceans: Harmonic Modes. J. Mar. Sci. Eng. 2018, 6, 78. [Google Scholar] [CrossRef]
  58. Choi, M.Y.; Thouless, D.J. Topological interpretation of subharmonic mode locking in coupled oscillators with inertia. Phys. Rev. B 2001, 64, 014305. [Google Scholar] [CrossRef]
  59. Duan, W.; Bin, H.; Kaoru, T.; Pingping, L.; Daniel, N.; Yosuke, Y.; Wenrui, H. Anomalous atmospheric events leading to Kyushu’s flash floods, July 11–14, 2012. Nat. Hazards 2014, 73, 1255–1267. [Google Scholar] [CrossRef]
  60. Muthers, S.; Gudrun Laschewski, G.; Matzarakis, A. The Summers 2003 and 2015 in South-West Germany: Heatwaves and Heat-Related Mortality in the Context of Climate Change. Atmosphere 2017, 8, 224. [Google Scholar] [CrossRef]
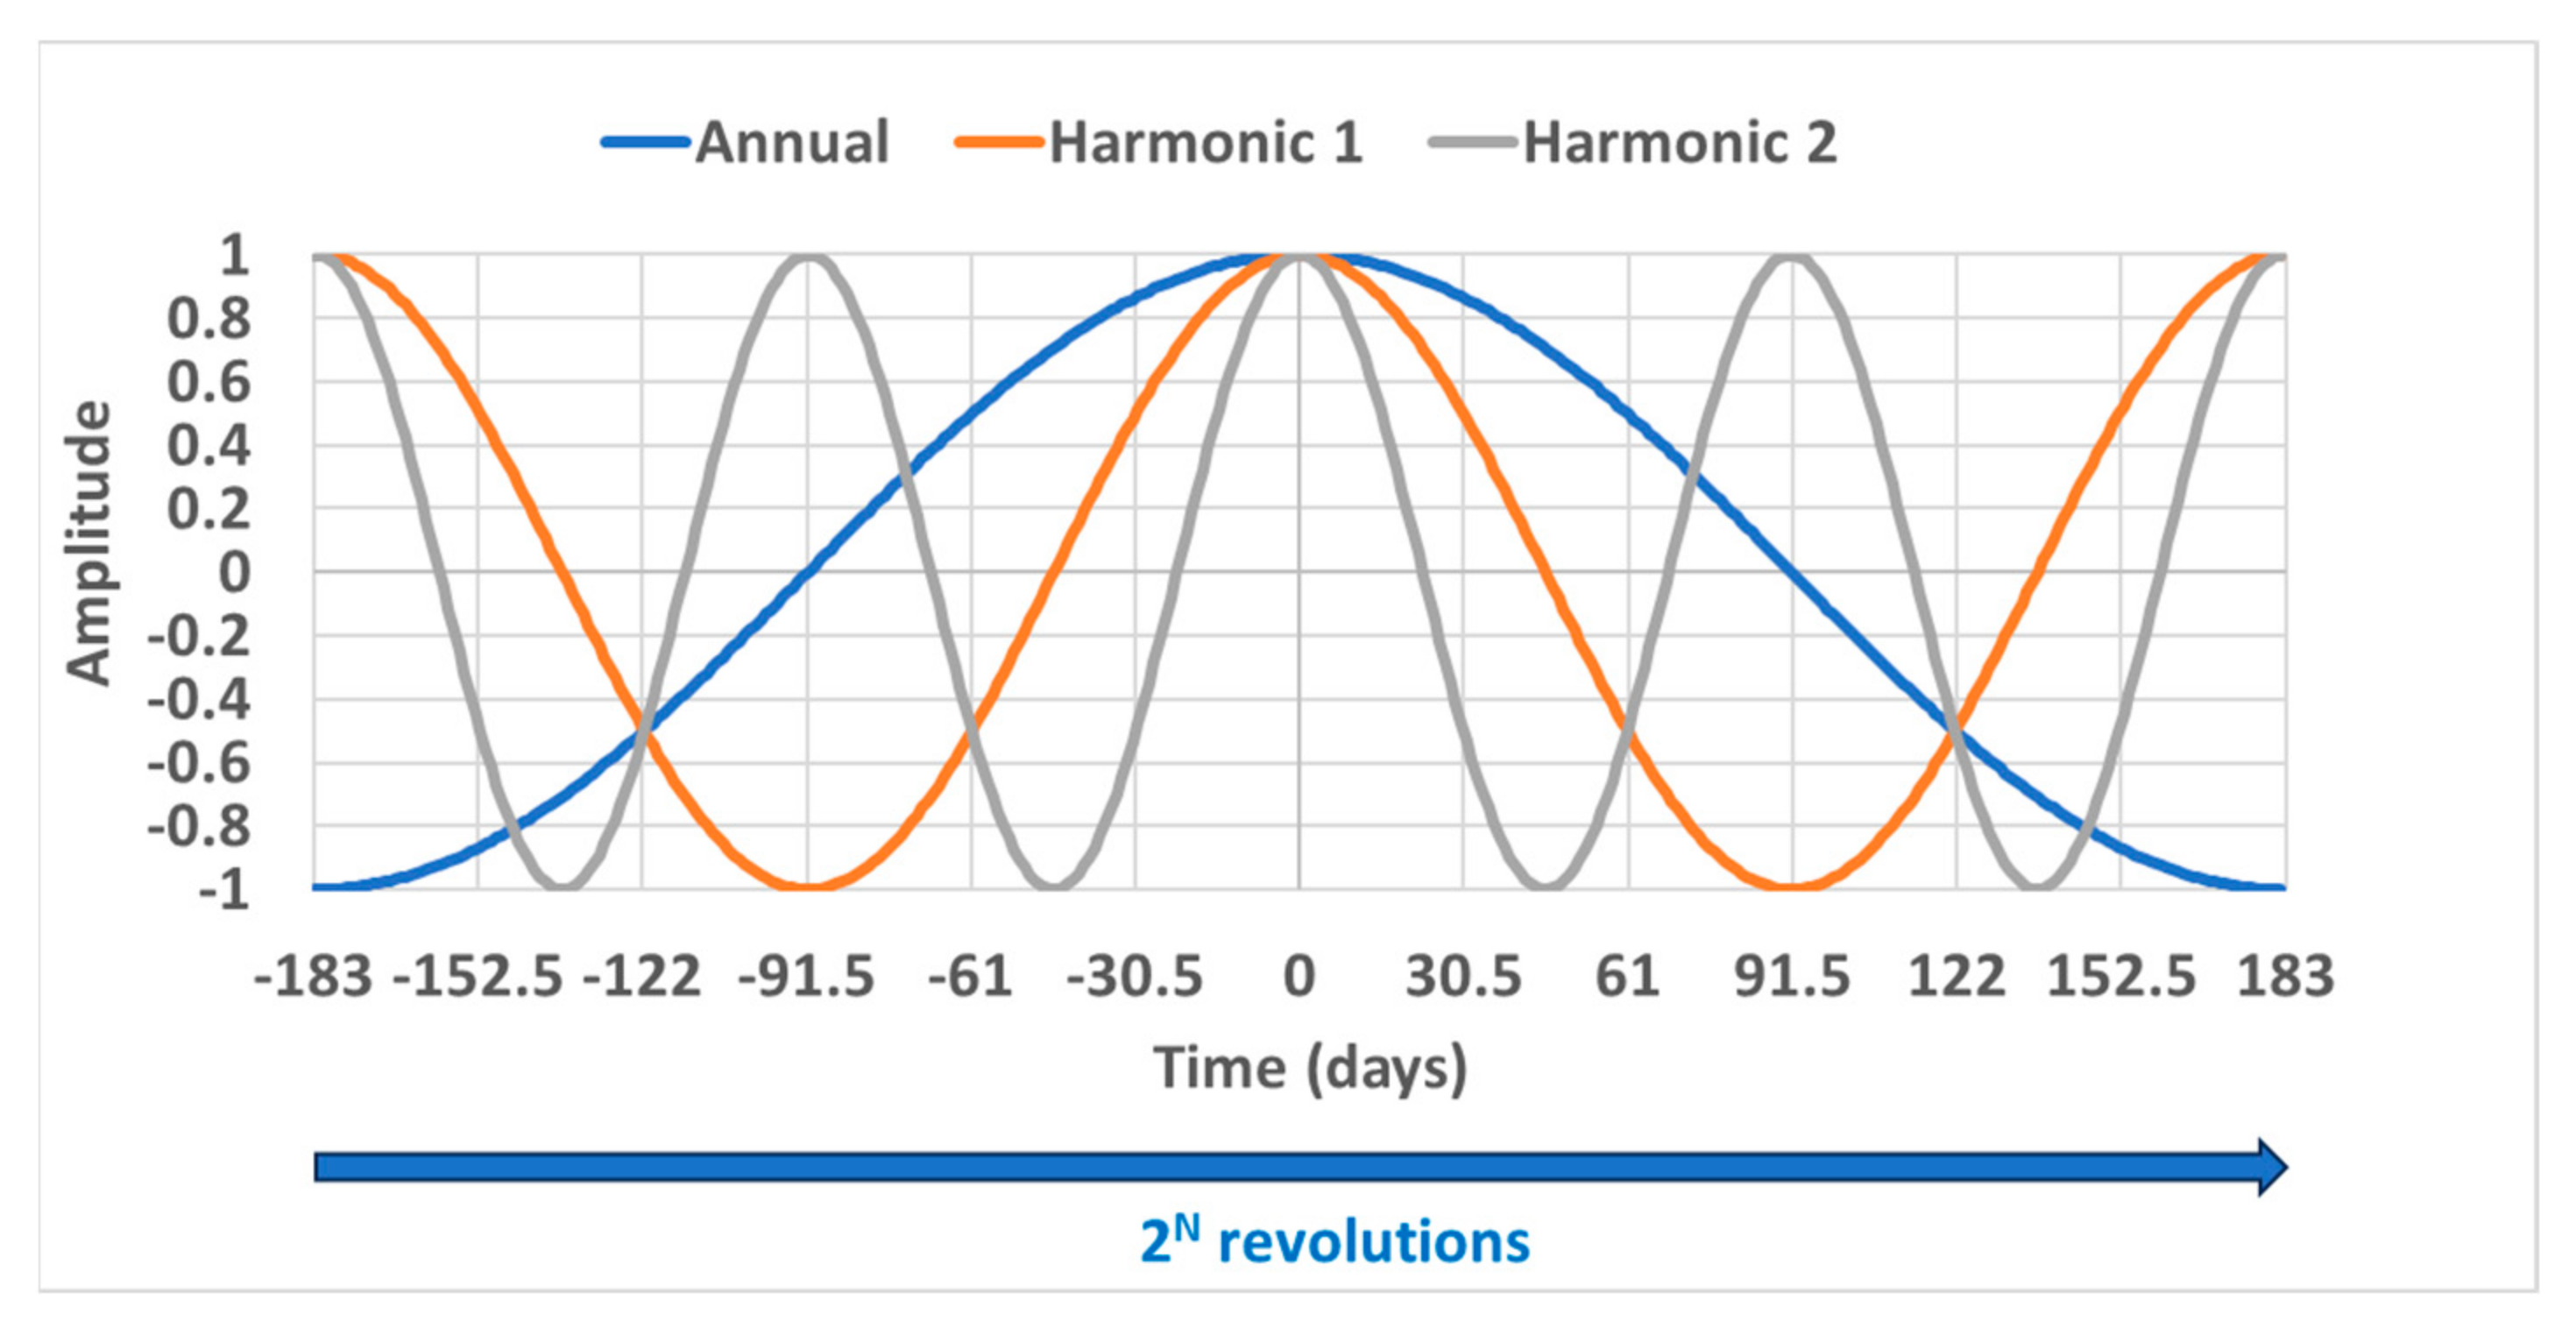
Figure 1. The amplitude of the Rossby waves according to the number of elapsed days expressed in relation to a reference date. Only the 1-, 1/2-, and 1/4-year-period waves are considered. The amplitude scale is arbitrary.
Atmosphere 15 00608 g001
Figure 2. Representation of the harmonic of the annual quasi-stationary Rossby wave whose apparent wavelength corresponds to one revolution. The red arrows represent the vertical motion of the interface at the antinodes and the brown arrows represent the velocity of the modulated airflows, which reverse at the antinodes. (a,b) represent two opposite phases occurring during a period.
Atmosphere 15 00608 g002
Figure 3. Wind velocity at 250 mb in northern hemisphere, on 6 June 2005, in period ranges 274 to 548 days (a,b), 137 to 274 days (c,d), and 68 to 137 days (e,f). Amplitudes (speed anomalies in m/s regardless of their date of occurrence) in (a,c,e) and phases (time shift of speed anomalies relative to 6 June 2005) in (b,d,f).
Atmosphere 15 00608 g003
Figure 4. Fourier spectrum and confidence level of the wind velocity at 250 mb from 1 January 1979 to 31 July 2023, averaged in the region [2.5W,10E] × [50N,60N].
Atmosphere 15 00608 g004
Figure 5. Wind velocity at 250 mb in southern hemisphere, on 13 January 2011, in period ranges 274 to 548 days (a,b), 137 to 274 days (c,d), and 68 to 137 days (e,f). Amplitudes (m/s) in (a,c,e), and phases (time shift relative to 13 January 2011) in (b,d,f).
Atmosphere 15 00608 g005
Figure 6. The wind velocity at 250 mb (a,b), geopotential height at 500 mb (c,d), and precipitation rate (e,f) on 12 July 2012: (a,c,e) amplitude and (b,d,f) phase. The wind speed phase (b) indicates when the modulated airflows are coldest. The scale of the amplitudes of the geopotential height is referring to negative anomalies.
Atmosphere 15 00608 g006
Figure 7. The wind velocity at 200 mb (a,b) on 12 July 2012: (a) amplitude and (b) phase. The wind speed phase (b) indicates when the modulated airflows are coldest.
Atmosphere 15 00608 g007
Figure 8. The cross-section of the Rossby waves at the tropopause of the northern hemisphere vs. latitude.
Atmosphere 15 00608 g008
Figure 9. The wind velocity at 250 mb (a,b), geopotential height at 500 mb, and air temperature 2 m above the ground on 12 August 2015 in the period range 17.1 to 34.2 days: (a,c,e) amplitude and (b,d,f) phase. The wind speed phase (b) indicates when the modulated airflows are warmest. The scale of the amplitudes of the geopotential height is referring to positive anomalies.
Atmosphere 15 00608 g009
Table 1. The mean period and period ranges of the harmonics represented in the figures.
Mean PeriodPeriod Range
1/8 year (45.7 days)34.2 to 68 days
1/16 year (22.8 days)17.1 to 34.2 days
1/32 year (11.4 days)8.56 to 17.1 days
1/64 year (5.7 days)4.28 to 8.56 days
Disclaimer/Publisher’s Note: The statements, opinions and data contained in all publications are solely those of the individual author(s) and contributor(s) and not of MDPI and/or the editor(s). MDPI and/or the editor(s) disclaim responsibility for any injury to people or property resulting from any ideas, methods, instructions or products referred to in the content.