Error in Figure
In the original publication [1], there was a mistake in Figure 5 as it was published. There was an error in the code, which affected the analysis of the layers in the temporal dimension of the ACCESS-S2 FBI hindcast dataset for the week of 25th of November 2015. This affected the displayed dynamical forecast probability of top-decile FBI in that week, limiting the forecast output to one ensemble member and a two-week lead time only. The corrected Figure 5 appears below, incorporating the full three ensemble members at both two- and three-week hindcast lead times.
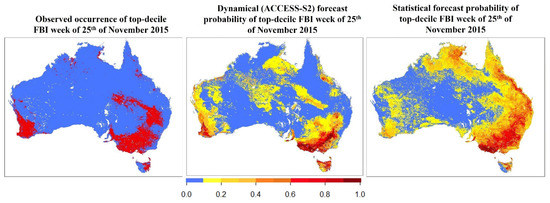
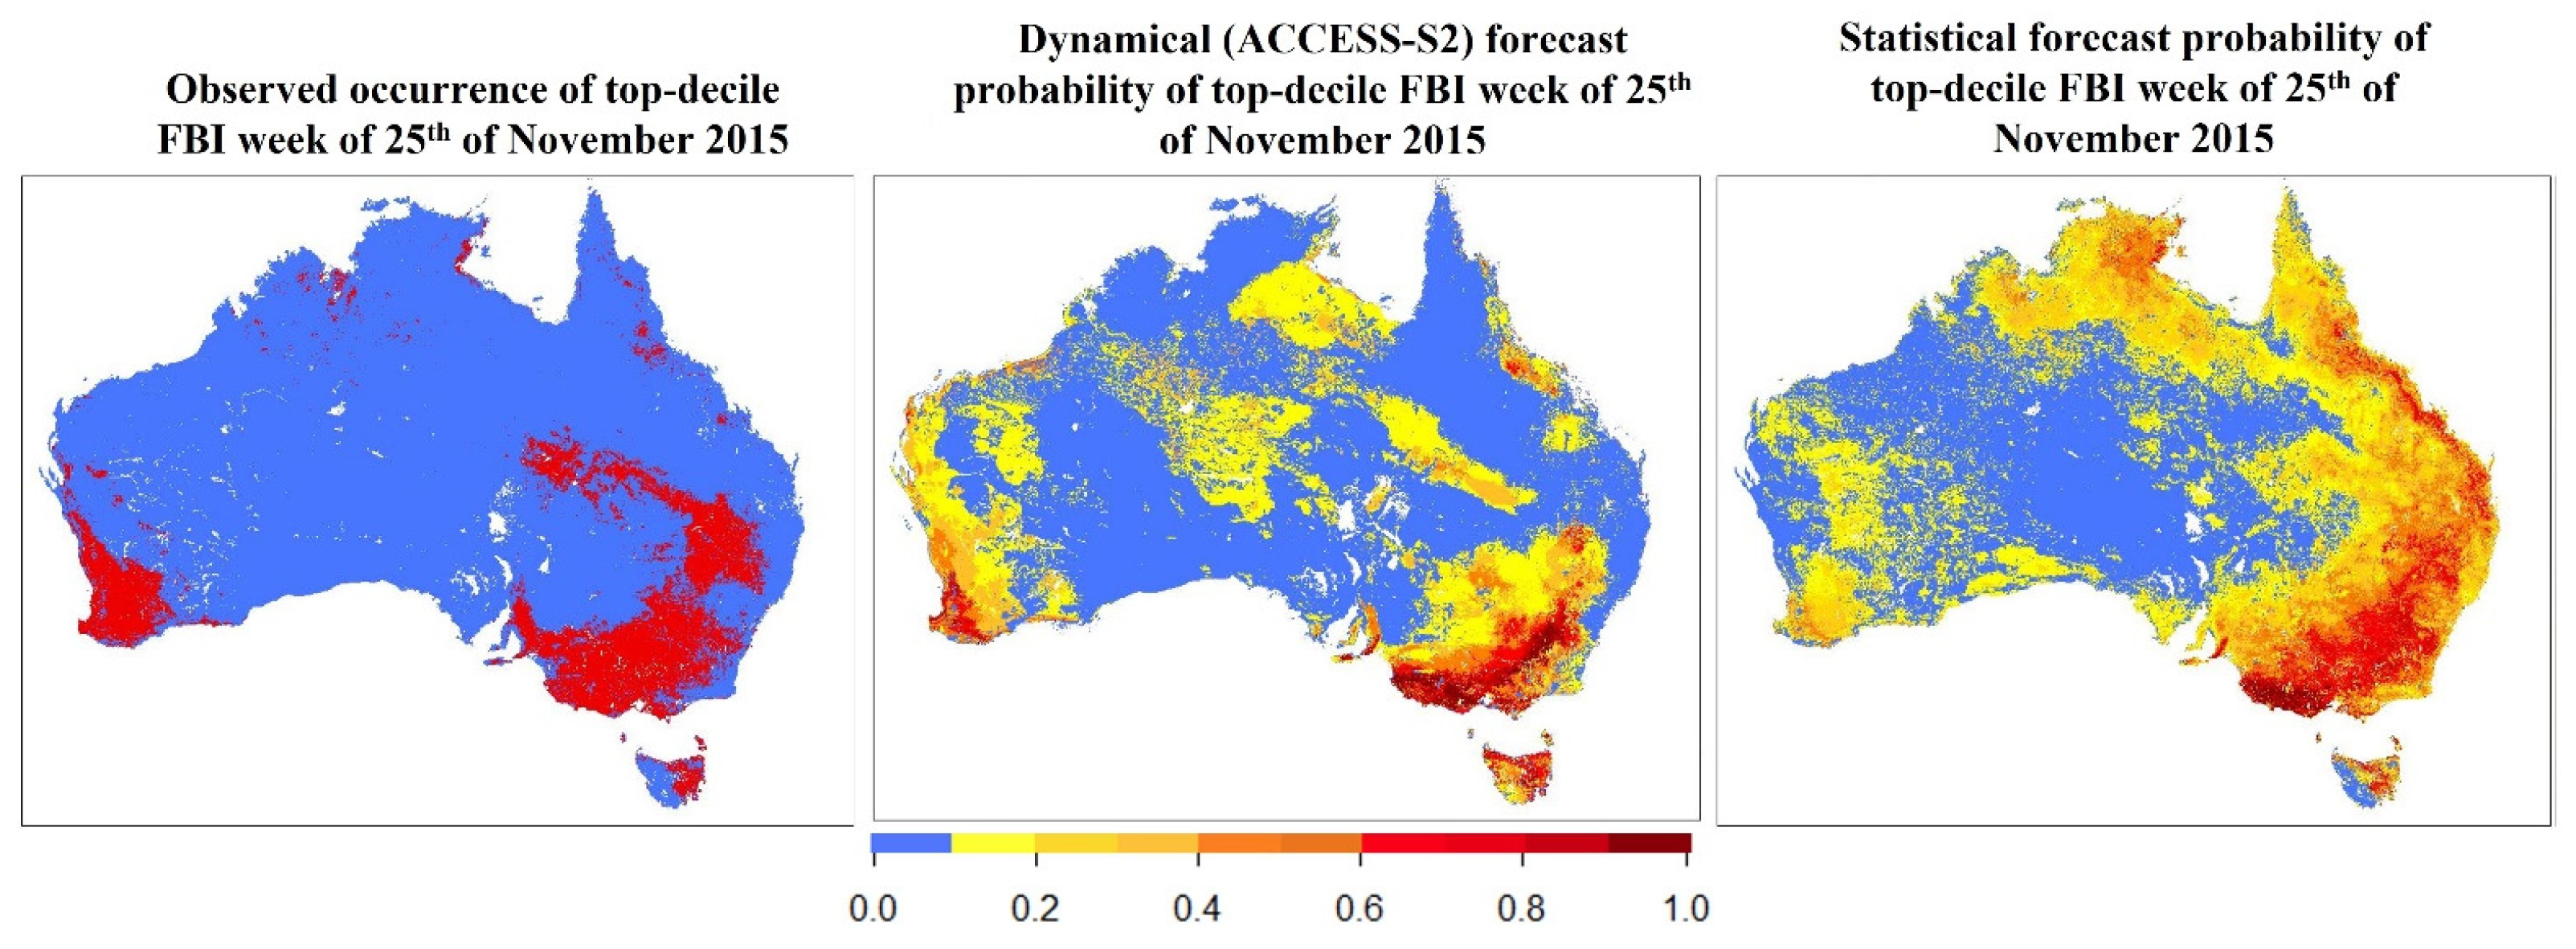
Figure 5.
Observed occurrence and forecasted probability of 90th percentile FBI for the week of 25 November 2015.
Error in Table
In the original publication, there was a mistake in Table 5 as it was published, due to the error in Figure 5 described above. The contingency table (Table 5) for the dynamical model has been corrected below.

Table 5.
Contingency table, accuracy, probability of detection, and false alarm ratio for dynamical (ACCESS-S2) and statistical models on week of 25 November 2015 over Australia.
Text Correction
Due to the aforementioned errors in Figure 5 and Table 5, the discussion of the performance of the dynamical model was inaccurate. A correction has been made to Results, Section 3.3 Pinery Fire, paragraphs 1 and 2.
There is a discrepancy between the dynamical and statistical forecasts of the extreme FBI probability in the week of the Pinery fire case study (Figure 5). The statistical forecast model indicates a very high likelihood of extreme FBI in the southeast of Australia and up the east coast. In some locations, this likelihood is greater than 0.9. Increased chances of extreme FBI are also forecast in northern Australia and the southwest. In contrast, the dynamical model indicates higher chances of extreme FBI being most likely in southeast Australia, southwest western Australia and Tasmania, with limited probability of extreme fire danger elsewhere. Both models capture the increase in the probability of extreme FBI in the regions north of Adelaide, which were impacted at the WUI by the fire event, and in southwest Australia, which was impacted by fires in the preceding week [89]. The statistical model clearly highlights the risk of high FBI in southeast Australia in the region of the fires, as well as the observed signal through eastern Tasmania, eastern NSW and southern QLD. However, it substantially overpredicts the chance of severe FBI, particularly in QLD and northern Australia, where it was not observed. In this case, both models capture different elements of the observed spatial distribution of extreme FBI, highlighting the value of having more than one forecasting method for such events.
The differences described above are represented in the contingency tables for the statistical and dynamical models (Table 5). The accuracy of the dynamical model is higher than that of the statistical model. This can be partially attributed to the higher proportion of correct negatives, while it can be seen that the statistical model displays more hits and fewer misses. The false alarm ratio is once again higher in the statistical model, but not by a large margin, while the probability of detection is far higher in the statistical model as opposed to the dynamical forecast. As we discuss in Section 4, this discrepancy can highlight the importance of assessing more than one model’s output for a fire danger forecast, particularly when operational agencies are aware in advance that extreme conditions are likely [90].
The authors state that the scientific conclusions are unaffected. This correction was approved by the Academic Editor. The original publication has also been updated.
Reference
- Taylor, R.; Marshall, A.G.; Crimp, S.; Cary, G.J.; Harris, S. A Statistical Forecasting Model for Extremes of the Fire Behaviour Index in Australia. Atmosphere 2024, 15, 470. [Google Scholar] [CrossRef]
Disclaimer/Publisher’s Note: The statements, opinions and data contained in all publications are solely those of the individual author(s) and contributor(s) and not of MDPI and/or the editor(s). MDPI and/or the editor(s) disclaim responsibility for any injury to people or property resulting from any ideas, methods, instructions or products referred to in the content. |
© 2024 by the authors. Licensee MDPI, Basel, Switzerland. This article is an open access article distributed under the terms and conditions of the Creative Commons Attribution (CC BY) license (https://creativecommons.org/licenses/by/4.0/).