Article

Study on the Influence of the Cell Structure on the Pressure Drop of Gasoline Particulate Filter

1
School of Mechanics and Transportation, Southwest Forestry University, Kunming 650224, China
2
Dehong Vocational College, Dehong 678400, China
*
Author to whom correspondence should be addressed.
Atmosphere 2024, 15(7), 805; https://doi.org/10.3390/atmos15070805
Submission received: 25 January 2024 / Revised: 15 April 2024 / Accepted: 2 July 2024 / Published: 4 July 2024
(This article belongs to the Section Air Pollution Control)

Abstract

:
The cell structure of a gasoline particulate filter (GPF) is made up of thousands of individual cells. Although the symmetric square cell structure of the GPF is commonly used internationally, several cell designs have been proposed to reduce the pressure drop in the GPF trapping process. The aim of this paper was to use AVL-Fire software to establish GPF models of different cell structures, mainly including the symmetric square cell structure, asymmetric square cell structure, and symmetric hexagonal cell structure, and analyze the GPF pressure drop characteristics of different cell structures according to the carrier structural parameters and altitude. The results show that compared with the pressure drop of the symmetric square cell structure, the pressure drop of the asymmetric cell structure with inlet/outlet side length ratios ranging from 1.1 to 1.4 is decreased by 4.61%, 9.07%, 12.19%, and 13.22%, respectively, and the pressure drop of the symmetric hexagonal cell structure is decreased by 33.17%. Both asymmetric and symmetric hexagonal cell structure GPFs can decrease the pressure drop during trapping by increasing the cell density. From 200 CPSI to 300 CPSI, the pressure drop of the asymmetric cell structure with inlet/outlet side length ratios ranging from 1.1 to 1.4 is decreased by 20.43%, 20.53%, 20.39%, and 18.56%, respectively, and the pressure drop of the symmetric hexagonal cell structure is decreased by 18.70%. The pressure drop values of GPFs with asymmetric and symmetric hexagonal cell structures show an increasing trend with an increasing filter wall thickness and inlet/outlet plug length. The pressure drop values of GPFs with asymmetric and symmetric hexagonal cell structures show an increasing trend with an increasing altitude, and the larger the inlet/outlet ratio, the more significant the increase in the pressure drop.

1. Introduction

With the realization that the particulate matter in the exhaust of internal combustion locomotives has caused great harm to human health and the ecological environment [1,2], regulatory bodies around the world have imposed limits on particle emissions from internal combustion locomotives, with Europe and China proposing regulatory limits for particle number (PN) of 6 × 10¹¹#/km [3,4]. Meanwhile, a Gasoline Direct Injection (GDI), an engine technology that injects fuel directly into the cylinder, has been widely promoted because of its higher combustion efficiency and power output compared to port fuel injection (PFI) gasoline engines [5,6]. The combustion pattern of GDI engines results in wet-walls and uneven gas mixtures in the engine cylinder, which increase the production and emission of particulate matter and thus fail to meet the requirements of the emission regulations [7,8]. In order to comply with stricter regulations, additional emission control devices are required for GDI engines. The application of a gasoline particulate filter (GPF) has been found to be effective in reducing particulate emissions from GDI engines, and is one of the most effective aftertreatment methods available, thus attracting widespread attention [9,10].
In recent years, gasoline particulate filters have become increasingly popular in GDI engines [11,12]. During the application process, it was found that the exhaust backpressure brought about by GPF technology in the exhaust system is an important factor affecting engine performance [13]. This is due to the fact that particulate deposits cause a rise in the GPF pressure drop, which is too high and leads to a reduction in engine efficiency, which in turn affects the power performance and fuel economy [14]. Therefore, in order to reduce the pressure drop of the GPF to the maximum, reduce the fuel consumption, and thus reduce the CO2 and particle emissions, many scholars have carried out a lot of research. Saito et al. measured the pressure drop at different wall thicknesses and different opening areas using a cold flow bench as the measuring device and found that the GPF structural parameter increased from 12 mil/300 CPSI to 5 mil/360 CPSI with an increase in the opening area from 31% to 41%, and the value of the pressure drop was reduced by about 50% [15]. Ito et al. verified the performance of GPF by the whole vehicle test, and it was found that under the same wall thickness and 0.3 g/L soot loading, the pressure drop showed a de-creasing trend with the increase of the GPF’s cell density [16]. Zuo et al. investigated the effect of four structural parameters on the pressure drop of petrol particulate filters and found that the cell density, wall thickness, wall length, and permeability can change the resistance to the flow inside the GPF and thus the pressure drop, changing the values of the cell density, wall thickness, length, and permeability. The maximum decrements in the pressure drop are 54.3%, 47.5%, 27.9%, and 27.3%, respectively [17]. Niu et al. used AVL-Fire software to establish a GPF pressure drop model, and studied the effects of the cell density and carrier length on the pressure drop characteristics. The simulation results show that increasing the cell density and carrier length will make the pressure drop before and after the GPF becomes larger [18]. Kannan et al., to understand the pressure drop characteristics of a GPF under clean, soot, and ash loading conditions through experiments conducted on an engine dynamometer and vehicle, and then using the obtained test data, built a numerical model to estimate the pressure drop at different operating conditions; the results show a maximum of 2.15 kPa at a 4.05 g soot load [19]. Ito et al. conducted a study around the effect of parameters such as the porosity and average pore size on the exhaust back pressure of GPFs, which showed that the use of materials with a porosity greater than 60% and a larger cross-sectional area of the openings resulted in a smaller exhaust back pressure, and the larger the average pore size, the smaller the pressure drop [20]. Shimoda et al. studied GPFs designed with low backpressure and found that the ratio of the filter length to diameter (L/D) had a significant effect on the pressure drop, which was reduced by 52% when L/D was reduced from 1.1 to 0.6 [21].
In summary, professional scholars have analyzed the influence of structural parameters on the pressure drop of GPFs, and the studies mainly focus on the symmetric square cell structure. At present, such GPFs that have specially shaped cells have been realized in advance of the manufacturing technologies. However, the current studies have not comprehensively analyzed the effects of different cell structures on the pressure drop characteristics of GPFs. In addition, in previous studies, researchers paid more attention to the effect of structural parameters on the pressure drop and neglected the effect of the external factor altitude on the pressure drop of GPFs, which led to the inability to fully understand the effect. In this study, a CFD mathematical model of a GPF is developed using AVL-Fire 2020 software to investigate the effect of different GPF cell structures on the pressure drop characteristics. Based on the predecessors, the GPF models of a symmetric square cell structure, symmetric hexagonal cell structure, and asymmetric square cell structure were established by numerical simulations, and the effects of the cell structure on the pressure drop of the GPF were analyzed by combining the cell density, wall thickness, inlet and outlet plug lengths, and altitude. This provides reference significance for the development and optimization of GPF technology in the future.

2. Materials and Methods

2.1. Mathematical Model

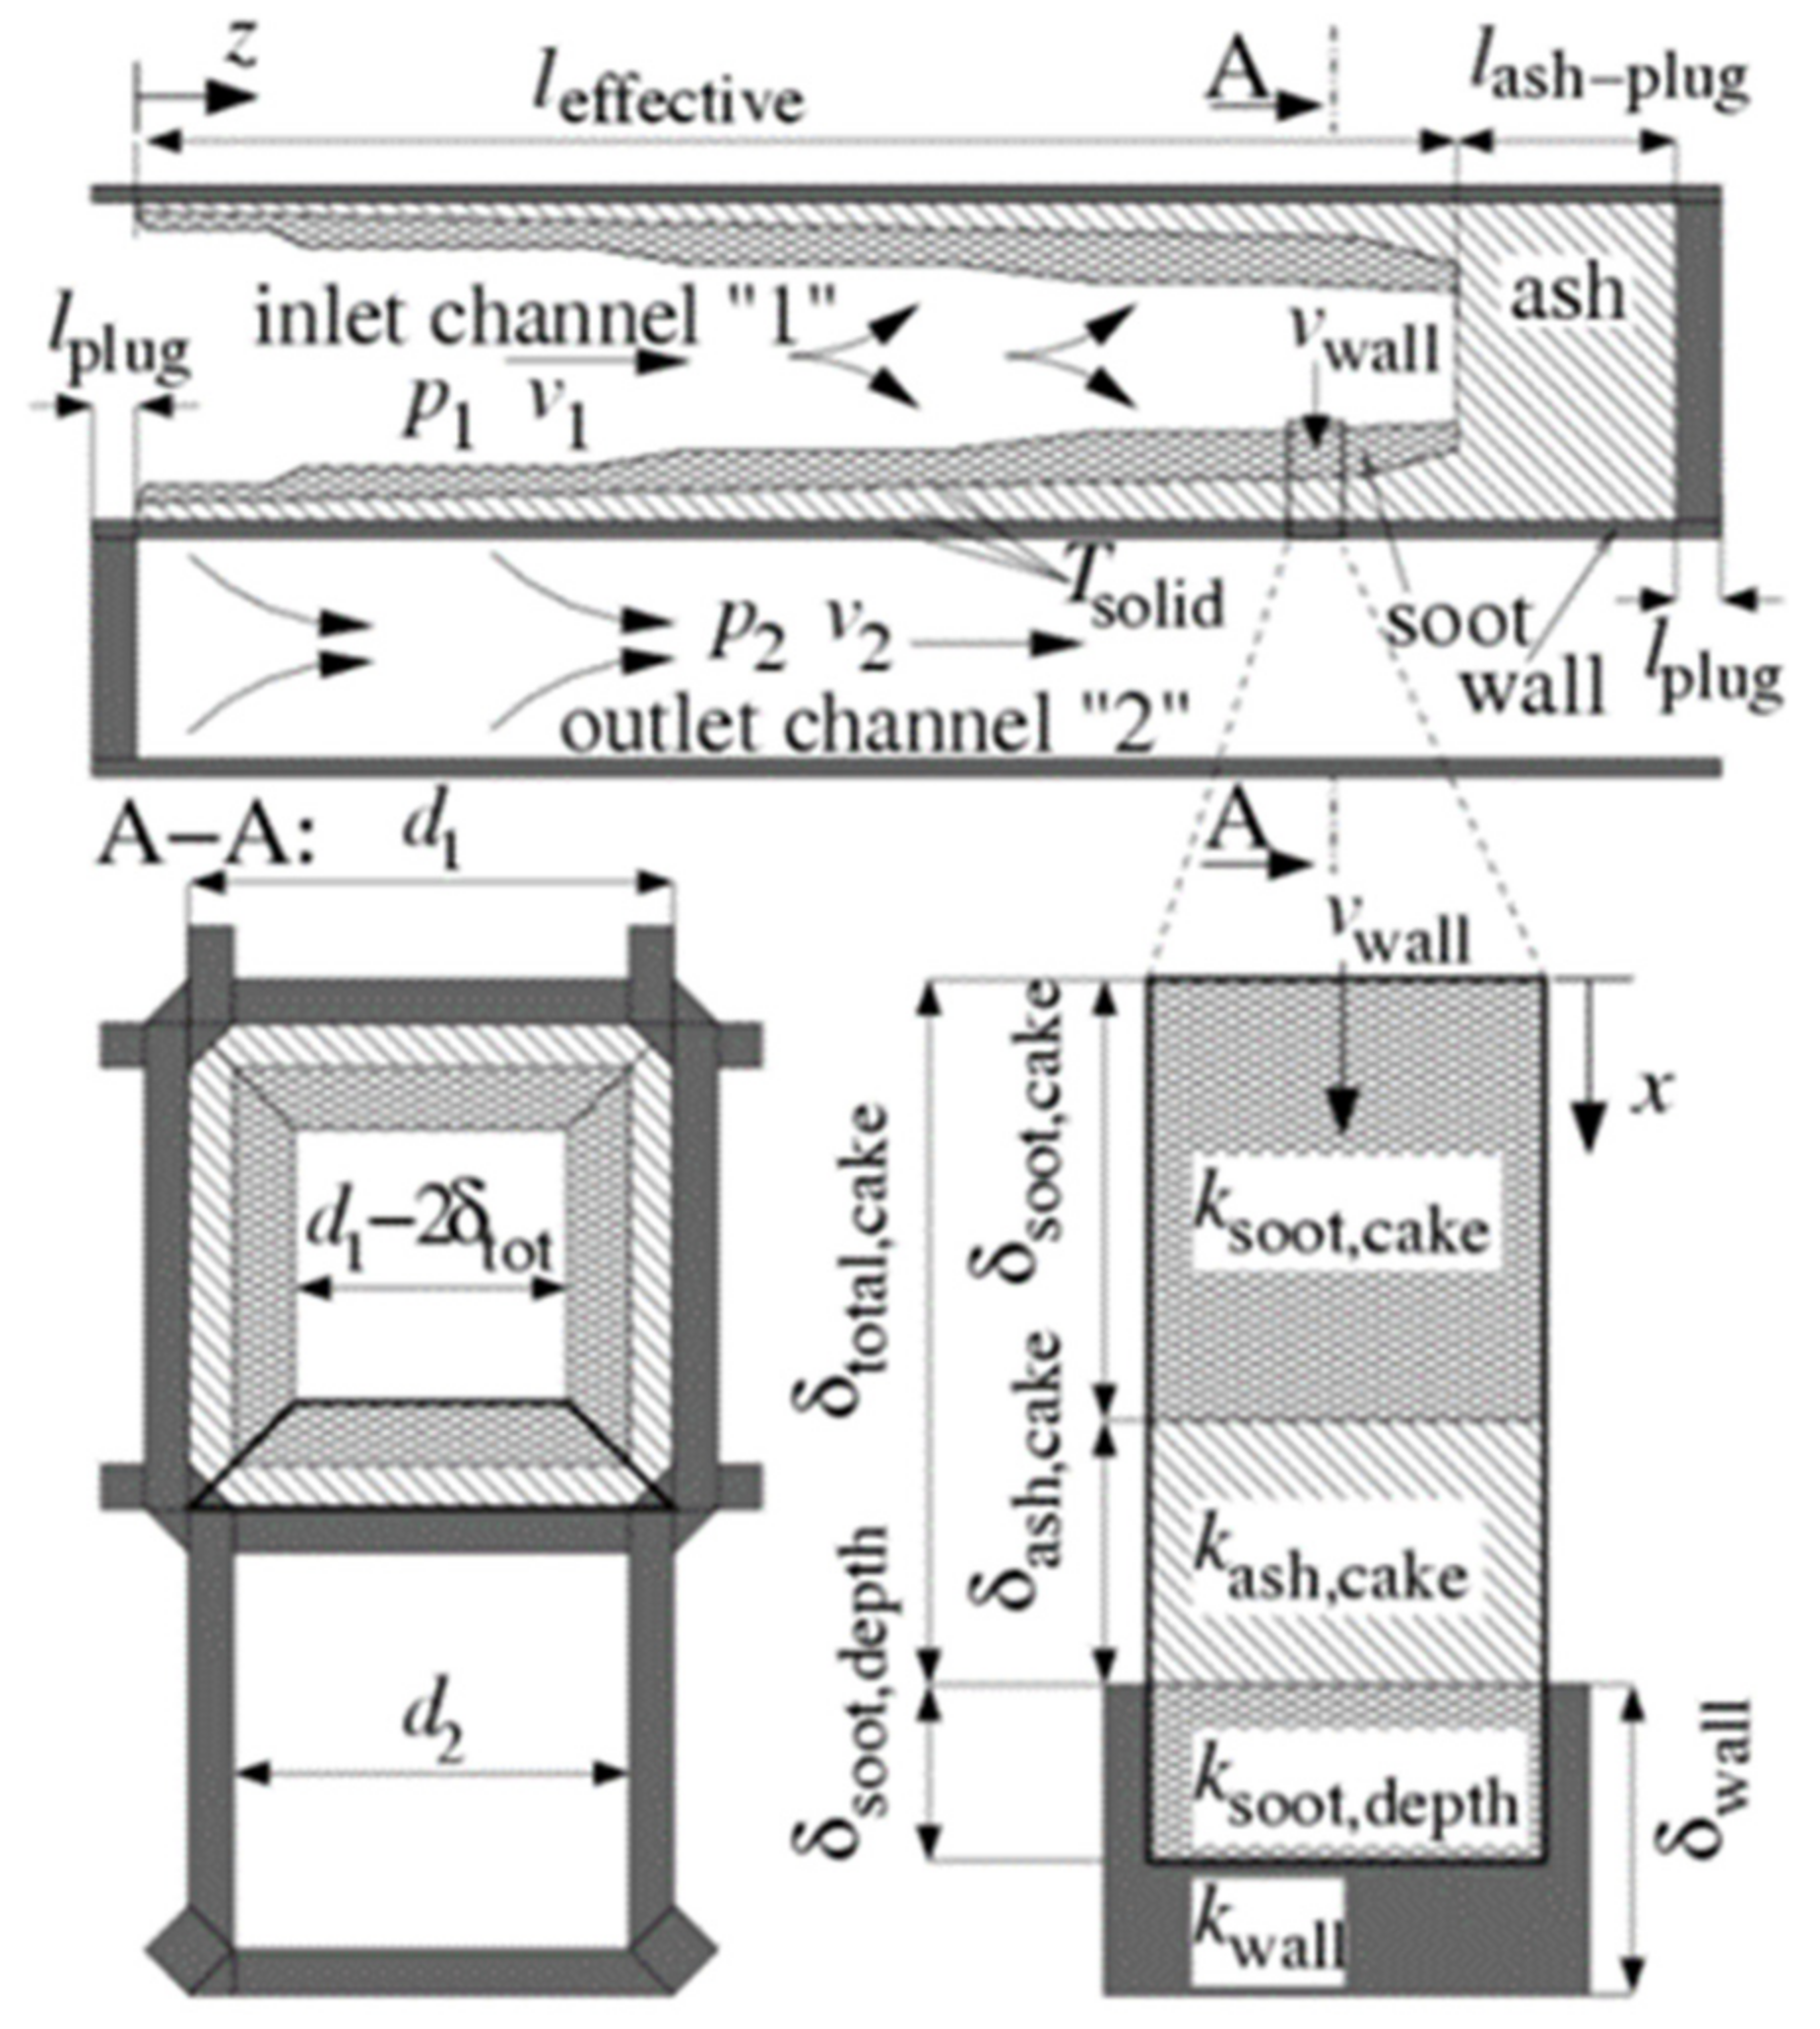
2.1.1. GPF Internal Flow Field Model

As shown in Figure 1, the wall-flow GPF has an exhaust inlet and outlet channel, where the engine exhaust flows into inlet channel 1 and then through the wall, which has a porous medium, into outlet channel 2, and the carbon soot particulate matter is deposited within the wall. The carbon soot particles are trapped in the GPF’s filter channel by deep filtration and soot cake filtration, respectively. The deep filtration layer is deposited on the inside of the filter channel media, while the soot cake layer builds up on the surface [22].
The flow model of the GPF’s internal fluid (inlet and outlet channels) is based on the one-dimensional steady-state continuity equation and Momentum equation [23]:
d d z ρ g , 1 · v g , 1 · A F , 1 = ρ g , 1 · v w , 1 · A S , 1
d d z ρ g , 2 · v g , 2 · A F , 2 = ρ g , 2 · v w , 2 · A S , 2
where ρ g , i is the density of the gas phase in kg·m−3 (when i = 1, it is denoted as the gas phase density of the inlet channel, and when i = 2, it is denoted as the gas phase density of the outlet channel); A F , i represents the free channel cross section that is available for the gas flow in m2; v w , i represents the wall velocity lateral to the axial direction in m·s−1; A S , i is the wet perimeter of the free channel cross section of the channel in m; and v g , i is the gas velocity in m·s−1.
The momentum conservation equation of the GPF is expressed as follows:
d d z ρ g , 1 · v g , 1 2 · A F , 1 = A F , 1 · d p g , 1 d z v g , 1 · F 1 · μ + ρ g , 1 · v w , 1 · A S , 1
d d z ρ g , 2 · v g , 2 2 · A F , 2 = A F , 2 · d p g , 2 d z v g , 2 · F 2 · μ
where p g , i is the pressure in the filter channel in Pa (when i = 1, it is denoted as the gas pressure in the inlet channel, and when i = 2, it is denoted as the gas pressure in the outlet channel); F i is the friction loss coefficient of the channel air flow; and μ is dynamic viscosity coefficient in Pa·s.
Wall flow rate:
v w , 2 ( x ) = v w , 1 · d 1 2 δ s c d 1 · ρ g , 1 ρ g , 2

2.1.2. GPF Internal Pressure Drop Model

The important basis for the realization of GPF technology is its own pressure drop. The pressure drop at the front and rear ends of the GPF is used to evaluate the regenerative equilibrium state of the GPF, so the study of the GPF pressure drop model is of great significance to the efficiency and optimization of the GPF. The GPF pressure drop mainly comes from the flow resistances when the exhaust flows through the filter wall, the soot layer in the filter wall, the soot cake layer, and the ash cake layer. The GPF pressure drop model used in this paper is based on the definition of a pressure drop in porous media in Darcy’s law [24], and the inlet/outlet pressure drop model is shown in the following equation:
P g , 1 P g , 2 = Δ P w + Δ P s d + Δ P a c + Δ P s c
Wall pressure drop:
Δ P w = v w , 1 · μ · d 1 2 δ s c d 1 · δ w k w
Depth filtration layer pressure drop:
Δ P s d = v w , 1 · μ · d 1 2 δ s c d 1 · δ s d k s d
Ash cake layer pressure drop:
Δ P a c = v w , 1 · μ · d 1 2 δ s c d 1 · δ a c k a c
Soot cake layer pressure drop:
Δ P s c = v w , 1 · μ · d 1 2 δ s c d 1 · d 1 2 k s c · ln d 1 d 1 2 δ s c
where Δ P w , Δ P s d , Δ P a c , and Δ P s c are the Wall pressure drop, the depth filtration layer pressure drop, the ash cake layer pressure drop, and the soot cake layer pressure drop, respectively, in Pa; k w , k s d , k a c , and k s c are the permeability of the filter wall, the soot layer in the filter wall, the ash cake layer, and the soot cake layer, respectively, in m2; δ w , δ s d , δ a c , and δ s c are the thickness of the filter wall, the soot layer in the filter wall, the ash cake layer, and the soot cake layer, respectively, in m; μ is the dynamic viscosity coefficient in Pa·s; and d 1 is the internal length of the carrier channel in m.

2.2. Model Building

The GPF has a porous structure, the front and back are alternately blocked, and the exhaust gas flows in from the inlet channel and out from the outlet channel through the porous media wall. The silicon carbide carrier with a diameter of 143.8 mm and a length of 127 mm used in this paper is one of the most widely used and researched materials at present, which has the advantages of a high temperature resistance, corrosion resistance, and good thermal conductivity. These basic parameters of the GPF are consistent with those in reference [25], and the specific parameters are shown in Table 1. As shown in Figure 2, the particle filter was modeled and meshed in three dimensions by AVL-Fire After-treatment with a total number of 251,992 meshes. The following assumptions need to be made in the simulation analysis: (a) ignore the internal heat radiation loss of the GPF and consider the influence of heat conduction; (b) the PM component in the exhaust gas is pure soot; and (c) there is no heat exchange between the carrier and the external environment and the boundary is regarded as adiabatic.

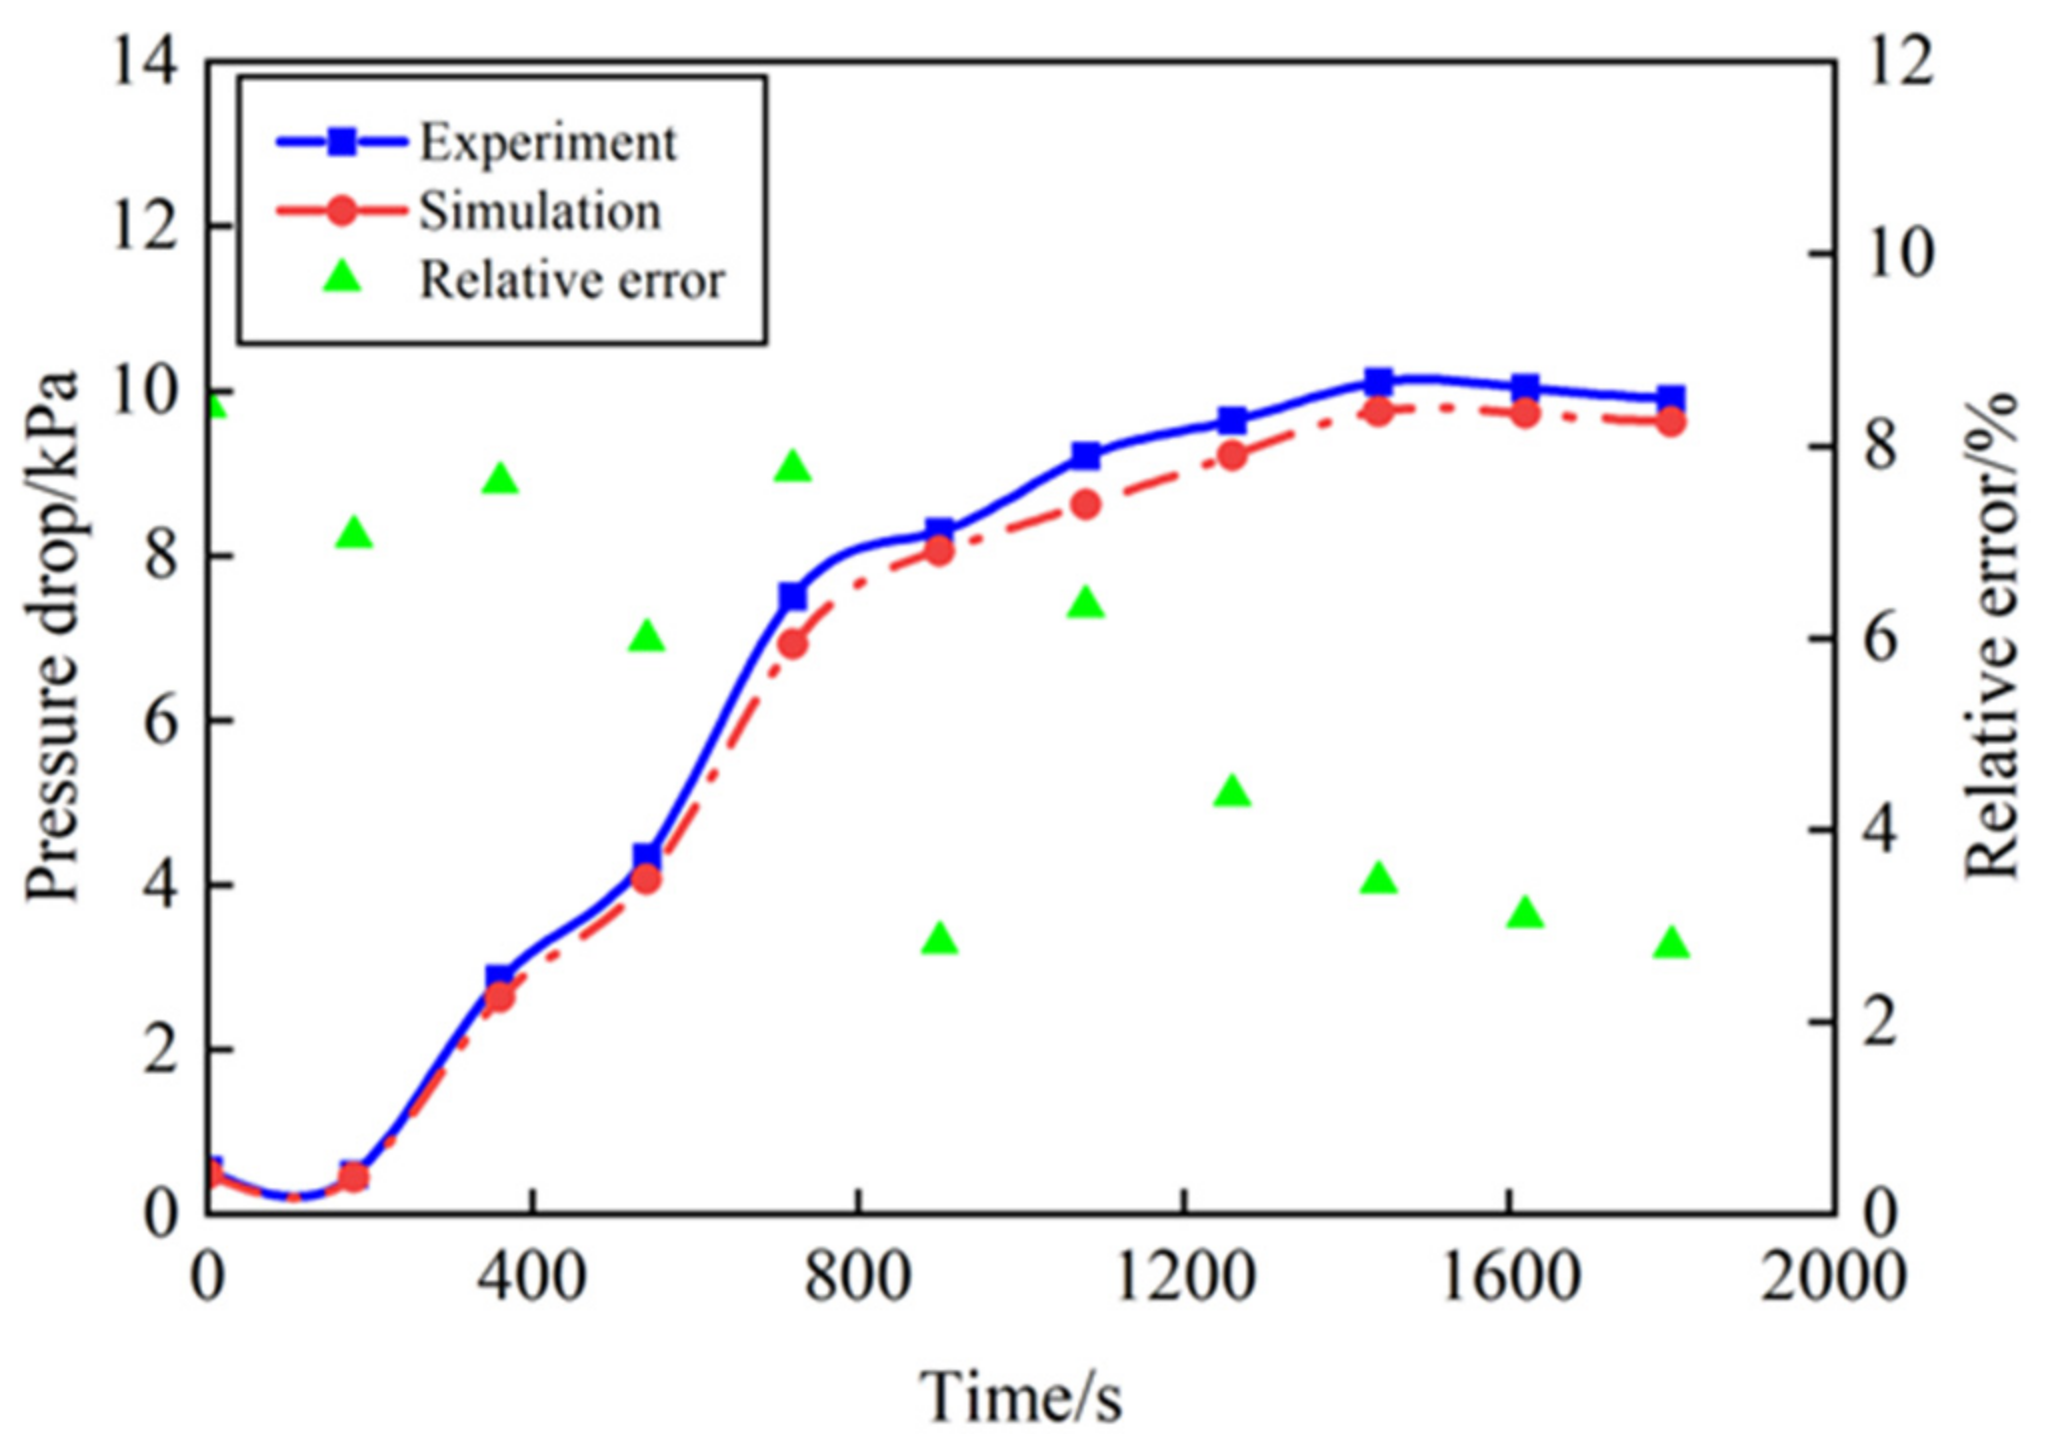
2.3. Model Verification

In order to verify the accuracy of the numerical calculation model, it is necessary to carry out experimental verification on the established model. Among them, the exhaust state parameters and particulate filter structure parameters required in the model validation calculations are quoted from the reference [25]. The experimental data were obtained by selecting the engine to run continuously for 1800 s under the operating condition of a 3000 r/min full load, and the GPF pressure drop value data were obtained by the continuous test measurement method. The simulation boundary conditions are as follows: the inlet boundary condition is selected as the exhaust temperature of 1035 K, the inlet flow rate is 0.092 kg/s, the initial soot loading of the carrier is 0 g/L, the outlet uses the ambient pressure as the boundary condition, and the initial temperature of the carrier is 300 K, which are also all from the reference [25]. Consistent with the above parameters, when the simulation parameters were set and run under these conditions for 1800 s, the GPF pressure drop over time was obtained. As shown in Figure 3, The simulation result of this paper is the difference between the average pressure of the inlet and the average pressure of the outlet in the GPF. From Figure 3, it can be seen that the difference between the simulated calculated values and the experimental values in the reference [25] is relatively small, and the trend of change is basically the same. The experimental process inevitably produces ash, while the simulation calculation process considers the ash deposition to be zero, so the experimental value of the pressure drop is slightly larger than the simulated value. After the analysis and comparison, it was found that the relative error between the simulated values of the overall pressure drop and the experimental values in the reference [25] was within the range of 10%, which indicates that the model has high accuracy and is able to accurately predict the pressure variations in the GPF.

3. Results and Discussion

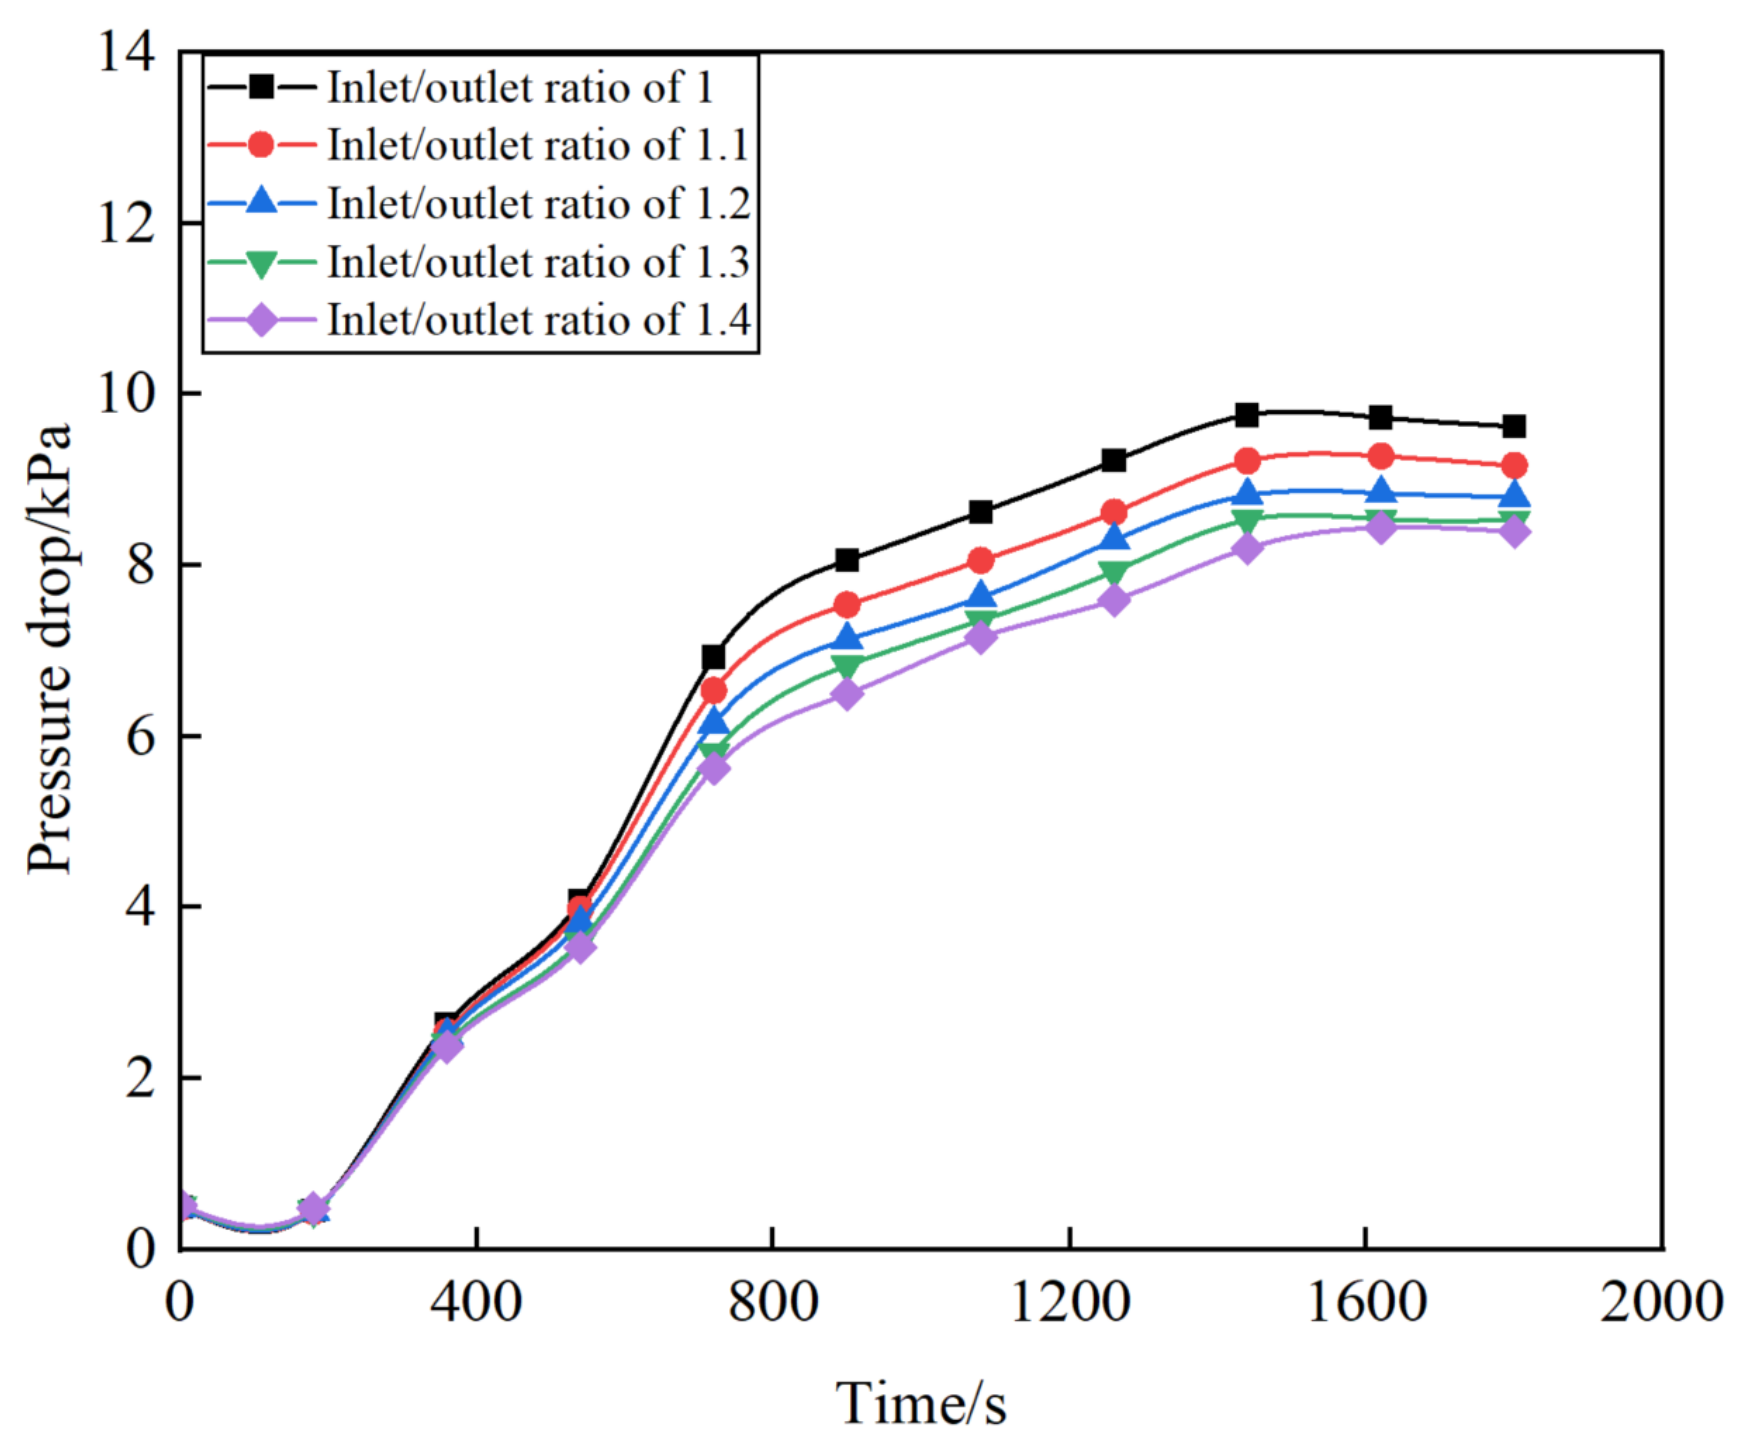
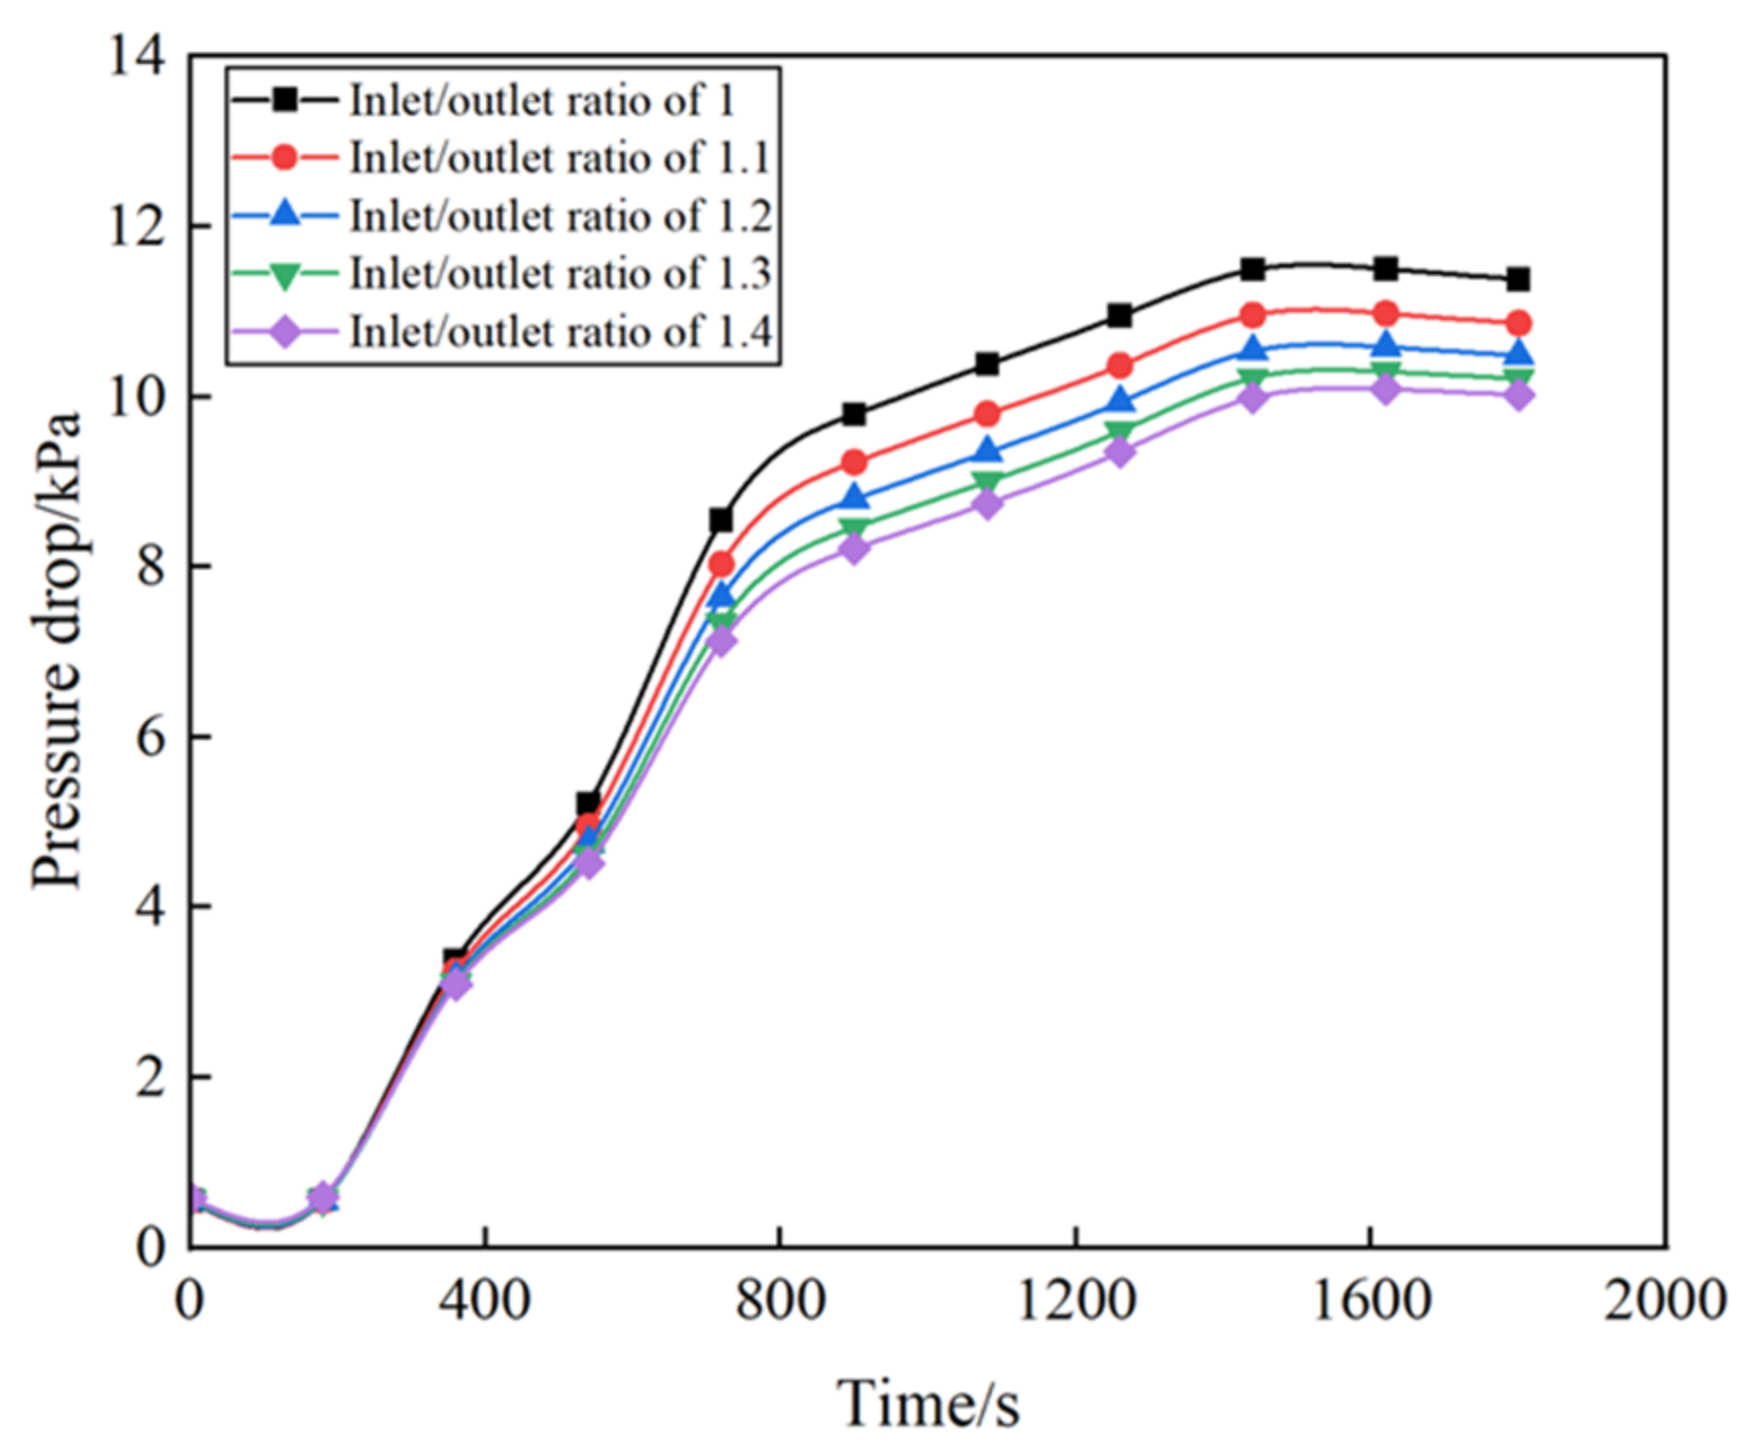
3.1. Effect of Asymmetric Cell Structure on Pressure Drop

The so-called asymmetric cell structure means that the inlet opening area is different from the outlet opening area, and in order to increase the amount of GPF soot and ash and reduce the pressure drop, the inlet area is usually larger than the outlet area, i.e., the inlet equivalent diameter is larger than the outlet equivalent diameter. This can greatly increase the soot and ash capacity of the GPF and reduce the pressure drop of the GPF, whose structure is shown in Figure 4.
The cell density and wall thickness were kept unchanged, and the effect of the cell ratio on the GPF’s pressure drop performance was studied. According to previous experience, the cell ratio should not exceed 1.4; otherwise, it will lead to poor structural strength, so this value is constrained to 1~1.4, and the simulation interval variation is set to 0.1 [26]. Figure 5 shows the GPF pressure drop over time at different cell ratios. With the increase in the proportion of the inlet/outlet cells, the pressure drop of the GPF during the capture process showed a decreasing trend, and the pressure drop of the symmetric square cell structure was the largest. The ratio of the inlet/outlet cells was 1.1 to 1.4 and the pressure drop decreased by 4.61%, 9.07%, 12.19%, and 13.22%, respectively. It can be seen that the rate of the decrease decreases as the ratio of the inlet/outlet cells increases. As the inlet/outlet cell ratio increases, the flow surface of the inlet cell increases, resulting in a decrease in the exhaust velocity, and the larger aperture has a larger particulate deposition area, resulting in the thickness of the soot layer becoming thinner, and the resistance of the exhaust gas penetrating the particulate matter cake layer becoming smaller; that is, the bearing capacity of the particles in the cell increases so that the pressure drop of the GPF carrier decreases, which shows that increasing the cell ratio is effective in reducing the trapping pressure drop of the GPF cake layer.
The distribution of soot particles in the GPF carrier not only affects the GPF pressure drop, but is also an important factor affecting regeneration [27]. Figure 6 shows the distribution of soot particles in symmetric and asymmetric cells in the GPF carrier when the soot loading time reaches 1440 s.
As can be seen in Figure 6, when the boundary conditions and capture times are the same, the axial distribution of soot in the GPF carriers with symmetric and asymmetric cell structures is inhomogeneous along the cell, with the density of soot at the back end being greater than that at the front end. As in the early stage of capture, soot particles are mainly captured at the back end of the cell, resulting in the uneven distribution of the filter wall along the axial direction of the cell, and the permeability of the filter wall at the back end of the cell becomes smaller. As the soot continues to load, the filter wall permeability of the location of the filtration rate is large, resulting in the capture of soot slowly turning to the front end, so that the carrier soot distribution tends to be uniform again. With the increase in the inlet/outlet ratio, the density of soot at the back end of the GPF carrier decreases, indicating that the asymmetric cell structure of the GPF has a certain influence on the distribution of soot.

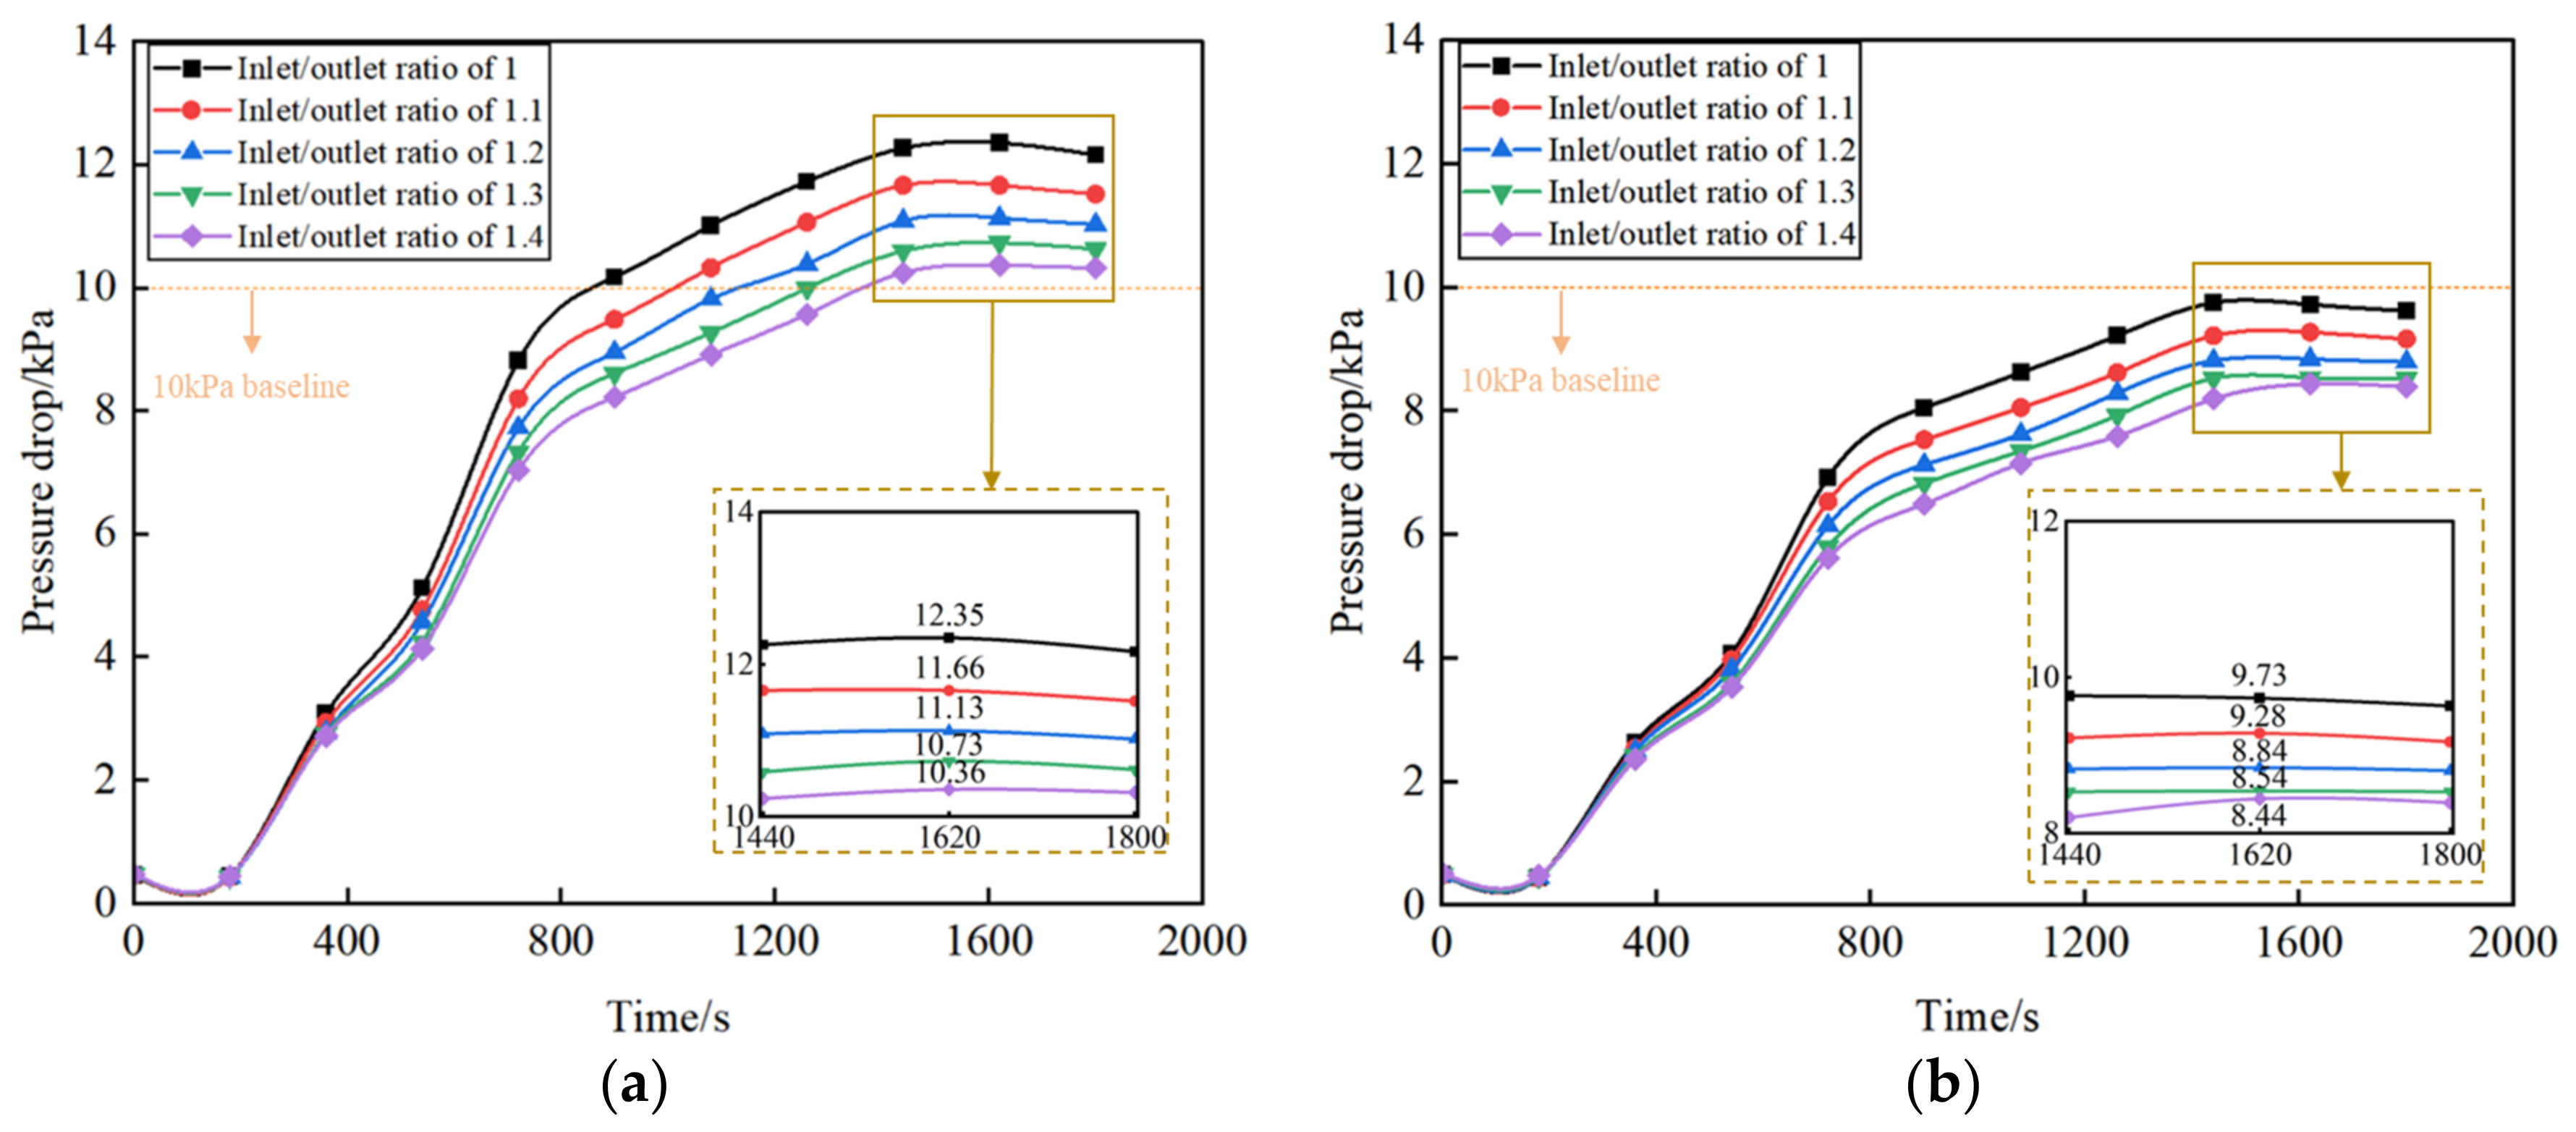
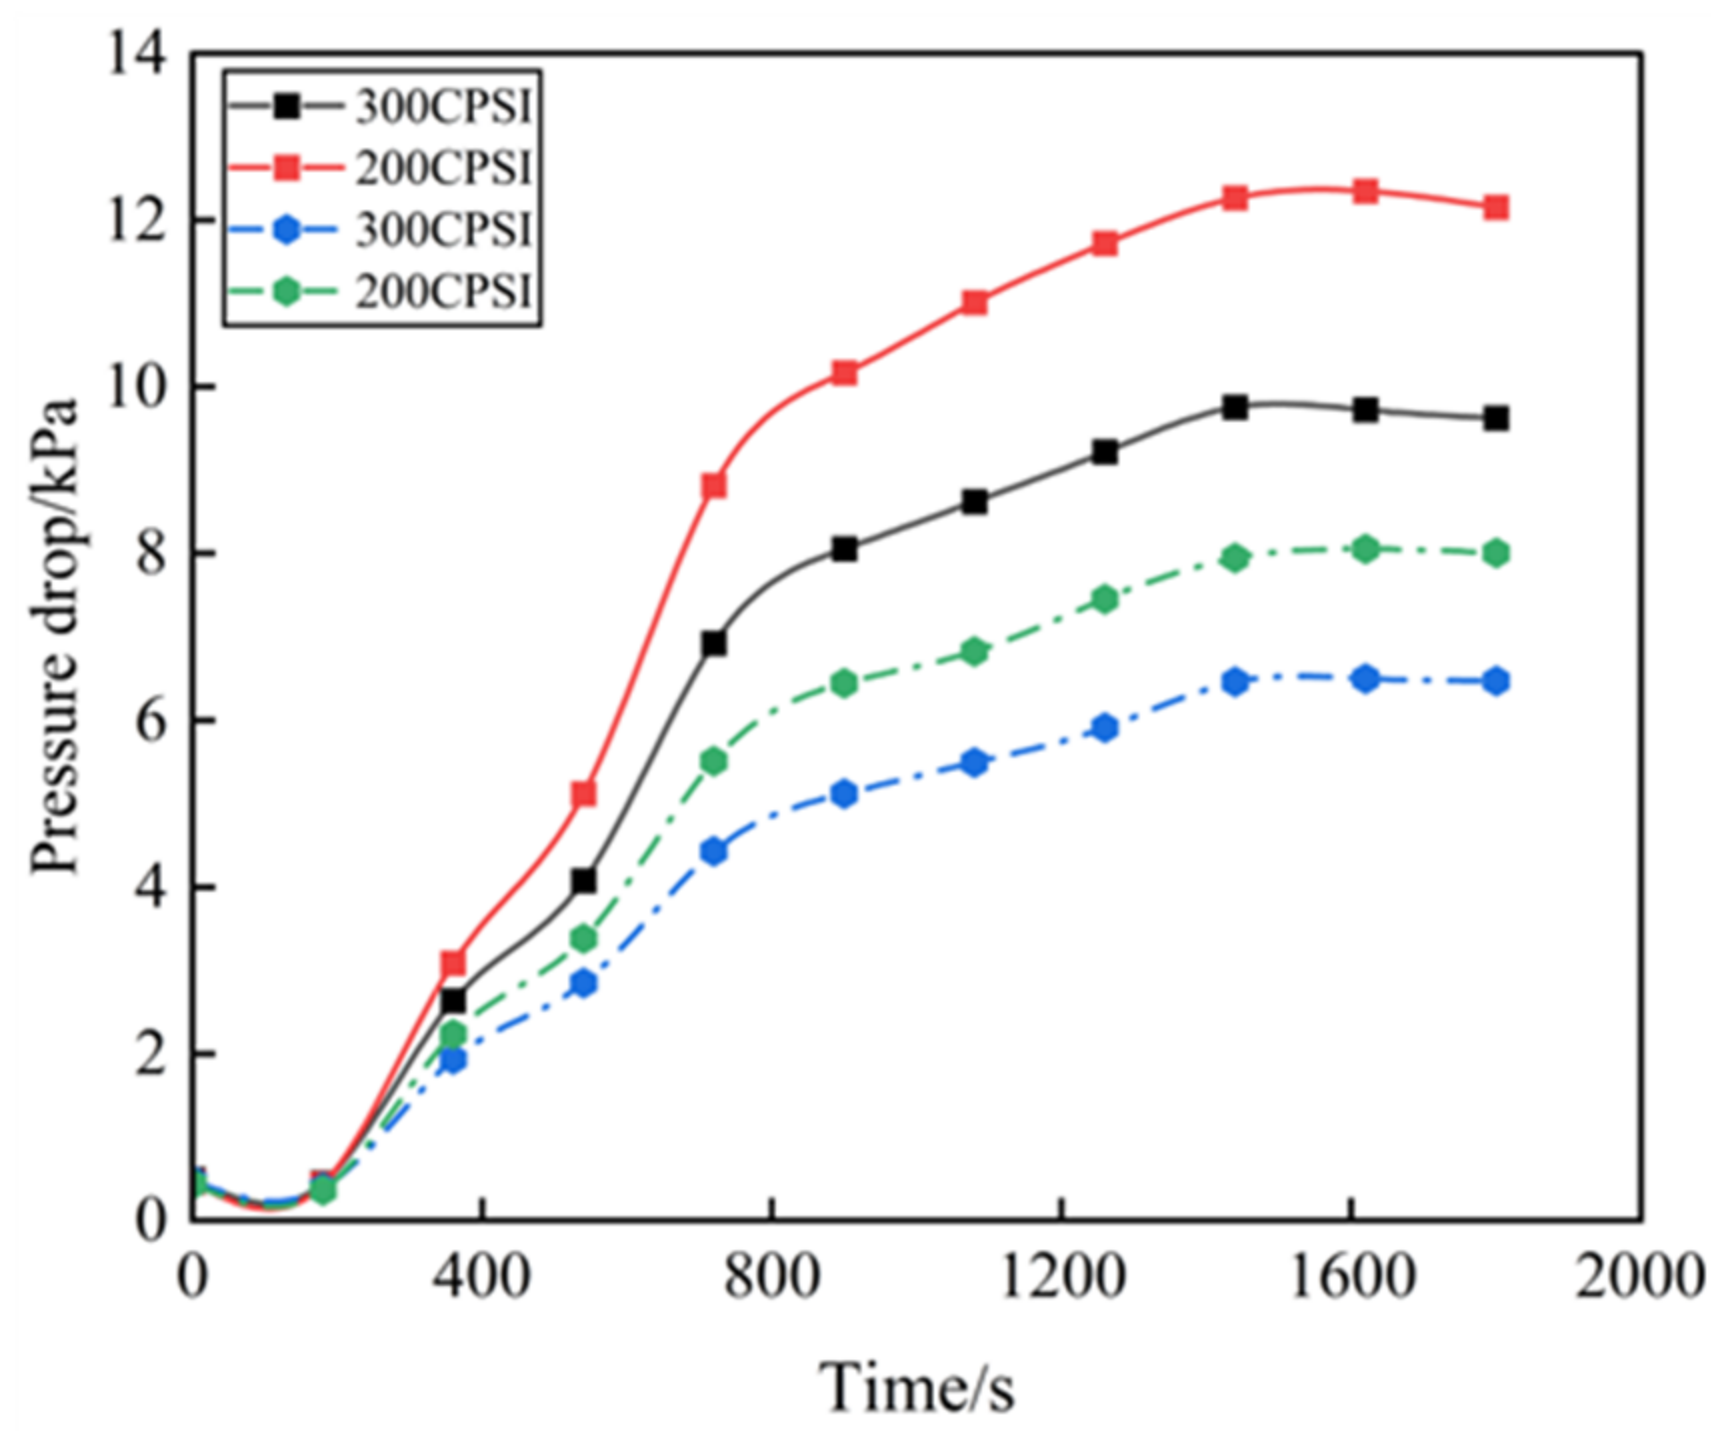
3.1.1. Effect of Asymmetric Cell Side Length Ratio on Pressure Drop Characteristics of GPF at Different Cell Densities

The GPF cell density determines the change in cell size, which affects the soot capture area of the carrier, and increasing the cell density can reduce the wall thickness of the carrier cell, which can reduce the pressure drop of the GPF, so the cell density has a certain influence on the pressure drop characteristics of the carrier. Figure 7 shows the change trend of the GPF pressure drop corresponding to the asymmetric cell structure under different cell densities when the initial soot deposition is 0 g/L. As can be seen from the figure, when the cell density is small, the GPF pressure drop decreases with the increase in the cell density, and the asymmetric cell structure with inlet/outlet ratios of 1.1~1.4 GPF increased from a 200 CPSI to 300 CPSI pressure drop which decreased by 20.43%, 20.53%, 20.39%, and 18.56%, respectively. This is because when the cell density increases, the flow rate of exhaust gas through a single inlet decreases under the condition that the engine exhaust flow rate remains constant, so the GPF pressure drop decreases. Compared with the pressure drop curves in the figure, the similarity is that the pressure drop curves have the same trend with the soot loading time. The difference is that at both cell densities, the pressure drop at 200 CPSI decreases to more than at 300 CPSI as the inlet/outlet ratio increases. When the inlet/outlet ratio changes from 1.3 to 1.4 at 300 CPSI, the pressure drop decreases very little, and it basically coincides at 1620~1800 s, and the pressure drop almost does not decrease. At 200 CPSI, when the in/outlet ratio changes from 1.3 to 1.4, the reduction in the pressure drop is still obvious, with an additional increase of 0.27 kPa to 300 CPSI. Therefore, it is indicated that the different cell densities affect the pressure drop characteristics of the GPF carriers with asymmetric cell structures.

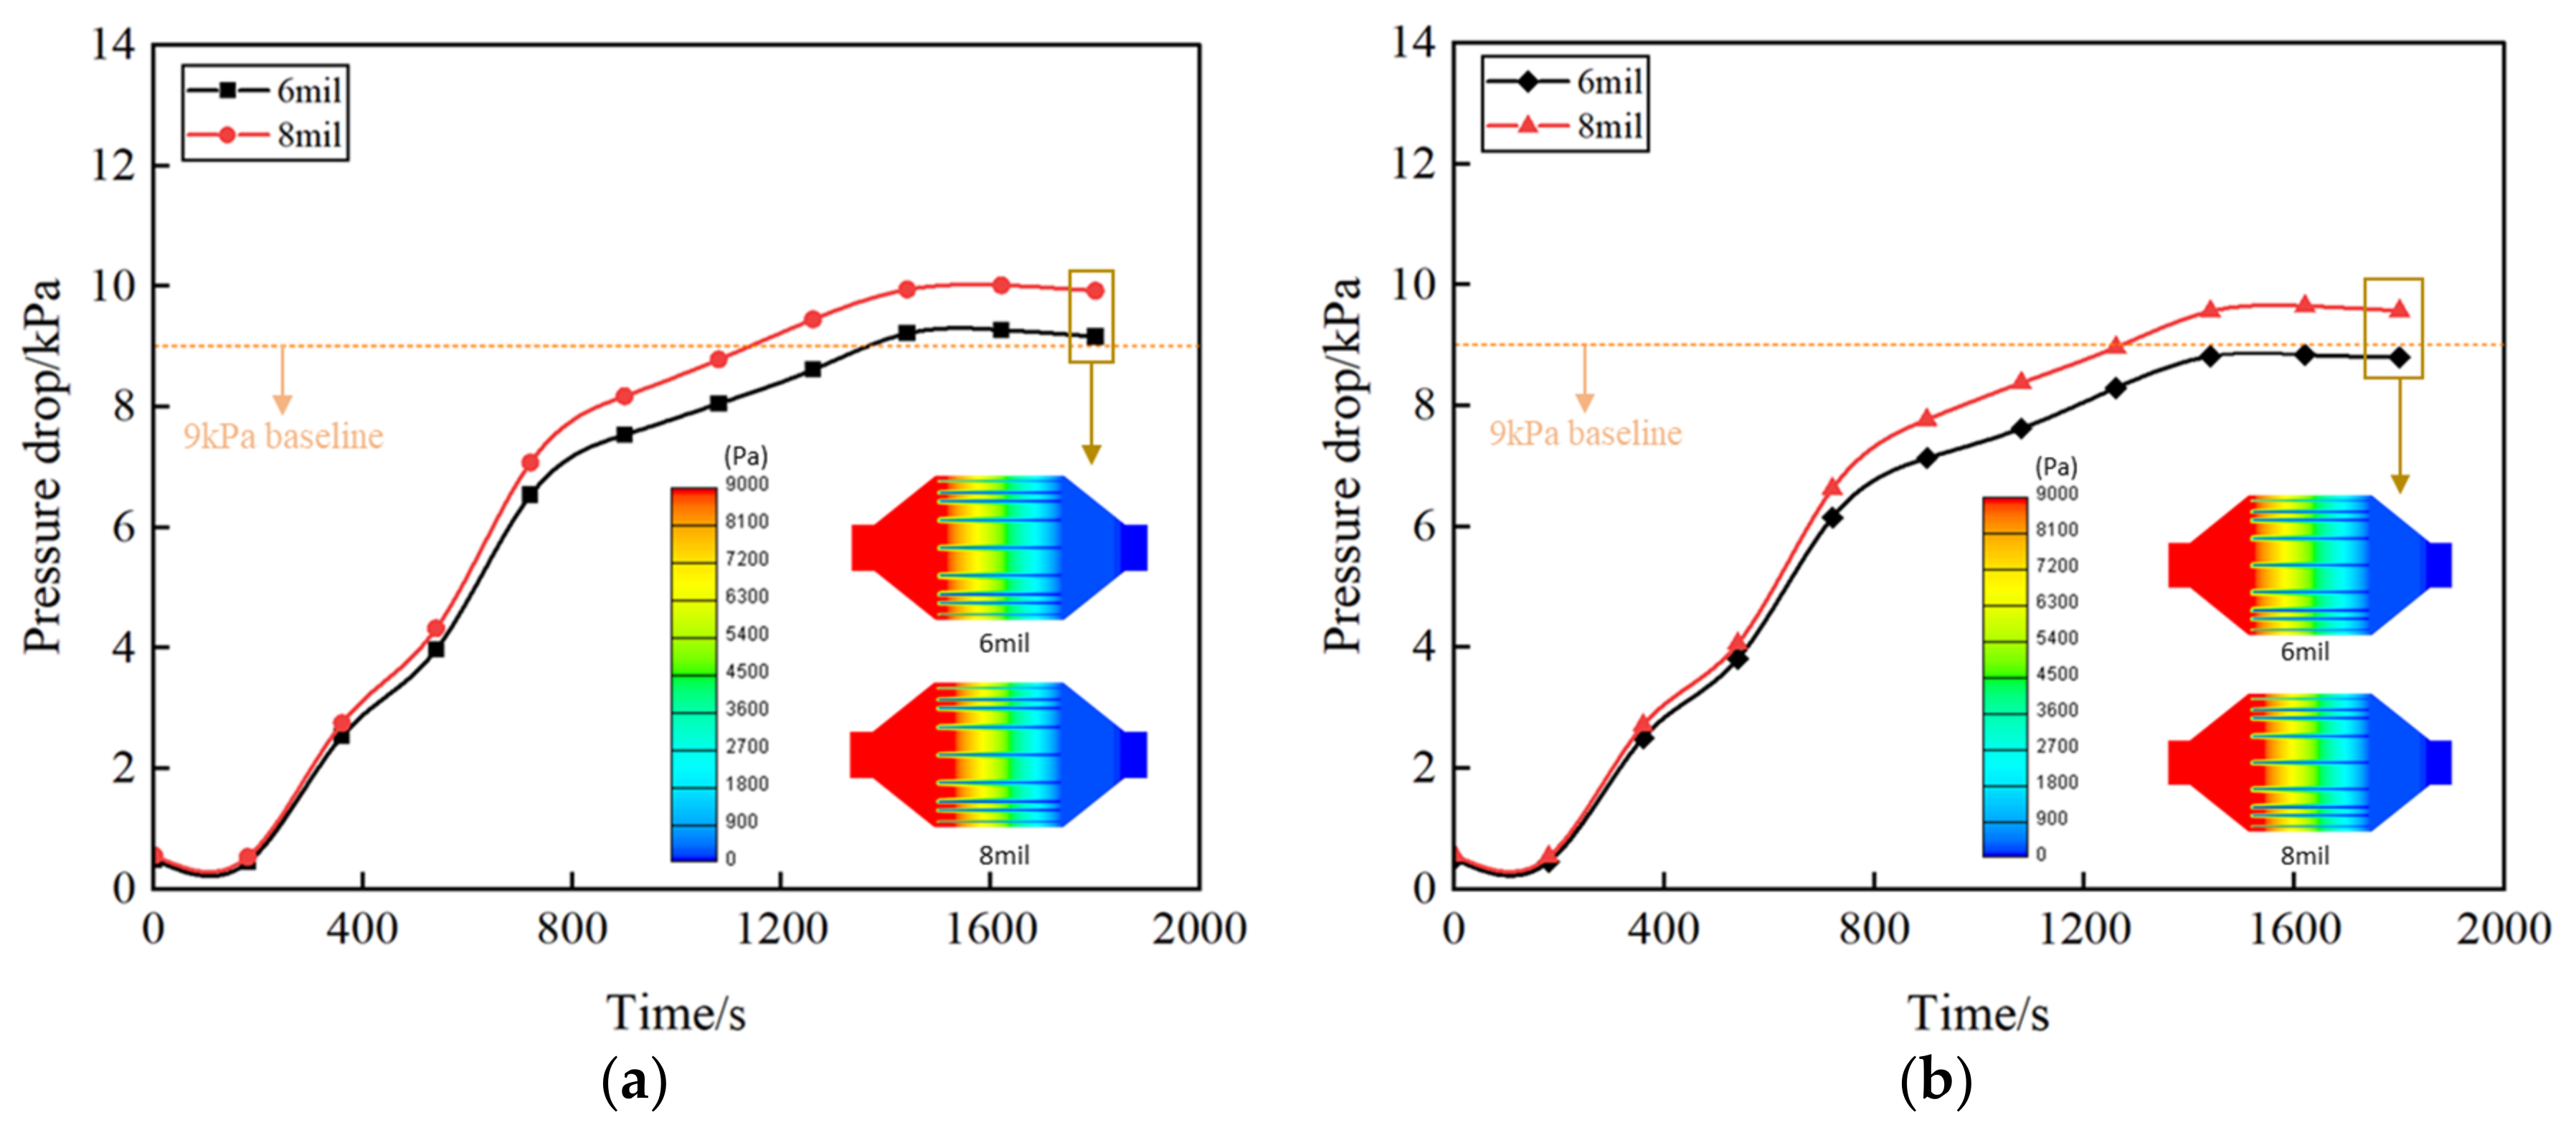
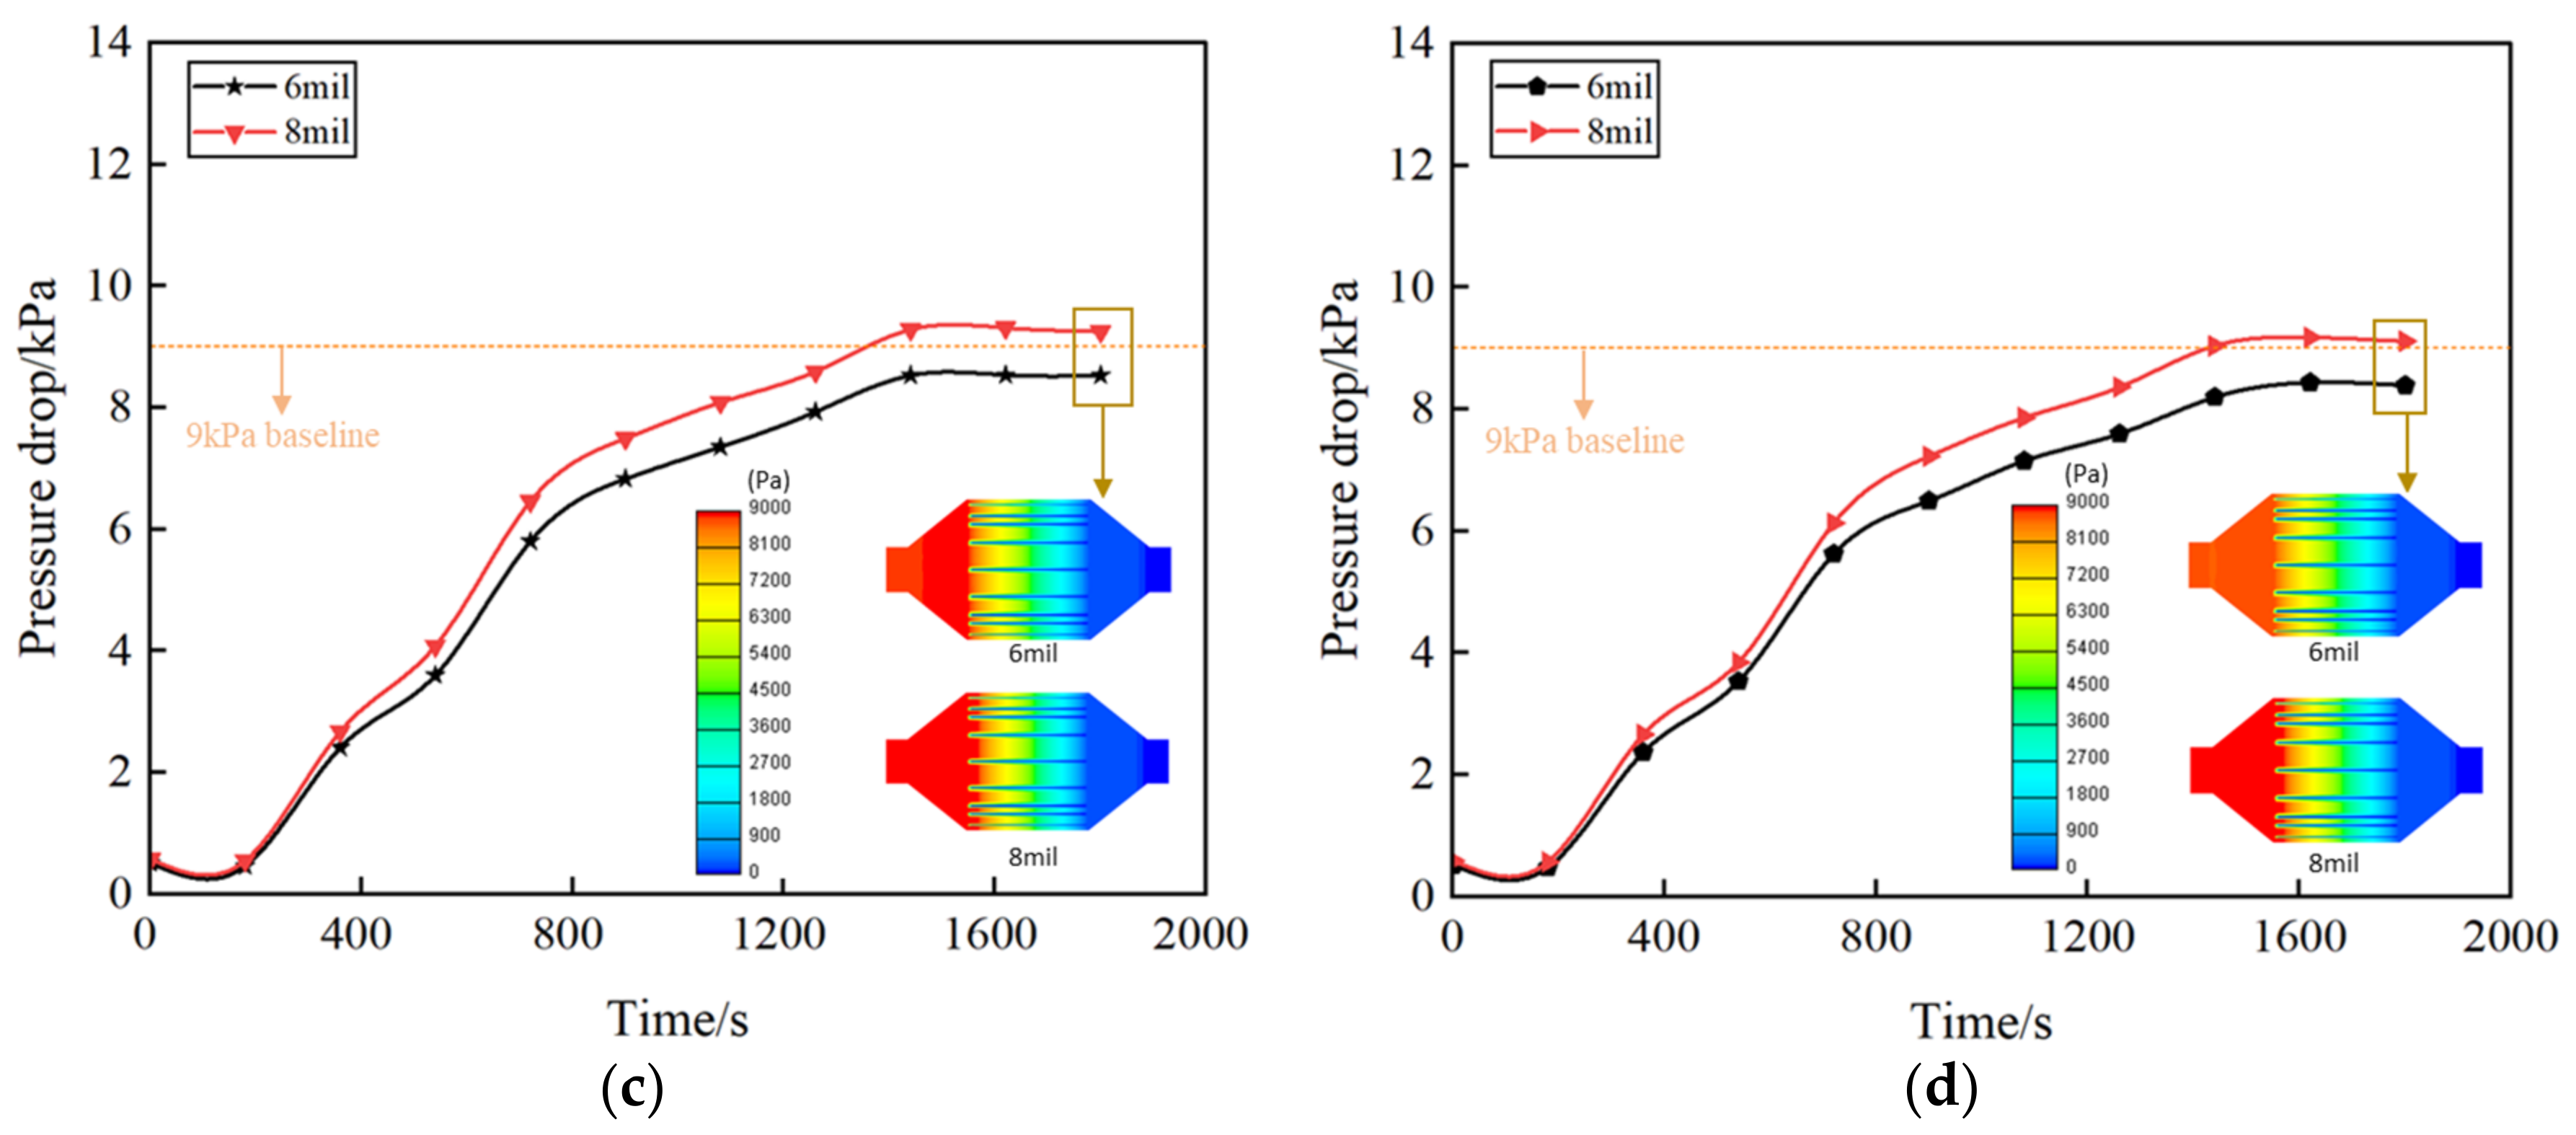
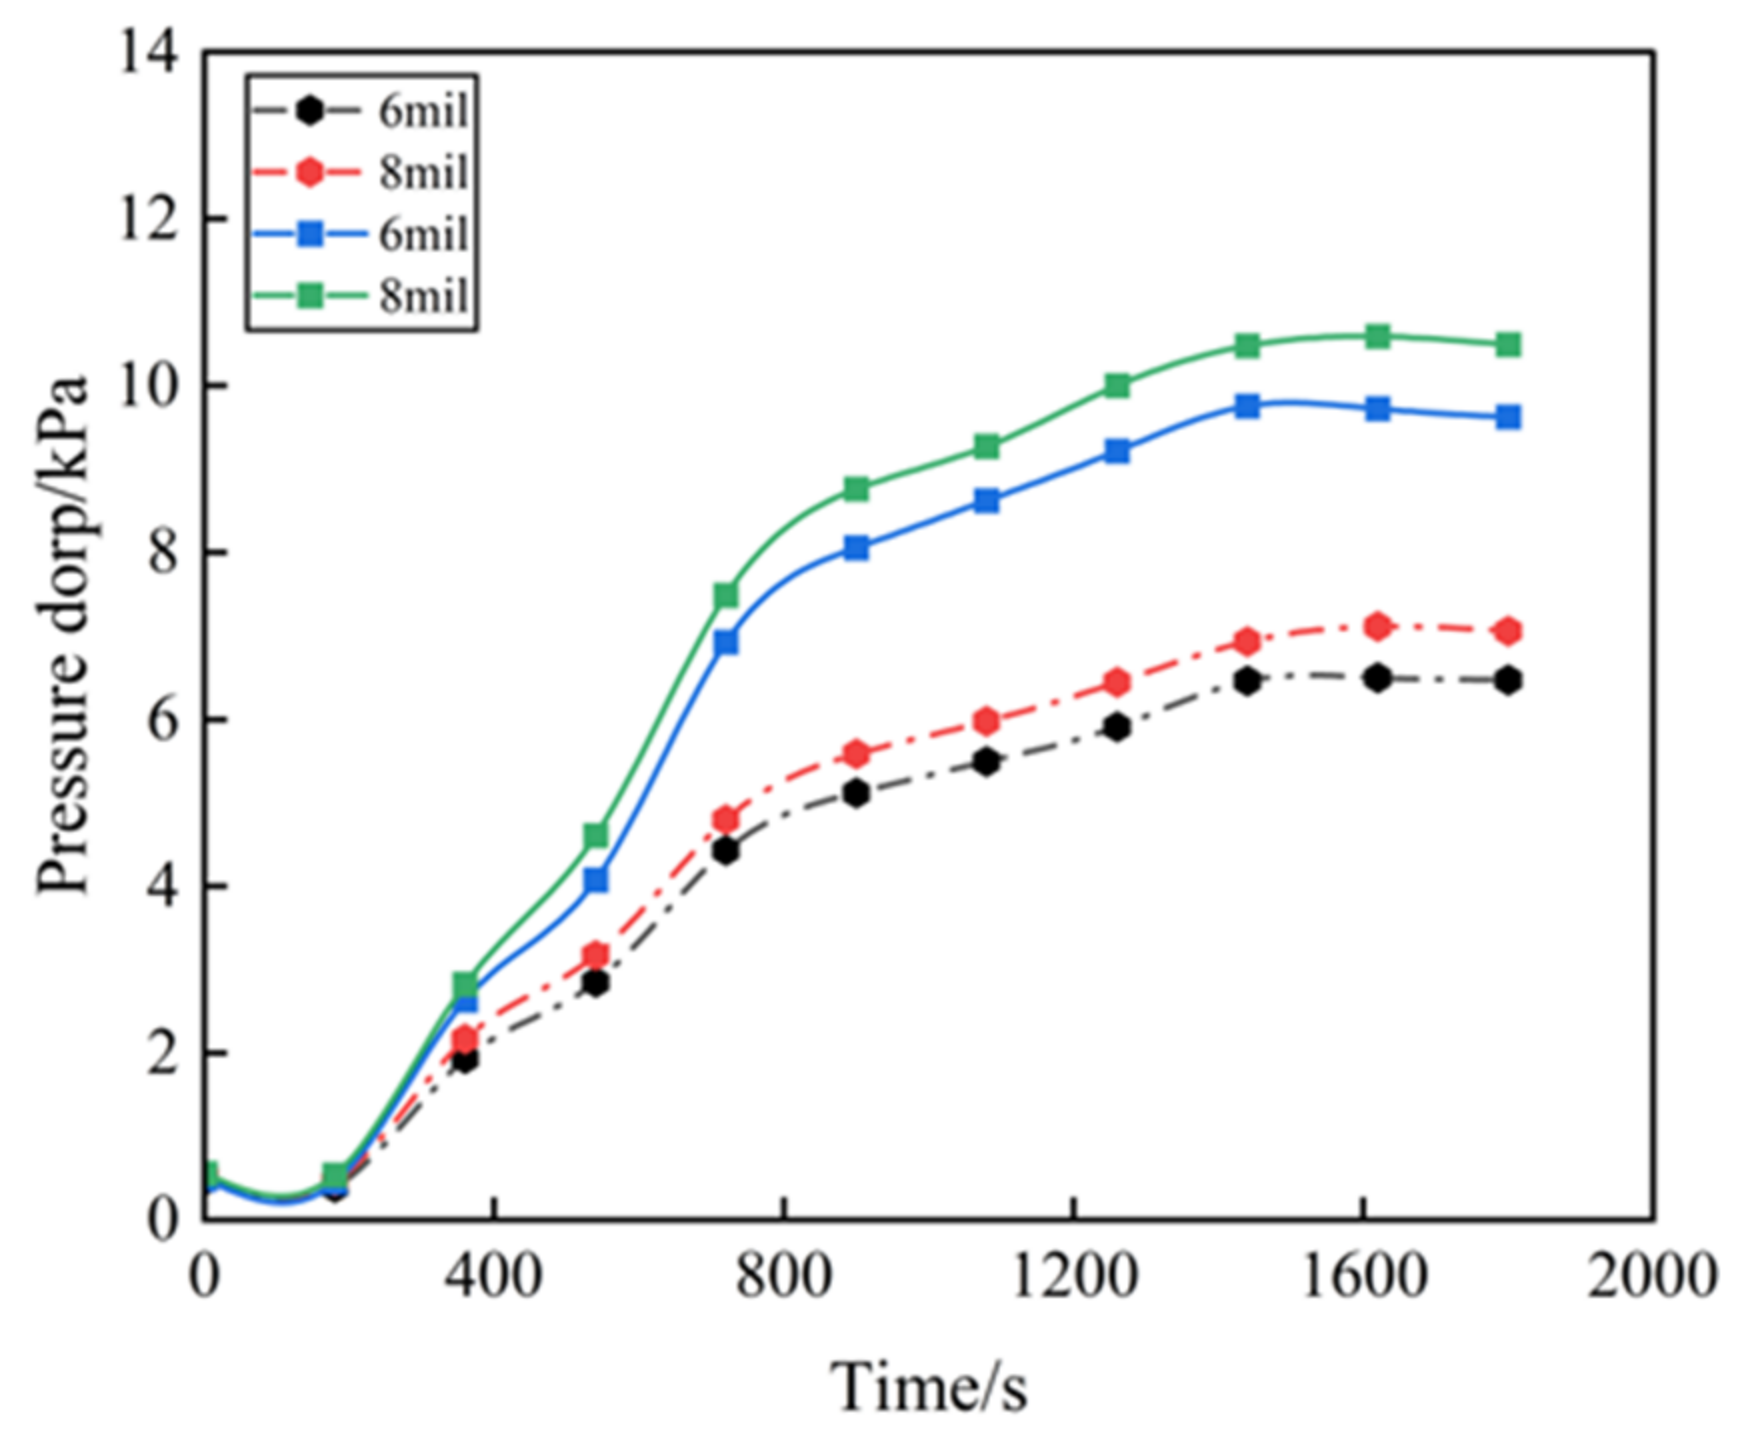
3.1.2. Effect of Asymmetric Cell Side Length Ratio on Pressure Drop Characteristics of GPF at Different Filter Wall Thicknesses

The filter wall thickness is the thickness of the GPF filter wall, which is selected as 6 mil and 8 mil [28], respectively. The cell density will be maintained at 300 CPSI, and asymmetric cell structures with different inlet/outlet ratios will be simulated and investigated. Figure 8 shows the variation of the GPF pressure drop with the soot loading time for different inlet/outlet ratios at different wall thicknesses. As can be seen from the figure, the pressure drop of the GPF increases with the increasing wall thickness for different inlet/outlet ratios. The pressure drop increases because the increase in the filter wall thickness leads to an increase in the resistance of the exhaust air to penetrating filter wall surfaces. With the increase in the input/outlet ratio, the rate of the pressure drop reduction also decreases. Between the inlet/outlet ratio of 1.3 and 1.4, the pressure drop reduction range is the lowest, and the pressure drop value reduction is the smallest under the wall thickness of 6 mil and 8 mil from 1620 s to 1800 s; the minimum drop is only 0.1 kPa, indicating that the inlet/outlet ratio of GPFs with an asymmetric cell structure is not as large as possible. When the inlet/outlet ratio is 1.4, the value of the pressure drop reduction for the exhaust flow through the inlet cell and through the wall is comparable to the value of the pressure drop increase for the exhaust flow through the outlet cell, further increasing the inlet/outlet cell diameter ratio which does not achieve an effective reduction in the GPF pressure drop.
As shown in Figure 9, the GPF pressure drop for the asymmetric cell structure varies at different wall thicknesses. In the asymmetric cell structure under different inlet/outlet ratios, with the change in the soot loading time, the pressure drop characteristics of different wall thicknesses are different; the GPF pressure drop with a wall thickness of 6 mil is lower than that of the GPF with a wall thickness of 8 mil under different inlet/outlet ratios. With the increase in the wall thickness, the GPF pressure drop increased by 7.99% for an inlet/outlet ratio of 1.1, 9.13% for an inlet/outlet ratio of 1.2, 9.08% for an inlet/outlet ratio of 1.3, and 8.74% for an inlet/outlet ratio of 1.4. This trend is similar to the results of Xiao et al. [28]. This is because as the wall thickness increases, the contact area of the exhaust gases with the wall increases. The flow resistance caused by the contact between the exhaust gas and the wall will consume the kinetic energy of the fluid and cause a sharp change in pressure. Therefore, a smaller wall thickness can reduce the GPF pressure drop.

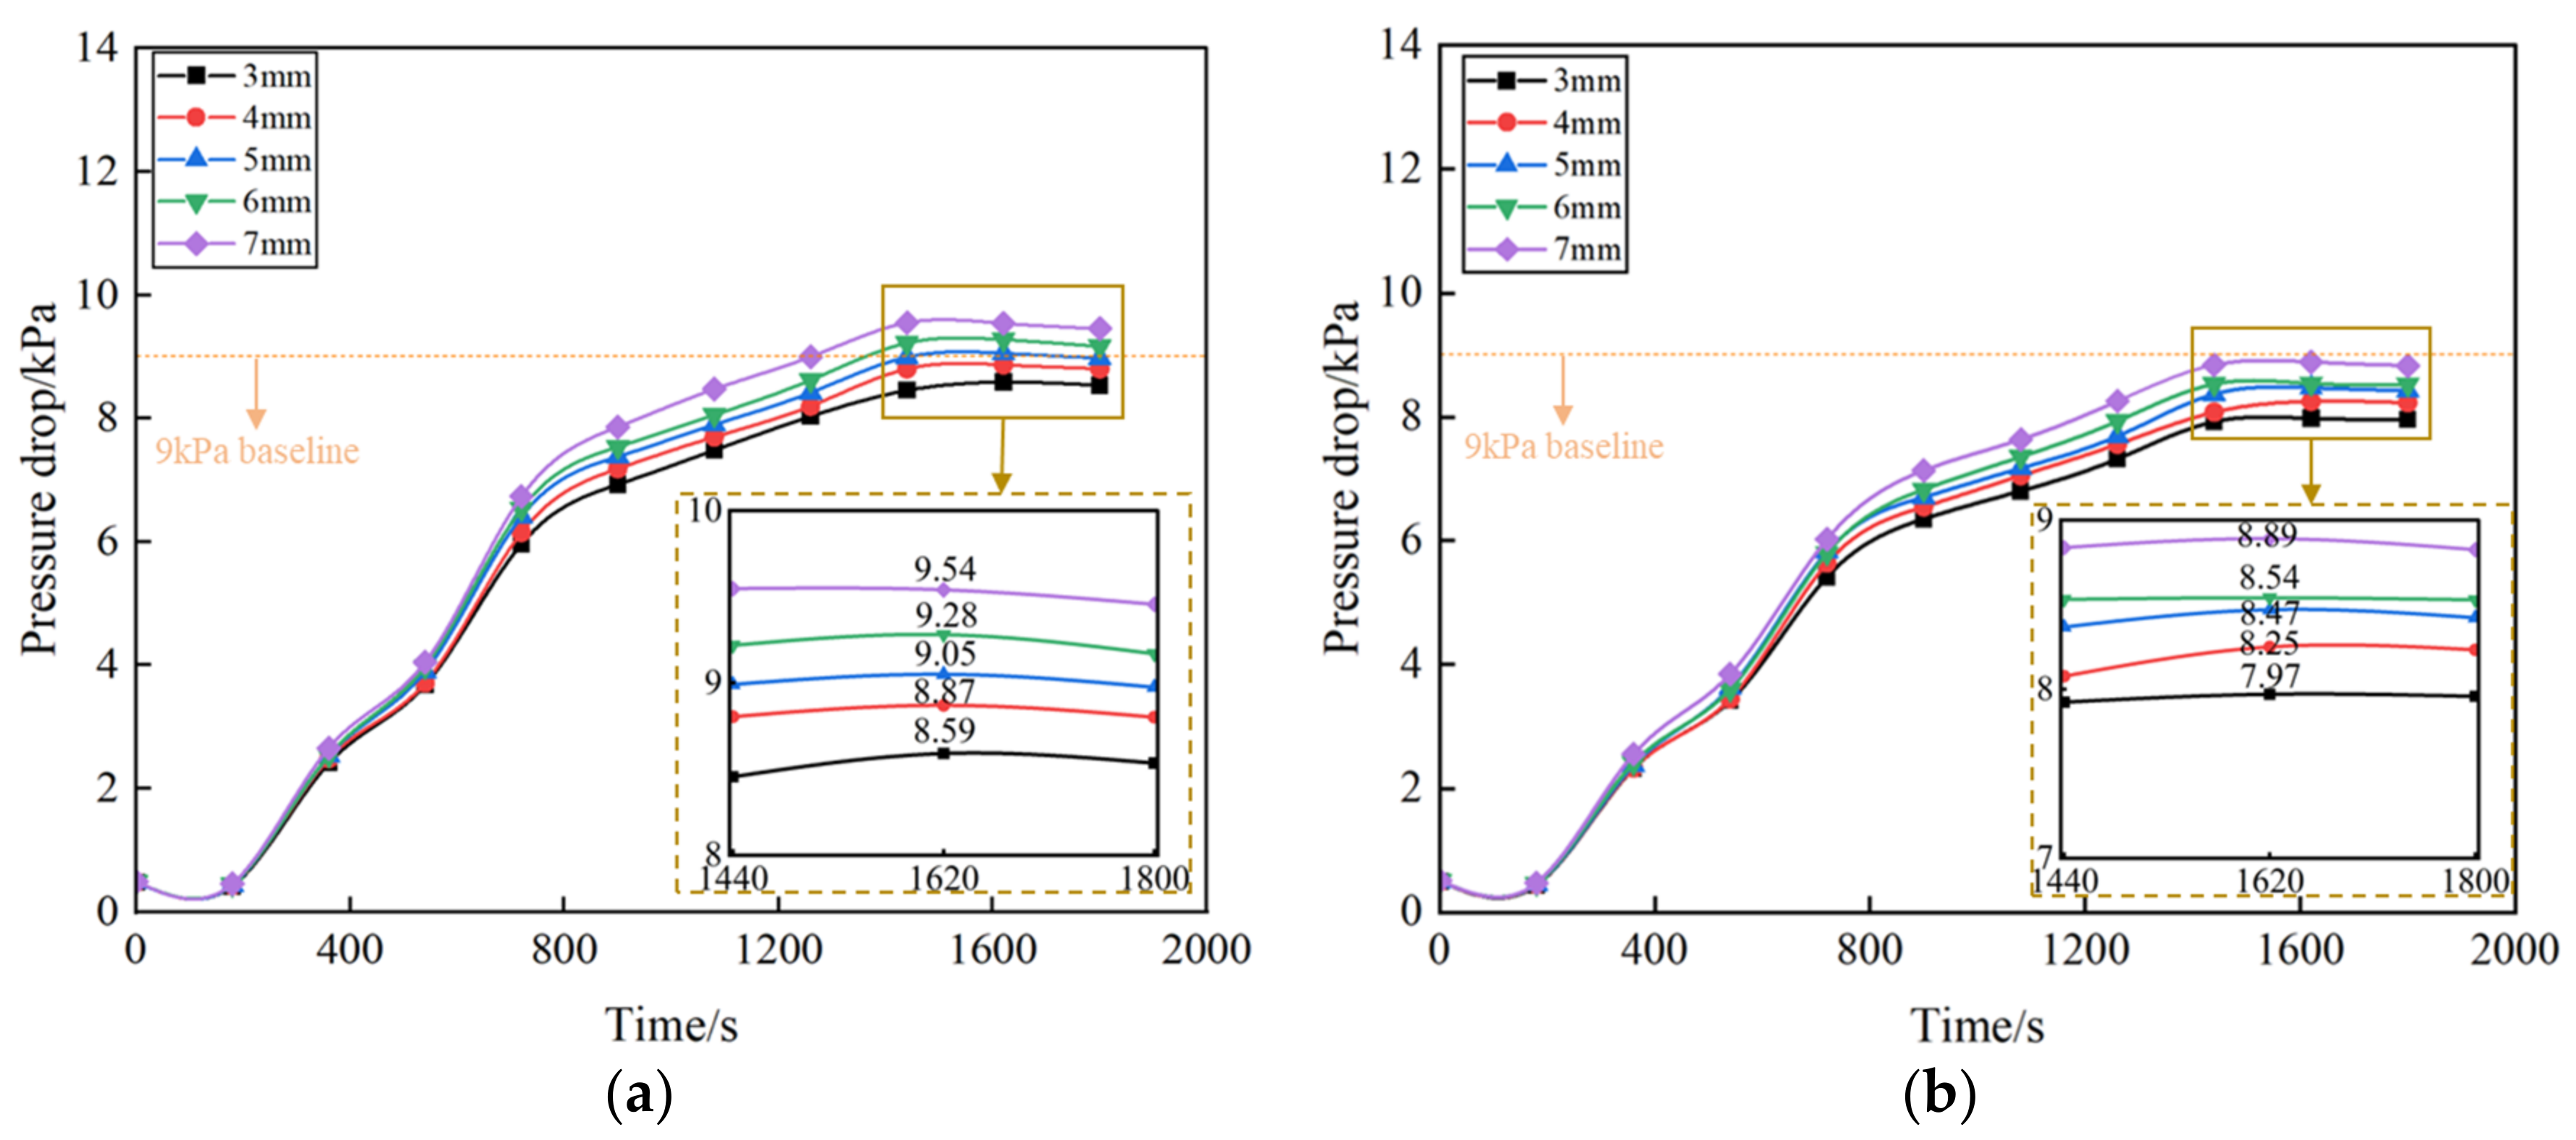
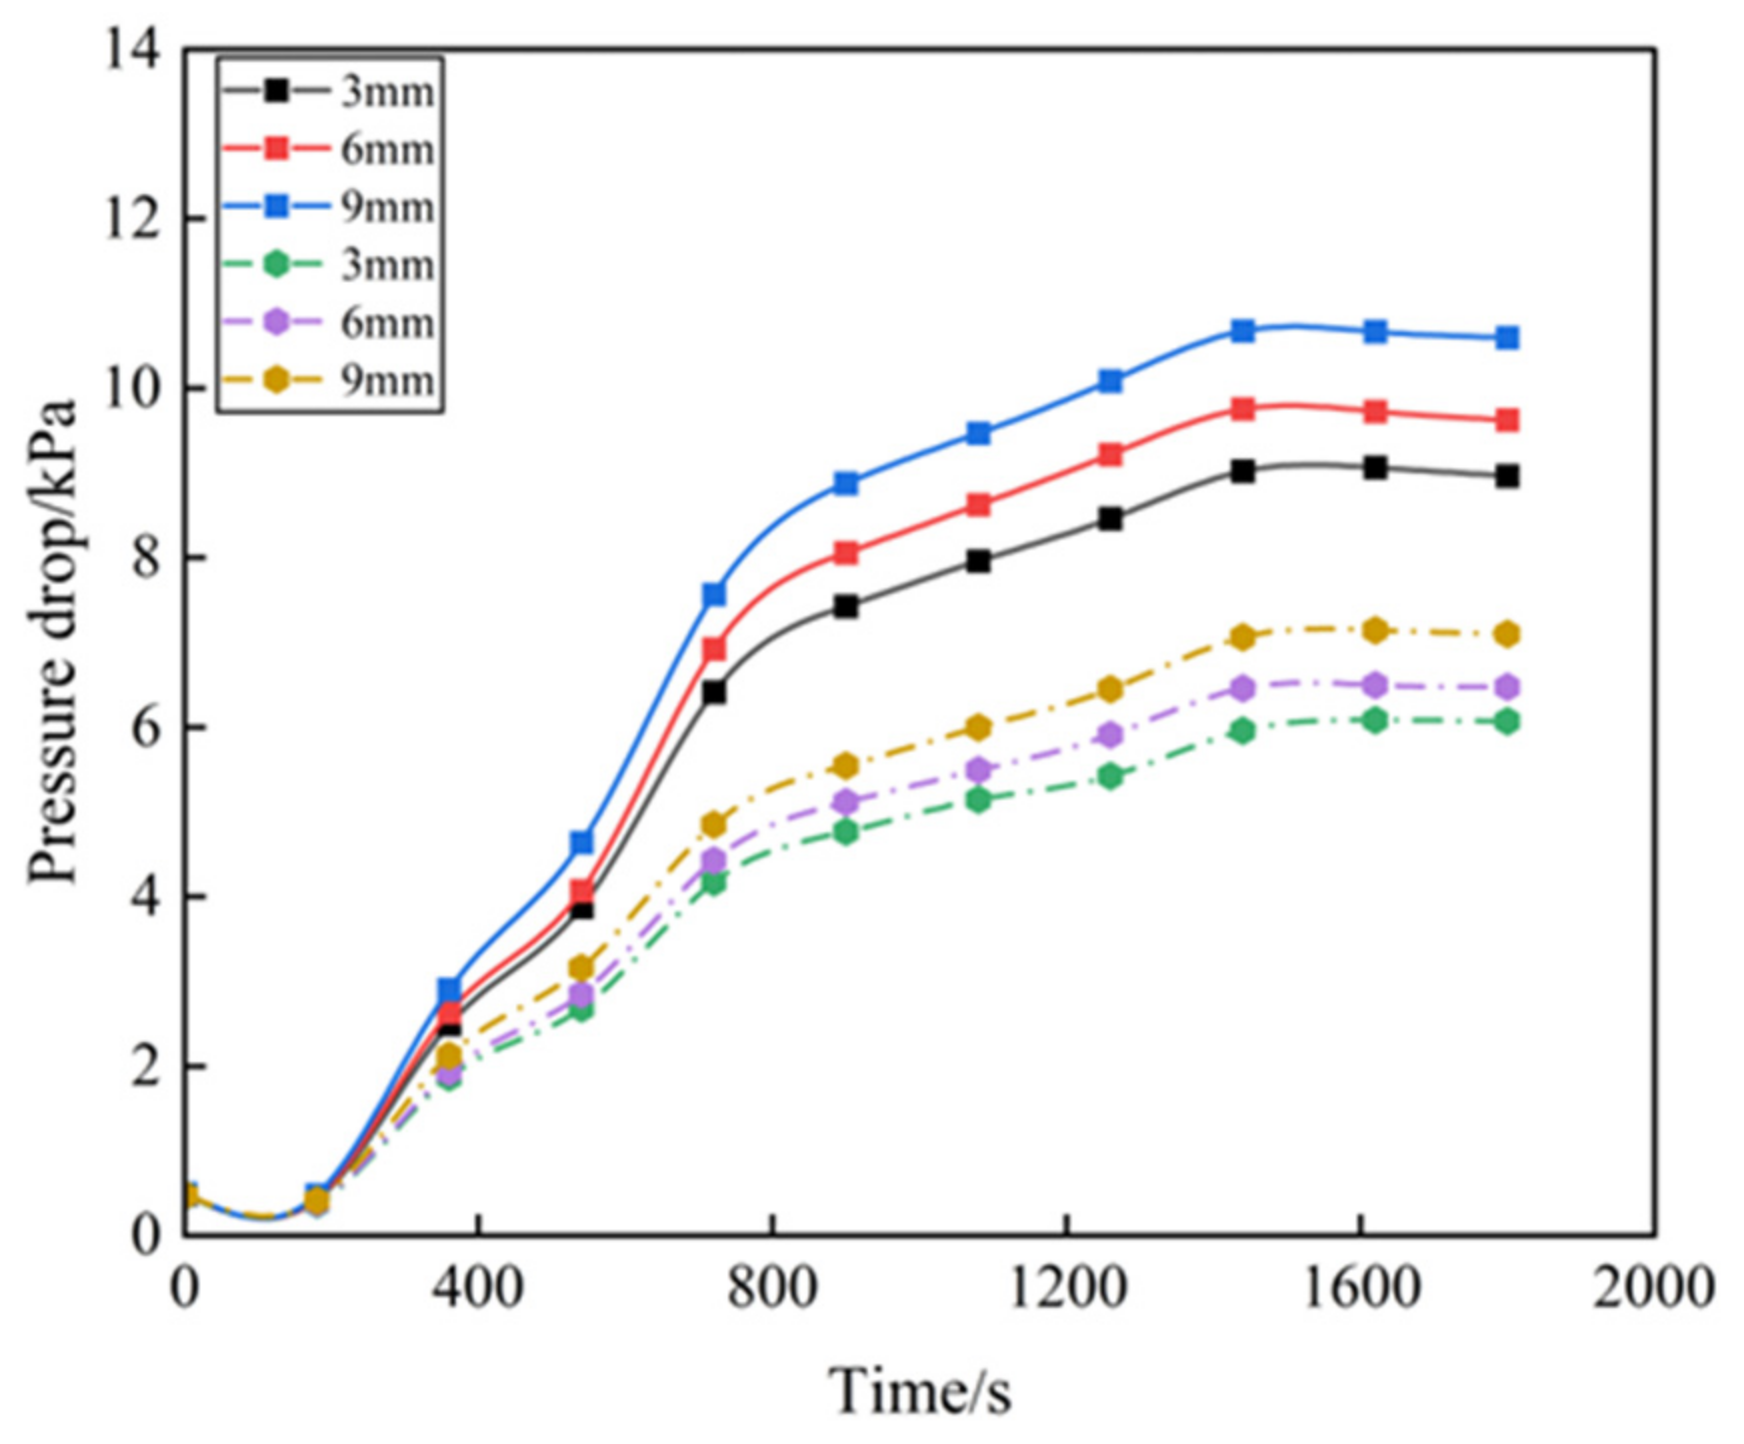
3.1.3. Effect of Asymmetric Cell Side Length Ratio on Pressure Drop Characteristics of GPF at Different Plug Lengths

The plug refers to the part of the GPF inlet and outlet that are blocked, and five plug lengths will be selected, namely 3 mm, 4 mm, 5 mm, 6 mm, and 7 mm. The hole density will be maintained at 300 CPSI, and the simulation will be carried out according to the asymmetric channel structure with two different inlet/outlet ratios. Figure 10 shows the variation of the GPF pressure drop with the soot loading time for inlet/outlet ratios of 1.1 and 1.3 at different plug lengths. As can be seen from the figure, with the increase in the plug length, the pressure drop of the GPF under the same inlet/outlet ratio increases. As the increase in the length of the plug leads to a reduction in the effective length of the carrier, the carrying capacity of the particles in the cell is weakened, and the layer of carbon soot becomes thicker for the same amount of carbon soot loading at the same time, leading to an increase in the pressure drop. When the inlet/outlet ratio is 1.1, with every increase of 1 mm, the pressure drop increases by 2.03~3.26%; when the inlet/outlet ratio is 1.3, with every increase of 1mm, the pressure drop increases by 0.83~4.10%, which shows that the fluctuation is relatively large with the increase in the inlet/outlet ratio. When the inlet/outlet ratio is 1.3, the plug length increases from 5 mm to 6 mm, and the pressure drop increase of 1620~1800 s is the smallest with the loading of soot. It can be seen that different plug lengths have an effect on the GPF pressure drop in an asymmetric cell structure.

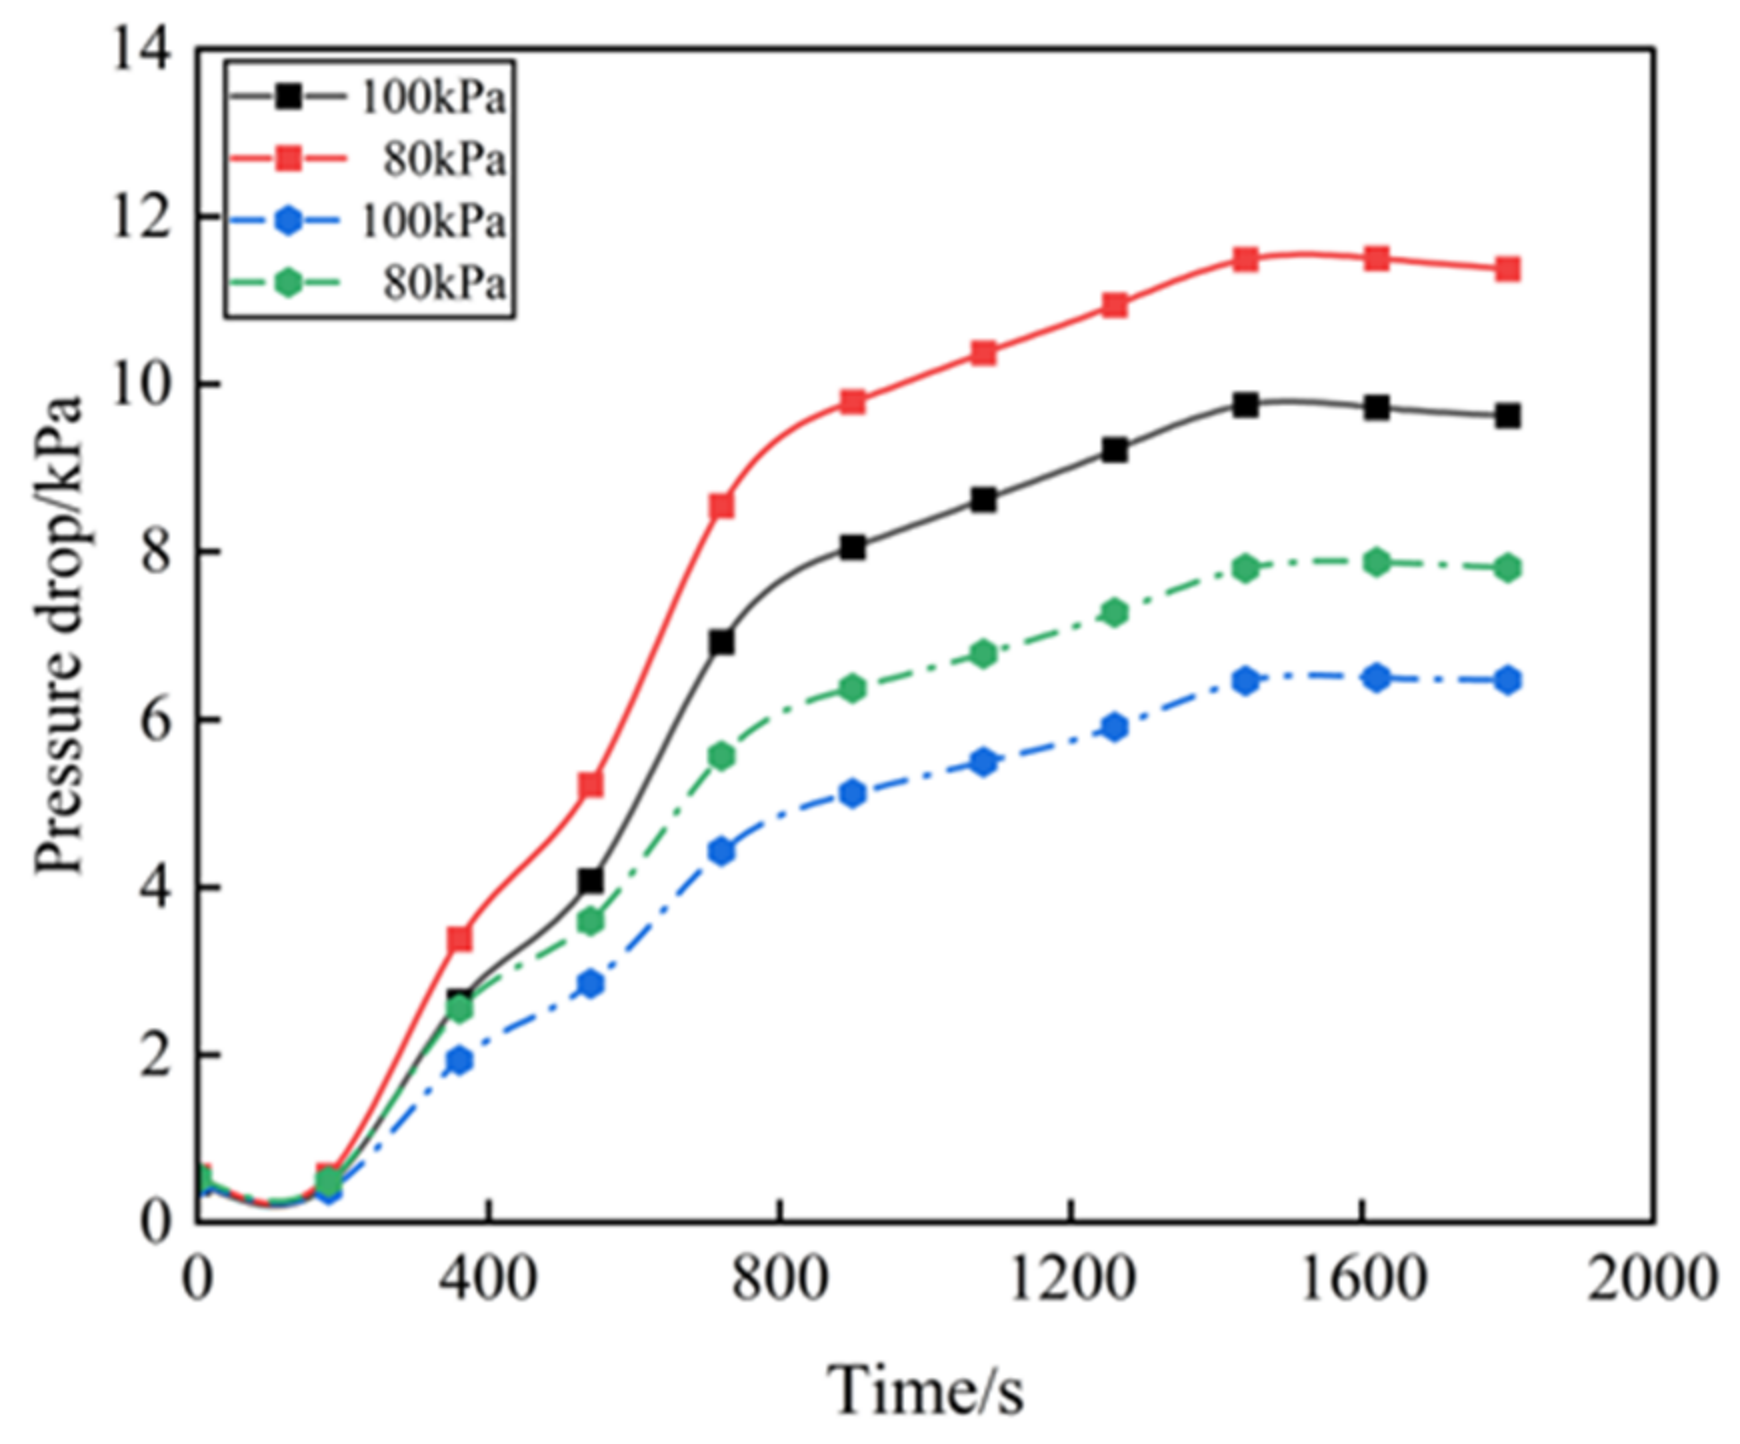
3.1.4. Effect of Asymmetric Cell Side Length Ratio on Pressure Drop Characteristics of GPF at Different Altitudes

In a plateau environment with an altitude of 1980 m and an atmospheric pressure of 80 kPa, the effect of an asymmetric cell structure on the pressure drop characteristics of a GPF at different altitudes was studied. As shown in Figure 11, the GPF pressure drop at the simulated outlet parameter at 80 kPa varies with the inlet/outlet cell ratio. Under the same conditions, with the change in the soot loading time and the increase in the inlet/outlet cell ratio, the GPF pressure drop decreases, and the decreasing speed gradually decreases from 4.51% to 1.85%.
As shown in Figure 12, the GPF pressure drop in the asymmetric cell structures varies at different altitudes. As can be seen from the figure, in the asymmetric cell structure at different inlet/outlet ratios, with the change in the soot loading time, the GPF pressure drop in the plateau environment is higher than that in the plain environment under different inlet/outlet ratios, and when the inlet/outlet ratio is 1.1, the GPF pressure drop in the plateau environment increases by 18.84% compared with the plain environment. When the inlet/outlet ratio is 1.2, the GPF pressure drop in the plateau environment increases by 19.48% compared with the plain environment. When the inlet/outlet ratio is 1.3, the increase in the plateau environment is 19.78% compared with the plain environment, and when the inlet/outlet ratio is 1.4, the increase in the plateau environment is 21.84% compared with the plain environment. The greater the inlet/outlet ratio, the greater the increase in the pressure drop with the increasing altitude.

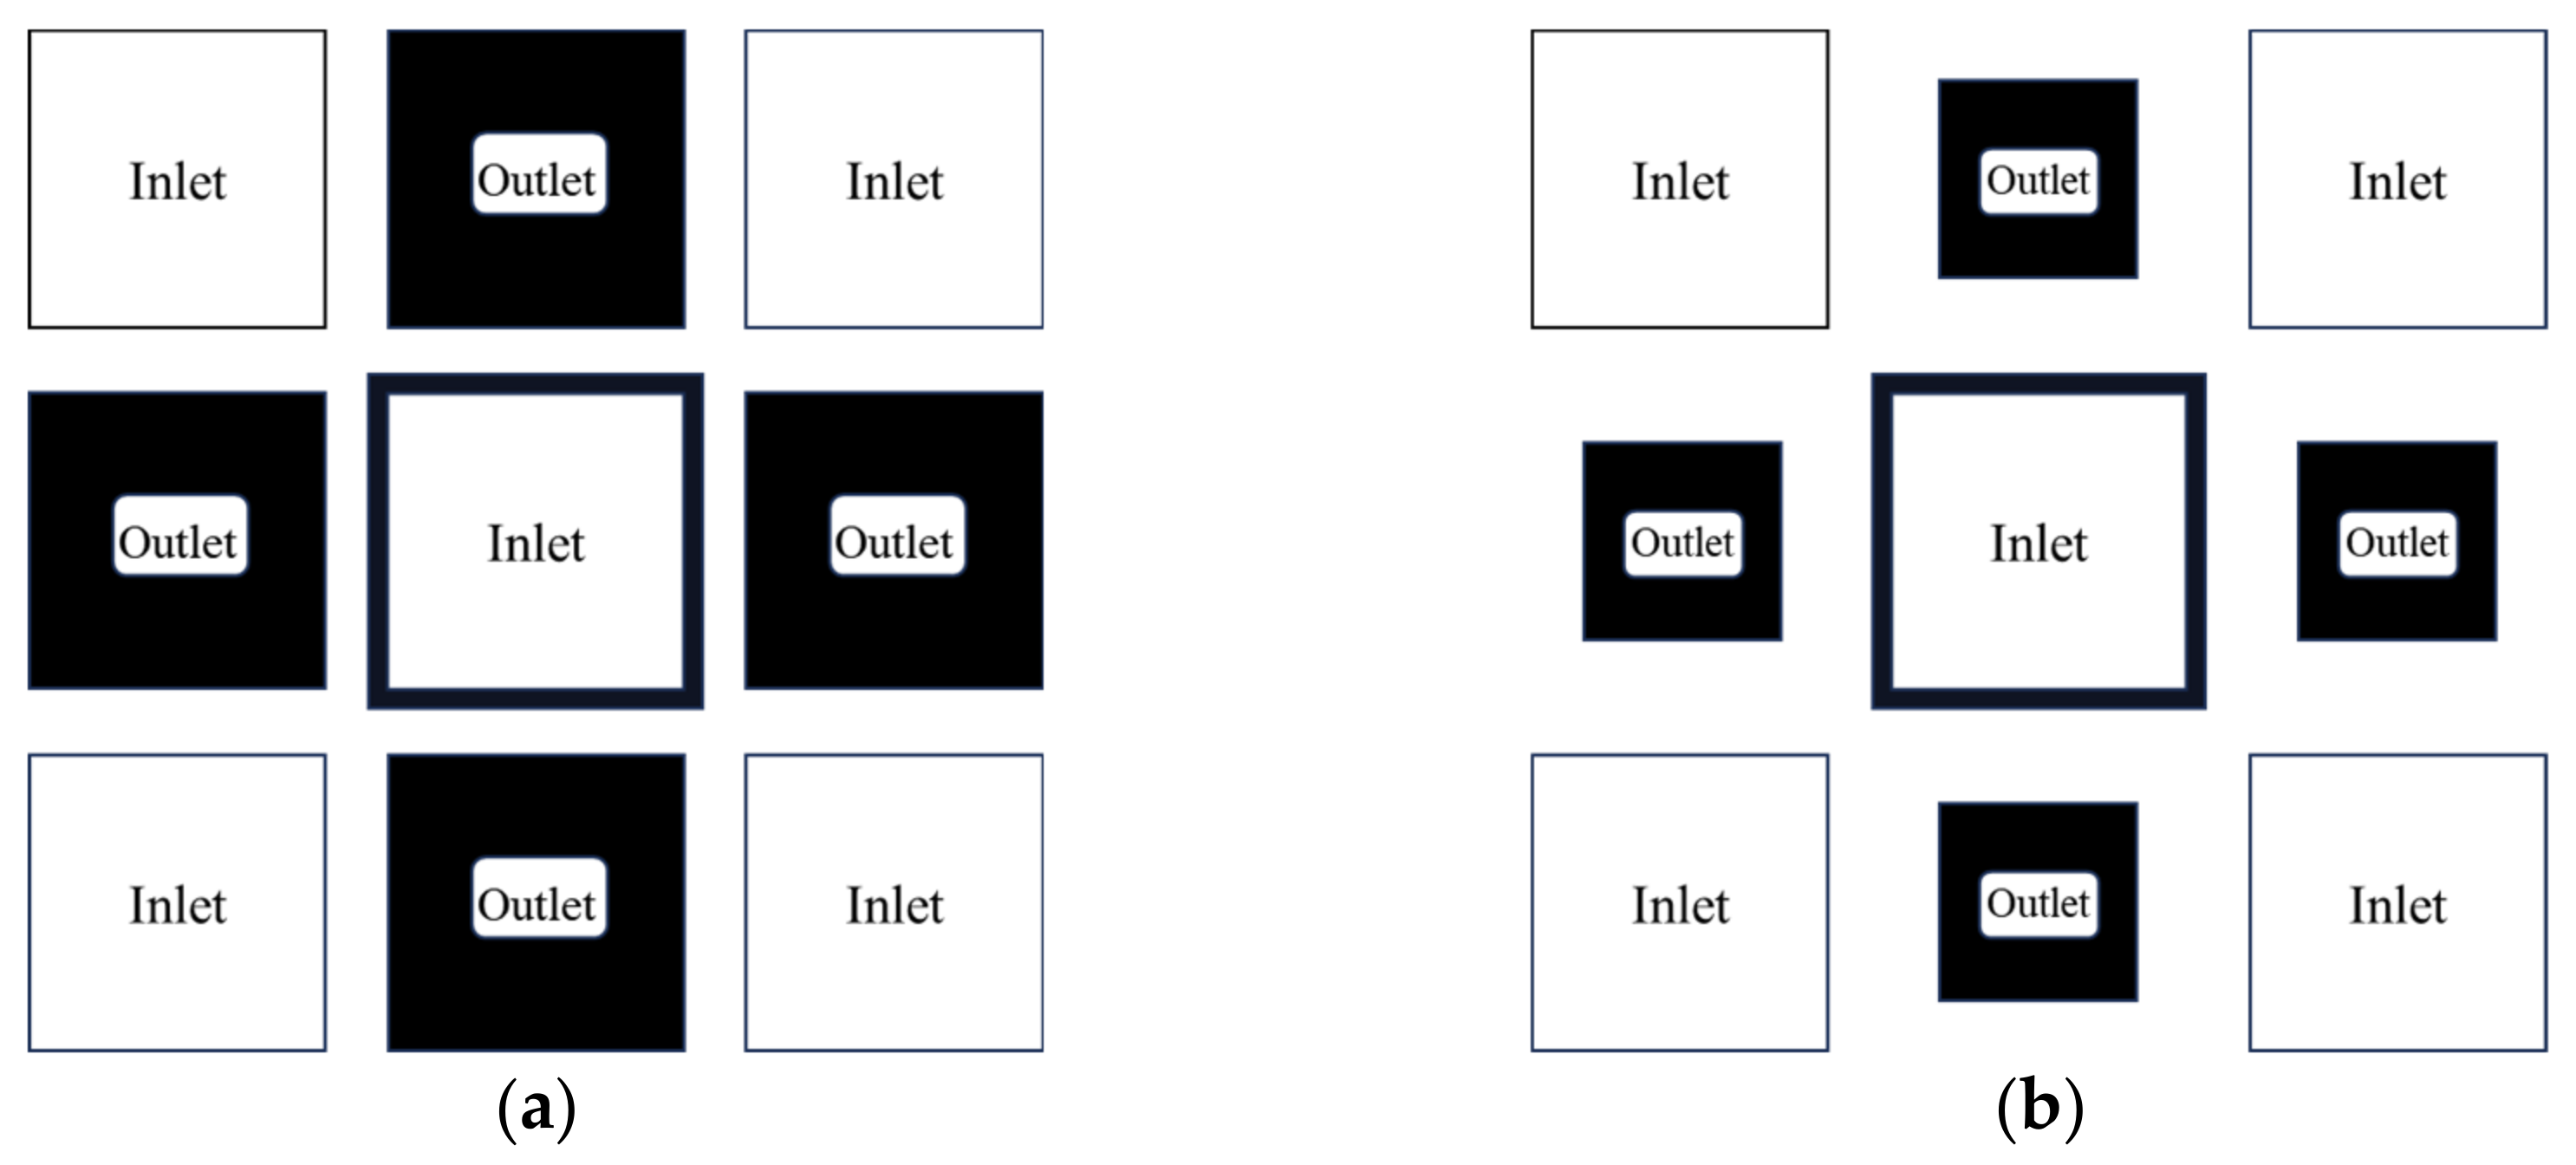
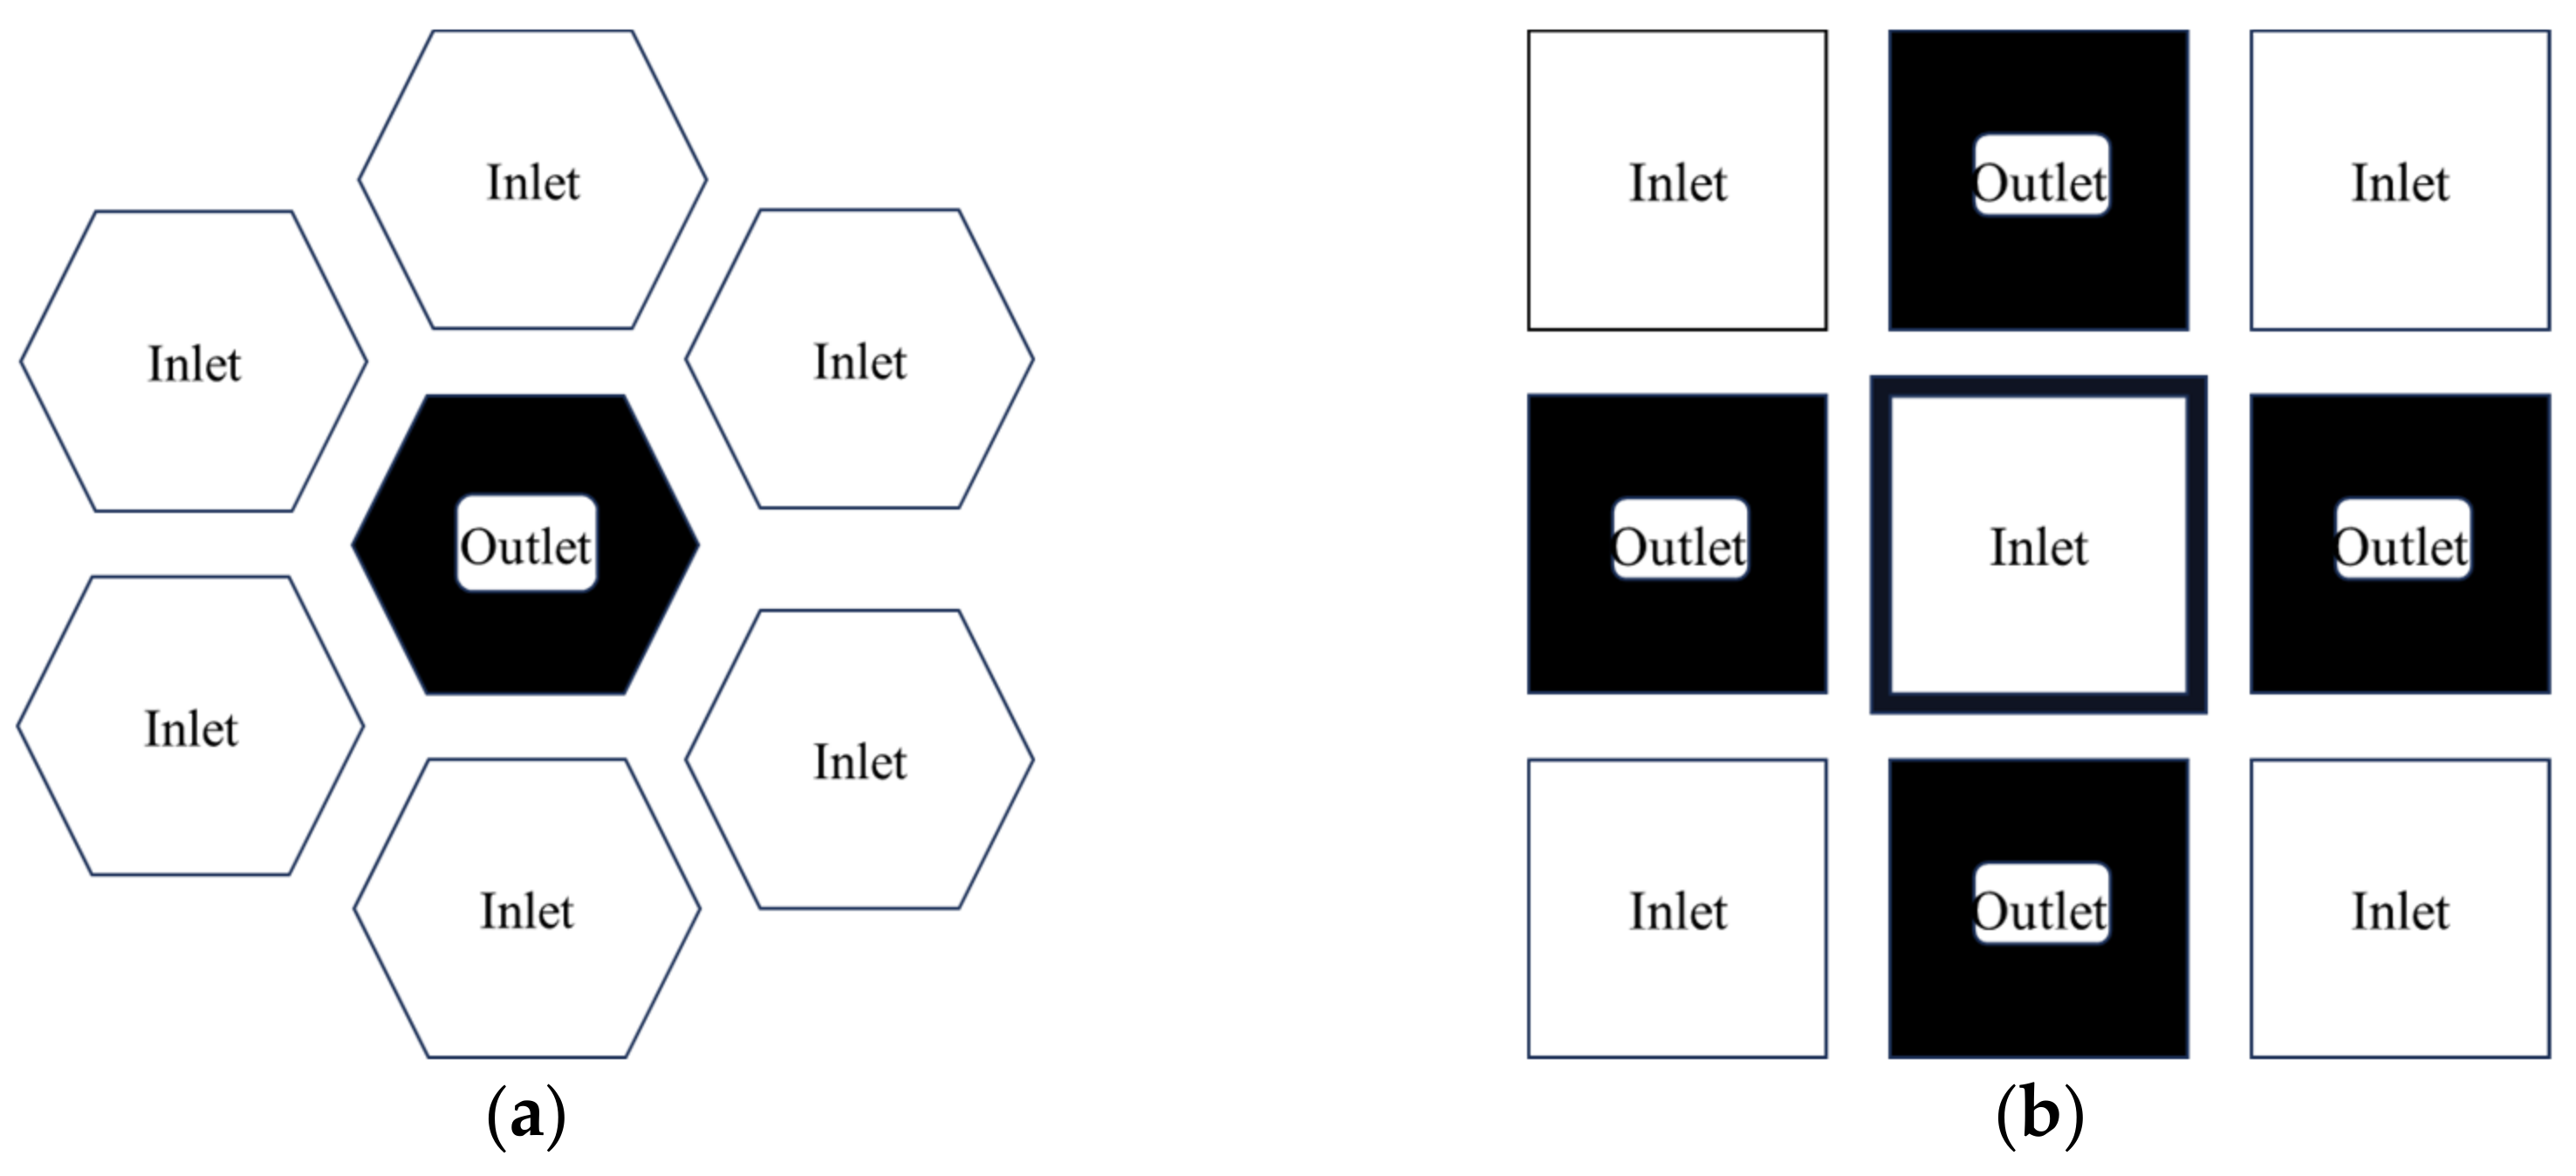
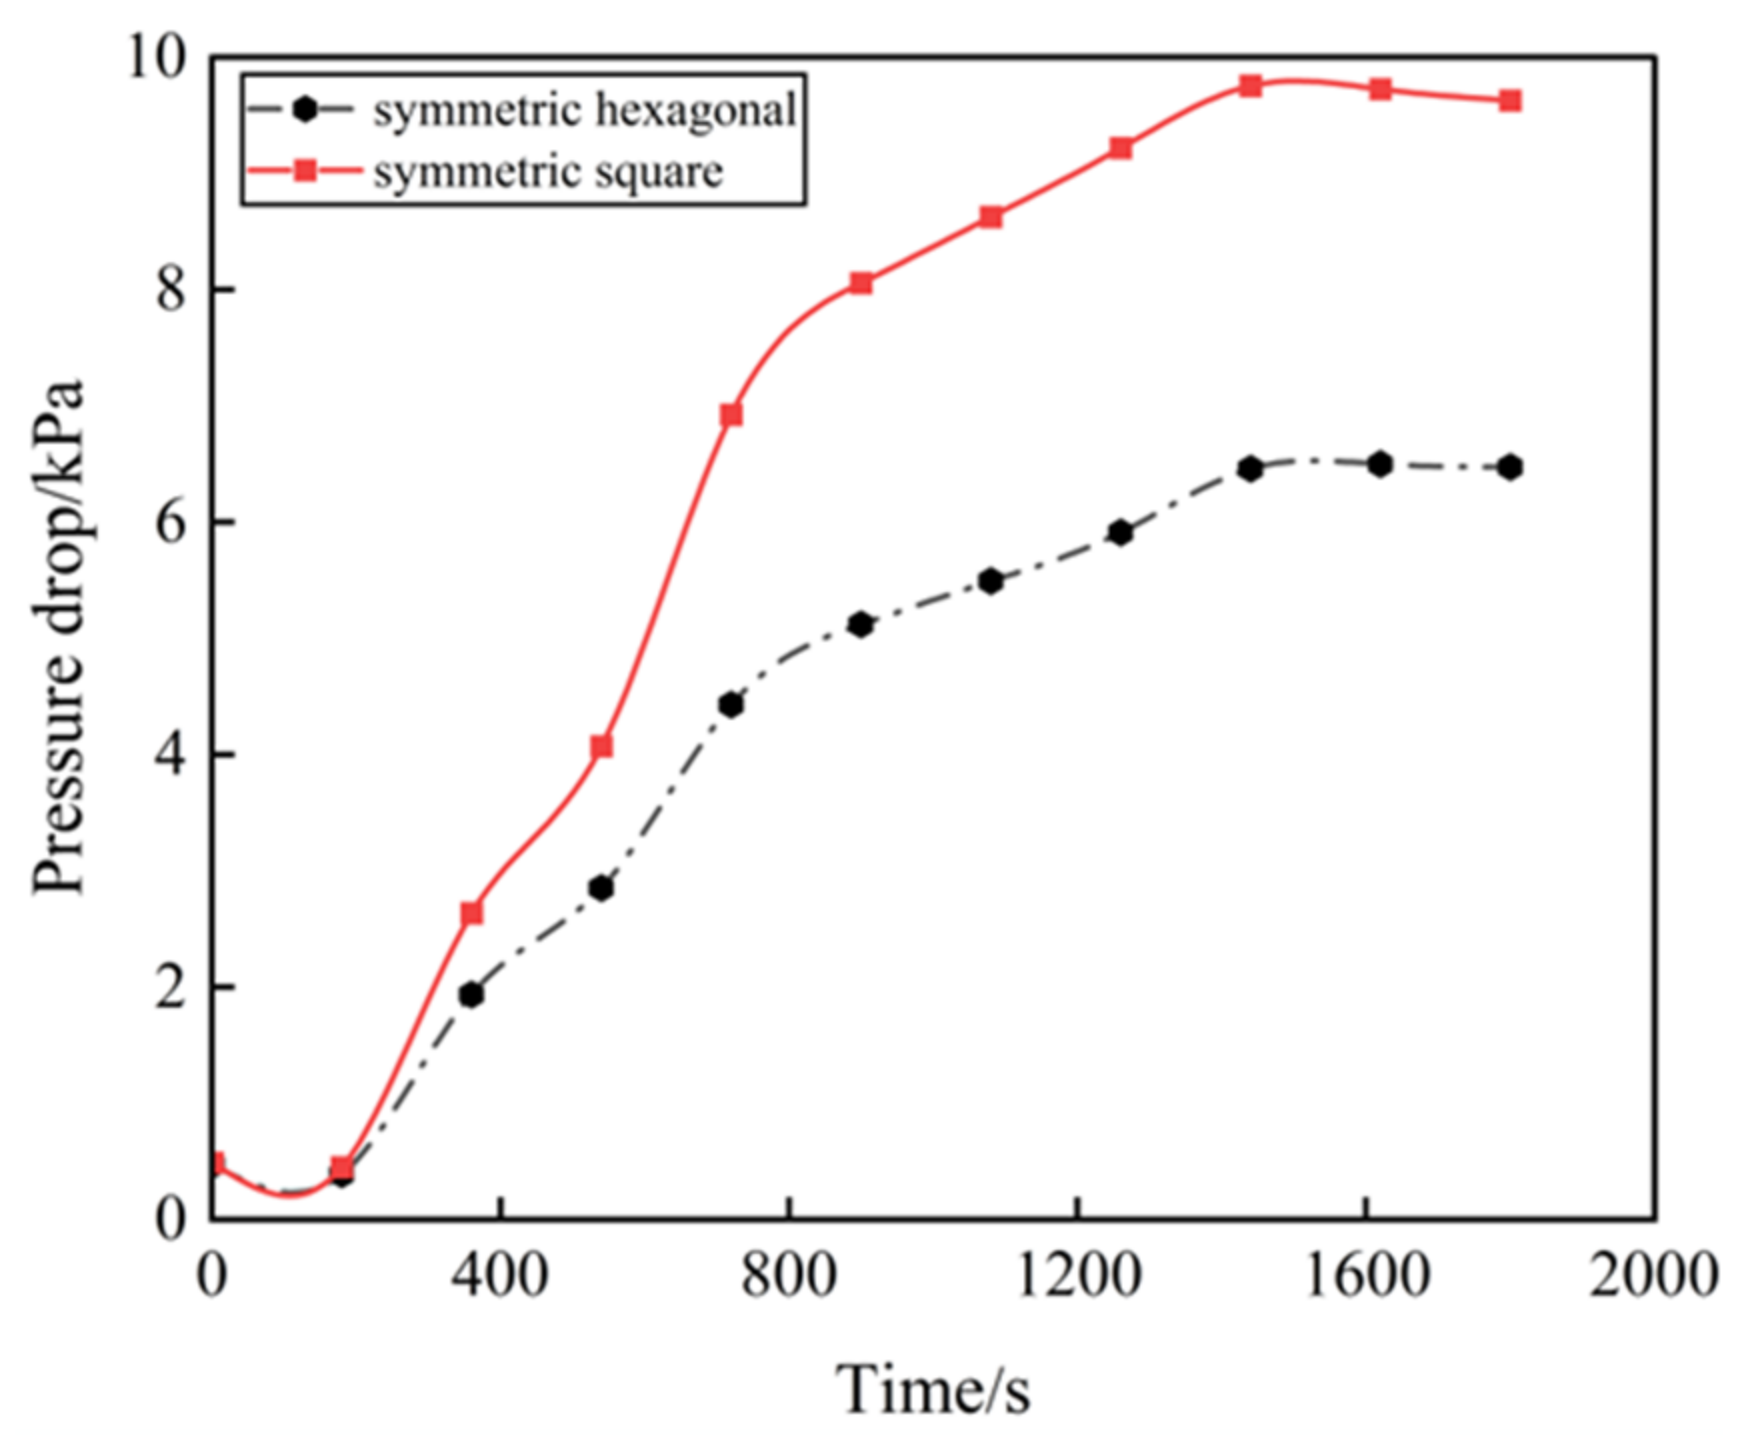
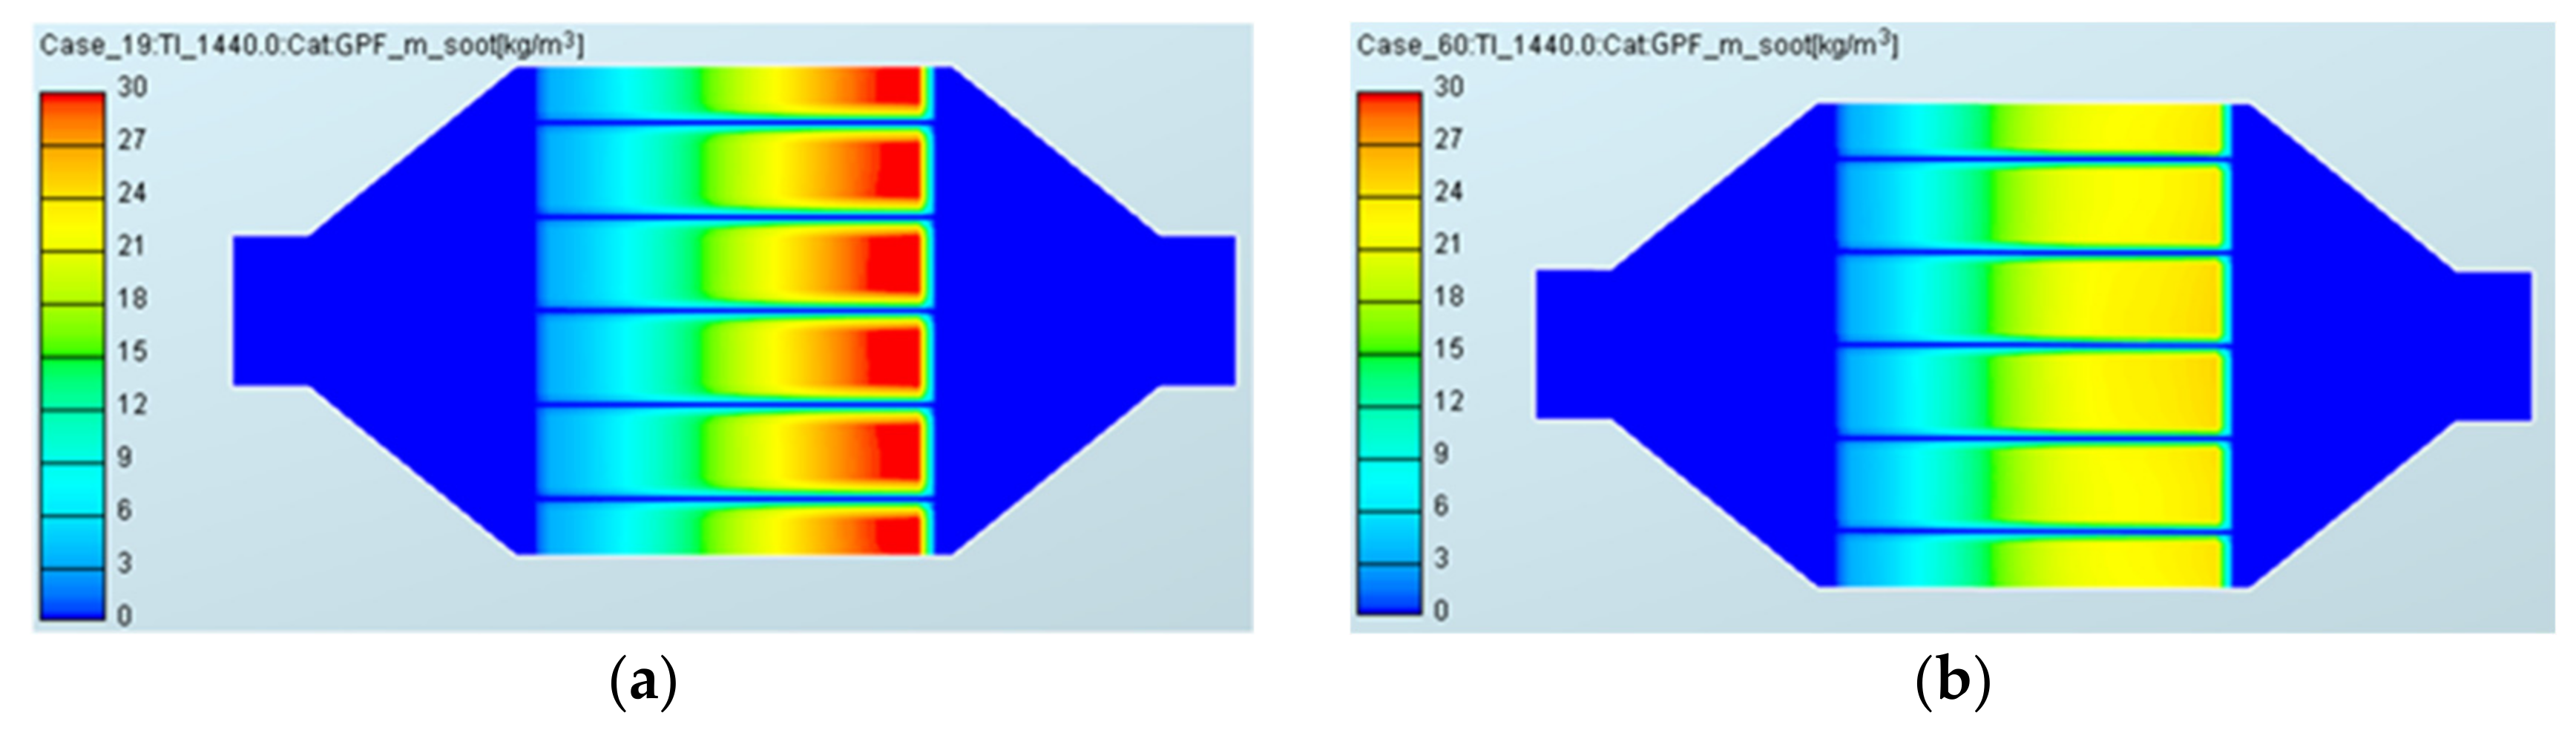
3.2. Effect of Cell Structure Shape on GPF Pressure Drop

Figure 13 shows the carrier diagram of the GPF symmetric hexagonal and symmetric square cell structures. The traditional symmetric square cell structure of a GPF has the same number of inlet and outlet cells, i.e., its opening rate is the same. The number of inlet cells in a symmetric hexagon is greater than the number of outlet cells; that is, the opening rate of the inlet and outlet cells is different. Figure 14 compares the influence of the two cell structure shapes on the pressure drop of the GPF. At the beginning, the GPF is in a clean state. With the change in the soot loading time, the pressure drop of the symmetric hexagonal cell structure is 33.17% lower than that of the symmetric square cell structure, and the maximum pressure drop difference is 3.29 kPa. This trend is similar to the results of Tsuneyoshi et al. [29]. Under the same cell density, the GPF inlet cell opening rate of the symmetric hexagonal cell structure is larger showing a large inlet air flow area, and under the same conditions, the symmetric hexagonal cell structure GPF capture area is larger, resulting in the thin thickness of the soot layer. As a result, the total pressure difference is smaller. Therefore, increasing the trapping area can reduce the pressure drop of the carrier.
Figure 15 shows the distribution of the soot particles in the GPF carriers with symmetric square and symmetric hexagonal cell structures when the soot was loaded up to 1440 s. It can be seen from Figure 15 that when the boundary conditions and capture time are the same, the soot capture distribution in the GPF carrier of the symmetric square and symmetric hexagonal cell structure is that the soot density in the rear end is greater than that of the front end, and the soot density in the symmetric hexagonal cell structure is smaller than that of the symmetric square cell structure. Due to the larger bearing area of the symmetric hexagonal cell structure GPF, the soot layer is thinner and the pressure drop is lower.

3.2.1. Effect of Cell Structure Shape on GPF Pressure Drop Characteristics under Different Cell Densities

Cell density refers to the number of cell unit section areas. In order to study the influence of the cell structure shape on the GPF pressure drop under different cell densities, two cell densities of 200 CPSI and 300 CPSI were simulated. Figure 16 shows the pressure drop curves of GPFs with symmetric hexagonal and square cell structures under different cell densities in a clean-wall state. It can be concluded from the figure that with the increase in the cell density, the GPF pressure drop of the symmetric hexagonal and square cell structures decreases; the symmetric hexagonal GPF pressure drop decreases by 18.70%, and the symmetric square GPF pressure drop decreases by 20.46%. The inverse relationship between the increase in the pressure drop and the increase in CPSI is shown. This trend is similar to the results of Wang et al. [30]. The reason for this phenomenon is that the increase in CPSI decreases the soot loading in individual cells and decreases the pressure drop. When the cell density is the same, the GPF pressure drop of the symmetric hexagonal cell structure of 200 CPSI is 35.22% lower than that of the symmetric square cell structure of 200 CPSI, and the GPF pressure drop of the symmetric hexagonal cell structure of 300 CPSI is 33.17% lower than that of the symmetric square cell structure of 300 CPSI.

3.2.2. Effect of Cell Structure Shape on GPF Pressure Drop Characteristics under Different Filter Wall Thicknesses

The influence of symmetric square and symmetric hexagonal cell structures on the pressure drop characteristics of GPFs under different wall thicknesses was studied, and two wall thicknesses of 6 mil and 8 mil were selected, respectively, and the other conditions were consistent for the simulation research. Figure 17 shows the pressure drop curves of GPFs with symmetric hexagonal and square cell structures under different wall thicknesses in a clean-wall state. It can be seen from the figure that with the increase in the wall thickness, the GPF pressure drop of the symmetric square and symmetric hexagonal cell structures increases, the GPF pressure drop of the symmetric square cell increases by 7.45%, and the GPF pressure drop of the symmetric hexagonal channel increases by 7.33%. From the results of the simulations, it can be seen that increasing the wall thickness affects the GPF pressure drop of different cell structures to basically the same extent. Due to the increase in the filter wall thickness, the particles are more likely to be trapped on the surface of the filter wall, the amount of particle capture increases, and the resistance of the exhaust penetrating filter wall increases, so the pressure drop also increases. Compared to the symmetric square cell structure GPF, the pressure drop of the symmetric hexagonal cell structure GPF decreased by 33.17% and 32.84% for both wall thicknesses, respectively. Therefore, regardless of whether it is a symmetric hexagonal cell structure or a symmetric square cell structure, reducing the filter wall thickness can decrease the filtration pressure drop and improve the flow resistance performance of the GPF.

3.2.3. Effect of Cell Structure Shape on GPF Pressure Drop Characteristics under Different Plug Lengths

The influence of symmetric square and symmetric hexagonal cell structures on the pressure drop characteristics of GPFs under different plug lengths was studied, and three plug lengths of 3 mm, 6 mm, and 9 mm were selected, respectively, and the other conditions were consistent for the simulation research. Figure 18 shows the GPF pressure drop with the soot loading time for different cell structure shapes under different plug lengths. As can be seen in the figure, the pressure drop of a symmetric hexagon is lower than that of a symmetric square for the same plug length. Compared to the symmetric square cell structure GPF, the symmetric hexagon cell structure GPF pressure drop decreased by 32.88%, 33.17%, and 33.03% for the three plug lengths, respectively. Under the same cell structure, with the increase in the plug length, the total pressure drop of the GPF filter increases. When the wall thickness increases from 3 mm to 6 mm in 360~540 s, the GPF’s pressure drop increases slowly, and when the wall thickness increases from 6 mm to 9 mm, the pressure drop increases rapidly. With the change in the soot loading time, the length of the symmetric hexagonal GPF plug increased from 3 mm to 6 mm and the pressure drop increased by 6.84%; the pressure drop increased by 9.94% when the plug length increased from 6 mm to 9 mm. When the length of the symmetric square GPF plug increased from 3 mm to 6 mm, the pressure drop increased by 7.30%, and from 6 mm to 9 mm, the pressure drop increased by 9.71%. Therefore, by reducing the length of the plug, the pressure drop can be reduced.

3.2.4. Effect of Cell Structure Shape on GPF Pressure Drop Characteristics under Different Altitudes

In a plateau environment with an altitude of 1980m and an atmospheric pressure of 80 kPa, the influence of the cell structure shape on the GPF pressure drop characteristics at different altitudes was studied. Figure 19 shows the variation of the GPF pressure drop with the soot loading time for different cell structure shapes at different altitudes. From the figure, it can be seen that in the plateau environment, the symmetric hexagonal and symmetric square have the same pattern of variation in the pressure drop, and with the increase in the altitude, the pressure drop also increases. The symmetric square GPF pressure drop increases by 17.79%, and the symmetric hexagonal GPF pressure drop increases by 20.82%, so the plateau environment has a large influence on the GPF pressure drop of the symmetric hexagonal cell structure. In the plain environment, the GPF of the symmetric hexagonal cell structure is 33.78% lower than that of the symmetric square cell structure, while the GPF pressure drop of the symmetric hexagonal cell structure is 32.07% lower than that of the symmetric square cell structure in the plateau environment, and the difference in altitude has little effect on the GPF pressure drop of different cell structures.

4. Conclusions

The GPF pressure drop model is established based on AVL-Fire 2020 software, and the GPF trapping process was simulated to study the effects of the structural parameters and altitude on the GPF pressure drop characteristics under different cell structures. The simulation results show that both symmetric hexagonal and asymmetric cell structure GPFs have a lower pressure than the traditional symmetric square cell structure GPFs for the same exhaust flow rate, cell density, and wall thickness. The symmetric hexagonal cell structure GPF pressure drop is decreased more significantly and its soot-carrying capacity is higher. With the change in the soot loading time, the pressure drop of the symmetric hexagonal cell structure is 33.17% lower than that of the symmetric square cell structure, and the maximum pressure drop difference is 3.29 kPa. Moreover, as the inlet/outlet ratio increases, the difference between the pressure drop profiles of different proportional cell structures decreases. Increasing the cell density reduces the pressure drop in the GPF of both asymmetric and symmetric hexagonal cell structures, and an inlet/outlet ratio of 1.2 is the best to decrease the pressure drop in asymmetric cell structures. The increase in the GPF pressure drop for different cell structures is in direct proportion to the increase in the wall thickness and plug length. Therefore, a proper reduction in the wall thickness and plug length is beneficial in reducing the pressure drop during trapping. As the altitude increases, the symmetric square cell structure has the smallest increase in pressure drop compared to the asymmetric and symmetric hexagonal cell structures, and the larger the inlet/outlet ratio, the larger the increase in the pressure drop.
In future work, the gasoline engine can be coupled for joint simulations to analyze the effect of the cell structure on the pressure drop characteristics of the GPF and the performance of the gasoline engine under transient conditions.

Author Contributions

Conceptualization, L.H. and Y.C.; Methodology, L.H.; Software, D.W.; Validation, L.H., H.Y. and J.L.; Formal analysis, L.H.; Investigation, L.H.; Resources, L.H., J.L., C.H. and D.W.; Data curation, L.H. and C.H.; Writing—original draft preparation, L.H.; Writing—review and editing, N.Y., Y.Y. and C.H.; Visualization, J.L.; Supervision, J.L.; Project administration, J.L.; Funding acquisition, J.L. All authors have read and agreed to the published version of the manuscript.

Funding

This work is financially supported by National Natural Science Foundation of China (NSFC), grant number 51968065; Yunnan Provincial High-Level Talent Support Project, grant number YNWR-QNBJ-2018-066 and YNQR-CYRC-2019-001; Yunnan Provincial Science and Technology Department Project, grant number 202301BD070001-077.

Institutional Review Board Statement

Not applicable.

Informed Consent Statement

Not applicable.

Data Availability Statement

The data presented in this study are available on request from the corresponding author. The data are not publicly available due to confidentiality of test data.

Conflicts of Interest

The authors declare no conflicts of interest.

References

  1. Ni, T.; Han, B.; Bai, Z. Source apportionment of PM10 in four cities of northeastern China. Aerosol Air Qual. Res. 2012, 12, 571–582. [Google Scholar] [CrossRef]
  2. Li, H.; Wang, Q.; Yang, M.; Li, F.; Wang, J.; Sun, Y.; Wang, C.; Wu, H.; Qian, X. Chemical characterization and source apportionment of PM2.5 aerosols in a megacity of Southeast China. Atmos. Res. 2016, 181, 288–299. [Google Scholar] [CrossRef]
  3. Zhu, R.; Hu, J.; Bao, X.; He, L.; Lai, Y.; Zu, L.; Li, Y.; Su, S. Tailpipe emissions from gasoline direct injection (GDI) and port fuel injection (PFI) vehicles at both low and high ambient temperatures. Environ. Pollut. 2016, 216, 223–234. [Google Scholar] [CrossRef]
  4. Ko, J.; Kim, K.; Chung, W.; Myung, C.-L.; Park, S. Characteristics of on-road particle number (PN) emissions from a GDI vehicle depending on a catalytic stripper (CS) and a metal-foam gasoline particulate filter (GPF). Fuel 2019, 238, 363–374. [Google Scholar] [CrossRef]
  5. Davis, S.C.; Williams, S.E.; Boundy, R.G.; Moore, S. 2015 Vehicle Technologies Market Report; Oak Ridge National Lab. (ORNL): Oak Ridge, TN, USA, 2016. [Google Scholar]
  6. Duronio, F.; De Vita, A.; Allocca, L.; Anatone, M. Gasoline direct injection engines—A review of latest technologies and trends. Part 1: Spray breakup process. Fuel 2020, 265, 116948. [Google Scholar] [CrossRef]
  7. Joshi, A.; Johnson, T.V. Gasoline particulate filters—A review. Emiss. Control Sci. Technol. 2018, 4, 219–239. [Google Scholar] [CrossRef]
  8. Rotondi, R. Modeling mixture formation in a gasoline direct injection engine. J. Appl. Mech. 2006, 73, 931–939. [Google Scholar] [CrossRef]
  9. Adam, F.; Olfert, J.; Wong, K.F.; Kunert, S.; Richter, J.M. Effect of Engine-Out Soot Emissions and the Frequency of Regeneration on Gasoline Particulate Filter Efficiency; SAE Technical Paper; SAE: Warrendale, PA, USA, 2020. [Google Scholar]
  10. Martínez-Munuera, J.C.; Zoccoli, M.; Giménez-Mañogil, J.; García-García, A. Lattice oxygen activity in ceria-praseodymia mixed oxides for soot oxidation in catalysed Gasoline Particle Filters. Appl. Catal. B Environ. 2019, 245, 706–720. [Google Scholar] [CrossRef]
  11. Jang, J.; Lee, J.; Choi, Y.; Park, S. Reduction of particle emissions from gasoline vehicles with direct fuel injection systems using a gasoline particulate filter. Sci. Total Environ. 2018, 644, 1418–1428. [Google Scholar] [CrossRef]
  12. Kontses, A.; Triantafyllopoulos, G.; Ntziachristos, L.; Samaras, Z. Particle number (PN) emissions from gasoline, diesel, LPG, CNG and hybrid-electric light-duty vehicles under real-world driving conditions. Atmos. Environ. 2020, 222, 117126. [Google Scholar] [CrossRef]
  13. Yue, H.; Lehmen, A.; Van Nieuwstadt, M.; Pan, Z.; Wang, J.; Fang, Z. A study on the filtration efficiency and regeneration capacity of the gasoline particulate filter. Proc. Inst. Mech. Eng. Part D J. Automob. Eng. 2021, 235, 346–361. [Google Scholar] [CrossRef]
  14. Lee, Z.; Kim, T.; Park, S. Influences of exhaust load and injection timing on particle number emissions in a gasoline direct injection engine. Fuel 2020, 268, 117344. [Google Scholar] [CrossRef]
  15. Saito, C.; Nakatani, T.; Miyairi, Y.; Yuuki, K.; Makino, M.; Kurachi, H.; Heuss, W.; Kuki, T.; Furuta, Y.; Kattouah, P.; et al. New Particulate Filter Concept to Reduce Particle Number Emissions; SAE Technical Paper; SAE: Warrendale, PA, USA, 2011. [Google Scholar]
  16. Ito, Y.; Shimoda, T.; Aoki, T.; Shibagaki, Y.; Yuuki, K.; Sakamoto, H.; Vogt, C.; Matsumoto, T.; Heuss, W.; Kattouah, P.; et al. Advanced Ceramic Wall Flow Filter for Reduction of Particulate Number Emission of Direct Injection Gasoline Engines; SAE Technical Paper; SAE: Warrendale, PA, USA, 2013. [Google Scholar]
  17. Zuo, Q.; Yang, X.; Zhu, X.; Guan, Q.; Wei, K.; Shen, Z.; Zhu, G.; Zhang, B. Effects of structural optimization design of gasoline particulate filter on soot emission and performance of GDI engine. Int. J. Environ. Sci. Technol. 2022, 19, 11199–11216. [Google Scholar] [CrossRef]
  18. Niu, Y.; Zhang, T.; Liu, X.; Feng, S.; Zhang, Q. Simulation study of GPF performance based AVL-FIRE. J. Hebei Univ. Technol. 2018, 47, 37–41. [Google Scholar]
  19. Kannan, R.; Ramappan, V.; Mehta, Z.; Govindula, S.S.; Zielinski, A.; Thornton, M.; Gillim, A.; Paramadhayalan, T. Pressure Drop Performance of Gasoline Particulate Filters-Experimental and Modeling Study; SAE Technical Paper; SAE: Warrendale, PA, USA, 2022. [Google Scholar]
  20. Ito, Y.; Shimoda, T.; Aoki, T.; Yuuki, K.; Sakamoto, H.; Kato, K.; Thier, D.; Kattouah, P.; Ohara, E.; Vogt, C. Next Generation of Ceramic Wall Flow Gasoline Particulate Filter with Integrated Three Way Catalyst; SAE Technical Paper; SAE: Warrendale, PA, USA, 2015. [Google Scholar]
  21. Shimoda, T.; Ito, Y.; Saito, C.; Nakatani, T.; Shibagaki, Y.; Yuuki, K.; Sakamoto, H.; Vogt, C.; Matsumoto, T.; Furuta, Y.; et al. Potential of a Low Pressure Drop Filter Concept for Direct Injection Gasoline Engines to Reduce Particulate Number Emission; SAE Technical Paper; SAE: Warrendale, PA, USA, 2012. [Google Scholar]
  22. Piscaglia, F.; Ferrari, G. A novel 1D approach for the simulation of unsteady reacting flows in diesel exhaust after-treatment systems. Energy 2009, 34, 2051–2062. [Google Scholar] [CrossRef]
  23. Yao, S.; Wang, K.; Zhang, X.; Song, C.; Lei, H.; Lv, G. Simulation study on the regeneration equilibrium state of gasoline particulate filters. Chin. Intern. Combust. Engine Eng. 2021, 42, 93–99. [Google Scholar]
  24. Villata, G.; Tarabocchia, A.; Bozzolini, V.; Caroca, J.; Russo, N.; Fino, D.; Saracco, G.; Specchia, V. Pollutants emissions during mild catalytic DPF regeneration in light-duty vehicles. SAE Int. J. Fuels Lubr. 2009, 2, 78–87. [Google Scholar] [CrossRef]
  25. Li, L. Simulation Analysis and Experimental Verification GPF Technology of GDI Engines; Hebei University of Technology: Tianjin, China, 2015. [Google Scholar]
  26. Chen, Z.; Li, Z.; Jiao, P.; Zhang, W.; Gao, L. Simulation DPF with different characteristics channels. In Proceedings of the 2011 International Conference on Electric Information and Control Engineering, Wuhan, China, 15–17 April 2011; pp. 5302–5305. [Google Scholar]
  27. Tsuneyoshi, K.; Yamamoto, K. Experimental study of hexagonal and square diesel particulate filters under controlled and uncontrolled catalyzed regeneration. Energy 2013, 60, 325–332. [Google Scholar] [CrossRef]
  28. Xiao, G.; Li, B.; Tian, H.; Leng, X.; Long, W. Numerical study on flow and pressure drop characteristics of a novel type asymmetric wall-flow diesel particulate filter. Fuel 2020, 267, 117148. [Google Scholar] [CrossRef]
  29. Tsuneyoshi, K.; Yamamoto, K. A study on the cell structure and the performances of wall-flow diesel particulate filter. Energy 2012, 48, 492–499. [Google Scholar] [CrossRef]
  30. Wang, D.; Tan, P.; Zhu, L.; Wang, Y.-H.; Hu, Z.-Y.; Lou, D.-M. Novel soot loading prediction model of diesel particulate filter based on collection mechanism and equivalent permeability. Fuel 2021, 286, 119409. [Google Scholar] [CrossRef]
Figure 1. Pair of GPF Channels.
Atmosphere 15 00805 g001
Figure 2. Gasoline particulate filter grid model.
Atmosphere 15 00805 g002
Figure 3. Comparison of gasoline particulate filter pressure drop between simulation and experiment.
Atmosphere 15 00805 g003
Figure 4. Symmetric and asymmetric cell structure. (a) Symmetric; (b) asymmetric.
Atmosphere 15 00805 g004
Figure 5. Variation of GPF pressure drop with different inlet/outlet ratios.
Atmosphere 15 00805 g005
Figure 6. Comparison of soot distribution of GPF with symmetric and asymmetric cell structure. (a) Inlet/outlet ratio of 1; (b) inlet/outlet ratio of 1.1; (c) inlet/outlet ratio of 1.2; (d) inlet/outlet ratio of 1.3; and (e) inlet/outlet ratio of 1.4.
Atmosphere 15 00805 g006
Figure 7. Variation of GPF pressure drop for asymmetric cell structure with different cell densities. (a) 200 CPSI; (b) 300 CPSI.
Atmosphere 15 00805 g007
Figure 8. Variation of pressure drop for asymmetric cell structures with different wall thicknesses. (a) Asymmetric GPF pressure drop at 6 mil; (b) asymmetric GPF pressure drop at 8 mil.
Atmosphere 15 00805 g008
Figure 9. Variation of pressure drop for asymmetric cell structures at different wall thicknesses. (a) Inlet/outlet ratio of 1.1; (b) inlet/outlet ratio of 1.2; (c) inlet/outlet ratio of 1.3; (d) inlet/outlet ratio of 1.4.
Atmosphere 15 00805 g009aAtmosphere 15 00805 g009b
Figure 10. Variation of pressure drop in asymmetric cell structure with different plug lengths. (a) Inlet/outlet ratio of 1.1; (b) inlet/outlet ratio of 1.3.
Atmosphere 15 00805 g010
Figure 11. Variation of GPF pressure drop in asymmetric cell structure at 80 kPa.
Atmosphere 15 00805 g011
Figure 12. Variation of pressure drop in asymmetric cell structure at different atmospheric pressures. (a) Inlet/outlet ratio of 1.1; (b) inlet/outlet ratio of 1.2; (c) inlet/outlet ratio of 1.3; (d) inlet/outlet ratio of 1.4.
Atmosphere 15 00805 g012
Figure 13. Symmetric hexagonal and symmetric square cell structure. (a) Symmetric hexagonal; (b) symmetric square.
Atmosphere 15 00805 g013
Figure 14. Symmetric hexagonal and symmetric square cell structure GPF pressure drop variation.
Atmosphere 15 00805 g014
Figure 15. Comparison of soot distribution of GPF with symmetric square and symmetric hexagonal cell structure. (a) Symmetric square cell structure GPF; (b) symmetric hexagonal cell structure GPF.
Atmosphere 15 00805 g015
Figure 16. Variation of pressure drop in symmetric square and symmetric hexagonal GPF at different cell densities.
Atmosphere 15 00805 g016
Figure 17. Variation of pressure drop in symmetric square and symmetric hexagonal GPF at different filter wall thicknesses.
Atmosphere 15 00805 g017
Figure 18. Variation of pressure drop in symmetric square and symmetric hexagonal GPF at different plug lengths.
Atmosphere 15 00805 g018
Figure 19. Variation of pressure drop in symmetric square and symmetric hexagonal GPF at different altitudes.
Atmosphere 15 00805 g019
Table 1. GPF main parameters.
ParameterValue
Number of channels per square inch 300
Wall thickness (mm) 0.1524
Carrier density (kg·m−3) 1500
Thermal conductivity (W·(m·K)−1) 5
Specific heat capacity (J·(kg·K)−1) 1250
Porous wall permeability (m2) 5 × 10 13
Soot layer permeability (m2) 5 × 10 14
Deep soot layer permeability (m2) 5 × 10 15
Deep soot thickness (mm) 0.01
Deep soot layer density (kg·m−3) 3
Initial soot layer density (kg·m−3) 1 6
Amount of soot in the exhaust
(kg Particle·kg Gas−1)
0.0002
Disclaimer/Publisher’s Note: The statements, opinions and data contained in all publications are solely those of the individual author(s) and contributor(s) and not of MDPI and/or the editor(s). MDPI and/or the editor(s) disclaim responsibility for any injury to people or property resulting from any ideas, methods, instructions or products referred to in the content.

