Abstract
Flash drought is characterized by rapid onset and short-duration drought conditions caused by a combination of factors, including high evaporation, high temperature, and prolonged periods of little to no precipitation, leading to a sudden and severe decrease in soil moisture levels. In comparison to conventional drought, it is more susceptible to the effects of global warming and has the potential to become a common drought phenomenon in the coming years, necessitating further research. In this paper, we focused on flash drought events, specifically in forest parts of northeastern China that are included within the Greater Khingan Mountains (GKM), Lesser Khingan Mountains (LKM), and Changbai Mountains (CM), using daily soil moisture data as well as SPOT- VEGETATION NDVI satellite data from 2000 to 2020 and determined their impact on the forest NDVI. Our major findings are as follows. (1) The forest within GKM had the maximum area being affected by flash drought events. (2) The frequency ranged from 1 to 2 times, whereas the total duration varied between 20 and 55 days over the study area in a 21-year period. (3) Flash drought was most common in the plant-growing seasons. (4) The flash drought events had a negative influence on the forest NDVI. Our study contributes to a deeper understanding of the flash drought dynamics in forest areas of northeast China for flash drought monitoring, prediction, and management strategies in this region.
1. Introduction
Out of all the climate and weather extremes, drought is one of the most damaging and little understood phenomena [1], with wide-ranging and far-reaching impacts [2]. It brings severe devastation in numerous aspects, including the natural environment, agricultural output, and living water [3]. The American Meteorological Society (AMS) identified four distinct types of drought: hydrological, meteorological, agricultural, and socioeconomic. These categories are determined by the environmental and socioeconomic elements that are impacted by the drought [4]. Scientific study on flash drought has been ongoing since 2002 [5] and the term “flash drought” was developed to call attention to this extraordinary drought type and to better differentiate these occurrences from more typical droughts [6]. It looks as though they occur in a “flash”, making them and their consequences more challenging to forecast and plan for [7]. A flash drought differs from a traditional drought in its rapid onset, intensification, and short duration [8]. The attention of community and academic researchers was drawn to the flash drought event when a severe drought occurred in the central and western plains of the United States in the spring of 2012 [9].
Flash droughts occur as a result of elevated evapotranspiration (ET) rates produced by abnormally high temperatures, strong winds, and intense solar radiation. These conditions are accompanied by little or no rainfall [10], leading to reduced soil moisture levels [11]. When there is a lack of rainfall coupled with severe meteorological phenomena that enhance the demand for evaporation, such as elevated temperatures, various elements work together to cause a rapid increase in evaporation–transpiration processes and the reduction of soil moisture (SM) [12]. When this condition lasts for a prolonged period ranging from several days to several weeks, the evapotranspiration (ET) attributes undergo a transition from being regulated by energy to being governed by moisture. Consequently, this transition gives rise to a sudden onset of drought known as a flash drought, which is quickly accompanied by an increase in vegetation stress [13], and the stress can cause serious impacts on the vegetation health and productivity. Long-term flash droughts have the potential to increase environmental unsustainability, human mortality, and food and water insecurity because of their unpredictable nature and propensity to cause simultaneous severe events like heat waves and wildfires [14].
While significant progress has been made in understanding flash droughts, the methods for detecting and characterizing them are still evolving and not yet standardized [15]. The evaporative stress index (ESI) [16], standardized evaporative stress ratio (SESR) [17], standardized precipitation evaporation index (SPEI) [18], evaporative demand drought index (EDDI) [19], and soil moisture volatility index (SMVI) [20] are some of the drought indices adopted by researchers for determining flash drought events. While studying major climatic variables like precipitation, root-zone soil moisture, temperature, and the actual and projected evapotranspiration that are used to define flash droughts, it was discovered that during flash droughts, the root-zone soil moisture exhibits the clearest signal [21]. Likewise, various satellite-based indicators have been utilized to observe the vegetation’s reaction to flash drought, such as the leaf area index (LAI) [22], solar-induced chlorophyll fluorescence (SIF) [23], normalized difference vegetation index (NDVI) [24], gross primary productivity (GPP) [25], and net primary productivity (NPP) [26]. The normalized difference vegetation index (NDVI) serves as a crucial indicator utilized for determining the vegetation greenness, providing information about the vegetation status [27]. In the context of flash droughts, the NDVI plays an important role in monitoring vegetative stress and dynamics in response to sudden changes in soil moisture and precipitation levels [28].
Currently, there also remains an argument regarding the precise definition of a flash drought. Although flash droughts were divided into two types, heat wave flash drought and precipitation deficit flash drought [29], the composite drought occurrences outlined in this definition do not capture the swift onset of flash droughts, and certain brief periods of intense heat and drought are not ruled out. According to [30], flash drought was defined as an event where the percentile of the soil moisture averaged over 5 days drops from 40% to 20% in less than 20 days. Likewise, another study employed the Standardized Evaporative Stress Ratio (SERS) derived from the pentad averages [17], and they categorized events with change in mean SERS resulting in a reduction in the drought index of less than 25% of the climate state as flash droughts. While both concepts capture the swift onset of flash droughts, neither of them distinctly delineates the decline and end of these events, thus hindering further research on analyzing their duration and impacts. Drawing from prior studies, considering both the onset and recovery phases of flash droughts, a flash drought event was characterized as a rapid drop in the pentad average percentile of the soil moisture from above 40% to below 20%, with an average decline rate exceeding 5%, and the drought should last for a minimum of 15 days. The end of the flash drought is marked when the percentile of soil moisture returns to above 20% [30].
China is very vulnerable to the impacts of climate change, seeing considerable increases in temperature and decreased precipitation, so flash drought has been occurring more frequently in China. In China, the average flash drought’s frequency increased by 109% between 1979 and 2010 [31]. From 2000 to 2016, the frequency of China’s flash droughts varied from 6% to 20%, with the northern and southern regions of the country being more susceptible to these occurrences [32]. Warming and shifting wetting patterns have been shown to intensify flash drought in regions like the Loess Plateau and the central Qinghai–Tibet Plateau [33]. Flash droughts are primarily concentrated in the northwest, northeast, southwest, and middle-lower Yangtze River regions [34]. During the summer of 2013, a sudden and severe drought in southern China resulted in the destruction of about two million hectares of crops in the provinces of Hunan and Guizhou, affecting 13 provinces, and during mid-to-late 21st century, the effects of flash droughts have become increasingly significant [30,35].
There is a pressing need to deepen our understanding of flash drought. The scientific community needs to make advances in this field in order to develop a better understanding of flash drought events, which encompass a variety of impacts and pose challenges for sub-seasonal prediction [19]. Furthermore, most of the papers related to flash drought have focused on only plant-growing seasons. This paper explored flash droughts that occur throughout the year. In general, flash drought is more common in plant-growing seasons, but the study of year-round flash droughts aids in understanding the effects they have on plants and the natural environment [36].
Similarly, broader research on China’s flash drought has clarified the reasons behind flash drought events as well as their trends across different regions of the country, but we did not find many papers that focused solely on flash drought in northeastern China, which not only faces a high risk of drought but also covers a vast forest area of the entire nation. After over a century of climate study, northeast China is one of the world’s most significant warming zones and is quite vulnerable to global warming. In the context of forests in this region, where climate change is already altering the composition and health of the trees, it is imperative to look into whether flash droughts happen in this region and their associated impacts [37]. So, in this paper, we have moved a step further by concentrating on three mountainous regions within the forests of northeast China: the Greater Khingan Mountains, the Lesser Khingan Mountains, and the Changbai Mountains from 2000 to 2020. In accordance with the recommendation of the WMO [38] and to cover significant number of years, we chose 21 years as the time period for our study. This study was carried out to identify the flash drought events using daily soil moisture data and then the spatial and temporal characteristics of flash drought events and their impact on the forest NDVI. The result of this study contributes to the field of climate change and has some ecological impacts.
2. Materials and Methods
2.1. Study Area
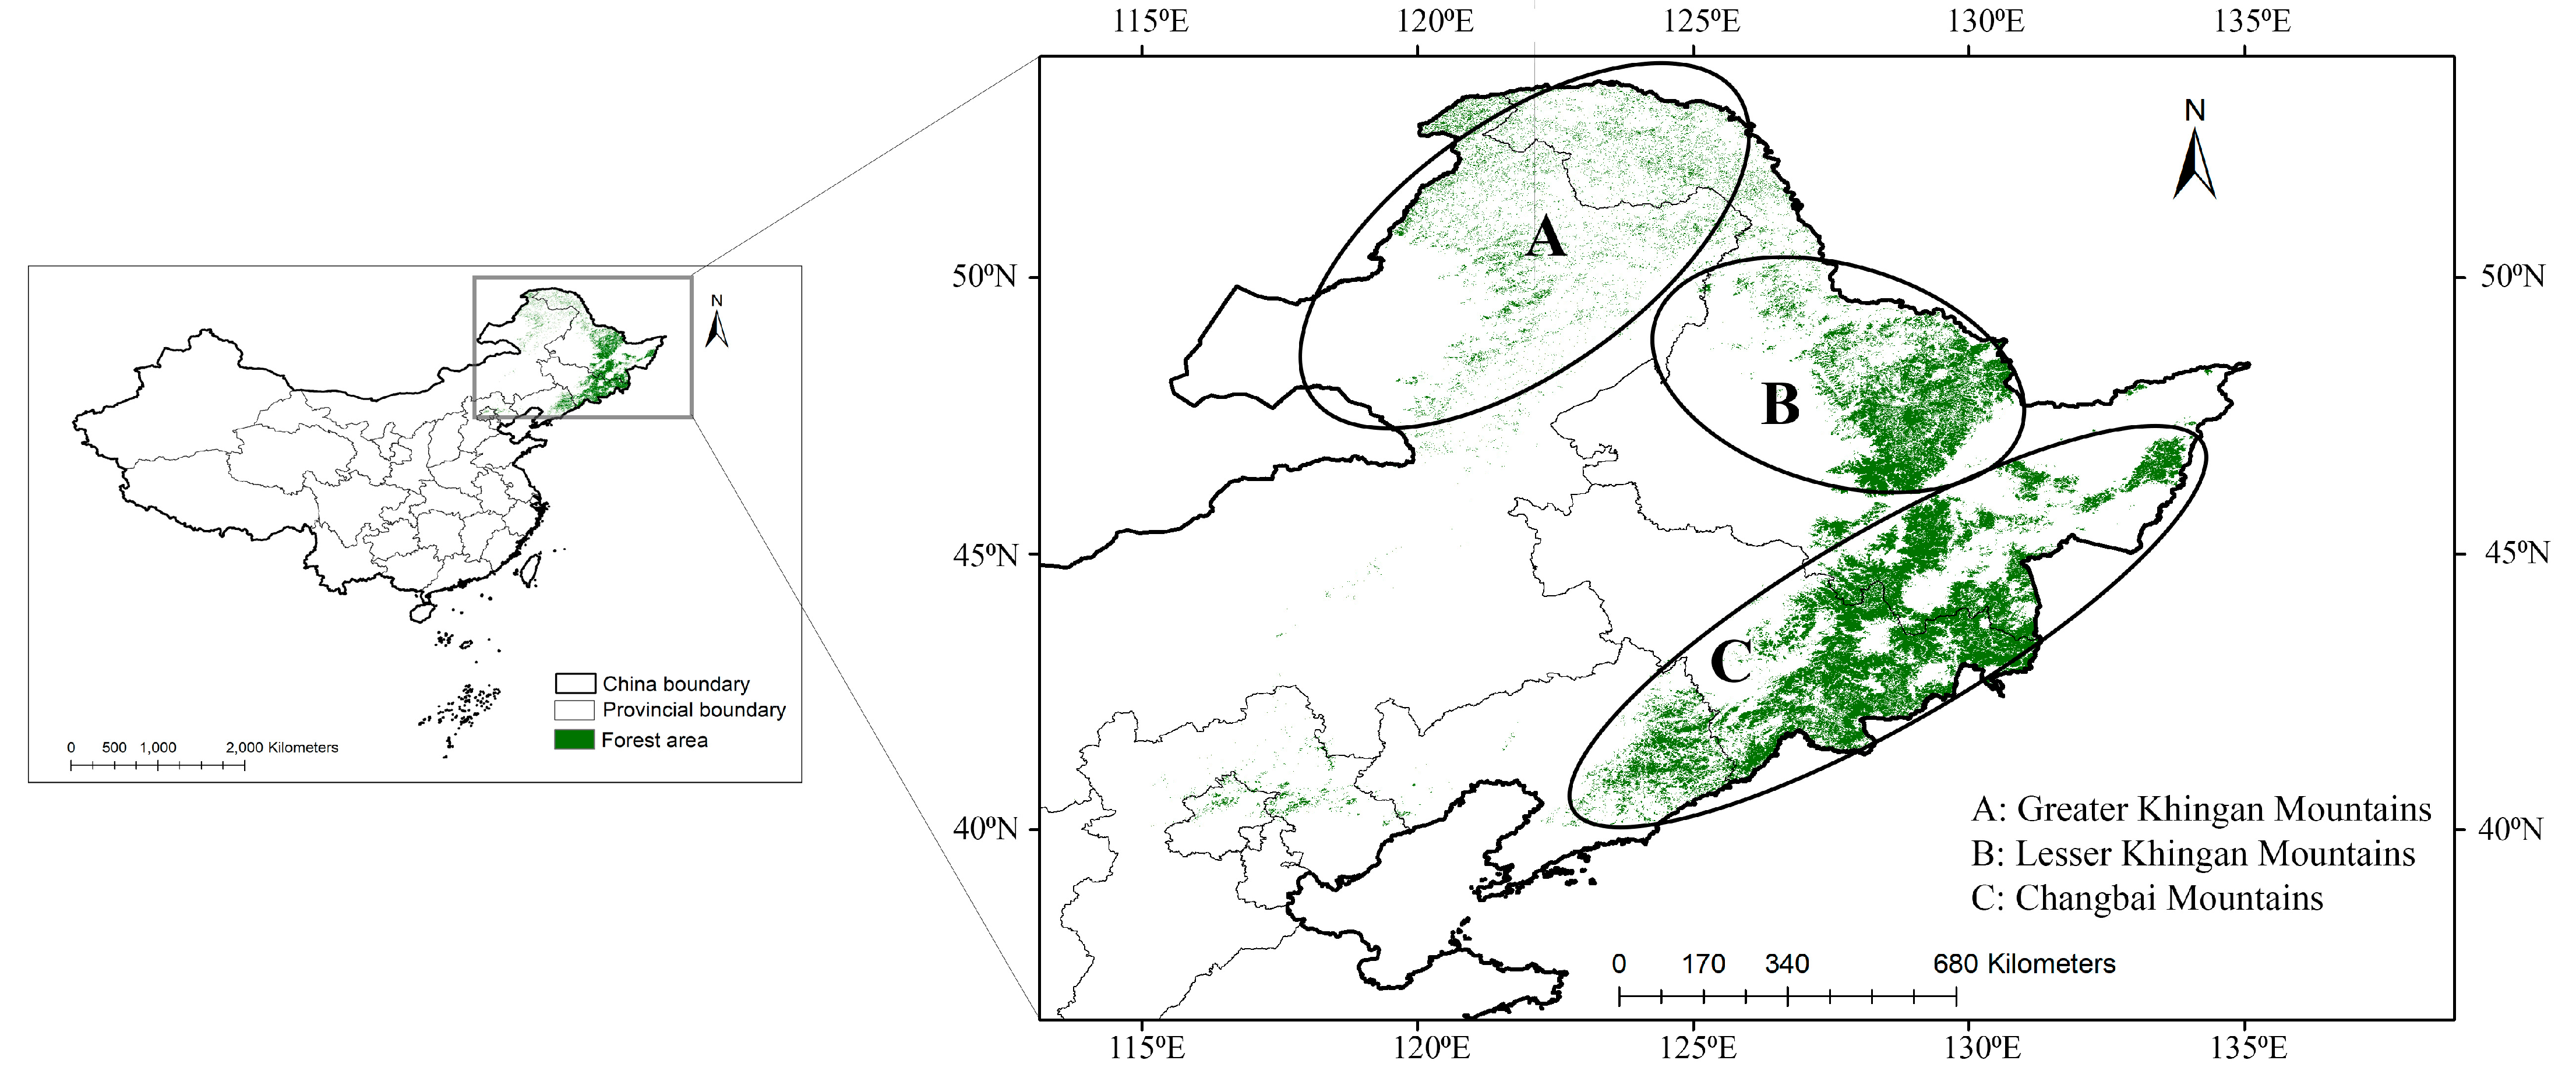
The focus of this study was on the forest of northeastern China, which has not been disturbed for 20 years. Northeast China is situated at the higher latitudes of the eastern end of the Eurasian continent [39]. Northeast China harbors a considerable expanse of forested land, spanning approximately 507,362 square kilometers, thereby constituting approximately 40.3% of the region’s overall land area. The forests situated in the northeastern region of China are encompassed within the expansive Greater and Lesser Khingan Mountains as well as the Changbai Mountains (Figure 1). These three mountain areas have a distinct climate, vegetation types and environmental factors. The Changbai Mountains, which are located in the temperate humid monsoonal climatic zone between 41°25′ N and 43°35′ N and 125°34′ E and 128°01′ E, have an average annual temperature of 2–6 °C and 400–700 mm of precipitation, with the majority of the precipitation falling between July and September [40]. Usually, there is a mixed coniferous–broadleaved forest as the native vegetation. The continental monsoon climate of the Lesser Khingan Mountains (46°28′ N–49°21′ N, 127°42′E–130°14′ E) is moderate, with an average yearly temperature of –1–2.6 °C and an average annual precipitation of 460–610 mm [41]. Typically, there is a temperate mixed forest as the native vegetation. Similar to this, the Greater Khingan Mountains, which are situated in the temperate continental monsoon climatic zone and have an average annual temperature of −6 to −1 °C and an average annual precipitation of 240 to 442 mm, are located between 50°10′ N and 53°33′ N and 121°12′ E and 127°00′ E. The predominant plant type is boreal coniferous forest [42]. These three mountain ranges—Greater Khingan, Lesser Khingan, and Changbai—contribute significantly to the landscape, climate, and ecological diversity of northeast China and adjacent regions.
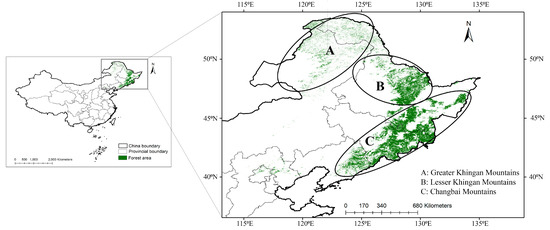
Figure 1.
Map of the study area (green area indicates the forest area of northeastern China).
2.2. Study Data
2.2.1. Soil Moisture
To identify the flash drought events, a 1 km daily soil moisture dataset over China based on the in situ measurement was downloaded from National Tibetan Plateau Data Center (TPDC) (http://www.tpdc.ac.cn/) from 2000 to 2020 assessed on 15 December 2023. The dataset of soil moisture we downloaded covers the time frame ranging from 2000 to 2020 and includes measurements of the soil moisture at intervals of 10 cm (10–100 cm depth). The unit of measurement for the data is 0.001 m3/m3. The soil moisture dataset, which is accessible from the TPDC, was derived through the utilization of machine-learning techniques involving the ERA5_Land meteorological forcing data, leaf area index (LAI), land cover type, topography (DEM), and soil properties as covariates. This process was based on 10 layers of soil moisture that were observed by 1648 stations provided by the China Meteorological Administration. Furthermore, the accuracy of this dataset was validated through the execution of experiments [43]. In this study, we downloaded the soil moisture dataset at a depth of 40 cm as a large portion of the fine roots of the trees are available within this depth and the drought stress can be captured well. The soil moisture data were further extracted to the study area and processed for flash drought calculation.
2.2.2. NDVI
The NDVI time-series data from SPOT/VGT and MODIS satellite remote-sensing imagery are often used to track changes in the patterns of vegetation, land use/cover, categorize macro-vegetation cover, and estimate net primary productivity [44]. The NDVI data used in this study were obtained from the “China Monthly 1 km Vegetation Index (NDVI) Spatial Distribution dataset” provided by the Data Center for Resources and Environmental Sciences, Chinese Academy of Sciences (http://www.resdc.cn). The NDVI dataset available was based on the remote-sensing data of the SPOT-VEGETATION NDVI satellite. Monthly data were synthesized using the maximum synthesis method on the basis of data every 10 days, with a spatial resolution of 1 km × 1 km [45]. From the downloaded monthly data, we determined the average NDVI of the Northeast Forest growing season (April–October) from 2000 to 2020 to see the NDVI values at different locations where flash drought events occurred.
2.3. Flash Drought Identification
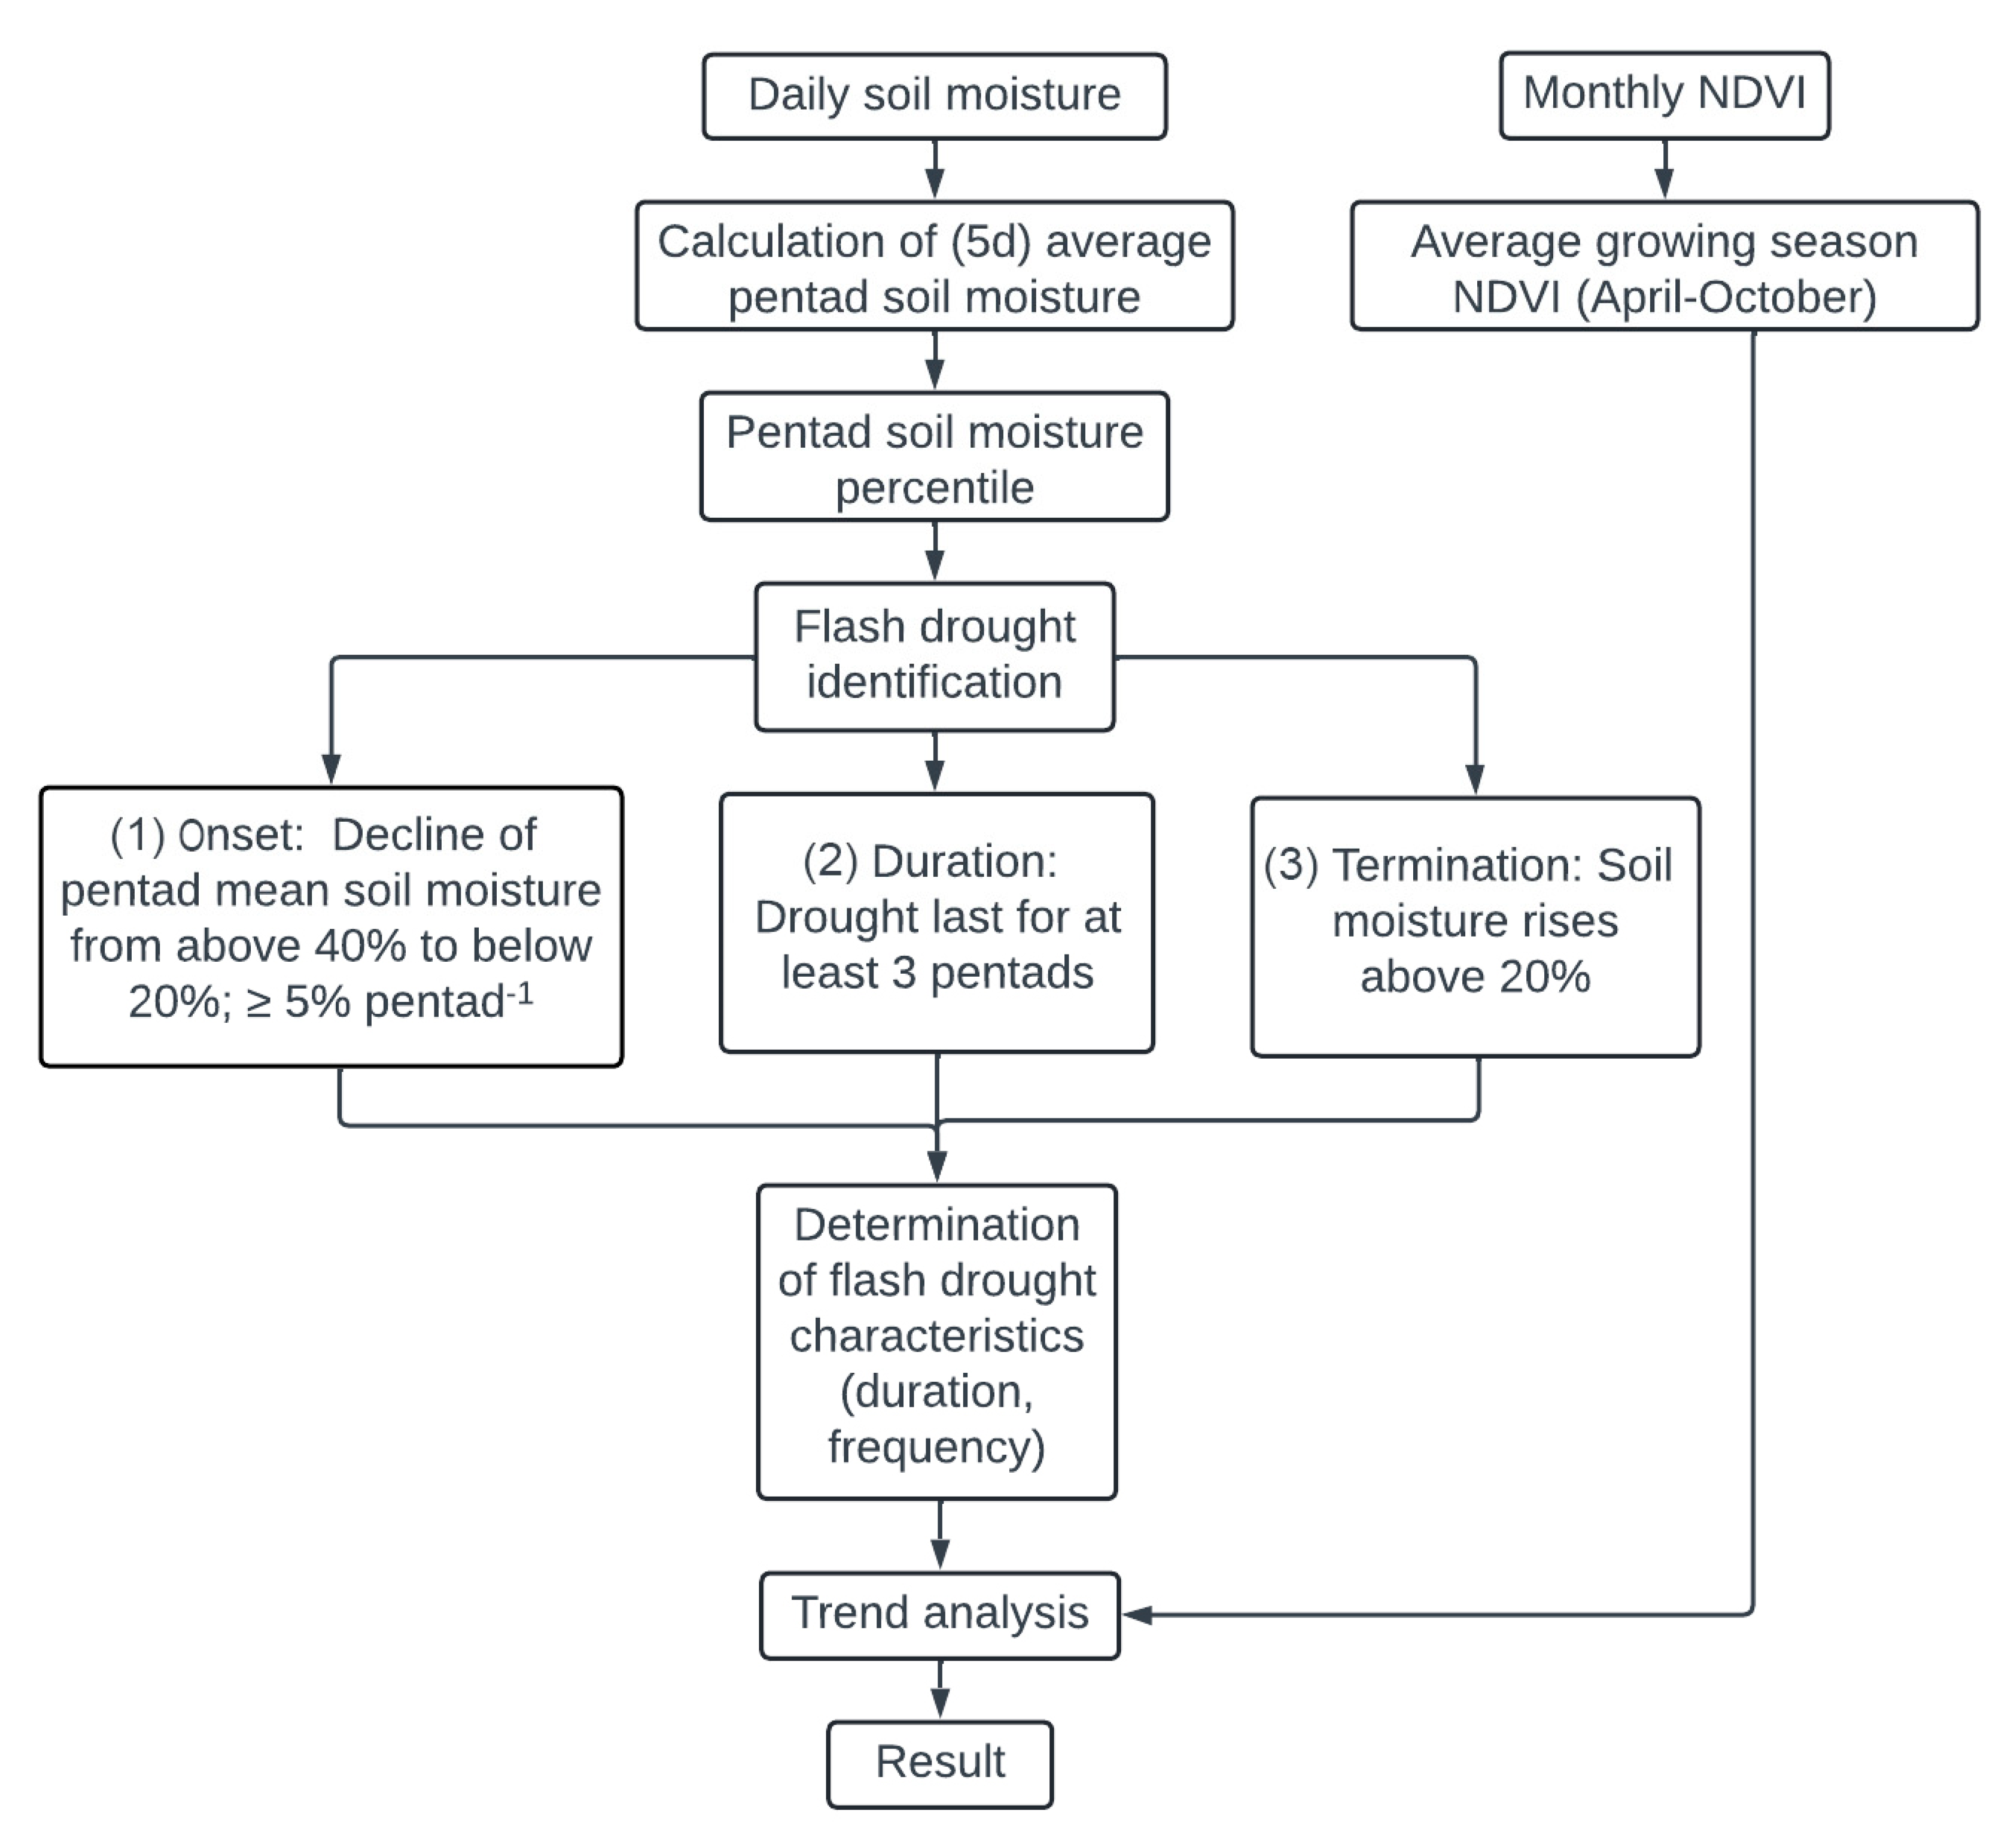
Flash drought events were determined on the basis of an abrupt change in the soil moisture, mainly using the methodology of [30]. For this, the daily gridded soil moisture was converted into pentad (five-day average). Therefore, for each year, a total of 73 pentads were formed [46]. Then, the soil moisture percentile was determined for each pentad for each year. Finally, the following conditions were applied to identify flash drought. (1) The flash drought begins when the pentad (5d) mean soil moisture falls from above the 40th percentile to below the 20th percentile, with an average decline rate of no less than 5% in the percentile per pentad. (2) The flash drought ends when the reduction in the pentad soil moisture rises above the 20th percentile. (3) Similarly, the drought must last for a minimum of three pentads (15 days). This definition takes into account both drought (soil moisture percentile less than 20%) and flash (decline rate of soil moisture percentile greater than 5%). The drought event calendar time is the period between the beginning and ending of a drought event. A flash drought event’s start and recovery phases are described by the first two criteria, and the minimal amount of time that soil moisture stays below the 40th percentile is described by the third criterion.
The frequency was defined as the number of flash drought events at each grid point per year, and it represents the number of times. The duration was defined as the number of days during which the flash drought events last. It includes days from the onset to the end of the flash drought. Similarly, we determined the areas affected by flash drought by calculating the ratio of the grid points that experienced flash droughts to the total grid points in the study area [47].
Trend Analysis
A nonparametric test called the Mann–Kendall (M-K) [48,49] method is often used to determine if the time series of the variable under study has a monotonic trend. The alternative hypothesis (H1) in the M-K test denotes the existence of a monotonic trend in the data, which may be positive or negative, whereas the null hypothesis (H0) indicates that there is no monotonic trend in the series. Positive standardized test statistic ZMK values denote a rising trend within the time series data, while negative ZMK values imply a declining trend. This study used the M-K trend analysis to look at the trend of flash droughts and the NDVI in a selected time period and the significance was tested at 95% confidence interval. The M-K trend test was performed and the trendline equation and R² value were added using Excel.
The test statistic ZMK for a given time series (x1, …, …, xn), was calculated as follows:
where the length of the time series is denoted by n. xi and xj represent the sequential data in the time series. Parameter tp signifies the number of ties of the pth value.
The flowchart of the overall research route carried out in this study is shown in (Figure 2). The flash drought calculation was carried out using SAS version 9.4, the maps were produced using ArcGIS 10.3 and the other analyses were carried out using R 4.3.1 and MS Excel version 2019.
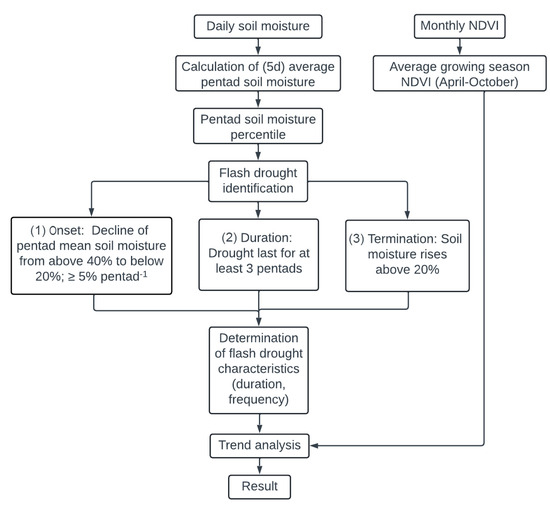
Figure 2.
Flowchart of the research route applied in this study.
3. Results
3.1. Identification of Flash Drought Events
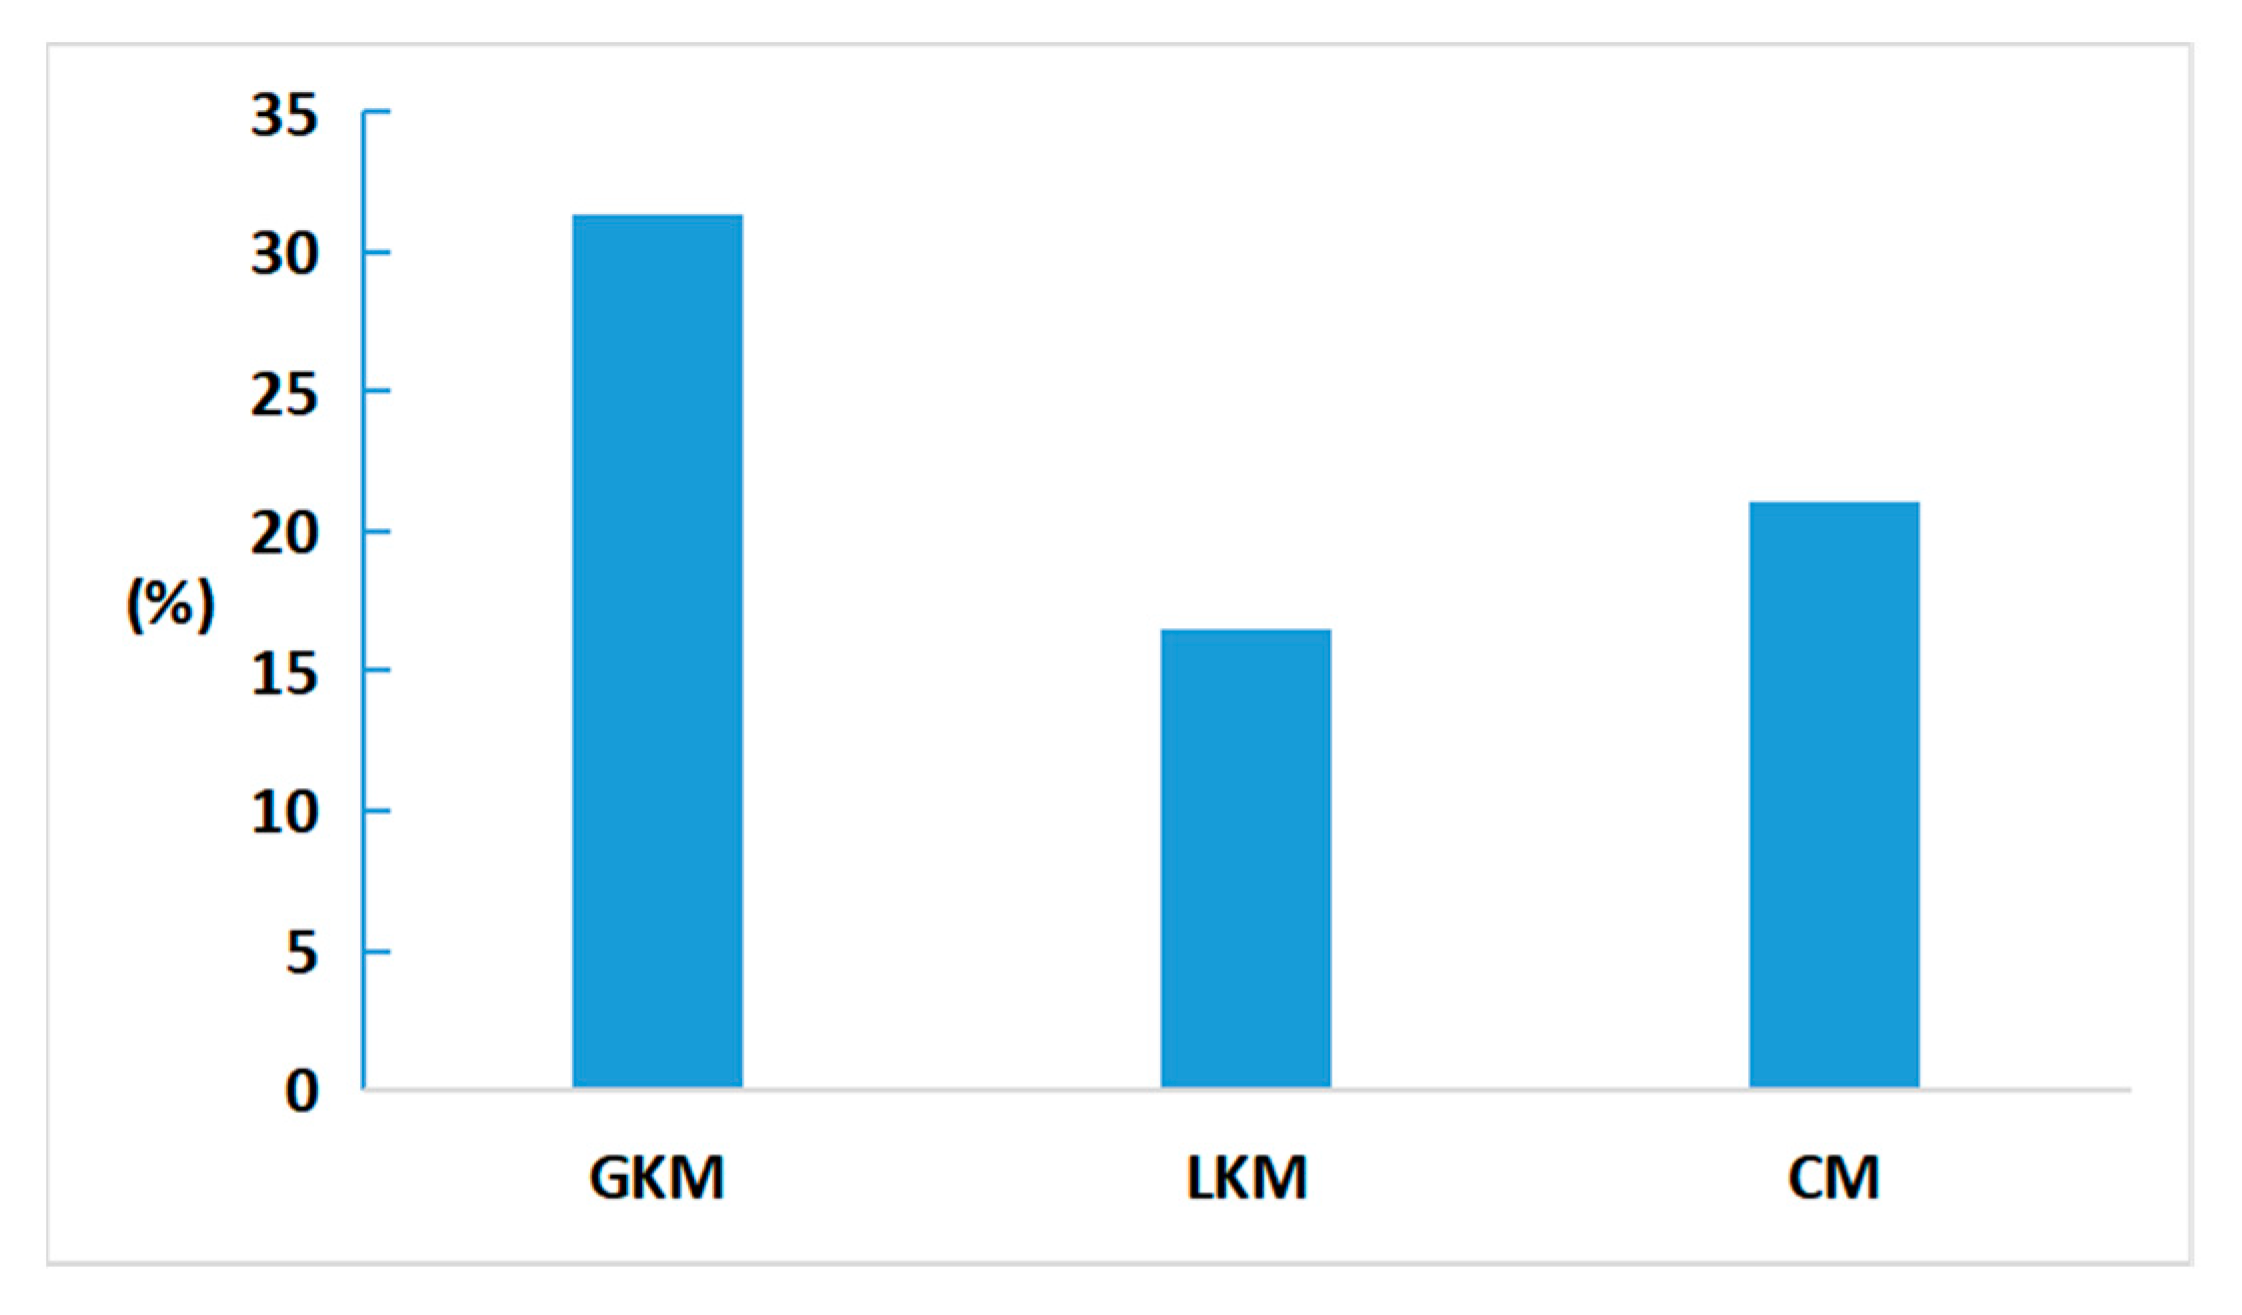
First, we identified flash drought events across three mountain areas, Greater Khingan Mountains (GKM), Lesser Khingan Mountains (LKM) and Changbai Mountains (CM), which cover the forest in northeast China within our extensive study area from 2000 to 2020. Out of the total grid points surveyed annually, we found that around 21% of the forest area experienced flash drought events. Looking at the area being impacted by flash drought, 31.3% of the forest area in the GKM experienced the adverse effects of these events. Following behind was the CM, where flash droughts affected 21.1% of the area, and the LKM had a slightly lower percentage, with 16.5% of its total forest area being impacted by flash drought events, as shown in Figure 3.

Figure 3.
Percentage of the area affected by flash drought events in three mountain areas from 2000 to 2020.
3.2. Spatio-Temporal Characteristics of Flash Drought Events
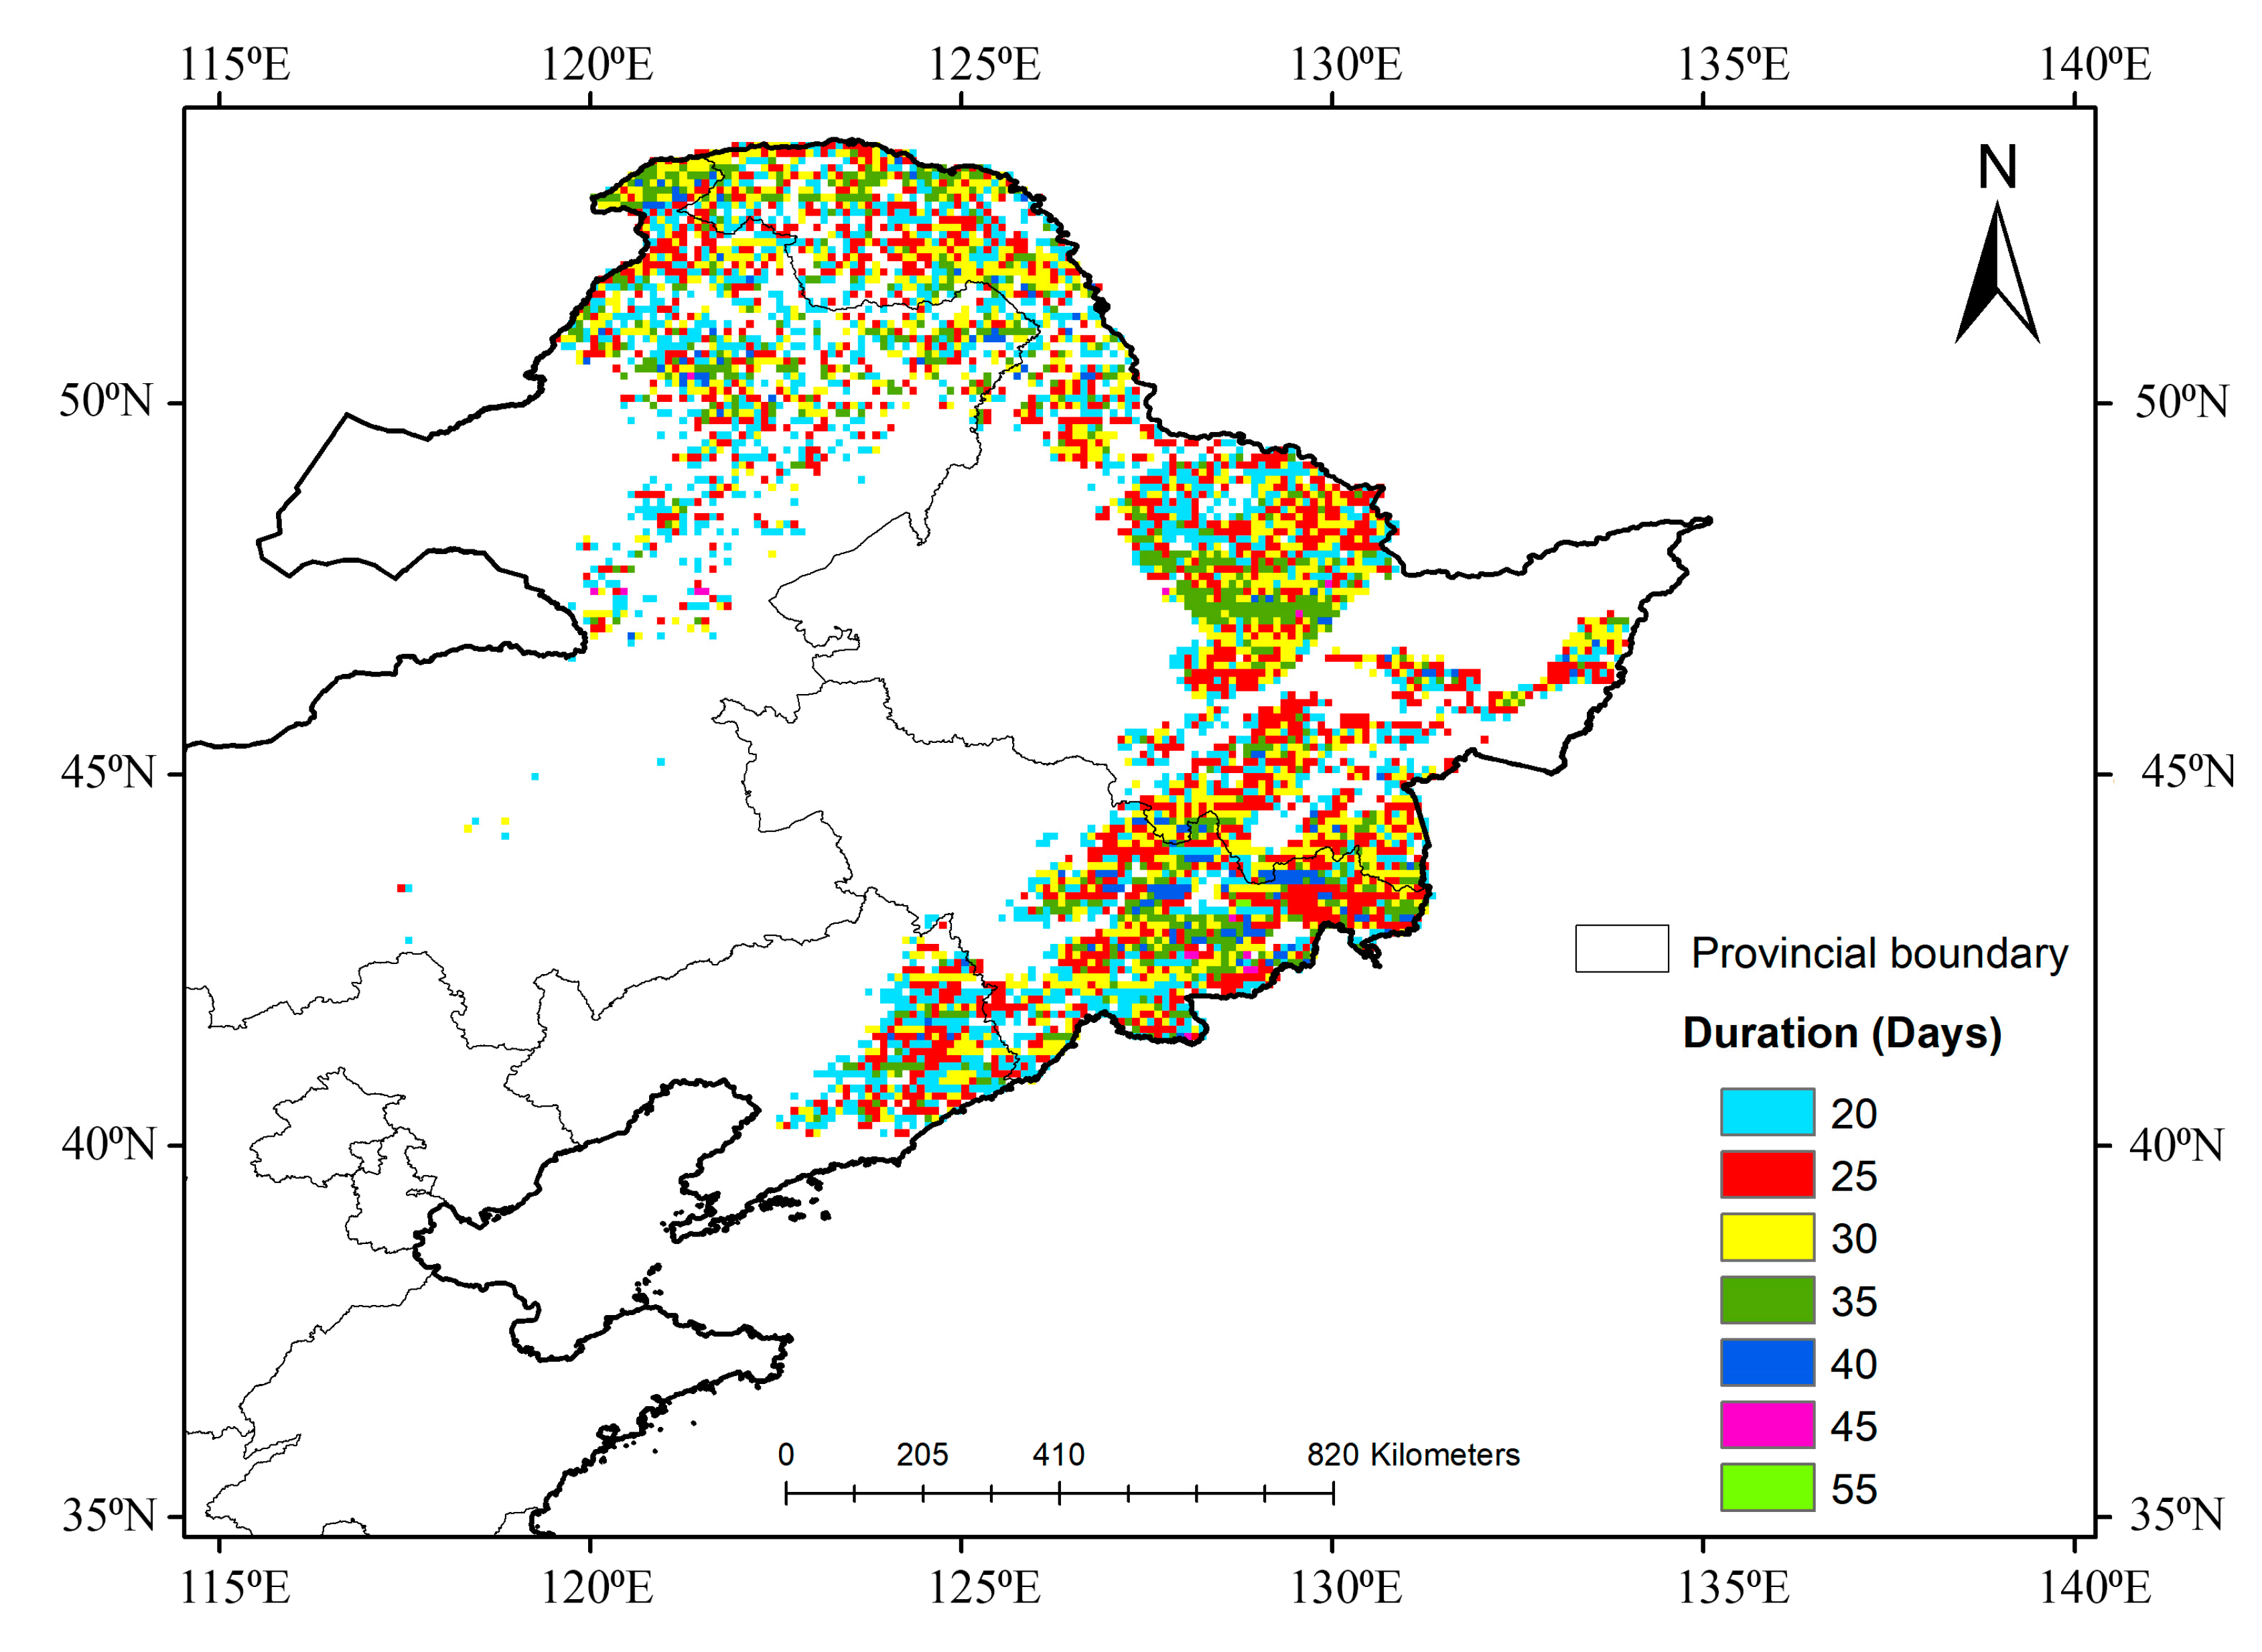
For the flash drought characteristics, we determined the duration and frequency of the flash drought events at each grid point. Across the area we studied, most of the flash drought events lasted between 20 and 55 days, with the majority falling within a range of 4 to 5 pentads, which is about 20 to 25 days, as shown in Figure 4. While separating along different mountains, the total durations were not so different. The shortest duration was 20 days for all the mountain areas, whereas the longest duration of the GKM and LKM was 45 days, but for the CM, at some grid points the longest duration extended up to 55 days. The frequency of flash drought events at each grid point varied between 1 and 2 times (Figure 5). Interestingly, this frequency range was consistent across all the mountains studied, which shows that the likelihood of experiencing a flash drought event within a given year was similar across the GKM, LKM and CM.
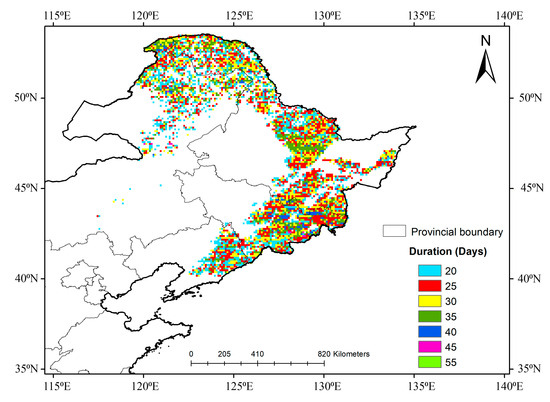
Figure 4.
Spatial distribution of the total duration of flash drought from 2000 to 2020.
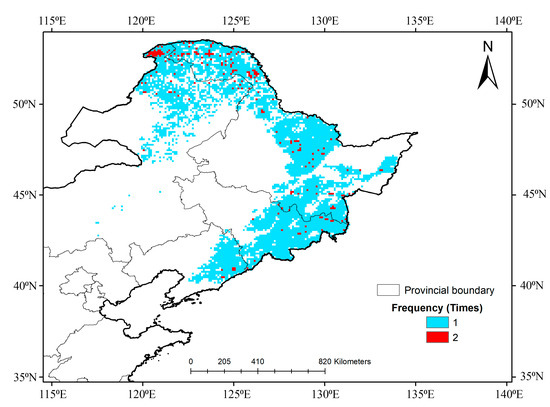
Figure 5.
Spatial distribution of the frequency of flash drought from 2000 to 2020.
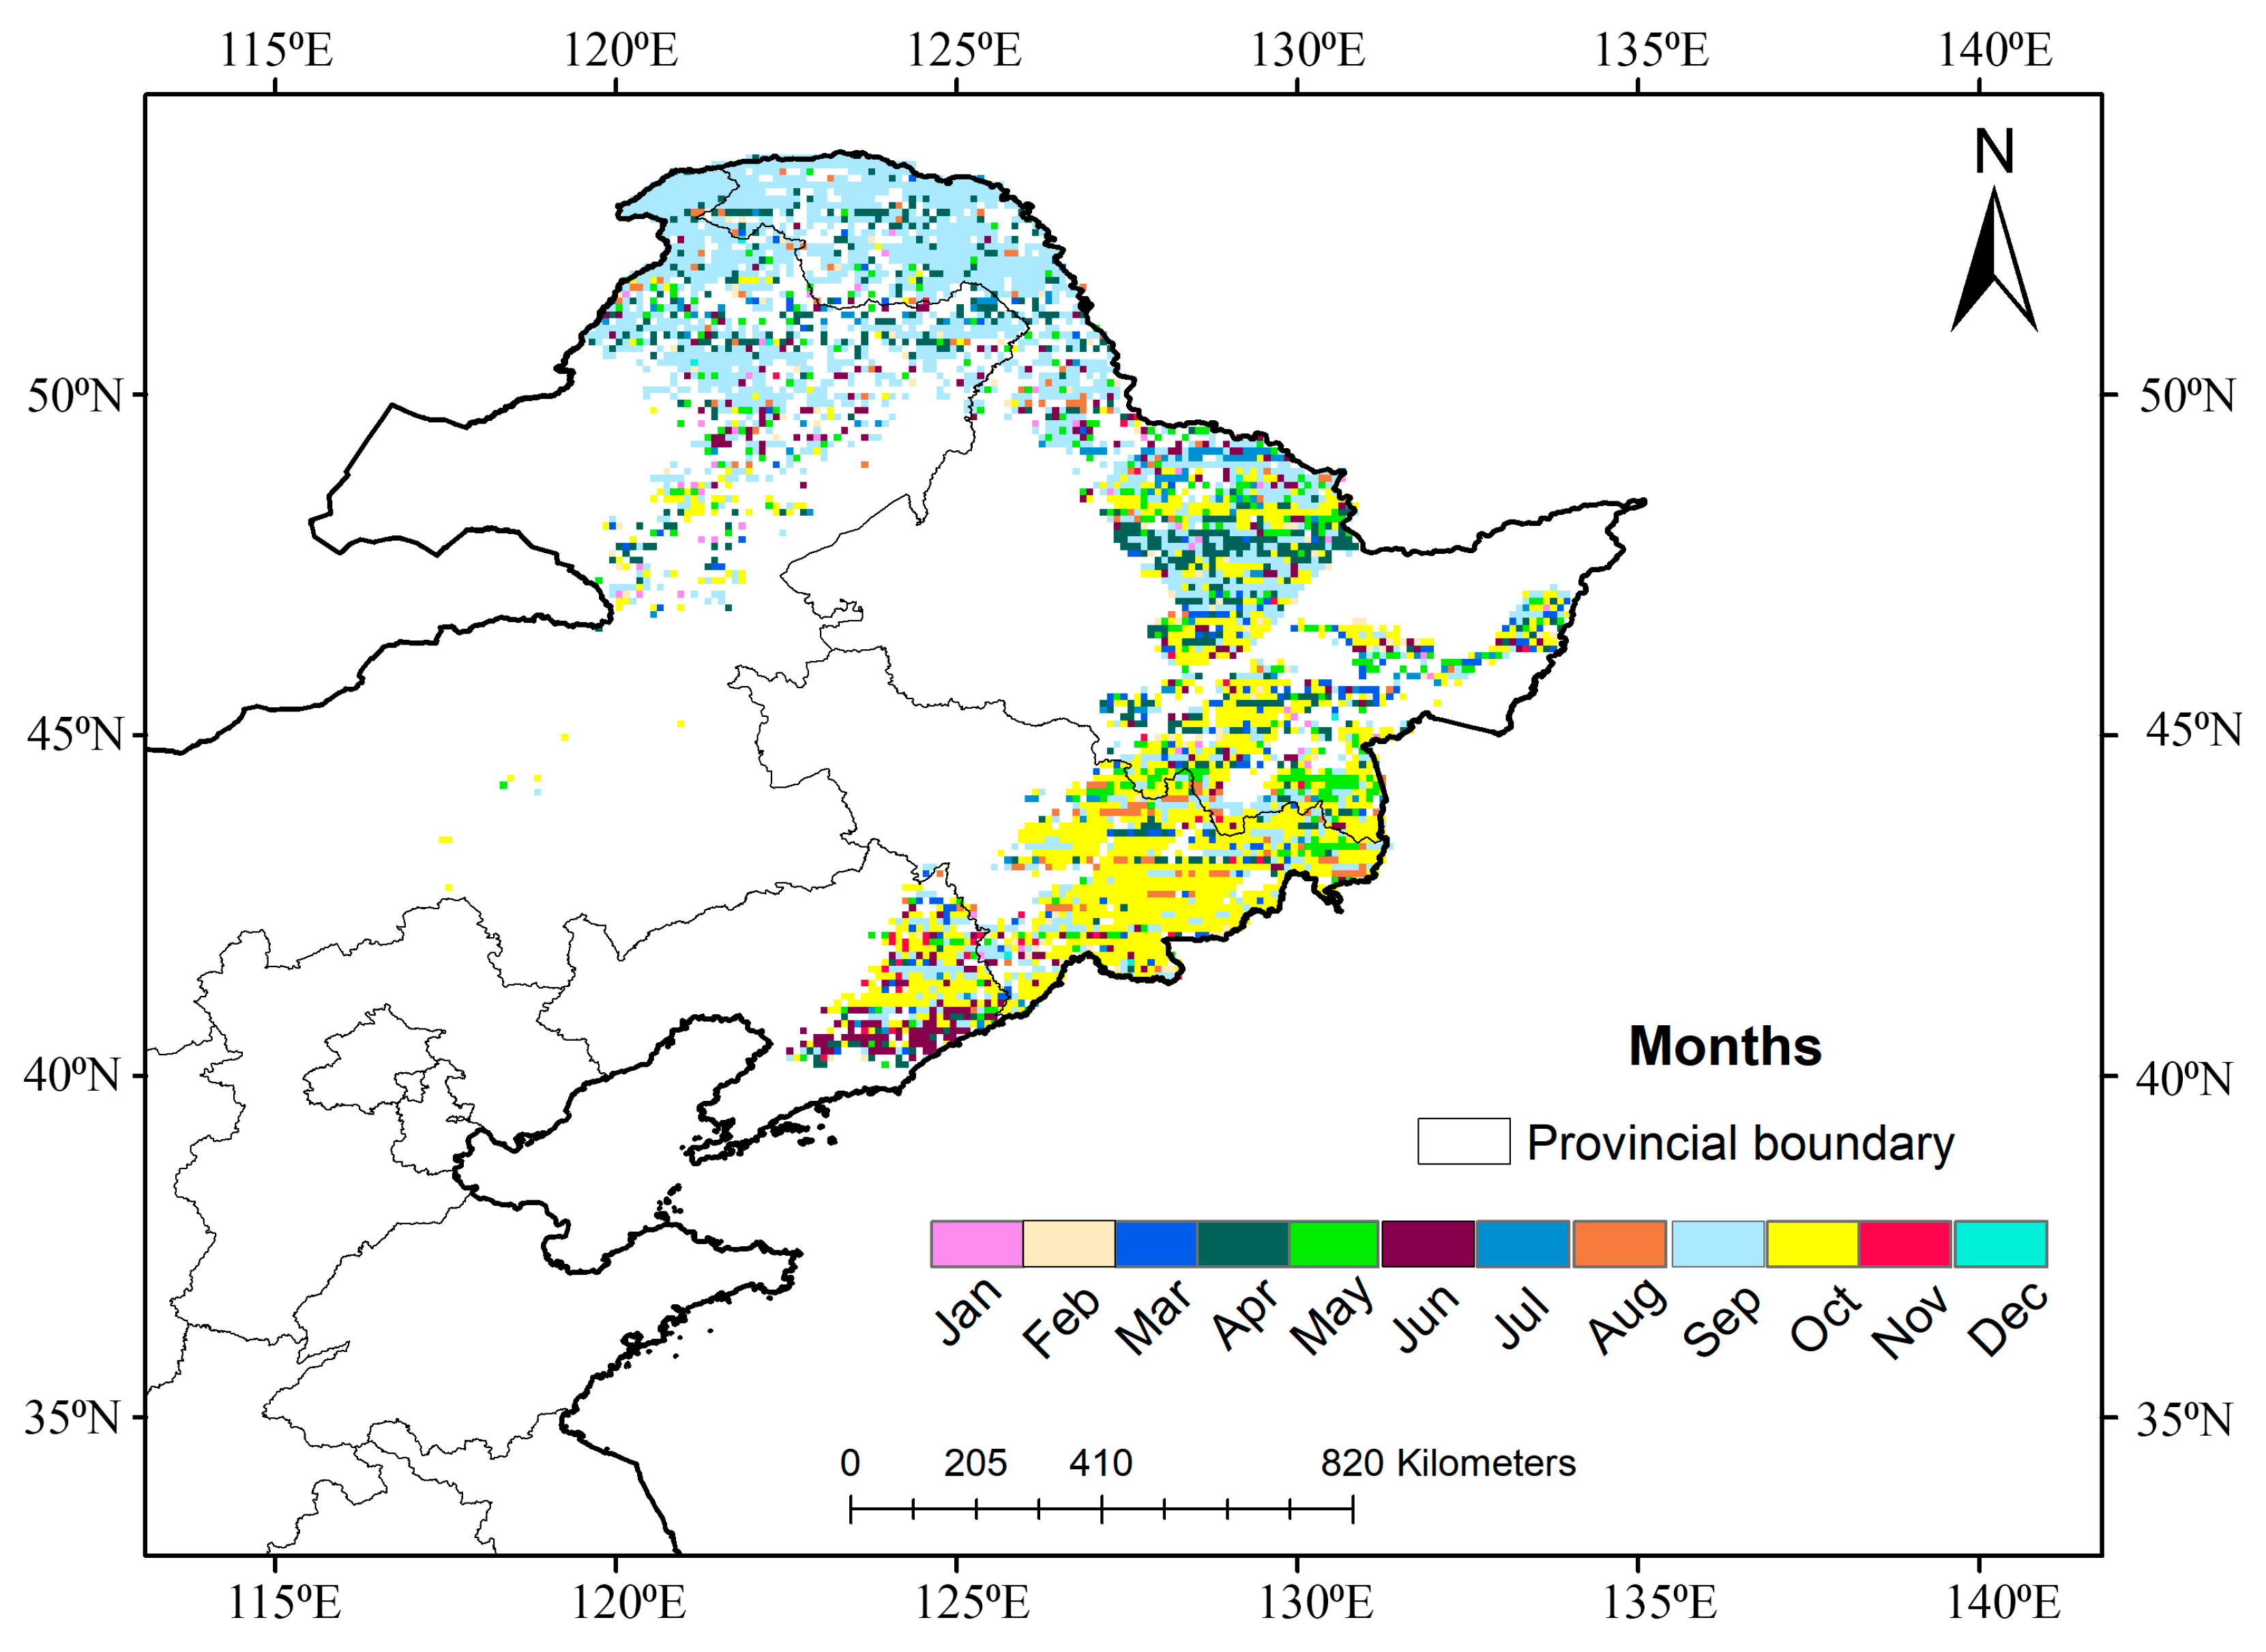
Although flash drought events were observed in all the months, from Figure 6 it became evident that they were most common during the months of April to October.

Figure 6.
Onset of flash drought events in different months from 2000 to 2020.
Within this period, the maximum flash drought events were observed to begin in September and October, and less in June and July in the three mountain areas. This seven-month period, which is also the period of the plant-growing season, emerged as the peak period for flash drought occurrence, with a maximum number of events observed during this time frame. Conversely, the figures revealed a notable decrease in the occurrence of flash drought events during the months of November, December, January, and February.
We determined the percentage of flash drought events in each year out of the total flash drought events that occurred in the 21-year time period. From the perspective of the inter-annual variation in the area being affected by flash drought events in each year, we found downward trends (Figure 7) in the three mountain areas. For both the GKM and LKM, the maximum area was affected in 2007, but for the CM, the maximum was observed in the year 2002. Overall, the proportion of flash drought events were increasing from 2000 to 2010 but started decreasing after the year 2010. Looking at the inter-annual variation in the frequency, we observed that the average frequency was almost stable and there were no distinct changes in each year.
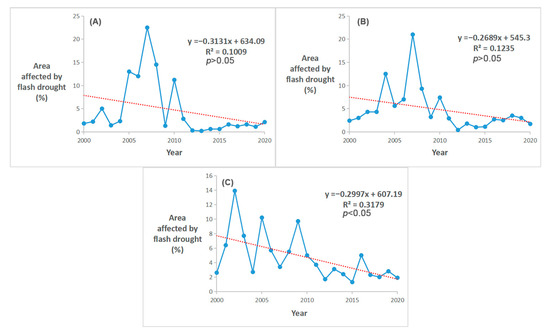
Figure 7.
Trends in the percentage of area affected by flash drought in the (A) GKM, (B) LKM and (C) CM from 2000 to 2020.
3.3. Flash Drought and NDVI
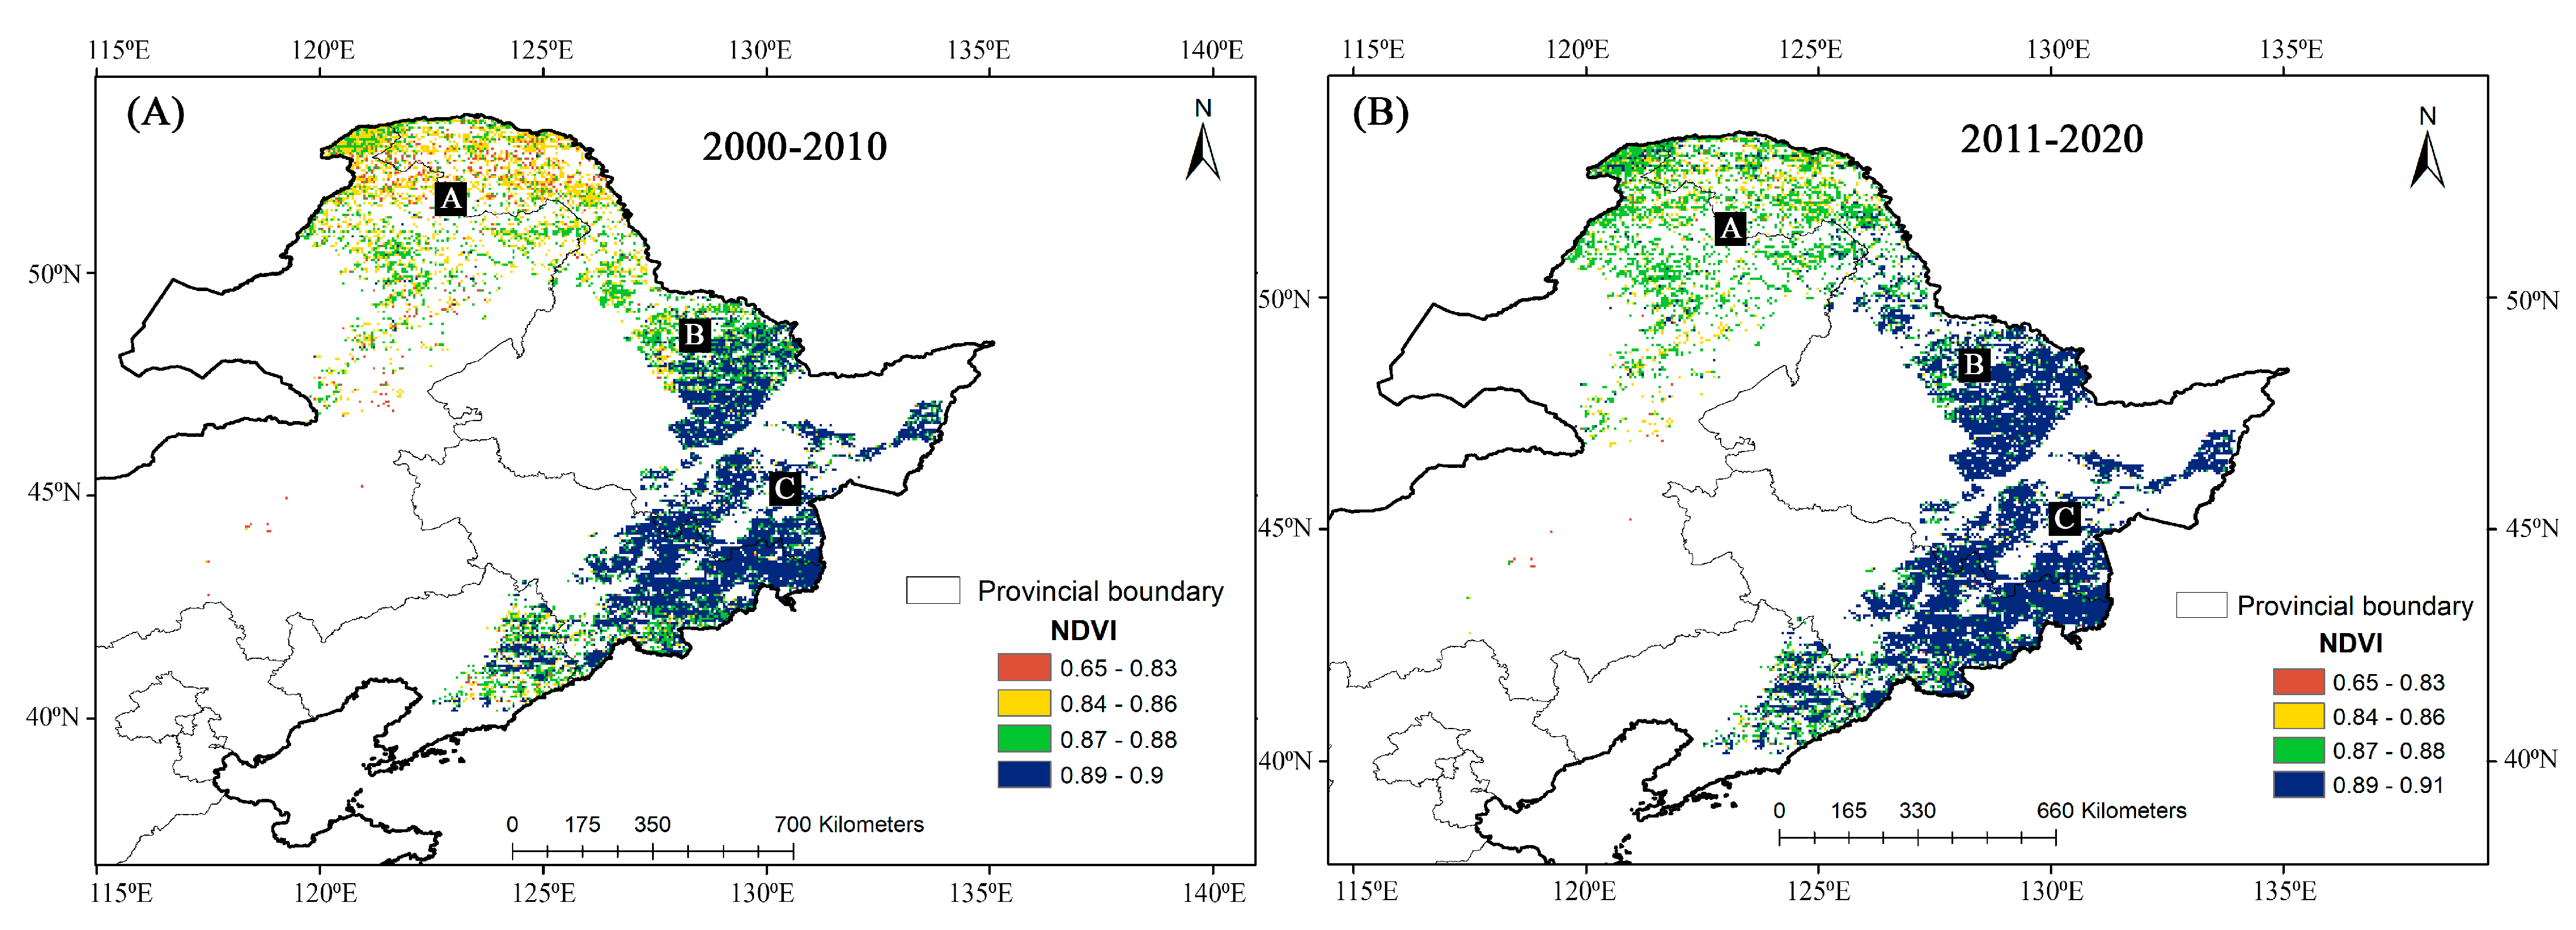
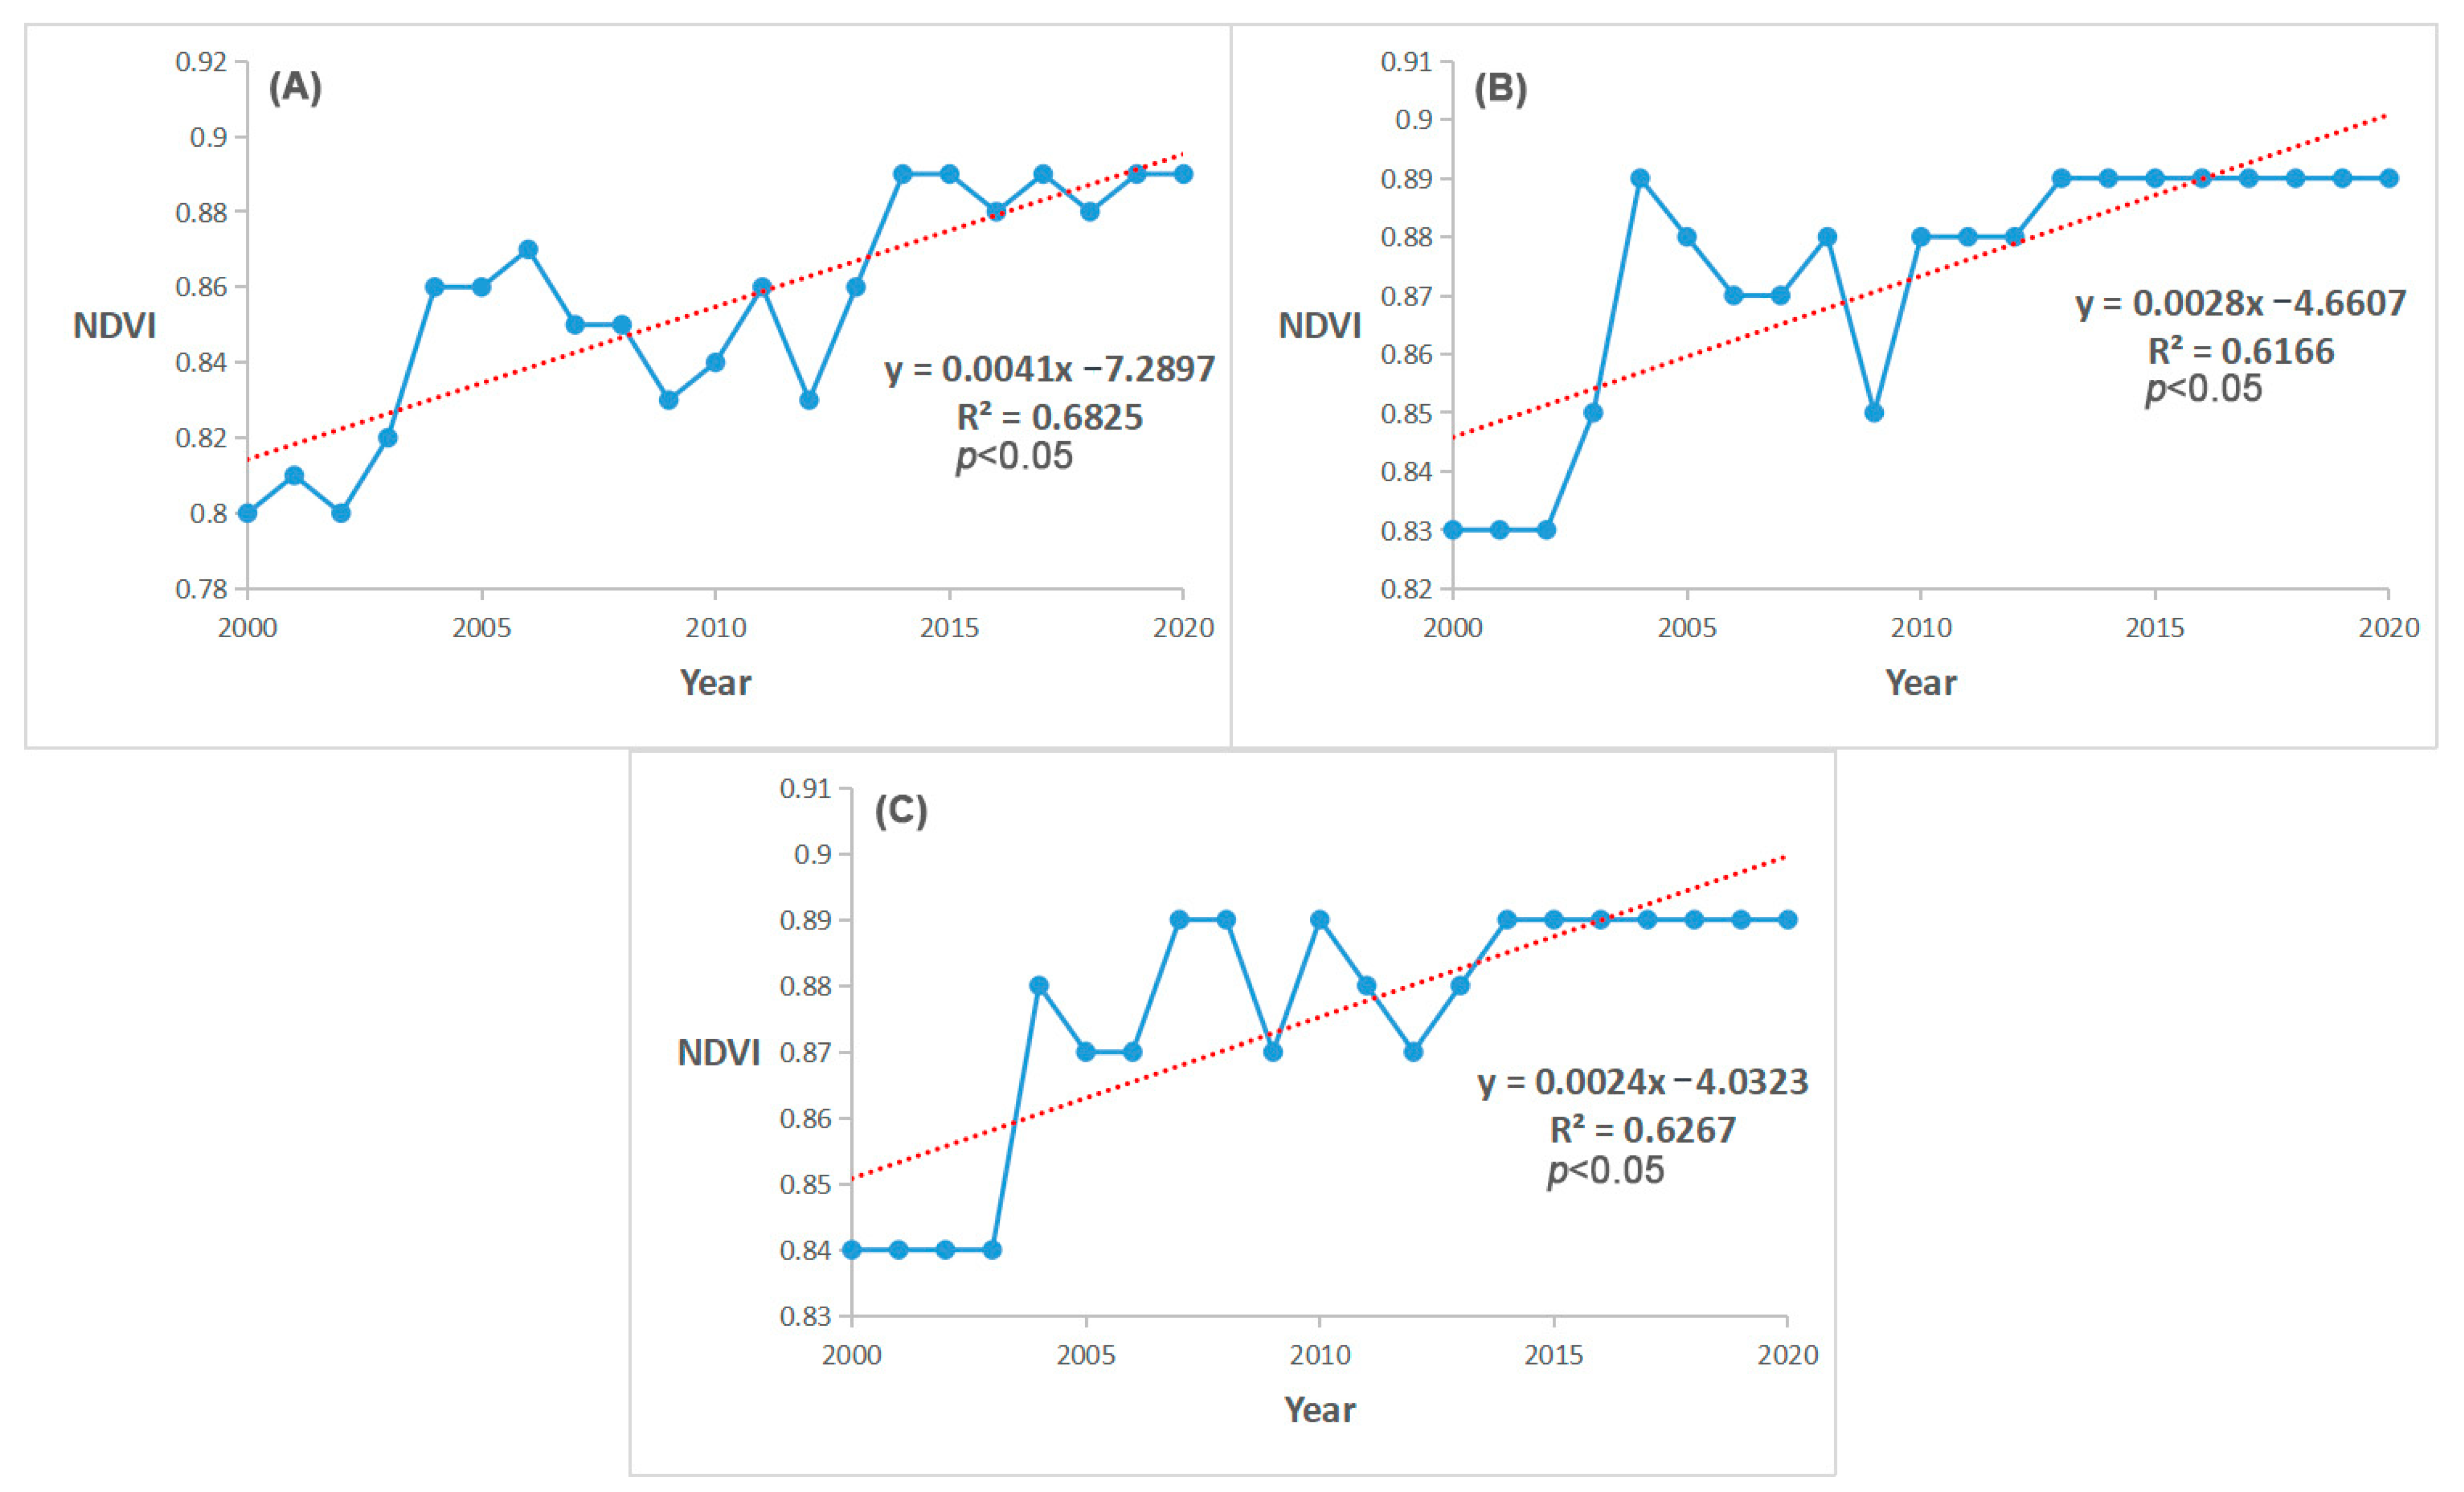
Flash drought was most common during the growing season of plants, so we used the growing season NDVI to see if there were any changes in the NDVI value in the grid points where flash drought happened. In order to compare the changes in the NDVI, we separated the years from 2000 to 2010 (Figure 8A) and 2011 to 2020 (Figure 8B), as in all three mountain areas we observed a large number of flash drought events from 2000 to 2010 and after that they decreased. Figure 8 shows the clear difference in the NDVI values between the selected years, as the NDVI was generally low in the year where the maximum area was impacted by flash drought and vice versa. We have appointed the three mountain areas as A, B and C in Figure 8 to compare with the trends of the respective mountain areas in Figure 9. Likewise, having the maximum number of areas being impacted by flash drought, we can clearly observe the low value of the NDVI in the GKM in comparison to the others. We observed a significant upward trend (p < 0.05) in the NDVI in all three mountain areas from 2000 to 2020 (Figure 9), but there was not much distinct variation in the NDVI values among them. The flash drought was found to decrease after 2010 and the NDVI value was found to increase in the corresponding years. This shows the negative impact of flash drought on the NDVI.
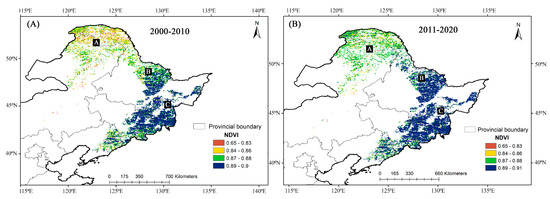
Figure 8.
Spatial distribution of the growing season NDVI. (A) 2000–2010; (B) 2011–2020.
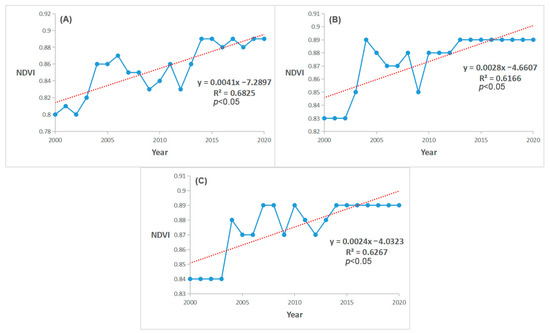
Figure 9.
Trends in the mean value of the growing season NDVI in the (A) GKM, (B) LKM and (C) CM from 2000 to 2020.
4. Discussion
4.1. Spatio-Temporal Analysis of Flash Drought Events
A significant number of flash drought events were detected in our study area. In comparison to other papers, the overall count of flash drought events in our study area was higher. The reason behind this might be that we selected a large area, while another reason might be that we chose an area with only forest vegetation in northeastern China. The flash drought in northeast China is influenced by dense vegetation. Dense vegetation can increase water stress by pumping more water from the soil and increase rates of evapotranspiration, which change the soil moisture level, and that increases the probability and severity of flash droughts in these regions. Similarly, the vegetation greenness also intensifies the flash drought [50]. It was found to have a considerable impact on the occurrence of flash droughts in locations such as the Great Plains and the western regions of the United States, as demonstrated by various studies [51]. The percentages of area affected by the flash drought are ranked as follows: GKM > CM > LKM. These results demonstrate the variability in the flash drought events in our research region. To understand the characteristics of flash drought, we employed an analysis based on their frequency and duration as these are vital features of any drought events. In the case of these characteristics, we did not observe much spatial variation. This can also be justified on the basis of our research area as it was selected within only forested regions. Considering this, we can assume that the results would be different if we had chosen multiple land covers. Based on the definition we used for the identification of frequency, we found that some areas experienced a flash drought once during this time frame, while others experienced it twice. A study in northeast China found an average frequency of about three times [52].
In addition to considering the actual humidity limitations and the quick development of flash droughts, the flash drought events’ duration should also be considered by researchers [53] as the impacts on the ecosystem much depend on the duration of drought. While following [29], we kept the threshold of the flash drought duration at a minimum 15 days. According to this, the total duration of major flash drought events in our study varied from 20 to 55 days, where the average duration over all the study area from 2000 to 2020 was about 22 days (4.4 pentads). Our findings were almost consistent with other findings, where the average duration in northeast China was 4.48 pentads [36]. In another research study, the duration reached up to 36 days in the northeastern part of China [54]. We focused on how much area was affected by flash drought within our selected study area and we found out that with the passing of years, less area was influenced between 2000 and 2020. Our findings was consistent with the findings of [55], where they also observed the area affected by flash drought was decreasing in northeast China. While looking at the trend in the area affected by flash drought in the three mountain areas, the trend in the CM was little bit different in comparison to the GKM and LKM. There might be several factors being influenced by its climate variability, soil type, vegetation and land cover, which need to be investigated more [56].
Similar to our result, flash drought events primarily occur between April and October in others study also, with a focus on the plant-growing seasons [57,58]. Even though flash drought is more frequent in dry regions throughout the year, it is more common in the northeast and northern China (moist) areas during the plant growth season [54]. Along with this, the flash droughts in the Wei River basin also mainly occur in spring (March–May) and summer (June–August) [50]. The primary cause of flash droughts is a lack of precipitation, which is common during growing seasons and makes the soil dry, especially in regions that are vulnerable to flash drought events [7]. The above-mentioned results can also depict flash drought as mostly prevalent in the spring, summer and early autumn seasons but less common in winter seasons. These seasons often bring with them a variety of weather conditions, such as sunlight, rain, and sporadic thunderstorms, with temperatures that vary depending on the specific location in northeast China. Agreeing with our findings, a study also mentioned that regional flash drought occurred more frequently in the spring and summer, notably in northeast China [59].
4.2. Impact of Flash Drought on NDVI
In order to manage the effects of flash droughts, it is critical to identify plant responses to these events since this can serve as the scientific foundation for the development of an early warning system [24]. In this study, we used the NDVI to detect if there is any influence of flash drought on the forest of northeast China. We observed the negative response of the forest NDVI toward flash drought through the overall increasing trend in the NDVI during the decreasing trends in the proportion of flash drought from 2000 to 2020, but there was no exact variation in the response of the NDVI to flash drought in individual years. Likewise, through a comparison of years with more and a smaller proportion of flash drought events, we found differences in the NDVI values. The NDVI, which is sensitive to vegetation water stress, can decline rapidly at the time of sudden onset of flash droughts when plant suffers soil moisture deficits. However, the magnitude of this decline depends on the intensity and duration of the flash drought; longer and more severe events may result in larger negative NDVI anomalies [60,61]. Even though flash droughts only last a short while, they have a significant influence on vegetation, according to previous research and practical cases [62]. The main cause of plant stress during flash droughts is the rapid depletion of root-zone soil moisture, which causes the plants to close their stomata to conserve water, reducing photosynthesis and productivity [57,63]. Observations of vegetation during the early stages of flash droughts, when there is temporarily enough soil water available, have shown positive responses (such as enhanced evapotranspiration), which most likely lead to the subsequent loss of soil moisture. However, as the soil moisture levels continue to drop, flash droughts have detrimental impacts on plants, including reductions in photosynthetic activity and canopy dieback [22].
Through an analysis of the FLUXNET observations, the evaluation of vegetation’s response to flash drought revealed that changes in the stomatal conductance and water usage efficiency lead to decreased gross primary production (GPP) during the flash drought period [26]. In addition, another study found a significant decline in the normalized difference vegetation index (NDVI), gross primary productivity (GPP), and sun-induced fluorescence throughout the dry period while investigating a typical flash drought in the United States [64]. Likewise, while studying the effects of flash drought on vegetation in the Loess Plateau, China, they observed the negative correlation of flash drought and the NDVI in the northwest part of Loess Plateau. Similarly, research during the flash drought period also showed a continuous decline in the NDVI anomaly and plant canopy surface water, indicating a significant effect on vegetation [65]. Researchers used a variety of observational data, such as the gross primary production (GPP) and leaf area index (LAI), to examine how ecosystems responded to flash droughts in Europe between 2001 and 2019. They discovered that, in arid regions, a sudden shift to water-stressed conditions occurred within a few weeks, which had a negative impact on the vegetation status and decreased carbon uptake, particularly in the early stages of drought [22]. Using solar-induced chlorophyll fluorescence to monitor how plant ecosystems responded to the flash droughts that occurred in the Hai River Basin, China, between 2001 and 2019, it was shown that the flash drought occurrence had a major impact on vegetation production, as evidenced by 40% of the basin experiencing losses in gross primary productivity (GPP) [23].
Due to the complexity of the interactions, vegetation ecosystems might respond differently to flash droughts depending on the particular characteristics of the place and the type of vegetation there [66]. Compared to forests, agricultural and grassland ecosystems often exhibit more dramatic negative NDVI responses because they are more susceptible to rapid moisture deficiencies [60]. The vegetation status was found to be negatively affected within a short period of time in the arid region, whereas in the humid region, the vegetation was less affected, with the quick recovery of soil moisture [22].
5. Conclusions
Flash droughts are one of the most complicated and catastrophic meteorological phenomena. In this study, we explored the complex dynamics of flash droughts occurring rapidly in the forest areas of northeastern China during the period from 2000 to 2020. Based on pentad soil moisture percentile criteria, we aimed to reveal findings regarding the number of flash drought events and their characteristics as well as their impacts on the forest NDVI. The main findings are summarized below:
- Our findings revealed the variability of flash drought events in three mountain areas, highlighting the significance of localized evaluations for successful drought mitigation strategies.
- Although the total number of flash drought events was high, the repetition of events in the same location within our selected time frame was low and the total duration was not so prolonged, and there was not much distinct spatial variation in the flash drought characteristics among the three mountain areas.
- The inter-annual variations in the area affected by flash drought events highlighted the changing interaction between climatic elements and the quick onset of drought conditions. The increasing trend in the NDVI during the decreasing trends in the flash drought, as well as the improvement in the NDVI value over the time period, revealed the negative impact of flash drought on the forest NDVI.
The relation between flash drought and vegetation involves a complex interplay. Flash drought occurs rapidly within a short period of time, but its impact, especially on forest ecosystems, can be more severe. So, detailed analysis when studying and understanding the impacts of climatic phenomena like flash droughts on ecological systems by focusing on more specific area and time period requires further research. Our research emphasizes the necessity for specific drought mitigation strategies in the forests of northeastern China. Through the utilization of advanced methods, our findings are helpful in deeply understanding flash drought as well as its impact, contributing to more effective policy formulation and the enhancement of forest resilience.
Author Contributions
Conceptualization, B.L. and S.A.; methodology, S.A.; software, S.A. and W.Z.; formal analysis, S.A. and Z.D.; data curation, S.A., B.L. and W.Z.; writing—original draft preparation, S.A. and N.S; writing—review and editing, S.A., B.C., R.M. and B.L; visualization, S.A. and N.S. All authors have read and agreed to the published version of the manuscript.
Funding
This research was funded by the National Natural Science Foundation of China, grant number 41877416.
Institutional Review Board Statement
Not appliable.
Informed Consent Statement
Not applicable.
Data Availability Statement
The soil moisture dataset referenced in this paper is available from the National Tibetan Plateau Data Center (TPDC) (http://www.tpdc.ac.cn/, accessed on 3 September 2023). The NDVI dataset is available from the Data Center for Resources and Environmental Sciences, Chinese Academy of Sciences (http://www.resdc.cn, assessed on 15 December 2023).
Acknowledgments
The authors are grateful to the anonymous reviewers, the handling editor, and the editor-in-chief, whose comments were critical in finalizing the manuscript. We are filled with gratitude to Mansoor Hayat, Anant Mishra, Suneel Yadav, Diwas Bajracharya, and all the individuals who provided direct and indirect support at various stages of the study. The usual disclaimer applies, and all mistakes remain the authors’ responsibility.
Conflicts of Interest
The authors declare no conflicts of interest.
References
- Poonia, V.; Goyal, M.K.; Jha, S.; Dubey, S. Terrestrial ecosystem response to flash droughts over India. J. Hydrol. 2022, 605, 127402. [Google Scholar] [CrossRef]
- Orth, R.; O, S.; Zscheischler, J.; Mahecha, M.D.; Reichstein, M. Contrasting biophysical and societal impacts of hydro-meteorological extremes. Environ. Res. Lett. 2022, 17, 014044. [Google Scholar] [CrossRef]
- Tian, J.; Zhang, Z.; Zhao, T.; Tao, H.; Zhu, B. Warmer and wetter climate induced by the continual increase in atmospheric temperature and precipitable water vapor over the arid and semi–arid regions of Northwest China. J. Hydrol. Reg. Stud. 2022, 42, 101151. [Google Scholar] [CrossRef]
- Wilhite, D.A.; Glantz, M.H. Understanding: The drought phenomenon: The role of definitions. Water Int. 1985, 10, 111–120. [Google Scholar] [CrossRef]
- Lisonbee, J.; Woloszyn, M.; Skumanich, M. Making sense of flash drought: Definitions, indicators, and where we go from here. J. Appl. Serv. Climatol. 2022, 2021. [Google Scholar] [CrossRef]
- Svoboda, M.; LeComte, D.; Hayes, M.; Heim, R.; Gleason, K.; Angel, J.; Rippey, B.; Tinker, R.; Palecki, M.; Stooksbury, D. The drought monitor. Bull. Am. Meteorol. Soc. 2002, 83, 1181–1190. [Google Scholar] [CrossRef]
- Rakkasagi, S.; Poonia, V.; Goyal, M.K. Flash drought as a new climate threat: Drought indices, insights from a study in India and implications for future research. J. Water Clim. Chang. 2023, 14, 3368–3384. [Google Scholar] [CrossRef]
- Zhang, J.; Zhang, M.; Yu, J.; Yu, Y.; Yu, R. Comparison of Flash Drought and Traditional Drought on Characteristics and Driving Forces in Xinjiang. Remote Sens. 2023, 15, 4758. [Google Scholar] [CrossRef]
- Yuan, X.; Wang, Y.; Ji, P.; Wu, P.; Sheffield, J.; Otkin, J.A. A global transition to flash droughts under climate change. Science 2023, 380, 187–191. [Google Scholar] [CrossRef]
- Chen, L.G.; Gottschalck, J.; Hartman, A.; Miskus, D.; Tinker, R.; Artusa, A. Flash drought characteristics based on US drought monitor. Atmosphere 2019, 10, 498. [Google Scholar] [CrossRef]
- Otkin, J.A.; Anderson, M.C.; Hain, C.; Svoboda, M.; Johnson, D.; Mueller, R.; Tadesse, T.; Wardlow, B.; Brown, J. Assessing the evolution of soil moisture and vegetation conditions during the 2012 United States flash drought. Agric. For. Meteorol. 2016, 218, 230–242. [Google Scholar] [CrossRef]
- Christian, J.I.; Basara, J.B.; Hunt, E.D.; Otkin, J.A.; Xiao, X. Flash drought development and cascading impacts associated with the 2010 Russian heatwave. Environ. Res. Lett. 2020, 15, 094078. [Google Scholar] [CrossRef]
- Nguyen, H.; Wheeler, M.C.; Otkin, J.A.; Cowan, T.; Frost, A.; Stone, R. Using the evaporative stress index to monitor flash drought in Australia. Environ. Res. Lett. 2019, 14, 064016. [Google Scholar] [CrossRef]
- Zscheischler, J.; Westra, S.; Van Den Hurk, B.J.; Seneviratne, S.I.; Ward, P.J.; Pitman, A.; AghaKouchak, A.; Bresch, D.N.; Leonard, M.; Wahl, T. Future climate risk from compound events. Nat. Clim. Chang. 2018, 8, 469–477. [Google Scholar] [CrossRef]
- Pang, Y. A review on the identification methods of flash drought and its spatial dynamic propagation. In E3S Web of Conferences; EDP Sciences: Ulys, France, 2023; p. 01005. [Google Scholar]
- Anderson, M.C.; Hain, C.; Otkin, J.; Zhan, X.; Mo, K.; Svoboda, M.; Wardlow, B.; Pimstein, A. An intercomparison of drought indicators based on thermal remote sensing and NLDAS-2 simulations with US Drought Monitor classifications. J. Hydrometeorol. 2013, 14, 1035–1056. [Google Scholar] [CrossRef]
- Christian, J.I.; Basara, J.B.; Otkin, J.A.; Hunt, E.D.; Wakefield, R.A.; Flanagan, P.X.; Xiao, X. A methodology for flash drought identification: Application of flash drought frequency across the United States. J. Hydrometeorol. 2019, 20, 833–846. [Google Scholar] [CrossRef]
- Noguera, I.; Domínguez-Castro, F.; Vicente-Serrano, S.M. Characteristics and trends of flash droughts in Spain, 1961–2018. Ann. N. Y. Acad. Sci. 2020, 1472, 155–172. [Google Scholar] [CrossRef]
- Pendergrass, A.G.; Meehl, G.A.; Pulwarty, R.; Hobbins, M.; Hoell, A.; AghaKouchak, A.; Bonfils, C.J.; Gallant, A.J.; Hoerling, M.; Hoffmann, D. Flash droughts present a new challenge for subseasonal-to-seasonal prediction. Nat. Clim. Chang. 2020, 10, 191–199. [Google Scholar] [CrossRef]
- Osman, M.; Zaitchik, B.F.; Badr, H.S.; Christian, J.I.; Tadesse, T.; Otkin, J.A.; Anderson, M.C. Flash drought onset over the contiguous United States: Sensitivity of inventories and trends to quantitative definitions. Hydrol. Earth Syst. Sci. 2021, 25, 565–581. [Google Scholar] [CrossRef]
- Qing, Y.; Wang, S.; Ancell, B.C.; Yang, Z.-L. Accelerating flash droughts induced by the joint influence of soil moisture depletion and atmospheric aridity. Nat. Commun. 2022, 13, 1139. [Google Scholar] [CrossRef]
- Sungmin, O.; Park, S.K. Flash drought drives rapid vegetation stress in arid regions in Europe. Environ. Res. Lett. 2023, 18, 014028. [Google Scholar]
- Yao, T.; Liu, S.; Hu, S.; Mo, X. Response of vegetation ecosystems to flash drought with solar-induced chlorophyll fluorescence over the Hai River Basin, China during 2001–2019. J. Environ. Manag. 2022, 313, 114947. [Google Scholar] [CrossRef]
- Li, P.; Jia, L.; Lu, J.; Jiang, M.; Zheng, C.; Menenti, M. Investigating the Response of Vegetation to Flash Droughts by Using Cross-Spectral Analysis and an Evapotranspiration-Based Drought Index. Remote Sens. 2024, 16, 1564. [Google Scholar] [CrossRef]
- Zhang, M.; Yuan, X. Rapid reduction in ecosystem productivity caused by flash droughts based on decade-long FLUXNET observations. Hydrol. Earth Syst. Sci. 2020, 24, 5579–5593. [Google Scholar] [CrossRef]
- Zhang, M.; Yuan, X.; Otkin, J.A. Remote sensing of the impact of flash drought events on terrestrial carbon dynamics over China. Carbon. Balance Manag. 2020, 15, 20. [Google Scholar] [CrossRef]
- De Ocampo, A.L.P. Normalized Difference Vegetation Index (NDVI) Estimation based on Filter Augmented Imaging. In Proceedings of the 2023 International Electrical Engineering Congress (iEECON), Krabi, Thailand, 8–10 March 2023; pp. 84–88. [Google Scholar]
- Nguyen, H.; Wheeler, M.C.; Otkin, J.A.; Nguyen-Huy, T.; Cowan, T. Climatology and composite evolution of flash drought over Australia and its vegetation impacts. J. Hydrometeorol. 2023, 24, 1087–1101. [Google Scholar] [CrossRef]
- Mo, K.C.; Lettenmaier, D.P. Precipitation deficit flash droughts over the United States. J. Hydrometeorol. 2016, 17, 1169–1184. [Google Scholar] [CrossRef]
- Yuan, X.; Wang, L.; Wu, P.; Ji, P.; Sheffield, J.; Zhang, M. Anthropogenic shift towards higher risk of flash drought over China. Nat. Commun. 2019, 10, 4661. [Google Scholar] [CrossRef] [PubMed]
- Li, M.; Ma, Z. Soil moisture-based study of the variability of dry-wet climate and climate zones in China. Chin. Sci. Bull. 2013, 58, 531–544. [Google Scholar] [CrossRef]
- Liu, Y.; Zhu, Y.; Zhang, L.; Ren, L.; Yuan, F.; Yang, X.; Jiang, S. Flash droughts characterization over China: From a perspective of the rapid intensification rate. Sci. Total Environ. 2020, 704, 135373. [Google Scholar] [CrossRef]
- Zhang, E.; Wang, Q.; Guan, Q.; Yang, X.; Luo, H.; Zhang, J.; Du, Q.; Zhang, Z. Re-intensification of flash drought in western China over the past decade: Implications of fluctuating wetting trend. Sci. Total Environ. 2024, 919, 170878. [Google Scholar] [CrossRef] [PubMed]
- Zhang, L.; Liu, Y.; Ren, L.; Teuling, A.J.; Zhu, Y.; Wei, L.; Zhang, L.; Jiang, S.; Yang, X.; Fang, X. Analysis of flash droughts in China using machine learning. Hydrol. Earth Syst. Sci. 2022, 26, 3241–3261. [Google Scholar] [CrossRef]
- Yuan, X.; Ma, Z.; Pan, M.; Shi, C. Microwave remote sensing of short-term droughts during crop growing seasons. Geophys. Res. Lett. 2015, 42, 4394–4401. [Google Scholar] [CrossRef]
- Xue, Z.; Chen, Y.; Yin, Y.; Chen, W.; Jiao, Y.; Deng, P.; Dai, S. Spatio-temporal characteristics and driving factors of flash drought in northern China from 1978 to 2020. Global Planet Chang. 2024, 232, 104326. [Google Scholar] [CrossRef]
- Sun, F.; Yuan, J.; Lu, S. The change and test of climate in Northeast China over the last 100 years. Clim. Environ. Res. 2006, 11, 101–108. [Google Scholar]
- Abu Arra, A.; Şişman, E. Innovative Drought Classification Matrix and Acceptable Time Period for Temporal Drought Evaluation. Water Resour. Manag. 2024, 38, 2811–2833. [Google Scholar] [CrossRef]
- Xiao-Ying, W.; Chun-Yu, Z.; Qing-Yu, J. Impacts of climate change on forest ecosystems in Northeast China. Adv. Clim. Change Res. 2013, 4, 230–241. [Google Scholar] [CrossRef]
- Gao, G.; Jie, D.; Li, D.; Li, N.; Liu, L.; Liu, H.; Wang, J.; Niu, H.; Meng, M.; Liu, Y. Reconstruction of local-scale plant community characteristics using phytolith: A case study of a forested region in Northeast China. Catena 2021, 203, 105146. [Google Scholar] [CrossRef]
- Yan, X.; Zhao, S.; Shugart, H.; Fu, C.; Yu, Z. How should the Xiao Hinggan Mt. forests change with potential climate change: A simulation study. J. Nat. Resour. 1999, 14, 372–376. [Google Scholar]
- Wang, X.; Li, X.; He, H.; Leng, W.; Wen, Q. Postfire succession of larch forest in the northern slope of Daxinganling. Chin. J. Ecol. 2004, 35, 35–41. [Google Scholar]
- Li, Q.; Shi, G.; Shangguan, W.; Nourani, V.; Li, J.; Li, L.; Huang, F.; Zhang, Y.; Wang, C.; Wang, D. A 1 km daily soil moisture dataset over China using in situ measurement and machine learning. Earth Syst. Sci. Data 2022, 14, 5267–5286. [Google Scholar] [CrossRef]
- Jiang, L.; Liu, Y.; Wu, S.; Yang, C. Analyzing ecological environment change and associated driving factors in China based on NDVI time series data. Ecol. Indic. 2021, 129, 107933. [Google Scholar] [CrossRef]
- Xu, X. China Monthly Vegetation Index (NDVI) Spatial Distribution Dataset; Data Registration and Publishing System of Resource and Environment Science Data Center, Chinese Academy of Sciences: Beijing, China, 2018. [Google Scholar]
- Mahto, S.S.; Mishra, V. Dominance of summer monsoon flash droughts in India. Environ. Res. Lett. 2020, 15, 104061. [Google Scholar] [CrossRef]
- Zhang, S.; Li, M.; Ma, Z.; Jian, D.; Lv, M.; Yang, Q.; Duan, Y.; Amin, D. The intensification of flash droughts across China from 1981 to 2021. Clim. Dyn. 2023, 62, 1233–1247. [Google Scholar] [CrossRef]
- Mann, H.B. Nonparametric tests against trend. Econom. J. Econom. Soc. 1945, 13, 245–259. [Google Scholar] [CrossRef]
- Kendall, M.G. Rank correlation methods. Biometrika 1948, 30, 81–93. [Google Scholar] [CrossRef]
- Wang, H.; Zhu, Q.; Wang, Y.; Zhang, H. Spatio-temporal characteristics and driving factors of flash drought recovery: From the perspective of soil moisture and GPP changes. Weather. Clim. Extrem. 2023, 42, 100605. [Google Scholar] [CrossRef]
- Zhang, Y.; You, Q.; Chen, C.; Li, X. Flash droughts in a typical humid and subtropical basin: A case study in the Gan River Basin, China. J. Hydrol. 2017, 551, 162–176. [Google Scholar] [CrossRef]
- Li, J.; Wang, Z.; Wu, X.; Chen, J.; Guo, S.; Zhang, Z. A new framework for tracking flash drought events in space and time. Catena 2020, 194, 104763. [Google Scholar] [CrossRef]
- Christian, J.I.; Basara, J.B.; Lowman, L.E.; Xiao, X.; Mesheske, D.; Zhou, Y. Flash drought identification from satellite-based land surface water index. Remote Sens. Appl. Soc. Environ. 2022, 26, 100770. [Google Scholar] [CrossRef]
- Fu, K.; Wang, K. Quantifying flash droughts over China from 1980 to 2017. J. Geophys. Res. Atmos. 2022, 127, e2022JD037152. [Google Scholar] [CrossRef]
- Sun, J.; Zhang, Q.; Liu, X.; Sun, J.; Chen, L.; Wu, Y.; Hu, B.; Zhang, G. Flash droughts in a hotspot region: Spatiotemporal patterns, possible climatic drivings and ecological impacts. Weather Clim. Extreme 2024, 45, 100700. [Google Scholar] [CrossRef]
- Han, Y.; Li, Z.; Huang, C.; Zhou, Y.; Zong, S.; Hao, T.; Niu, H.; Yao, H. Monitoring droughts in the Greater Changbai Mountains using multiple remote sensing-based drought indices. Remote Sens. 2020, 12, 530. [Google Scholar] [CrossRef]
- Park, S.K. Global ecosystem responses to flash droughts are modulated by background climate and vegetation conditions. Commun. Earth Environ. 2024, 5, 1–7. [Google Scholar]
- Chen, L.G.; Gottschalck, J.; Tinker, R.; Hartman, A.; Miskus, D.; Artusa, A. Flash Drought Characteristics and Prediction. Clim. Predict. ST Dig. 2019, 126. [Google Scholar]
- Gong, Z.; Zhu, J.; Li, T.; Huang, D.; Chen, X.; Zhang, Q. The features of regional flash droughts in four typical areas over China and the possible mechanisms. Sci. Total Environ. 2022, 827, 154217. [Google Scholar] [CrossRef]
- Mohammadi, K.; Jiang, Y.; Wang, G. Flash drought early warning based on the trajectory of solar-induced chlorophyll fluorescence. Proc. Natl. Acad. Sci. USA 2022, 119, e2202767119. [Google Scholar] [CrossRef]
- Osman, M.; Zaitchik, B.F.; Badr, H.S.; Otkin, J.; Zhong, Y.; Lorenz, D.; Anderson, M.; Keenan, T.F.; Miller, D.L.; Hain, C. Diagnostic classification of flash drought events reveals distinct classes of forcings and impacts. J. Hydrometeorol. 2022, 23, 275–289. [Google Scholar]
- Otkin, J.A.; Svoboda, M.; Hunt, E.D.; Ford, T.W.; Anderson, M.C.; Hain, C.; Basara, J.B. Flash droughts: A review and assessment of the challenges imposed by rapid-onset droughts in the United States. Bull. Am. Meteorol. Soc. 2018, 99, 911–919. [Google Scholar]
- Lovino, M.A.; Pierrestegui, M.J.; Müller, O.V.; Müller, G.V.; Berbery, E.H. The prevalent life cycle of agricultural flash droughts. Npj Clim. Atmos. Sci. 2024, 7, 73. [Google Scholar] [CrossRef]
- Jin, C.; Luo, X.; Xiao, X.; Dong, J.; Li, X.; Yang, J.; Zhao, D. The 2012 flash drought threatened US Midwest agroecosystems. Chin. Geogr. Sci. 2019, 29, 768–783. [Google Scholar] [CrossRef]
- Zheng, X.; Huang, S.; Peng, J.; Leng, G.; Huang, Q.; Fang, W.; Guo, Y. Flash droughts identification based on an improved framework and their contrasting impacts on vegetation over the Loess Plateau, China. Water Resour. Res. 2022, 58, e2021WR031464. [Google Scholar] [CrossRef]
- Han, J.; Zhang, J.; Yang, S.; Seka, A.M. Improved understanding of flash drought from a comparative analysis of drought with different intensification rates. Remote Sens. 2023, 15, 2049. [Google Scholar] [CrossRef]


Disclaimer/Publisher’s Note: The statements, opinions and data contained in all publications are solely those of the individual author(s) and contributor(s) and not of MDPI and/or the editor(s). MDPI and/or the editor(s) disclaim responsibility for any injury to people or property resulting from any ideas, methods, instructions or products referred to in the content. |
© 2024 by the authors. Licensee MDPI, Basel, Switzerland. This article is an open access article distributed under the terms and conditions of the Creative Commons Attribution (CC BY) license (https://creativecommons.org/licenses/by/4.0/).