
The Development of a Hailstone Disdrometer and Its Preliminary Observation in Aksu, Xinjiang
 ,
,
Abstract
:1. Introduction
2. Instrument, Method, and Data
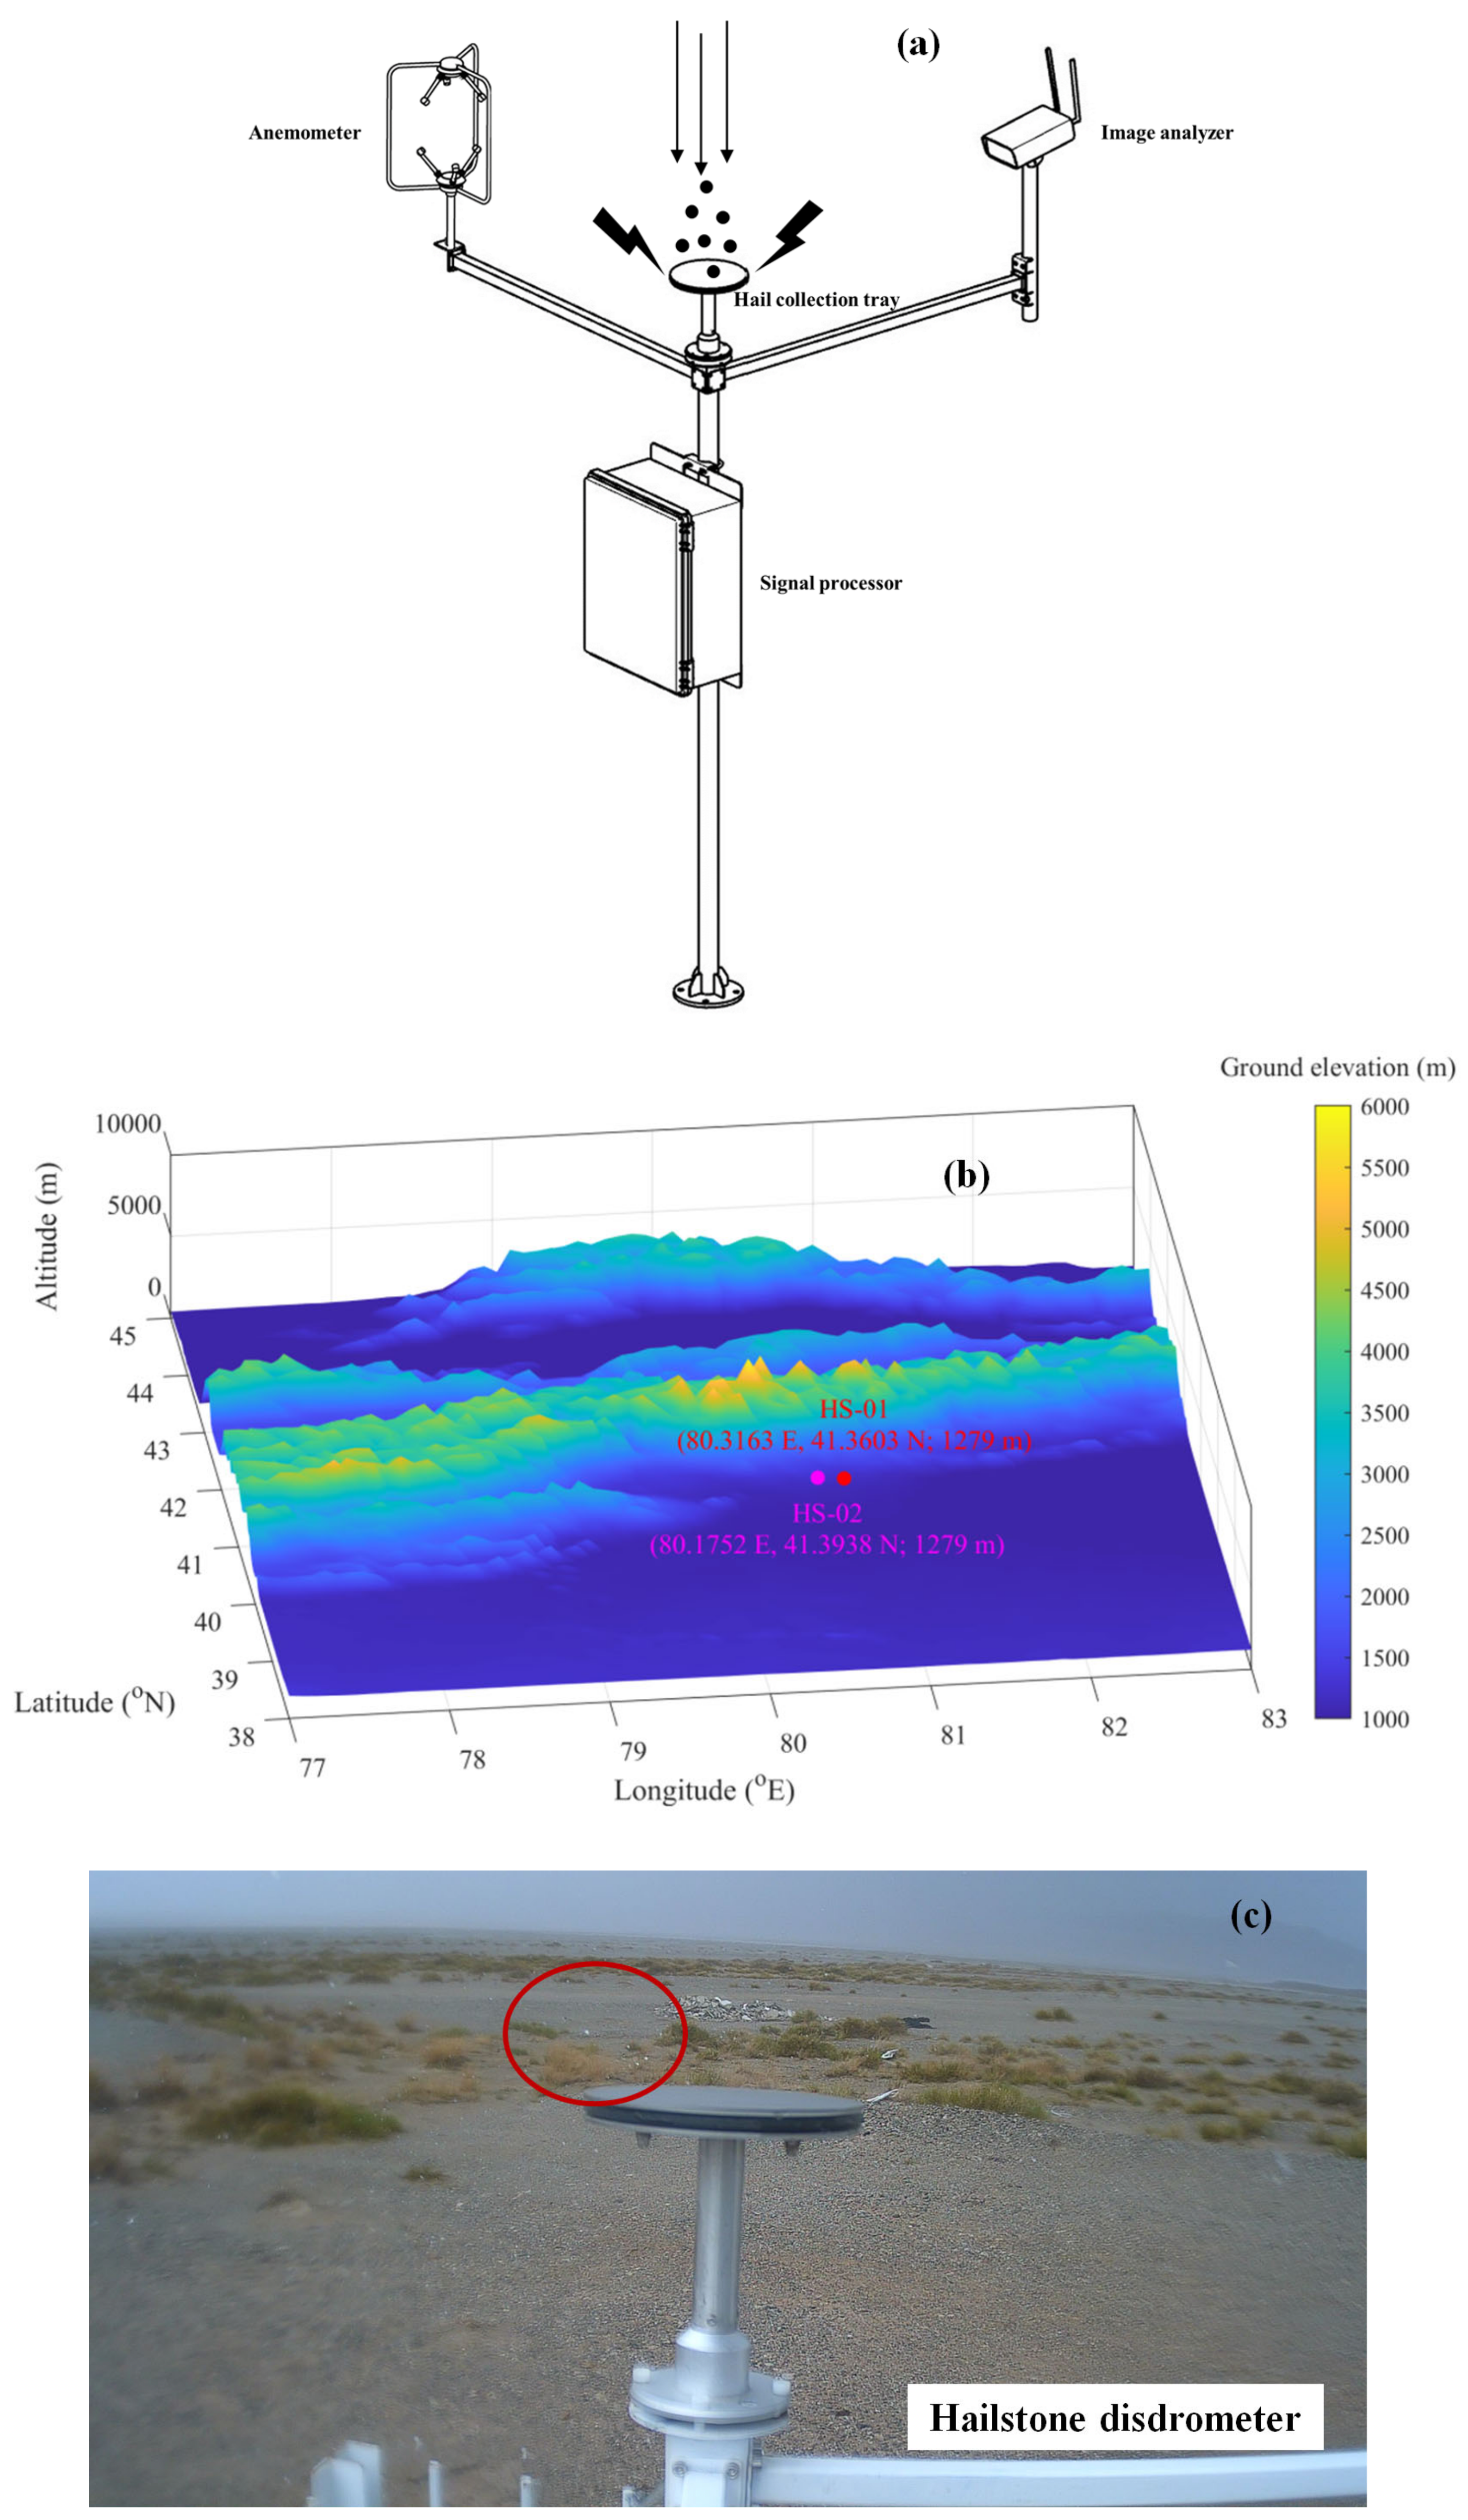
2.1. Components of the Hailstone Disdrometer
2.2. Method of Hailstone Retrieval
2.3. Field Experiment and Data
3. Results
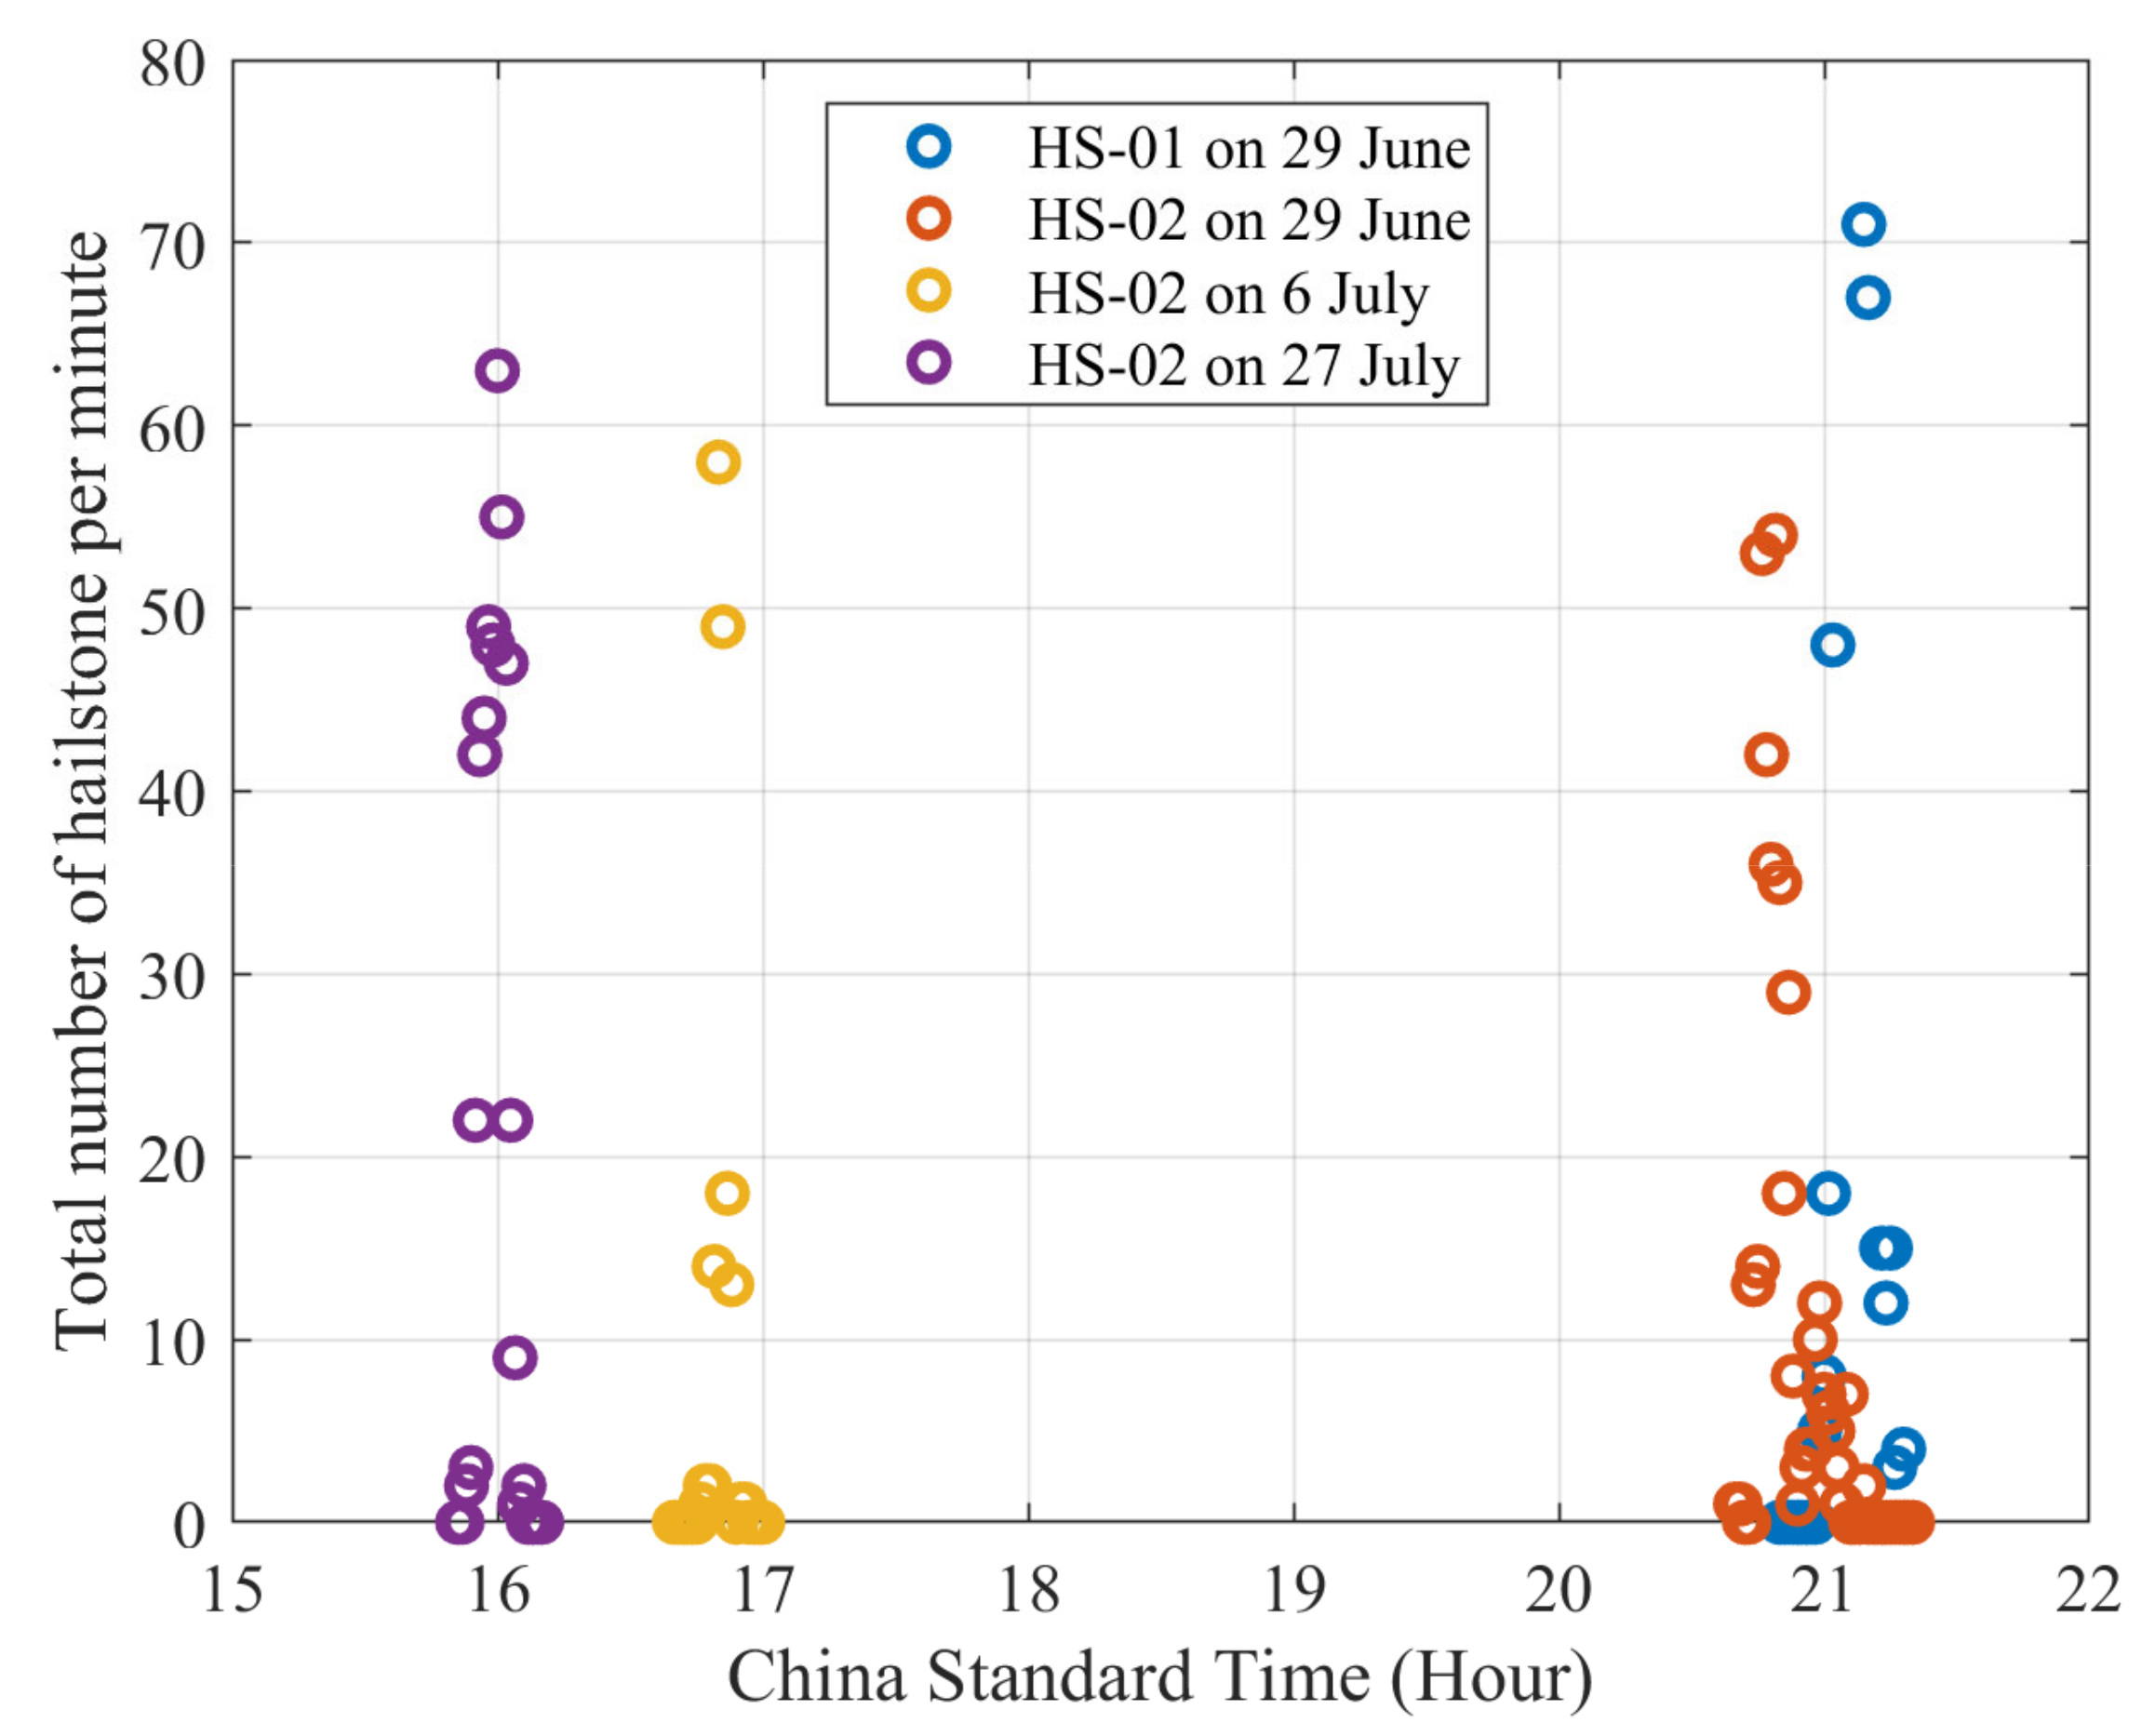
3.1. Hail Characteristics Observed using the Hailstone Disdrometer in Aksu, Xinjiang
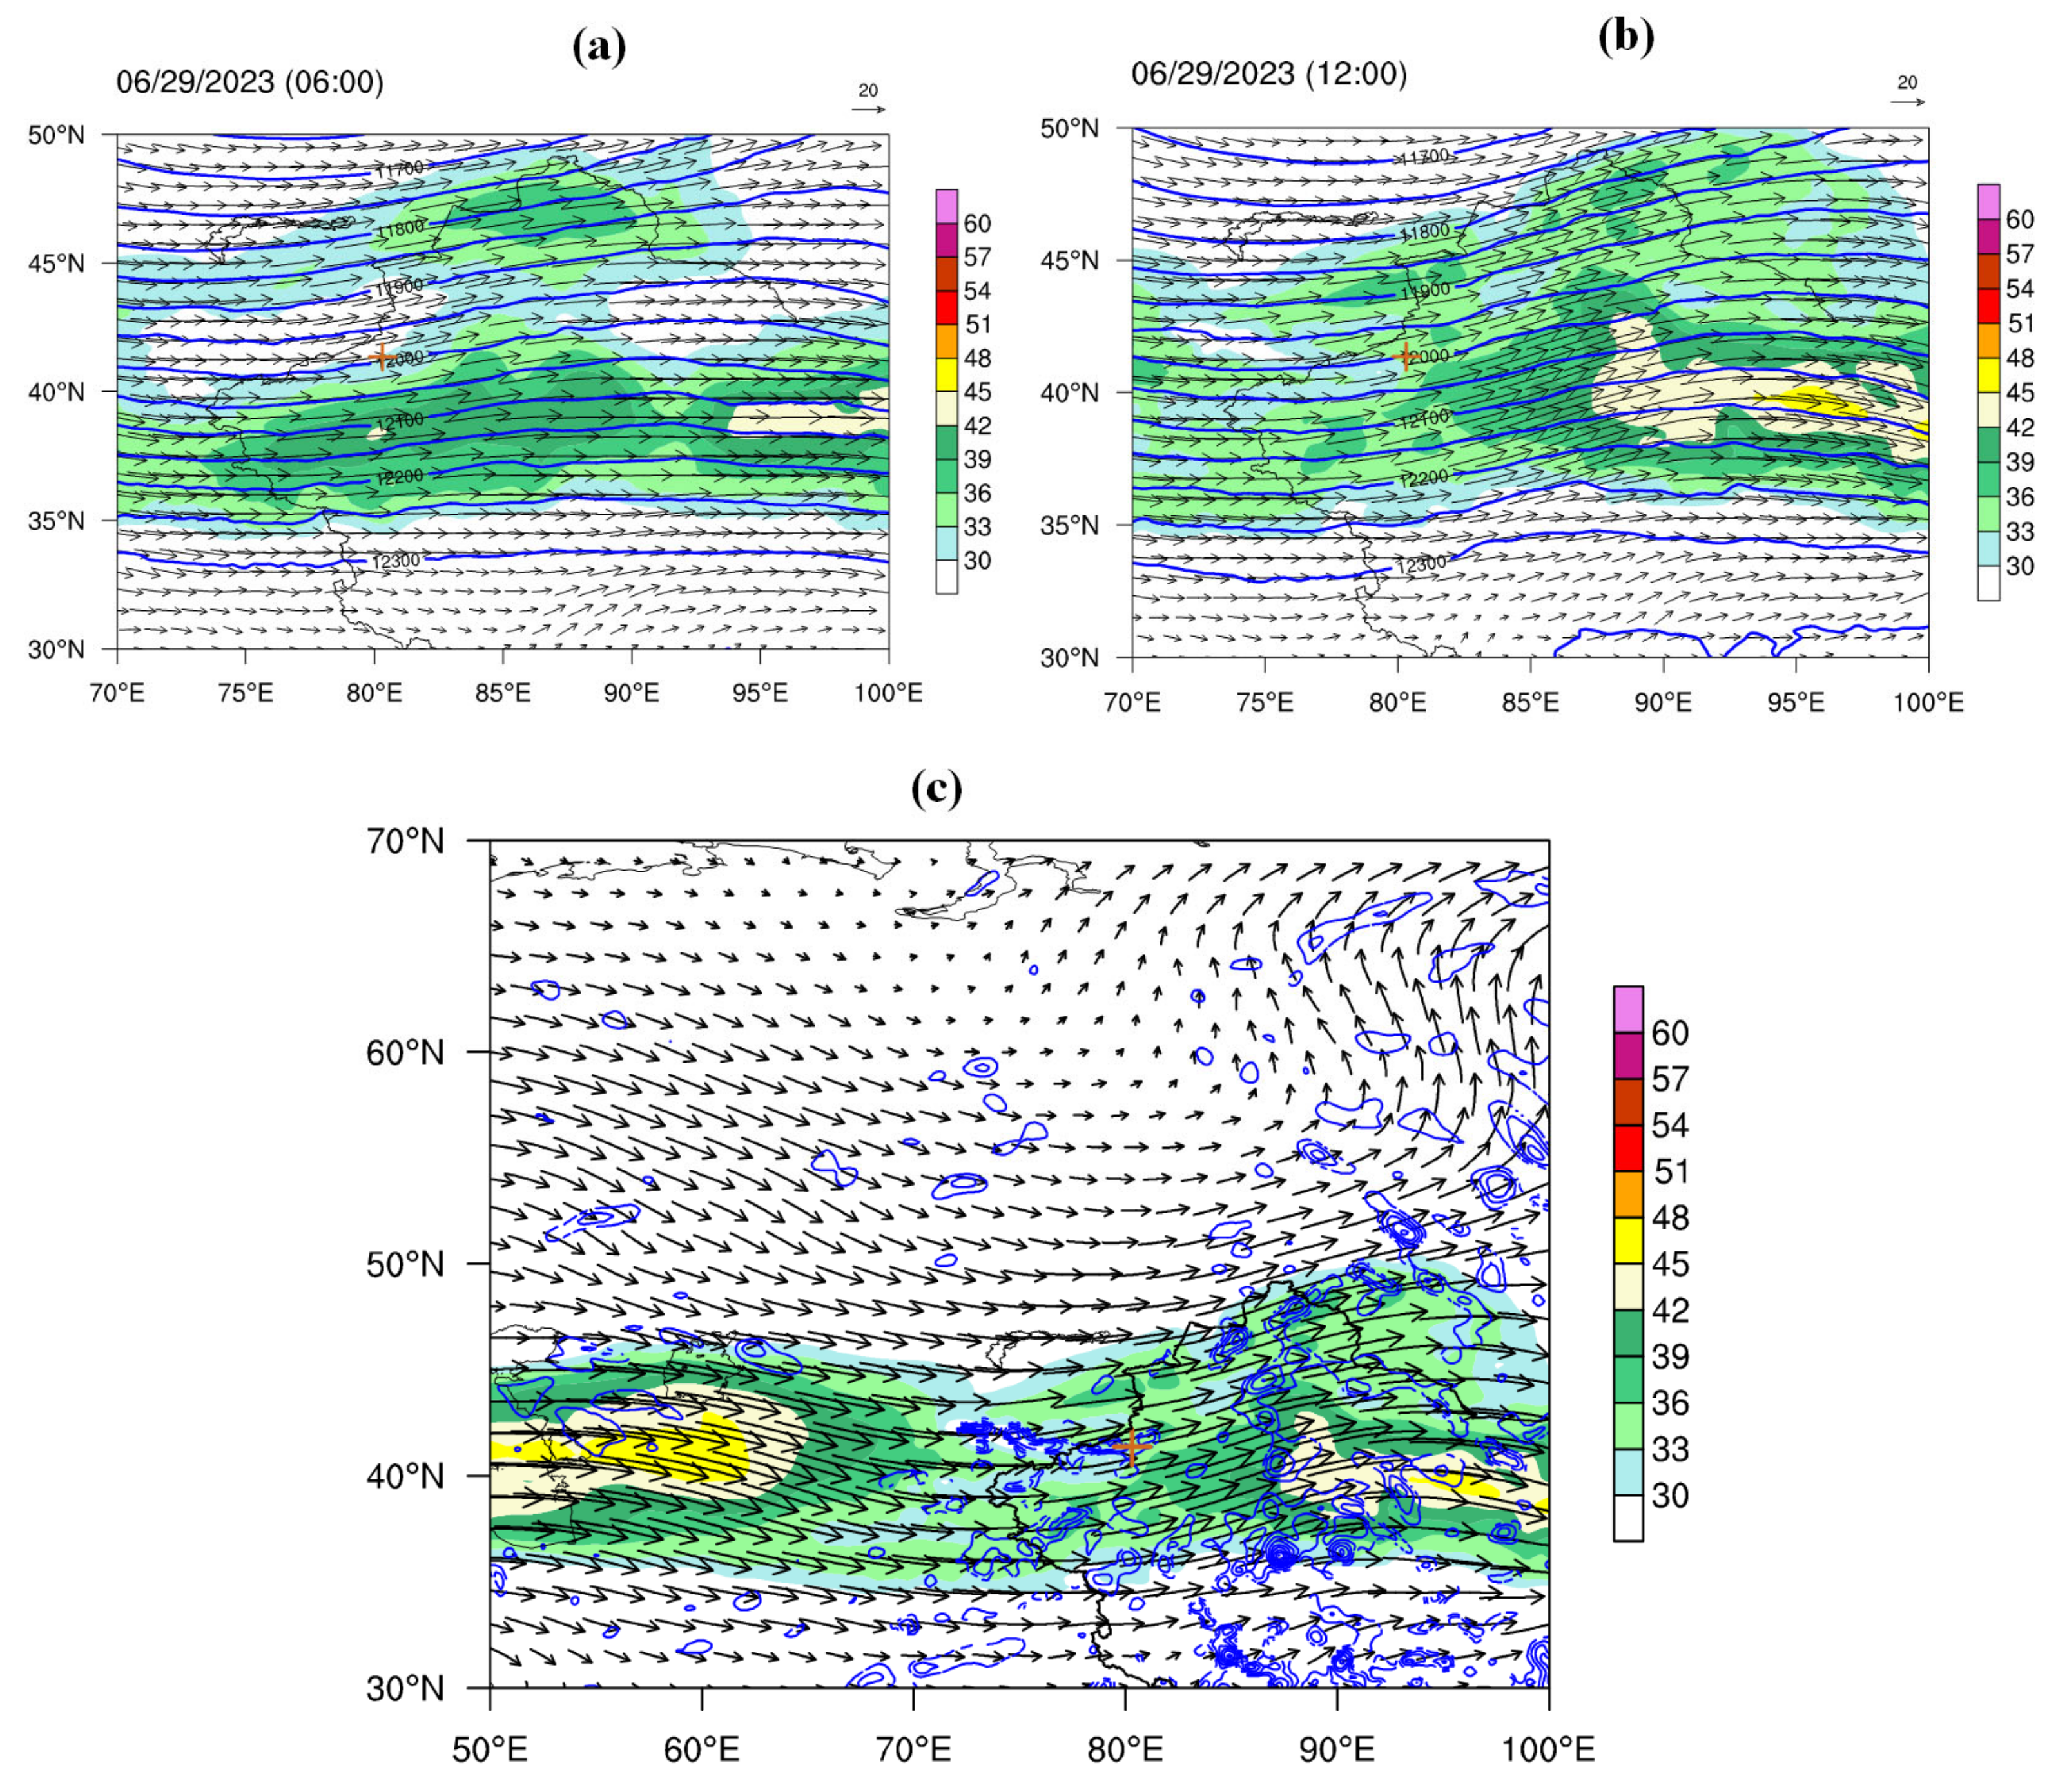
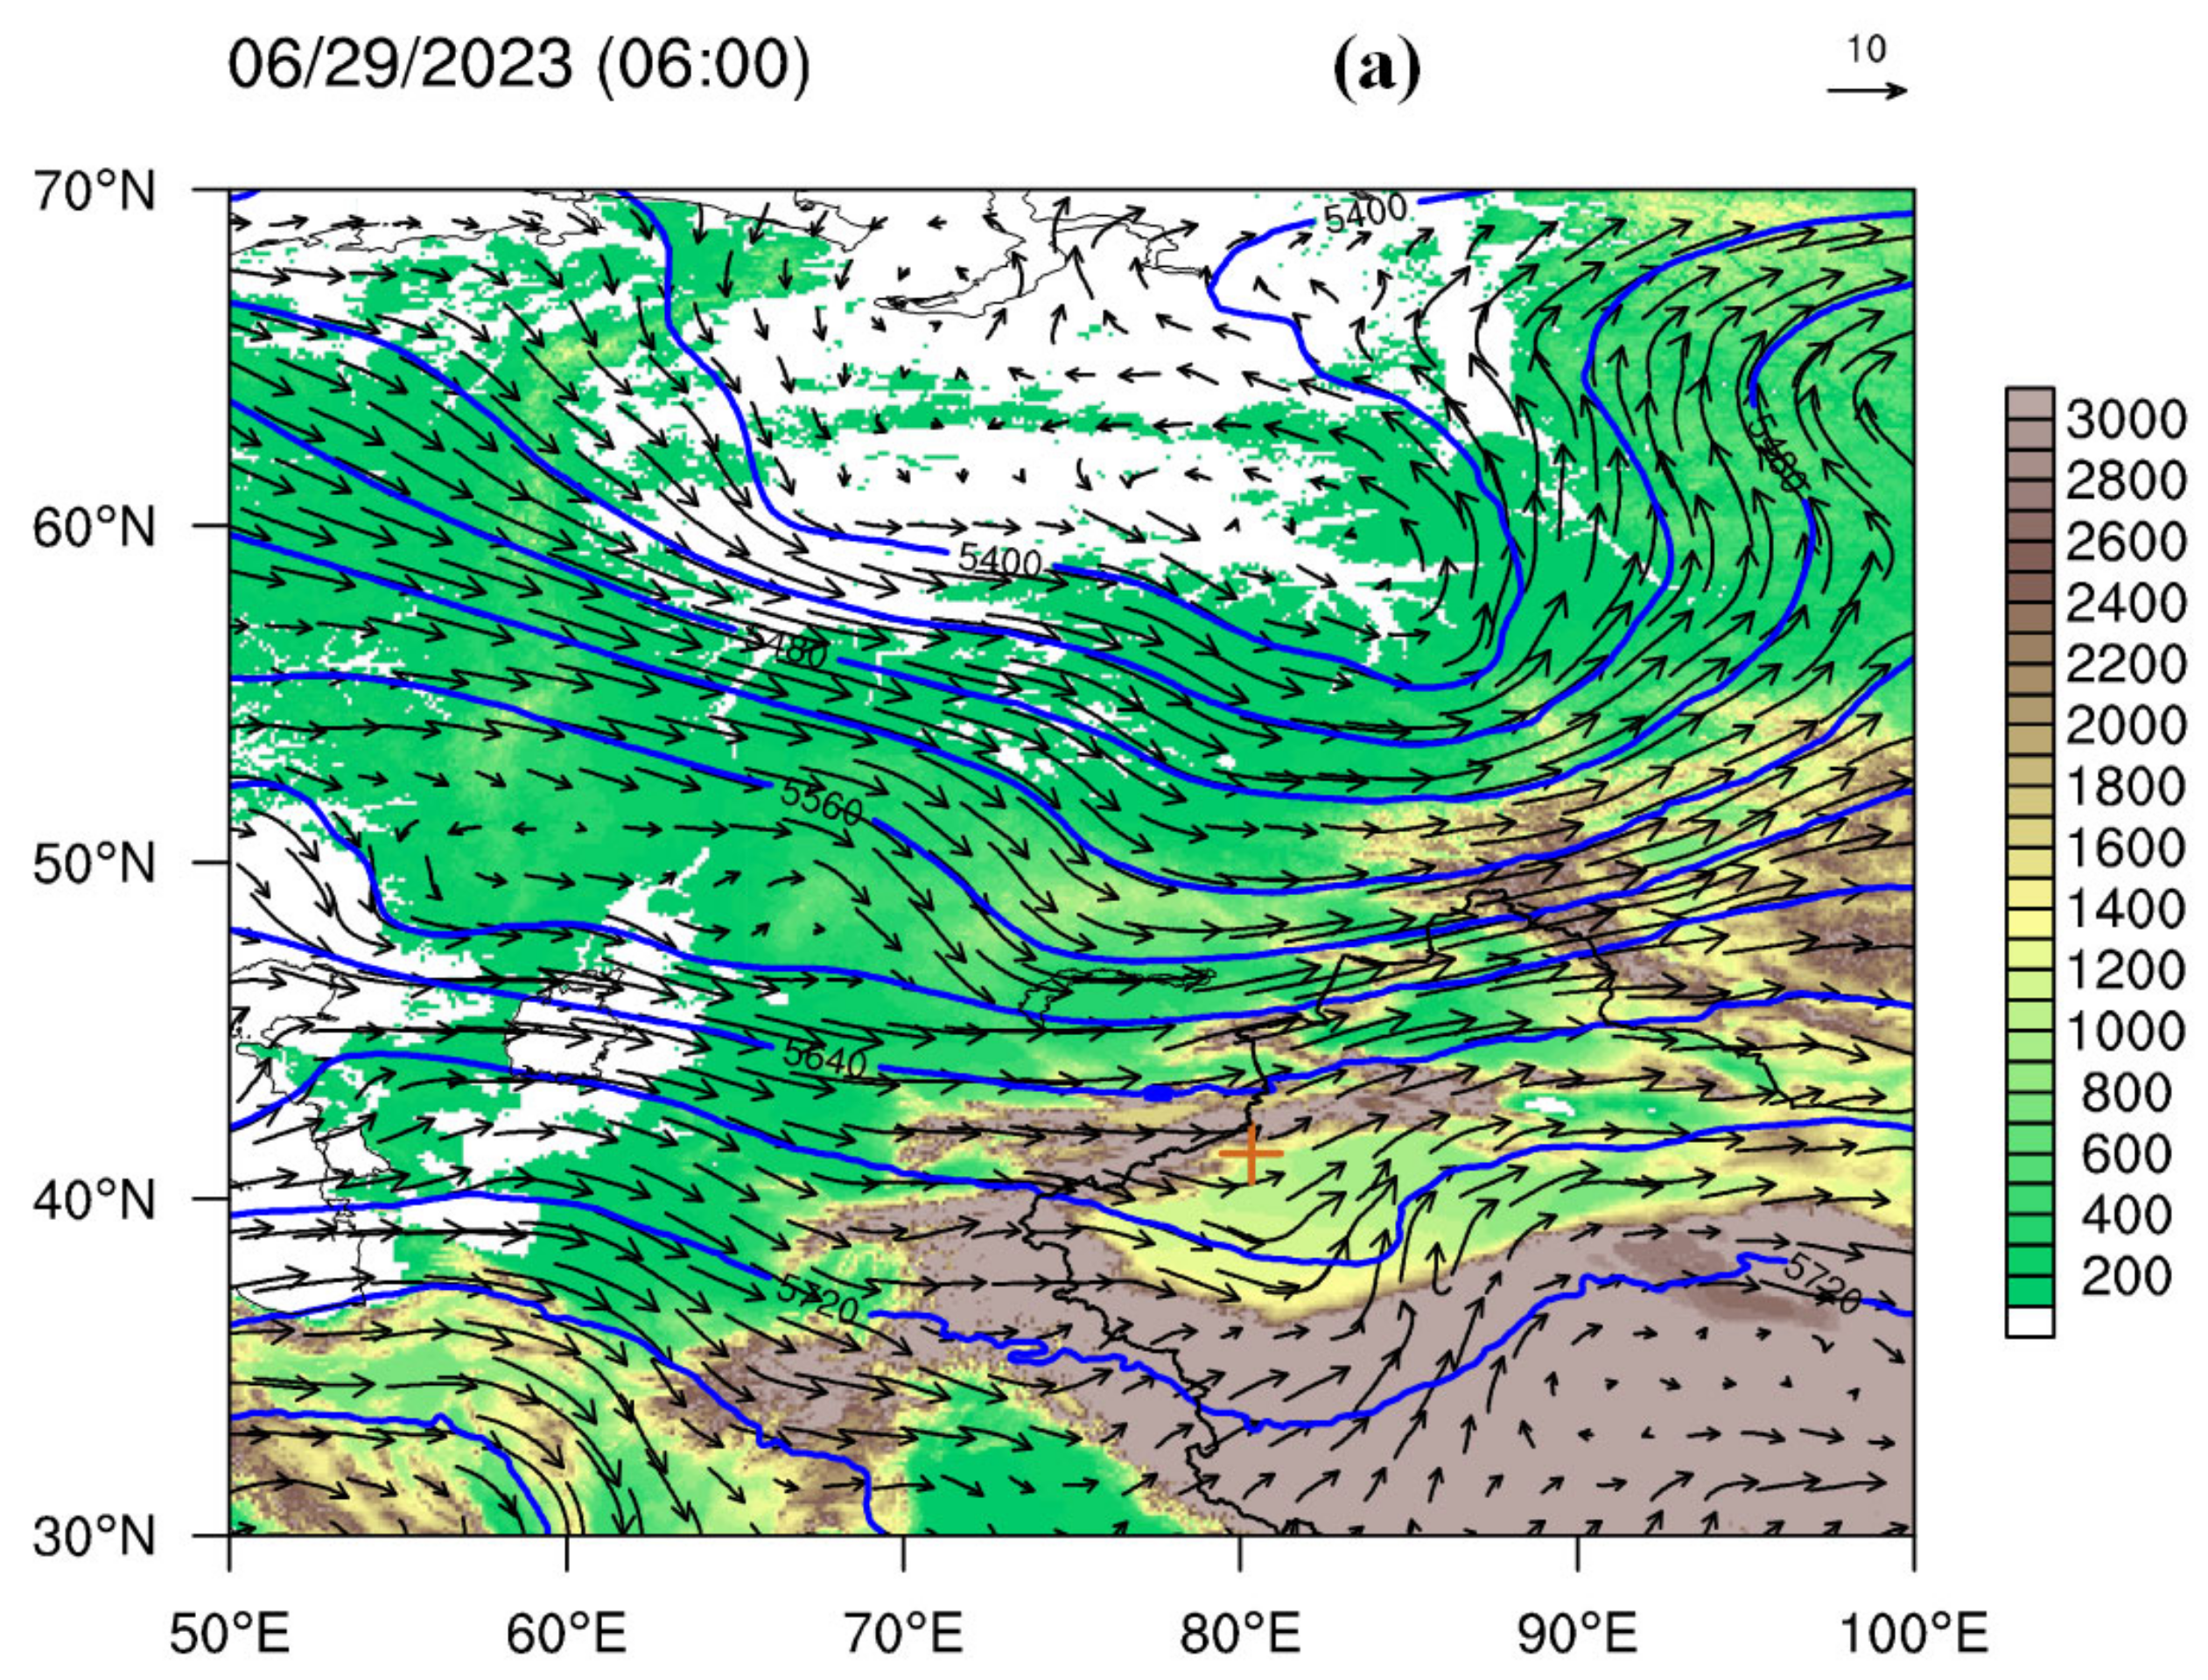
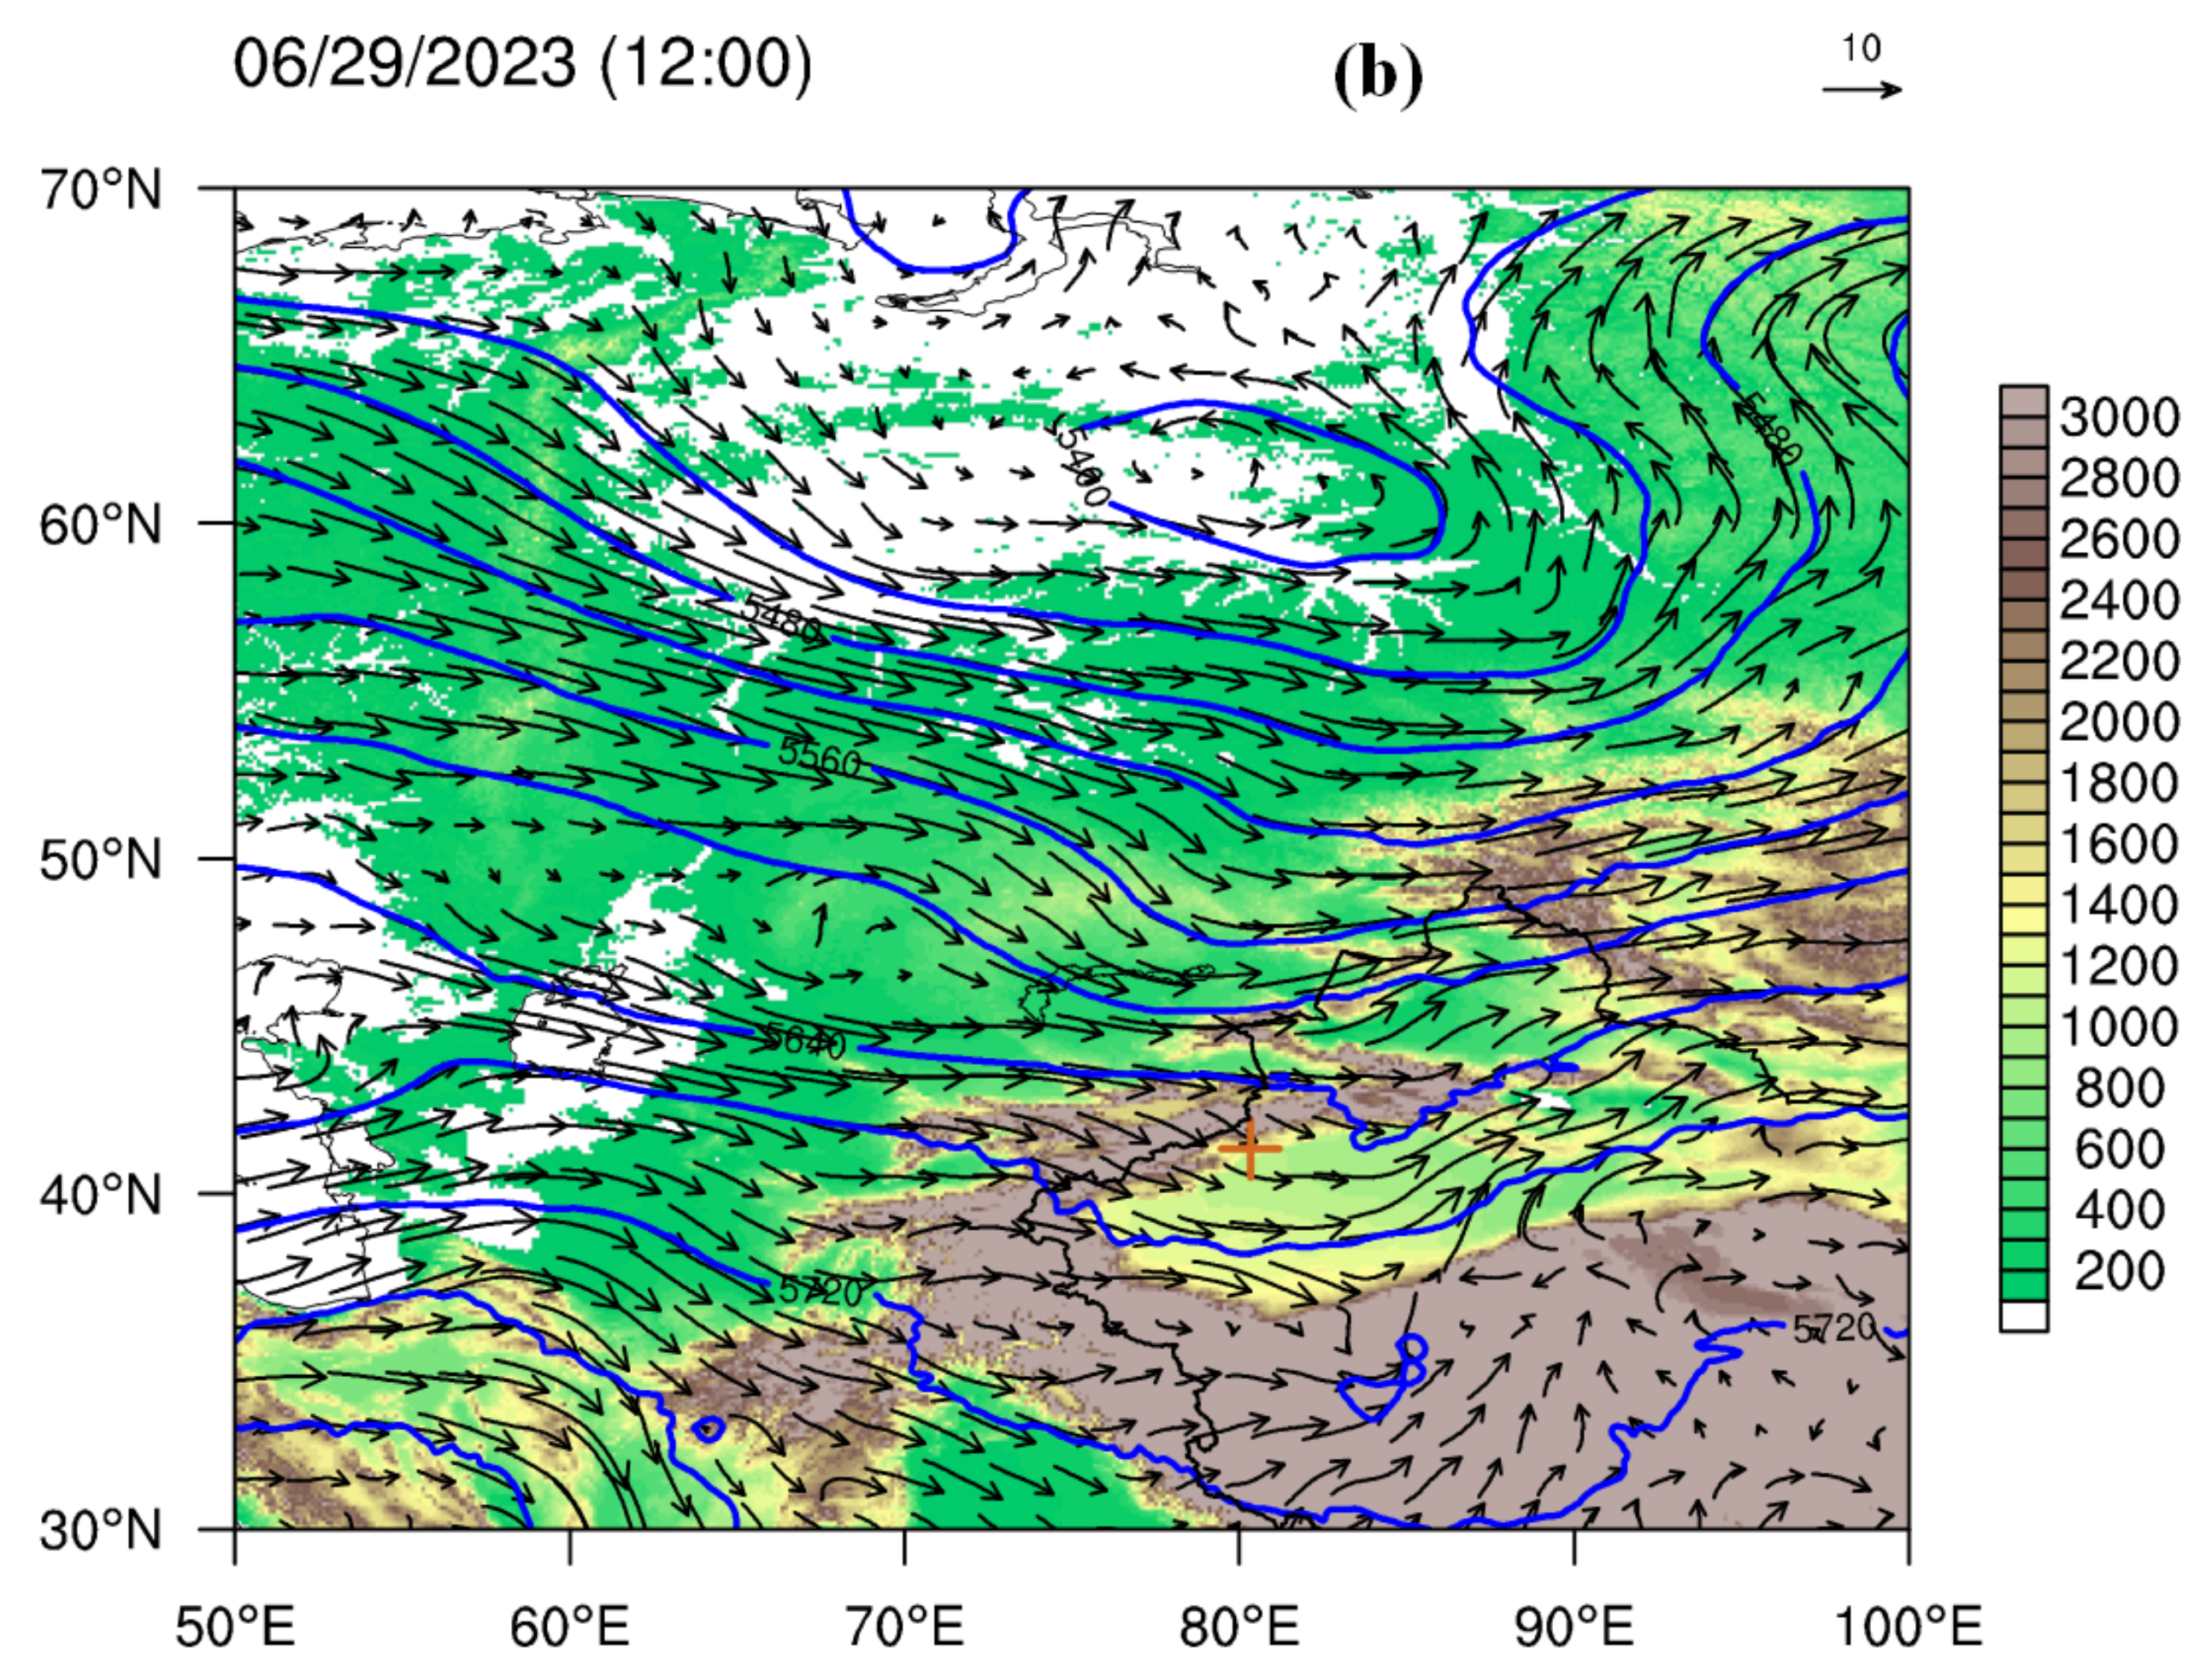
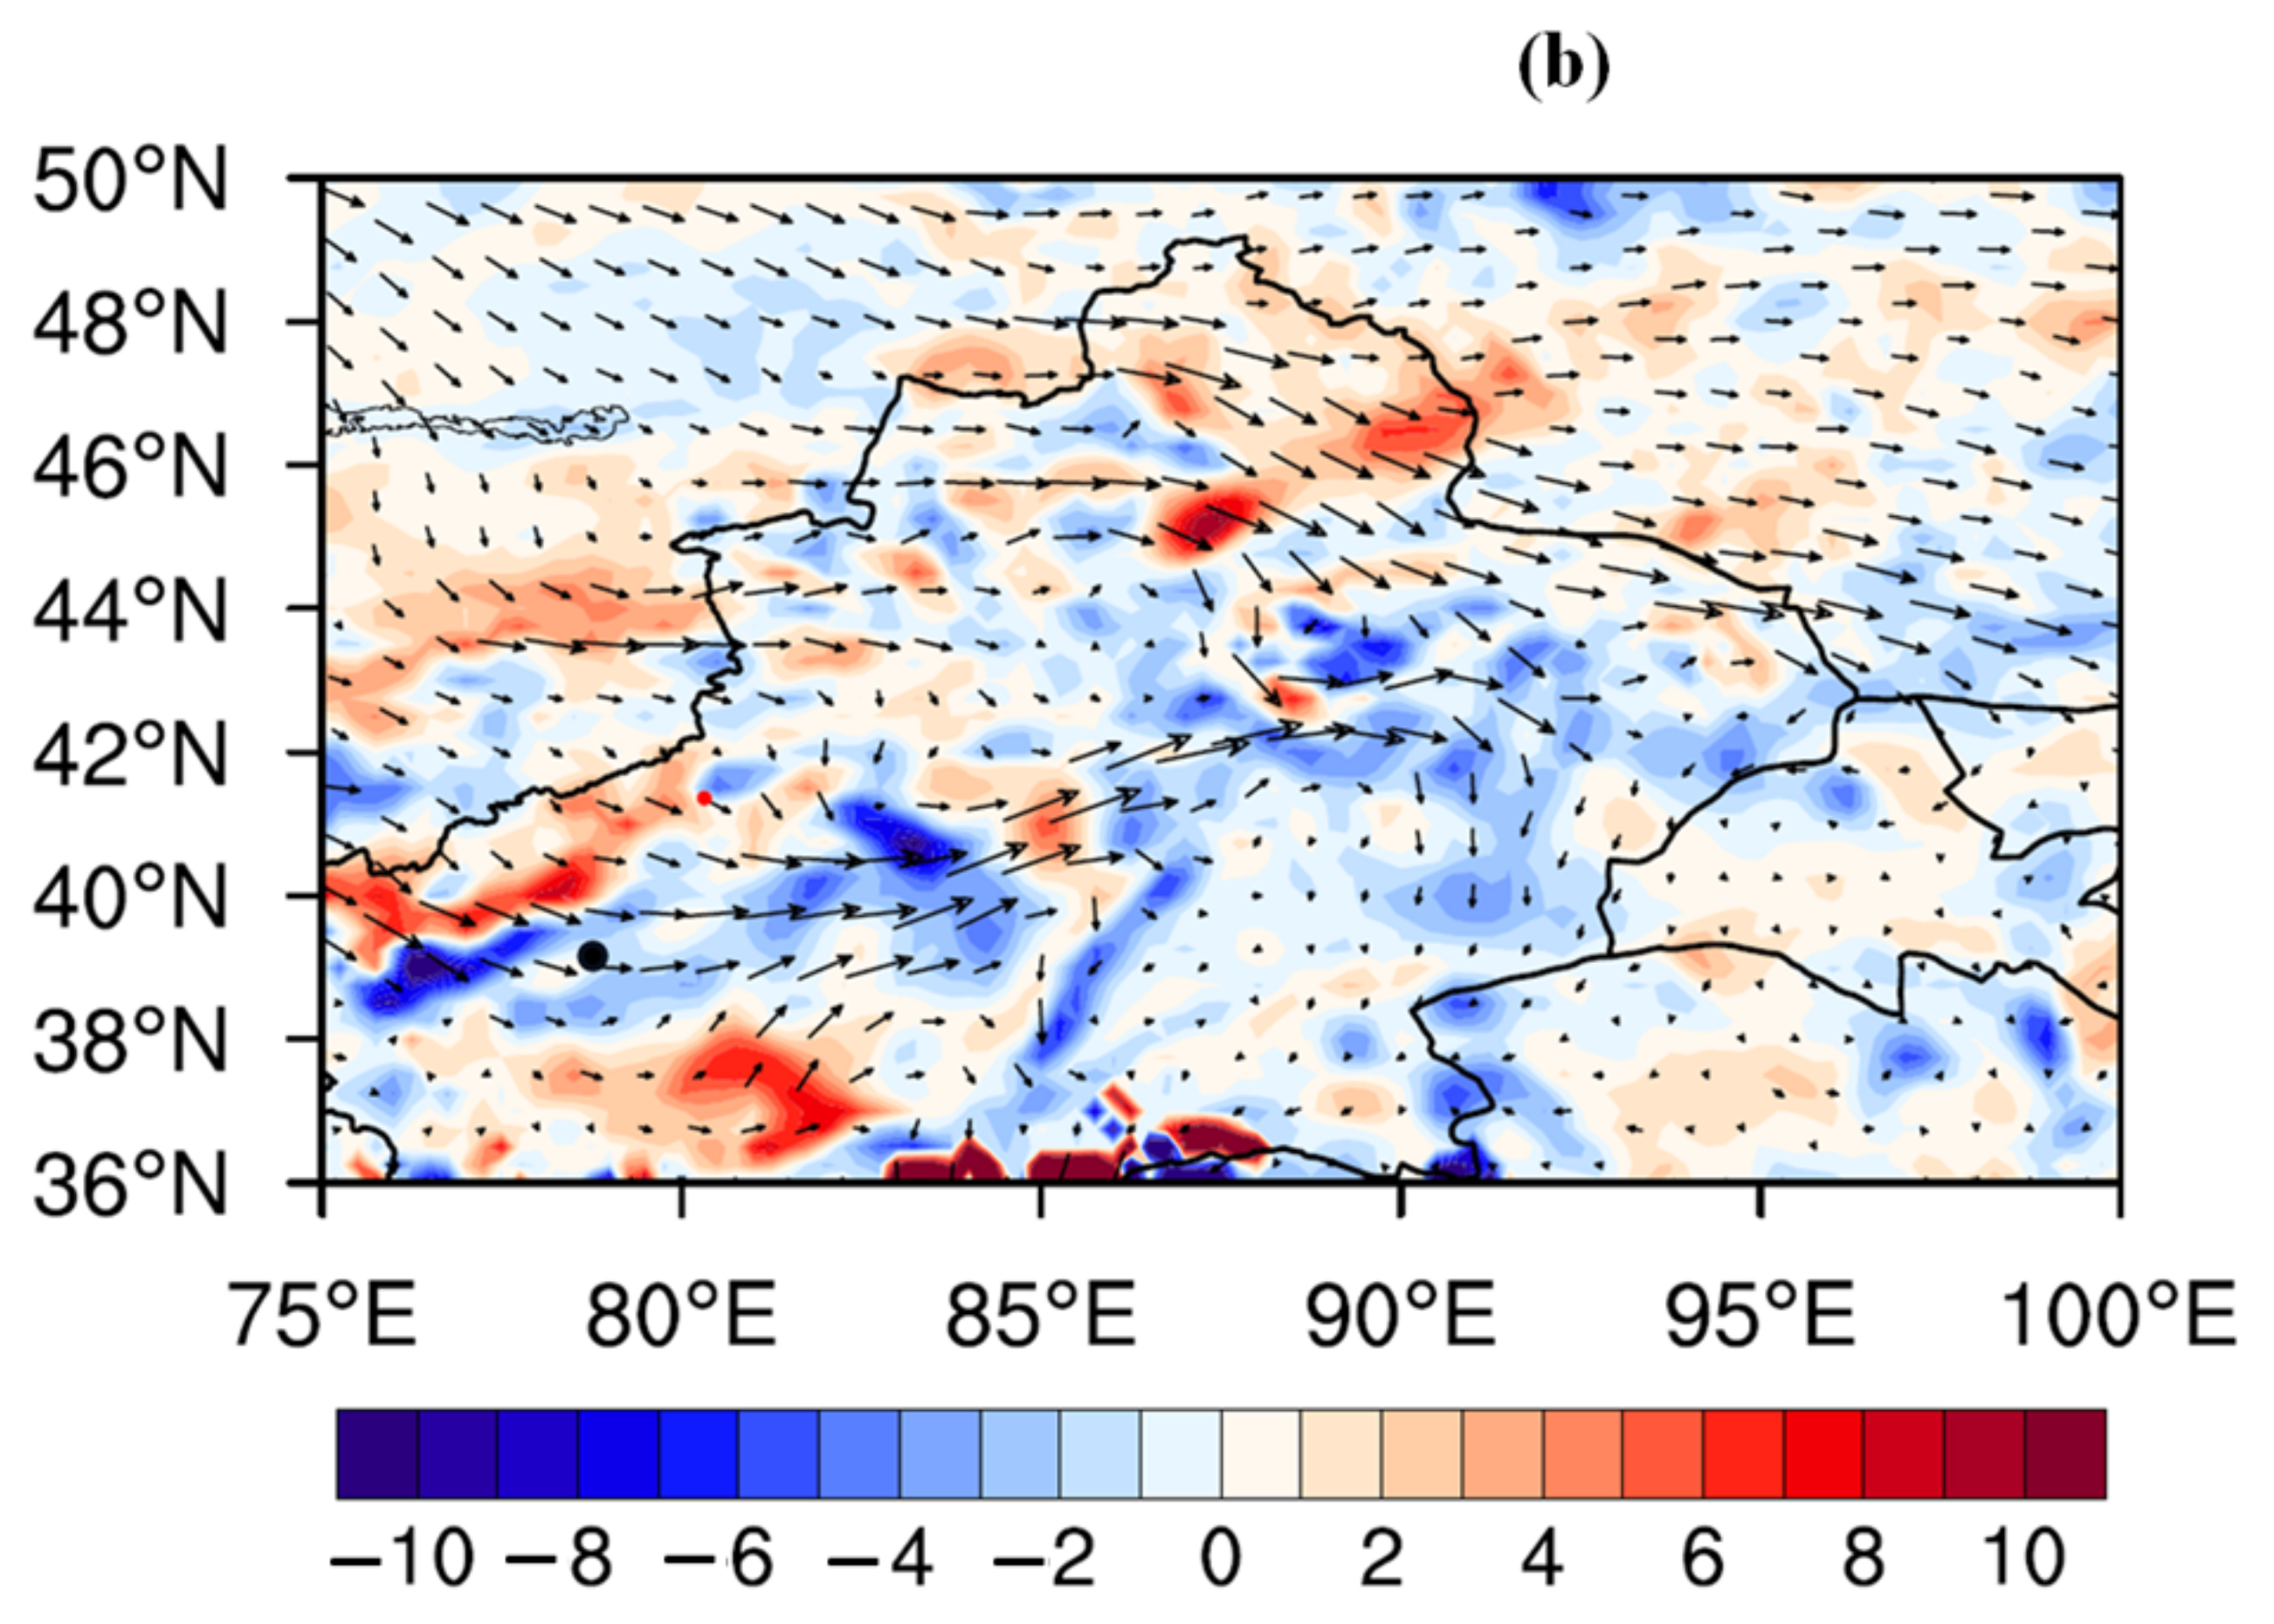
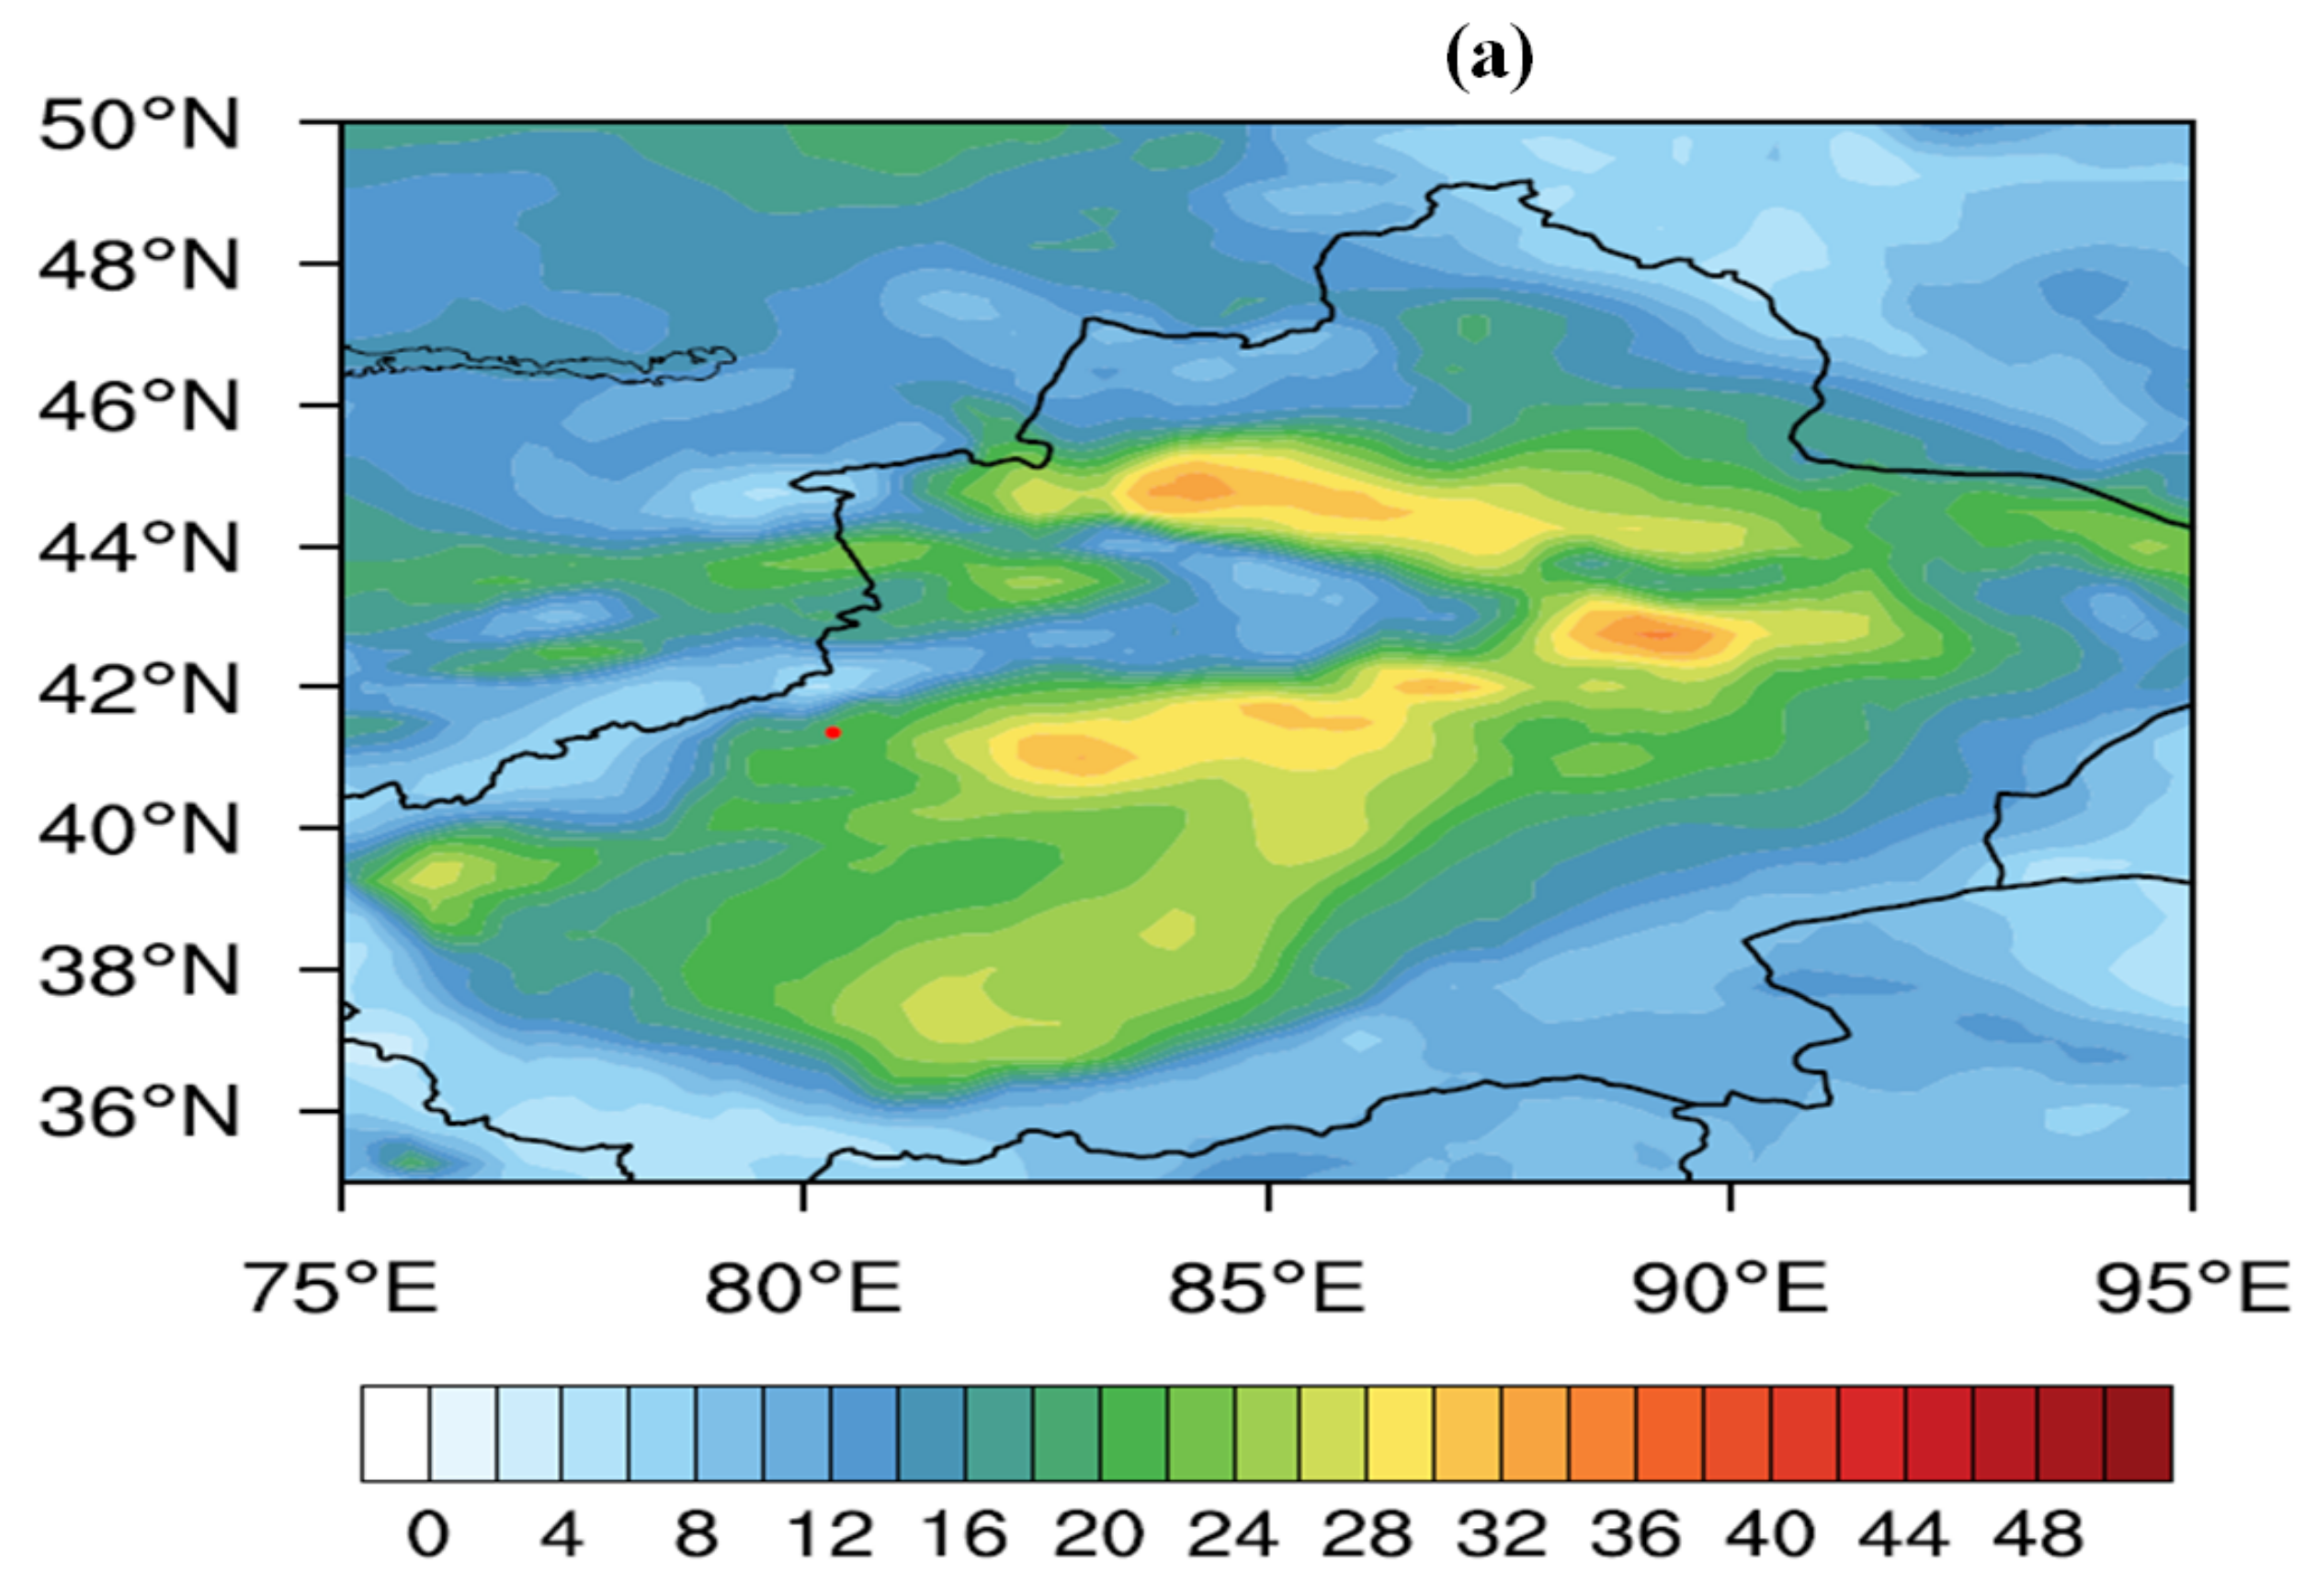
3.2. Synoptic Analysis of Hail Formation on 29 June 2023
4. Conclusions and Discussion
Author Contributions
Funding
Data Availability Statement
Conflicts of Interest
References
- Allen, J.T.; Giammanco, I.M.; Kumjian, M.R.; Punge, H.J.; Zhang, Q.; Groenemeijer, P.; Kunz, M.; Ortega, K. Understanding hail in the Earth system. Rev. Geophys. 2020, 58, e2019RG000665. [Google Scholar] [CrossRef]
- Michaud, A.B.; Dore, J.E.; Leslie, D.; Lyons, W.B.; Sands, D.C.; Priscu, J.C. Biological ice nucleation initiates hailstone formation. J. Geophys. Res.-Atmos. 2014, 119, 12186–12197. [Google Scholar] [CrossRef]
- Brown, T.M.; Pogorzelski, W.H.; Giammanco, I.M. Evaluating hail damage using property insurance claims data. Weather Clim. Extrem. 2015, 7, 197–210. [Google Scholar] [CrossRef]
- Kunkel, K.; Karl, T.; Brooks, H.; Kossin, J.; Lawrimore, J.; Arndt, D.; Bosart, L.; Changnon, D.; Cutter, S.L.; Doesken, N.; et al. Monitoring and understanding trends in extreme storms: State of knowledge. Bull. Am. Meteor. Soc. 2013, 94, 499–514. [Google Scholar] [CrossRef]
- Kim, M.H.; Lee, J.; Lee, S.J. Hail: Mechanisms, monitoring, forecasting, damages, financial compensation systems, and prevention. Atmosphere 2023, 14, 1642. [Google Scholar] [CrossRef]
- Shedd, L.; Kumjian, M.R.; Giammanco, I.; Brown-Giammanco, T.; Maiden, B.R. Hailstone shapes. J. Atmos. Sci. 2021, 78, 639–652. [Google Scholar] [CrossRef]
- Chhabra, R.P.; Agarwal, L.; Sinha, N.K. Drag on nonspherical particles: An evaluation of available methods. Powder Technol. 1999, 101, 288–295. [Google Scholar] [CrossRef]
- Punge, H.J.; Bedka, K.M.; Kunz, M.; Werner, A. A new physically based stochastic event catalog for hail in Europe. Nat. Hazards 2014, 73, 1625–1645. [Google Scholar] [CrossRef]
- Heymsfield, A.; Szakáll, M.; Jost, A.; Giammanco, I.; Wright, R. A comprehensive observational study of graupel and hail terminal velocity, mass flux, and kinetic energy. J. Atmos. Sci. 2018, 75, 3861–3885. [Google Scholar] [CrossRef]
- Pojorlie, K.L.; Doering, S.; Fowle, M.A. The record-breaking Vivian, South Dakota hailstorm of 23 July 2010. J. Oper. Meteor. 2013, 1, 3–18. [Google Scholar] [CrossRef]
- Witt, A.; Burgess, D.W.; Seimon, A.; Allen, J.T.; Snyder, J.C.; Bluestein, H.B. Rapid-scan radar observations of an Oklahoma tornadic hailstorm producing giant hail. Weather Forecast. 2018, 33, 1263–1282. [Google Scholar] [CrossRef]
- Kumjian, M.R.; Gutierrez, R.; Soderholm, J.S.; Nesbitt, S.W.; Maldonado, P.; Luna, L.M.; Marquis, J.; Bowley, K.A.; Imaz, M.A.; Salio, P. Gargantuan Hail in Argentina. Bull. Am. Meteor. Soc. 2020, 101, E1241–E1258. [Google Scholar] [CrossRef]
- Blair, S.F.; Laflin, J.M.; Cavanaugh, D.E.; Sanders, K.J.; Currens, S.R.; Pullin, J.I.; Cooper, D.T.; Deroche, D.R.; Leighton, J.W.; Fritchie, R.V.; et al. High-resolution hail observations: Implications for NWS warning operations. Weather Forecast. 2017, 32, 1101–1119. [Google Scholar] [CrossRef]
- Ni, X.; Zhang, Q.; Liu, C.; Li, X.; Zou, T.; Lin, J.; Kong, H.; Ren, Z. Decreased hail size in China since 1980. Sci. Rep. 2017, 7, 10913. [Google Scholar] [CrossRef] [PubMed]
- Li, X.; Zhang, Q.; Zou, T.; Lin, J.; Kong, H.; Ren, Z. Climatology of hail frequency and size in China, 1980–2015. J. Appl. Meteor. Climatol. 2018, 57, 875–887. [Google Scholar] [CrossRef]
- Giaiotti, D.; Gianesini, E.; Stel, F. Heuristic considerations pertaining to hailstone size distributions in the plain of Friuli-Venezia Giulia. Atmos. Res. 2001, 57, 269–288. [Google Scholar] [CrossRef]
- Dessens, J.; Berthet, J.L.; Sanchez, J.L. A point hailfall classification based on hailpad measurements: The ANELFA scale. Atmos. Res. 2007, 83, 132–139. [Google Scholar] [CrossRef]
- Sioutas, M.; Meaden, T.; Webb, J. Hail frequency, distribution and intensity in Northern Greece. Atmos. Res. 2009, 93, 526–533. [Google Scholar] [CrossRef]
- Hohl, R.; Schiesser, H.H.; Aller, D. Hailfall: The relationship between radar-derived hail kinetic energy and hail damage to buildings. Atmos. Res. 2002, 63, 177–207. [Google Scholar] [CrossRef]
- Kumjian, M.R.; Richardson, Y.P.; Meyer, T.; Kosiba, K.A.; Wurman, J. Resonance scattering effects in wet hail observed with a dual-X-band-frequency, dual-polarization Doppler on Wheels on radar. J. Appl. Meteor. Climatol. 2018, 57, 2713–2731. [Google Scholar] [CrossRef]
- Punge, H.J.; Bedka, K.M.; Kunz, M.; Reinbold, A. Hail frequency estimation across Europe based on a combination of overshooting top detections and the ERA-INTERIM reanalysis. Atmos. Res. 2017, 198, 34–43. [Google Scholar] [CrossRef]
- Mroz, K.; Battaglia, A.; Lang, T.J.; Cecil, D.J.; Tanelli, S.; Tridon, F. Hail-detection algorithm for the GPM core observatory satellite sensors. J. Appl. Meteor. Climatol. 2017, 56, 1939–1957. [Google Scholar] [CrossRef]
- Bedka, K.; Allen, J.; Punge, H.; Kunz, M. A long-term overshooting convective cloud top detection database over Australia derived from MTSAT Japanese advanced meteorological imager observations. J. Appl. Meteor. Climatol. 2018, 57, 937–951. [Google Scholar] [CrossRef]
- Sand, W.R. Observations in hailstorms using the T-28 aircraft system. J. Appl. Meteor. 1976, 15, 641–650. [Google Scholar] [CrossRef]
- Field, P.R.; Heymsfield, A.J.; Detwiler, A.G.; Wilkinson, J.M. Normalized hail particle size distributions from the T-28 storm-penetrating aircraft. J. Appl. Meteor. Climatol. 2019, 58, 231–245. [Google Scholar] [CrossRef]
- Löffler-Mang, M.; Schön, D.; Landry, M. Characteristics of a new automatic hail recorder. Atmos. Res. 2011, 100, 439–446. [Google Scholar] [CrossRef]
- Long, A.B.; Matson, R.J.; Crow, E.L. The Hailpad: Materials, Data Reduction and Calibration. J. Appl. Meteorol. 1979, 19, 1300–1313. [Google Scholar] [CrossRef]
- Cifelli, R.; Doesken, N.; Kennedy, P.; Carey, L.D.; Rutledge, S.A.; Gimmestad, C.; Depue, T. The Community Collaborative rain, hail, and snow network. Bull. Am. Meteorol. Soc. 2005, 86, 1069–1077. [Google Scholar] [CrossRef]
- Kalina, E.A.; Friedrich, K.; Ellis, S.M.; Burgess, D.W. Comparison of Disdrometer and X-Band Mobile Radar Observations in Convective Precipitation. Mon. Weather Rev. 2014, 142, 2414–2435. [Google Scholar] [CrossRef]
- Soderholm, J.S.; Kumjian, M.R.; McCarthy, N.; Maldonado, P.; Wang, M. Quantifying hail size distributions from the sky—Application of drone aerial photogrammetry. Atmos. Meas. Tech. 2020, 13, 747–754. [Google Scholar] [CrossRef]
- Dennis, E.J.; Kumjian, M.R. The impact of vertical wind shear on hail growth in simulated supercells. J. Atmos. Sci. 2017, 74, 641–663. [Google Scholar] [CrossRef]
- Kumjian, M.R.; Lombardo, K. A hail growth trajectory model for exploring the environmental controls on hail size: Model physics and idealized tests. J. Atmos. Sci. 2020, 77, 2765–2791. [Google Scholar] [CrossRef]
- Ryzhkov, A.V.; Kumjian, M.R.; Ganson, S.M.; Khain, A.P. Polarimetric radar characteristics of melting hail. Part I: Theoretical simulations using spectral microphysical modeling. J. Appl. Meteor. Climatol. 2013, 52, 2849–2870. [Google Scholar] [CrossRef]
- Ortega, K.L.; Krause, J.M.; Ryzhkov, A.V. Polarimetric radar characteristics of melting hail. Part III: Validation of the algorithm for hail size discrimination. J. Appl. Meteor. Climatol. 2016, 55, 829–848. [Google Scholar] [CrossRef]
- Giammanco, I.M.; Maiden, B.R.; Estes, H.E.; Brown-Giammanco, T.M. Using 3D laser scanning technology to create digital models of hailstones. Bull. Am. Meteor. Soc. 2017, 98, 1341–1347. [Google Scholar] [CrossRef]
- Michaelides, S.; Levizzani, V.; Anagnostou, E.; Bauer, P.; Kasparis, T.; Lane, J.E. Precipitation: Measurement, remote sensing, climatology and modeling. Atmos. Res. 2009, 94, 512–533. [Google Scholar] [CrossRef]
- Ceperuelo, M.; Llasat, M.C.; López, L.; García-Ortega, E.; Sánchez, J.L. Study of 11 September 2004 hailstorm event using radar identification of 2-D systems and 3-D cells. Adv. Geosci. 2006, 7, 215–222. [Google Scholar] [CrossRef]
- Li, Y.; Zhi, J.; Zhang, C. Cause analysis of a strong hail weather in Kashi area in June 2013. Desert Oasis Meteorol. 2014, 8, 19–26, (In Chinese with English Abstract). [Google Scholar]
- Seeley, J.; Romps, D. The effect of global warming on severe thunderstorms in the United States. J. Clim. 2015, 28, 2443–2458. [Google Scholar] [CrossRef]
- Changnon, S.A. Increasing major hail losses in the U.S. Clim. Chang. 2009, 96, 161–166. [Google Scholar] [CrossRef]
- Brooks, H.E.; Lee, J.W.; Craven, J.P. The spatial distribution of severe thunderstorm and tornado environments from global reanalysis data. Atmos. Res. 2003, 67–68, 73–94. [Google Scholar] [CrossRef]
- Punge, H.J.; Kunz, M. Hail observations and hailstorm characteristics in Europe: A review. Atmos. Res. 2016, 176–177, 159–184. [Google Scholar] [CrossRef]
- Changnon, S.A. The scales of hail. J. Appl. Meteorol. 1977, 16, 626–648. [Google Scholar] [CrossRef]
- Prein, A.F.; Holland, G.J. Global estimates of damaging hail hazard. Weather Clim. Extrem. 2018, 22, 10–23. [Google Scholar] [CrossRef]
- Yan, J.; Ma, L.; Cai, R. The overview of study on hailstorm in Xinjiang. Desert Oasis Meteorol. 2023, 17, 10–17, (In Chinese with English Abstract). [Google Scholar]
- Zhao, J.; Yue, Y.; Wang, J.; Yin, Y.; Feng, H. Study on spatio-temporal pattern of hail disaster in China mainland from 1950 to 2009. Chin. J. Agrometeorol. 2015, 36, 83–92, (In Chinese with English Abstract). [Google Scholar]
- Zhu, S.; Luo, J.; Qu, L. The spatial-temporal distribution and radar echo signatures of hail in Aksu, Xinjiang. Desert Oasis Meteorol. 2021, 15, 81–88, (In Chinese with English Abstract). [Google Scholar]
- Schleusener, R.A.; Jennings, P.C. An energy method for relative estimates of hail intensity. Bull. Am. Meteorol. Soc. 1960, 41, 372–376. [Google Scholar] [CrossRef]
- Browning, K.A.; Ludlam, F.H.; Macklin, W.C. The density and structure of hailstones. Q. J. R. Met. Soc. 1963, 89, 75–84. [Google Scholar] [CrossRef]
- Johansson, C.; Bergström, H. An auxiliary tool to determine the height of the boundary layer. Bound. Layer Meteor. 2005, 115, 423–432. [Google Scholar] [CrossRef]
- Zhang, J.; Chen, H.; Zhu, Y.; Shi, H.; Zheng, Y.; Xia, X.; Teng, Y.; Wang, F.; Han, X.; Li, J.; et al. A novel method for estimating the vertical velocity of air with a descending radiosonde system. Remote Sens. 2019, 11, 1538. [Google Scholar] [CrossRef]
- Dieling, C.; Smith, M.; Beruvides, M. Review of impact factors of the velocity of large hailstones for laboratory hail impact testing consideration. Geosciences 2020, 10, 500. [Google Scholar] [CrossRef]
- Dennis, A.S. Weather Modification by Cloud Seeding; Academic Press: New York, NY, USA, 1980. [Google Scholar]
- Gokhale, N.R. Hailstorms and Hailstone Growth, 1st ed.; State University of New York Press: Albany, NY, USA, 1975. [Google Scholar]
- Wang, J.; Bian, J.; Brown, W.O.; Cole, H.; Grubišić, V.; Young, K. Vertical air motion from T-REX radiosonde and dropsonde data. J. Atmos. Ocean. Technol. 2009, 26, 928–942. [Google Scholar] [CrossRef]
- E44 Committee. Test Method for Determining Resistance of Photovoltaic Modules to Hail by Impact with Propelled Ice Balls 2019; ASTM International: West Conshohocken, PA, USA, 2019. [Google Scholar]
- World Meteorological Organization (WMO). Technical Regulations: Volume II—Meteorological Service for International Air Navigation, 2018th ed.; World Meteorological Organization: Geneva, Switzerland, 2018. [Google Scholar]
- Yang, J.; Zhang, Z.; Wei, C.; Lu, F.; Guo, Q. Introducing the new generation of Chinese geostationary weather satellites, FengYun-4. Bull. Am. Meteor. Soc. 2017, 98, 1637–1658. [Google Scholar] [CrossRef]
- Hersbach, H.; Bell, B.; Berrisford, P.; Hirahara, S.; Horányi, A.; Muñoz-Sabater, J.; Nicolas, J.; Peubey, C.; Radu, R.; Schepers, D.; et al. The ERA5 global reanalysis. Q. J. R. Meteorol. Soc. 2020, 146, 1999–2049. [Google Scholar] [CrossRef]
- Zhang, C.; Zhang, Q.; Wang, Y. Climatology of hail in China: 1961–2005. J. Appl. Meteor. Climatol. 2008, 47, 795–804. [Google Scholar] [CrossRef]


| Measurement Elements | Hail Number, Hail Size Distribution, Equivalent Liquid Precipitation, Hail Image, Wind Speed, and Wind Direction | |
|---|---|---|
| Key parameters | Hail size classification | 5–75 mm, 14 bins at a 5 mm interval; >75 mm, the 15th bin |
| Sampling frequency | 25 Hz | |
| Sampling area | 314 cm2 | |
| Maximum precipitation | 1200 mm/h | |
| Precipitation accuracy | ±10% (<120 mm/h), ±20% (≥120 mm/h) | |
| Hail image | Triggered by the hail impact | |
| Image resolution | 1920 × 1080 pixels, adjustable | |
| Wind speed range | 0–50 m/s | |
| Wind speed accuracy (@ 12 m/s) | <1.5%·RMS | |
| Wind direction range | 0–359.9° | |
| Wind direction accuracy (@ 12 m/s) | 0.5° | |
| Signal path number | 14 (Analog 6, digital 6, and pulse 2) | |
| Output data interval | 1 min; adjustable | |
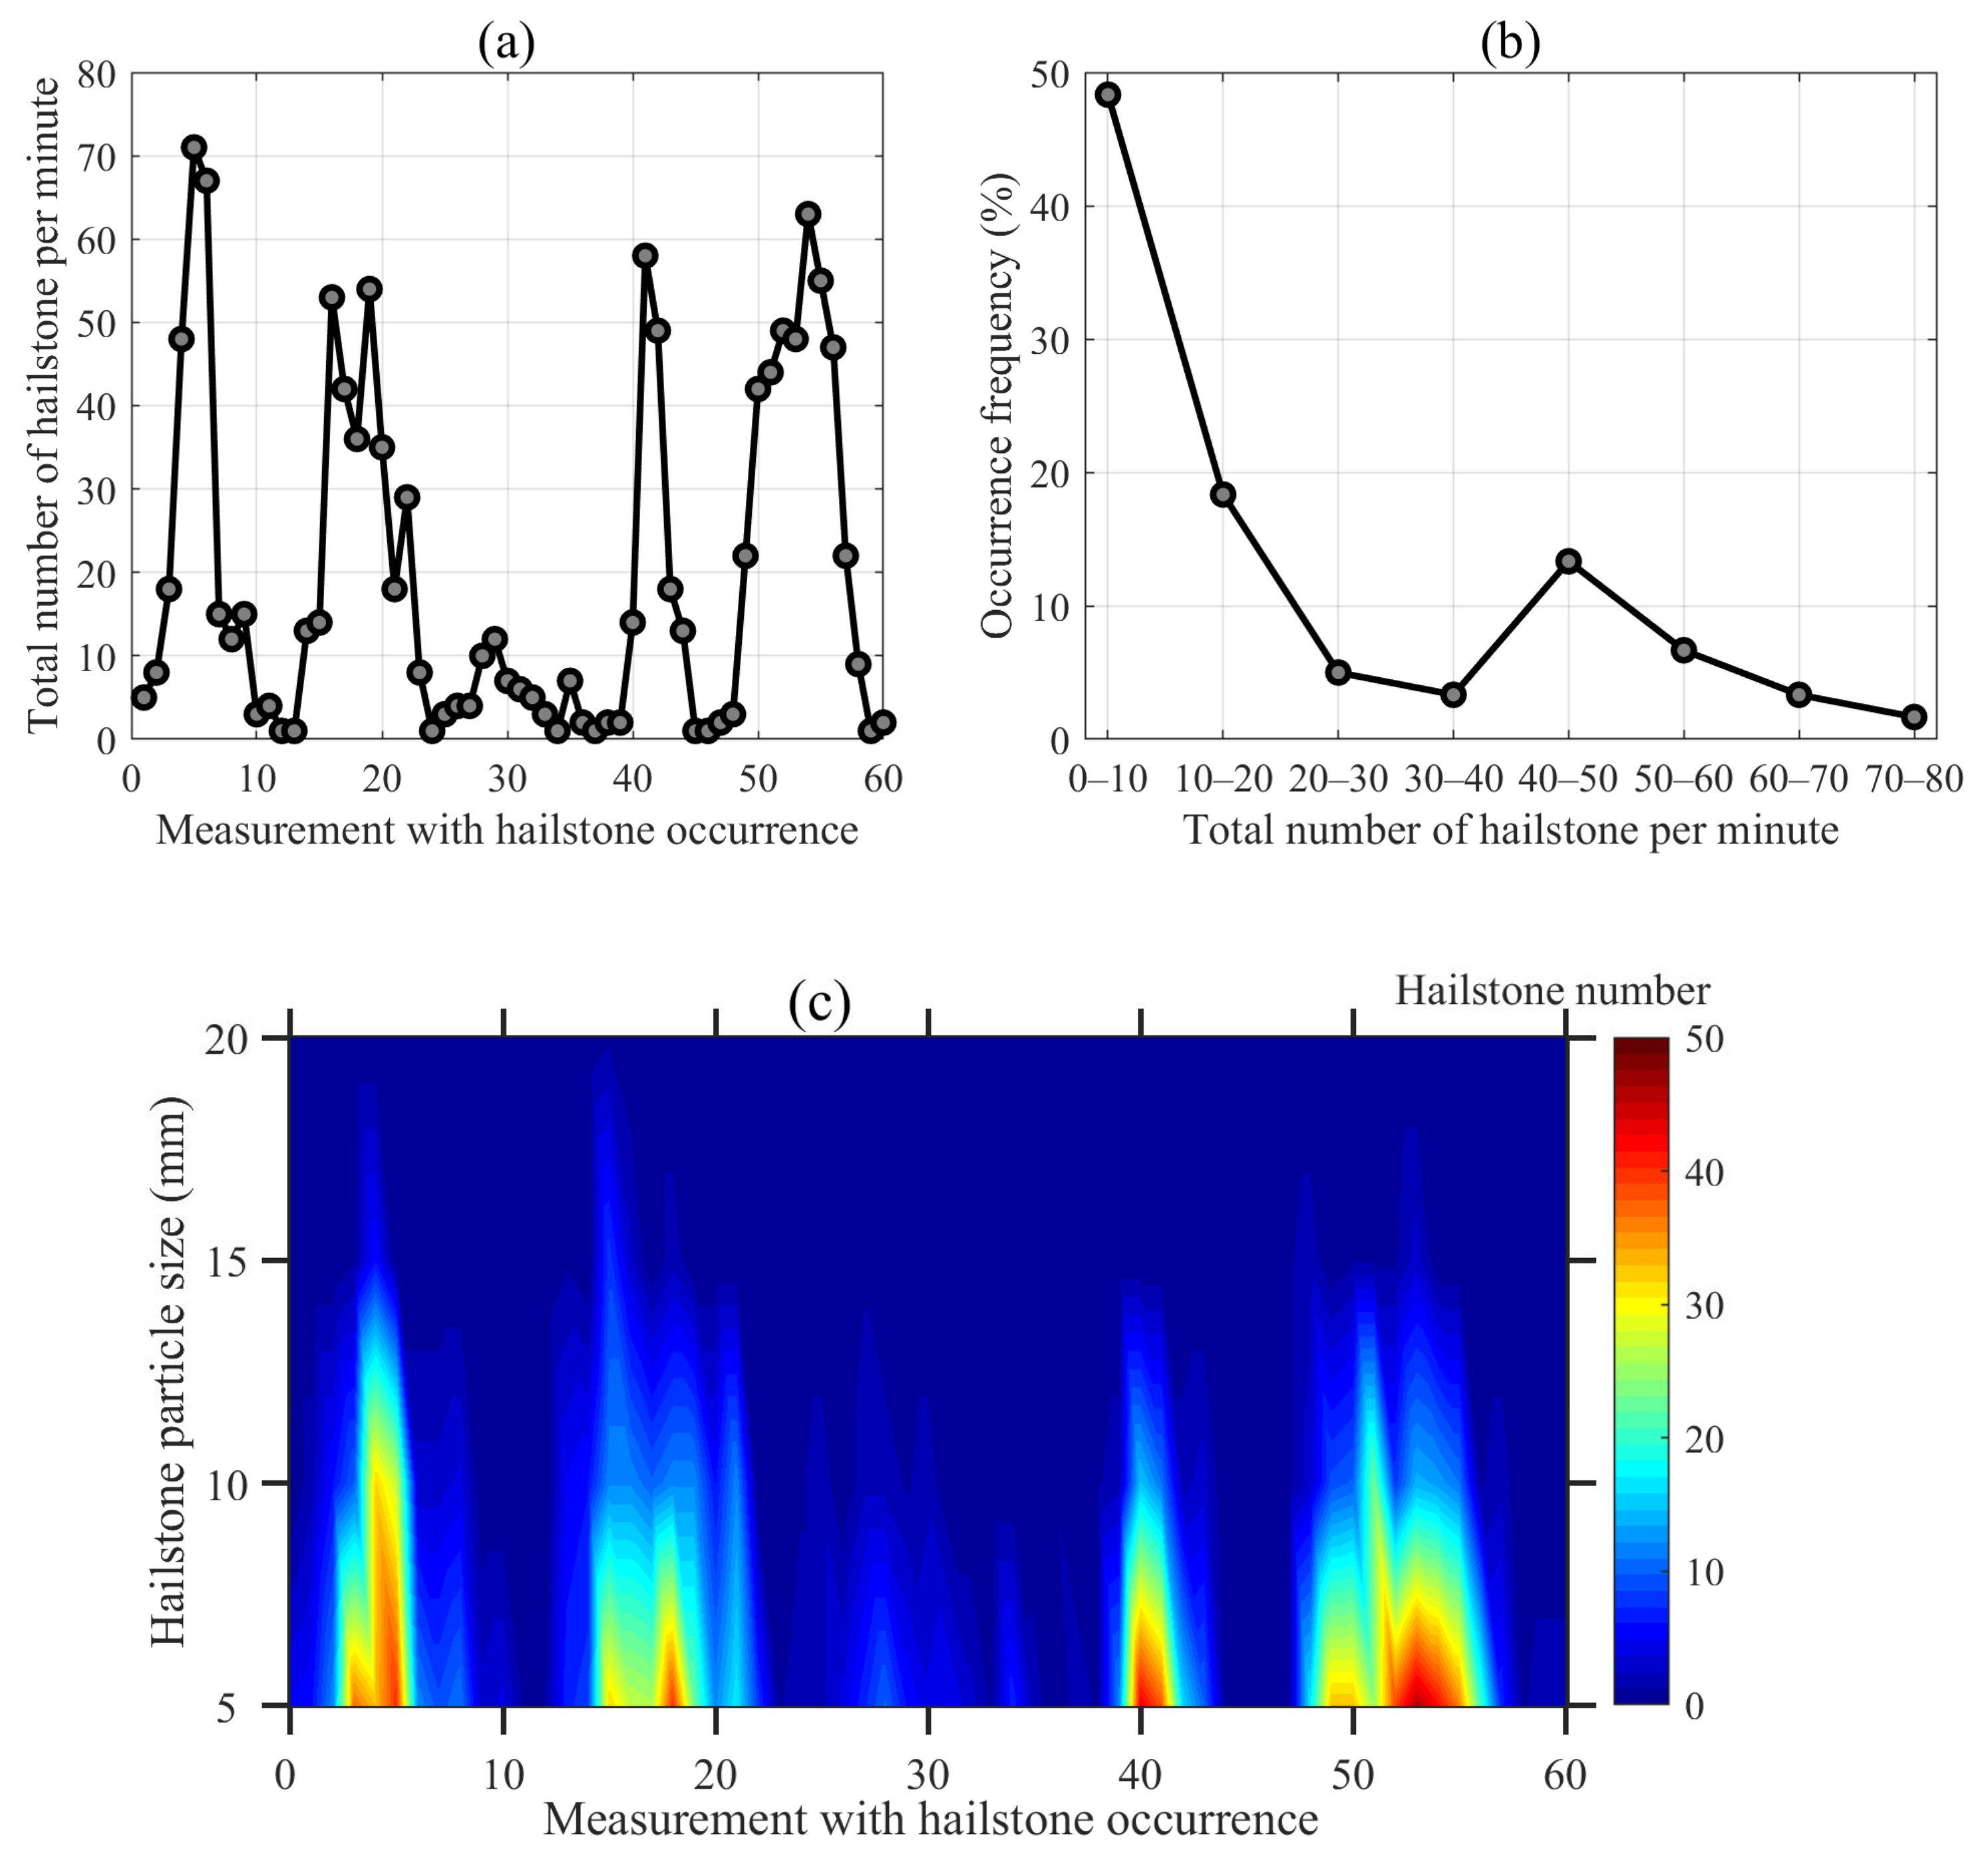
| Maximum hail number | ~70 per minute |
| Average hail number | 20.1 ± 21.0 per minute |
| Hail number < 10 per minute | An occurrence frequency of 48% |
| Hail number at 40–50 per minute | An occurrence frequency of 13% |
| Hail particle size | Primarily between 5 and 10 mm |
Disclaimer/Publisher’s Note: The statements, opinions and data contained in all publications are solely those of the individual author(s) and contributor(s) and not of MDPI and/or the editor(s). MDPI and/or the editor(s) disclaim responsibility for any injury to people or property resulting from any ideas, methods, instructions or products referred to in the content. |
© 2024 by the authors. Licensee MDPI, Basel, Switzerland. This article is an open access article distributed under the terms and conditions of the Creative Commons Attribution (CC BY) license (https://creativecommons.org/licenses/by/4.0/).
Share and Cite
Li, Y.; Mou, X.; Kang, J.; Zhu, S.; Fan, Y.; Fan, H.; Wei, X.; Chen, D.; Ren, S.; Jia, S.; et al. The Development of a Hailstone Disdrometer and Its Preliminary Observation in Aksu, Xinjiang. Atmosphere 2024, 15, 823. https://doi.org/10.3390/atmos15070823
Li Y, Mou X, Kang J, Zhu S, Fan Y, Fan H, Wei X, Chen D, Ren S, Jia S, et al. The Development of a Hailstone Disdrometer and Its Preliminary Observation in Aksu, Xinjiang. Atmosphere. 2024; 15(7):823. https://doi.org/10.3390/atmos15070823
Chicago/Turabian StyleLi, Yuanyuan, Xiaoxuan Mou, Juan Kang, Sihua Zhu, Yujiang Fan, Hongyun Fan, Xuhui Wei, Dan Chen, Shiqi Ren, Shengjie Jia, and et al. 2024. "The Development of a Hailstone Disdrometer and Its Preliminary Observation in Aksu, Xinjiang" Atmosphere 15, no. 7: 823. https://doi.org/10.3390/atmos15070823