

High-Resolution Characterization of Aerosol Optical Depth and Its Correlation with Meteorological Factors in Afghanistan
 ,
,  ,
,  , , and
Abstract
:
1. Introduction
2. Data and Methods
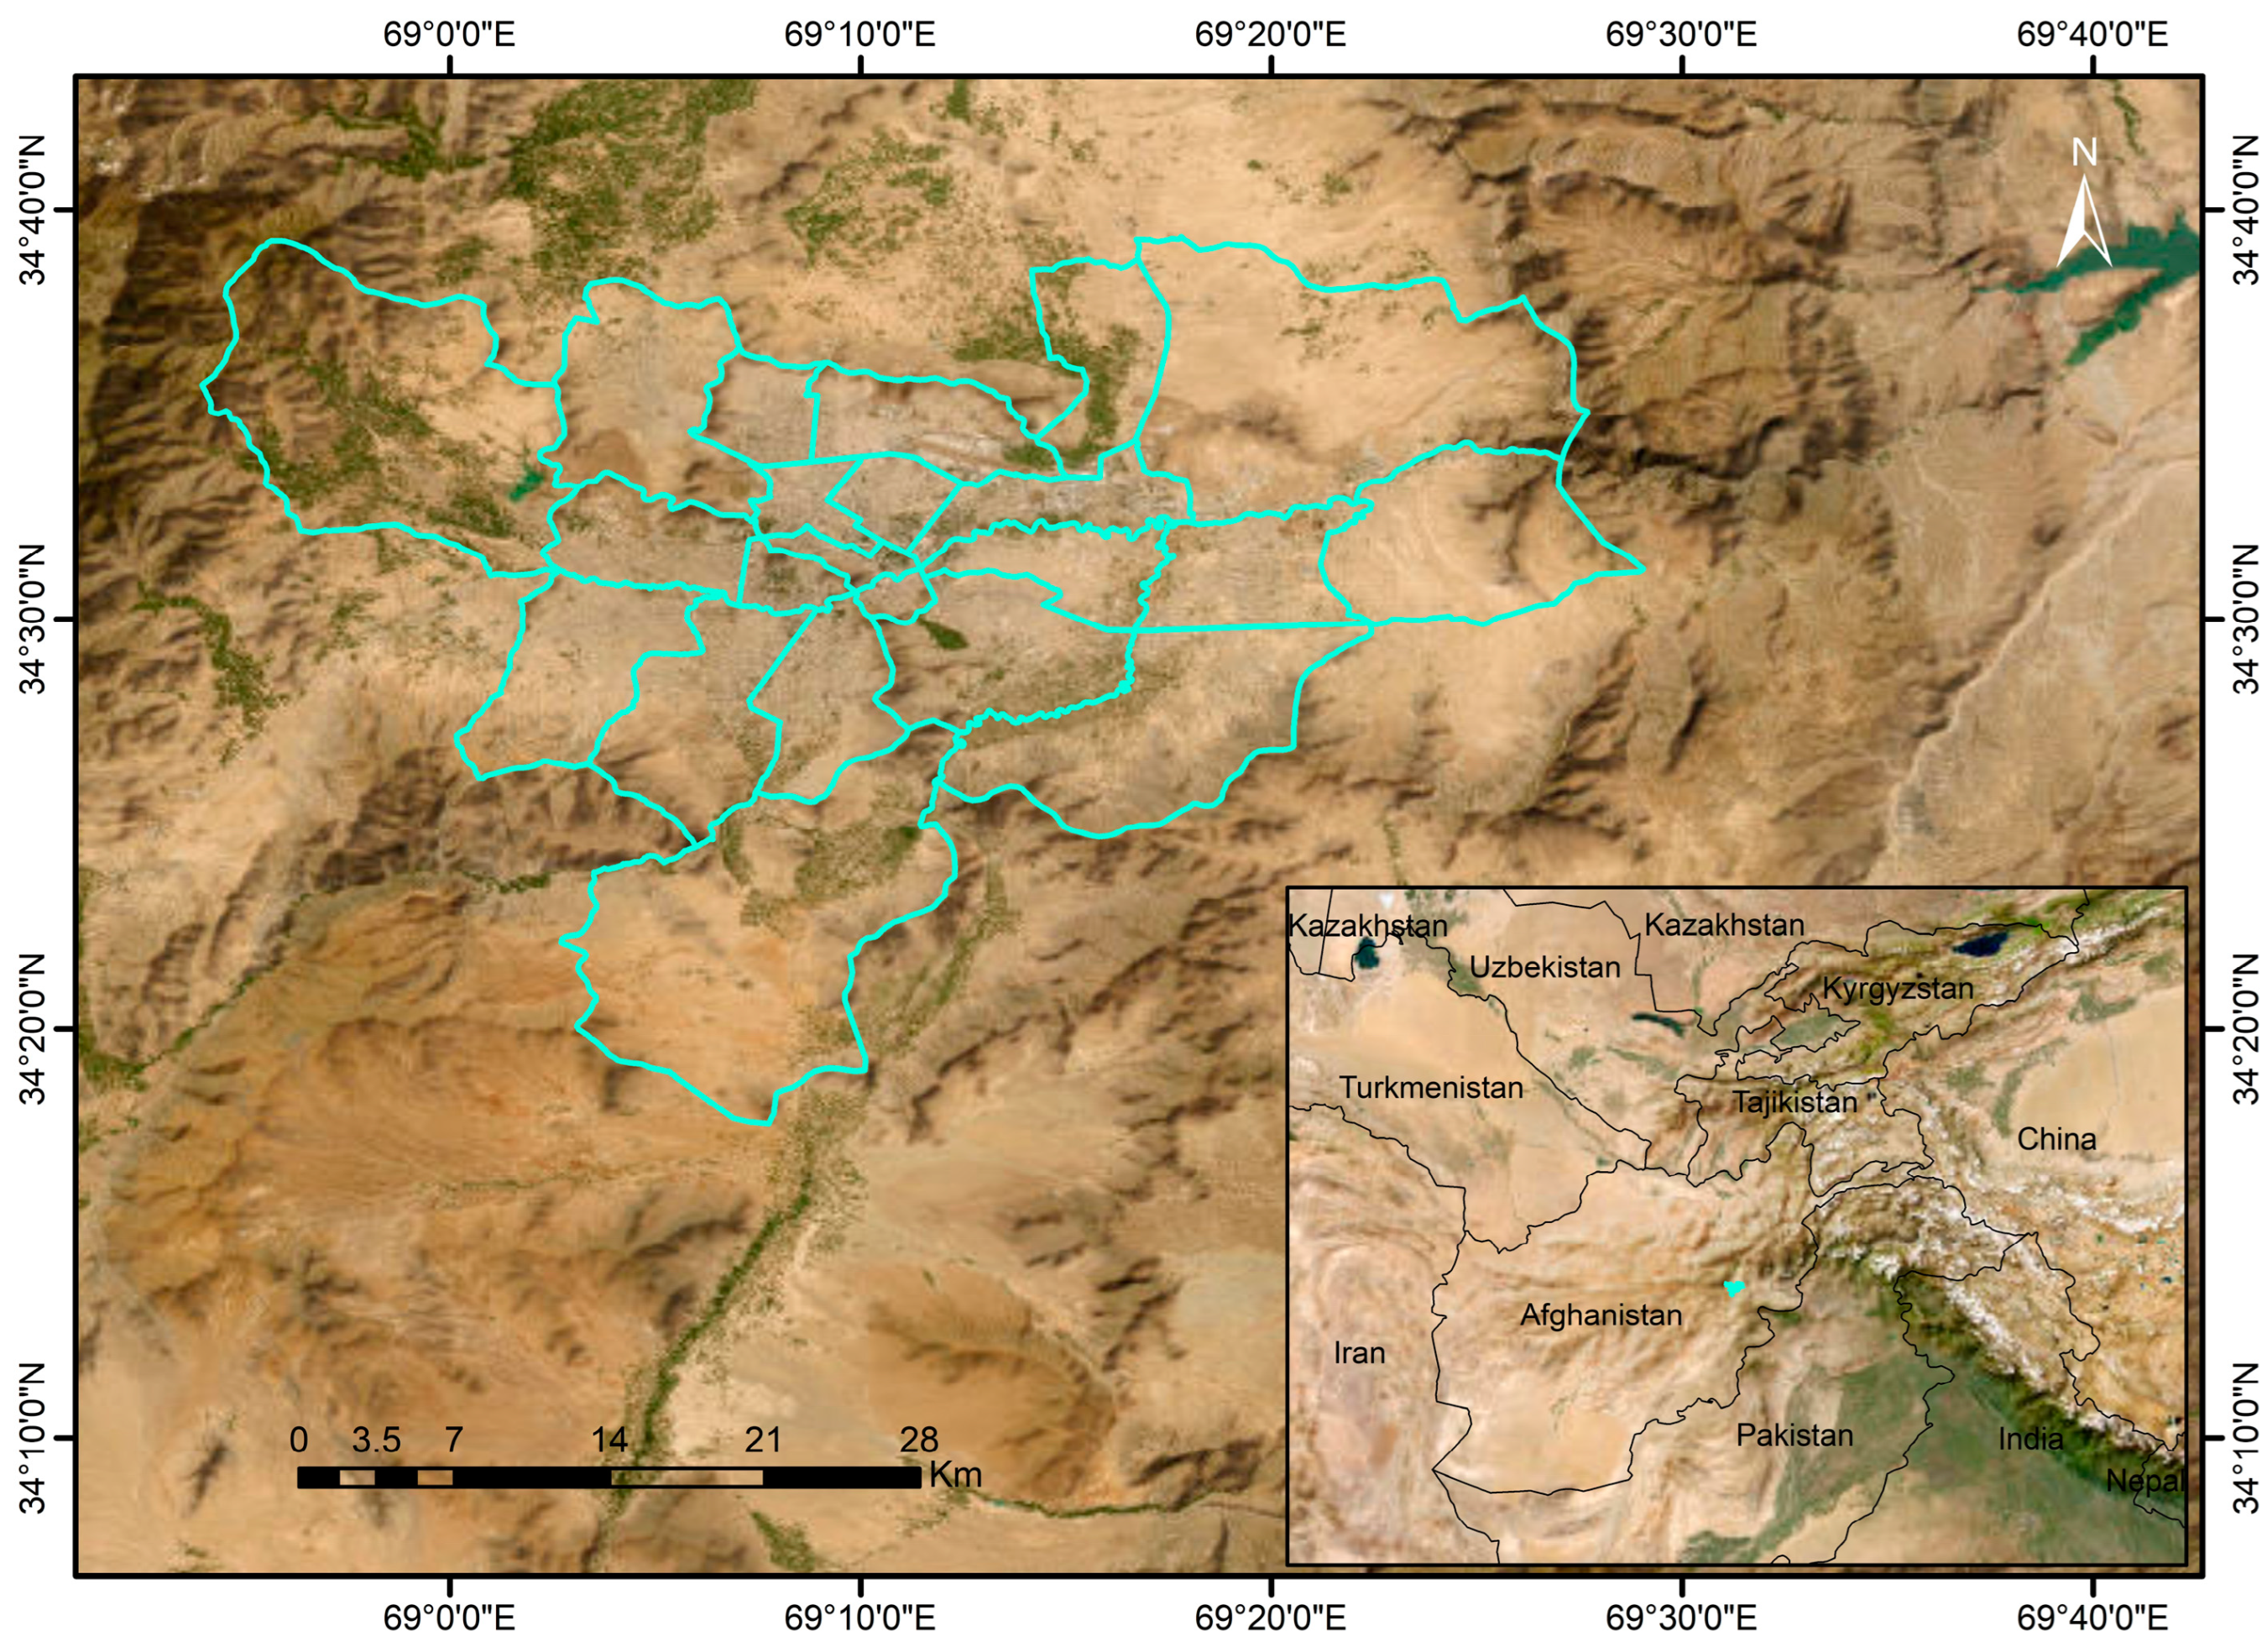
2.1. Study Site
2.2. Satellite Datasets
2.2.1. MODIS Products
2.2.2. MERRA-2
2.3. Data Preprocessing
2.4. Statistical Analysis
3. Results and Discussion
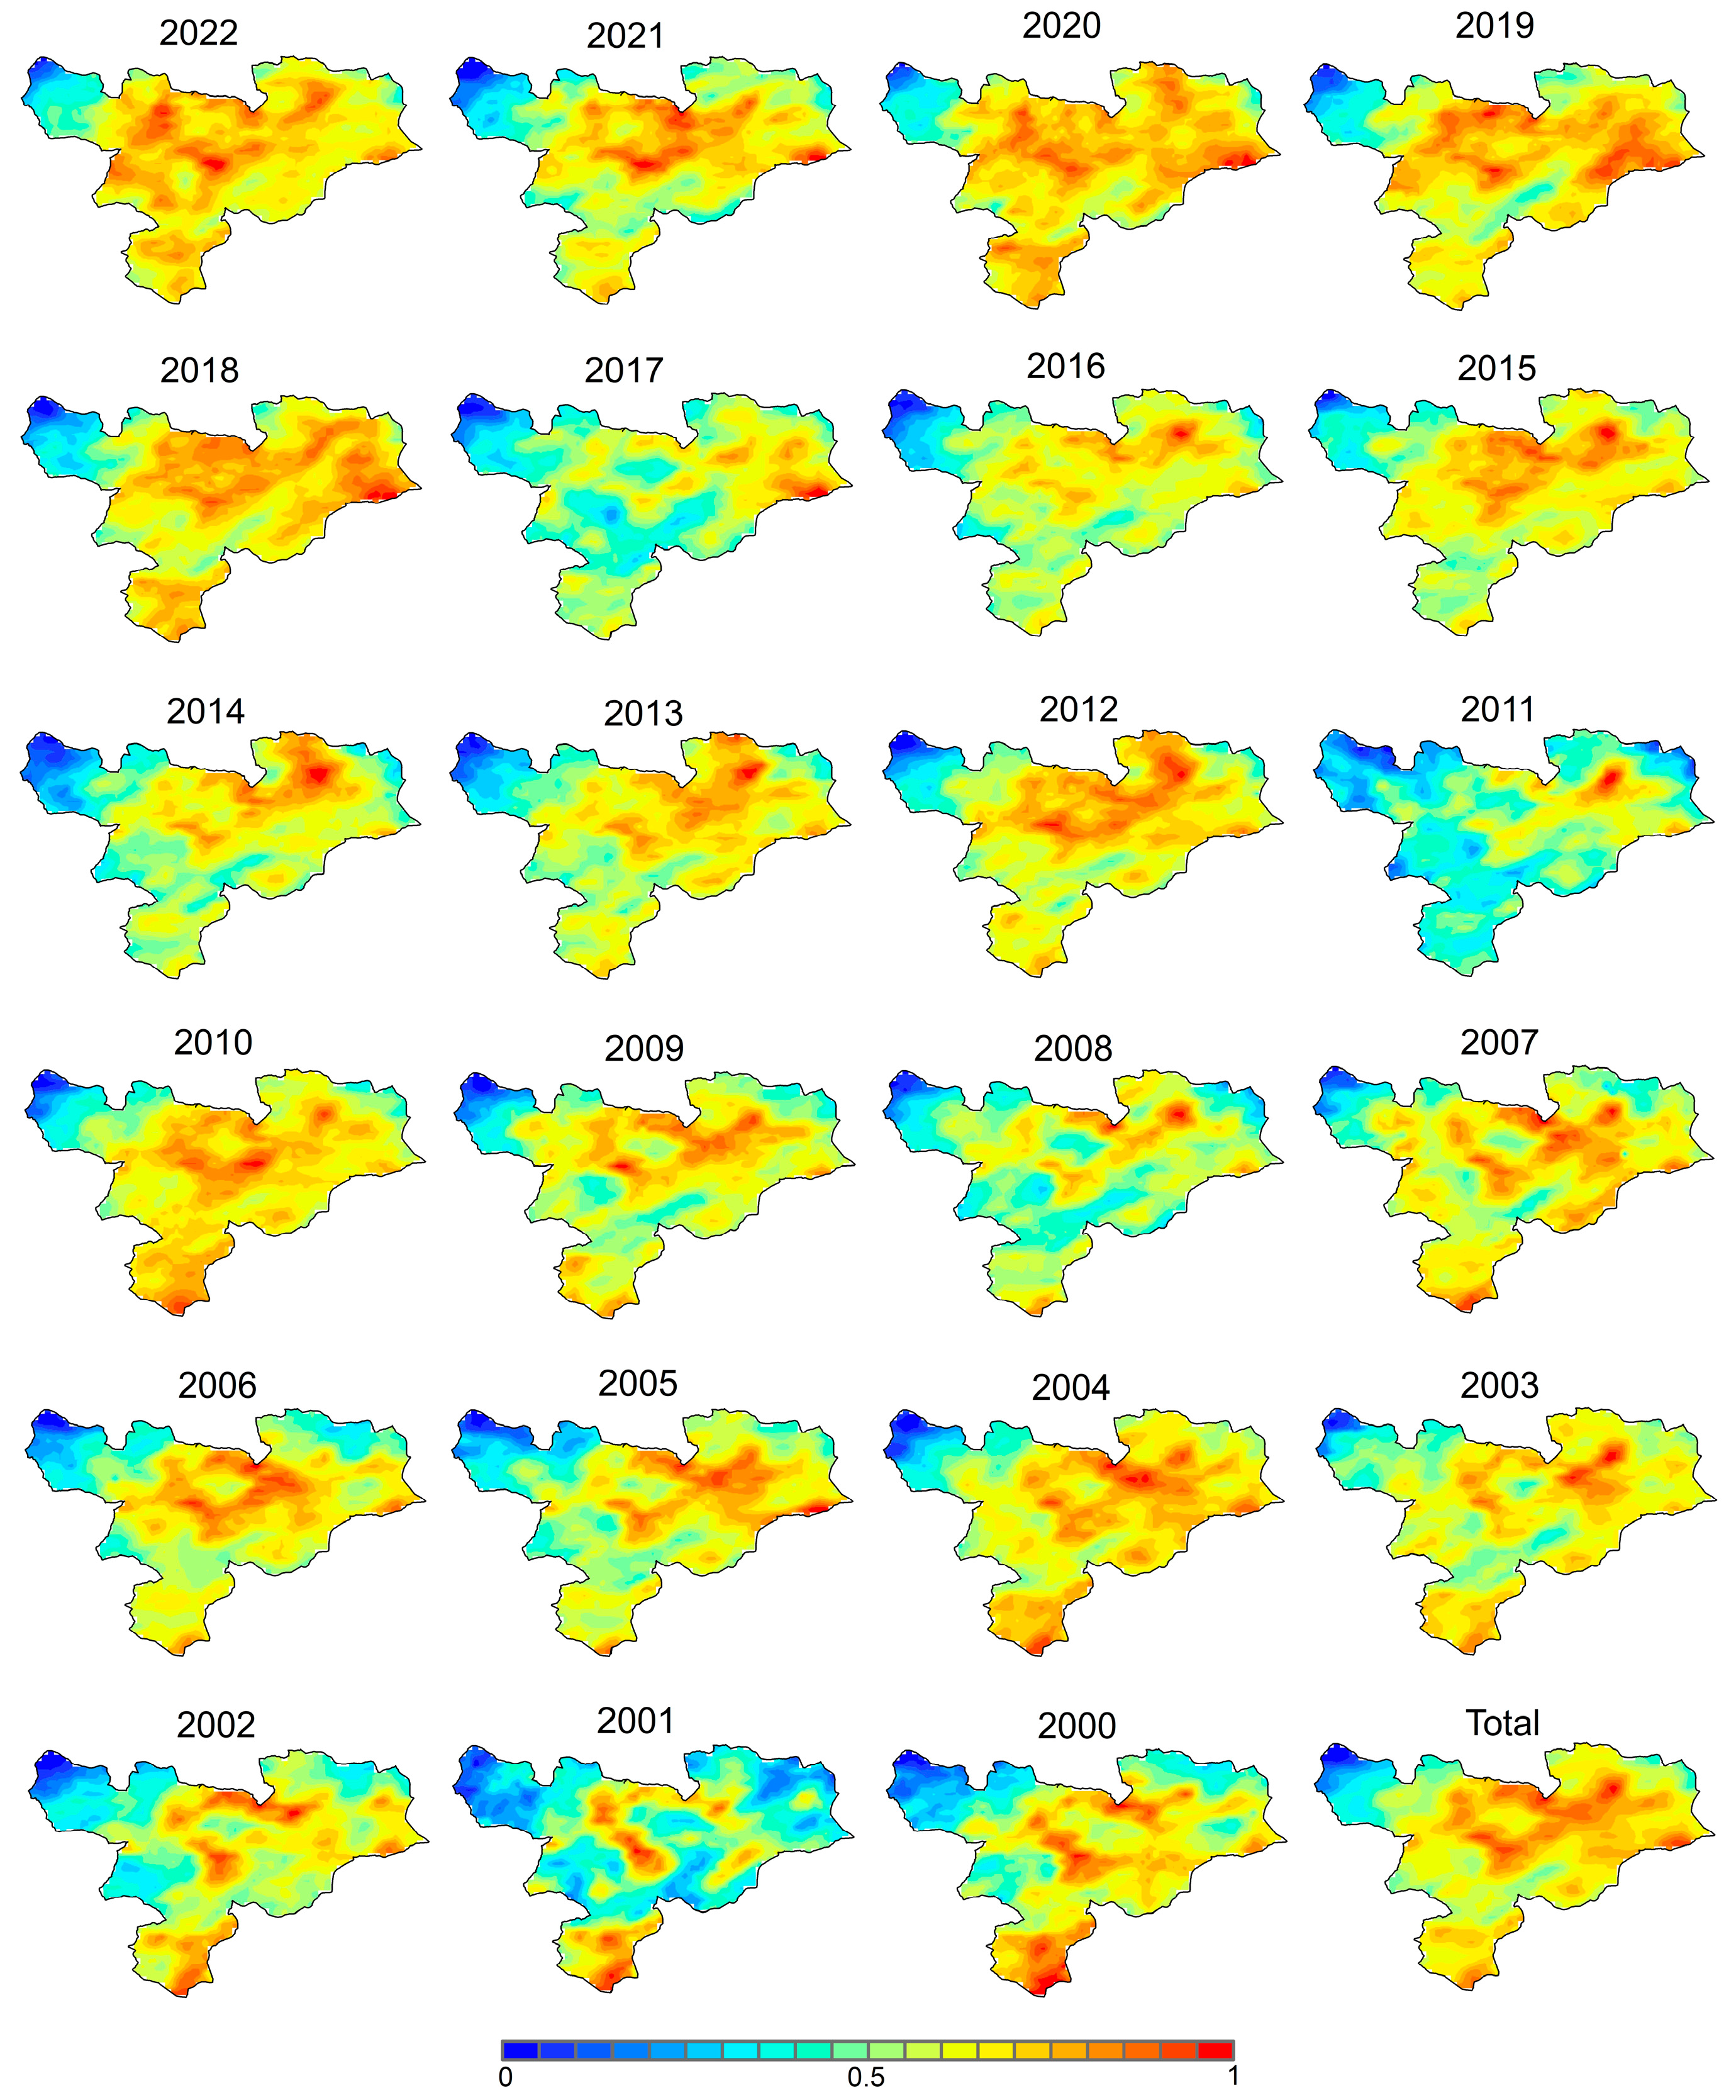
3.1. Spatial and Temporal Variations in AOD
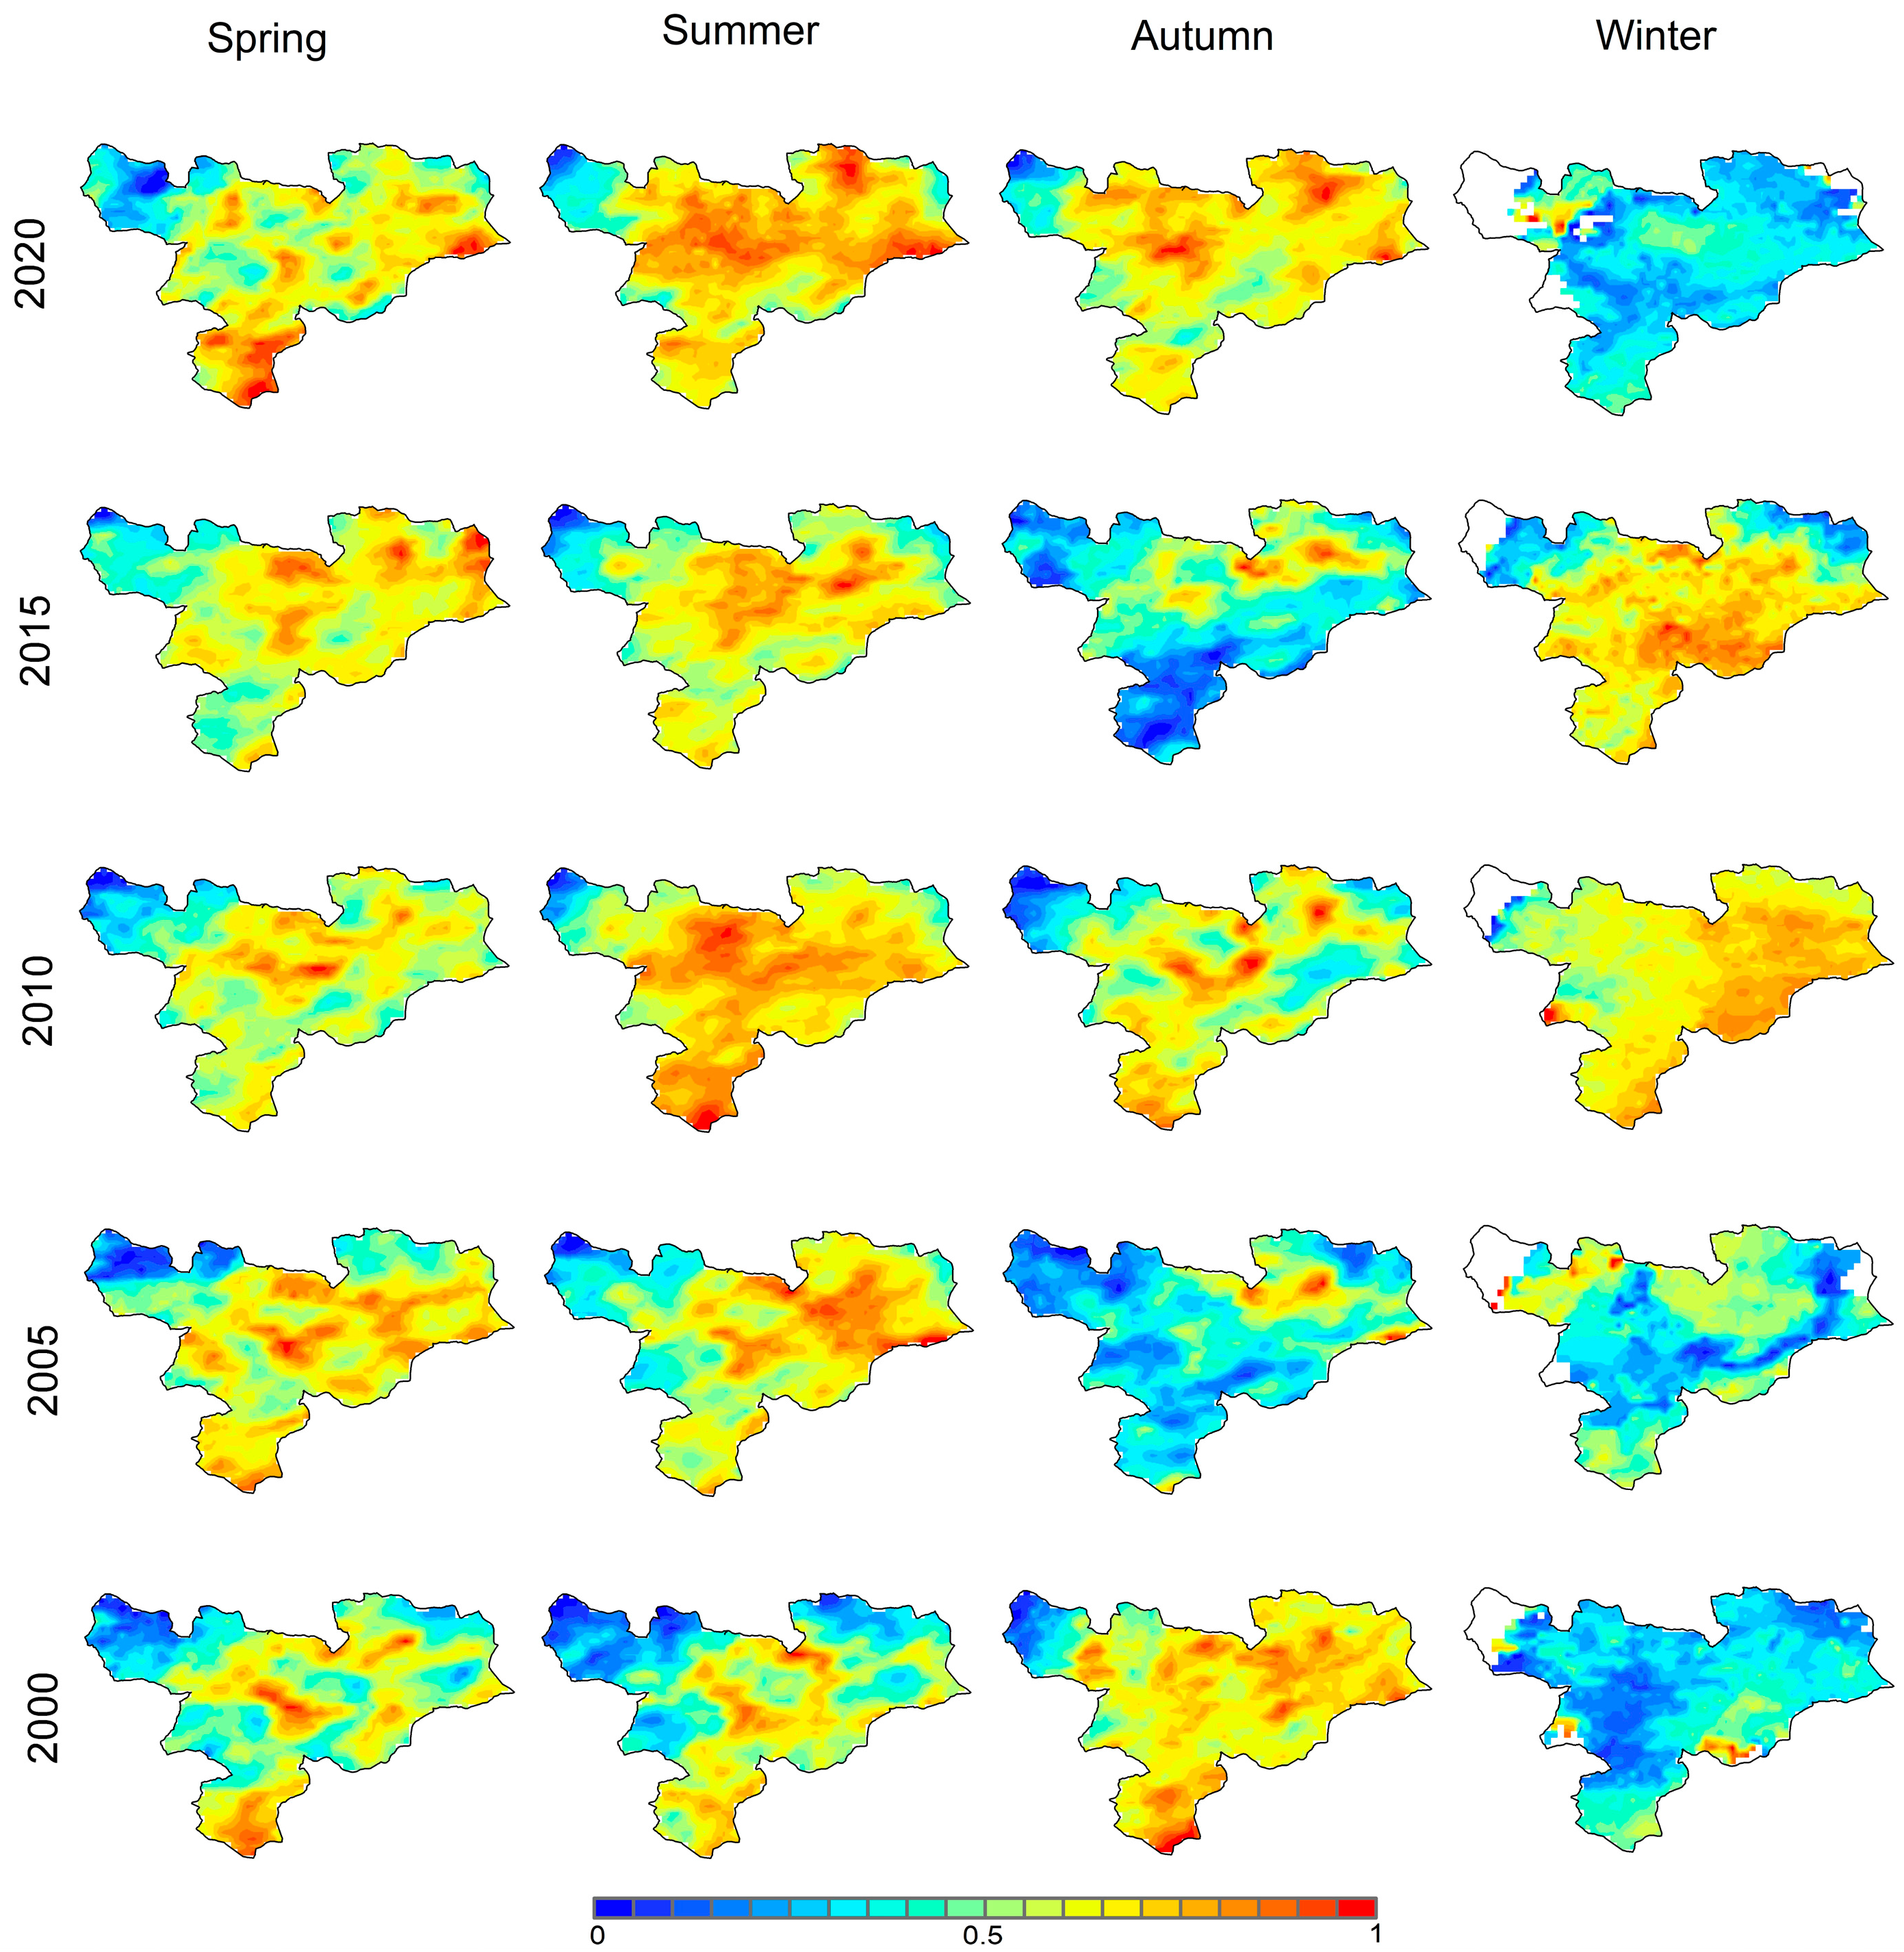
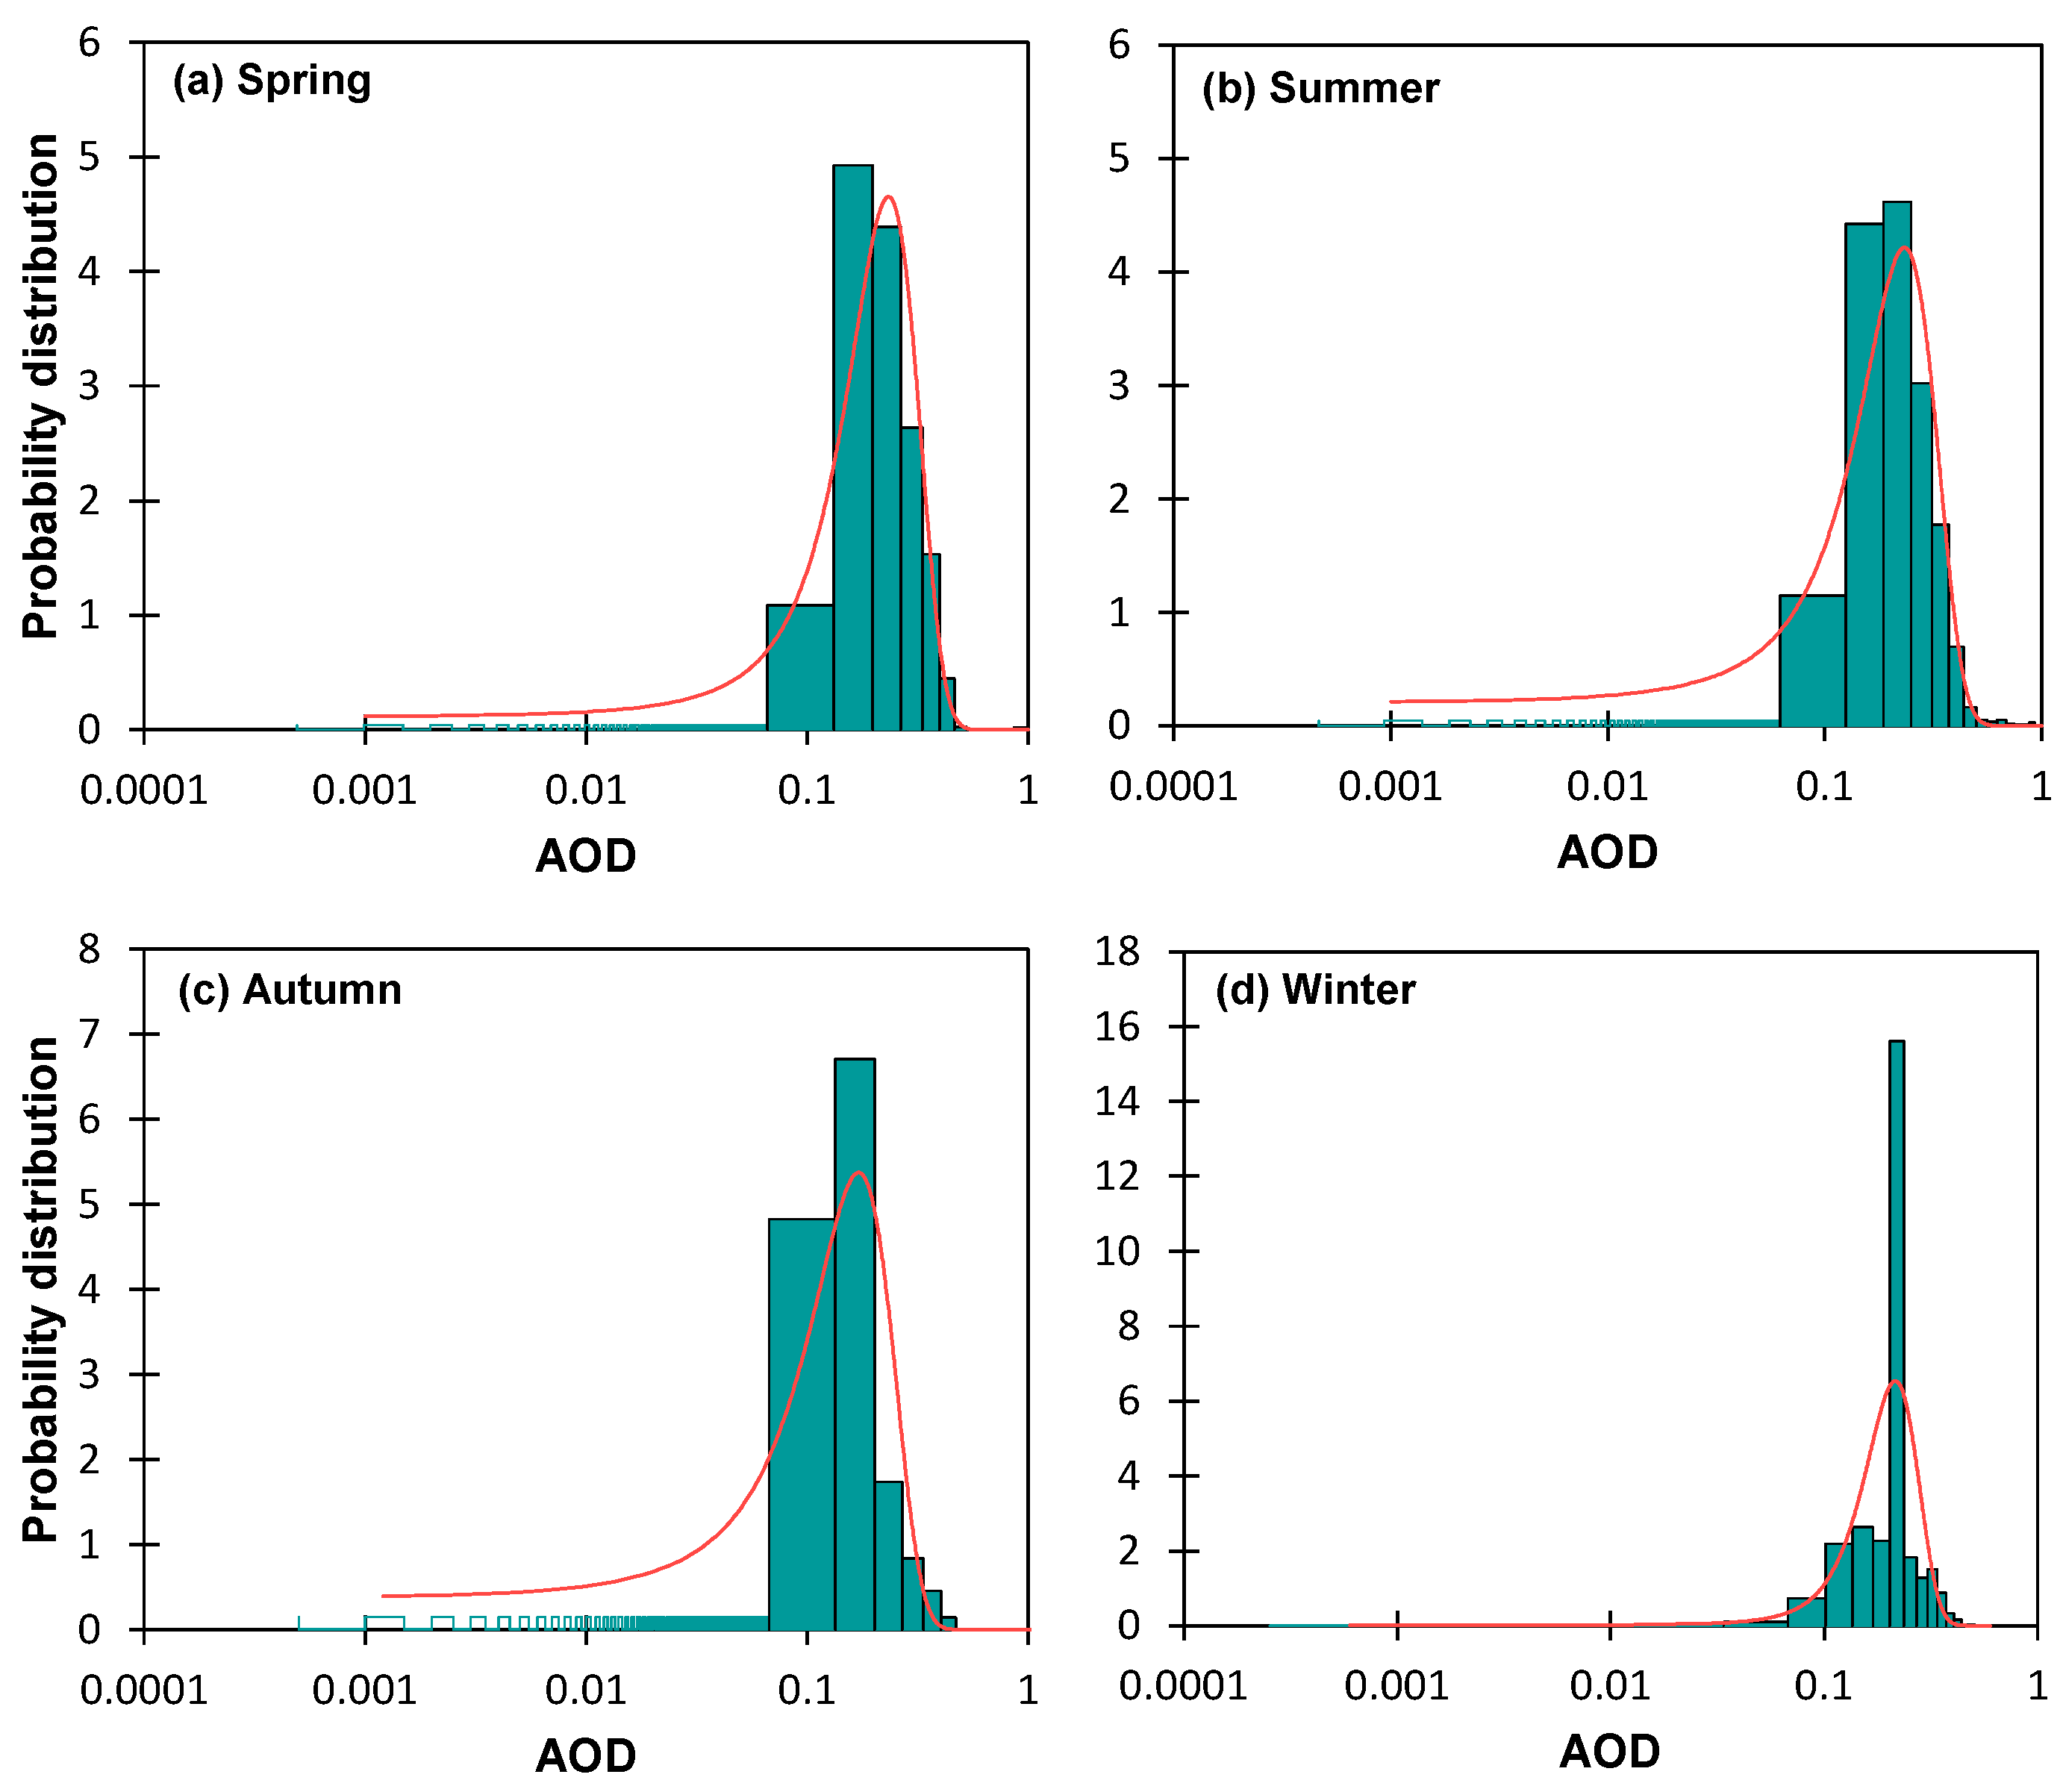
3.2. Seasonal and Interannual Variations in AOD
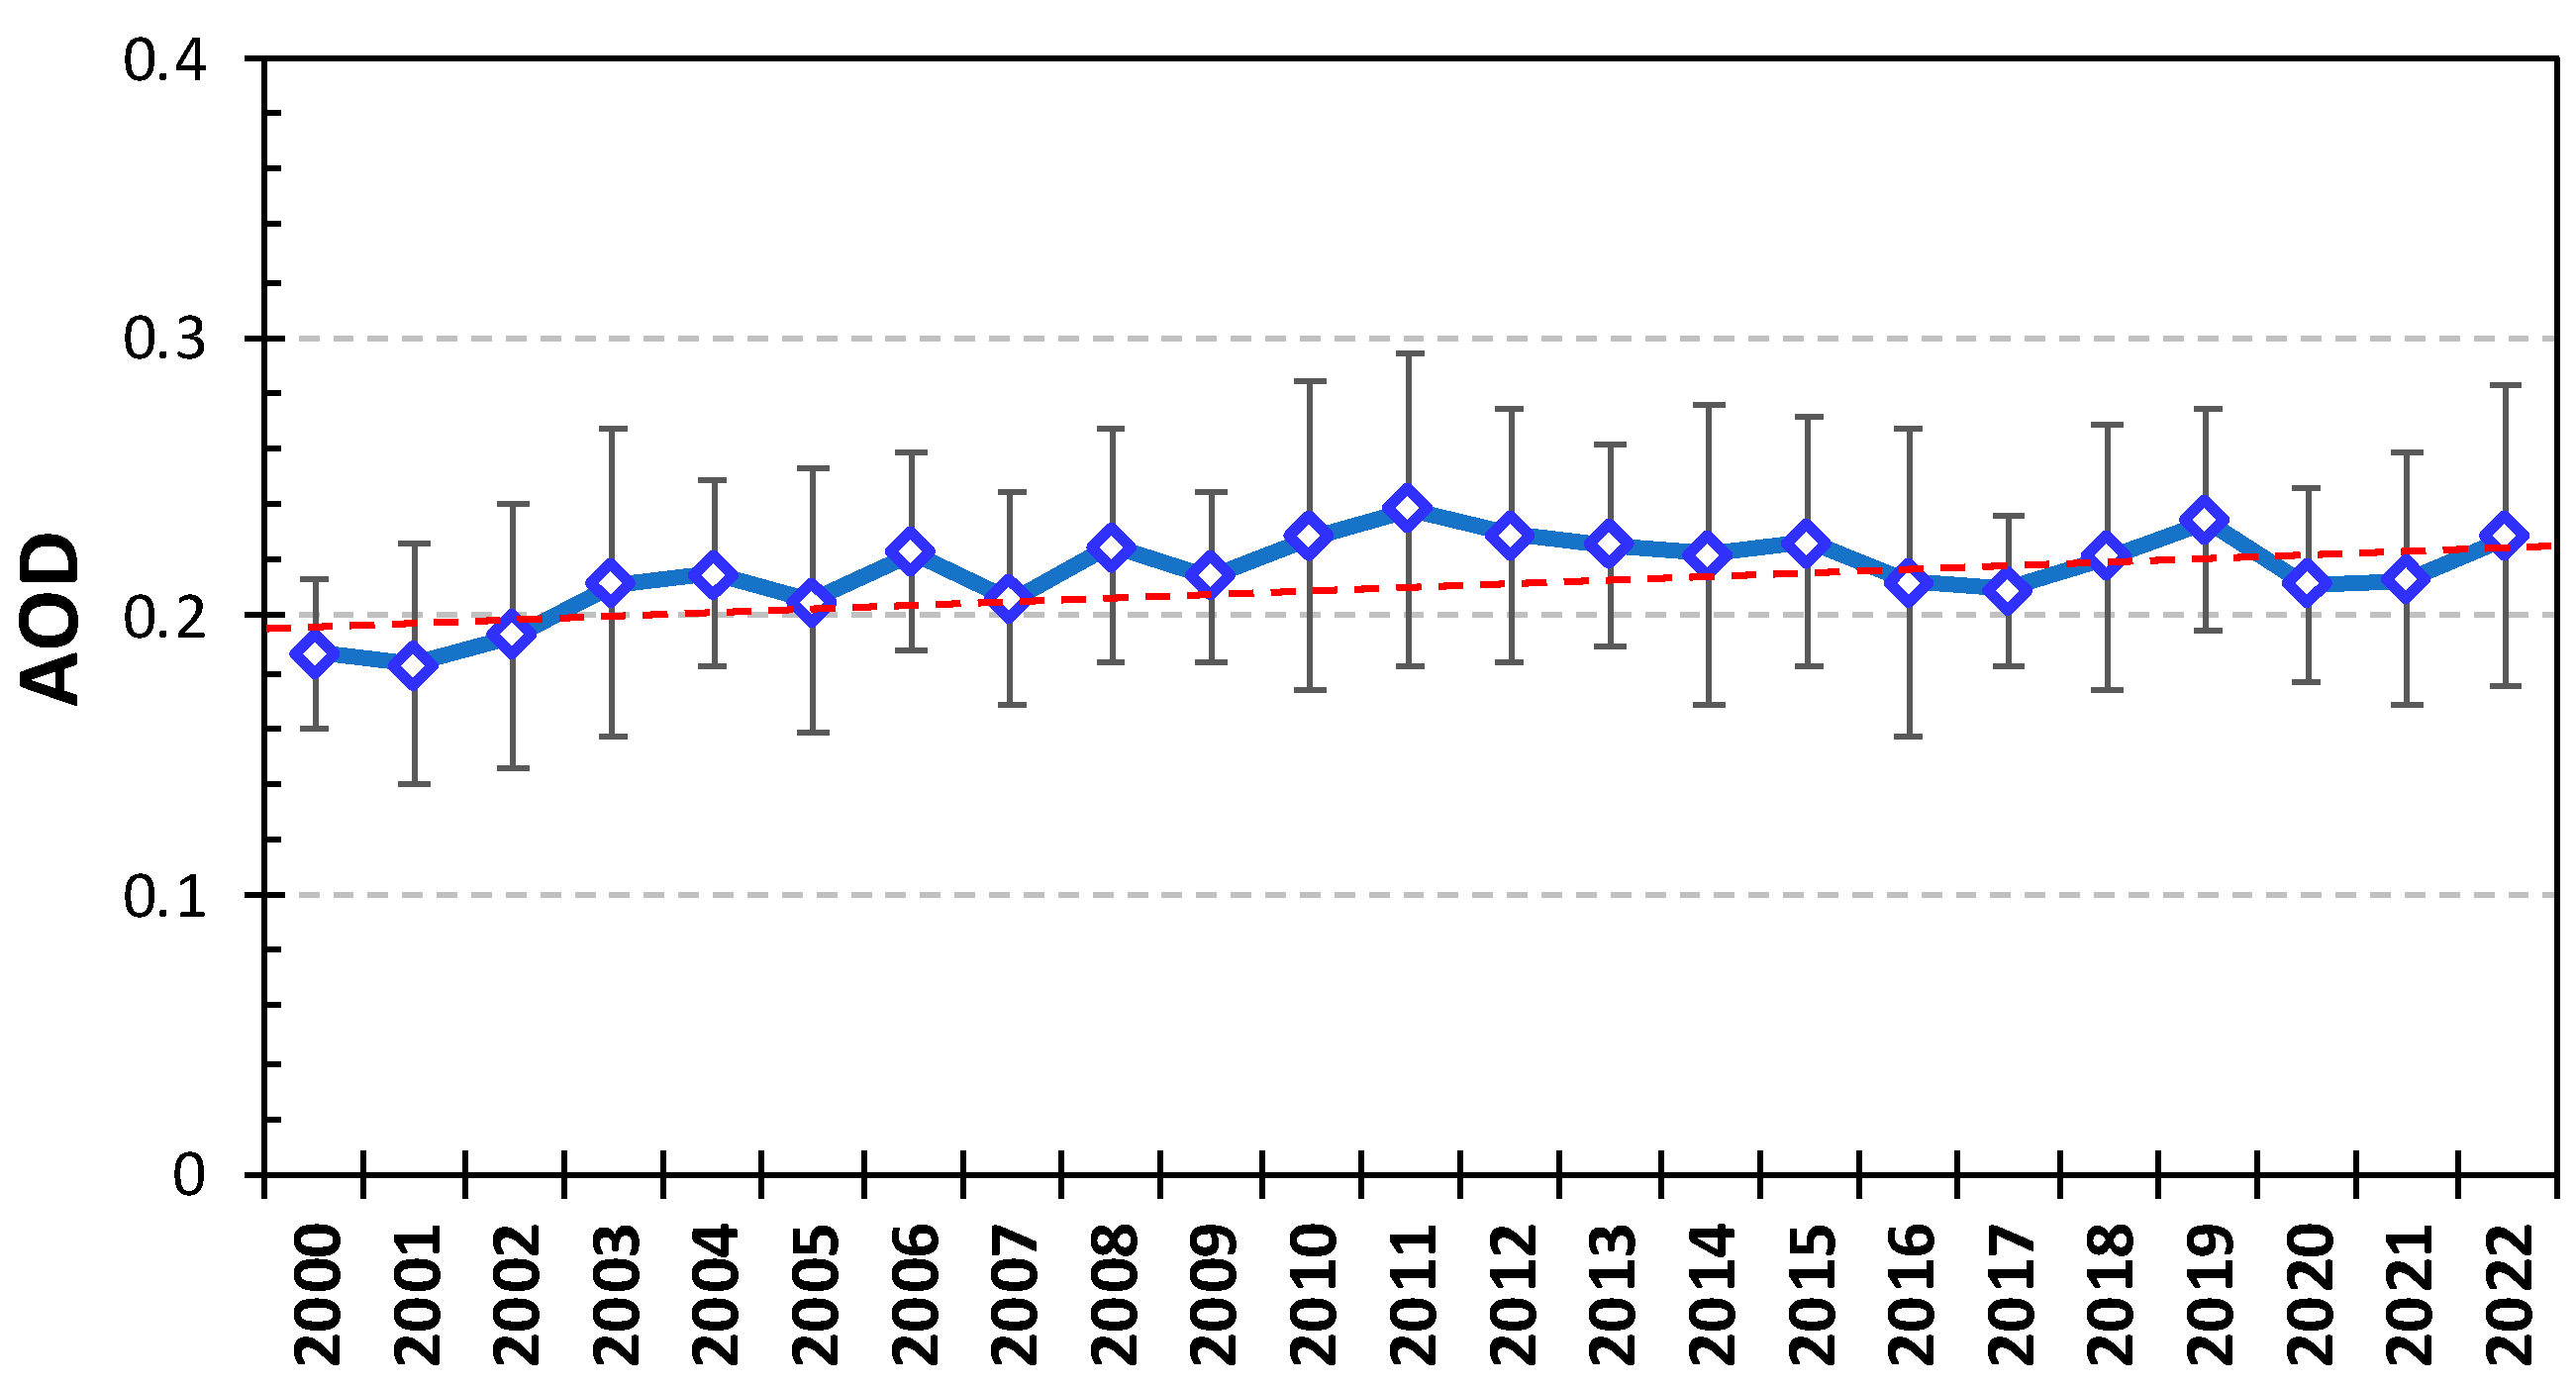
3.3. Long-Term Trend in AOD and Meteorological Factors
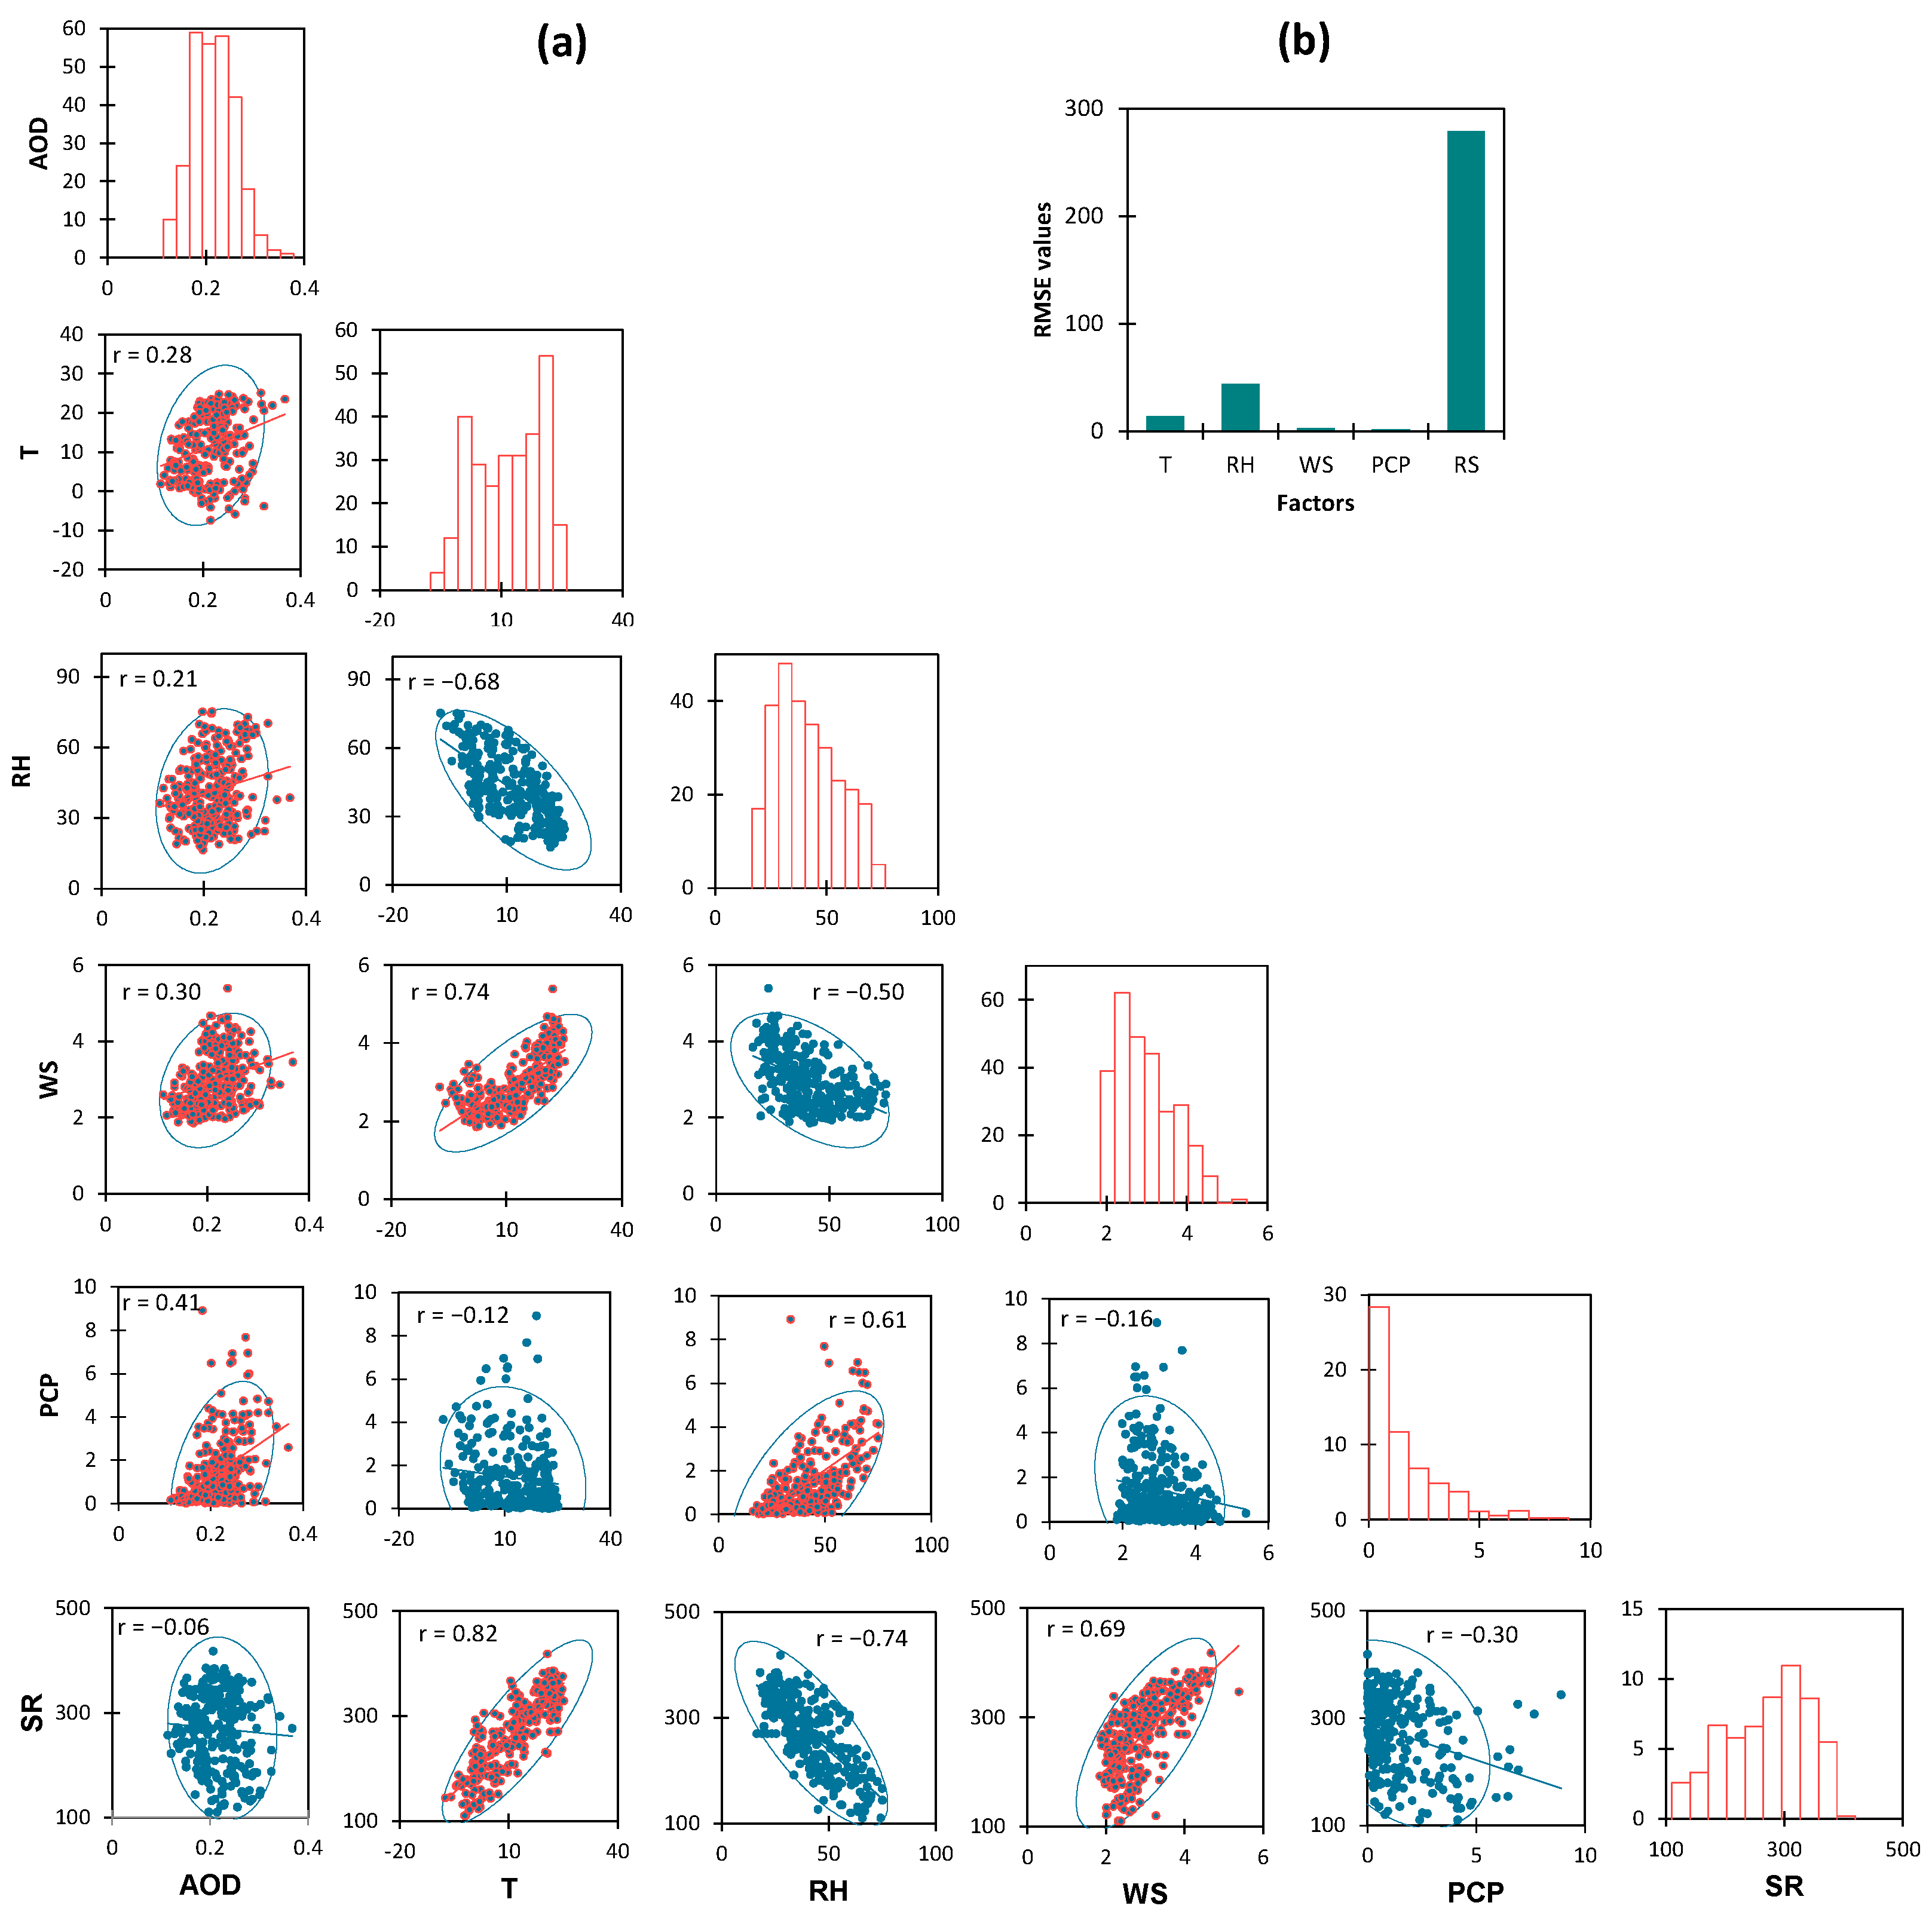
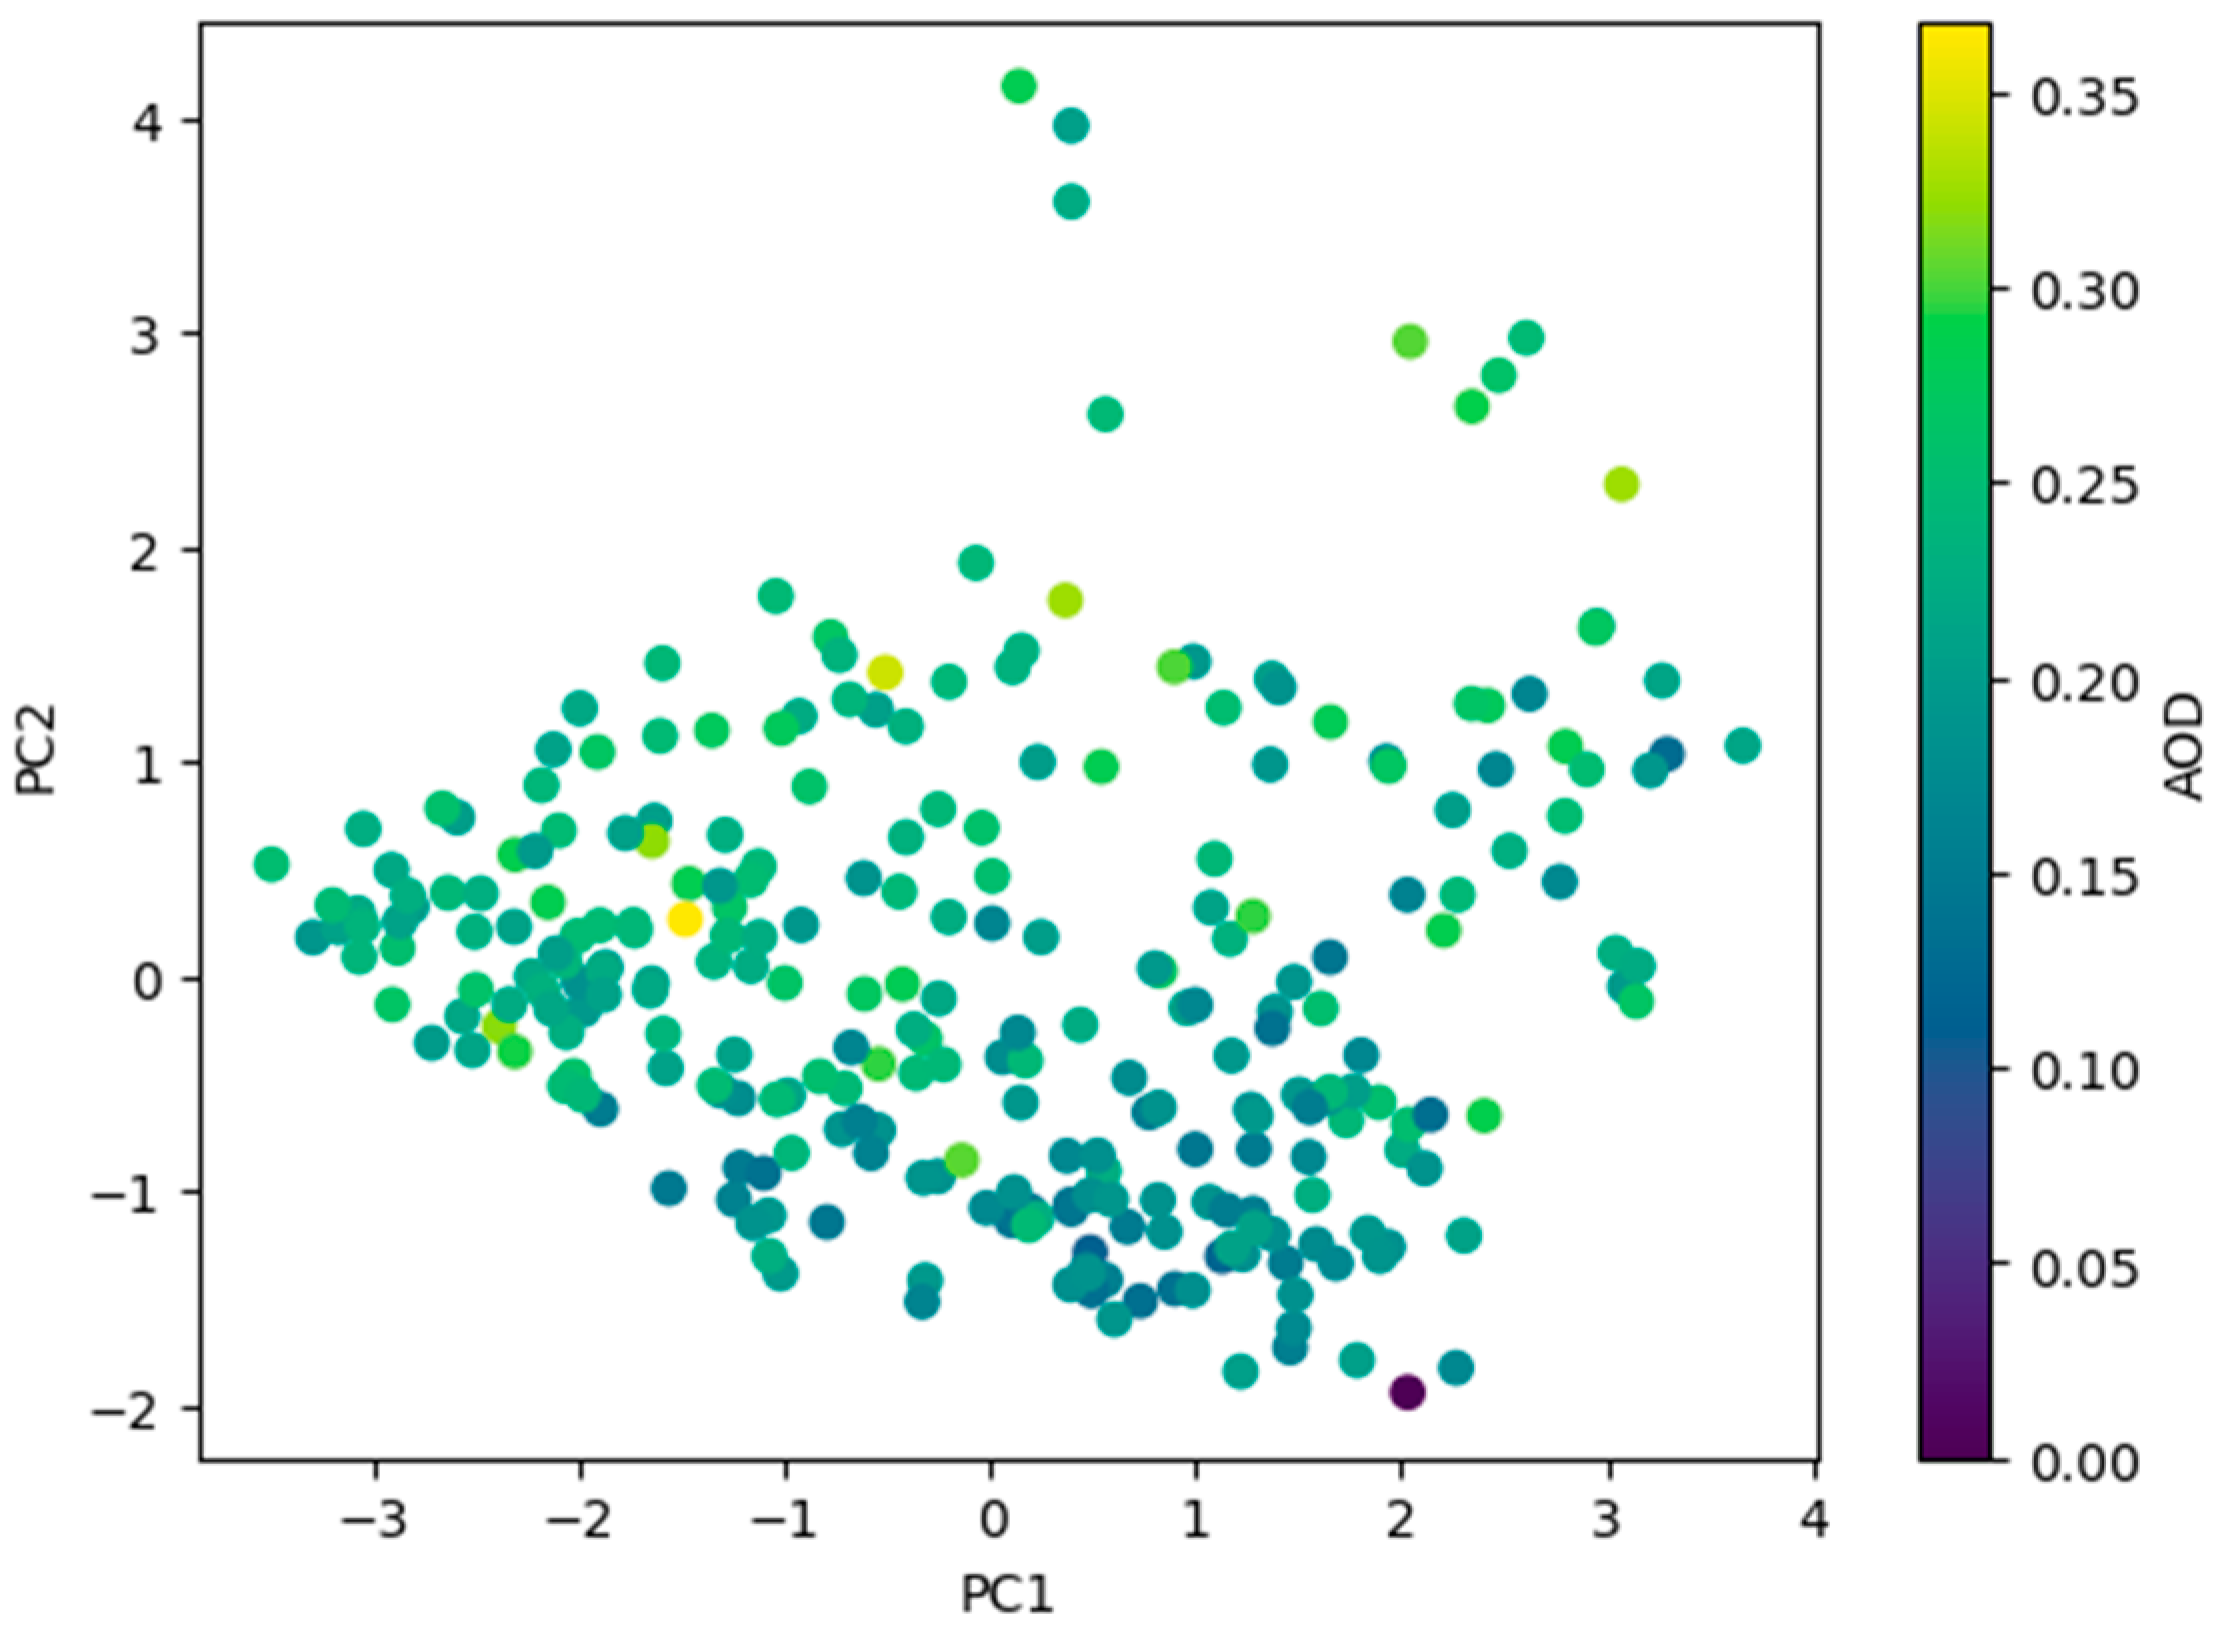
3.4. Relationship between AOD and Meteorological Factors
4. Conclusions
Author Contributions
Funding
Institutional Review Board Statement
Informed Consent Statement
Data Availability Statement
Acknowledgments
Conflicts of Interest
Abbreviations
| Abbreviation | Explanation |
| AOD | Aerosol Optical Depth |
| GEE | Google Earth Engine |
| MAIAC | Multiangle Implementation of Atmospheric Correction |
| MERRA | Modern Era Retrospective Analysis for Research and Application |
| MODIS | Moderate Resolution Imaging Spectroradiometer |
| NASA | National Aeronautics and Space Administration |
| NEPA | National Environmental Protection Agency |
| NOAA | National Oceanic and Atmospheric Administration |
| PC1 | Principle Component 1 |
| PC2 | Principle Component 2 |
| PCA | Principle Component Analysis |
| PCP | Precipitation |
| PM | Particulate Matter |
| RH | Relative Humidity |
| RMSE | Root Mean Square Error |
| SR | Solar Radiation |
| T | Temperature |
| US.EPA | United States Environmental Protection Agency |
| WD | Wind Speed |
| WHO | World Health Organization |
| WS | Wind Directions |
References
- Inerb, M.; Phairuang, W.; Paluang, P.; Hata, M.; Furuuchi, M.; Wangpakapattanawong, P. Carbon and Trace Element Compositions of Total Suspended Particles (TSP) and Nanoparticles (PM0.1) in Ambient Air of Southern Thailand and Characterization of Their Sources. Atmosphere 2022, 13, 626. [Google Scholar] [CrossRef]
- Landrigan, P.J.; Fuller, R.; Acosta, N.J.R.; Adeyi, O.; Arnold, R.; Basu, N.; Baldé, A.B.; Bertollini, R.; Bose-O’Reilly, S.; Boufford, J.I.; et al. The Lancet Commission on Pollution and Health. Lancet 2018, 391, 462–512. [Google Scholar] [CrossRef] [PubMed]
- WHO. Ambient Air Pollution: A Global Assessment of Exposure and Burden of Disease; WHO: Geneva, Switzerland, 2016. [Google Scholar]
- US.EPA Particulate Matter (PM) Basics. Available online: https://www.epa.gov/pm-pollution/particulate-matter-pm-basics (accessed on 20 February 2024).
- Magnusson, R.; Hägglund, L.; Wingfors, H. Broad Exposure Screening of Air Pollutants in the Occupational Environment of Swedish Soldiers Deployed in Afghanistan. Mil. Med. 2012, 177, 318–325. [Google Scholar] [CrossRef] [PubMed]
- Hoet, P.H.M.; Brüske-Hohlfeld, I.; Salata, O.V. Nanoparticles—Known and Unknown Health Risks. J. Nanobiotechnology 2004, 2, 12. [Google Scholar] [CrossRef] [PubMed]
- NEPA. The Daily Air Pollution Figures for Various Areas of Kabul City; NEPA: Kabul, Afghanistan, 2023. Available online: https://www.nepa.gov.af/airpollution (accessed on 10 March 2024).
- Khpalwak, W.; Jadoon, W.A.; Abdel-dayem, S.M.; Sakugawa, H. Polycyclic Aromatic Hydrocarbons in Urban Road Dust, Afghanistan: Implications for Human Health. Chemosphere 2019, 218, 517–526. [Google Scholar] [CrossRef] [PubMed]
- Kinne, S.; Schulz, M.; Textor, C.; Guibert, S.; Balkanski, Y.; Bauer, S.E.; Berntsen, T.; Berglen, T.F.; Boucher, O.; Chin, M.; et al. An AeroCom Initial Assessment—Optical Properties in Aerosol Component Modules of Global Models. Atmos. Chem. Phys. 2006, 6, 1815–1834. [Google Scholar] [CrossRef]
- Remer, L.A.; Kaufman, Y.J.; Tanré, D.; Mattoo, S.; Chu, D.A.; Martins, J.V.; Li, R.R.; Ichoku, C.; Levy, R.C.; Kleidman, R.G.; et al. The MODIS Aerosol Algorithm, Products, and Validation. J. Atmos. Sci. 2005, 62, 947–973. [Google Scholar] [CrossRef]
- Bencherif, H.; Bounhir, A.; Bègue, N.; Millet, T.; Benkhaldoun, Z.; Lamy, K.; Portafaix, T.; Gadouali, F. Aerosol Distributions and Sahara Dust Transport in Southern Morocco, from Ground-Based and Satellite Observations. Remote Sens. 2022, 14, 2454. [Google Scholar] [CrossRef]
- Caido, N.G.; Ong, P.M.; Rempillo, O.; Galvez, M.C.; Vallar, E. Spatiotemporal Analysis of MODIS Aerosol Optical Depth Data in the Philippines from 2010 to 2020. Atmosphere 2022, 13, 939. [Google Scholar] [CrossRef]
- Chau, K.; Franklin, M.; Lee, H.; Garay, M.; Kalashnikova, O. Temporal and Spatial Autocorrelation as Determinants of Regional Aod-Pm2.5 Model Performance in the Middle East. Remote Sens. 2021, 13, 3790. [Google Scholar] [CrossRef]
- Ettehadi Osgouei, P.; Roberts, G.; Kaya, S.; Bilal, M.; Dash, J.; Sertel, E. Evaluation and Comparison of MODIS and VIIRS Aerosol Optical Depth (AOD) Products over Regions in the Eastern Mediterranean and the Black Sea. Atmos. Environ. 2022, 268, 118784. [Google Scholar] [CrossRef]
- Gouda, K.C.; Gogeri, I.; ThippaReddy, A.S. Assessment of Aerosol Optical Depth over Indian Subcontinent during COVID-19 Lockdown (March–May 2020). Environ. Monit. Assess. 2022, 194, 195. [Google Scholar] [CrossRef] [PubMed]
- Shin, M.; Kang, Y.; Park, S.; Im, J.; Yoo, C.; Quackenbush, L.J. Estimating Ground-Level Particulate Matter Concentrations Using Satellite-Based Data: A Review. GIScience Remote Sens. 2020, 57, 174–189. [Google Scholar] [CrossRef]
- Colbeck, I.; Lazaridis, M. Aerosol Science: Technology and Appliactions; Wiley: Chichester, UK, 2014; ISBN 9781119977926. [Google Scholar]
- Srivastava, A.K.; Devara, P.C.S.; Rao, Y.J.; Bhavanikumar, Y.; Rao, D.N. Aerosol Optical Depth, Ozone and Water Vapor Measurements over Gadanki, a Tropical Station in Peninsular India. Aerosol Air Qual. Res. 2008, 8, 459–476. [Google Scholar] [CrossRef]
- NOAA SURFRAD Aerosol Optical Depth. Available online: https://gml.noaa.gov/grad/surfrad/aod/#:~:text=Aerosol optical depth is a,ground by these aerosol particles (accessed on 18 April 2024).
- Superczynski, S.D.; Kondragunta, S.; Lyapustin, A.I. Evaluation of the Multi-angle Implementation of Atmospheric Correction (MAIAC) Aerosol Algorithm through Intercomparison with VIIRS Aerosol Products and AERONET. J. Geophys. Res. Atmos. 2017, 122, 3005–3022. [Google Scholar] [CrossRef] [PubMed]
- Martins, V.S.; Lyapustin, A.; Carvalho, L.A.S.; Barbosa, C.C.F.; Novo, E.M.L.M. Validation of High-resolution MAIAC Aerosol Product over South America. J. Geophys. Res. Atmos. 2017, 122, 7537–7559. [Google Scholar] [CrossRef]
- Kloog, I.; Sorek-Hamer, M.; Lyapustin, A.; Coull, B.; Wang, Y.; Just, A.C.; Schwartz, J.; Broday, D.M. Estimating Daily PM 2.5 and PM 10 across the Complex Geo-Climate Region of Israel Using MAIAC Satellite-Based AOD Data. Atmos. Environ. 2015, 122, 409–416. [Google Scholar] [CrossRef] [PubMed]
- Lee, H.J.; Chatfield, R.B.; Strawa, A.W. Enhancing the Applicability of Satellite Remote Sensing for PM 2.5 Estimation Using MODIS Deep Blue AOD and Land Use Regression in California, United States. Environ. Sci. Technol. 2016, 50, 6546–6555. [Google Scholar] [CrossRef] [PubMed]
- Just, A.C.; Wright, R.O.; Schwartz, J.; Coull, B.A.; Baccarelli, A.A.; Tellez-Rojo, M.M.; Moody, E.; Wang, Y.; Lyapustin, A.; Kloog, I. Using High-Resolution Satellite Aerosol Optical Depth To Estimate Daily PM 2.5 Geographical Distribution in Mexico City. Environ. Sci. Technol. 2015, 49, 8576–8584. [Google Scholar] [CrossRef] [PubMed]
- Stafoggia, M.; Schneider, A.; Cyrys, J.; Samoli, E.; Andersen, Z.J.; Bedada, G.B.; Bellander, T.; Cattani, G.; Eleftheriadis, K.; Faustini, A.; et al. Association Between Short-Term Exposure to Ultrafine Particles and Mortality in Eight European Urban Areas. Epidemiology 2017, 28, 172–180. [Google Scholar] [CrossRef] [PubMed]
- Sen, A.; Abdelmaksoud, A.S.; Nazeer Ahammed, Y.; Alghamdi, M.A.; Banerjee, T.; Bhat, M.A.; Chatterjee, A.; Choudhuri, A.K.; Das, T.; Dhir, A.; et al. Variations in Particulate Matter over Indo-Gangetic Plains and Indo-Himalayan Range during Four Field Campaigns in Winter Monsoon and Summer Monsoon: Role of Pollution Pathways. Atmos. Environ. 2017, 154, 200–224. [Google Scholar] [CrossRef]
- Sayer, A.M.; Munchak, L.A.; Hsu, N.C.; Levy, R.C.; Bettenhausen, C.; Jeong, M.J. Modis Collection 6 Aerosol Products: Comparison between Aqua’s e-Deep Blue, Dark Target, and “Merged” Data Sets, and Usage Recommendations. J. Geophys. Res. 2014, 119, 13965–13989. [Google Scholar] [CrossRef]
- Singh, N.; Murari, V.; Kumar, M.; Barman, S.C.; Banerjee, T. Fine Particulates over South Asia: Review and Meta-Analysis of PM2.5 Source Apportionment through Receptor Model. Environ. Pollut. 2017, 223, 121–136. [Google Scholar] [CrossRef] [PubMed]
- Singh, N.; Banerjee, T.; Raju, M.P.; Deboudt, K.; Sorek-Hamer, M.; Singh, R.S.; Mall, R.K. Aerosol Chemistry, Transport, and Climatic Implications during Extreme Biomass Burning Emissions over the Indo-Gangetic Plain. Atmos. Chem. Phys. 2018, 18, 14197–14215. [Google Scholar] [CrossRef]
- Meng, H.; Bai, G.; Wang, L. Analysis of the Spatial and Temporal Distribution Characteristics of AOD in Typical Industrial Cities in Northwest China and the Influence of Meteorological Factors. Atmos. Pollut. Res. 2024, 15, 101957. [Google Scholar] [CrossRef]
- Li, S.; Wang, T.; Xie, M.; Han, Y.; Zhuang, B. Observed Aerosol Optical Depth and Angstrom Exponent in Urban Area of Nanjing, China. Atmos. Environ. 2015, 123, 350–356. [Google Scholar] [CrossRef]
- Li, J.; Ge, X.; He, Q.; Abbas, A. Aerosol Optical Depth (AOD): Spatial and Temporal Variations and Association with Meteorological Covariates in Taklimakan Desert, China. PeerJ 2021, 9, e10542. [Google Scholar] [CrossRef] [PubMed]
- Przybylak, R.; Svyashchennikov, P.N.; Uscka-Kowalkowska, J.; Wyszyński, P. Solar Radiation in the Arctic during the Early Twentieth-Century Warming (1921-50): Presenting a Compilation of Newly Available Data. J. Clim. 2021, 34, 21–37. [Google Scholar] [CrossRef]
- Ulfat, I.; Javed, F.; Abbasi, F.A.; Kanwal, F.; Usman, A.; Jahangir, M.; Ahmed, F. Estimation of Solar Energy Potential for Islamabad, Pakistan. Energy Procedia 2012, 18, 1496–1500. [Google Scholar] [CrossRef]
- Ismail, A.H.; Dawi, E.A.; Almokdad, N.; Abdelkader, A.; Salem, O. Estimation and Comparison of the Clearness Index Using Mathematical Models—Case Study in the United Arab Emirates. Evergreen 2023, 10, 863–869. [Google Scholar] [CrossRef]
- Foschini, F. Kabul Unpacked: A Geographical Guide to a Metropolis in the Making. 2019. Available online: https://www.afghanistan-analysts.org/en/special-reports/kabul-unpacked-a-geographical-guide-to-a-metropolis-in-the-making/ (accessed on 22 February 2024).
- ADB Kabul Air Quality Management: Strategy Report; Asian Development Bank location: Metro Manila, Philippines, 2007.
- Foschini, F. Kabul and the Challenge of Dwindling Foreign Aid; United States Institute of Peace: Washington, DC, USA, 2017; ISBN 9781601276414. [Google Scholar]
- Hsu, N.C.; Gautam, R.; Sayer, A.M.; Bettenhausen, C.; Li, C.; Jeong, M.J.; Tsay, S.C.; Holben, B.N. Global and Regional Trends of Aerosol Optical Depth over Land and Ocean Using SeaWiFS Measurements from 1997 to 2010. Atmos. Chem. Phys. 2012, 12, 8037–8053. [Google Scholar] [CrossRef]
- Lyapustin, A.; Wang, Y.; Laszlo, I.; Kahn, R.; Korkin, S.; Remer, L.; Levy, R.; Reid, J.S. Multi-Angle Implementation of Atmospheric Correction (MAIAC): 2. Aerosol Algorithm. J. Geophys. Res. Atmos. 2011, 116, 1–15. [Google Scholar] [CrossRef]
- Gorelick, N.; Hancher, M.; Dixon, M.; Ilyushchenko, S.; Thau, D.; Moore, R. Google Earth Engine: Planetary-Scale Geospatial Analysis for Everyone. Remote Sens. Environ. 2017, 202, 18–27. [Google Scholar] [CrossRef]
- Kumar, L.; Mutanga, O. Google Earth Engine Applications; Mdpi AG: Basel, Switzerland, 2019; ISBN 9783038978848. [Google Scholar]
- NASA Modern-Era Retrospective Analysis for Research and Applications, Version 2. Available online: https://gmao.gsfc.nasa.gov/reanalysis/MERRA-2/ (accessed on 13 April 2024).
- Gelaro, R.; McCarty, W.; Suárez, M.J.; Todling, R.; Molod, A.; Takacs, L.; Randles, C.A.; Darmenov, A.; Bosilovich, M.G.; Reichle, R.; et al. The Modern-Era Retrospective Analysis for Research and Applications, Version 2 (MERRA-2). J. Clim. 2017, 30, 5419–5454. [Google Scholar] [CrossRef]
- NASA POWER Data Methodology. Available online: https://power.larc.nasa.gov/docs/methodology/ (accessed on 8 April 2024).
- Randles, C.A.; da Silva, A.M.; Buchard, V.; Colarco, P.R.; Darmenov, A.; Govindaraju, R.; Smirnov, A.; Holben, B.; Ferrare, R.; Hair, J.; et al. The MERRA-2 Aerosol Reanalysis, 1980 Onward. Part I: System Description and Data Assimilation Evaluation. J. Clim. 2017, 30, 6823–6850. [Google Scholar] [CrossRef]
- Buchard, V.; Randles, C.A.; da Silva, A.M.; Darmenov, A.; Colarco, P.R.; Govindaraju, R.; Ferrare, R.; Hair, J.; Beyersdorf, A.J.; Ziemba, L.D.; et al. The MERRA-2 Aerosol Reanalysis, 1980 Onward. Part II: Evaluation and Case Studies. J. Clim. 2017, 30, 6851–6872. [Google Scholar] [CrossRef]
- Buchard, V.; da Silva, A.M.; Randles, C.A.; Colarco, P.; Ferrare, R.; Hair, J.; Hostetler, C.; Tackett, J.; Winker, D. Evaluation of the Surface PM2.5 in Version 1 of the NASA MERRA Aerosol Reanalysis over the United States. Atmos. Environ. 2016, 125, 100–111. [Google Scholar] [CrossRef]
- Rienecker, M.; Keppenne, C.; Kovach, R.; Jacob, J.; Marshak, J. The GMAO’s Ensemble Kalman Filter Ocean Data Assimilation System. In Proceedings of the Third WCRP International Conference on Reanalysis, Tokyo, Japan, 28 January–1 February 2008; pp. 9–15. [Google Scholar]
- Reichle, R.H.; Liu, Q.; Koster, R.D.; Draper, C.S.; Mahanama, S.P.P.; Partyka, G.S. Land Surface Precipitation in MERRA-2. J. Clim. 2017, 30, 1643–1664. [Google Scholar] [CrossRef]
- Bosilovich, M.; Akella, S.; Coy, L.; Cullather, R.; Draper, C.; Gelaro, R.; Kovach, R.; Liu, Q.; Molod, A.; Norris, P.; et al. MERRA-2: Initial Evaluation of the Climate. NASA Tech. Rep. Ser. Glob. Model. Data Assim. 2015, 43, 139. [Google Scholar]
- ADB. Country Synthesis Report on Urban Air Quality Management: Afghanistan; ADB: Metro Manila, PH, USA, 2006. [Google Scholar]
- Di Lella, L.A.; Loppi, S.; Protano, G.; Riccobono, F. Toxic Trace Elements and Organic Compounds in the Ambient Air of Kabul, Afghanistan. Atmos. Environ. 2006, 40, 225–237. [Google Scholar] [CrossRef]
- Torabi, S.E.; Amin, M.; Phairuang, W.; Hata, M.; Furuuchi, M. Preliminary Discussion about the Air Pollution Status in Afghanistan from Aerosol Optical Depth. IOP Conf. Ser. Earth Environ. Sci. 2023, 1199, 012022. [Google Scholar] [CrossRef]
- Shen, L.; Wang, H.; Zhao, T.; Liu, J.; Bai, Y.; Kong, S.; Shu, Z. Characterizing Regional Aerosol Pollution in Central China Based on 19 Years of MODIS Data: Spatiotemporal Variation and Aerosol Type Discrimination. Environ. Pollut. 2020, 263, 114556. [Google Scholar] [CrossRef]
- Cugerone, K.; De Michele, C.; Ghezzi, A.; Gianelle, V. Aerosol Removal Due to Precipitation and Wind Forcings in Milan Urban Area. J. Hydrol. 2018, 556, 1256–1262. [Google Scholar] [CrossRef]


| Variable | Observations | Minimum | Maximum | Mean | Std. |
|---|---|---|---|---|---|
| Jan | 357 | 0.061 | 0.413 | 0.192 | 0.055 |
| Feb | 248 | 0.075 | 0.404 | 0.226 | 0.042 |
| Mar | 424 | 0.061 | 0.498 | 0.230 | 0.068 |
| Apr | 594 | 0.051 | 0.982 | 0.249 | 0.085 |
| May | 578 | 0.073 | 0.451 | 0.227 | 0.071 |
| Jun | 696 | 0.055 | 0.953 | 0.230 | 0.084 |
| Jul | 721 | 0.039 | 0.923 | 0.248 | 0.094 |
| Aug | 581 | 0.068 | 0.899 | 0.244 | 0.090 |
| Sep | 592 | 0.055 | 0.736 | 0.198 | 0.073 |
| Oct | 592 | 0.046 | 0.889 | 0.175 | 0.076 |
| Nov | 518 | 0.040 | 0.431 | 0.171 | 0.067 |
| Dec | 482 | 0.057 | 0.998 | 0.166 | 0.065 |
| Annual | 0.214 | 0.090 | |||
| Season | Observations | Minimum | Maximum | Mean | Std. |
|---|---|---|---|---|---|
| Spring | 1864 | 0.051 | 0.982 | 0.233 | 0.086 |
| Summer | 1894 | 0.039 | 0.923 | 0.232 | 0.095 |
| Autumn | 1592 | 0.040 | 0.998 | 0.171 | 0.074 |
| Winter | 1047 | 0.061 | 0.498 | 0.215 | 0.061 |
| Variable | z | s | p Value | Slope |
|---|---|---|---|---|
| AOD | 2 | 77 | 0.044 | 0.001 |
| T | −1.563 | −166 | 0.117 | −0.015 |
| RH | 3.063 | 117 | 0.002 | 0.813 |
| PCP | 3.591 | 137 | 0.0003 | 33.159 |
| WS | −0.475 | −19 | 0.634 | −0.002 |
| Factors | PC1 | PC2 |
|---|---|---|
| T | −0.52 | 0.29 |
| RH | 0.49 | 0.35 |
| WS | −0.47 | 0.26 |
| PCP | 0.26 | 0.80 |
| SR | −0.43 | 0.26 |
Disclaimer/Publisher’s Note: The statements, opinions and data contained in all publications are solely those of the individual author(s) and contributor(s) and not of MDPI and/or the editor(s). MDPI and/or the editor(s) disclaim responsibility for any injury to people or property resulting from any ideas, methods, instructions or products referred to in the content. |
© 2024 by the authors. Licensee MDPI, Basel, Switzerland. This article is an open access article distributed under the terms and conditions of the Creative Commons Attribution (CC BY) license (https://creativecommons.org/licenses/by/4.0/).
Share and Cite
Torabi, S.E.; Amin, M.; Phairuang, W.; Lee, H.-M.; Hata, M.; Furuuchi, M. High-Resolution Characterization of Aerosol Optical Depth and Its Correlation with Meteorological Factors in Afghanistan. Atmosphere 2024, 15, 849. https://doi.org/10.3390/atmos15070849
Torabi SE, Amin M, Phairuang W, Lee H-M, Hata M, Furuuchi M. High-Resolution Characterization of Aerosol Optical Depth and Its Correlation with Meteorological Factors in Afghanistan. Atmosphere. 2024; 15(7):849. https://doi.org/10.3390/atmos15070849
Chicago/Turabian StyleTorabi, Sayed Esmatullah, Muhammad Amin, Worradorn Phairuang, Hyung-Min Lee, Mitsuhiko Hata, and Masami Furuuchi. 2024. "High-Resolution Characterization of Aerosol Optical Depth and Its Correlation with Meteorological Factors in Afghanistan" Atmosphere 15, no. 7: 849. https://doi.org/10.3390/atmos15070849