Article

Characteristics of Atmospheric Diabatic Heating of the Southwest China Vortex That Induces Extreme Rainstorms in Sichuan

1
Heavy Rain and Drought-Flood Disaster in Plateau and Basin Key Laboratory of Sichuan Province, Chengdu 610072, China
2
Sichuan Meteorological Disaster Prevention Technology Center, Chengdu 610072, China
3
Institute of Plateau Meteorology, China Meteorology Administration, Chengdu 610072, China
*
Author to whom correspondence should be addressed.
Atmosphere 2024, 15(7), 861; https://doi.org/10.3390/atmos15070861 (registering DOI)
Submission received: 3 June 2024 / Revised: 17 July 2024 / Accepted: 19 July 2024 / Published: 21 July 2024
(This article belongs to the Special Issue Advances in Rainfall-Induced Hazard Research)

Abstract

:
In this study, we aimed to demonstrate the importance of diabatic heating in extreme rainstorm weather events induced by the Southwest China vortex (SWCV) in different precipitation regions with a similar circulation background. The results showed that atmospheric diabatic heating had indicative significance for the intensity evolution of the SWCV and the precipitation area. Changes in the diabatic heating intensity preceded the intensity evolution of the SWCV, and the diabatic heating region was consistent with the heavy precipitation region. The variation in diabatic heating was mainly due to the positive contribution of its vertical transport term. The two types of spatially non-uniform heating effects were similar; however, the western type was located southeast of the SWCV, with an asymmetric distribution on the southeastern and northwestern sides. The eastern type was located in the northeast of the SWCV, with an asymmetric distribution on the northeastern and southwestern sides. The vertically non-uniform heating effect played a decisive role in the distribution and evolution of the spatially non-uniform heating terms. The vertically non-uniform heating effect affected the intensity evolution of the SWCV. In contrast, the horizontally non-uniform heating effect, in opposition to the vertically non-uniform heating effect, had a slightly weaker intensity than the vertically non-uniform heating effect. For the SWCV system, which induces extreme rainstorms, the magnitude of the horizontally non-uniform heating effect could reach that of vertically non-uniform heating; thus, the possible impact of horizontally non-uniform heating should be considered.

1. Introduction

The Southwest China vortex (SWCV) is a mesoscale vortex with cyclonic circulation, generated on the 700 or 850 hPa isobaric surface in the western region of Sichuan [1]. It is one of the main impact systems causing catastrophic weather in China, second only to typhoons and their residual low-pressure systems in terms of the intensity and scope of their influence [2]. The Southwest China vortex mostly stagnates, develops, or disappears in the source area, and, in a few instances, it can move out of the source area under appropriate circulation conditions. Its eastward movement and development can bring heavy rainfall to the middle and lower reaches of the Yangtze River, the Huai River Basin, South China, and even North China [3,4,5,6,7,8].
As the SWCV is one of the main systems triggering heavy rainfall in China, many scholars have analyzed its activity rules, structure, and rainfall characteristics and obtained meaningful results [6,7,8,9,10,11,12,13]. Atmospheric diabatic heating is strongly involved in the occurrence and development of weather systems [14,15,16]. Studies have shown that the ground sensible heating and warm advection near the source area of the low vortex are major contributors to the generation of positive non-thermal wind vorticity [17]. Meanwhile, the positive feedback between the low-altitude positive vorticity and the release of latent heat plays a crucial role in the development and eastward movement of the SWCV. Through simulation experiments, it has also been demonstrated that ground heating plays a sustaining role in the development of the SWCV, which is mainly affected by the heating of precipitation condensation latent heat, and the release of precipitation condensation latent heat largely determines the formation of the SWCV [18]. The development of the SWCV is closely related to diabatic heating, which is one of the main reasons for the increase in positive vorticity in the middle and upper troposphere. The positive feedback between the low-altitude positive vorticity and latent heat release plays a crucial role in the sudden development and eastward migration of low vorticity [19,20,21]. Deng et al. [22] simulated the development mechanisms of the SWCV in a heavy rainstorm in Sichuan and Chongqing and concluded that the diabatic heating was enhanced before the SWCV and the positive feedback between the two may be an important mechanism in the development of the SWCV and its volatility. Zhou et al.’s [23] analysis of the characteristics of the Southwest China vortex during two consecutive heavy rainfall events in the Western Sichuan Basin further confirmed the important contribution of diabatic heating to this weather system.
Existing reports have enhanced our understanding of the thermodynamic characteristics of the SWCV, but they only focus on the analysis of typical cases or the comparison of two cases. There is no research on the atmospheric diabatic heating characteristics of the SWCV considering multiple cases. Sichuan is the origin of the SWCV, and, under its influence, heavy rain occurs frequently in the basin. Moreover, against the background of global warming, the frequency of extremely heavy rain has increased further [24]. A total of 53 extreme rainstorm events occurred in Sichuan Basin from 1981 to 2020, among which 28 events were induced by the SWCV, which is the main system causing extreme rainstorms in the Sichuan Basin. Based on the study of the circulation background and structural characteristics of the extreme storms induced by the SWCV in the Sichuan Basin [25], we analyzed the evolution characteristics of the atmospheric diabatic heating process associated with extreme storms induced by the SWCV in the Sichuan Basin through dynamic synthesis; this could enhance our understanding of the energetics of extreme storms in the SWCV.

2. Data and Methods

2.1. Data

The data used in this study included the following: (1) the daily (12:00–12:00, 00:00–00:00 UTC) and hourly rainfall data of 156 national stations from 1981 to 2022, which were used to select extreme rainstorm cases; (2) the upper air observation data of the MICAPS of the China Meteorological Administration from 1981 to 2022, which were used to determine the cases of extreme rainstorms induced by the SWCV; (3) ERA5, the fifth-generation atmospheric reanalysis data from the European Centre for Medium-Range Weather Forecasts (ECMWF) (https://cds.climate.copernicus.eu/api/v2 (accessed on 21 June 2021)), which includes 37 layers in the vertical direction, a horizontal resolution of 0.25° × 0.25°, and a time interval of 1 h. Furthermore, we obtained the variables u, v, w, q, and t. The evolutionary characteristics of the atmospheric diabatic heating associated with extreme rainstorms caused by the SWCV in Sichuan were then analyzed.

2.2. Calculation Methods

The first law of the thermodynamics equation is introduced and the “inverse algorithm” is used to calculate the diabatic heating characteristics of the SWCV [26]:
Q 1 = C p [ T t + V T + ( P P 0 ) k ω θ p ] ,
where Q 1 is diabatic heating; C p is the specific heat at constant pressure, which is 1004.8416 J kg−1 K−1; T is the temperature; V is the horizontal wind vector; ω is the vertical wind velocity in the pressure coordinate; θ is the potential temperature; k = 0.2875; and P is the pressure, where P 0 = 1000 hPa. The first term on the right-hand side of Equation (1) is the local variation in the temperature. The second is the horizontal advection term of the temperature. The third is the vertical transport term of the temperature.
The vertically integrated diabatic heating < Q 1 > can be obtained using Equation (2).
< Q 1 > = 1 g p s p t Q 1 d p ,
where P s is the surface pressure and P t is the pressure at the top of the troposphere (usually 100 hPa).
The diabatic heating rate Q can be obtained using Equation (3), where the unit of Q is K/(6 h).
Q = Q 1 / C p = T t + V T + ( P P 0 ) k ω θ p ,
The complete-form vertical vorticity equation can be simplified by assuming that only the external heat source is retained for heating, without considering the friction dissipation and the development of tilt vorticity [27,28].
ζ t + V ζ + β v = ( 1 k ) ( f + ζ ) ω p + ( f + ζ ) Q θ + f + ζ θ z Q z 1 θ z v x Q x + 1 θ z u y Q y + R .
The terms on the right-hand side of Equation (4) represent the effect on the location of vorticity from the following: ascending motion, the heat source, spatially non-uniform diabatic heating, and the residual error ( R , consisting of frictional dissipation, slantwise vorticity development, and computational errors). In addition, u and v are the zonal and meridional horizontal wind speeds, ζ is the relative vorticity, f is the Coriolis parameter, θ z = θ z , and Q represents the diabatic heating rate in the thermodynamic equation and is calculated using Equation (3).

2.3. Dynamic Synthesis Method

Dynamic synthesis was used to analyze the common features of several typical cases. The specific methods are as follows [29].
S ¯ t ( x , y ) = 1 N n 1 N S t ( x , y ) .
In Equation (5), S ¯ t ( x , y ) is the sample mean-field; S t ( x , y ) is the physical field at time t ; and N is the total number of samples. The geometric center of each SWCV wind field at 700 hPa was taken as the central coordinate (0,0), and the grid points within 10° × 10° were used for the dynamic synthesis of the arithmetic average of the physical quantity field. The latitudinal relative coordinates from left (bottom) to right (top) represent west to east, and the meridional relative coordinates from bottom (left) to top (right) represent south to north.

2.4. Case Selection

SWCV standard: A small closed flow with cyclonic circulation on the 700 or 850 hPa isobaric surface, generated in Western Sichuan Province, with a diameter of 300–400 km [1].
According to Zhou et al.’s definition [25], for an individual case of an extreme rainstorm induced by the SWCV in the Sichuan Basin, the two following requirements should be met: one is that the rainfall in 24 h should exceed 250 mm; the other is that the system is directly affected by the SWCV during the rainfall period. The specific definition is as follows.
(1)
The daily rainfall (12–12 or 00–00 h) at one station in 156 countries is ≥250 mm, i.e., an extreme rainstorm case. When it occurs at the same time at 12–12 and 00–00 h, the maximum rainfall period is counted as an individual case, and this condition represents an extreme rainstorm case.
(2)
The SWCV appeared before the extreme rainstorm, and, during the period of the extreme rainstorm, the SWCV appeared more than 12 consecutive times in the reanalysis data at 1 h intervals. Moreover, at least one station with more than 250 mm of precipitation was within 200 km of the center of the SWCV.
According to the above criteria, there were 20 cases of extreme rainstorms induced by the SWCV in Sichuan from 1981 to 2022, and the weather circulation backgrounds were mainly divided into the “high east and low west” type and the “westerly trough” type. Among them, the “high east and low west” type was the most frequent, with 16 cases (Table 1), and the “westerly trough” type had only 4 cases.
The “east high–west low “ type refers to the following situation: the 500 hPa Western Pacific Subtropical High (hereinafter referred to as “the subtropical high”) controls the eastern region of China, while the western region exhibits a low-pressure system. The Tibetan Plateau’s low trough and the eastward-moving northwest trough jointly affect Sichuan.
To further analyze the characteristics of the extreme rainstorms induced by the SWCV, this study focuses on the analysis of 16 cases of vortex rainstorms against the background of “high east and low west” circulation. According to the area affected by the extreme rainstorm in the Sichuan Basin, it is further divided into two types, the “eastern type” and the “western type” (Figure 1), with 7 cases of the western type and 9 cases of the eastern type. The average duration of the 16 extreme rainstorms is 78.3 h. An extreme rainstorm generally occurs within 0~24 h after the formation of the Southwest China vortex [25]. The “western type” mainly occurs in July, accounting for 71.4%, and the “eastern type” occurs in June–September (Table 1).

3. Statistical Characteristics of SWCV

3.1. Analysis of Rainfall Characteristics

The two above-mentioned types of 24 h precipitation were averaged, and the SWCV’s positions at the time that the hourly rainfall was at its maximum intensity were synthesized. The “western type” extreme rainstorms were mainly located in Guangyuan, Mianyang, Deyang, Chengdu, Ya’an, Meishan, and Leshan in Central Sichuan Province (Figure 1a), while the heavy rainfall center was located in the northeast of the SWCV. The “eastern type” extreme rainstorms were located in Bazhong, Dazhou, Guang’an, Nanchong, Suining, Ziyang, Neijiang, Zigong, Yibin, and Luzhou in Eastern Sichuan Province (Figure 1b), and the heavy rainfall center was located in the east of the SWCV.
To examine the relationship between the locations of the SWCV and the extreme rainfall center, the position of the maximum hourly precipitation and the SWCV at the previous time were superimposed (Figure 2). The maximum precipitation occurred within 150 km of the SWCV’s center. In contrast, the maximum precipitation center was mainly located in the southeastern quadrant of the SWCV (eight times, accounting for 50% of the total), followed by the northeastern quadrant (five times, accounting for 31% of the total), with both quadrants accounting for a total of 81%. However, there were two occurrences in the northwestern quadrant and one occurrence in the southwestern quadrant, accounting for 12.5% and 6.2%, respectively, amounting to a total of 18.7%. This indicated that the maximum precipitation from extreme rainstorms induced by the SWCV in Sichuan Province mainly occurred in the fourth and first quadrants within the eastern half of the vortex; this asymmetry resulted in different thermodynamic and dynamic interactions.

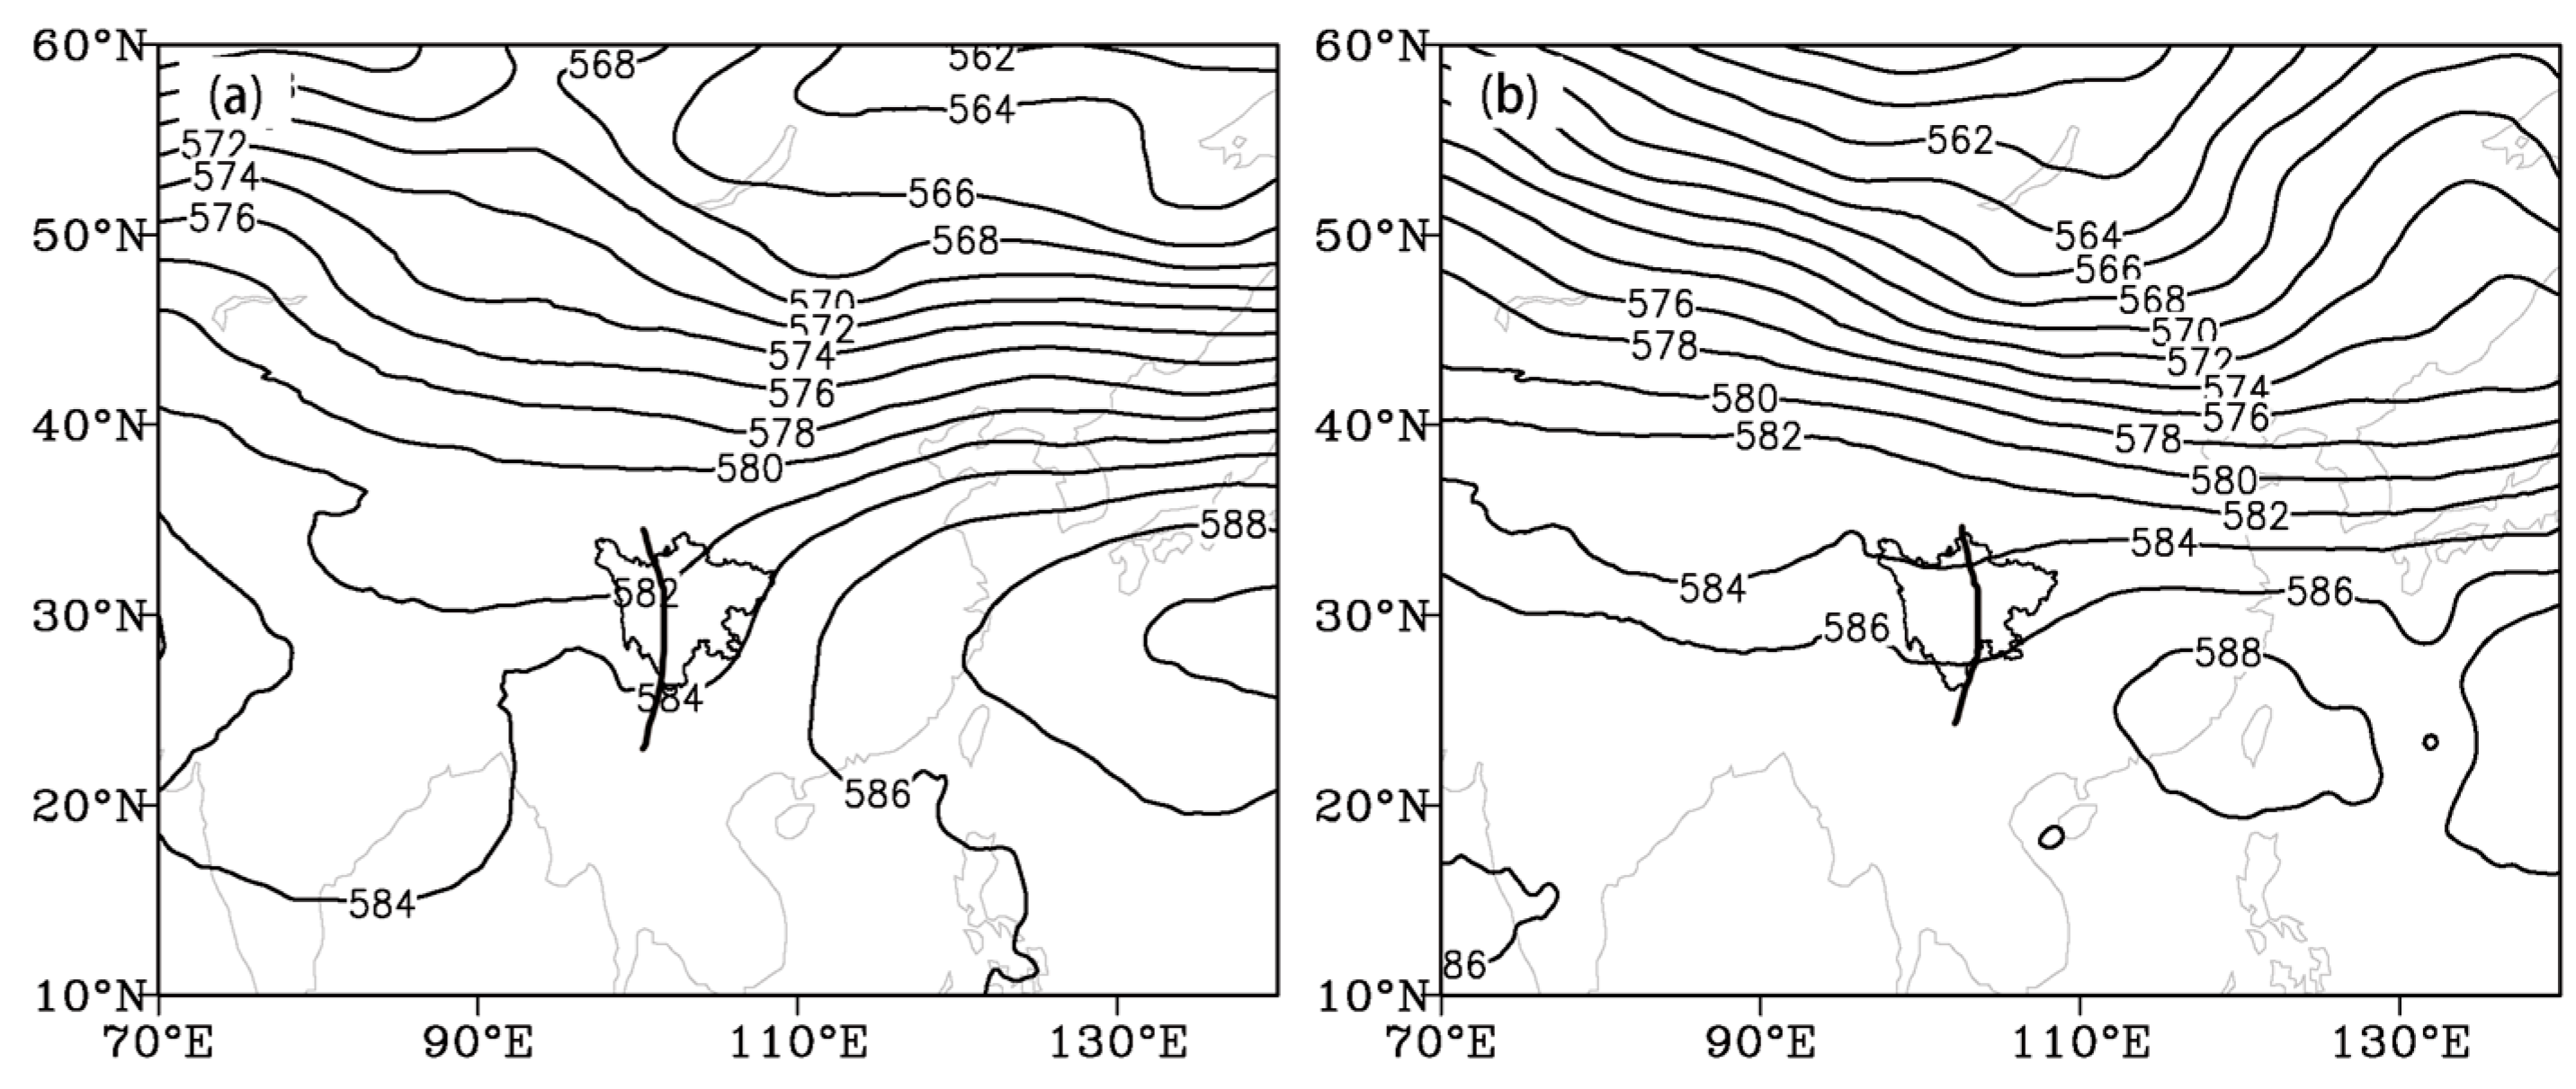
3.2. Analysis of Circulation Background Characteristics

The composite distribution of the 500 hPa circulation at the time of the maximum rainfall intensity during the extreme rainstorm process (Figure 3) showed that the circulation situation in both types of extreme weather belonged to the “high east and low west” type; however, there were some differences. The subtropical high of the extreme rainstorm process in the “western type” exhibited a “block pattern” on the eastern coast of China, and the blocking situation was more significant. The western ridge point of the subtropical high’s 588 dagpm line was located at 120° E, the ridge position was near 30° N, and the Tibetan Plateau trough was combined with an upper trough to affect Sichuan. The subtropical high of the extreme rainstorm process in the “eastern type” was more westward, with the western ridge point at 110° E, and the ridge line was further south near 25° N, showing an east–west “zonal belt pattern” distribution. The Tibetan Plateau trough was also weaker than that of the “western type”, and Sichuan was affected by the eastward plateau trough.

4. Distribution Characteristics of Diabatic Heating

Wu et al. [28] demonstrated the importance of diabatic heating in the development of the SWCV, and they determined both its life cycle length and the strength of its development. To analyze the evolutionary characteristics of the extreme rainstorm weather induced by the SWCV in its different periods, we considered the occurrence time of extreme rainstorms as the initial stage, the hourly maximum precipitation time of the central rainstorm station as the vital stage, and the end time of extreme precipitation as the end stage (Table 1). A dynamic composite analysis was conducted on the cases of the “western type” and “eastern type” extreme rainstorms induced by the SWCV in Sichuan Province, aiming to obtain the thermal characteristics of different precipitation regions with a similar circulation background.

4.1. Evolution of Diabatic Heating < Q >

Diabatic heating plays an essential role in the occurrence and development of the SWCV. Atmospheric diabatic heating is the primary thermodynamic forcing factor for the variations in atmospheric circulation and in weather systems [30]. Figure 4 illustrates the changes in the regional average vorticity at 700 hPa and the regional average < Q > before and after the extreme rainstorms induced by the SWCV. The research of Zhu et al. [1] shows that the SWCV is a mesoscale system of 300–400 km. Therefore, in this study, the geometric center of the 700 hPa SWCV wind field is selected as the center of the circle, and the area with two longitudes and latitudes as the radius is averaged. Figure 4 shows that the dynamic uplift effect of the positive vorticity was significant during the initial stage of precipitation. As the latent heat of precipitation condensation was released, the < Q > was rapidly enhanced, which further enhanced the positive vorticity via a positive feedback mechanism. Consequently, it entered the vital stage of precipitation, with the < Q > and positive vorticity reaching their peaks. The positive vorticity and < Q > were weakened in the later precipitation end stage. Notably, the sharp strengthening (weakening) of the < Q > preceded the strengthening (weakening) of the positive vorticity. The < Q > of the “western type” was more significant than that of the “eastern type”.

4.2. Horizontal Distribution of Diabatic Heating

During the initial stage of the “western type” (Figure 5a), the geopotential height of the 700 hPa SWCV center (the geometric center of the 700 hPa SWCV wind field) was 306 dagpm. At this time, the isobars were sparse and the wind speed on the southeastern side of SWCV was significantly stronger than that on the northwestern side. The < Q > was located in the center and northeast of the SWCV, with a zonal distribution in the northeast–southwest direction, and its maximum value was 400 W.m−2. During the vital stage (Figure 5b), the SWCV’s intensity increased, the geopotential height was 305.5 dagpm, and the isobar density intensified. The outermost closed isobar was 307.5 dagpm, and the < Q > above was enhanced to 800 W.m−2. The heating area was maintained at the center of the SWCV and at the intersection of the southeastern and northwestern airflow in the northeast, which was consistent with the location of the synthetic precipitation area. During the end stage (Figure 5c), the intensity of the SWCV’s center weakened and the geopotential height increased to 307 dagpm. The range and intensity of the < Q > significantly decreased, the < Q > was only maintained in a small area of the SWCV’s center and the southeast, and the maximum value also declined to 400 W.m−2.
During the initial stage of the “eastern type” (Figure 5d), the SWCV’s intensity (at the central potential height of 308.5 dagpm) and the scope and intensity of the < Q > were weak. Heating was restricted to the center of the SWCV and a small area of southwestern airflow on its eastern side, with the maximum heating of only 200 W.m−2. During the vital stage (Figure 5e), the geopotential height field of the SWCV remained at 308.5 dagpm; however, the isobaric lines became densely packed, and the < Q > was enhanced, reaching the maximum value of 700 W.m−2. The heating area was located in the center of the SWCV with the southwestern airflow on its eastern side, which was consistent with the location of synthetic precipitation. During the end stage (Figure 5f), the strength of the SWCV’s center weakened, the geopotential height increased by 0.5 dagpm, and the range and intensity of the < Q > decreased, with the maximum heating reduced to 400 W.m−2. The central heating area of the SWCV disappeared, and the heating continued only within a small area of the southwestern airflow on its eastern side.
In summary, the variation characteristics of < Q > were consistent during the two types of SWCV-associated extreme rainstorm weather. The position of the < Q > region was consistent with that of the heavy rainfall region, but the intensity and range of the two heating areas differed. The heating intensity of the “western type” was greater, and this may have been related to the higher rainfall intensity of the “western type” (Figure 1a). The heating area in the vital stage was located in the center and the northeast of the SWCV, exhibiting a northeast–southwest zonal distribution, whereas the heating intensity of the “eastern type” was relatively weak, and the heating area was located in the center of the SWCV and the small range of southwestern airflow on its eastern side.

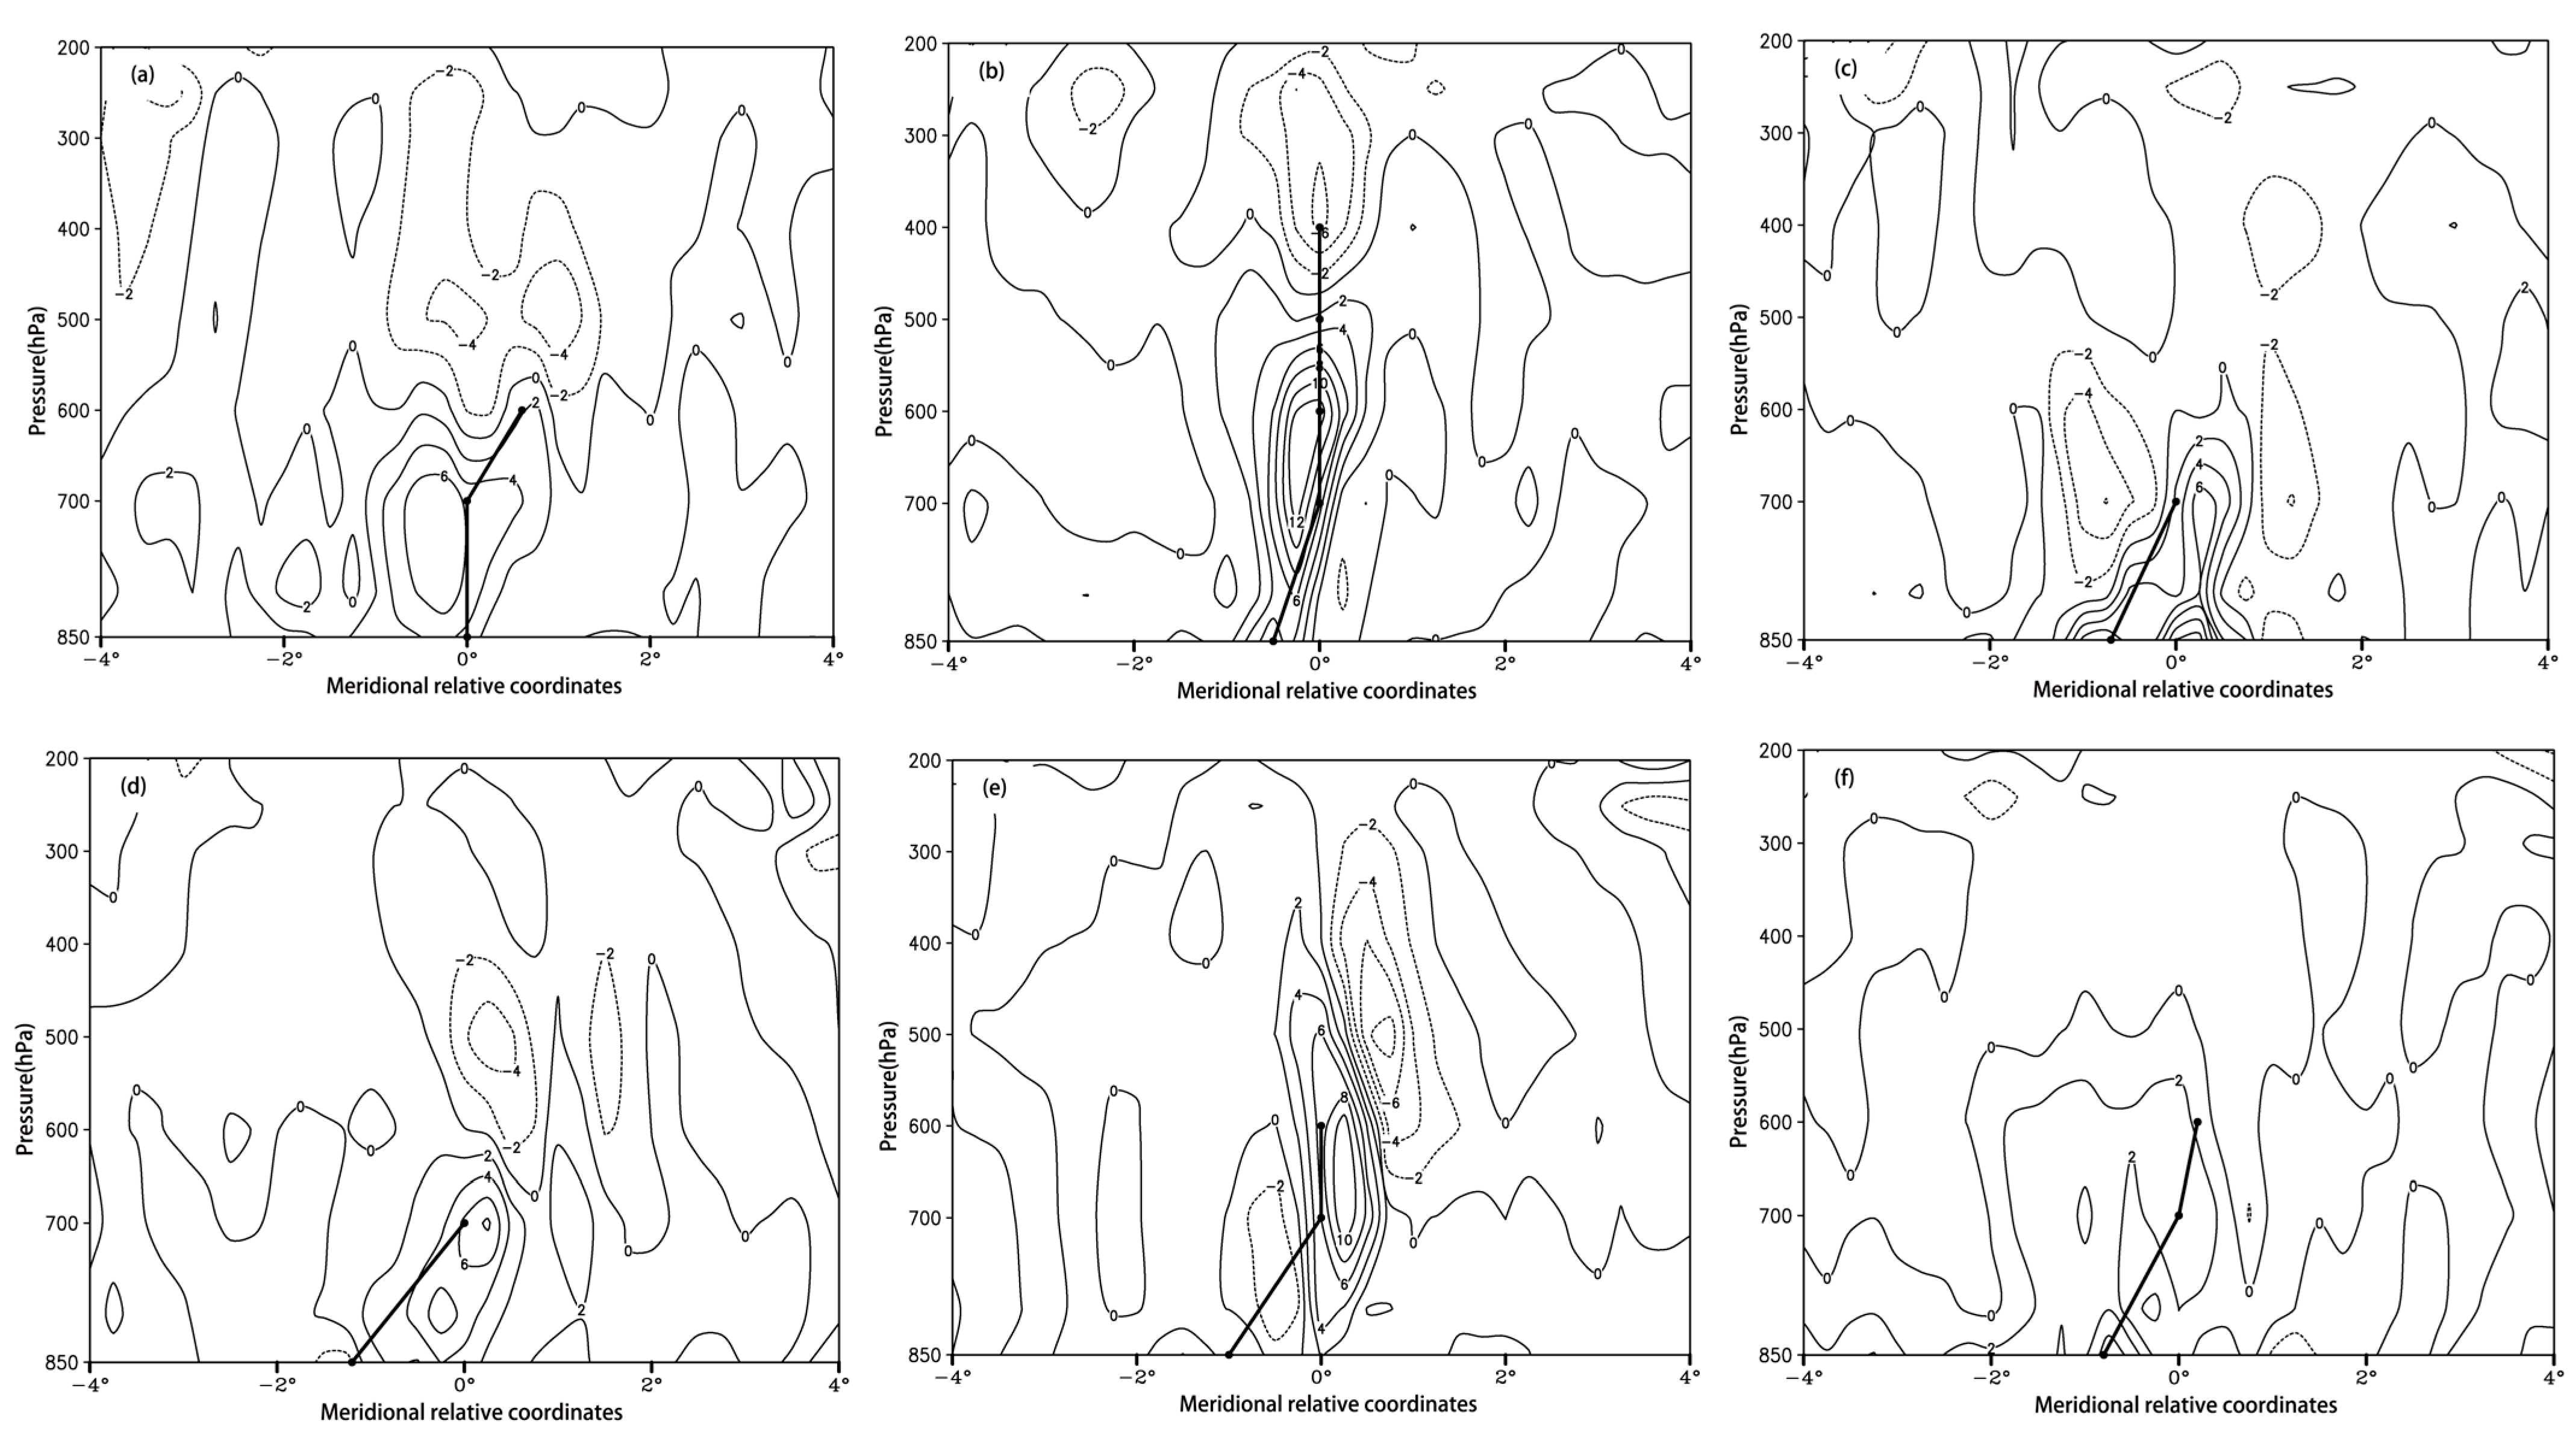
4.3. Vertical Distribution of Diabatic Heating Rate

Figure 6 shows the latitude–height profile distribution of the vertical variation in the diabatic heating rate and vorticity (note: the longitudinal–height profile distribution is omitted). During the initial stage of the “western type” (Figure 6a), the geopotential height of the cyclone circulation of the SWCV developed to 600 hPa and its vortex center slightly tilted to the northwest with the height. The positive vorticity center of the SWCV was located at 700 hPa, its intensity reached 10 × 10−5 s−1, and its height developed to approximately 450 hPa. The SWCV became a diabatic heating rate area, and the heating rate center was located near 600 hPa, above which the maximum heating rate was 4 K/(6 h). The heating rate center exhibited a higher value than the positive vorticity center. During the vital stage (Figure 6b), the SWCV developed continuously, the height of cyclone circulation reached 400 hPa, and its vortex center extended vertically with the altitude. The positive vorticity and the heating rate also significantly increased; the center of positive vorticity increased to 600 hPa, and the center value increased to 12 × 10−5 s−1. The heating rate increased to 6 K/(6 h), and the height of the heating rate center remained greater than that of the positive vorticity center. During the end stage (Figure 6c), the height of cyclone circulation in the SWCV dropped to 700 hPa, and the vortex center was slightly inclined to the northwest with the height. The positive vorticity intensity increased by 20 × 10−5 s−1; however, the center height dropped to the boundary layer, while the negative vorticity in the lower layer on the northwestern side also increased. In addition, the heating rate was significantly weakened.
During the initial stage of the “eastern type” (Figure 6d), the SWCV’s cyclonic circulation developed to 700 hPa, and the vortex center tilted to the northwest with the height. The positive vorticity height developed to 400 hPa, the heating rate center was located at 700 hPa, and the intensity reached 14 × 10−5 s−1. There was a heating rate area above the SWCV, while the heating rate center was located at 600 hPa with a central value of 3 K/(6 h). The heating rate center’s height was higher than that of the positive vorticity center. During the vital stage (Figure 6e), the geopotential height of the SWCV’s cyclonic circulation developed to 600 hPa and the vortex center was maintained at a northwestern tilt with the height. At this time, the positive vorticity increased to 18 × 10−5 s−1 and the central value of the heating rate increased to 4 K/(6 h). During the end stage (Figure 6f), the geopotential height of the SWCV’s cyclonic circulation increased to 600 hPa and it tilted toward the northwest with the height, the positive vorticity weakened to 12 × 10−5 s−1, the heating rate was also weakened, and the heating rate center was located far from the SWCV’s center.
The diabatic heating rates for both types of SWCV systems were significant. All SWCV centers exhibited a vertical structure that tilted to the northeast with the altitude; however, in the vital stage of the “western type”, the center extended vertically with the altitude. The heating rate peaked at the strongest level of precipitation, and the height of the heating rate center was higher than that of the positive vorticity center. Overall, the vertical distribution range, height, and intensity of the heating rate in the “western type” were significantly greater than those in the “eastern type”; however, the positive vorticity intensity in the “eastern type” was stronger than that in the “western type”.

4.4. Diabatic Heating Rate Components

Equation (4) shows that the Q obtained via the “inverse algorithm” is subject to the combined effect of the local variation in the temperature term, the horizontal advection variation term of the temperature, and the vertical transport term of the temperature. Thus, a question arises: during the intensity evolution of the SWCV, which one of the components contributes the most to the Q ?
Here, with the center of the SWCV at 700 hPa as the origin and ±2° longitude and latitude as the radius, regional averaging was performed to analyze the vertical distribution characteristics of the diabatic heating rate components.
Figure 7 shows that the distribution trends of the different components in the two types were consistent at each stage of the extreme rainstorm weather caused by the SWCV. The horizontal advection term of the diabatic heating rate had little change, mainly due to the prominent role of the vertical transport term in the diabatic heating rate. The variations in the diabatic heating rate of the “western type” are shown in Figure 7a–c. The horizontal advection term of the heating rate had almost no effect, and the heating rate of the local variation term was minimal in the initial stage and slightly increased in the vital and end stages; however, both contributed negatively. The vertical transport term was the primary contributor to the diabatic heating rate, and the heating rate significantly increased in the vital stage; the maximum value was located at 400 hPa in the upper troposphere with a heating rate of 1.5 K/(6 h), reflecting the critical impact of the vertical transport of water vapor in the SWCV and the positive feedback effect of the precipitation–condensation latent heat release. The vertical distributions of the “eastern type” are shown in Figure 7d–f. Similarly, the horizontal advection term of the heating rate was almost zero, and the transport term of its local variation had a negligible effect. The vertical transport term played a prominent role and had the most significant effect in the vital stage. The maximum value was located at 500 hPa in the upper troposphere, with a heating rate of 1 K/(6 h); however, the vertical transport effect of the heating rate was smaller than that of the “western type”.
In summary, the variations in the vertical distribution of the diabatic heating rate were consistent in the two types. The contribution of the horizontal advection variation term of the temperature to the heating rate in the SWCV region was minimal, indicating that warm and humid advection transport mainly occurred in the external atmospheric environment of the vortex system. The local variation term of the temperature was minimal and made a negative contribution in all stages besides the vital and end stages of the “western type”, during which there were slight increases. The variation in the diabatic heating rate was mainly due to the positive contribution of its vertical transport term.

5. Effect of Non-Uniform Heating for the SWCV

According to Wu et al. [28], the magnitude of the vorticity advection term in Equation (4) was 10−10 s−2, the magnitude of the β effect term was 10−10 s−2, the magnitude of the heat source was 10−10 s−2, and the magnitude of the spatially non-uniform heating effect was 10−9 s−2. On this basis, the influence of spatially non-uniform heating on the SWCV was analyzed.
Figure 8 shows that there was a weak spatially non-uniform heating effect 18 h prior to the extreme precipitation, and this gradually increased with time, with a corresponding increase in vorticity in the initial stage. Subsequently (6 h prior to the extreme precipitation), the spatially non-uniform heating effect and the cyclonic positive vorticity increased. In the vital stage (0 h prior to the extreme precipitation), the spatially non-uniform heating effect and positive vorticity reached their peak values. At the time of the maximum hourly precipitation, the spatially non-uniform heating effect and vorticity also peaked. Subsequently (6 h after the extreme precipitation), the spatially non-uniform heating rapidly decreased and was in a state of weak heating and vorticity reduction. In the end stage (12 h after the extreme precipitation), the spatially non-uniform heating effect was at a low point, whereby it weakened unstably, and the vorticity of the SWCV continued to weaken, reaching the lowest point of negative vorticity. Therefore, the local variation term of the vorticity in the SWCV region was closely related to the variations in the spatially non-uniform heating effect and both had consistent characteristics. The specific impact of the spatially non-uniform heating effect on the strength of the SWCV is discussed below.

5.1. Effect of Spatially Non-Uniform Heating

Considering the latitude–height profile of the spatially non-uniform heating effect as an example (note: the longitudinal–height profile is omitted), the spatially non-uniform heating effect developed within the SWCV system and was asymmetrical. The spatially non-uniform heating effect was the most significant in the vital stage of extreme rainstorms; however, the two types differed. During the initial stage of the “western type” (Figure 9a), the spatially non-uniform heating effect was mainly below 600 hPa, and the heating effect developed asymmetrically in a southeast–northwest direction. The largest heating area value tended to be found in the southeast of the SWCV, with a peak value of 6 × 10⁻⁹ s−2, and it was negative above 600 hPa. This type of spatially non-uniform heating effect increased the positive vorticity in the lower layer and the negative vorticity in the upper layer. During the vital stage (Figure 9b), the spatially non-uniform heating effect on the southeastern and northwestern sides was asymmetrically enhanced, the height of the heating area increased to 450 hPa, the maximum spatially non-uniform heating effect below it doubled to 12 × 10−9 s−2, and the negative value of the upper troposphere above it also increased. This resulted in an increase in the thermal effect of the synchronous enhancement between the positive vorticity in the middle–lower layers and the negative vorticity in the upper layer. During the end stage (Figure 9c), the asymmetric distribution of the spatially non-uniform heating effect was maintained; however, the large-value area moved to the northwest of the SWCV, and the heating area dropped below 650 hPa. Although the spatially non-uniform heating effect in the near-surface layer was maintained, the negative area above it weakened or disappeared.
During the initial stage of the “eastern type” (Figure 9d), the positive region of spatially non-uniform heating was below 600 hPa; however, it developed asymmetrically in both the northeast and the southwest, and the largest area of spatially non-uniform heating was located northeast of the SWCV with a maximum value of 8 × 10⁻⁹ s−2. The heating effect resulted in the development of the positive vorticity of the SWCV, and there was a corresponding −4 × 10⁻⁹ s−2 cooling effect area above 600 hPa over the SWCV, thereby increasing the negative vorticity. During the vital stage (Figure 9e), the spatially non-uniform heating effect maintained the asymmetric development of the northeastern and southwestern sides, the intensity increased to 10 × 10−9 s−2, the height increased to 350 hPa, and the cooling effect area moved to the north of the SWCV. During the end stage (Figure 9f), the spatially non-uniform heating significantly weakened, thereby reducing the SWCV’s intensity.
The two types of spatially non-uniform heating effects were similar, and the heating effect was strongest in the vital stage. The largest heating effect region of the “western type” was located in the southeast of the SWCV and asymmetrically distributed on the southeastern and northwestern sides, so that the large positive vorticity region of the SWCV was distributed on its southeastern side (Figure 6a,b). The largest spatially non-uniform heating effect area of the “eastern type” was located in the northeast of the SWCV and asymmetrically distributed on the northeastern and southwestern sides, with the positive vorticity of the SWCV distributed mainly on its northeastern side (Figure 6d,e).

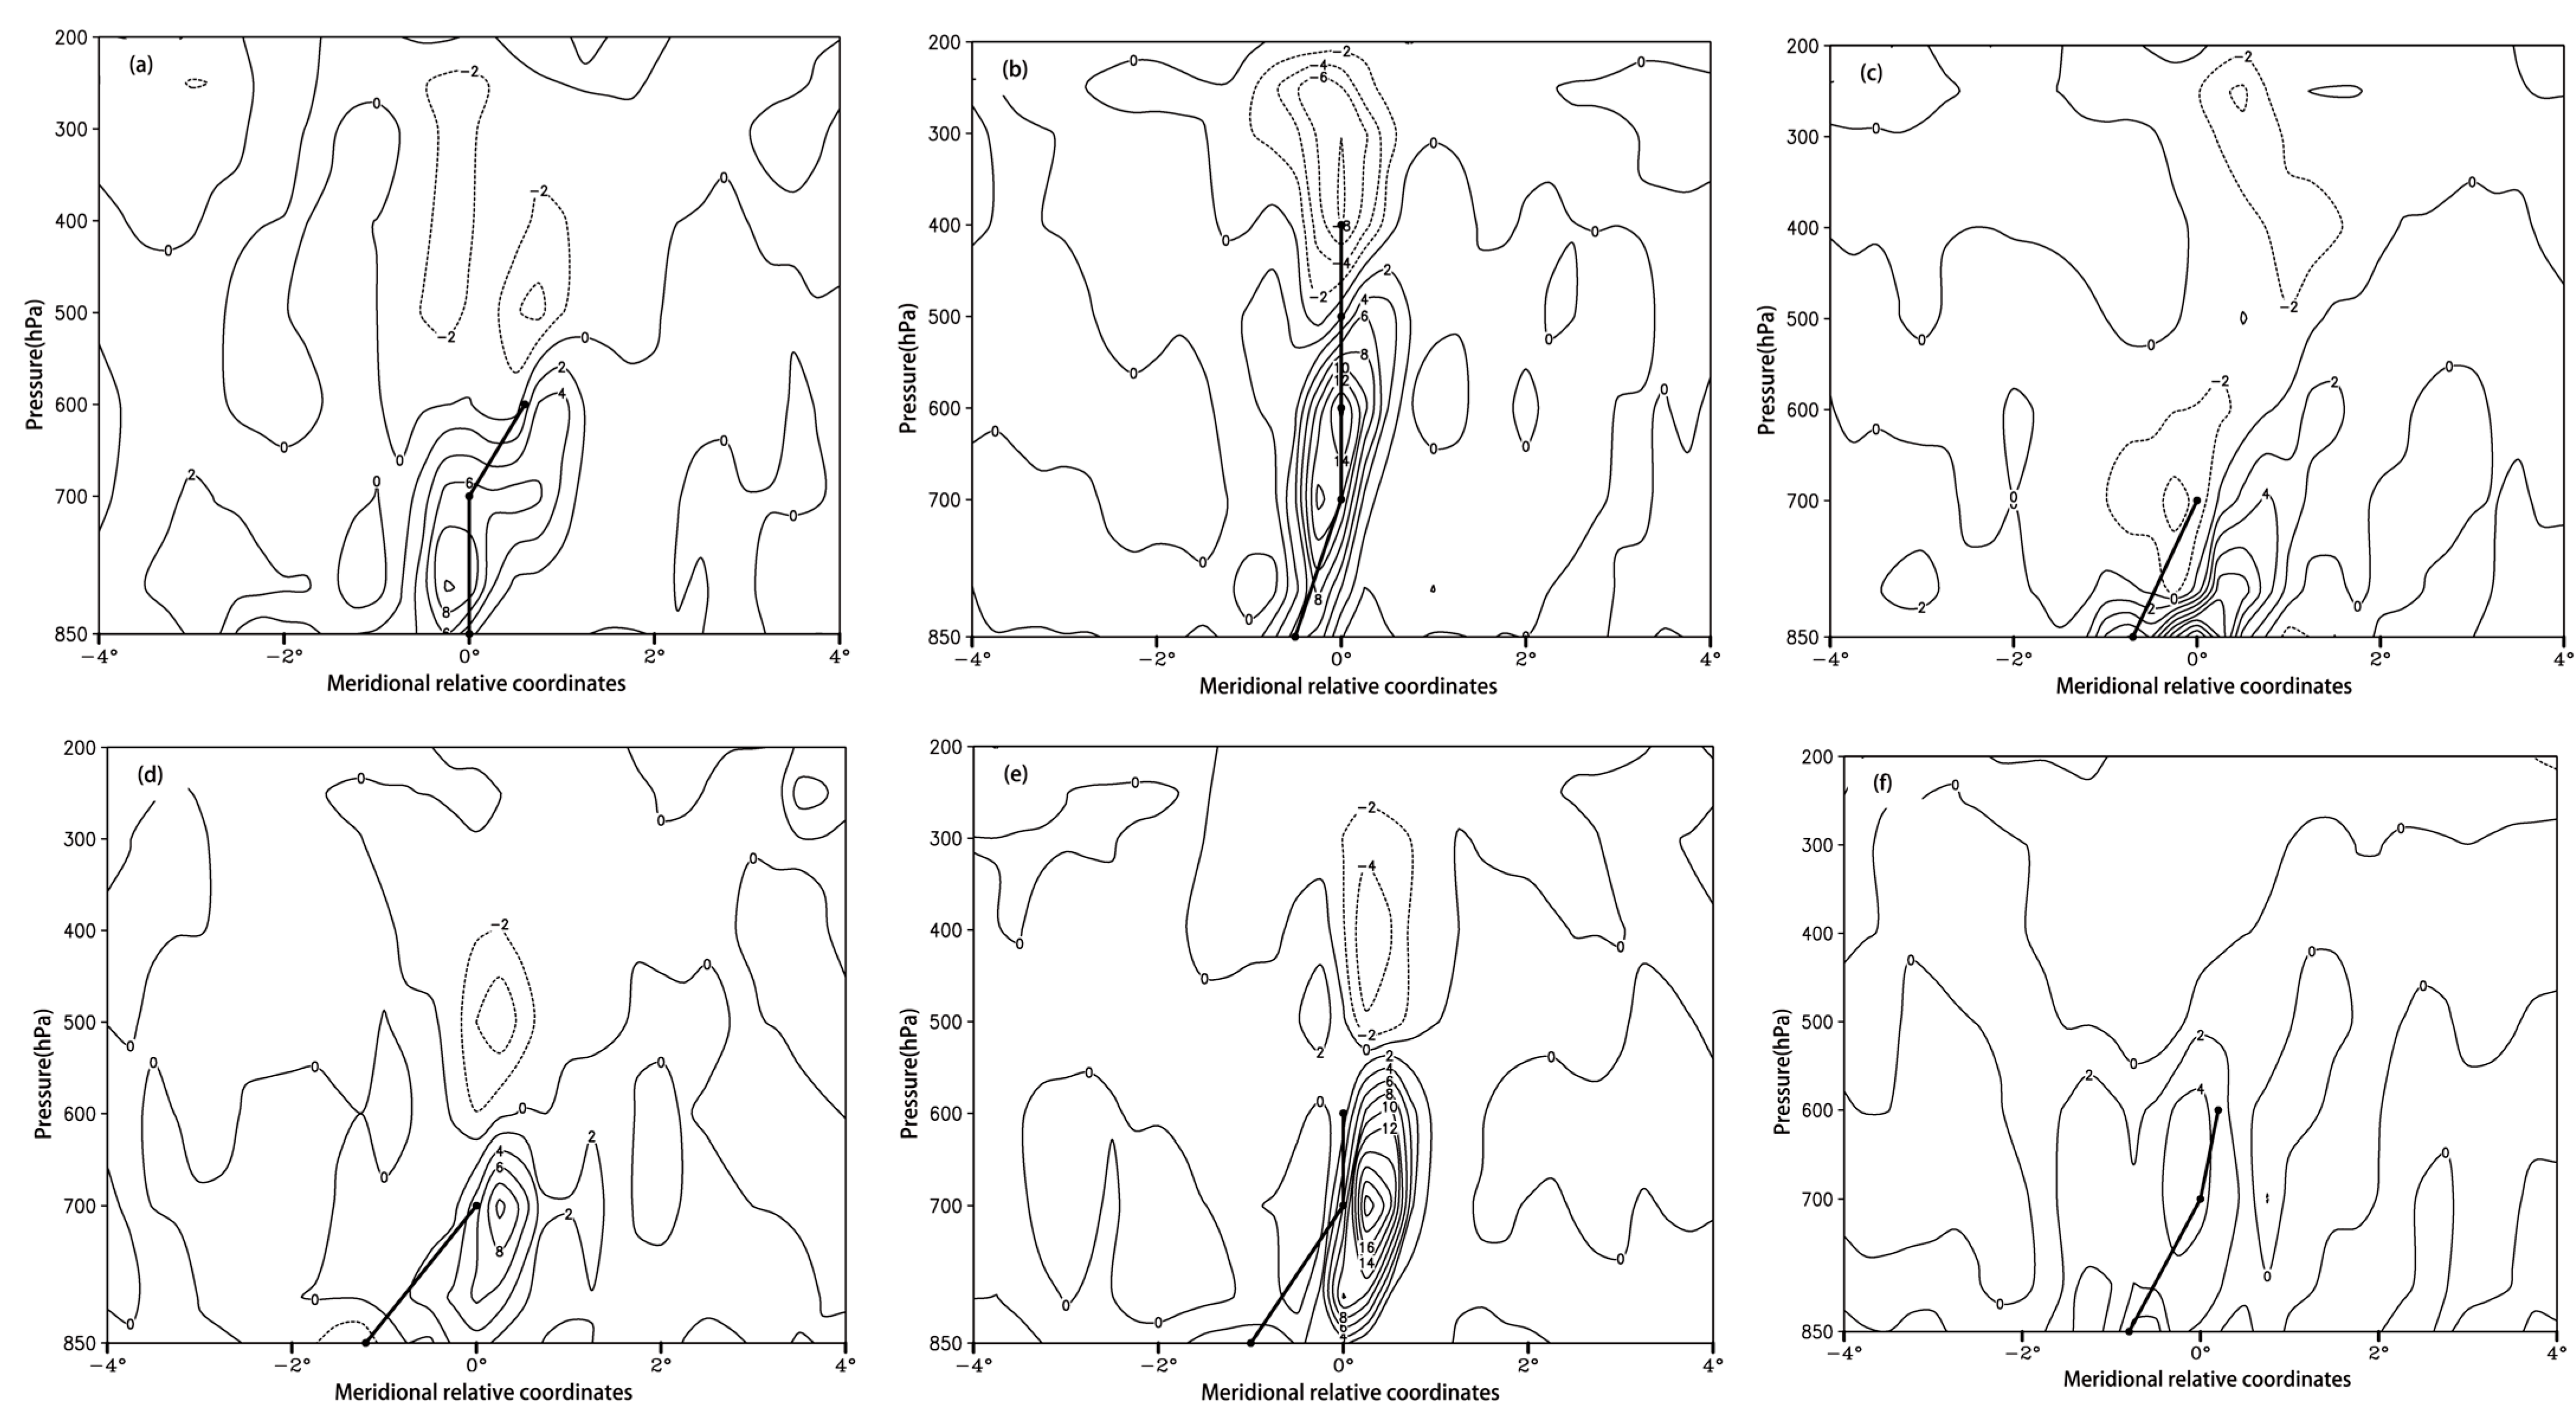
5.2. Effect of Vertically Non-Uniform Heating

According to Yao et al. [15], vertically non-uniform heating plays a decisive role in vorticity development. If f + ζ θ z Q z > 0 , a positive vorticity source is generated, which is conducive to vorticity growth and development; otherwise, the vorticity decreases.
Figure 10a–f show that the distribution trends of the vertically and spatially non-uniform heating effects in the two types were almost identical and that the vertically non-uniform heating effect was larger than the spatially non-uniform heating effect. This indicates that the vertically non-uniform heating term played a decisive role in the distribution and evolution of the spatially non-uniform heating term. The vertically non-uniform heating effect was one of the primary mechanisms underlying the variation in the SWCV’s intensity, which is consistent with the analyses of Yao et al. [15]. In addition, the vertically non-uniform heating effect of the “eastern type” was more substantial in the vital stage, strengthening the SWCV’s positive vorticity development. This resulted from baroclinic instability and was conducive to vertical growth relating to the intrusion of cold air in the “eastern type” and the intersection of warm and cold air. Vertical atmospheric thermodynamic–dynamic evolution is the most essential feature of severe convective weather, such as the extreme rainstorms caused by the SWCV. The vertical structures, differences, and evolutions of local water vapor, heat, momentum, and other physical quantity fields are significant, and the effect of vertically non-uniform heating mainly reflects the spatially non-uniform heating.

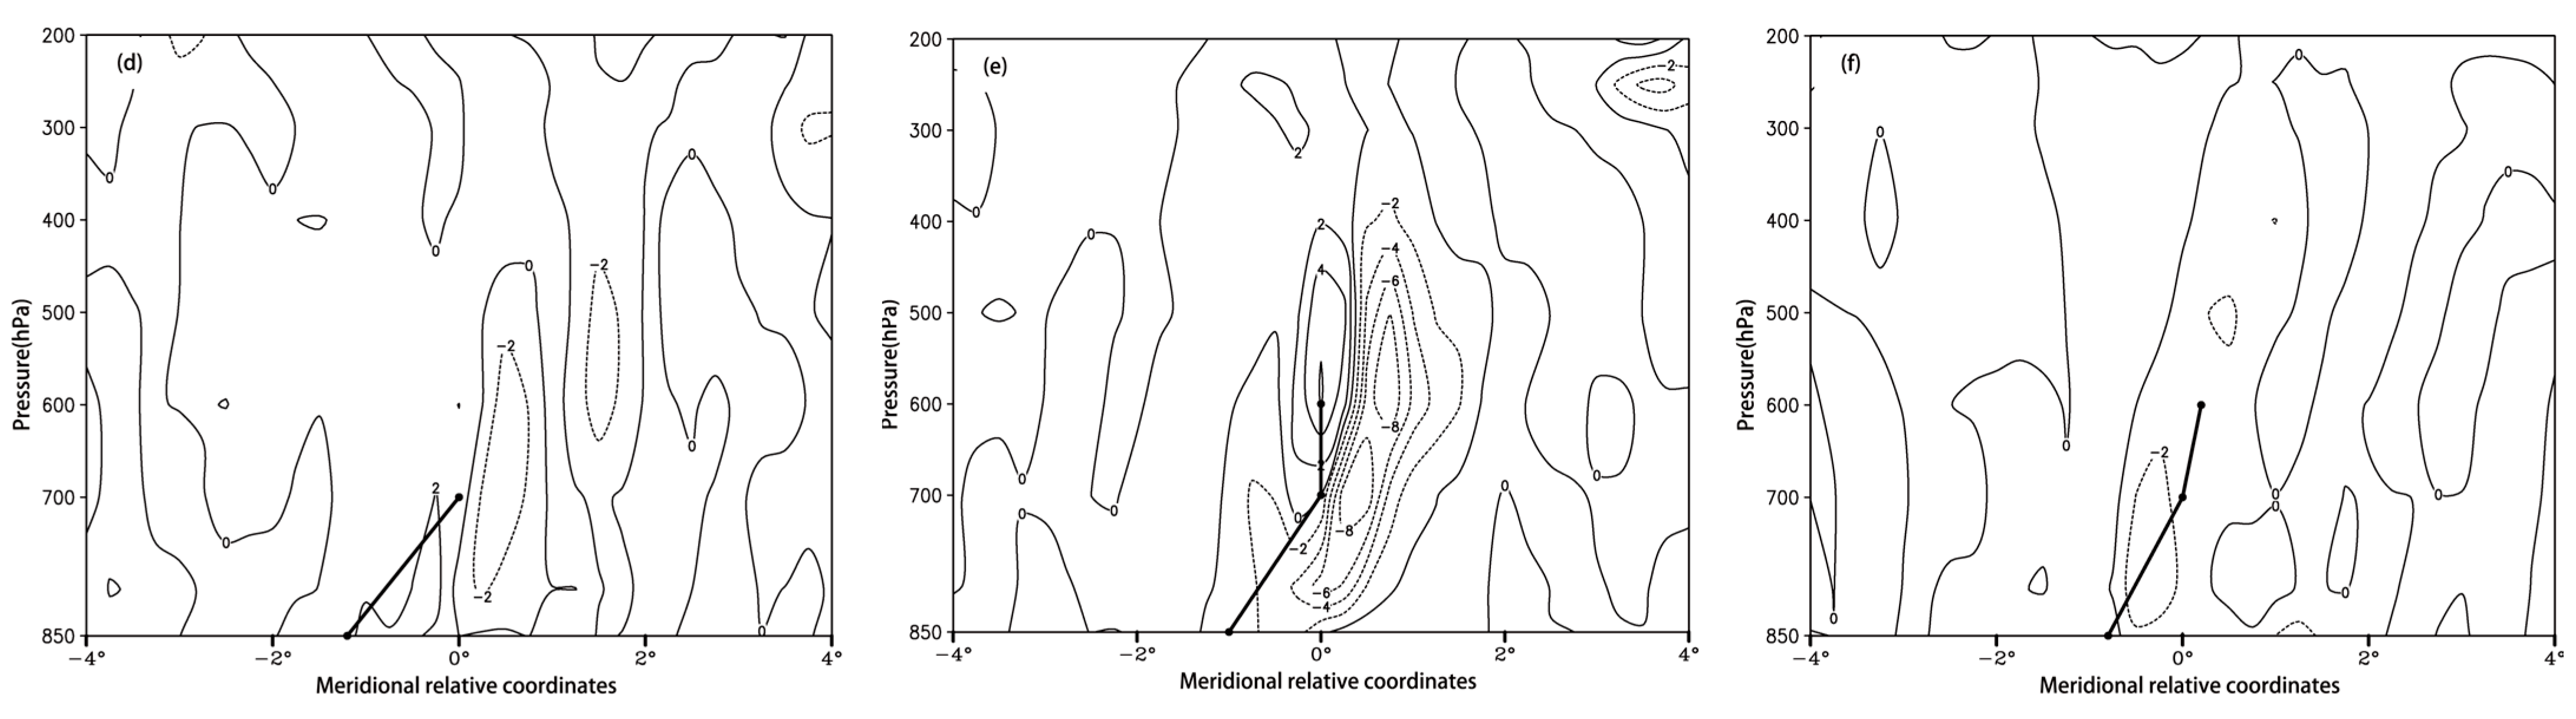
5.3. Effect of Horizontally Non-Uniform Heating

The above analysis demonstrates that vertically non-uniform heating mainly contributed to spatially non-uniform heating. According to Wu et al. [28] and Yao et al. [15], the horizontally non-uniform heating effect was one to two orders of magnitude smaller than the vertically non-uniform heating effect. However, the relative effect of horizontally non-uniform heating on the extreme rainstorms induced by the SWCV requires elucidation.
Figure 11 shows the horizontally non-uniform heating distribution of the three stages of the extreme rainstorm weather caused by the SWCV. During the initial stage of the “western type” (Figure 11a), the horizontally non-uniform heating effect had significant asymmetry, and the heating effect occurred in the southeast of the SWCV and the cooling effect occurred in the northwest. The asymmetry of the horizontally non-uniform heating increased the positive vorticity in the southeast of the SWCV and reduced that in the northwest, further strengthening its asymmetry. During the vital stage (Figure 11b), the horizontally non-uniform heating effect in the southeast of the SWCV was slightly weakened; however, it remained conducive to an increase in positive vorticity in the southeast, maintaining the cooling effect in the northwest of the SWCV and its center. During the end stage (Figure 11c), the horizontally non-uniform heating effect around the center of the SWCV was positive, increasing the positive vorticity of the SWCV.
During the initial stage of the “eastern type” (Figure 11d), the SWCV region was controlled by weak positive horizontally non-uniform heating. During the vital stage (Figure 11e), the northwest of the SWCV became a strong cooling area, which reduced the positive vorticity of the SWCV. The horizontally non-uniform heating area increased to 4 × 10⁻⁹ s−2 in the southeast and its positive vorticity also increased, which enhanced the asymmetry of the SWCV. During the end stage (Figure 11f), the horizontally non-uniform heating effect around the SWCV occurred in negative areas, which reduced the positive vorticity of the SWCV.
To summarize, the effects of horizontally and vertically non-uniform heating were contrasting within the range of the SWCV. In the vital stage, the positive (negative) value region of horizontally non-uniform heating corresponded to the negative (positive) value region of vertically non-uniform heating; however, the intensity of vertically non-uniform heating was significantly stronger than that of horizontally non-uniform heating. Although horizontally non-uniform heating was not a significant contributor to spatially non-uniform heating, its magnitude was similar to that of vertically non-uniform heating; this situation differs slightly from that previously reported [16]. This reiterates that the extreme rainstorm weather induced by the SWCV, particularly in the initial and vital stages, was mainly characterized by the vertically non-uniform heating effect related to the dynamic action of the SWCV, the convergence of and rise in water vapor, and the release of the latent heat of precipitation–condensation, while horizontally non-uniform heating was secondary.

6. Conclusions and Discussion

Using meteorological data from the period 1981–2022, 16 typical extreme rainstorms in Sichuan Province, caused by the SWCV, were selected in the context of the “high east and low west” type of circulation. Based on statistical research, physical diagnosis, and mechanism analysis, the evolutionary characteristics and impact mechanisms of diabatic heating, the SWCV system, and its precipitation were revealed under two circulation types (the “western type” and the “eastern type”), and important insights were obtained. The main conclusions are as follows.
(1)
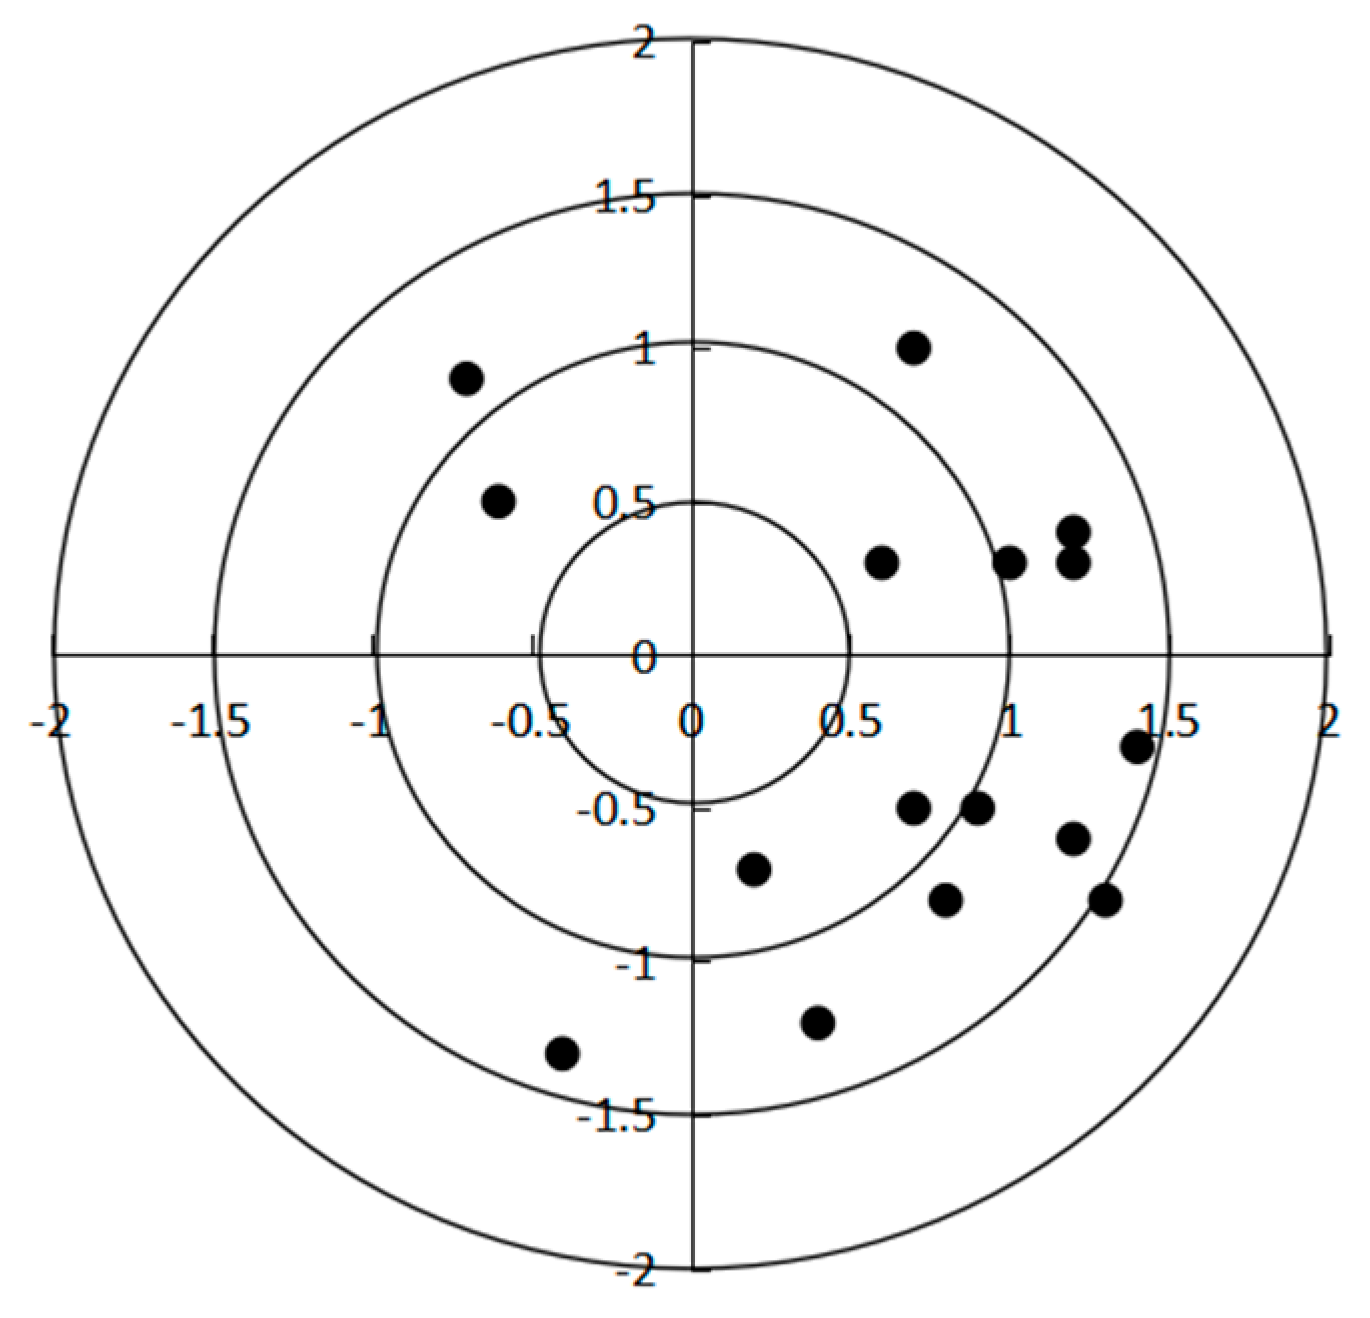
The maximum precipitation centers were all within 150 km of the SWCV’s center; 50% were located in the southeastern quadrant and 31% were located in the northeastern quadrant. The eastern half of the SWCV was the primary area of maximum precipitation in terms of the extreme rainstorm weather caused by the SWCV; this demonstrates the asymmetry in the distribution of the extreme precipitation caused by the SWCV.
(2)
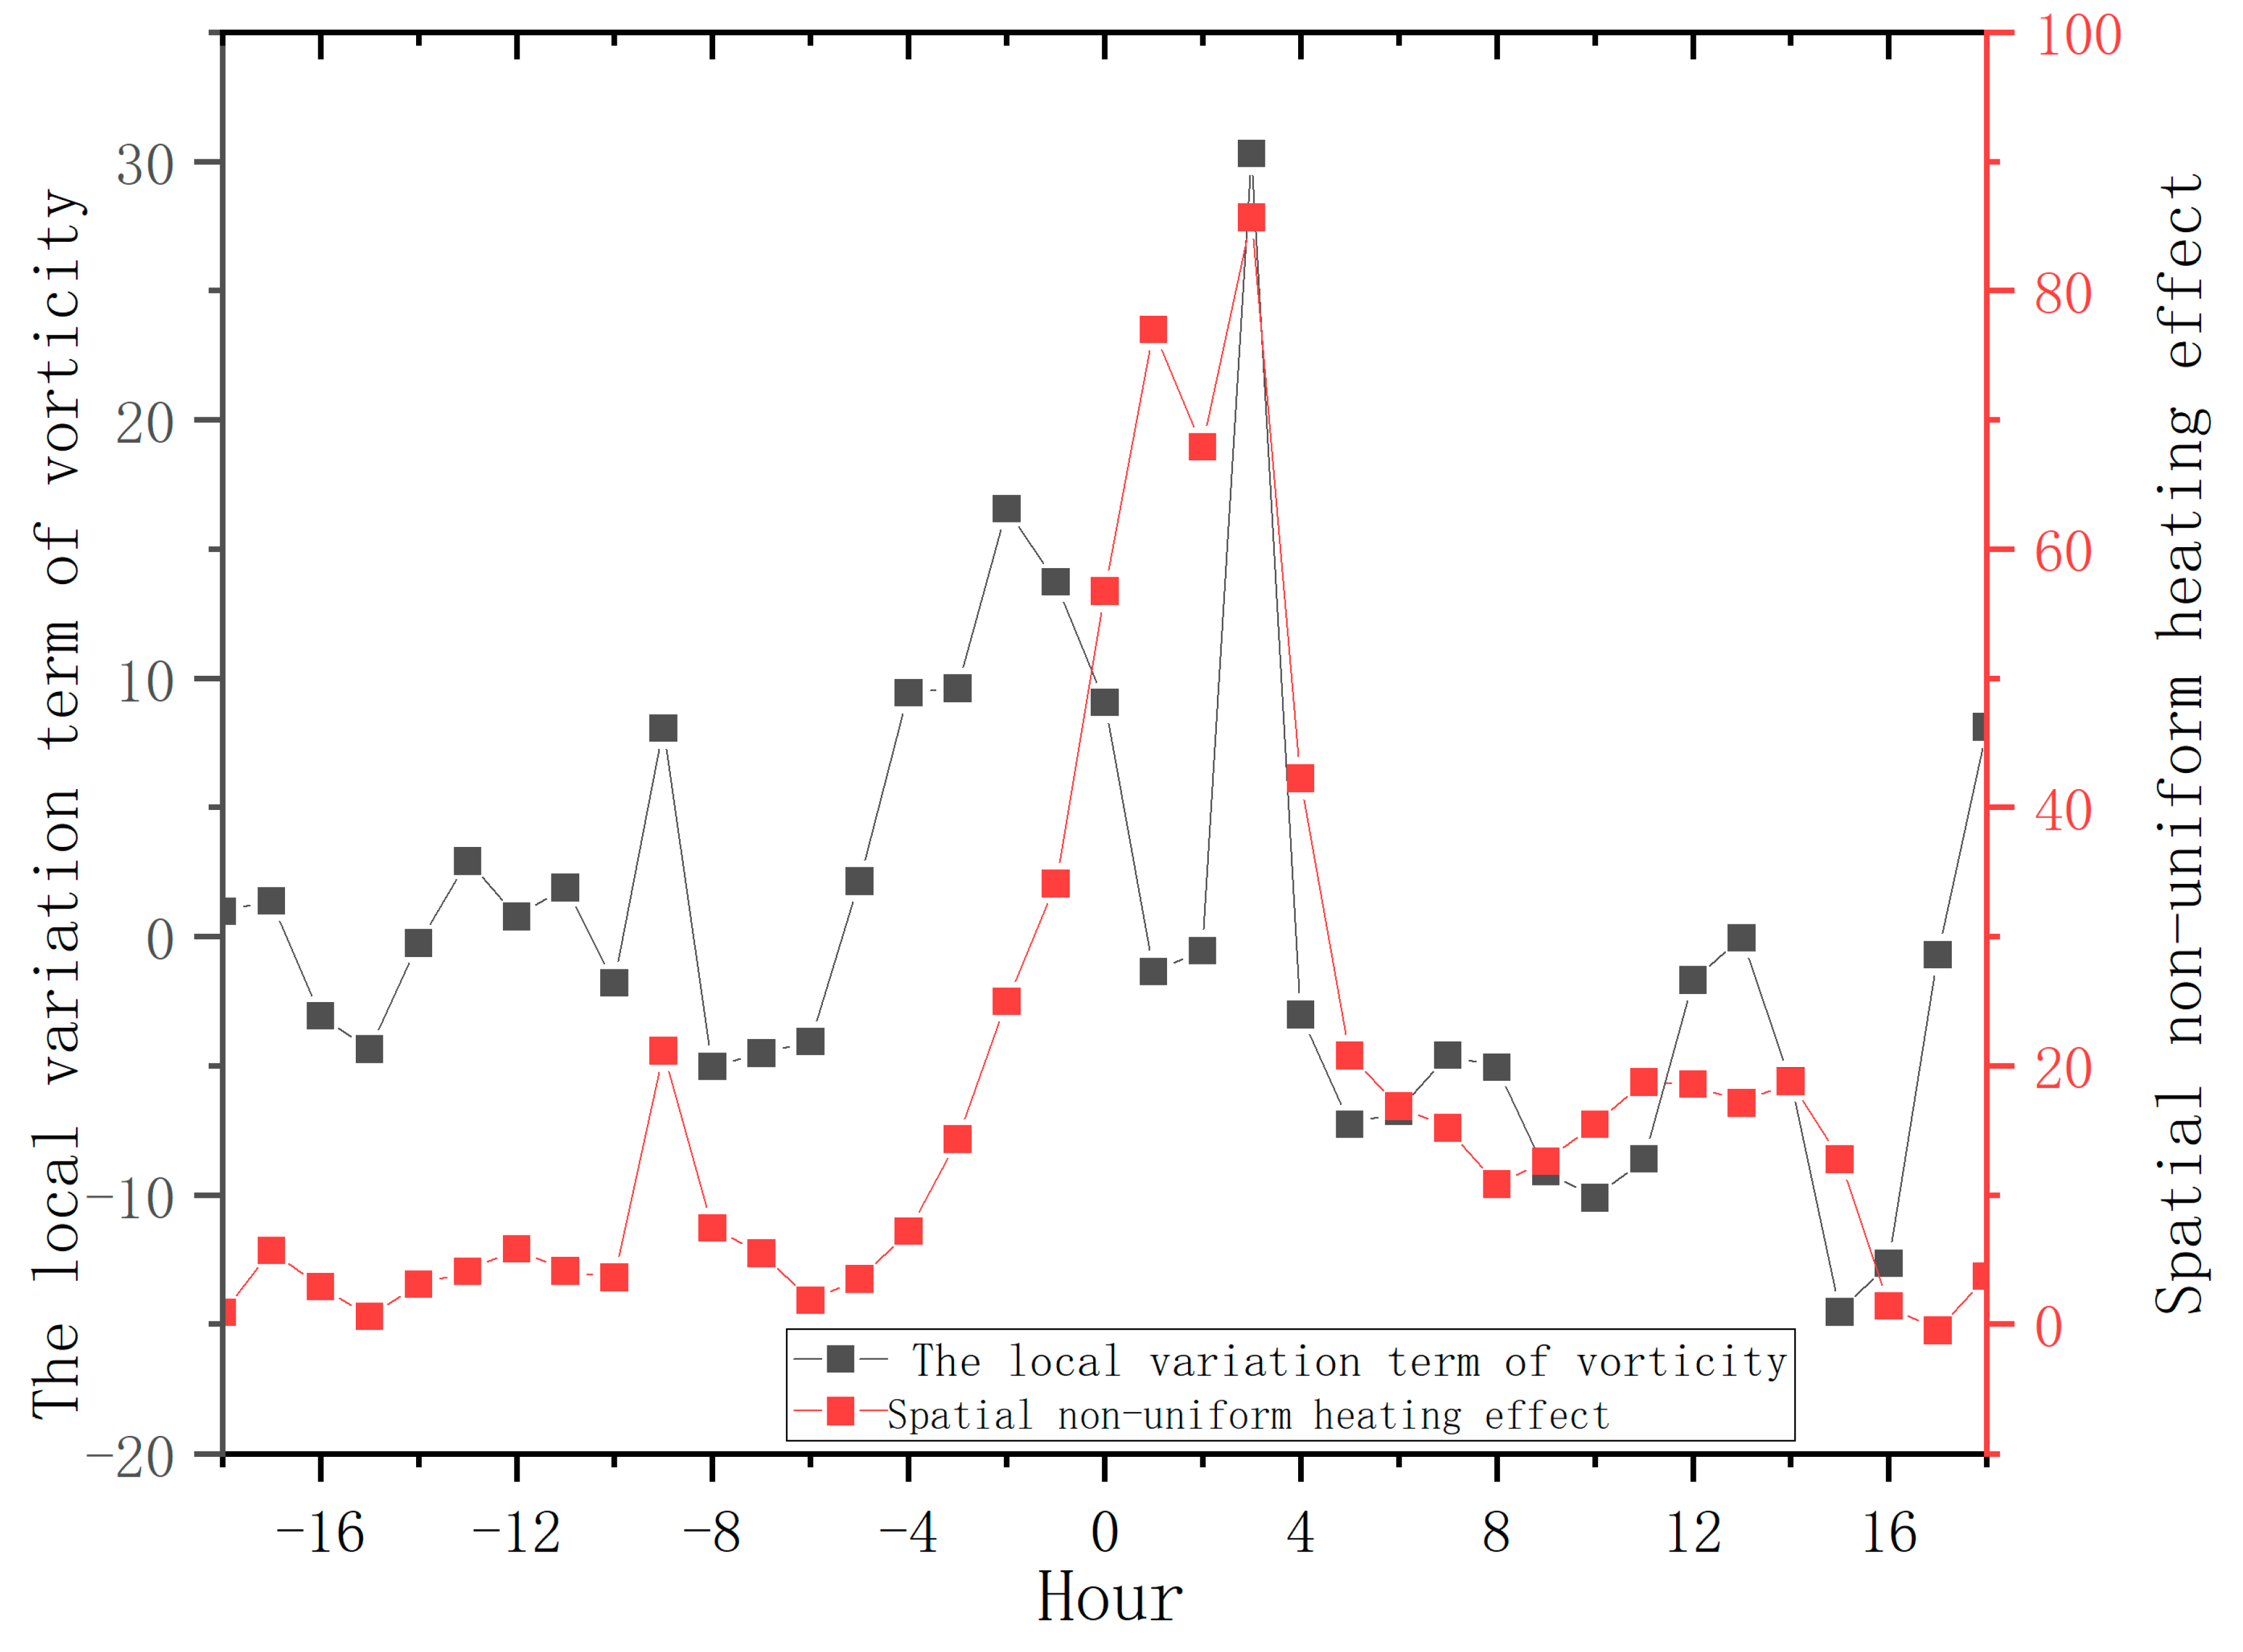
The variation in atmospheric diabatic heating was consistent with the intensity of the SWCV and precipitation; however, the sharp increase (decrease) in diabatic heating was faster than the increase (decrease) in the positive vorticity. The vertically integrated diabatic heating was the strongest in the vital stage of the extreme rainstorms caused by the SWCV. The large-value area of the “western type” was located in the center and northeast of the SWCV, and the large-value area of the “eastern type” was located in the southwestern airflow to the east of the Southwest China vortex.
(3)
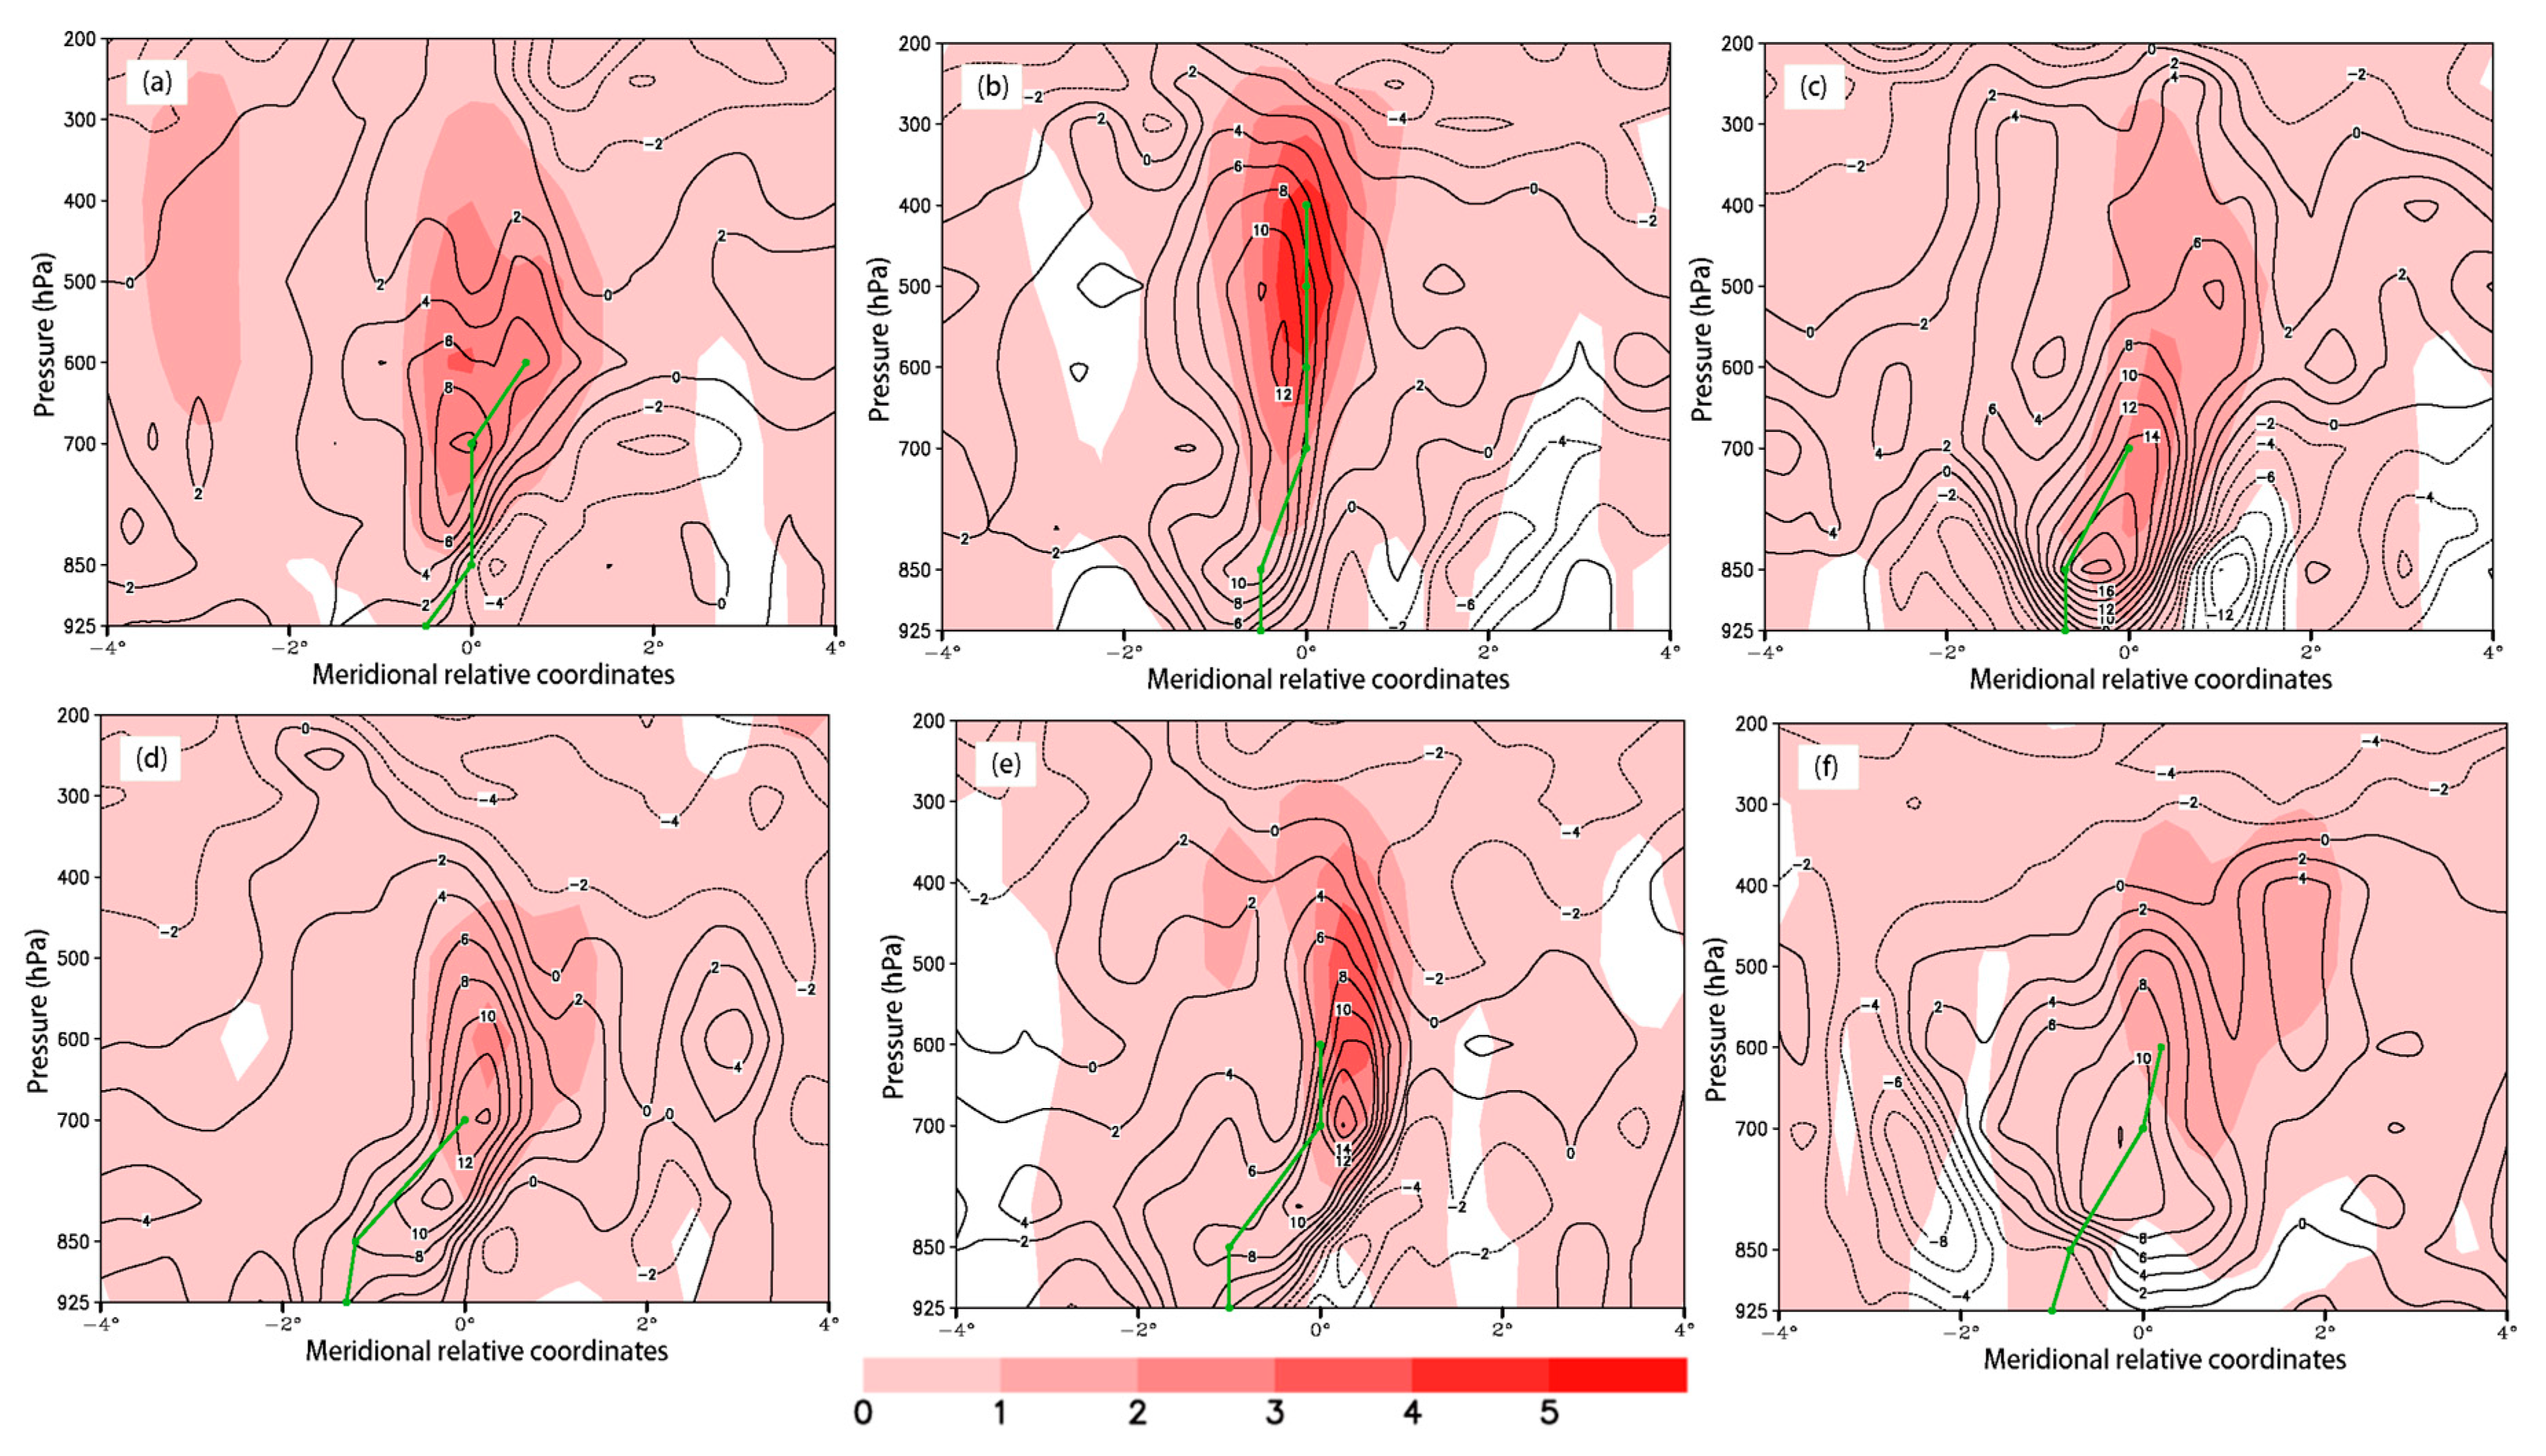
In the vital stage, the SWCV developed vertically with the height, and its center showed a vertical structure that tilted towards the northwest with the height. The diabatic heating rates above the two types of SWCV were positive, with the highest heating rate in the vital stage. The range, intensity, and height of the heating rate of the “western type” were greater than those of the “eastern type”. The variation in the diabatic heating rate was mainly due to vertical transportation.
(4)
The spatially non-uniform heating effects had similarities and were the strongest heating effects in the vital stage. The heating effect resulted in a high-value area in the “western type” located to the southeast of the SWCV, showing an asymmetric distribution on both the southeastern and northwestern sides. The heating effect resulted in a high-value area in the “eastern type” located to the northeast of the SWCV, showing an asymmetric distribution on both the northeastern and southwestern sides. The heating effect’s positive value area corresponded to the heavy precipitation area.
(5)
The vertically non-uniform heating term plays a decisive role in the distribution and evolution of the spatially non-uniform heating term. The vertically non-uniform heating effect affects the intensity evolution of the SWCV, the horizontally non-uniform heating effect was weaker than the vertically non-uniform heating effect, and the effect was the opposite.
At present, there is no reference for the study of the diabatic heating characteristics of multiple synthesized SWCV cases. Yao et al. [16] studied the diabatic heating characteristics of the plateau shear line, and the comparison of the two research results showed that the SWCV reflects the plateau shear line. The vertical transport of the temperature is the main contributor to the intensity of the Q during the evolution of the plateau shear line. The vertically non-uniform diabatic heating effect is the primary mechanism, with the vertically non-uniform heating effect of the plateau shear line being one to two orders of magnitude larger than the horizontally non-uniform heating effect. Conversely, for the SWCV, the vertically non-uniform heating effect and the horizontally non-uniform heating effect are of equal magnitude. At present, only the SWCV that induces extreme rainstorms has been analyzed. In the next step, the diabatic heating characteristics of the Southwest China vortex will be analyzed without considering precipitation, in order to obtain the thermodynamic characteristics of the development of the SWCV.

Author Contributions

Conceptualization, Y.L. and C.Z.; methodology, C.Z. and Y.L.; validation, C.Z.; formal analysis, C.Z.; investigation, C.Z.; writing—original draft preparation, C.Z.; writing—review and editing, Y.L.; visualization, C.Z.; supervision, Y.L.; project administration, Y.L.; funding acquisition, Y.L. All authors have read and agreed to the published version of the manuscript.

Funding

This research was funded by the Key Project of the Joint Meteorological Fund of the National Natural Science Foundation of China (grant no. U2242202), the Key Project of the National Natural Science Foundation of China (grant no. 42030611), the Innovation Team Fund of the Sichuan Meteorological Administration (grant no. SCQXCXTD-202201), the Innovative Development Special Project of the China Meteorological Administration (grant no. CXFZ2023J016), and the 2024 China Meteorological Administration Restoration Project (FPZJ2024-111).

Institutional Review Board Statement

Not applicable.

Informed Consent Statement

Not applicable.

Data Availability Statement

The daily precipitation data used in the study were obtained from the China Meteorological Administration Information Center. The hourly ERA5 reanalysis data are available through the ECMWF, (https://cds.climate.copernicus.eu/api/v2 (accessed on 21 June 2021)).

Conflicts of Interest

The authors declare no conflicts of interest.

References

  1. Zhu, Q.G.; Lin, J.R.; Shou, S.W.; Tang, D.S. Principles and Methods of Weather, 4th ed.; Meteorological Press: Beijing, China, 2000; pp. 371–374. [Google Scholar]
  2. Wang, Z.S.; Wang, Y.H.; Liang, Y.G. The numeric experiment research on a Southwest Vortex rainstorm. The Research on Rainstorm Science, Professional Experiment and the Theory Research on Weather Dynamics; Meteorological Press: Beijing, China, 1996; pp. 257–267. [Google Scholar]
  3. Wang, B.; Orlanski, I. Study of a heavy rain vortex formed over the eastern Flank of the Tibetan Plateau. Mon. Weather Rev. 1987, 115, 147–157. [Google Scholar] [CrossRef]
  4. Luo, Y.L.; Wu, M.W.; Ren, F.M.; Wong, W.K. Synoptic situations of extreme hourly precipitation over China. J. Clim. 2016, 29, 8703–8719. [Google Scholar] [CrossRef]
  5. Jian, L.; Chen, H.M.; Rong, X.Y.; Su, J.Z.; Xin, Y.F.; Furtado, K.; Milton, S.; Li, N.N. How well can a climate model simulate an extreme precipitation event: A case study using the transpose-AMIP experiment. J. Clim. 2018, 31, 6543–6556. [Google Scholar] [CrossRef]
  6. Chen, Y.R.; Li, Y.Q. A thermodynamic condition affecting the movement of a southwest China vortex case. Meteorol. Atmos. Phys. 2022, 134, 36. [Google Scholar] [CrossRef]
  7. Li, C.; Li, Y.; Fu, S.M.; Jiang, X.W.; Wang, X.F.; Li, S.S.; Cui, C.G.; Hu, Y.; Cui, W.J. A new perspective on the orographic effect of the windward slope on the multi-scale eastward-Moving southwest vortex systems. Atmos. Res. 2022, 279, 106365. [Google Scholar] [CrossRef]
  8. Wang, X.M.; Liu, Y. Causes of extreme rainfall in May 2013 over Henan Province: The role of the southwest vortex and low-level jet. Theor. Appl. Clim. 2017, 129, 701–709. [Google Scholar] [CrossRef]
  9. Chen, Y.R.; Li, Y.Q.; Zhao, T.-L. Cause analysis on eastward movement of Southwest China Vortex and its induced heavy rainfall in South China. Adv. Meteorol. 2015, 2015, 481735. [Google Scholar] [CrossRef]
  10. Feng, X.Y.; Liu, C.H.; Fan, G.Z.; Liu, X.D.; Feng, C.Y. Climatology and structures of Southwest in the NCEP climate forecast system reanalysis. J. Clim. 2016, 29, 7675–7701. [Google Scholar] [CrossRef]
  11. Lu, P.; Zheng, W.P.; Li, Y.Q. Comparison of the movement and vertical structures of two types of the southwest vortex. Meteorol. Atmos. Phys. 2020, 132, 571–581. [Google Scholar] [CrossRef]
  12. Xiang, S.Y.; Li, Y.Q.; Zhai, S.X.; Peng, J. Comparative analysis of precipitation structures in two Southwest China vortex events over eastern Sichuan Basin by TRMM. J. Atmos. Terr. Phys. 2021, 221, 105691. [Google Scholar] [CrossRef]
  13. Xiang, J.; Wang, H.; Li, Z.; Bu, Z.C.; Yang, R.; Liu, Z.H. Case study on the evolution and precipitation characteristics of Southwest Vortex in China: Insights from FY-4A and GPM observations. Remote Sens. 2023, 15, 4114. [Google Scholar] [CrossRef]
  14. Zhou, W.L.; Li, Y.Q.; Liu, C.; Peng, J.K. Physical Mechanism of the Development and Extinction of the China Southwest Vortex. Atmosphere 2023, 14, 337. [Google Scholar] [CrossRef]
  15. Yao, X.P.; Liu, Q.H.; Zhang, S.; Ma, J.L. Mechanism of atmospheric diabatic heating effect on the intensity of zonal shear line over the Tibetan Plateau in Boreal summer. J. Geophys. Res. 2021, 126, e2021JD034840. [Google Scholar] [CrossRef]
  16. Zhao, Y.C.; Park, C.; Son, S.W. Importance of diabatic heating for the Eastward-moving heavy rainfall events along the Yangtze river, China. J. Atmos. Sci. 2023, 80, 151–165. [Google Scholar] [CrossRef]
  17. Hu, Y.; Deng, Y.; Lin, Y.L.; Zhou, Z.M.; Cui, C.G.; Li, C.; Dong, X.Q. Indirect effect of diabatic heating on Mei-yu frontogenesis. Clim. Dyn. 2022, 59, 851–868. [Google Scholar] [CrossRef]
  18. Li, G.P.; Wang, J.; Lu, J.H. A potential mechanism of the warm vortex genesis in Southwest China. J. Appl. Meteorol. Sci. 1991, 2, 91–99. [Google Scholar]
  19. Zhang, Z.T.; Lin, M.Y.; Qi, P.; Chen, S.Z.; Wang, H.C. Numerical simulation about thermal forcing effect on Southwest vortex’s developing mechanism. Arid Meteorol. 2016, 34, 533–539. [Google Scholar] [CrossRef]
  20. Zhai, D.H.; Kong, F.Y.; Dai, Z.J.; Gao, S.; Deng, C.Z.; Zhang, Y. Analysis of deep convective towers in a Southwest-vortex rainstorm event. J. Trop. Meteorol. 2021, 27, 177–190. [Google Scholar] [CrossRef]
  21. Yang, P.; Yu, R.C.; Li, J. A case study on the role of water vapor from Southwest China in downstream heavy rainfall. Adv. Atmos. Sci. 2008, 25, 563–576. [Google Scholar] [CrossRef]
  22. Deng, C.Z.; Zhao, Y.; Kong, F.Y.; Zhai, D.H.; Li, Q.; He, Y. A numerical simulation study of the Southwest vortex mechanism during the “6.30” heavy rain event in Sichuan and Chongqing. Plateau Meteorol. 2021, 40, 85–97. [Google Scholar] [CrossRef]
  23. Zhou, C.H.; Xiao, D.X.; Chen, C.P. Characteristics of Southwest Vortex during Two Consecutive Heavy Rains in Western Sichuan Basin. Plateau Mt. Meteorol. Res. 2023, 43, 26–33. [Google Scholar] [CrossRef]
  24. Xiao, D.X.; Yang, K.Q.; Yu, X.D.; Wang, J.J. Characteristics analyses of extreme rainstorm events in Sichuan Basin. Meteorol. Mon. 2017, 43, 1165–1175. [Google Scholar] [CrossRef]
  25. Zhou, C.H.; Xiao, D.X.; Yu, S.H. Circulation background and structural characteristics of the extreme rainstorm induced by the Southwest vortex in Sichuan. Meteorol. Mon. 2022, 48, 1577–1589. [Google Scholar] [CrossRef]
  26. Yanai, M.; Esbensen, S.; Chu, J.H. Determination of bulk properties of tropical cloud clusters from large-scale heat and moisture budgets. J. Atmos. Sci. 1973, 30, 611–627. [Google Scholar] [CrossRef]
  27. Liu, Y.M.; Wu, G.X.; Liu, H.; Liu, P. The effect of spatially nonuniform heating the formation and variation of subtropical high part III: Condensation heating and South Asia high and western pacific subtropical high. Acta Meteorol. Sin. 1999, 57, 525–538. [Google Scholar] [CrossRef]
  28. Wu, G.X.; Liu, Y.M.; Liu, P. The effect of spatially nonuniform heating on the formation and variation of subtropical high Ⅰ: Scale Analysis. Acta Meteorol. Sin. 1999, 57, 257–263. [Google Scholar] [CrossRef]
  29. Gray, W.M. Recent Advances in Tropical Cyclone Research from Rawinsonde Composite Analysis; WMO Programme on Research in Tropical Meteorology: Fort Collins, CO, USA, 1981; p. 407. [Google Scholar]
  30. Gao, L.; Li, J.P. Impacts and mechanism of diabatic heating on atmospheric perturbation potential energy. Chin. J. Geophys. 2013, 56, 3255–3269. [Google Scholar] [CrossRef]
Figure 1. Composite distribution (unit: mm) of the extreme rainstorm area of the SWCV. The gray-green star indicates the center of the synthetic SWCV. (a) “Western type”; (b) “eastern type”.
Atmosphere 15 00861 g001
Figure 2. Composite diagram of the maximum hourly rainfall intensity and the relative position of the SWCV (scale: 0.5 represents 50 km). The center of the circle is the central position of the SWCV.
Atmosphere 15 00861 g002
Figure 3. Composite distribution of the 500 hPa geopotential height field (unit: dagpm). The thick black solid line is the direct influence trough line: (a) “Western type”; and (b) “eastern type”.
Atmosphere 15 00861 g003
Figure 4. Time variations in the mean vorticity at 700 hPa (black line, unit: 10−6 s−1) and the diabatic heating of the entire vertical integration (red line, unit: W.m−2) in the SWCV region (0 h is the time at which the maximum hourly rainfall intensity occurred, and the negative [positive] time was before [after] the relative hourly maximum rainfall intensity, respectively). (a) “Western type”; and (b) “eastern type”.
Atmosphere 15 00861 g004
Figure 5. Diabatic heating of the entire vertical integration < Q 1 > in the extreme rainstorm weather caused by the SWCV (shading, unit: W.m−2) and the wind vector and geopotential height field at 700 hPa (black line, unit: dagpm) (the blue hollow triangle represents the center of the SWCV). (a,d) Initial stage; (b,e) vital stage; (c,f) end stage. (ac) “Western type”; (df) “western type”.
Atmosphere 15 00861 g005
Figure 6. Latitude–height profile of the diabatic heating rate Q [shading, unit: K/(6 h)] and vorticity (black line, unit: 10−5 s−1) along the center of the SWCV (the thick green solid line represents the central line of the SWCV with different isobaric surfaces). (a,d) Initial stage; (b,e) vital stage; (c,f) end stage. (ac) “Western type”; and (df) “eastern type”.
Atmosphere 15 00861 g006
Figure 7. Regional mean vertical variation in the diabatic heating rate process [K/(6 h)] in the extreme rainstorm weather caused by the SWCV. (a,d) Initial stage; (b,e) vital stage; (c,f) end stage. (ac) “Western type”; and (df) “eastern type”.
Atmosphere 15 00861 g007
Figure 8. Average local variation in vorticity (black line, unit: 10−10 s−2) and the change in the spatially non-uniform heating effect (red line, unit: 10−10 s−2) with time at 700 hPa [0 h: occurrence time of hourly maximum precipitation intensity; negative (positive) time: before (after) the moment of the maximum relative hourly precipitation intensity].
Atmosphere 15 00861 g008
Figure 9. Latitude–height profile of the spatially non-uniform heating term f + ζ θ z Q z 1 θ z v x Q x + 1 θ z u y Q y (thin black line, unit: 10−9 s−2) at the center of the SWCV (the thick black solid line indicates the central line of the SWCV with different isobaric surfaces). (a,d) Initial stage; (b,e) vital stage; (c,f) end stage. (ac) “Western type”; (df) “eastern type”.
Atmosphere 15 00861 g009
Figure 10. Latitude–height profile of the vertically non-uniform heating term f + ζ θ z Q z (thin black line, unit: 10−9 s−2) at the center of the SWCV (the thick black solid line indicates the central line of the SWCV with different isobaric surfaces). (a,d) Initial stage; (b,e) vital stage; (c,f) end stage. (ac) “Western type”; and (df) “eastern type”.
Atmosphere 15 00861 g010
Figure 11. Latitude–height profile of the horizontally non-uniform heating term 1 θ z v x Q x + 1 θ z u y Q y (thin black line, unit: 10−9 s−2) at the center of the SWCV (the thick black solid line indicates the central line of the SWCV with different isobaric surfaces). (a,d) Initial stage; (b,e) vital stage; (c,f) end stage. (ac) “Western type”; and (df) “eastern type”.
Atmosphere 15 00861 g011aAtmosphere 15 00861 g011b
Table 1. List of 16 cases used in composite analysis.
Initiation Stage (UTC)Vital Stage (UTC)End Stage (UTC) Initiation Stage (UTC)Vital Stage (UTC)End Stage (UTC)
Western type198107121219810713001981071312Eastern type198906060019890606211989060700
198406231219810623181984062412198907080019890708121989070900
198407011219840701171984070212199106291219910629171991063012
198707090019870709061987071000200409031220040903182004090412
199807050019980705021998070600201007161220100716162010071712
201307081220130708192013070912201408081220140808172014080612
202008151220200815182020081612201409121220140913012014091312
201707051220170705172017070612
202108071220210807192021080812
Note: 1981071212 refers to 12 UTC on 12 July 1981.
Disclaimer/Publisher’s Note: The statements, opinions and data contained in all publications are solely those of the individual author(s) and contributor(s) and not of MDPI and/or the editor(s). MDPI and/or the editor(s) disclaim responsibility for any injury to people or property resulting from any ideas, methods, instructions or products referred to in the content.

