Abstract
A total solar eclipse provides an unparalleled opportunity to study the changes in the atmosphere’s planetary boundary layer (PBL) due to changes in radiative heating. Although previous eclipse studies have demonstrated that significant changes occur, few studies have explored the evolution of these changes. To better understand the changes in the lowest layers of the PBL during an eclipse, a multi-sensor sampling approach was taken. Radiosonde launches were used to explore the depth of the column, while Unmanned Aerial Vehicles (UAVs) were used to document with high-resolution the brief changes in the vertical structure of the PBL caused by the eclipse. These changes highlighted differences from previous studies that relied solely on radiosonde and/or mesonet data alone. Higher-resolution sampling of the lower PBL showed a delay in the local vertical mixing as well as changes in the PBL height from pre- to post-eclipse. Slow responses were noted at the top of the PBL while very rapid changes to the PBL profile were captured in the near-surface layer. These changes highlighted differences from previous studies that relied solely on radiosonde and/or mesonet data alone. A preliminary analysis of the collected data highlighted a slow response to the eclipse near the top of the planetary boundary layer (radiosonde data) with very rapid changes noted in the near surface layer (UAV data). Preliminary results show that PBL heights remained nearly constant until well after third contact when a 35 hPa lowering of the PBL heights was observed and were limited to the lowest 25 hPa. The UAV soundings demonstrated the development of a strong inversion where the air below 990 hPa rapidly cooled with a nearly 1 °C drop in temperature observed. These observed changes raise interesting questions about how the lower and upper parts of the planetary boundary layer interact.
1. Introduction
Clayton [1] and Amiridis et al. [2] called total solar eclipses a ‘natural experiment’ where the effects of radiative heating on the planetary boundary layer can be studied. The first known quantitative measurements of the meteorological response to an eclipse were recorded in 1834 and were cited by Aplin [3]. The absence of solar radiation during a total eclipse causes a decrease in temperatures, resulting in changes in surface temperatures of up to −7 °C, as measured by Alpin [3]. The change in temperature is correlated with the change in solar radiation, but lags by 6 to 30 min according to Alpin [3]. The drop in temperature is accompanied by an increase in relative humidity as might well be expected. Ahrens et al. [4] reported temperature falls of 2.1 °C reaching a minimum temperature 5 min after mid-eclipse. Hanna [5] reported temperature drops of 2 °C with reports of minimum temperatures occurring approximately 14 min after mid-eclipse. Founda [6] observed temperature drops of between 1.6 °C to 3.9 °C. Time lags for these temperature changes took between 12 and 14 min. The differences in temperature recovery and temperature changes are accounted for by changes in land surface and amount of cloud cover.
As noted above, there are numerous studies of observed changes in the temperature, wind and pressure fields at the surface due to solar eclipses, but as noted by Hanna [5] these can suffer from vagaries of the weather. Radiosondes offer an inexpensive platform for measurements of the vertical structure of the atmosphere but are limited by the time it takes to ascend. Pasken et al. [7], Fowler et al. [8], Colligan et al. [9], Burt [10], Palomaki et al. [11] and Harrison et al. [12] used radiosondes to investigate a variety of phenomena ranging from stratospheric gravity waves to radiation budget studies.
There have been measurements of boundary layer height using radiosondes during eclipses, however, few studies exist. During the 2006 eclipse over Greece, a change in the boundary layer of approximately 175 m was measured with radiosondes by Amiridis et al. [2]. During the 2015 eclipse over the British Isles, authors Gray et al. [13] and Harrison et al. [12] stated there was observational evidence of a change in the height of the boundary layer, but their data were not shown. Pasken et al. [7] presented the results of a series of soundings obtained during the 2017 eclipse; one dataset from near the outer edge of totality, and the other dataset from on the eclipse center line. Both datasets documented the effects of the eclipse on the vertical structure of the atmosphere. Although both sites in the study showed moistening of the vertical profile near the Planetary Boundary Layer (PBL), only the site on the center line revealed a shallow eclipse-induced cold pool in the lowest 20 hPa. The low-level radiosondes launched from the center line site showed the rapid cooling in the lowest few hundred meters. This resulted in a strengthening of the low-level inversion, followed by a dry adiabatic ascent, which indicated a significant change in the PBL height. There were significant changes in the temperature lapse rate in the boundary layer along with a moistening of the dew point profile, particularly above 870 hPa. The southern edge of the site showed typical temperature increases due to heating during the day, along with significant moistening of the vertical column. The Fowler et al. [8] study showed similar results with strong surface layer cooling 40 min and 5 min before second contact. The coldest profile occurred about 15 min after third contact.
The 2017 eclipse sounding profiles provided valuable information about PBL evolution during that eclipse. There remain many unanswered questions that the 2024 total solar eclipse data would hopefully provide insight into. The sounding data collected during the 2017 total solar eclipse did not allow the effects of the eclipse in the lowest layers of the PBL to be documented. This was in part due to the sounding release plan, which placed launches from sites perpendicular to the path of the eclipse. This geometry allowed spatial changes to be measured and documented that the most significant changes occurred along the center line. This geometry, however, did not allow temporal changes to be effectively observed. Furthermore, sampling limitations imposed by the radiosondes themselves prevented the possibility of observing any rapid PBL changes related to the eclipse. In the 2024 experiment, to better understand how the PBL structure changed during the loss of radiative heating, vertical profiles from repeated radiosonde launches along the center line were combined with concurrent vertical profile data obtained by employing low-cost recreational UAVs.
Differences in the structure of the PBL between day and night are well understood and documented. However changes in the PBL due to the loss of incoming solar radiation caused by a total solar eclipse are not. Previous studies of PBL structural changes during a total solar eclipse appear to show that the eclipse only affects its lowest layers (20 hPa, 170 m). This is likely due to the short duration of the loss of incoming solar radiation; however, this may not be the only reason for the changes. There may be other known and unknown factors that affect changes in the temperature and moisture profile changes.
The advent of low-cost recreational Unmanned Aerial Vehicles (UAVs) has provided researchers with another platform to measure the vertical structure of the atmosphere. There are serious limitations as to when the use of UAVs are practical, such as when altitude and/or location restrictions are enforced. However, the ability to easily and rapidly change the location where the measurements are taken, along with the high vertical resolution that UAV measurements provide, mitigate some of the limitations of UAV use.
To better understand the changes in the lowest layers of the PBL during an eclipse, a multisensor sampling approach was taken. Radiosonde launches were augmented by UAV vertical profile measurements. Radiosondes launches were staged at a site along the center line of the eclipse path and were tenatively scheduled to be launched 45 min prior to and 45 min after totality, with a launch at the start of totality. This approach allowed us to better document details of the PBL evolution/devolution during the eclipse cycle. As noted by Pasken [7] and Fowler [8], the changes in the PBL profiles captured by radiosonde were not significantly altered by the partial phases. These radiosondes only provided low-resolution time series data in the PBL, but did provide data through a greater depth of the column. Employment of a low-cost, sensor mounted recreational UAV, flown from the surface to an altitude of 122 m helped collect high-temporal-resolution sounding data, better documenting changes in the lowest layers of the PBL. That increased resolution helped determine whether the changes were due to the eclipse or to other possible atmospheric changes.
2. Data and Methods
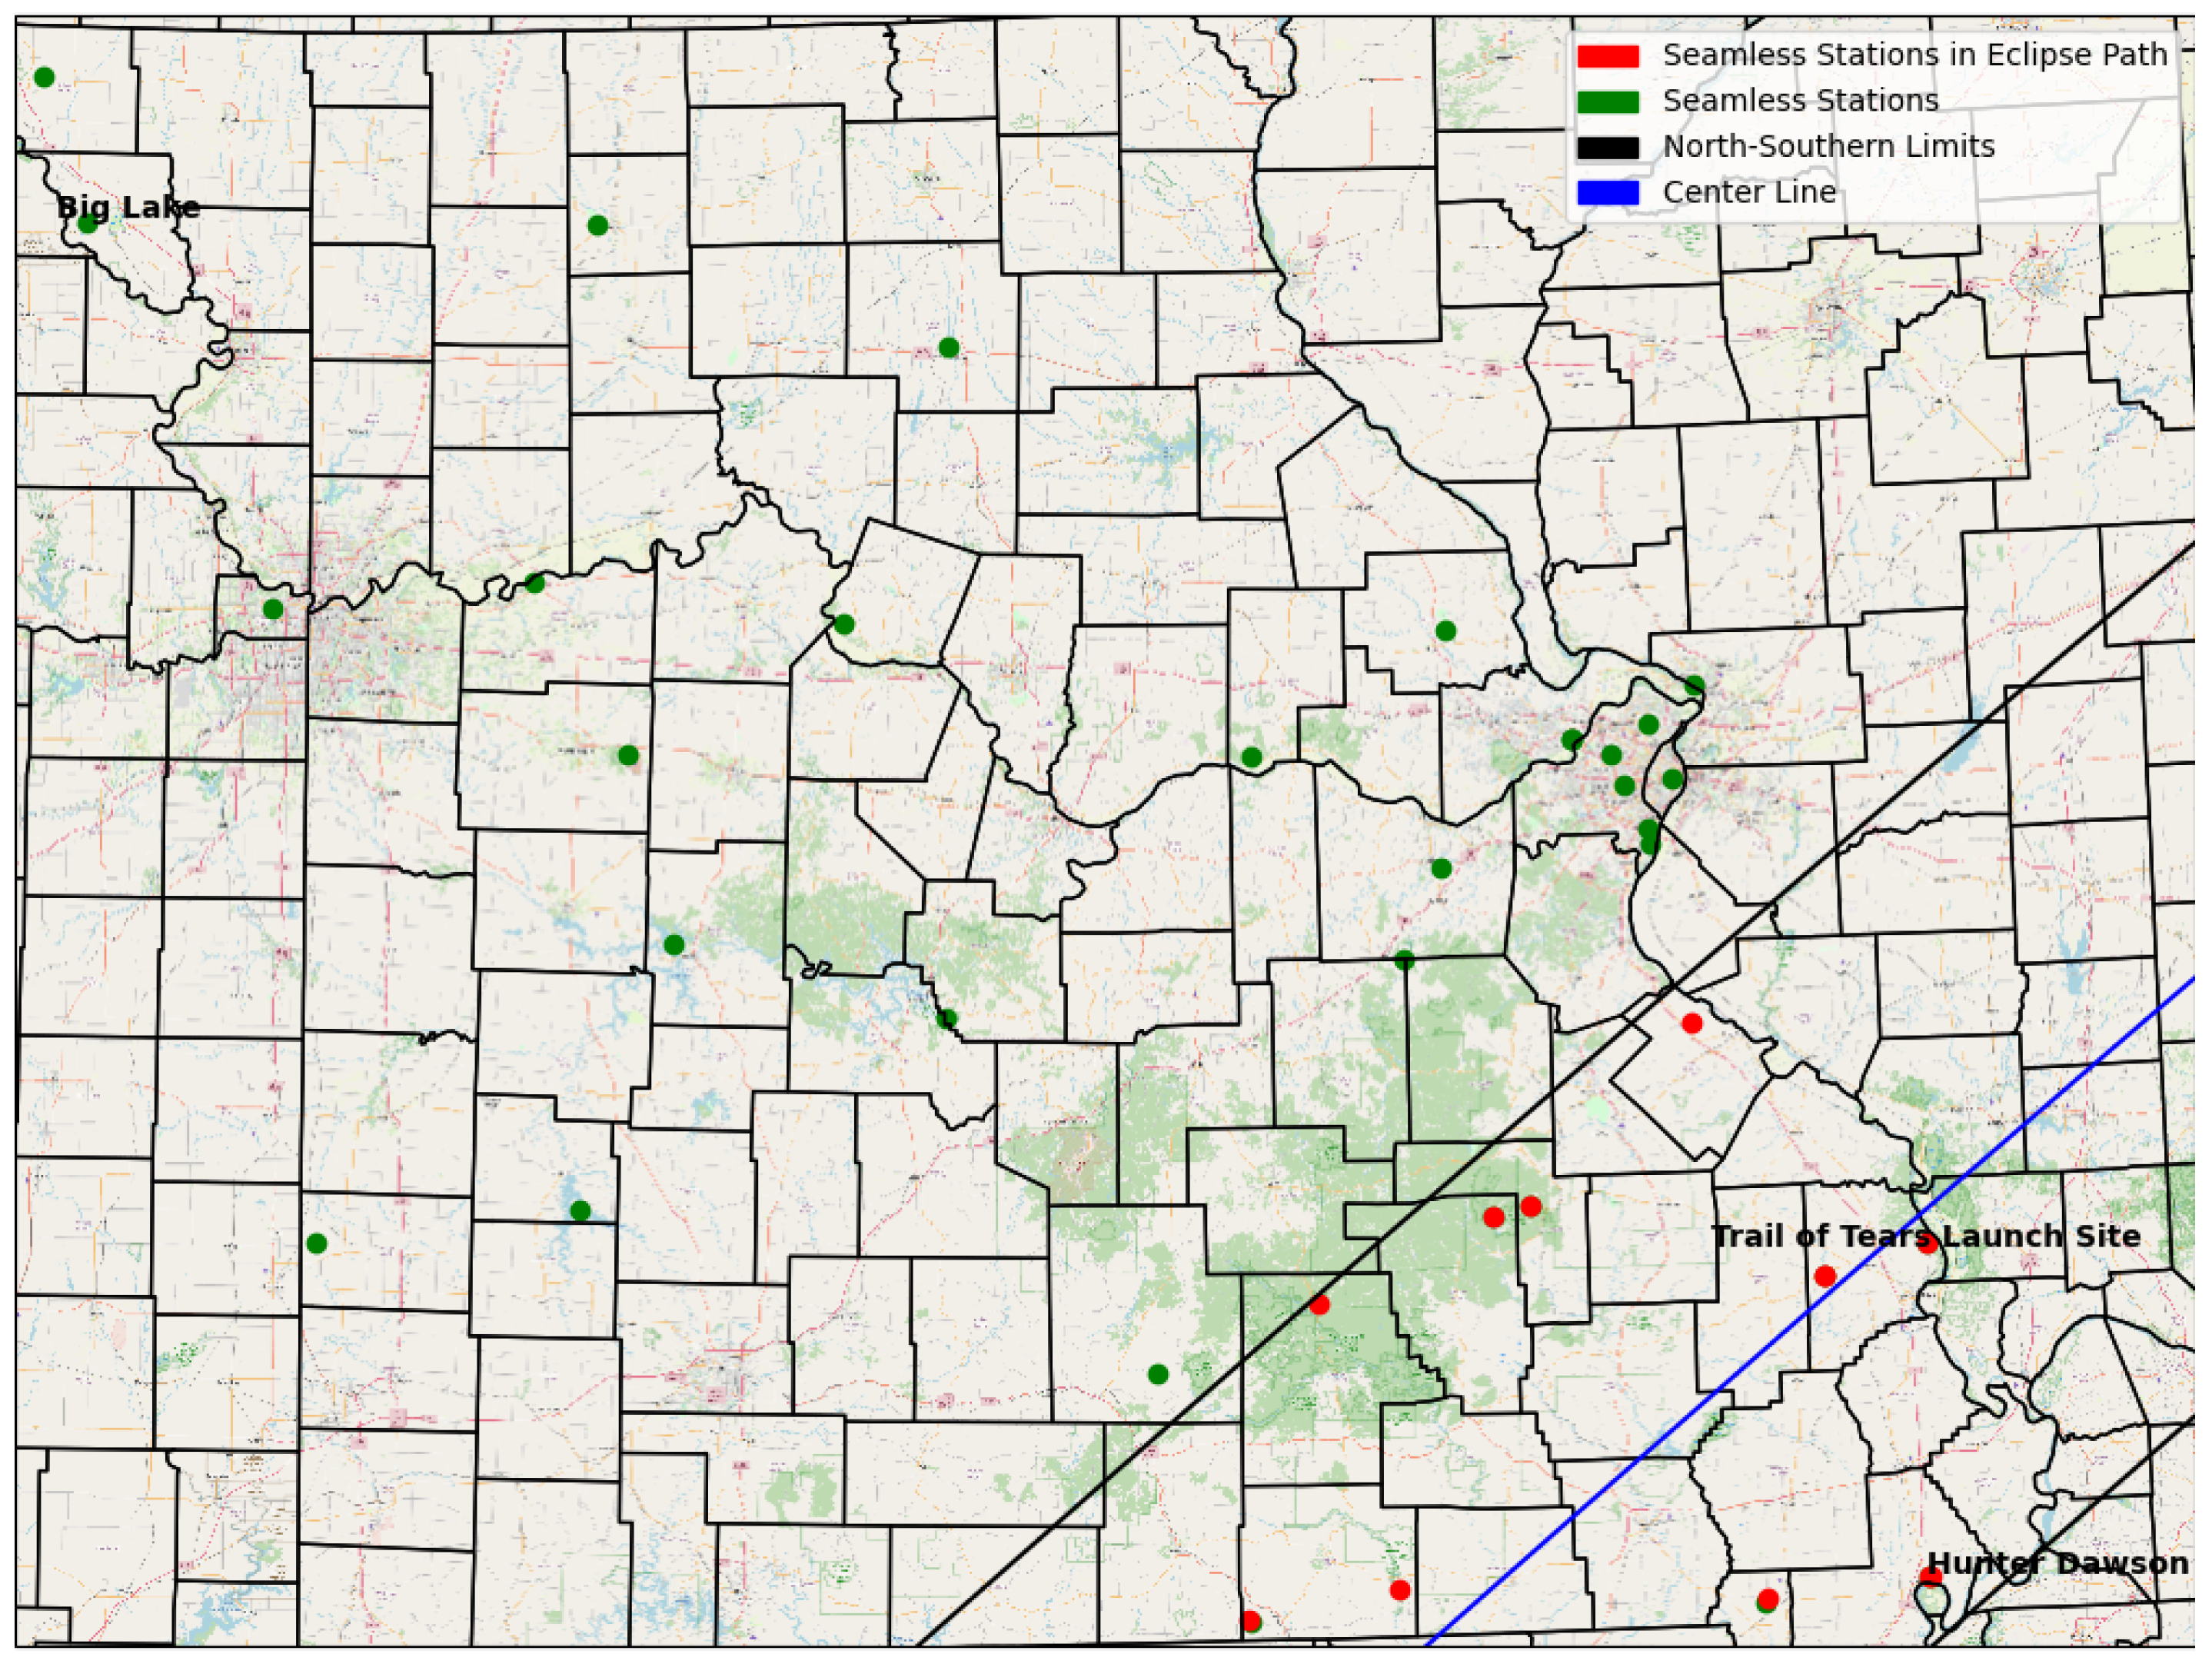
SEAMLESS (St. Louis University Earth and Atmospheric Mesoscale Laboratory for Earth Systems Science) has an agreement in place with the Missouri Department of Natural Resources (MO-DNR) to access MO-DNR state parks. The MO-DNR Trail of Tears State Park, shown in Figure 1 located near the center line of the eclipse, was chosen as the site for the experiment.
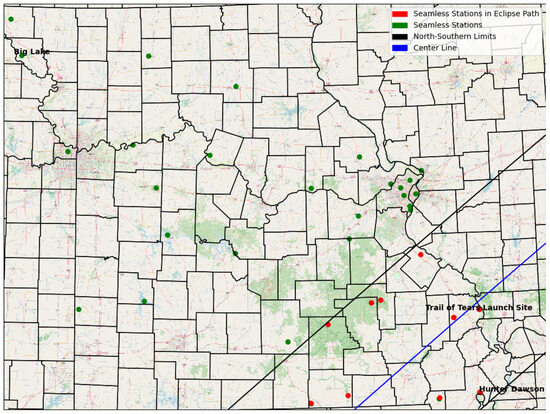
Figure 1.
Path of the eclipse (SW to NE) across the SEAMLESS mesonet. Black lines mark the northern and southern limits of totality, blue the centerline. Red dots mark mesonet stations within the eclipse path, green dots mesonet stations outside the eclipse path.
SEAMLESS (Saint Louis University Earth and Atmospheric Mesoscale Laboratory for Earth Systems Science) is a surface and upper air meso-meteorological network (mesonet) developed between Saint Louis University and community partners. The mesonet is composed of 51 RainWise Mk-4c sensor suites and three InterMet sounding systems (Figure 1).
SEAMLESS has three sounding systems; one located on the Saint Louis University campus, one at Trail of Tears State Park (located on the center line of the eclipse) and a mobile system. The sounding systems on campus of Saint Louis University and the mobile system were not used in this study.
Surface temperature, relative humidity, pressure, wind speed, wind direction, wind gust and precipitation were recorded once a minute at each surface site. A comprehensive Quality Assurance/Quality Control (QA/Quality Control) system was in place to complement the efficient collection and transmission of environmental observations by the network. (NOTE: The characteristics for placement of the mesonet sites are also generally consistent with the standards recommended by the American Association of State Climatologists (AASC) for automated weather station networks.)
The SEAMLESS network was/is designed to provide community partners with a weather-based decision support system that provides users with high-quality spatial and temporal resolution data. Therefore, it is well suited to study the mesoscale effects realized during the pre-eclipse, mid-eclipse and post-eclipse phases on the atmospheric structure. The SEAMLESS mesonet was also used by Pasken et al. [7] for the 2017 total solar eclipse.
A single InterMetSystems iMet-3100 system was used to launch iMet-4 radiosondes, which were expected to to rise to at least 500 mb before termination. The purpose was to measure the vertical structure in and just above the PBL to determine if a mid-level flow feature would affect the PBL structure. The sondes collected standard PTU (Pressure, Temperature, Moisture) and wind information at 1 s intervals using a standard 350 g balloon, providing an ascent rate of 5 m per second.
In addition, two unmanned aerial vehicles (UAVs) with attached atmospheric sensor packages were used to provide a more detailed look at the lowest 14 hPa. A Potensic Atom SE UAV and a DJI Spark UAV were equipped with InterMetSystems iMet-XQ UAV sensor suites. The UAVs ascended and descended as many times as possible to collect high-temporal-resolution data in the lowest levels of the PBL. iMet-XQ sensors have been compared favorably to Vaisala and InterMet iMet-4 radiosondes by numerous authors (Kimball et al. [14], Bailey et al. [15]).
Moreover, 350 g Kaymont radiosonde balloons were used for all three balloon launches. The original science plan called for a launch thirty minutes before second contact, a launch at second contact, a launch at third contact and the last launch thirty minutes after third contact. This plan had to be changed when a radiosonde balloon burst while being filled. Thus launches were made at forty-five minutes before second contact, at second contact and at forty-five minutes after third contact.
The radiosonde data were processed and initial quality control was conducted with the iMet software and by carefully examining both a Skew-T plot and the data in text format. Since the signals from the radiosondes were strong up to 300 hPa, very few bad data samples were found in the raw data. The first of the three sondes terminated after rising to 635 hPa. Although this did not reach the 500 mb level arbitrarily selected during the design of the experiment, it did not result in the loss of any critical information to the study effort. The sonde rose well above the PBL and provided documentation of the vertical atmospheric profile required to satisfy experiment data collection needs. iMet-4 performance and sensitivity characteristics are shown in Table 1.

Table 1.
iMet-4 radiosonde sensor characteristics.
In addition to the radiosonde data, UAV data were also collected at the same location as the radiosonde data to describe the structure of the PBL before, during and after the eclipse. Kimbell [14] and Bailey et al. [15] have replicated the accuracy of the iMet-XQ UAV sensor by comparing the UAV sensor data to both meteorologically instrumented tower data and radiosonde data.
The UAV data collected between the second and third contacts provided multiple vertical profiles at the lowest levels of the PBL. These data helped identify any rapid changes in the PBL structure. The first UAV flight was flown as close as possible to the radiosonde. This helped to compare the data accuracy between the radiosonde and the iMet-XQ sensor. The performance and sensitivity characteristics of iMet-XQ are shown in Table 2. Due to operational restrictions in place imposed by the Federal Aviation Administration (FAA), the UAVs could not exceed a weight of more than 250 g and could not exceed an altitude of 122 m above ground level (AGL).
Table 2.
iMet-XQ sensor characteristics.
The SEAMLESS mesonet provided a comprehensive view of the changing weather as a result of the total solar eclipse. As noted by Pasken et al. [7] there were unexpected changes in the vertical structure of the atmosphere during the 2017 eclipse, so close attention was paid to collecting data not only horizontally but also vertically.
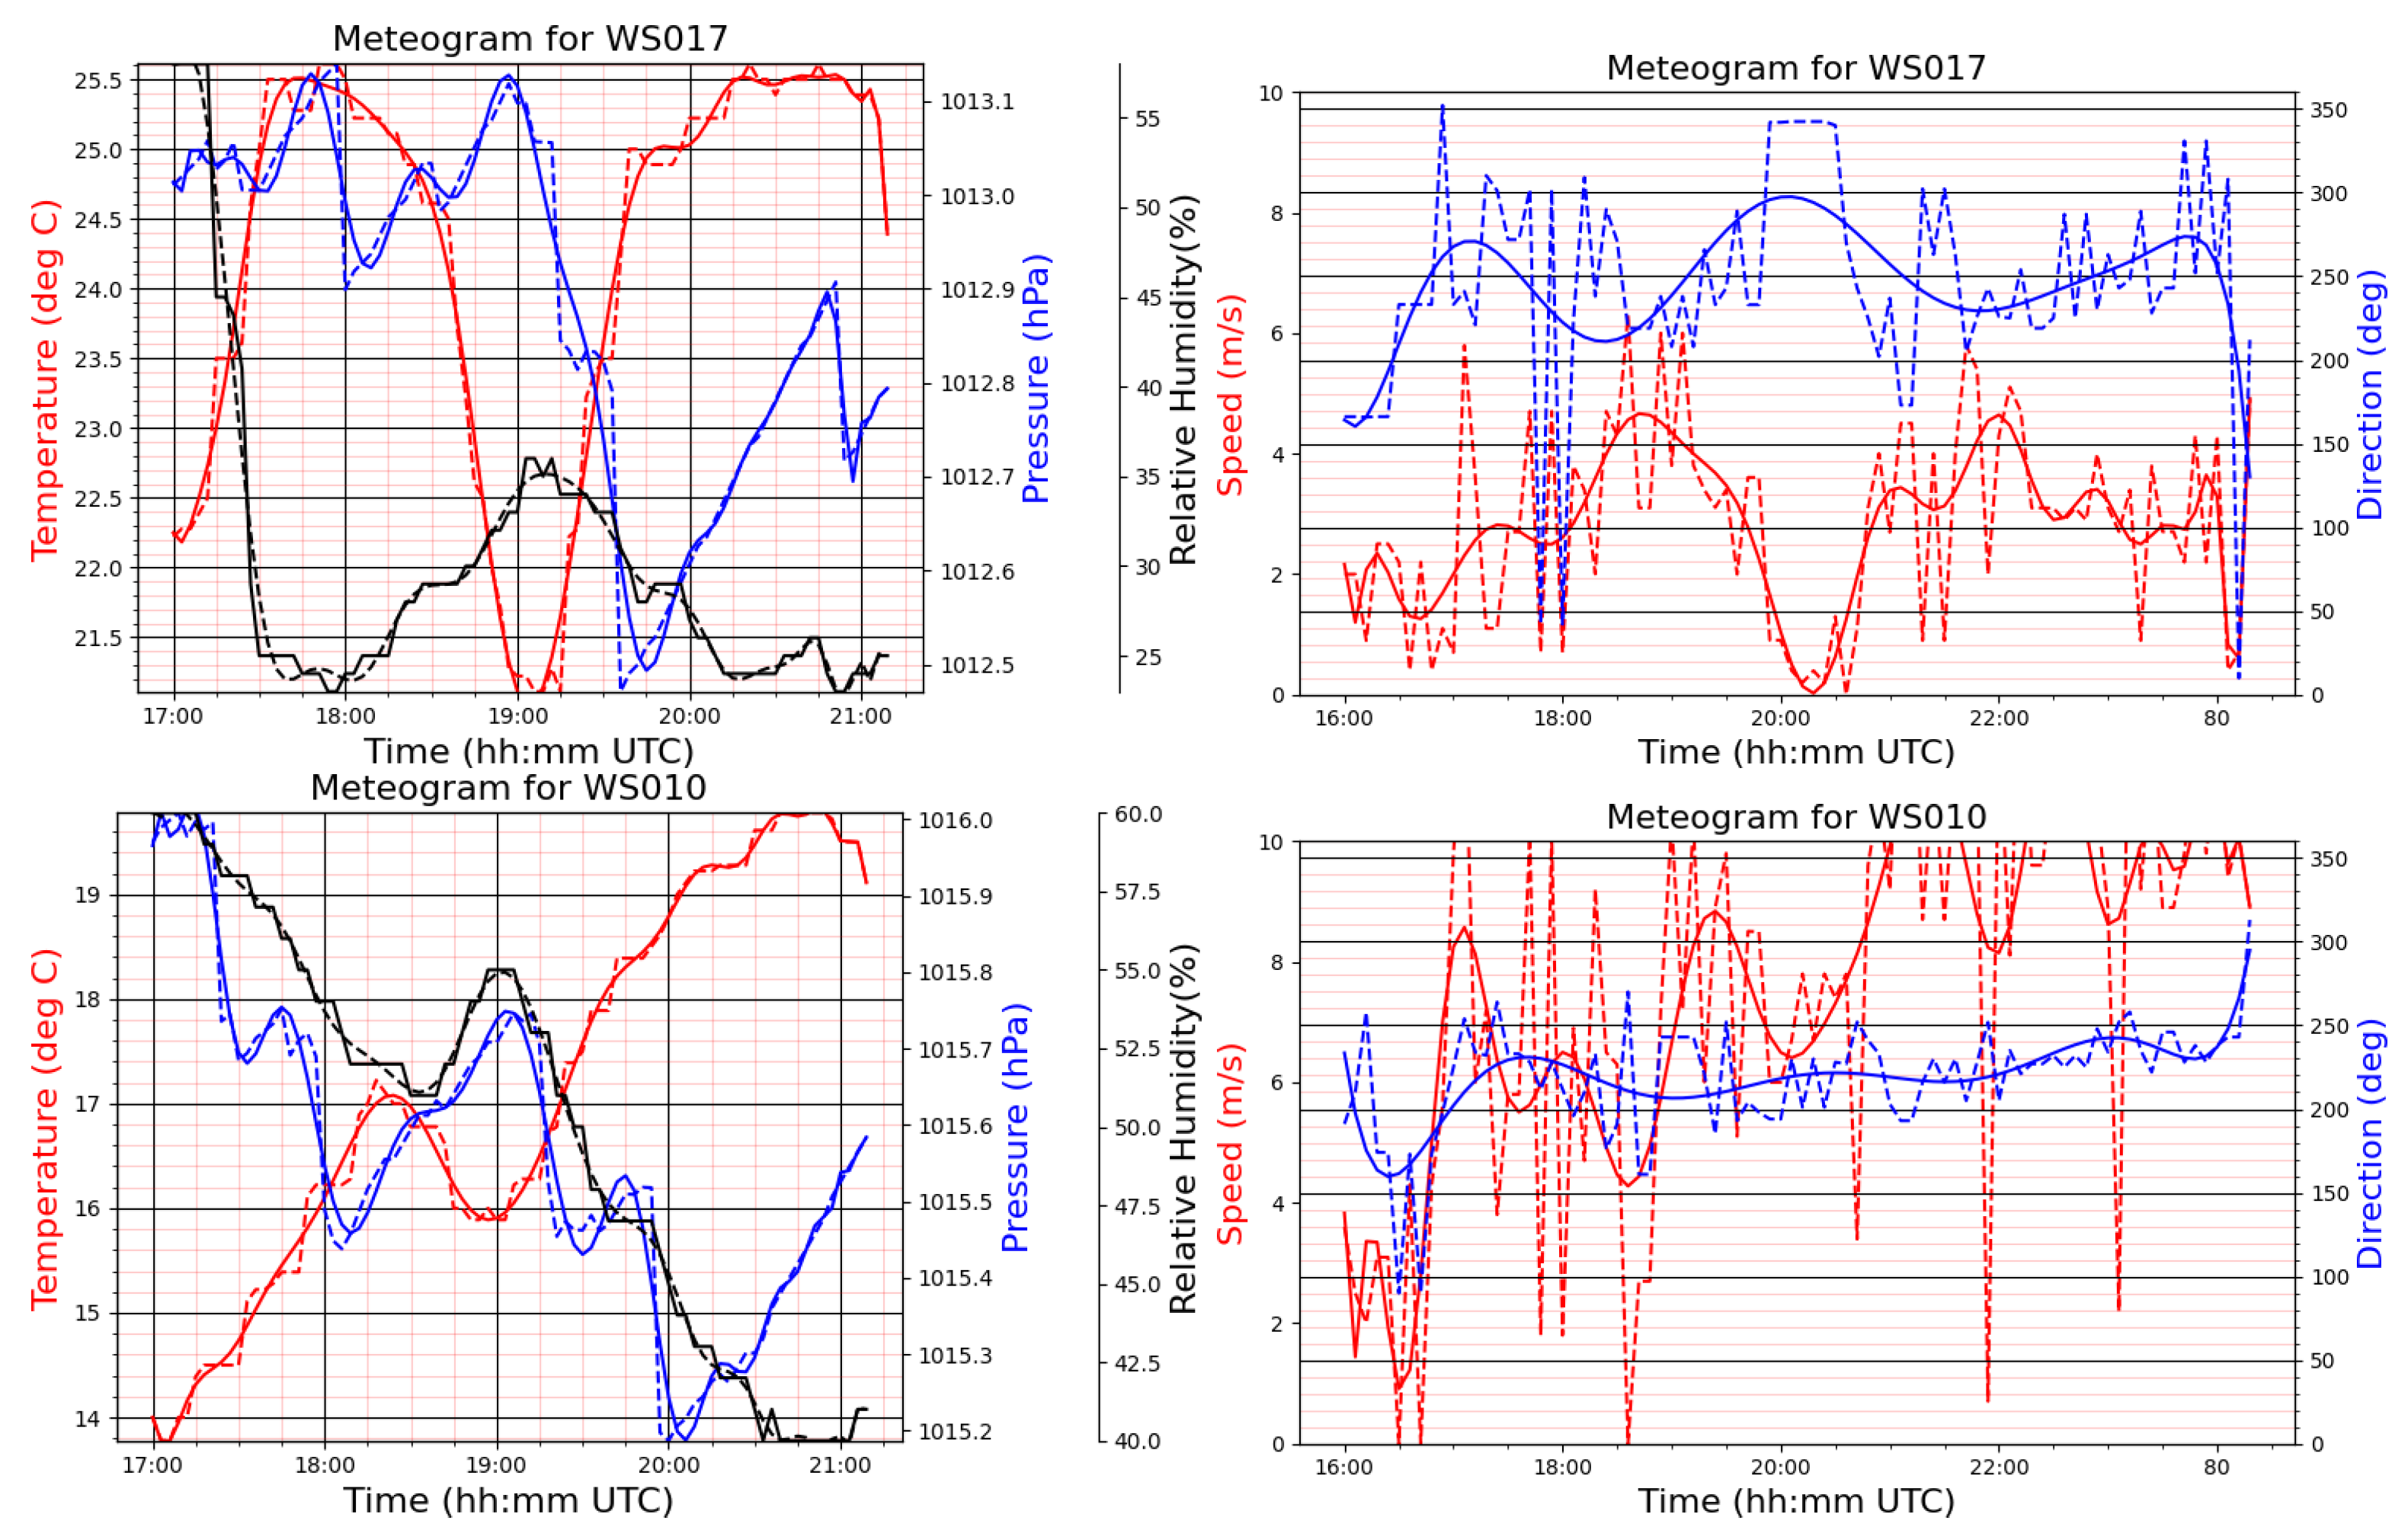
Meteograms from two surface mesonet stations, one on the centerline (WS017) and one well away from the eclipse center line in northwest Missouri (WS010), are shown in Figure 1 and Figure 2. The effects of the eclipse on the surface are clearly seen in the differences between a site on the eclipse center line and one well away from the eclipse center line. As expected the surface data clearly shows the effect of the eclipse at the surface and are in line with results from previous eclipses. Eclipse event timings for southern (Hunter-Dawson State Park) and eastern Missouri (Trail of Tears State Park) are given in Table 3.

Figure 2.
Surface meteograms from Trail of Tears State Park (WS017) and Big Lake State Park (WS010). Dashed lines are the observed one minute samples and the solid lines are 35th-order polynomial fit to the observed samples.
Table 3.
Eclipse event times for southern and eastern Missouri.
3. Results
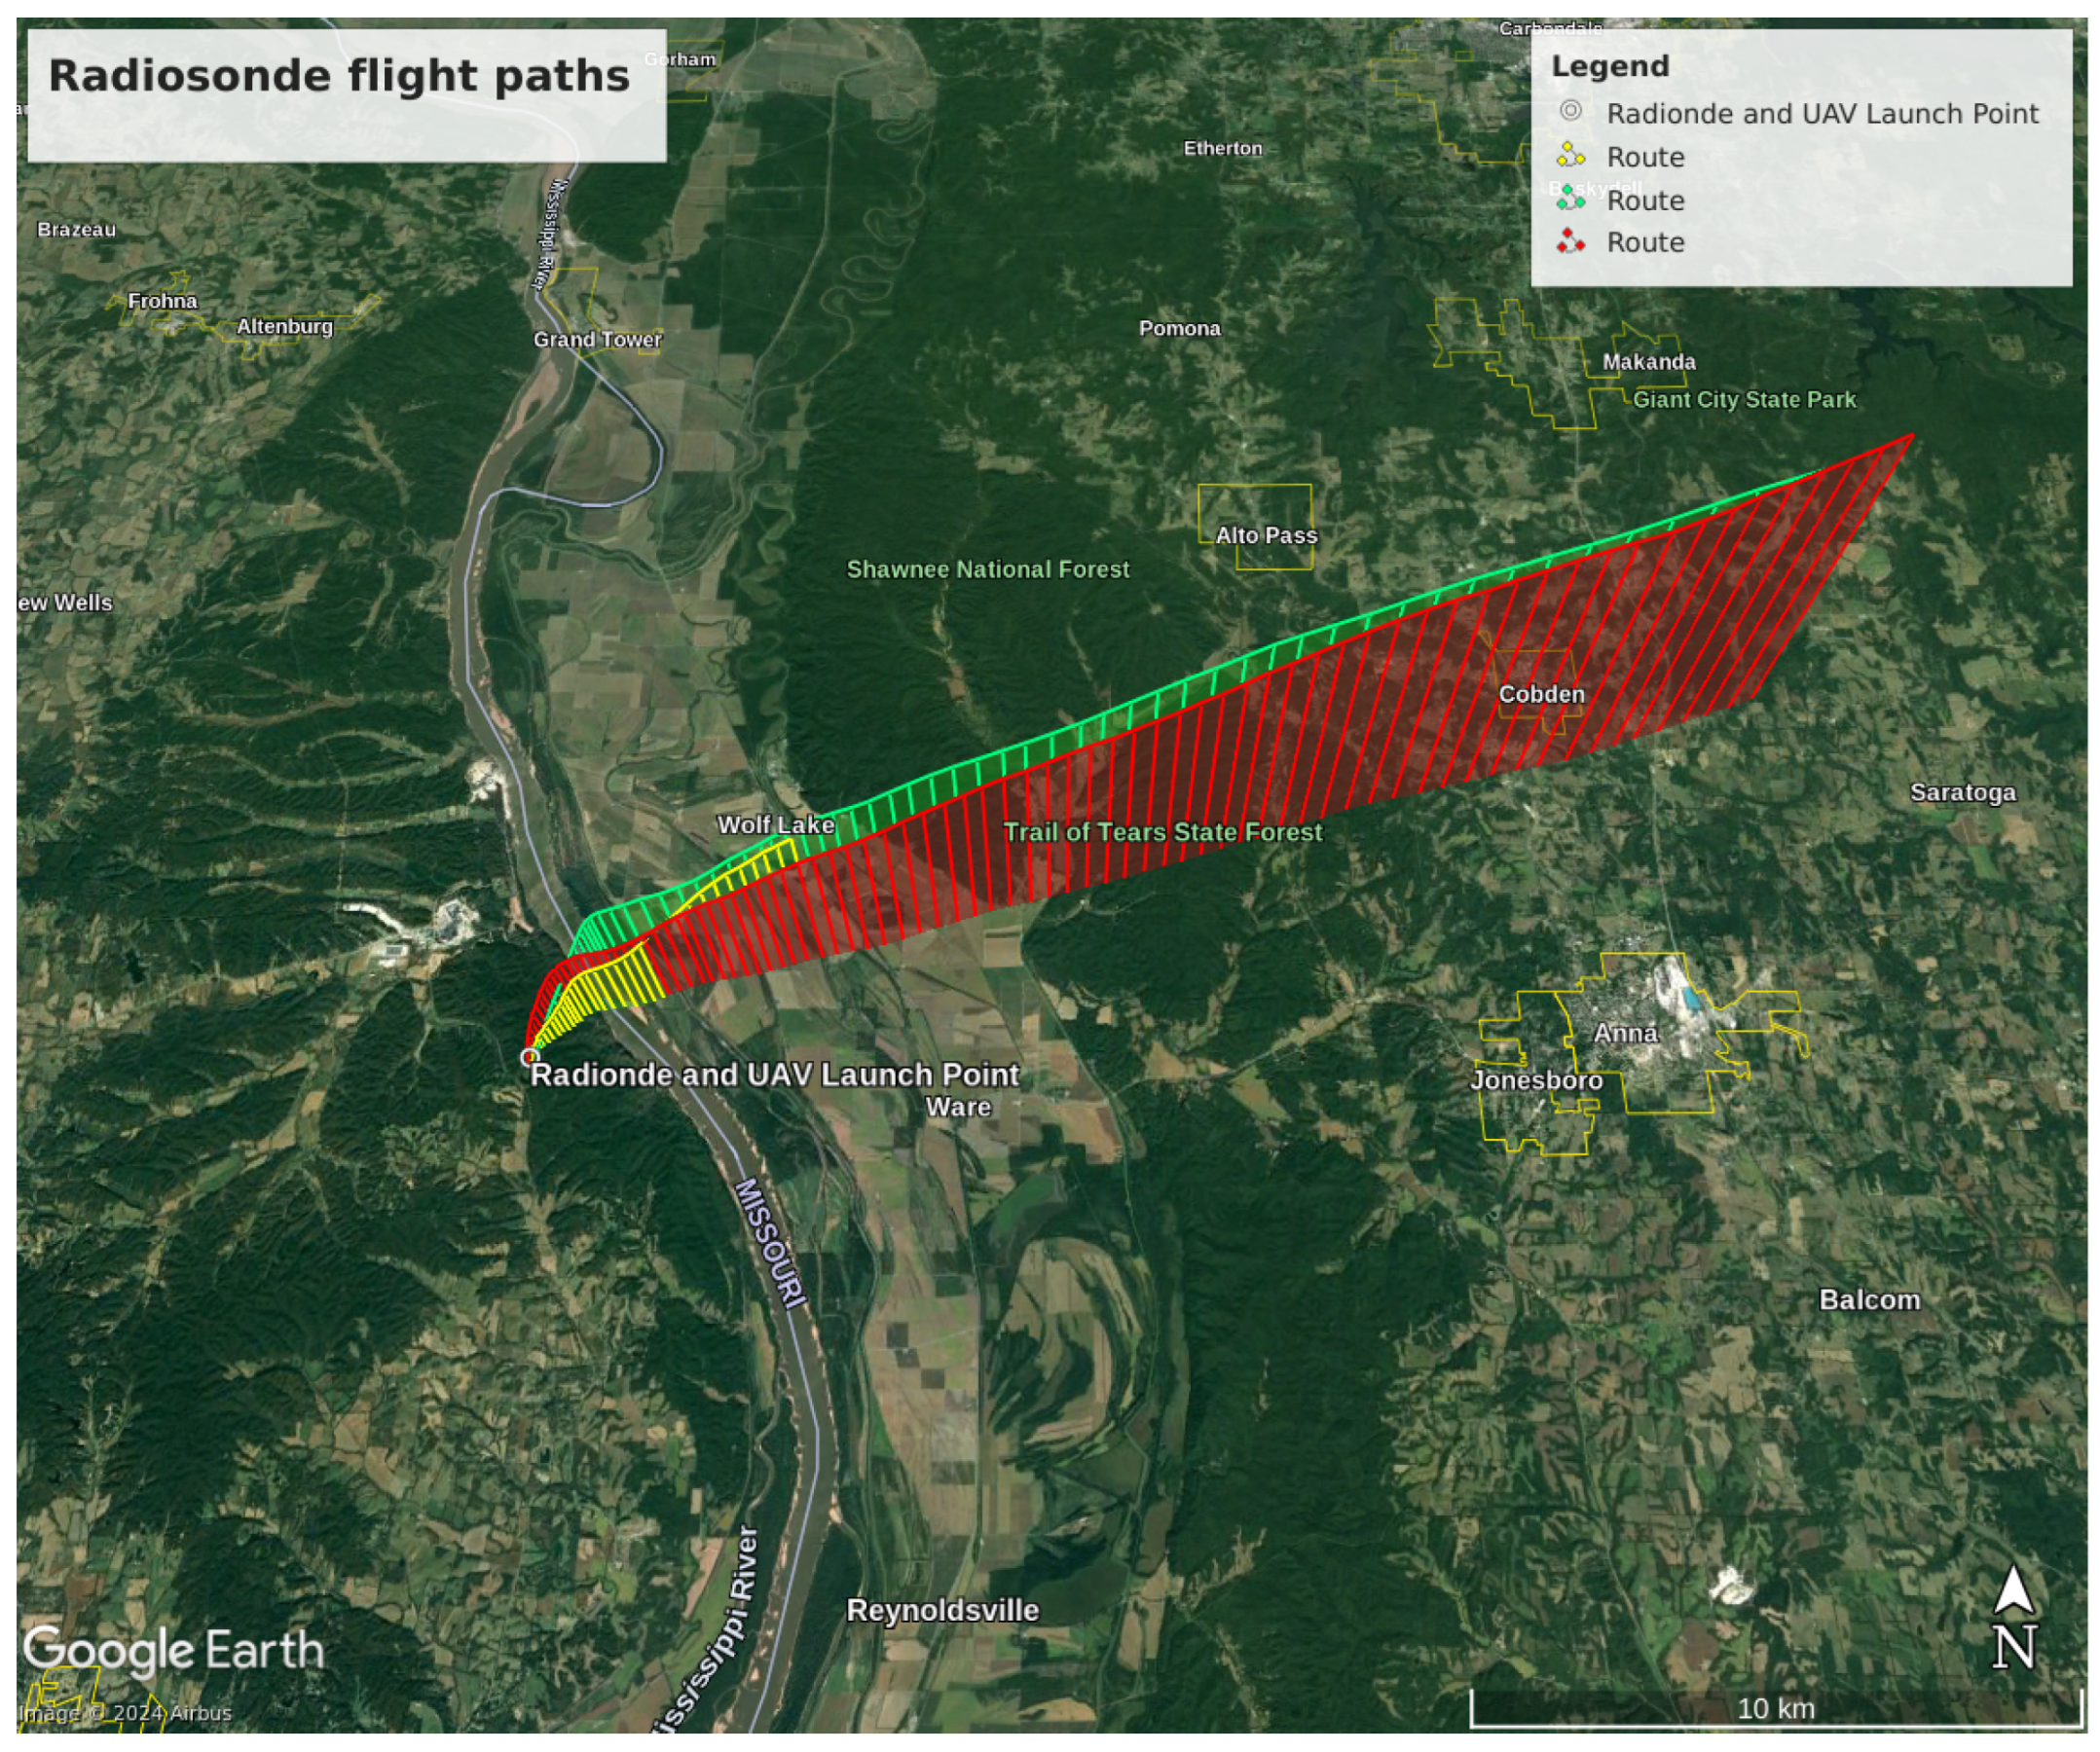
Vertical sounding profiles were captured with radiosonde and drone launches before, during and after eclipse totality. The three radiosondes launched captured temperature, dew point, relative humidity, wind and (calculated) lifted condensation level (LCL) data through various levels of the troposphere (Figure 3). The UAVs captured temperature and relative humidity data at a higher resolution from the surface to 122 m AGL, the Federal Aviation Agency maximum allowable altitude for UAVs in this airspace. The radiosondes captured alterations in the Planetary Boundary Layer (PBL) properties in correlation with the total solar eclipse. The most notable discoveries include changes in near-surface temperature, winds, PBL and LCL heights. The launch times are shown in Table 4.

Figure 3.
Radiosonde launch point in Trail of Tears State Park.
Table 4.
Sonde number, launch time, maximum height in hectoPascals and time to termination.
3.1. Radiosondes Launches
As noted in Table 4, radiosonde launches were actually conducted 49 min prior to second contact, at second contact and finally 33 min after third contact to provide context for the UAV flights. A summary of the the status and conditions for each of the radiosonde flights is given below:
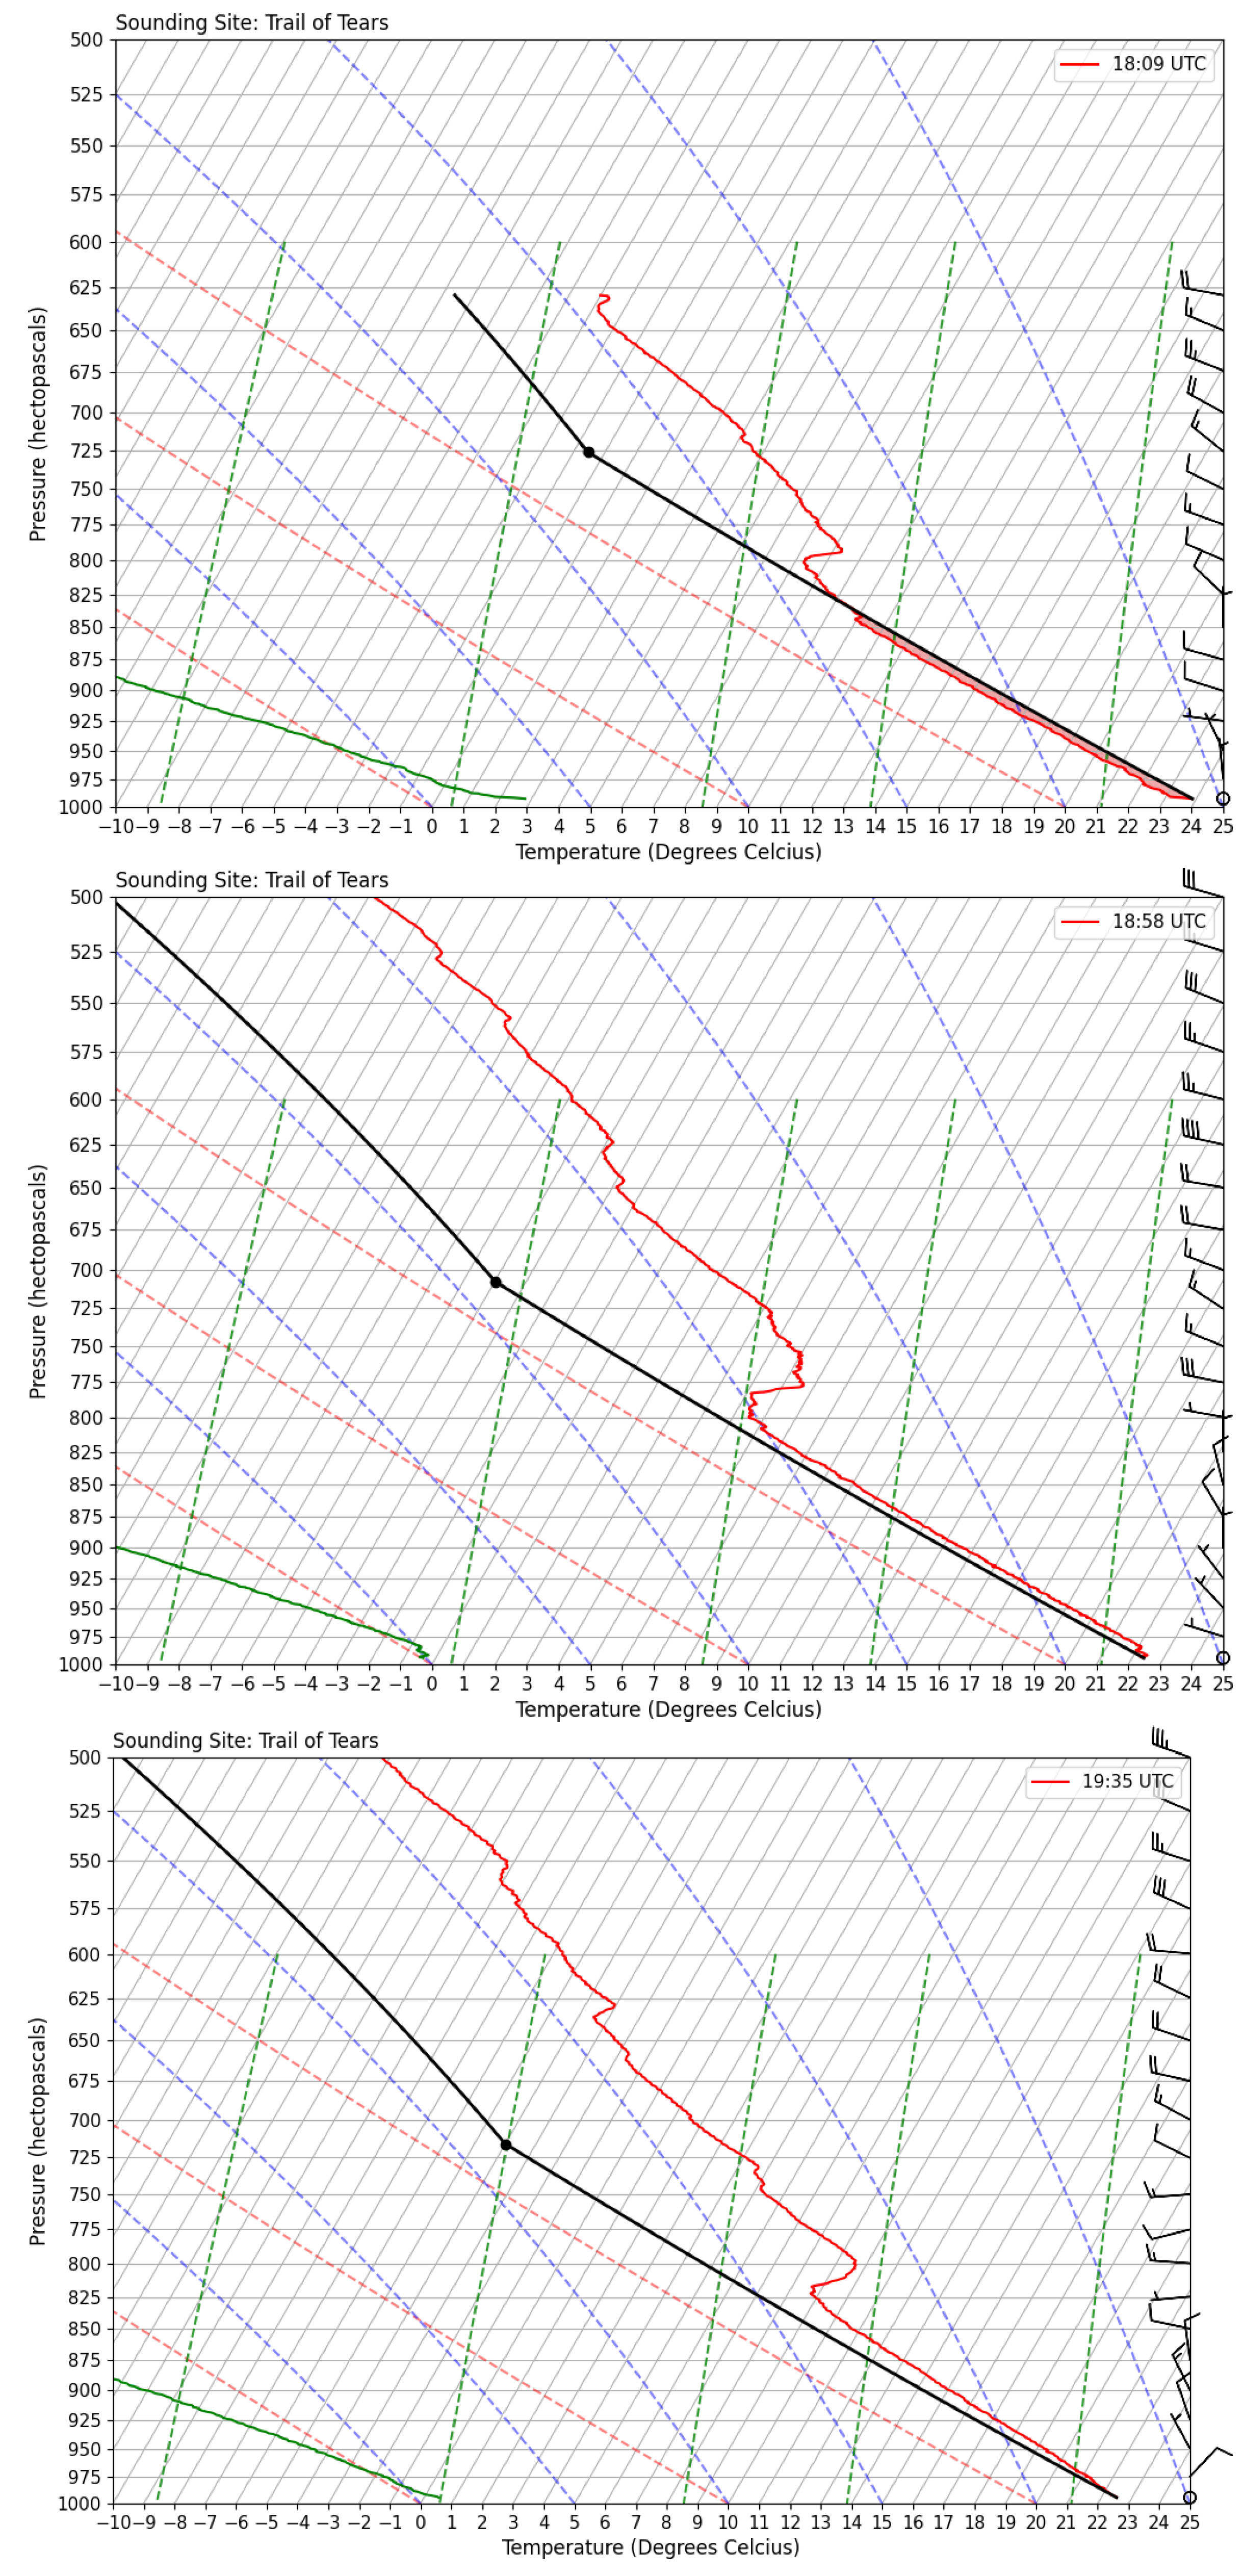
- The first radiosonde was launched at 18:09 UTC 49 min before second contact. The sonde rose until the balloon burst at 630 hPa. A temperature of 23.0 °C, dew point of −3 °C and winds of 4.5 ms−1 at 197° were recorded at the first sample height (28 m AGL) and was used to represent near-surface conditions (Figure 4). The atmosphere was dry adiabatic between 28 m to 1046 m AGL. The top of the Planetary Boundary Layer (PBL) was located at 800 hPa, characterized by a temperature inversion, wind shift a decrease in the lapse rates above the inversion. The temperature inversion was characterized by a 1.8°/100 m increase between 798 mb and 793 mb. The winds began gradually veering above the surface (190° at 28 m AGL to 223° at 1329 m AGL) where they veered relatively quickly to 267° at 1740 m AGL (808 hPa). Above the PBL, winds backed to southwesterly (235° at 752 mb). The LCL was located at 730 hPa.
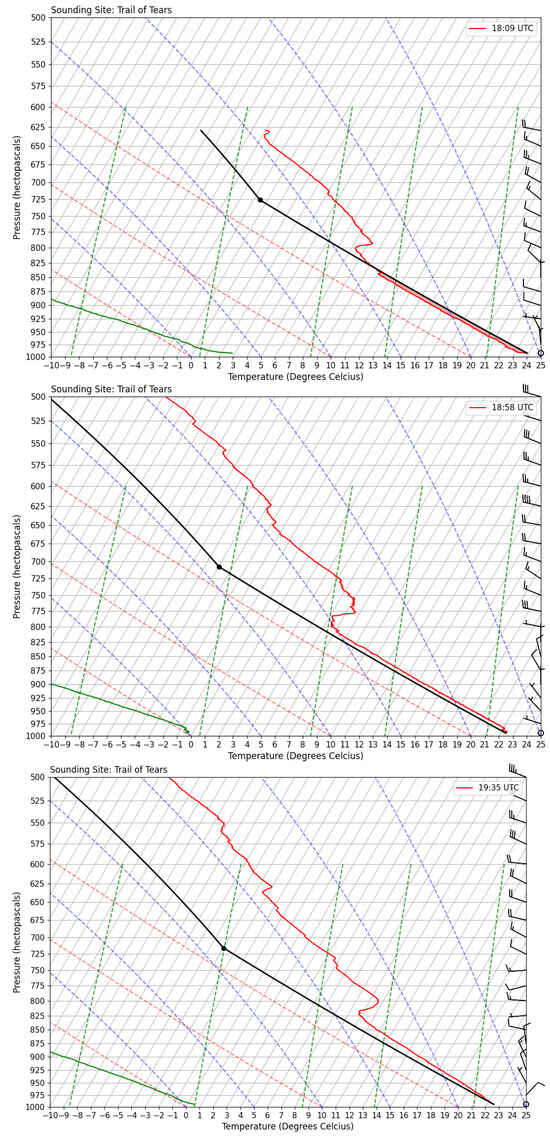 Figure 4. Skew-T plots from Trail of Tears State Parks for 18:09 UTC (top), 18:58 UTC (middle) and 19:35 UTC (bottom). Temperature trace is in red, Dew Point temperatures trace in green, surface dry adiabat in black and CAPE is shaded in red.
 - The second radiosonde was launched at second contact and rose to approximately 425 hPa during totality. A temperature of 22.0 °C, dew point of 1 °C, winds of 2.1 ms−1 at 213° at 92 m AGL were recorded (see Figure 5). Further, a small shallow temperature inversion was found just above the surface. The temperature increased from 21.9 °C at 28 m AGL to 22.3 °C at 36 m AGL before decreasing dry adiabatically throughout the rest of the PBL. The PBL height increased to approximately 775 hPa. The associated temperature inversion was characterized by a 1.9 °C/100 m increase between 780 and 776 hPa. The Wind direction stayed consistent with the near-surface winds of 213° at 29 m AGL switching direction slightly to 209° by 4218 m AGL. Winds veered from southwesterly to westerly near the top of the PBL, and backed to southwesterly once above the PBL. The LCL rose to approximately 700 hPa.
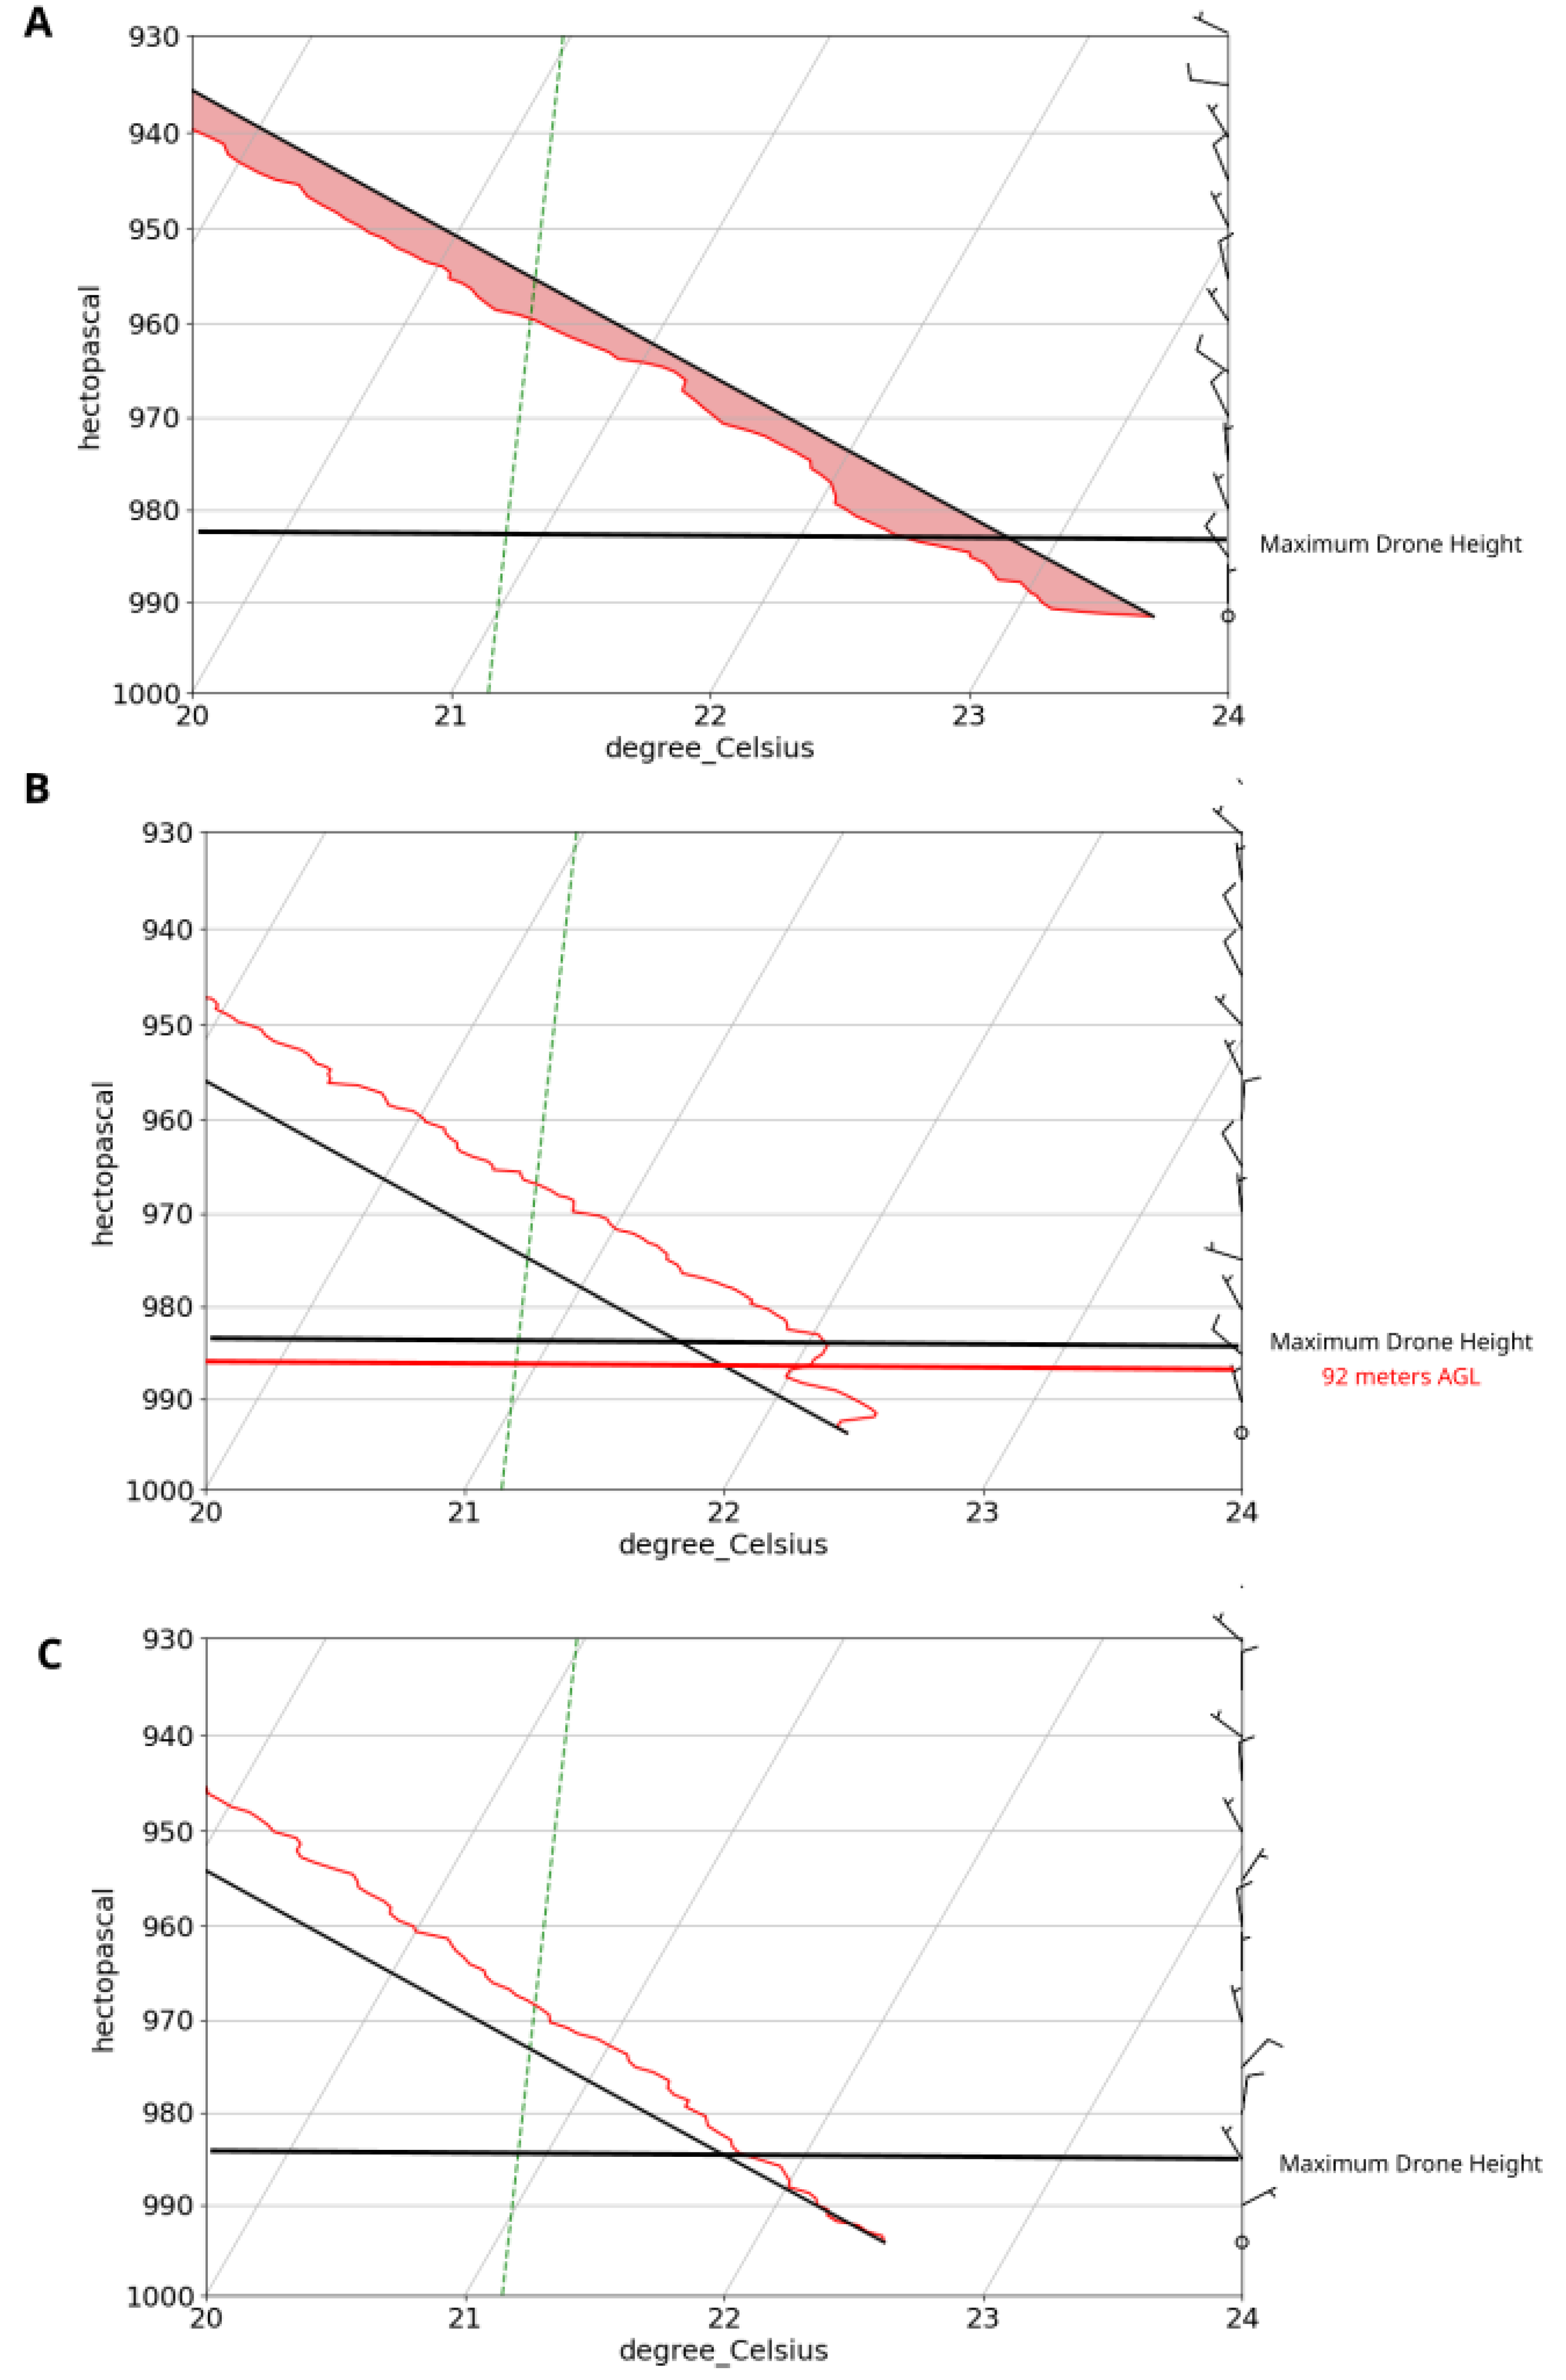
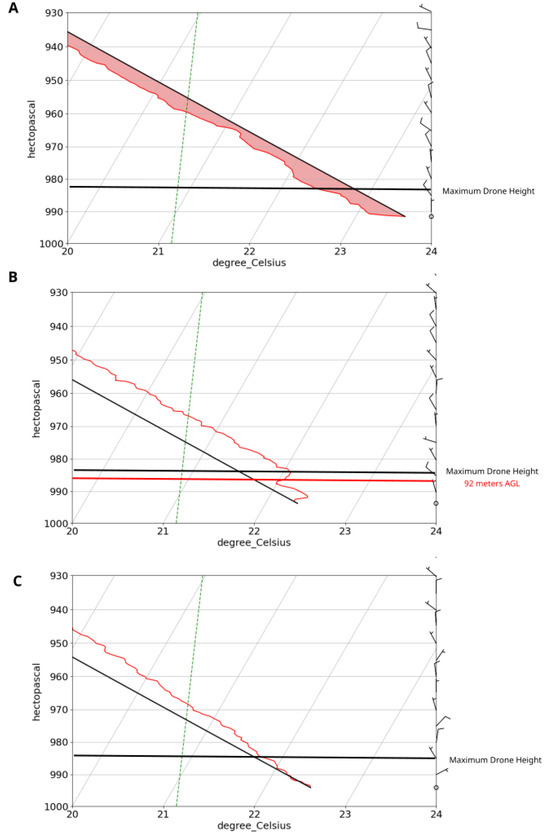 Figure 5. SkewT plots up to 980 hPa from Trail of Tears State Parks for 18:09 UTC (A), 18:58 UTC (B) and 19:35 UTC (C). Temperature trace is in red, Dew Point temperature trace in green, surface dry adiabat in black and CAPE is shaded in red.
 - The final radiosonde was launched at 19:35 UTC 33 min after third contact and rose to approximately 325 hPa. The first sounding level was at 11.5 m AGL. Here, a temperature of 22.5 °C, dew point of 2 °C and winds of 1.7 ms−1 at 172° were recorded. The slight temperature inversion detected in the second radiosonde launch disappeared and dry-adiabatic lapse rates persisted within the PBL. The PBL heights lowered to near 830 hPa. The corresponding temperature inversion increased nearly isothermally (0.42 °C/100 m) between 821 and 802 hPa. Similar to the first launch, winds within the PBL veered with height (17° at 1.5 m AGL to 230° at 1424 m AGL). Winds veered from southwesterly to westerly near the top of the PBL, and backed slightly above the PBL. The LCL lowered to 740 mb.
Data from the three radiosonde launches revealed several interesting changes within the PBL during the eclipse event. A drop of 1 °C at the surface, as well as the formation of a small shallow temperature inversion at 92 m AGL were recorded between second and third contact. This was the result of radiative heating loss at the surface at a rate greater than that of the air aloft. The winds within the PBL remain largely unidirectional during the eclipse, compared to veering with height both before and after. This was expected as the loss of radiative heating reduces the amount of mixing in the lower atmosphere thus altering vertical wind shear profiles. Lastly, the magnitude of the temperature inversion at the top of the PBL is greatest during the eclipse again due to the lower temperatures within the PBL. This created a small “capping inversion” similar to what one might find given late night and early morning stability. The reduction of solar energy caused by the total eclipse may well have caused the cooling in the PBL, while keeping the warm layer directly above.
The radiosonde data showed significant changes in the very lowest layers in the column. The 18:09 UTC and 19:35 UTC releases have nearly dry adiabatic lapse rates up to approximately 850 hPa. The 18:58 UTC sounding shows significant variability up to approximately 980 hPa and then becomes dry adiabatic (Figure 5). The loss of radiative heating results in significant cooling, but the cooling is limited to the near-surface layer.
There were further changes in the radisonde data between the second and third contact. Using the Richardson method, the height of the PBL between the first and second contact rose slightly and then lowered after third contact (Table 5). At first thought, it would be expected that the loss of radiation during the second contact would cause the PBL to sink, not rise. However, since changes in PBL height do not happen instantaneously, the radiosondes are likely to highlight the delayed reaction times resident in the PBL. The second radiosonde is launched immediately at the maximum loss of radiation. Therefore, the slight rise detected in the PBL is likely due to warm air remaining in the boundary layer from radiation escaping from the surface. The sunken PBL from the third contact is probably more representative of the PBL changes during a period of no radiative heating and mixing in the lower atmosphere. Since determining the location of the capping inversion visually is sometime difficult, PBL heights are computed using both the Richardson and capping methods Seidel [16]. Surface u and v values and height (z) values were obtained directly from sounding data. The capping method finds PBL heights that were within a few hPa of those found via the Richardson method.
where z = the height; s = the height of the surface; g = the acceleration of gravity; = virtual potential temperature; u = u wind component; v = v wind component; since is not known.
Table 5.
Sonde number, launch time and maximum height in hectoPascals (hPa).
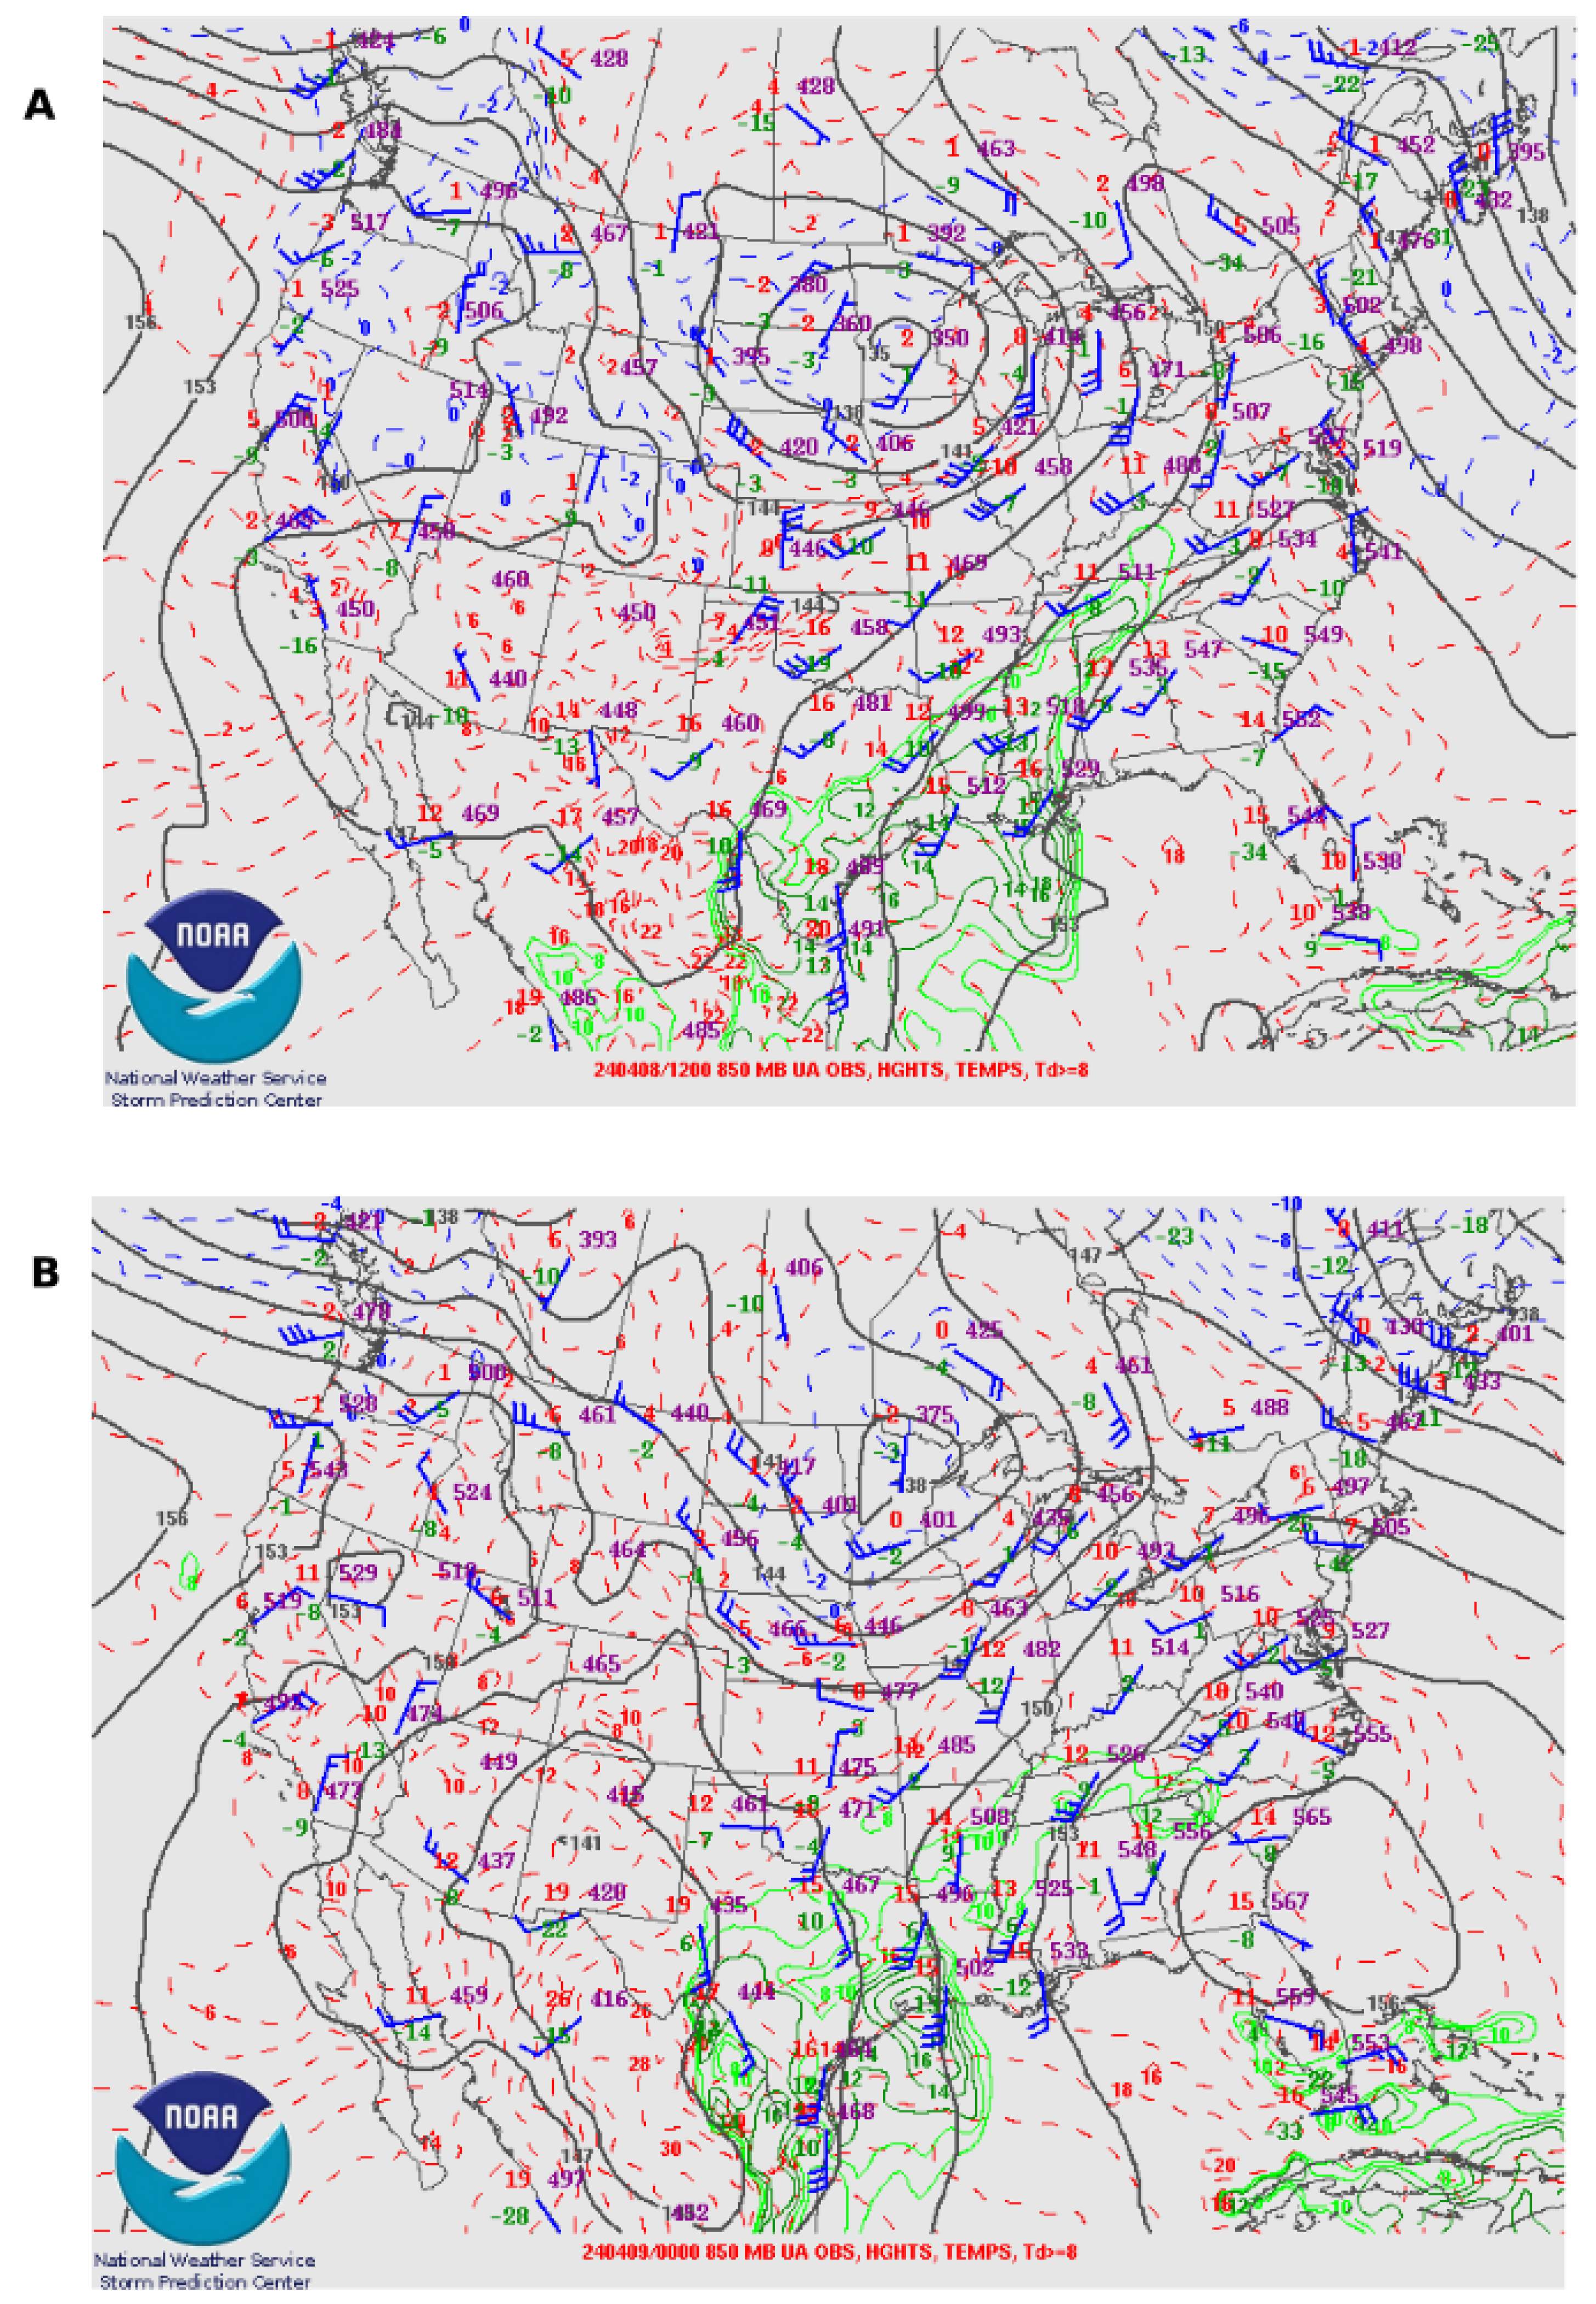
Furthermore, surface relative humidity values continued to increase even after second contact, causing the LCL to drop further. This is likely due to the increase in the surface dew point throughout the period, potentially caused by the southwesterly advection of warmer, more moist air (documented at 850 hPa Figure 6) along with continued southerly surface flow (Figure 2). Although the drop in LCL height may be due to the solar eclipse, this cannot be definitively determined from radiosonde data alone.
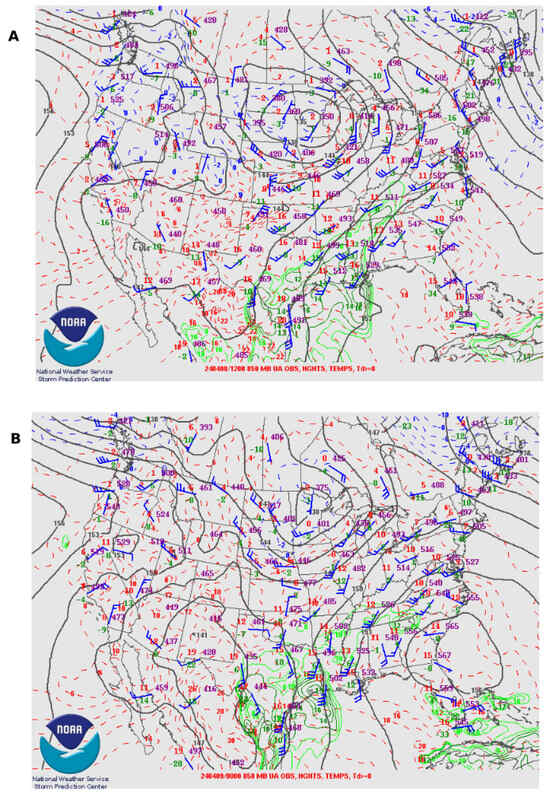
Figure 6.
850 hPa charts for 12 UTC 8 April 2024 (A) and 00 UTC 9 April 2024 (B).
3.2. UAV Flights
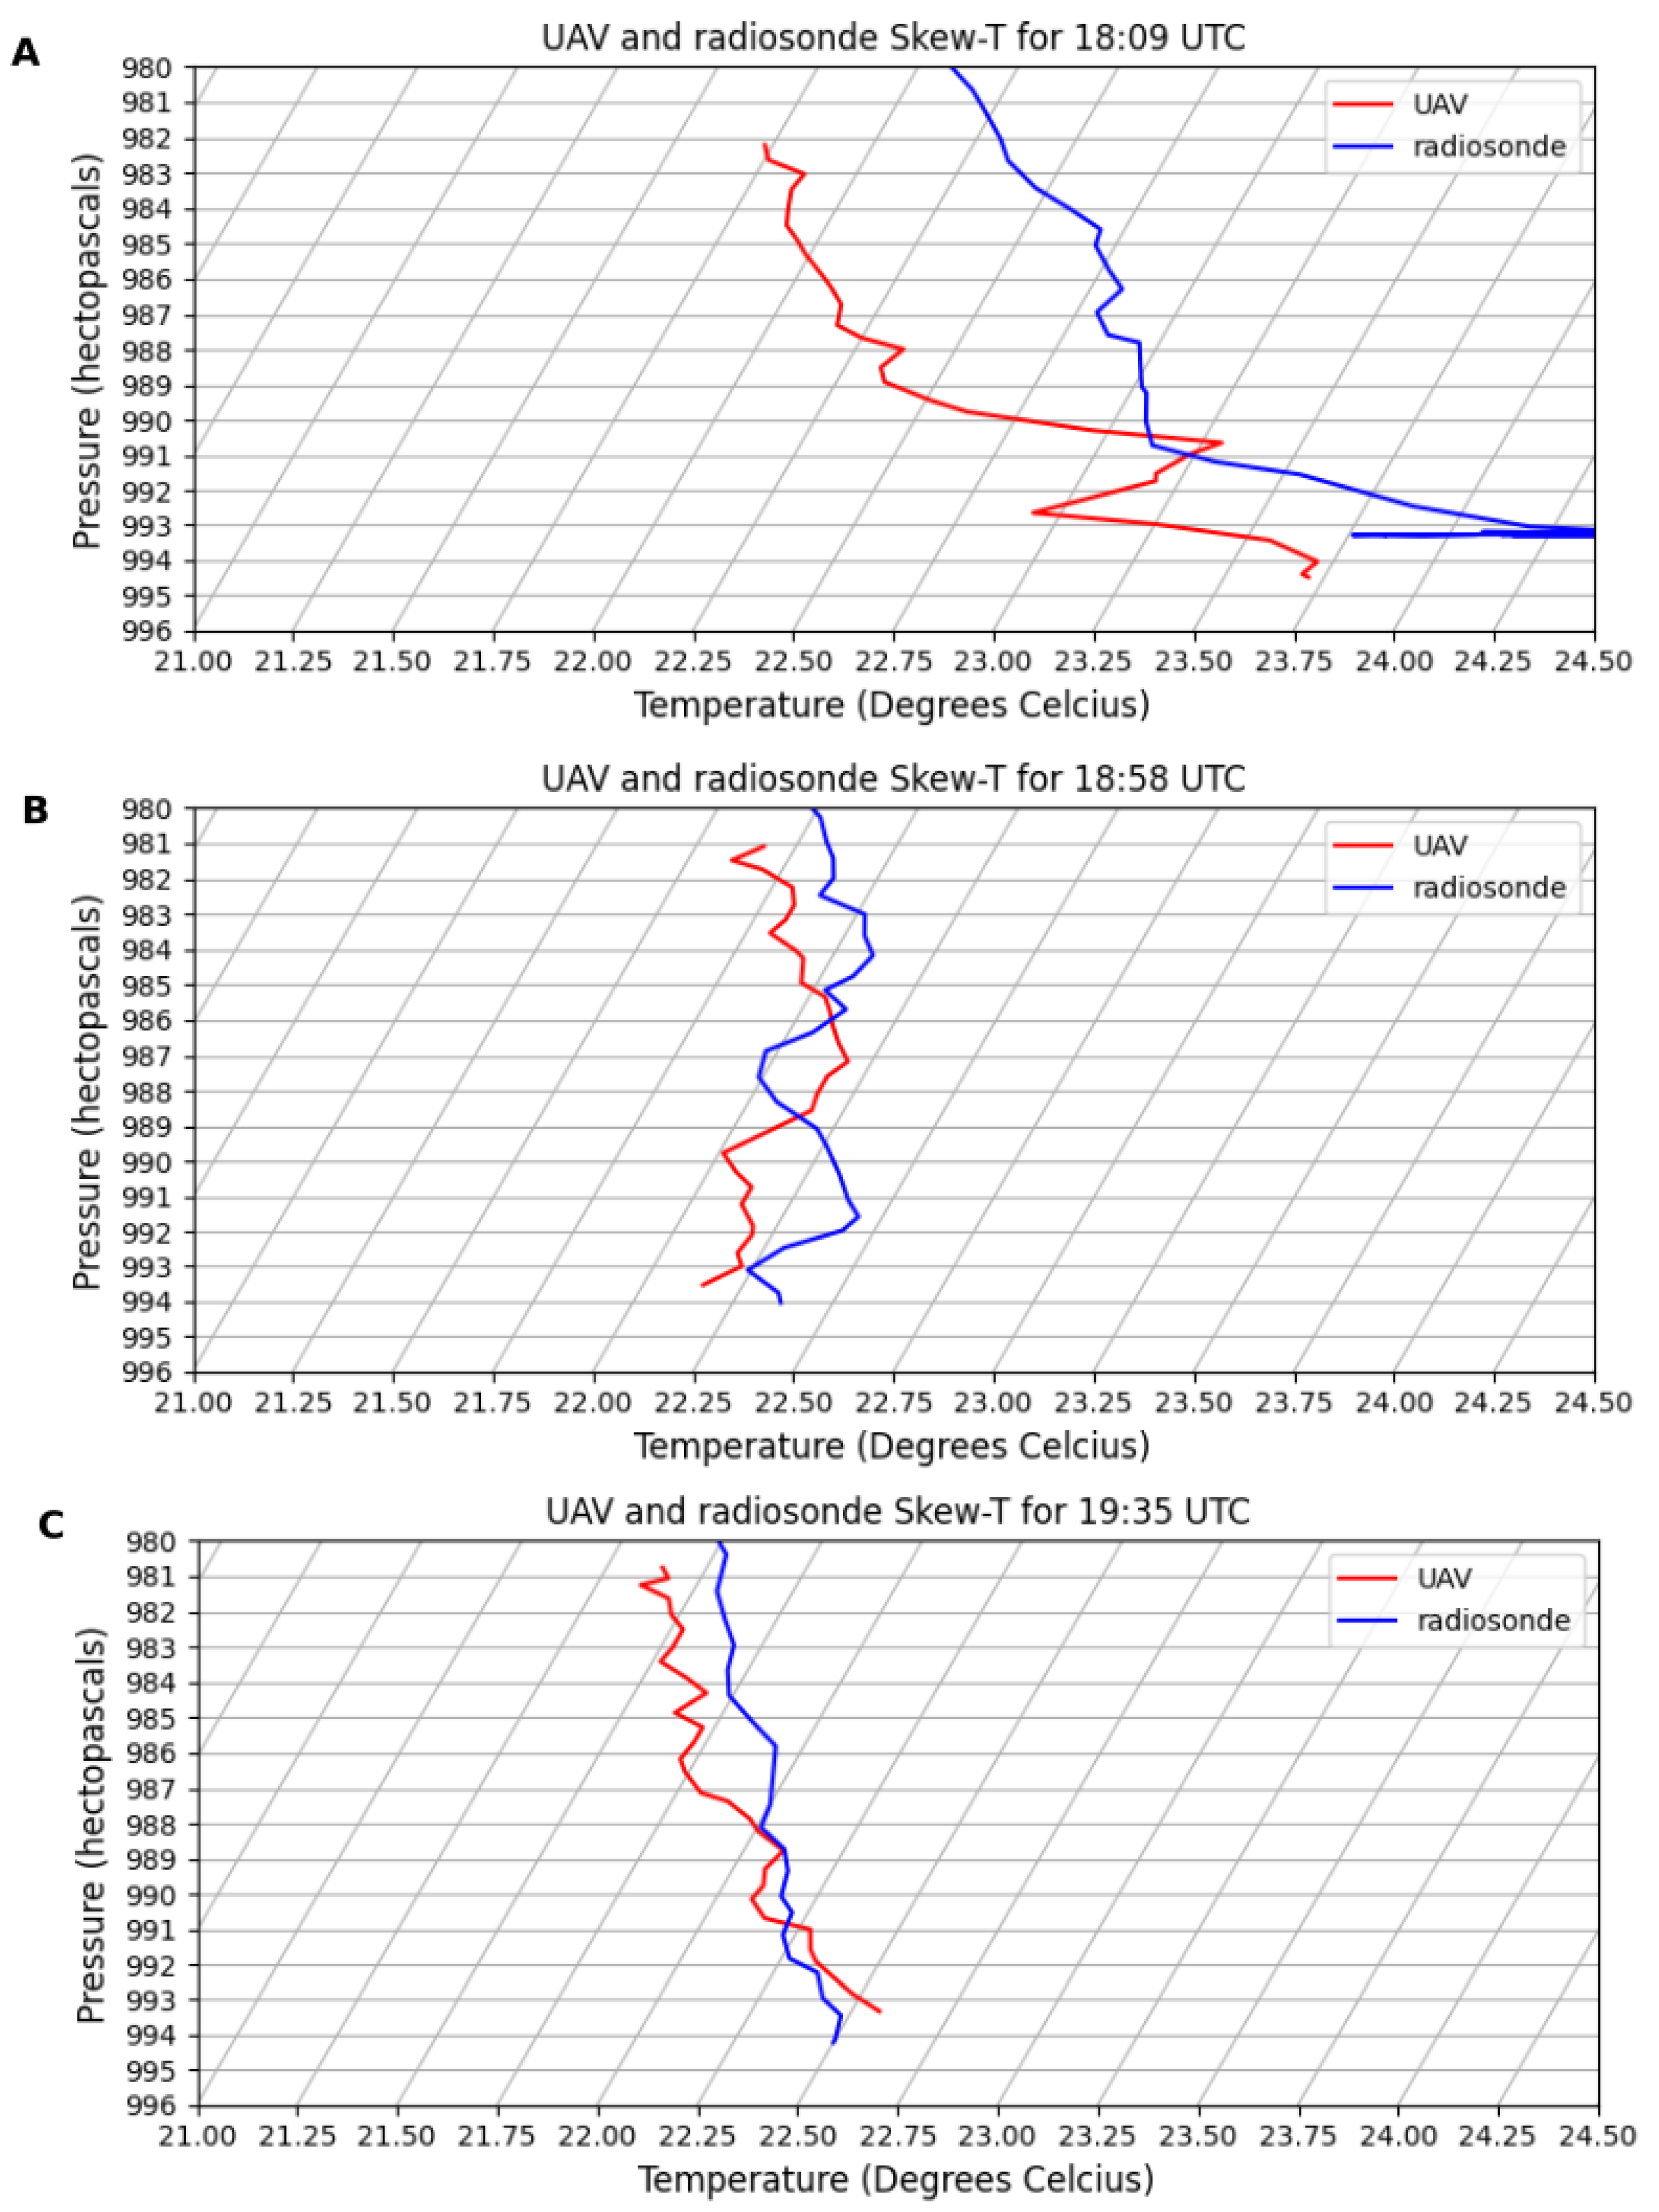
UAVs were used to document possible PBL profile changes observed within the 0–122 m aloft range: changes before, during and after totality. Two different brands of UAV were used: (1) Potensic ATOM SE Drone and (2) DJI Spark Drone. Both used the iMet-XQ met sensor. The iMET-XQ sensor was attached to the Potensic Atom SE with velcro to the upper case of the UAV (Figure 7). The intent was to minimize the effect of prop wash on the sensor. It is impossible to avoid some effects of the UAV itself on PBL measurements, but as Kimball et al. [14] noted, these effects can be mitigated. To ensure that UAV-borne sensors recorded consistent quality data, iMet-XQ data was compared to iMET-4 radiosonde data (Figure 8). There were small differences present. The maximum difference of 0.6 °C can be explained by differences in sensor response times, sensor accuracy and iMET-XQ positioning in drones. The Potensic Atom SE drone had the iMet-XQ sensor placed on top center of the UAV. That position was chosen to minimize the effects of the propellers on the sensed data. Similarly, the iMet-XQ sensor was attached to the bottom of the DJI Spark UAV body. Problems with the iMet-XQ sensor flown on the DJI UAV prohibited the collection of relative humidity data. Temperature data from the DJI UAV however was recorded, so only temperature changes between the Potensic Atom SE and DJI Spark were available for comparison. The UAVs were tested before formal balloon launches to ensure sensor and drone functionality.
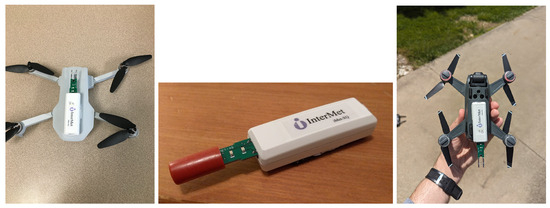
Figure 7.
Potensic Atom SE with iMet-XQ attached (left), InterMetsystems iMET-XQ sensor (center), DJI Spark with with iMet-XQ attached (right).
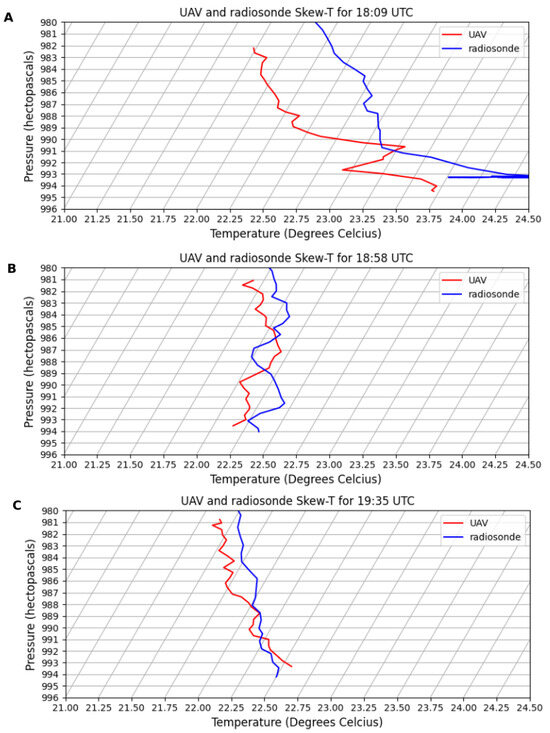
Figure 8.
Overlaid Potensic UAV and radiosonde data from Trail of Tears State Parks at (A) 18:09 UTC, (B) 18:58 UTC and (C) 19:35 UTC.
Three (3) UAV flights were performed for this experiment. (NOTE: Both UAVs were flown together with each radiosonde launch). All UAV vertical data profiles collected with each individual radiosonde launch are considered to be one (1) UAV flight. The first flight began at 18:09 UTC and consisted of an ascent to 122 m and a descent back to the surface and flown at the same time as the 18:09 UTC radiosonde launch. The second flight began at 18:58 UTC and consisted of six (6) ascents/descents with the initial ascent concurrent with the second radiosonde launch. The third flight began at 19:35 UTC and consisted of four (4) ascents/descents. The flight launches again were designed to be concurrent with radiosonde flights. Both provided a timeline of how temperature, moisture and pressure changed during each stage of the eclipse.
A summary of the UAV flights is provided below:
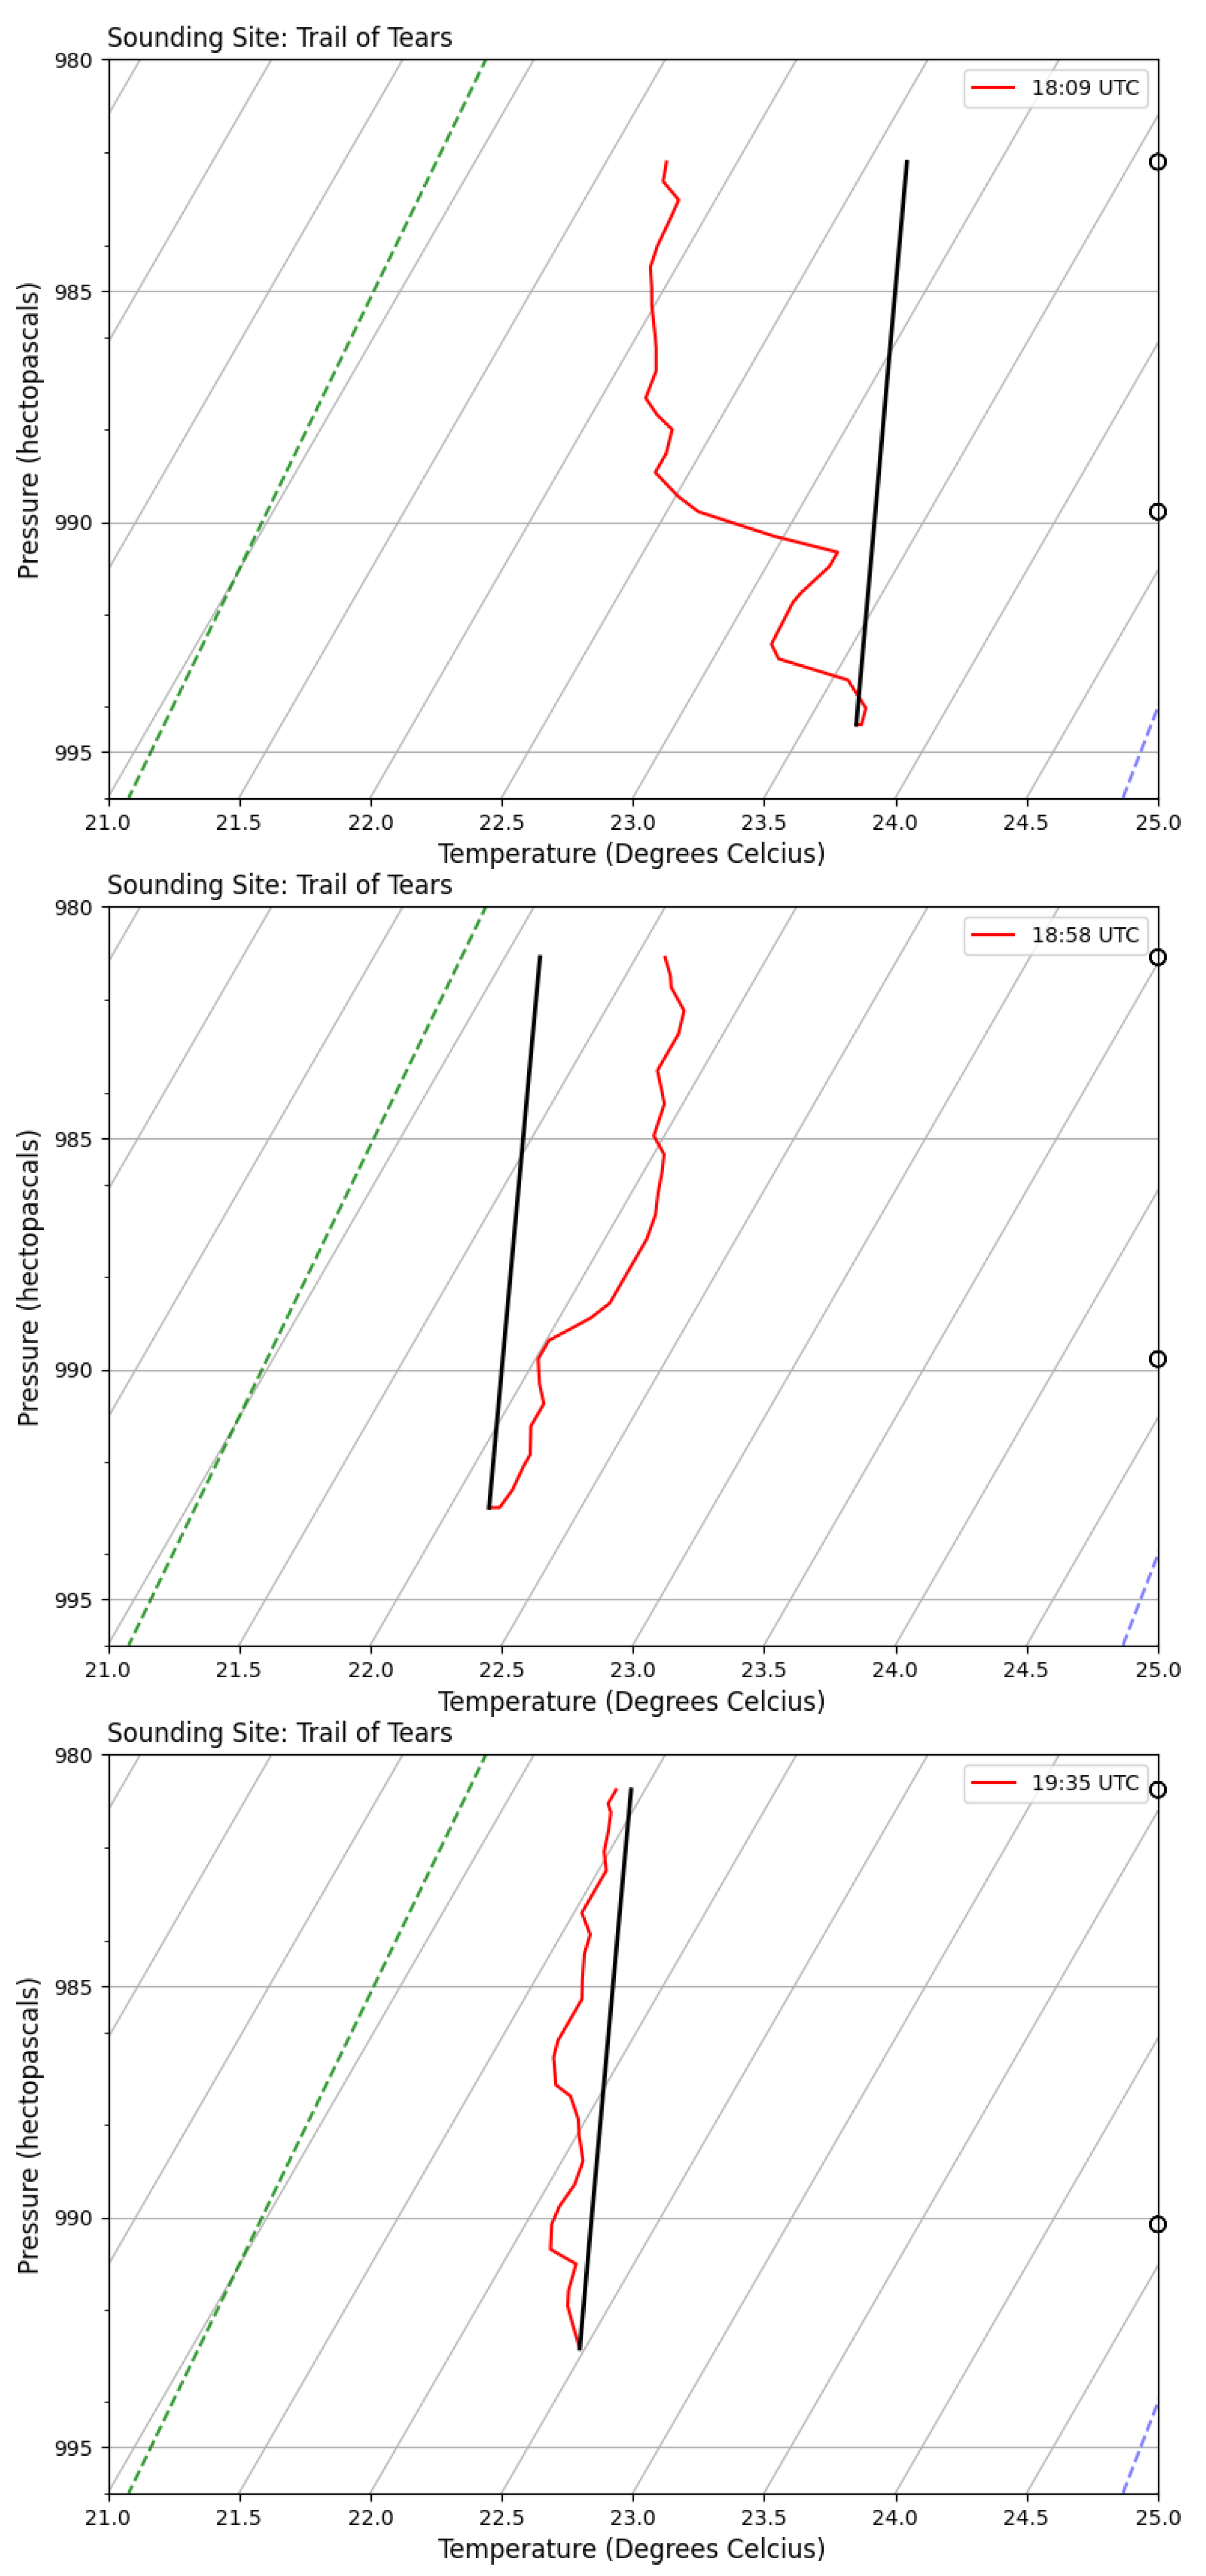
- The first flight was through a largely mixed atmosphere. The Potensic 18:09 UTC flight showed an unstable sounding throughout the column, which was indicative of the dry and warm conditions. The inversion at 991 hPa could have been caused by external factors such as the surrounding trees and the nearby lake (Figure 9). DJI flights showed the effect of the defective sensor package, with a large gap in the 18:11 UTC flight, 30 knot winds at 992 hPa and inconsistent results on other flights. Given the poor-quality data from DJI flights, DJI data will not be further discussed.
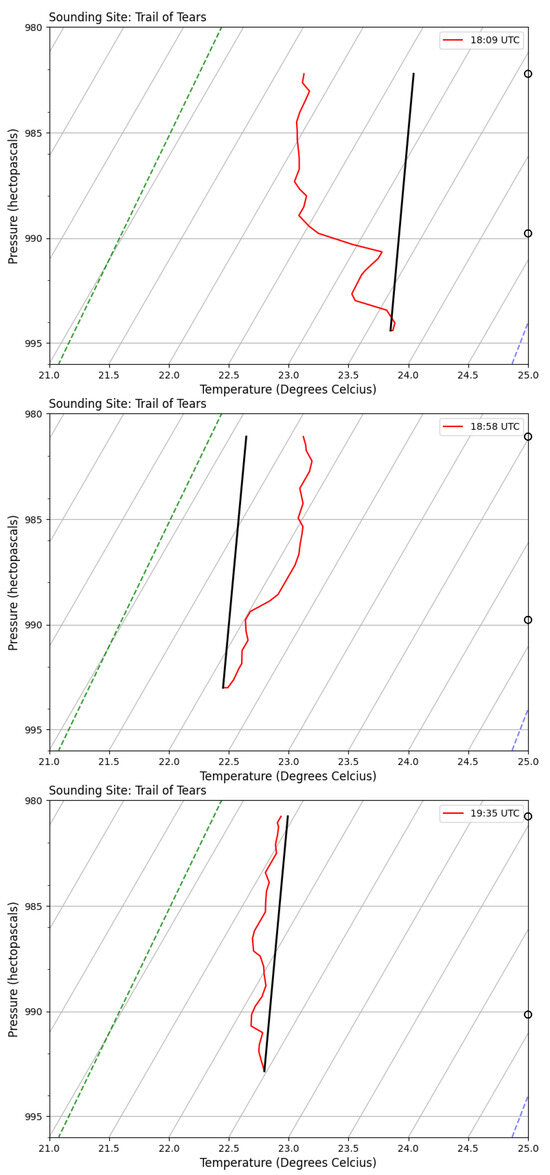 Figure 9. Potenisc UAV plots from Trail of Tears State Parks for 18:09 UTC (top) 18:58 UTC up bound (middle) and 19:35 UTC down (bottom). Temperature trace is in red, surface dry adiabat in black.
 - During the second flight, the column turned stable showing a weak inversion at 989 hPa. Both of these inversions (991 hPa and 989 hPA) are probably surface radiative inversions that could indicate the effect totality had on the environment.
- The third flight at 37 min after totality indicated a return towards the initial conditions. The temperature profile again became unstable and the inversion disappeared largely. The 18:09 UTC and 19:35 UTC flights showed indications of a small amount of CAPE on the Potensic flight. This shows the amount of time it takes for the PBL to recover after totality.
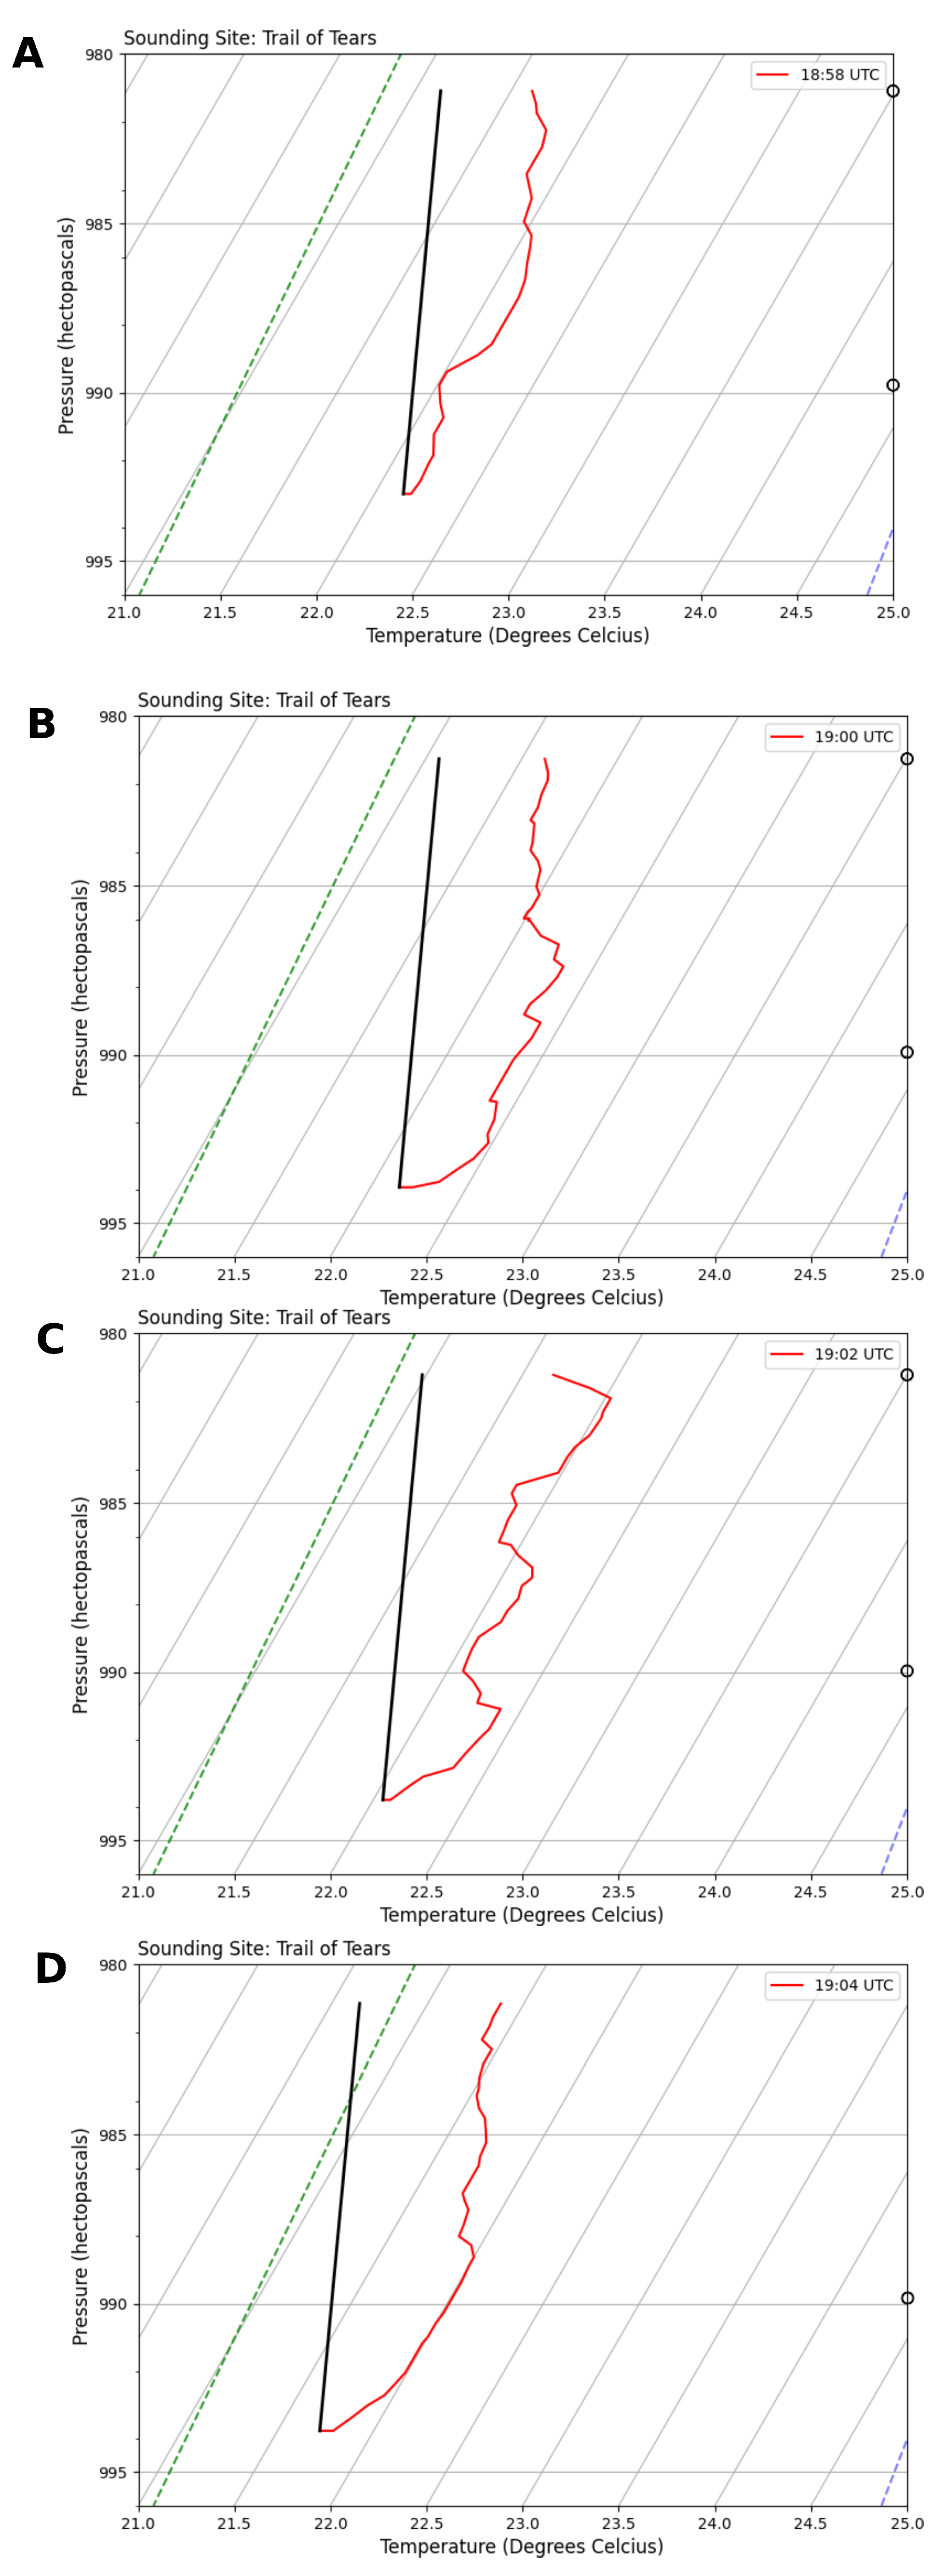
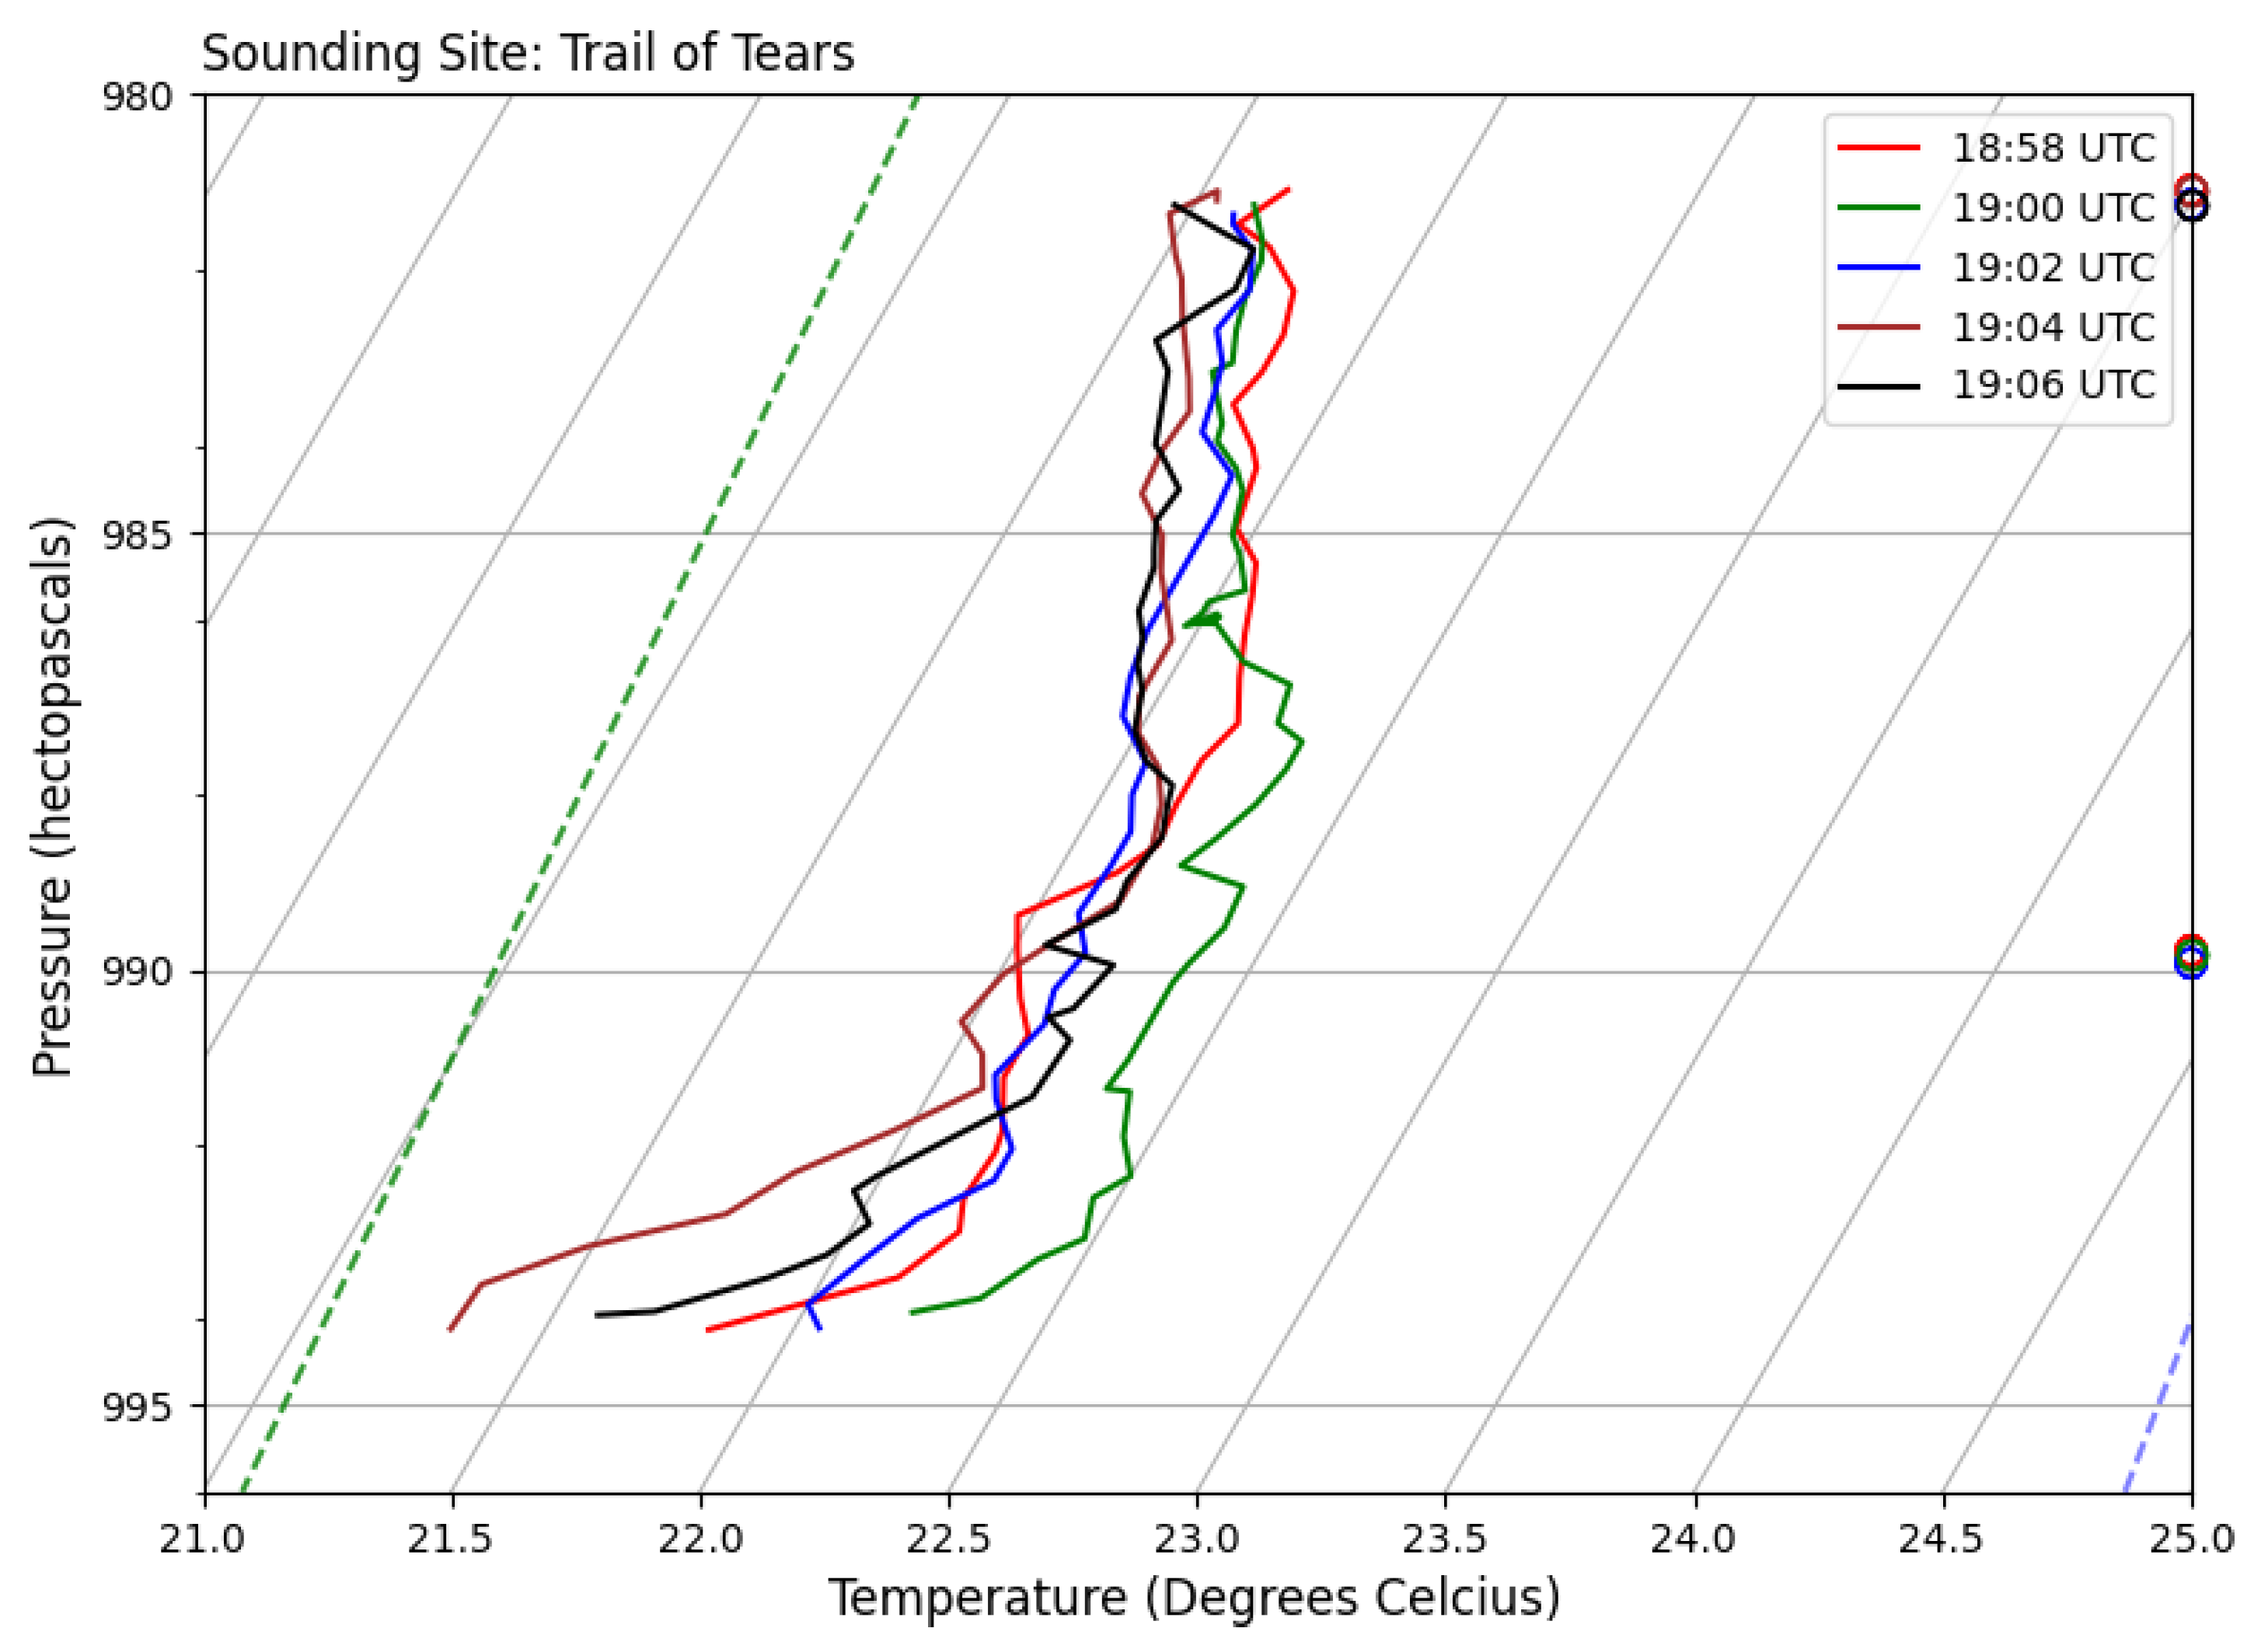
The flexibility of the UAV allows us to examine in detail the temporal changes in the lowest levels of the PBL. The multiple ascents and descents from the second UAV flight are presented in Figure 10. When interpreting these serial sounds, care must be taken. During ascents and descents, the sensors are exposed to differing amounts of prop wash as well as the PBL atmosphere. During ascent, prop wash is minimized but the probe is exposed to flow over the UAV. On descent, the probe prop wash is maximized, but the flow has passed over the UAV. The 18:58 UAV sounding shows a small inversion just above 990 hPa. The 19:00 UTC sounding showed a warming at the lowest levels, which resulted in a profile similar to Figure 15 in Pasken et al. [7]. That profile indicated rapid cooling at the surface. As the eclipse progressed, the surface continued to cool with mixing occurring. The lowest layers of the column continued to cool (see Figure 11), resulting in a significant inversion that strengthened until approximately 2 min after the third contact. By 19:04 UTC, the inversion reached a maximum of 0.8 °C at 33.6 m. After third contact occurred, the lowest layers cooled towards pre-eclipse values, recovering 0.4 °C in 2 min. Since the objective of the UAV flights was to monitor the temporal changes in the PBL, the 19:06 UTC flight was the last until the comparison flight at 19:35 UTC.
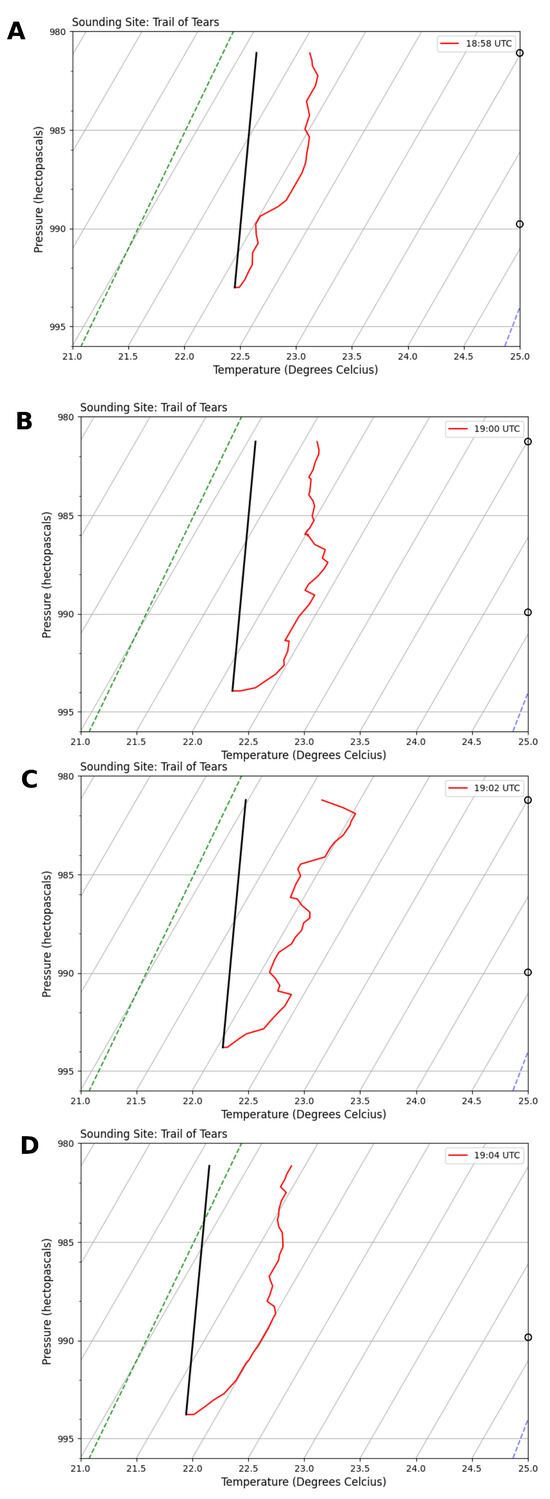
Figure 10.
Potensic UAV plots from Trail of Tears State Parks for (A) 18:58 UTC, (B) 19:00 UTC, (C) 19:02 UTC, (D) 19:04 UTC. Temperature trace is in red, surface dry adiabat in black.
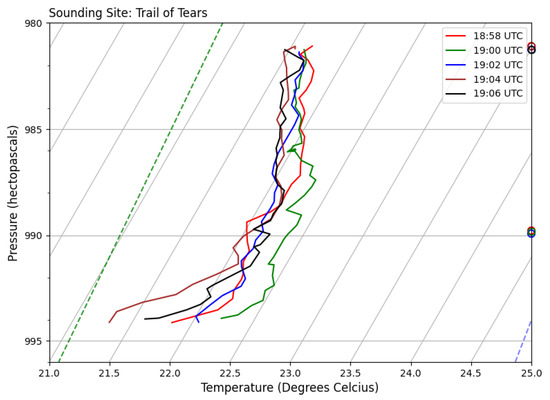
Figure 11.
Overlaid Potensic UAV plots from Trail of Tears State Parks for 18:58 UTC, 19:00 UTC, 19:02 UTC, 19:04 UTC and 19:06 UTC.
4. Summary of Results
Data from the three radiosonde and UAV launches showed significant profile changes in the PBL across the solar eclipse event. Radiosondes launched on the center line of the eclipse showed a rapid cooling, which resulted in a strengthening low-level inversion followed by dry adiabatic ascent. Unlike the 29 hPa PBL height change observed during the 2017 total solar eclipse (Pasken et al. [7]), there were no significant changes to the PBL heights until after the eclipse event was completed. PBL heights remained nearly constant until well after third contact when a 35 hPa lowering of the PBL heights was observed. The lack of change in PBL height may be the result of the warm and dry conditions present during the 2024 eclipse. Based on radiosonde and UAV observations, PBL height changes took significantly longer to recover compared to surface observations. Where the surface began recovery within 5 min after third contact, PBL height changes took upwards of 20 min. Since only one radiosonde was launched during totality, further temporal changes to the PBL could not be observed via radiosondes. UAVs observed temporal changes in the PBL profile during multiple ascents and descents during totality. The UAV soundings demonstrated the development of a strong inversion in the lowest 100 m of the PBL. This inversion was similar to that described by Pasken et al. [7], although not as deep. As the eclipse progressed, mixing began to occur. This first resulted in a warming at the surface. As the mixing continued, the air below 990 hPa rapidly cooled with a nearly 1 °C drop in temperature observed. Recovery then began towards PBL pre-eclipse initial conditions. This evolution needs further investigation.
5. Conclusions
In this paper, we have presented a novel set of observations and analyses addressing a specific swath of a total solar eclipse path. The path observed covered part of southeast Missouri on 8 April 2024. The focus of our effort was to collect high-quality spatial and temporal measurements in the planetary boundary layer (PBL) to assess how the PBL responds to the loss of radiative heating. Novel aspects of this study include the collection of high-resolution UAV data to measure temperature and moisture content at a high temporal resolution.
The three radiosonde soundings show that no significant changes to the PBL heights occurred until after totality. PBL heights remained nearly constant until well after third contact when a 35 hPa lowering of the PBL heights was observed. In addition, the UAV data clearly showed the development of a strong inversion in the lowest 100 m of the PBL. These observations were only possible because the UAVs were able to make multiple ascents and descents in the PBL rather than the single profile a radiosonde provides.
Due to the increased resolution, the delay in mixing and changes in the PBL height were documented. This was different from previous studies that exclusively relied on radiosonde data, which yielded a lower temporal resolution and could only be launched at certain intervals. The results of the UAV flights document the localized and brief effect that the total solar eclipse had on the vertical structure of the atmosphere. The UAV results show the advantages of using UAVs to collect data in the lowest levels of the PBL. Performing discrimination with care should be performed while analyzing UAV data. We noticed differences in data profiles based upon sensor location on the UAVs.
Given that this is a preliminary analysis of the state of the atmosphere before the eclipse and not how the terrain affects the results, the results have not been studied in enough detail to include in this article. More studies are warranted. We expect that more detailed analyses with a comparison of radiosonde and UAV launches under similar conditions at the same location would provide a more detailed picture of the event.
Author Contributions
Conceptualization, R.P.; methodology, R.P., J.B., M.I., R.J. and B.S.; visualization, R.P.; writing—original draft preparation, R.P., J.B., M.I., R.J. and B.S.; data curation, J.B., C.H., M.I., R.J., J.R. and B.S.; investigation, R.P., J.B., C.H., M.I., R.J., J.R. and B.S.; resources, J.B., C.H. and J.R.; writing—review and editing, R.W.; supervision, R.W.; project administration, R.W. All authors have read and agreed to the published version of the manuscript.
Funding
This research received no external funding.
Data Availability Statement
Restrictions apply to the availability of these data. These data were collected collaboration with the Missouri Department of Natural Resources, the Missouri Soybean Growers Association and Community Colleges across the state. Release of data from these sites will require Memorandum of Agreements from each individual location. Further, as noted in the title, this is a preliminary analysis and further work to ensure quality data needs to be done.
Acknowledgments
The authors would like to thank Ameren Missouri for the initial funding of the SEAMLESS mesonet, the Department of Earth and Atmospheric Sciences for continued funding of the SEAMLESS mesonet, logistical and administrative support. They would also like to thank Virginia Pasken for her editorial work.
Conflicts of Interest
The authors declare no conflicts of interest.
References
- Clayton, H.H.; Rotch, A.L.; Pickering, E.C. The eclipse cyclone and the diurnal cyclones. In Annals of the Astronomical Observatory of Harvard College; The Observatory: Cambridge, UK, 1901; Volume 43, 33p. [Google Scholar]
- Amiridis, V.; Melas, D.; Balis, D.S.; Papayannis, A.; Founda, D.; Katragkou, E.; Giannakaki, E.; Mamouri, R.E.; Gerasopoulos, E.; Zerefos, C. Aerosol Lidar observations and model calculations of the Planetary Boundary Layer evolution over Greece, during the March 2006 Total Solar Eclipse. Atmos. Chem. Phys. 2007, 7, 6181–6189. [Google Scholar] [CrossRef]
- Aplin, K.L.; Scott, C.J.; Gray, S.L. Atmospheric changes from solar eclipses. Philos. Trans. R. Soc. A Math. Phys. Eng. Sci. 2016, 374, 20150217. [Google Scholar] [CrossRef] [PubMed]
- Ahrens, D.; Iziomon, M.G.; Jaeger, L.; Matzarakis, A.; Mayer, H. Impacts of the solar eclipse of 11 August 1999 on routinely recorded meteorological and air quality data in south-west Germany. Meteorol. Z. 2001, 10, 215. [Google Scholar] [CrossRef]
- Hanna, E. Meteorological effects of the solar eclipse of 11 August 1999. Weather 2000, 55, 430–446. [Google Scholar] [CrossRef]
- Founda, D.; Melas, D.; Lykoudis, S.; Lisaridis, I.; Gerasopoulos, E.; Kouvarakis, G.; Petrakis, M.; Zerefos, C. The effect of the total solar eclipse of 29 March 2006 on meteorological variables in Greece. Atmos. Chem. Phys. 2007, 7, 5543–5553. [Google Scholar] [CrossRef]
- Pasken, R.; Halverson, J.; Braunschweig, P. Surface Mesonet and Upper Air Analysis of the August 21, 2017 Total Solar Eclipse. Atmosphere 2023, 14, 1412. [Google Scholar] [CrossRef]
- Fowler, J.; Wang, J.; Ross, D.; Colligan, T.; Godfrey, J. Measuring ARTSE2017: Results from Wyoming and New York. Bull. Am. Meteorol. Soc. 2019, 100, 1049–1060. [Google Scholar] [CrossRef]
- Colligan, T.; Fowler, J.; Godfrey, J.; Spangrude, C. Detection of stratospheric gravity waves induced by the total solar eclipse of July 2, 2019. Sci. Rep. 2020, 10, 19428. [Google Scholar] [CrossRef] [PubMed]
- Burt, S. Meteorological responses in the atmospheric boundary layer over southern England to the deep partial eclipse of 20 March 2015. Philos. Trans. R. Soc. A Math. Phys. Eng. Sci. 2016, 374, 20150214. [Google Scholar] [CrossRef] [PubMed]
- Palomaki, R.T.; Babić, N.; Duine, G.J.; van den Bossche, M.; De Wekker, S.F. Observations of Thermally-Driven Winds in a Small Valley during the 21 August 2017 Solar Eclipse. Atmosphere 2019, 10, 389. [Google Scholar] [CrossRef]
- Harrison, R.G.; Marlton, G.J.; Williams, P.D.; Nicoll, K.A. Coordinated weather balloon solar radiation measurements during a solar eclipse. Philos. Trans. R. Soc. A Math. Phys. Eng. Sci. 2016, 374, 20150221. [Google Scholar] [CrossRef] [PubMed]
- Gray, S.L.; Harrison, R.G. Eclipse induced wind changes over the British Isles on the 20 March 2015. Philos. Trans. R. Soc. A 2016, 374, 20150224. [Google Scholar] [CrossRef] [PubMed]
- Kimball, S.K.; Montalvo, C.J.; Mulekar, M.S. Evaluating Temperature Measurements of the iMET-XQ, in the Field, under Varying Atmospheric Conditions. Atmosphere 2020, 11, 335. [Google Scholar] [CrossRef]
- Bailey, S.C.; Canter, C.A.; Sama, M.P.; Houston, A.L.; Smith, S.W. Unmanned aerial vehicles reveal the impact of a total solar eclipse on the atmospheric surface layer. Proc. R. Soc. A 2019, 475, 20190212. [Google Scholar] [CrossRef] [PubMed]
- Seidel, D.J.; Zhang, Y.; Beljaars, A.; Golaz, J.C.; Jacobson, A.R.; Medeiros, B. Climatology of the planetary boundary layer over the continental United States and Europe. J. Geophys. Res. Atmos. 2012, 117. [Google Scholar] [CrossRef]

Disclaimer/Publisher’s Note: The statements, opinions and data contained in all publications are solely those of the individual author(s) and contributor(s) and not of MDPI and/or the editor(s). MDPI and/or the editor(s) disclaim responsibility for any injury to people or property resulting from any ideas, methods, instructions or products referred to in the content. |
© 2024 by the authors. Licensee MDPI, Basel, Switzerland. This article is an open access article distributed under the terms and conditions of the Creative Commons Attribution (CC BY) license (https://creativecommons.org/licenses/by/4.0/).