Article

A Novel Hybrid Method for Multi-Step Short-Term 70 m Wind Speed Prediction Based on Modal Reconstruction and STL-VMD-BiLSTM

1
Gansu Provincial Meteorological Service Center, Lanzhou 730010, China
2
Key Laboratory of Energy Meteorology China Meteorological Administration, Beijing 100081, China
3
Public Meteorological Service Center of China Meteorological Administration, Beijing 100081, China
4
Shaanxi Provincial Meteorological Service Center, Xi’an 710014, China
*
Authors to whom correspondence should be addressed.
Atmosphere 2024, 15(8), 1014; https://doi.org/10.3390/atmos15081014 (registering DOI)
Submission received: 4 July 2024 / Revised: 13 August 2024 / Accepted: 15 August 2024 / Published: 21 August 2024
(This article belongs to the Special Issue Solar Irradiance and Wind Forecasting)

Abstract

:
In the context of achieving the goals of carbon peaking and carbon neutrality, the development of clean resources has become an essential strategic support for the low-carbon energy transition. This paper presents a method for the modal decomposition and reconstruction of time series to enhance the prediction accuracy and performance regarding the 70 m wind speed. The experimental results indicate that the STL-VMD-BiLSTM hybrid algorithm proposed in this paper outperforms the STL-BiLSTM and VMD-BiLSTM models in forecasting accuracy, particularly in extracting nonlinearity characteristics and effectively capturing wind speed extremes. Compared with other machine learning algorithms, including the STL-VMD-LGBM, STL-VMD-SVR and STL-VMD-RF models, the STL-VMD-BiLSTM model demonstrates superior performance. The average evaluation criteria, including the RMSE, MAE and R2, for the proposed model, from t + 15 to t + 120 show improvements to 0.582–0.753 m/s, 0.437–0.573 m/s and 0.915–0.951, respectively.

1. Introduction

In the context of addressing global climate change as the greatest non-traditional security challenge, carbon reduction has become one of the most important principles and policies. Electricity generation accounts for more than 70% of greenhouse gas emissions and more than 90% of carbon gas emissions [1,2]. In the context of achieving the goals of carbon peaking and carbon neutrality, the comprehensive development and utilization of low-carbon clean energy to meet the increasing demand for carbon-emitting energy, and the gradual and comprehensive replacement of the existing stock, have become important strategic choices for the realization of the sustainable development of society [3].
The 2024 report of the Global Wind Energy Council (GWEC) indicates that the total installations of the global wind industry reached 117 GW in 2023, representing a 50% year-on-year increase from 2022. The future global demand for renewable energy will gradually increase, and the wind power installations in the 2024–2030 period will grow upwards by 10%, especially increasing in Europe, Asia and America [4]. Therefore, wind energy, as an important zero-carbon equivalent source of electricity, will play a key role in the energy transition. However, the wind speed is characterized by randomness, volatility and intermittency [5], which pose many challenges to the safe and stable operation and effective dispatch of power systems [6]. Therefore, the accurate prediction of the wind speed is crucial to improve the utilization of wind energy resources and enhance the ability of meteorological services to ensure the energy supply. In this regard, it is of great practical importance to improve the accuracy of wind speed prediction at different time scales, to ensure the safe and stable operation of the power grid and promote the development of the green economy by vigorously developing energy storage technology.
The forecasting methods for wind speed series are mainly based on physical or statistical methods. Physical methods predict the atmospheric wind field based on the equations of motion and the interaction laws among the physical parameters influencing the wind field. There are several global and regional models based on physical methods, including the European Center for Medium-Range Weather Forecasts (ECMWF) model and the China Global/Regional Assimilation and Prediction System (CGRAPS) model, which possess a temporal and spatial resolution of 3 h and 9 km, respectively. With the ongoing advancements in numerical weather prediction toward refinement [7], regional models such as GRAPES-MESO and WRF, which utilize background field data along with initial and boundary conditions provided by global models, have enhanced their temporal and spatial resolutions to 1 h and 3 km or even finer. The application of the four-dimensional assimilation forecast technique utilizing a numerically dense observation network can significantly improve both the spatial and temporal resolutions, as well as the forecast accuracy, of the wind speed [8,9]. However, in regions characterized by pronounced local climate features and limited monitoring resources, such as Northwest China, physical methods employing numerical weather prediction still exhibit a disparity between the forecast values and actual observations [10,11]. In addition, numerical models that rely on discrete computational systems possess high complexity and require time-consuming computation for short-range wind speed forecasts in complex terrain due to the physical parameterization schemes that depict the atmospheric dynamics and thermal processes as a complex nonlinear system. This complexity is further exacerbated by the high sensitivity of the atmospheric equations of motion to the boundary conditions and topographic parameters.
In contrast, statistical methods possess relatively lower time consumption and costs and are lightweight. Utilizing historical wind speed data, forecasting models can reconstruct the wind speed through traditional statistical methods or artificial intelligence methods. For smooth wind speed prediction, models such as the Autoregressive Moving Average (ARMA) are used, which can effectively fit and predict time series data that exhibit smoothness and linear trends [12]. Traditional statistical methods like the Autoregressive Integrated Moving Average (ARIMA) model can effectively capture the nonsmooth and nonlinear characteristics of the wind speed [13]. However, forecasting models that rely on traditional statistical methods tend to struggle with accuracy when dealing with wind speed series characterized by high complexity and volatility. This is primarily evident through the lag in the forecast results, unstable forecasting performance, and challenges in further improving the prediction accuracy [14]. Recently, artificial intelligence methods have emerged as innovative tools in the meteorological domain [15]. In contrast to physical and traditional statistical methods, artificial intelligence techniques (such as recurrent neural networks (RNNs) [16], convolutional neural networks (CNNs) [17] and the Self-Attention Mechanism Transformer [18]) demonstrate significant potential for the analysis of extensive datasets. In tpursuit of improved accuracy in wind power forecasting, Viet et al. (2023) propose a double-optimization approach aimed at developing a short-term wind power generation forecasting tool, which has shown heightened accuracy and can be widely implemented [19].
Combining high-temporal-resolution and high-spatial-resolution meteorological observation data with multi-source live fusion analysis technology enhances the performance of artificial intelligence methods for data mining through self-learning capabilities. This improves the ability to detect nonlinear wind speed variation features. Techniques such as integrated machine learning and deep learning methods based on RNN networks have demonstrated strong performance. Bentsen et al. (2023) focused on enhancing the forecasting precision of the multistep spatiotemporal wind speed by using a graph neural network (GNN) architecture to capture spatial dependencies, utilizing different update functions to learn temporal correlations [20]. Their study indicated that the GNN-FF Transformer could achieve superior outcomes for the 10 min and 1 h ahead forecasts. To mitigate the impact of noise on the characterization of nonlinear variations, the nonlinear single-time-series decomposition methods of Empirical Mode Decomposition (EMD) [21] and Extended Empirical Mode Decomposition (EEMD) [22] were implemented to establish a forecasting model. In [23], the EMD-CC Transformer connected an encoder and decoder through an attention mechanism. In this method, the EMD algorithm is used to decompose the time series to reveal the temporal changes across different time scales. Although the studies mentioned above concentrate on the decomposition and reconstruction of the wind speed series, there are several limitations associated with using a single-time-series decomposition method for wind speed forecasting: (1) the wavelet transform is prone to producing spurious harmonics that lack original physical significance when breaking down the original time series into multiple superpositions of wavelet functions [24]; (2) while EMD and EEMD can adaptively reflect the localized eigenfunctions of the original time series based on its nonlinear and smooth characteristics, they are also susceptible to issues such as modal aliasing phenomenon and endpoint effects. Thus, it is essential to develop prediction models that integrate various time series decomposition algorithms to enhance the short-term forecasting accuracy. To address the limitations of the aforementioned decomposition techniques, Dragomiretskiy et al. (2014) proposed the variational modal decomposition (VMD) method [25]. VMD can realize the effective separation of the intrinsic modal components (IMFs) and frequency domain segmentation of the signal, obtain the practical decomposition components of a given signal, and finally obtain the optimal solution of the variational problem [26].
From the above discussion, the main purpose of this work is to achieve credible wind speed forecasts at a 70 m height of the fan wheel hub, and a range of time series forecasting techniques in conjunction with modal reconstruction are constructed and assessed. This study introduces the numerical forecast as the background field factor for the nonlinear time series of the 70 m wind speed with poor regularity and high complexity, observed by a wind tower at a wind farm in Gansu Province. We adopt the forecast idea of “decomposition–prediction–reconstruction” to construct the 0–2 h short-term forecast model and carry out corresponding validation experiments. In summary, the main research content is as follows.
(1)
The STL method decomposes the original wind speed series and obtains the trend component, seasonal component, and residual component.
(2)
The VMD decomposition of the wind speed is utilized to obtain the high-frequency and low-frequency intrinsic modal components; the BiLSTM model of short-term wind speed prediction is constructed based on the results of the STL-VMD dual-time-series decomposition.
(3)
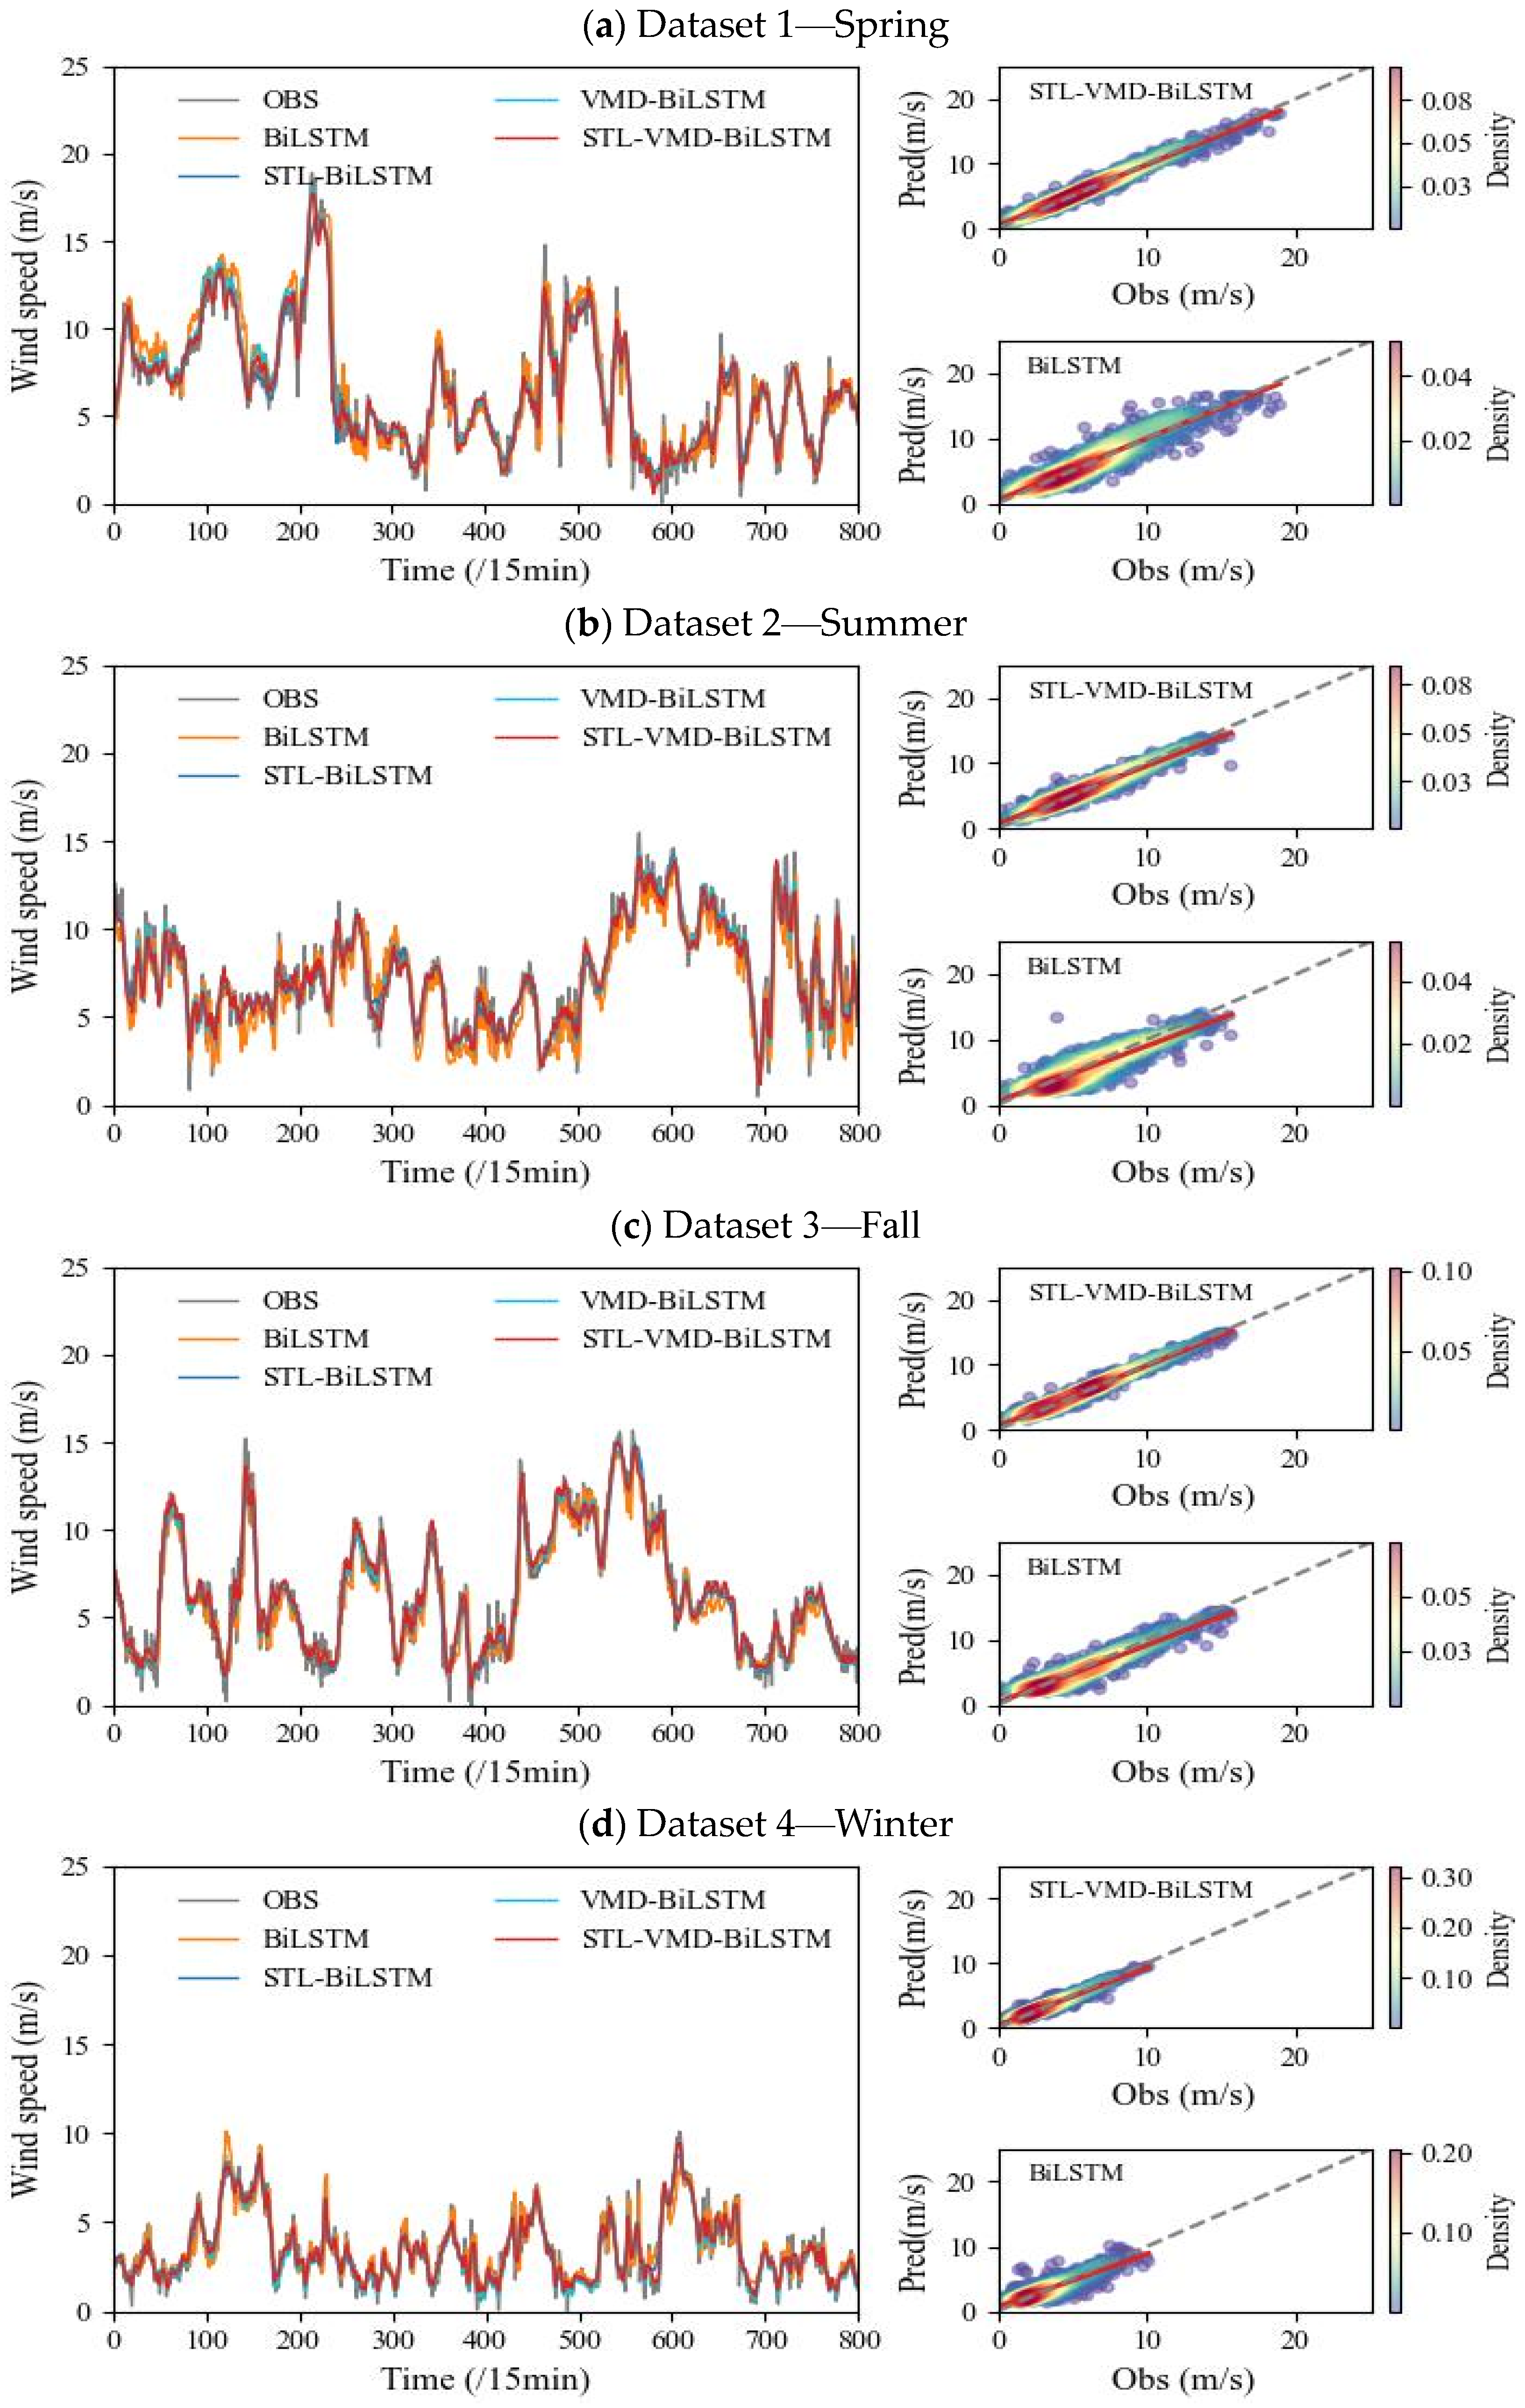
The feasibility and superiority of the STL-VMD dual-time-series decomposition method are verified through prediction experiments using the proposed method and the STL-BiLSTM, VMD-BiLSTM and BiLSTM methods with different datasets and prediction step sizes.
(4)
Through comparison tests between the proposed method, support vector regression (SVR), light gradient boosting machine (LGBM) and the random forest algorithm (RF), the prediction performance and superiority of the proposed model are validated across four datasets with different time step sizes.

2. Materials and Methods

2.1. Materials

The following two datasets are selected as research materials to carry out the analysis: (1) the continuous observation of the wind speed at a 70 m height acquired from the anemometer tower of a wind farm in Gansu Province during 2022, with a time resolution of 15 min, where the wind speed time series contained a total of 34,721 sample points, and (2) the ECWMF forecast products, 10-meter U (V) wind component and 100-meter U (V) wind component obtained at 12:00 UTC each day during 2022, denoted as 10 m U (V) and 100 m U (V), with a spatial resolution of 0.125° × 0.125°. Equation (1) presents the formula for the absolute wind speed at a 10 m and 100 m height, labeled as WS10m and WS100m, respectively. The WS10m and WS100m are used as input features instead of the 10-meter U (V) wind component and 100-meter U (V) wind component. The sample data are mapped to the interval [1] using the Min–Max normalization method, as shown in Equation (2).
W S = U 2 + V 2
x = x x min x max x min
where the normalized data is denoted by x ; the maximum value and minimum value of the sample data x are denoted by xmax and xmin, respectively.

2.2. Methods

A novel hybrid model (STL-VMD-BiLSTM) is proposed in this study, with the flowchart shown in Figure 1. The technology roadmap for the STL-VMD-BiLSTM model includes four modules in the overall architecture, which are as follows.
(1)
In Section 1 (top left), the original wind speed series observed at the height of 70 m is decomposed by STL, and the trend component, seasonal and residual component are obtained.
(2)
In Section 2 (middle left), the VMD method is used to decompose the actual wind speed again, and the high-frequency and low-frequency intrinsic modal components of the actual wind speed data are obtained.
(3)
In Section 3 (bottom left), the ECMWF grid data are interpolated to the site via a linear interpolation scheme; the temporal resolution of the site data is 15 min.
(4)
In Section 4 (right), the training set and validation set of the time series model are constructed. In order to verify the feasibility and superiority of the proposed method, experiments and a contrastive analysis are carried out to train and optimize the models mentioned in this paper.

2.2.1. STL

Seasonal and trend decomposition (STL) is a time series decomposition algorithm based on the locally weighted regression smoothing method (LOESS) for the estimation of nonlinear relationships [27]. Assuming additive decomposition written as in Equation (3), the STL method consists of an inner loop and an outer loop. Using the LOESS algorithm for smoothing and low-pass filtering, the original wind speed time series data Y υ are decomposed into the trend component T υ , the seasonal component S υ and the residual component R υ at the period υ .
Y υ = T υ + S υ + R υ
The STL inner loop consists of a seasonal smoothing process and a trend smoothing process, which are employed to update the seasonal component and the trend component, respectively. There are 6 steps in the inner loop.
Step 1: Detrending involves subtracting the trending component of the results of the previous round Y υ T υ ( k ) and the initial value T υ ( 0 ) is 0 in the first round.
Step 2: For cycle sub-series smoothing, LOESS is used to conduct regression smoothing for each cycle sub-series and extend them one cycle forward and one cycle backward, denoted as C υ ( k + 1 ) , υ = n ( p ) + 1 to N + n ( p ) . The LOESS parameters are chosen as q = n ( s ) and d = 1 .
Step 3: The low-pass filtering of the smoothed cycle sub-series is performed, which consists of running averages and a LOESS smoothing process with length parameters of n ( i ) and 3, respectively. The result is written as L υ ( k + 1 ) , where υ is between 1 and N . This step is equivalent to extracting the low pass of the cycle sub-series.
Step 4: The detrending of the smoothed cycle sub-series is performed to obtain the final seasonal component, described as S υ ( k + 1 ) = C υ ( k + 1 ) L υ ( k + 1 ) .
Step 5: Deseasonalization represents subtracting the seasonal component, described as Y υ S υ ( k + 1 ) .
Step 6: Trend smoothing involves applying the LOESS method with the parameters q = n ( t ) and d = 1 to the series to obtain the trend component, labeled as T υ ( k + 1 ) .
The outer loop can regulate the robustness weight by calculating the robustness weight for noise reduction based on the results of the inner loop, thus reducing the impact of noise on the next inner loop. The robustness weight (see Equation (4)) prevents the data series from having outliers, which results in a significant residual term and a large bias on the regression. Its bisquare function B and h are defined as in the following Equations (5) and (6):
ρ υ = B ( | R υ | / h )
h = 6 m e d i a n ( | R υ | )
B ( u ) = { ( 1 u 2 ) 2 0 u < 1 0 u > 1
where n ( i ) inner loops and n ( o ) outer loops are performed in the STL decomposition process. During Steps 2 and 6 in the inner loop of each iteration of LOESS regression, the neighborhood weight needs to be multiplied by the robustness weight to minimize the effect of outliers on LOESS.
The process of STL decomposition for the original wind speed time series is completed when the estimates of the trend and seasonal terms converge after multiple iterations of looping inside and outside.

2.2.2. VMD

The VMD process for wind speed time series consists of the construction and solution of constrained variational problems. Given that each intrinsic modal function (IMF) has a finite bandwidth with distinct center frequencies, while ensuring that the sum of all intrinsic modal components equals the original signal, the critical step in the VMD technique process is to determine the number k of modes in such a way that minimizes the sum of the estimated bandwidths for each IMF (Equation (7)) [28]. The wind speed time series is decomposed into k different time-varying and nonlinear frequency components.
min { u k , w k } { k t [ ( σ ( t ) + j π t ) u k ( t ) ] e j w k t 2 2 } s . t . k u k = f ( t )
where u k = { u 1 , , u k } and w k = { w 1 , , w k } are the k mode components and the corresponding center frequencies obtained from the VMD of the wind speed time series. σ ( t ) is the Dirichlet function, and the coefficient j is equal to 1 .
In order to determine the optimal solution of the constrained variational model, a penalty factor α and a Lagrange multiplier λ ( t ) are introduced to transform this constrained variational problem into an unconstrained variational problem, as represented by Equation (8). The multiplicative operator alternating direction method is used to solve the variational problem. Decomposition is employed to extract the respective intrinsic modal components and center frequencies.
L ( { u k } , { w k } , λ ) = α k t [ ( σ ( t ) + j π t ) u k ( t ) ] e j w k t 2 2 + f ( t ) k u k ( t ) 2 2 + λ ( t ) , f ( t ) k u k ( t )
In this work, in order to find the optimal modal number k for VMD, the decomposition accuracy evaluation index MAPE (which is the average value of the ratio of the residual to the original value) is adopted, represented by Equation (9).
M A P E = 1 N t = 1 N | f K u k ( t ) f |
where f is the raw wind speed time series, N is the length of the wind speed series and f K u k ( t ) denotes the residual term.

2.2.3. BiLSTM

The bidirectional long short-term memory (BiLSTM) neural network, proposed by Graves et al. (2005), comprises forward and inverse LSTM layers [29]. Unlike the unidirectional LSTM neural network, BiLSTM can explore the intrinsic connections of wind time series data to the maximum extent, rather than simply reversing the input sequence [30]. In order to enhance the predictive abilities of traditional neural networks and overcome problems such as gradient disappearance with the growth of the learning period, BiLSTM realizes the storage and control of historical information by introducing the concepts of memory units and gating mechanisms to regulate the flow of information in the network layers, as with LSTM [31].
In the forward and inverse LSTM layers, the BiLSTM unit structure consists of 3 types of gating (denoted as in Equations (10)–(12)). The input gate controls the information added to the current unit, using the hyper tangent function to generate a new candidate quantity, the memory unit c ˜ t , and thus control the added information (see Equation (13)). The forgetting gate controls the degree to which the previous unit has been forgotten, and its inputs are the outputs of the previous unit as well as the inputs of the current unit. Finally, the output gate controls the degree to which the current unit filters the information.
i t = σ ( W i · [ h t 1 , x t ] + b i )
f t = σ ( W f · [ h t 1 , x t ] + b f )
o t = σ ( W o · [ h t 1 , x t ] + b o )
c ˜ t = tanh ( W c · [ h t 1 , x t ] + b c )
c t = f t c t 1 + i i c ˜ t
σ ( x ) = 1 1 + e x
For the input gate i t , forgetting gate f t , output gate o t and memory unit c ˜ t , the corresponding weight matrixes are W i , W f , W c , W o and the bias vectors are b i , b f , b c , b o ; c t is the metacellular state and σ is the activation function with value domain [0, 1], and these are described as in Equations (14) and (15). The total output of the BiLSTM computational unit at moment t is calculated as follows in Equations (16)–(18).
h t = σ ( W F 1 x t + W F 2 h t 1 + b )
h t = σ ( W B 1 x t + W B 2 h t 1 + b )
y t = W O 1 h t + W O 2 h t 1 + b y
where x t , h t , h t , y t are the input vectors and output vectors of the implicit layer of forward and inverse propagation at time step t , respectively; W F 1 , W F 2 , W B 1 , W B 2 , W O 1 , W O 2 are the matrix coefficients; b , b , b y are the bias vectors.

2.2.4. Performance Evaluation Criteria

In this study, three evaluation indexes are selected to comprehensively evaluate the prediction performance of the models mentioned. The root mean square error (RMSE) and the mean absolute error (MAE) are used to quantify the number of errors. The goodness of fit R-squared (R2) is used to measure the performance of the proposed wind speed prediction model and other involved prediction models. The R2 score reflects the extent to which the variance of the prediction variable explains the variance of the observed variable. The closer the RMSE and MAE are to 0, the closer the R2 is to 1 and the better the performance of the prediction model. The three evaluation criteria are calculated as follows:
M A E = 1 N i = 1 n | y i y ^ i |
R M S E = 1 N i = 1 n ( y i y ^ i ) 2
R 2 = 1 S S E S S T S S E = i = 1 N ( y i y ^ i ) 2 S S T = i = 1 N ( y i y ¯ ) 2
where y i , y ^ i , y ¯ are the actual value, the prediction value and the expectancy value of the wind speed, respectively. N represents the length of the wind speed sequence. The sum of squares due to error (SSE) is the sum of squares of the residual difference between the observed and predicted values, representing the unexplained variability in the variable. The total sum of squares (SST) represents the sum of squares of the mean deviation between the observed and predicted values, signifying the total variation degree of the variable.

3. Results

3.1. Experimental Data Description

Given the seasonal variability, the 70 m wind speed dataset is segmented into four seasonal subsets. Figure 2 illustrates the Weibull distributions of these wind speed subsets, with K serving as the shape parameter, indicating how closely the data align with the mean (or peak). A larger (or smaller) K signifies a more concentrated (or dispersed) distribution. The scale parameter dictates the absolute magnitude of the distribution, reflecting the data’s range or scale. The location parameter (Loc) is utilized to adjust the standard distribution. The probabilty density function of Weibull minimum continuous random variable are denoted by the red lines. In spring, the maximum wind speed recorded is 24.80 m/s, while the mean wind speed is 7.116 m/s. As listed in Table 1, the shape parameter K is the lowest (1.731) in spring, with the highest scale parameter (8.033), suggesting that the Weibull distribution for spring is the most dispersed, as illustrated in Figure 2. In contrast, the mean wind speed during winter stands at 2.84 m/s, which is the lowest value among all seasons. The results indicate that the wind speed reaches the largest in spring and has the most vital characteristic of gusty fluctuations, while it is the smallest in winter but still has the most robust volatility characteristics.

3.2. Parameter Selection

To validate the proposed model, the dataset is segmented into groups representing three consecutive months. The first subset, spanning from January to March 2022, is designated as dataset 1. Similarly, the final subset, covering October to December 2022, is labeled dataset 4. Each case is further divided into the training set (85%) and the test set (15%).
Table 2 presents the optimal parameters of the prediction models based on BiLSTM. Each model consists of three LSTM layers, two dropout layers with a dropout rate of 0.2, one fully connected layer, and an output layer. The optimal values of window_size (20), batch_size (256) and epoch (15) are determined through the grid parameter optimization algorithm. The input features of the BiLSTM model include wind speed forecast data at 10 m and 100 m (WS10m and WS100m), along with observed wind speed data at 70 m (WS70m). For instance, in the fourth case, the input and output data shapes are (7379, 20, 3) and (7379, 8), respectively, intended for the BiLSTM, SVR, LGBM and RF models. The optimal input parameters for the prediction models utilizing the machine learning techniques are detailed in Table 3. The experiments were conducted on a 13th-Gen Intel (R) Core (TM) i7-1360P.
Table 4 lists the optimal features for the prediction models. Specifically, for the first type of model, such as BiLSTM, the input features include the WS10m, WS10m(t) and WS70m(t − k) vectors spanning from t − k to t, while the output vector is the WS70m from t + 15 to t + 120. The second (and third) types of models are fed by the WS10m, WS10m(t) and WS70m(t − k) vectors from t − k to t, along with the decomposition components generated by STL and VMD. The outputs of these two model types consist of STL or VMD subcomponents from t + 15 to t + 120, which are then used to reconstruct the wind speed sequences. In contrast, the label of the fourth type of model is based on the VMD component vectors, such as IMF1.

3.3. Analysis of Proposed Models

3.3.1. Decomposed Results for STL

The wind speed time series have the characteristics of trends, seasonality, periodicity and random noise. The STL algorithm is used to decompose the original wind speed series (top) into the smoothed trend component (middle top), the seasonal component (middle lower) and the residual component (bottom), which are shown in Figure 3. The trend component curve changes more gradually and smoothly. Table 5 lists some statistical values of the wind speed components decomposed by the STL algorithm; the strength of the trend (FT) and seasonality (FS) is defined as in Equations (22) and (23), respectively. The trend component, with a gentle feature, explains the low-frequency variation of the wind speed series and represents the long-term variation trend. For the strongly trended data, in four cases, the maximum ranges from 18.387 m/s to 23.674 m/s, and the strength of the trend FT is between 0.956 and 0.971. The seasonal component ranges from −2.199 m/s to 2.264 m/s and denotes the periodic variation of the time series. The strength of the seasonal component FS is between 0.292 and 0.337. The residual component represents changes not attributed to the periodic component and the trend component and is more random and approximately normally distributed with 0. The residual component is regarded as unpredictable random noise.
F T = max ( 0 , 1 V a r ( R t ) V a r ( T t + R t ) )
F S = max ( 0 , 1 V a r ( R t ) V a r ( S t + R t ) )

3.3.2. Decomposed Results for VMD

The trend components of the wind speed series are categorized into 10 groups using a three-month running period. The VMD algorithm is applied to decompose the observed wind speed data into several intrinsic modal components (IMFs) with the optimal decomposition modal number, denoted as K. In this study, the modal number is deemed optimal when two conditions are met: (1) the evaluation accuracy measured by the MAPE is less than 1% and (2) the MAPEs are calculated for various modal numbers K, ranging from 2 to 20. As K increases, the center frequency of each decomposed component tends to decrease. Furthermore, the change in the MAPEs when transitioning from K to K + 1 is minimal, indicating that K is considered to be optimal choice. Therefore, in the specific VMD process, we began by establishing the penalty coefficients, α = 2000 , τ = 0 and N 20 , followed by determining the modal number K of the VMD test. Finally, we calculated and compared the changes in the MAPE index for different values of the modal number K (see Table 6). The MAPE index exhibits a rapid decline as the modal number K increases. When the modal number K is 6, the MAPE values for each dataset range from 0.600 to 0.914, remaining below 1%. As the modal number (K) continues to rise from 7 to 20, the reduction in the MAPE index becomes less pronounced, suggesting that the optimal modal number for VMD in wind speed analysis is 6. For groups 4–6, a modal number of (K = 7) can be used without significant time cost considerations.
The observed wind speed time series alongside the VMD results are shown in Figure 4. IMF1 represents the low-frequency variability in the wind speed data, reflecting their long-term trend. IMF2–4 are the detail components, which indicate the changes in the wind speed across various time scales. IMF5–6 are the stochastic components, which characterize the wind speed time series with randomness features.

3.3.3. Prediction Results with Different Time Series Decomposition Schemes

We next assess the feasibility and reliability of the time series dual hybrid decomposition algorithms used in this paper to enhance the performance of the wind speed short-range proximity model. The comparative analyses of the prediction performance of the models, including the proposed STL-VMD-BiLSTM model and the VMD-BiLSTM, STL-BiLSTM and BiLSTM models, are carried out across the four datasets from t + 15 to t + 120. Table 7 lists prediction error scores of the BiLSTM models integrating time series decomposition methods at specified steps for these four sets. The performance of the short-range prediction model using different datasets is evaluated in terms of three main aspects: the goodness-of-fit R², which evaluates how well the models fit the data; the RMSE, which measures the extent of deviation between the observed and predicted values; and the MAE, which reflects the absolute error magnitude between the predicted and observed values, as well as the degree of deviation between the predicted values.
Figure 5, Figure 6 and Figure 7 illustrate the forecasted and observed values (represented as curved lines), with the scatter plots demonstrating the four models developed by integrating different time series decomposition methods. In Figure 5, the observed results and the predictions from the four methods at time t + 15 are closely aligned. The proposed STL-VMD-BiLSTM model exhibits the highest R² values, ranging from 0.937 to 0.958. In contrast, the BiLSTM model shows the lowest R² values, which range from 0.750 to 0.878.
As illustrated in Figure 6, none of the four models effectively and thoroughly replicates the gusty high winds or calm winds at t + 60, a discrepancy that is particularly evident in spring, when gusty high winds are prevalent, and in winter, characterized by calm winds. The R2 for the STL-VMD-BiLSTM model, noted for its robust descriptive capabilities, ranges from 0.922 to 0.951. The R2 scores for the VMD-BiLSTM and STL-BiLSTM models range from 0.909 to 0.952 and from 0.809 to 0.909 at t + 60, respectively. The BiLSTM model exhibits an R2 value of less than 0.667.
Figure 7 presents a comparison of the forecast and observed curves at the t + 120 timeframe, indicating a gradual decline in the predictive abilities of all models with the increase in the forecast length. Following the application of the decomposition and reconstruction methods, the forecasting capability of the STL-VMD-BiLSTM model shows a significant enhancement, with an R2 range of 0.893 to 0.939. The VMD-BiLSTM model follows with an R2 range of 0.859 to 0.914, while the STL-BiLSTM model slightly outperforms the BiLSTM model. The challenges in capturing the characteristics of wind speed changes and accurately forecasting wind speed extremes are principally reflected in the overestimation of extreme minima and the hysteresis evident in the forecast curves, which represent typical limitations of RNN forecasting models.
Figure 8 displays the forecast errors of the four models based on the BiLSTM method integrated with various decomposition methods across the four datasets and forecast steps. Throughout the forecasting period from t + 15 to t + 120, the four forecasting models demonstrate more pronounced errors in spring and summer than in fall and winter. As the forecasting step increases, the predictive capabilities of all models exhibit a declining trend. From spring to winter, the RMSE (MAE) evaluation indices for the BiLSTM model at t + 15 are between 0. 836 and 1.401 m/s (0.589 and 1.07 m/s). Following the implementation of the STL and VMD time series decomposition algorithms, the RMSEs (MAEs) of the STL-BiLSTM and VMD-BiLSTM models are reduced to 0.621–1.058 (0.621–1.05) m/s and 0.439–0.735 (0.323–544) m/s at t + 15. Furthermore, through the synthetic application of the STL and VMD time series decomposition algorithms, the STL-VMD-BiLSTM model possesses a better overall predictive effect than the models mentioned above, with the RMSE and MAE reduced to 0.435–0.668 m/s and 0.321–0.483 m/s, respectively.
At t + 60 and t + 120 (Figure 6 and Figure 7), the STL-VMD-BiLSTM model achieves the best prediction performance, exhibiting the lowest RMSE and MAE scores. At t + 60, the STL-VMD-BiLSTM model records RMSEs from 0.470 to 0.753 m/s and MAEs from 0.347 to 0.567 m/s. The RMSEs and MAEs of the VMD-BiLSTM and STL-BiLSTM models are lower than those of the BiLSTM model. As the prediction step increases, the RMSEs and MAEs of the STL-VMD-BiLSTM model rise to 0.542–0.92 m/s and 0.405–0.696 m/s at t + 120. The BiLSTM model exhibits the worst prediction performance, with the RMSE and MAE values reaching 1.18–1.2.725 m/s and 1.18–2.008 m/s at t + 120.
In summary, the prediction performance of the three models during the periods of t + 15~t + 120 indicates that as the prediction step size increases, the predictive advantage of the STL-VMD-BiLSTM model becomes more significant, effectively capturing the wind speed variability. The synergistic benefits of the dual decomposition technique significantly enhance the short-range wind speed prediction performance of the BiLSTM model.

3.3.4. Prediction Results with Different Models

To further verify the forecasting advantages of the proposed method, machine learning algorithms, including SVR, LGBM, and RF, are combined with the STL, VMD, and STL-VMD time series decomposition techniques. Corresponding comparative tests and analyses are conducted. Figure 8 illustrates the distribution of the accuracy evaluation criteria for the RMSEs and MAEs from t + 15 to t + 120 across the four data subsets.
Table 8 and Table 9 show the prediction outcomes of the models at specified steps for these four sets. The RMSEs (MAEs) from t + 15 to t + 120 for the methods based on SVR in conjunction with the time series decomposition algorithms are as follows: the RMSEs (MAEs) of the SVR model range from 0.797 to 2.738 (0.591 to 2.118) m/s, and the RMSEs (MAEs) of the STL-SVR and VMD-SVR models range from 0.598 to 2.576 (0.453 to 1.632) m/s and 0.604 to 1.144 (0.493 to 0.869) m/s, while the STL-VMD-SVR exhibits RMSE (MAE) scores of 0.446–0.751 (0.327–0.589) m/s. The methods combined with time series decomposition outperform the individual approach (SVR).
The RMSEs (MAEs) for the prediction results generated by the hybrid methods based on LGMB and RF from t + 15 to t + 120 are within the ranges of 0.604–2.658 (0.493–1.974) m/s and 0.604–2.716 (0.493–2.006) m/s, respectively. The STL-VMD-LGBM model yields RMSE scores ranging from 0.604 to 1.382 m/s and MAE scores from 0.493 to 1.036 m/s, while the STL-VMD-RF model achieves RMSE scores from 0.471 to 1.428 m/s and MAE scores from 0.393 to 1.089 m/s.
The average RMSE and MAE values for the STL-VMD-SVR, STL-VMD-LGBM and STL-VMD-RF models from t + 15 to t + 120 are 0.617–1.031 (0.463–0.796) m/s, 0.804–1.110 (0.614–0.857) m/s and 0.672–1.105 (0.498–0.847) m/s, respectively. Additionally, the average R2 values of the STL-VMD-SVR model range from 0.806 to 0.944, indicating superior performance as well. The contrastive analysis indicates that the STL-VMD-SVR model delivers better prediction performance than the methods based on other machine learning methods.
For all methods, the RMSE and MAE values are higher during spring and summer than in fall and winter (Figure 8a–d). The STL-VMD-BiLSTM model exhibits the best performance, with average RMSE, MAE and R2 values ranging from 0.582 to 0.753 m/s, 0.437 to 0.573 m/s and 0.915 to 0.951, respectively, from t + 15 to t + 120. The time cost of the STL-BiLSTM (STL-VMD-BiLSTM) model is two to three (approximately six to seven) times higher than that of BiLSTM, where the time taken to train and predict is 12–18 (42–49) minutes and 0.34 s, respectively, when computed sequentially. Overall, the STL-VMD-BiLSTM model outperforms the hybrid algorithms based on machine learning methods, albeit at a higher computational cost.

4. Conclusions

This paper introduces a hybrid method, STL-VMD-BiLSTM, for the modal decomposition and reconstruction of wind speed time series, taking into account their nonlinear and nonstationary characteristics. This approach aims to enhance the accuracy of short-term forecasts for time intervals of 0 to 2 h by analyzing both temporal and spatial variability features. The comparative analysis of the validation experiment’s results regarding the models’ prediction performance across four data subsets leads to the following conclusions.
A novel model, STL-VMD-BiLSTM, is established by integrating the STL-VMD hybrid decomposition method with BiLSTM, effectively breaking down the wind speed series into high-frequency and low-frequency intrinsic modes, thereby improving the prediction performance for nonlinear variations.
The STL-VMD-BiLSTM model excels in extracting the characteristics of wind speed changes and effectively capturing extreme wind speed forecasts. The STL-VMD-BiLSTM model achieves average RMSE, MAE and R2 values ranging from 0.582 to 0.753 m/s, 0.437 to 0.573 m/s and 0.915 to 0.951 from t + 15 to t + 120. On the other hand, the forecasting performance of the BiLSTM model, when not utilizing any time series model reconstruction and decomposition methods, indicates the lowest performance.
To further assess the prediction capabilities and superiority of the proposed methods, SVR, LGBM and RF models were developed for wind speed forecasting in conjunction with the STL-VMD decomposition method. The STL-VMD-BiLSTM model demonstrates superior performance, with RMSEs below 0.92 m/s, although it requires a comparatively longer training time. The average RMSEs (MAEs) for the STL-VMD-SVR, STL-VMD-LGBM and STL-VMD-RF models over the same forecasting periods of t + 15 to t + 120 are 0.617 to 1.031 (0.463 to 0.796) m/s, 0.804 to 1.110 (0.614 to 0.857) m/s and 0.672 to 1.105 (0.498 to 0.847) m/s, respectively, which are significantly higher than those of the proposed method.

5. Limitations and Future Research Directions

The proposed method has shown the superiority of short-term wind speed prediction results with a 2 h forecast horizon. However, there remain a few limitations that are to be addressed in further investigation, which are summarized as follows.
(1)
In this study, the historical period of the wind speed data used to build the model is only one year, and the optimization algorithms are not applied to adjust the parameters and enhance the accuracy of the short-term wind speed forecasting results. In the future, an optimization strategy and longer training and testing sets should be used for prediction and verification.
(2)
This study does not predict the wind speed at a forecast horizon longer than 2 h. In the future, the longer-sequence time series forecasting of the wind speed should be conducted to achieve prediction at longer forecast horizons.

Author Contributions

Conceptualization, X.D., D.Y. and Y.S.; methodology, X.D. and D.Y.; formal analysis, X.D., D.Y. and Y.S.; investigation, P.C. and J.Y.; data curation, X.D. and D.W.; writing—original draft preparation, X.D.; writing—review and editing, X.D., D.Y. and Y.S.; visualization, X.D., D.Y. and D.W.; supervision, P.C. and J.Y.; funding acquisition, X.D., D.Y. and P.C. All authors have read and agreed to the published version of the manuscript.

Funding

This research is funded by the Gansu Key Research and Development Plan (grant number 23YFGA0016), Meteorological Science and Technology Innovation Platform Project of China Meteorological Service Association (grant number CMSA2023MB024), Gansu Youth Science and Technology Fund Program (grant numbers 22JR5RA755 and 23JRRA1575) and Key Research Project of Shaanxi Provincial Department of Science and Technology (grant number 2023-YBSF-235).

Institutional Review Board Statement

Not applicable.

Informed Consent Statement

Not applicable.

Data Availability Statement

The data are unavailable due to privacy restrictions.

Conflicts of Interest

The authors declare no conflicts of interest.

References

  1. Osman, A.I.; Chen, L.; Yang, M.; Msigwa, G.; Farghali, M.; Fawzy, S.; Rooney, D.W.; Yap, P.S. Cost, Environmental Impact, and Resilience of Renewable Energy under a Changing Climate: A Review. Environ. Chem. Lett. 2022, 21, 741–764. [Google Scholar]
  2. Zhou, J.; Liu, H.; Xu, Y.; Jiang, W. A Hybrid Framework for Short Term Multi-Step Wind Speed Forecasting Based on Variational Model Decomposition and Convolutional Neural Network. Energies 2018, 11, 2292. [Google Scholar] [CrossRef]
  3. Vidal Bezerra, F.D.; Pinto Marinho, F.; Costa Rocha, P.A.; Oliveira Santos, V.; Van Griensven Thé, J.; Gharabaghi, B. Machine Learning Dynamic Ensemble Methods for Solar Irradiance and Wind Speed Predictions. Atmosphere 2023, 14, 1635. [Google Scholar] [CrossRef]
  4. GWEC. Global Wind Report 2024; Global Wind Energy Council: Brussels, Belgium, 2024. [Google Scholar]
  5. Petersen, C.; Reguant, M.; Segura, L. Measuring the Impact of Wind Power and Intermittency. Energy Econ. 2024, 129, 107200. [Google Scholar]
  6. Wu, H.; West, S.R. Co-optimisation of Wind and Solar Energy and Intermittency for Renewable Generator Site Selection. Heliyon 2024, 10, 26891. [Google Scholar]
  7. Orlando, G.; Benacchio, T.; Luca, B. An IMEX-DG Solver for Atmospheric Dynamics Simulations with Adaptive Mesh Refinem -ent. Comput. Appl. Math. 2023, 427, 115124. [Google Scholar]
  8. Zhang, J.; Zhao, X. Three-dimensional spatiotemporal wind field reconstruction based on physics-informed deep learning. Appl. Energy 2021, 300, 117390. [Google Scholar]
  9. Kumar, A.; Islam, T.; Ma, J.; Kashiyama, T.; Sekimoto, Y.; Mattmann, C. WindSR: Improving Spatial Resolution of Satellite Wind Speed Through Super-Resolution. Access 2023, 11, 69486–69494. [Google Scholar]
  10. Lv, S.; Wang, L. Deep Learning Combined Wind Speed Forecasting with Hybrid Time Series Decomposition and Multi -objective Parameter Optimization. Appl. Energy 2022, 311, 118674. [Google Scholar]
  11. Hao, Y.; Yang, W.; Yin, K. A Novel Wind Speed Forecasting Model Based on A Deep Learning Combined Strategy in Urban Energy Systems. Expert Syst. Appl. 2023, 219, 119636. [Google Scholar]
  12. Cumha, J.; Pereira, C. A hybrid model based on STL with simple exponential smoothing and ARMA for wind forecast in a Brazilian nuclear power plant site. Nucl. Eng. Des. 2024, 421, 113026. [Google Scholar]
  13. Aasim; Singh, S.N.; Mohapartra, A. Repeated Wavelet Transform Based ARIMA Model for Very Short-term Wind Speed Forecasting. Renew. Energy 2019, 136, 758–768. [Google Scholar]
  14. Sima, S.N.; Neda, T.; Akbar, S.N. A Comparison of ARIMA and LSTM in Forecasting Time Series. In Proceedings of the 17th IEEE International Conference on Machine Learning and Applications, Orlando, FL, USA, 17–20 December 2018. [Google Scholar]
  15. Duan, J.; Chang, M.; Chen, X.; Wang, W.; Zuo, H.; Bai, Y.; Chen, B. A Combined Short-term Wind Speed Forecasting Model Based on CNN-RNN and Linear Regression Optimization Considering Error. Renew. Energy 2022, 200, 788–808. [Google Scholar]
  16. Sun, Y.; Zhou, Q.; Sun, L.; Kang, J.; Li, H. CNN-LSTM-AM: A Power Prediction Model for Offshore Wind Turbines. Ocean Eng. 2024, 301, 117598. [Google Scholar]
  17. Jef, J.; Avendano, D.N.; Glenn, V.W.; Sofie, V.H. A Novel Day-ahead Regional and Probabilistic Wind Power Forecasting Framework using Deep CNNs and Conformalized Regression Forests. Appl. Energy 2024, 361, 122900. [Google Scholar]
  18. Aizpurua, J.I.; Peña-Alzola, R.; Olano, J.; Ramirez, I.; Lasa, I.; Del Rio, L.; Dragicevic, T. Probabilistic Machine Learning Aided Transformer Lifetime Prediction Framework for Wind Energy Systems. Electr. Power Energy Syst. 2023, 153, 109352. [Google Scholar]
  19. Viet, D.T.; Phuong, V.V.; Duong, M.Q.; Tran, Q.T. Models for Short-Term Wind Power Forecasting Based on Improved Artificial Neural Network Using Particle Swarm Optimization and Genetic Algorithms. Energies 2020, 13, 2873. [Google Scholar] [CrossRef]
  20. Bentsen, L.Ø.; Warakagoda, N.D.; Stenbro, R.; Engelstad, P. Spatio-temporal Wind Speed Forecasting Using Graph Networks and Novel Transformer Architectures. Appl. Energy 2023, 333, 120565. [Google Scholar]
  21. Li, N.; Dong, J.; Liu, L.; Li, H.; Yan, J. A Novel EMD and Causal Convolutional Network Integrated with Transformer for Ultra Short-term Wind Power Forecasting. Electr. Power Energy Syst. 2023, 154, 109470. [Google Scholar]
  22. Yan, Y.; Wang, X.; Ren, F.; Shao, Z.; Tian, C. Wind Speed Prediction Using A Hybrid Model of EEMD and LSTM Considering Seasonal Features. Energy Rep. 2022, 8, 8965–8980. [Google Scholar]
  23. Santos, V.O.; Rocha PA, C.; Scott, J.; Thé, J.V.G.; Gharabaghi, B. Spatio-temporal analysis of bidimensional wind speed forecasting: Development and thorough assessment of LSTM and ensemble graph neural networks on the Dutch database. Energy 2023, 278, 127852. [Google Scholar]
  24. Shan, J.; Wang, H.; Pei, G.; Zhang, S.; Zhou, W. Research on Short-term Power Prediction of Wind Power Generation Based on WT-CABC-KELM. Energy Rep. 2022, 8, 800–809. [Google Scholar]
  25. Dragomiretskiy, K.; Zosso, D. Variational mode decomposition. IEEE Trans. Signal Process. 2014, 62, 531–544. [Google Scholar]
  26. Li, J.; Song, Z.; Wang, X.; Wang, Y.; Jia, Y. A Novel Offshore Wind Farm Typhoon Wind Speed Prediction Model Based on PSO-BiLSTM Improved by VMD. Energy 2022, 251, 123848. [Google Scholar]
  27. Cleveland, R.B.; Cleveland, W.S.; McRae, J.E.; Terpenning, I.J. STL: A Seasonal-trend Decomposition Procedure Based on Loess. Off. Statistics. 1990, 6, 3–73. [Google Scholar]
  28. Shi, X.; Lei, X.; Huang, Q.; Huang, S.; Ren, K.; Hu, Y. Hourly Day-Ahead Wind Power Prediction Using the Hybrid Model of Variational Model Decomposition and Long Short-Term Memory. Energies 2018, 11, 3227. [Google Scholar] [CrossRef]
  29. Graves, A.; Schmidhuber, J. Framewise Phoneme Classification with Bidirectional LSTM and Other Neural Network Architectures. Neural Netw. 2005, 18, 602–610. [Google Scholar]
  30. Li, Z.; Xu, R.; Luo, X.; Gao, X.; Sun, H. Short-term Wind Power Prediction Based on Modal Reconstruction and CNN-BiLSTM. Energy Rep. 2023, 9, 6449–6460. [Google Scholar]
  31. Yuan, X.H.; Chen, C.; Jiang, M.; Yuan, Y. Prediction Interval of Wind Power Using Parameter Optimized Beta Distribution Based LSTM Mode. Appl. Soft Comput. 2019, 82, 105550. [Google Scholar]
Figure 1. Flowchart of the proposed STL-VMD-BiLSTM model.
Atmosphere 15 01014 g001
Figure 2. Weibull distributions of 70 m wind speed time series in four cases.
Atmosphere 15 01014 g002
Figure 3. STL decomposition results for 70 m wind speed observed at wind farm.
Atmosphere 15 01014 g003aAtmosphere 15 01014 g003b
Figure 4. Visualization of the observed wind speed time series and VMD results of the trend component obtained by STL.
Atmosphere 15 01014 g004
Figure 5. Prediction results of all four models with different decomposition methods at t + 15 in four cases.
Atmosphere 15 01014 g005
Figure 6. Prediction results of all four models with different decomposition methods at t + 60 in four cases.
Atmosphere 15 01014 g006
Figure 7. Prediction results of all four models with different decomposition methods at t + 120 in four cases.
Atmosphere 15 01014 g007
Figure 8. Accuracy evaluation of prediction results of models in four cases, with sets 1–4 representing spring to winter.
Atmosphere 15 01014 g008
Table 1. Overview of some statistical values of wind speed data in 2022.
CaseMaximum
(m/s)
Std
(m/s)
Mean
(m/s)
K LocScale
Spring24.804.3837.1161.731−0.0128.033
Summer20.993.5796.9212.055−0.0087.844
Fall19.673.2995.6881.830−0.0286.452
Winter20.2802.844.5291.732−0.1405.245
Table 2. Optimal input parameters of prediction models based on BiLSTM.
Model Parameter Test ParametersOptimal Parameter
Window_size L(8,12,16,20,24,28)20
Batch_size(64,128,256,512)256
Epoch(10,15,20)15
Neurons of fully connected layer8
Rate0.2
Activation functionReLu
Objective functionMAE
OptimizerAdam
Table 3. Optimal input parameters of prediction models based on machine learning methods.
ModelParameter
SVRkernelrbf
epsilon0.2
shrinkTrue
tol0.001
LGBMboosting_typegbdt
num_leaves31
learning_rate0.02
feature_fraction0.9
RFbagging_fraction0.8
bagging_freq5
estimators10
max_depth5
random_state0
Table 4. Optimal input features of prediction models.
TypeModelOptimal Features ( 1 < k L , L = 20 )Label ( 1 k N , N = 8 )
1RF
SVR
LGBM
BiLSTM
WS10m(t − k), …, WS10m(t)
WS100m(t − k), …, WS100m(t)
WS70m(t − k), …, WS70m(t)
WS70m(t + k), …, WS70m(t + N)
2STL-RF
STL-SVR
STL-LGBM
STL-BiLSTM
WS10m(t − k), …, WS10m(t)
WS100m(t − k), …, WS100m(t)
WS70m(t − k), …, WS70m(t)
STL-Trend(t − k), …, STL-Trend(t)
STL-Trend(t + k), …, STL-Trend(t + N)
WS10m(t − k), …, WS10m(t)
WS100m(t − k), …, WS100m(t)
WS70m(t − k), …, WS70m(t)
STL-Seasonal(t − k), …, STL-Seasonal(t)
STL-Seasonal(t + k), …, STL-Seasonal(t + N)
3VMD-RF
VMD-SVR
VMD-LGBM
VMD-BiLSTM
WS10m(t − k), …, WS10m(t)
WS100m(t − k), …, WS100m(t)
WS70m(t − k), …, WS70m(t)
VMD-IMF(t − k), …, VMD-IMF(t)
VMD-IMF(t + k), …, VMD-IMF(t)
4STL-VMD-RF
STL-VMD-SVR
STL-VMD-LGBM
STL-VMD-BiLSTM
WS10m(t − k), …, WS10m(t)
WS100m(t − k), …, WS100m(t)
WS70m(t − k), …, WS70m(t)
STL-Trend(t − k), …, STL-Trend(t)
STL-Seasonal(t − k), …, STL-Seasonal(t)
VMD-IMF(t − k), …, VMD-IMF(t)
VMD-IMF(t + k), …, VMD-IMF(t + N)
Table 5. Overview of statistical values of wind speed components decomposed by STL.
CaseSTL-Trend (m/s)STL-Seasonal (m/s)STL-Remainder (m/s)FTFS
MaxMinMeanMaxMinMaxMin
Spring23.6740.5707.1161.790−1.8417.004−5.4740.9710.292
Summer20.164−1.8416.9212.264−2.1996.281−3.7090.9560.308
Fall18.3870.9125.6881.943−1.9523.554−3.5660.9660.324
Winter19.198−0.0224.5291.251−1.4293.276−2.8300.9680.337
Table 6. The variation characteristics of the MAPE with different modal numbers K.
GroupsModal Number K
23456781020
1–34.5462.4901.6141.1360.7840.6880.4610.2920.144
2–44.8442.5941.7931.1770.8670.670.4570.3000.079
3–54.5752.4091.7161.2030.7570.6120.4420.2920.134
4–64.2602.2851.5931.1450.9140.5740.4200.2760.137
5–74.1622.3051.5521.1070.7220.6060.4120.2820.095
6–74.1562.3171.4891.1640.6990.5880.4070.2830.074
7–94.3392.3691.6831.2620.7440.6250.4110.3000.145
8–104.1952.0791.6591.1480.7170.5980.3920.2690.136
9–114.5342.3951.4291.1700.8890.5720.4130.2800.076
10–124.6582.6721.8461.2410.8800.7960.4210.2780.154
Table 7. Prediction results of models at specified steps based on BiLSTM in four cases.
CaseModelt + 15t + 60t + 120
RMSEMAER2RMSEMAER2RMSEMAER2
(a)
Spring
STL-VMD-BiLSTM0.6680.4830.9580.7540.5500.9460.9200.6960.918
VMD-BiLSTM0.7350.5440.9540.8300.6230.9431.0480.8000.906
STL-BiLSTM0.9150.6680.9191.1840.8610.8682.1081.5160.548
BiLSTM1.3200.9820.8652.0731.5210.6432.7252.0080.290
(b)
Summer
STL-VMD-BiLSTM0.6650.5040.9460.7490.5670.9290.8350.6310.910
VMD-BiLSTM0.7420.5430.9310.8370.6230.9090.9910.7510.860
STL-BiLSTM1.0580.7850.8451.1360.8500.8141.8990.4230.392
BiLSTM1.4011.0700.7582.0171.5190.3992.2711.7400.118
(c)
Fall
STL-VMD-BiLSTM0.5610.4390.9610.6270.4810.9510.7150.5580.939
VMD-BiLSTM0.5680.4280.9640.6560.4990.9520.8030.6610.914
STL-BiLSTM0.7830.5870.9320.8810.6790.9091.3621.1660.669
BiLSTM1.0260.7860.8781.5421.1380.6671.9191.5550.236
(d)
Winter
STL-VMD-BiLSTM0.4350.3210.9370.4700.3470.9220.5420.4050.893
VMD-BiLSTM0.4390.3230.9340.5080.3800.9090.6100.4600.859
STL-BiLSTM0.6210.4440.8590.6960.5220.8091.1890.9410.298
BiLSTM0.8360.5890.7501.2230.9530.3171.4581.180−0.339
Table 8. Prediction performance of machine learning models at specified steps in spring (a) and summer (b) sets.
CaseModelt + 15t + 60t + 120
RMSEMAER2RMSEMAER2RMSEMAER2
(a)
Spring
STL-VMD-SVR0.6780.5160.9600.8600.6580.9311.2210.9430.840
VMD-SVR0.6880.5230.9590.8580.6530.9321.1770.9080.855
STL-SVR0.9420.6810.9191.7271.2520.7002.5761.8930.235
SVR1.2280.8940.8622.0701.5100.5472.7382.0300.119
STL-VMD-LGBM0.9090.6540.9021.0800.7840.8531.3821.0360.749
VMD-LGBM0.9240.6620.8971.0830.7880.8521.3681.0280.753
STL-LGBM1.0190.7410.8731.3890.9880.7542.2111.5850.270
LGBM1.1510.8530.8501.9791.4460.4972.6581.9740.042
STL-VMD-RF0.7430.5440.9501.0130.7480.9001.4281.0890.797
VMD-RF0.7370.5370.9501.0210.7560.8991.3811.0520.802
STL-RF0.8770.6330.9271.3580.9790.8202.2581.6160.448
RF1.0710.7860.9001.9991.4650.6132.7162.0060.255
(b)
Summer
STL-VMD-SVR0.7580.5610.9270.9030.6820.8891.1680.8900.796
VMD-SVR0.8030.5930.9160.9500.7110.8741.1440.8690.804
STL-SVR0.9830.7330.8691.5971.2070.6112.0581.5750.217
SVR1.3000.9630.7761.9251.4530.4092.1881.6780.095
STL-VMD-LGBM0.9150.7050.8591.0050.7770.8201.1750.9130.735
VMD-LGBM0.9160.7070.8591.0140.7850.8151.1890.9280.722
STL-LGBM1.0490.8000.8001.2220.9370.7131.8391.4450.242
LGBM1.2650.9570.7361.9741.5140.2252.3521.855−0.300
STL-VMD-RF0.8260.6140.9110.9640.7320.8691.1810.8900.787
VMD-RF0.8280.6150.9110.9650.7320.8681.1800.8890.784
STL-RF0.9630.7070.8741.2170.9100.7771.8601.4370.387
RF1.2120.8890.8171.9731.4610.4162.2811.7500.061
Table 9. Prediction performance of machine learning models at specified steps in fall (a) and winter (b) sets.
CaseModelt + 15t + 60t + 120
RMSEMAER2RMSEMAER2RMSEMAER2
(a)
Fall
STL-VMD-SVR0.5850.4460.9620.7190.5510.9400.9830.7630.877
VMD-SVR0.6150.4660.9580.7470.5700.9350.9630.7460.883
STL-SVR0.7380.5580.9361.3040.9680.7751.9631.4970.364
SVR1.0050.7460.8801.6121.1980.6292.1181.6320.196
STL-VMD-LGBM0.7810.6040.9100.8740.6760.8831.0780.8310.811
VMD-LGBM0.7810.6040.9100.8770.6780.8821.0870.8380.804
STL-LGBM0.8630.6610.8851.0600.8120.8171.7121.3190.429
LGBM1.0660.8130.8261.6481.2540.4922.1601.684−0.148
STL-VMD-RF0.6490.4880.9520.8260.6340.9161.0580.8210.853
VMD-RF0.6500.4880.9520.8230.6320.9171.0670.8300.847
STL-RF0.7220.5420.9401.0360.7720.8651.7671.3150.528
RF0.9720.7190.8911.5871.1830.6442.0861.5980.175
(b)
Winter
STL-VMD-SVR0.4460.3270.9270.5570.4240.8720.7510.5890.711
VMD-SVR0.4660.3410.9190.5770.4380.8630.7390.5770.742
STL-SVR0.5980.4530.8600.9860.7810.5521.3401.089−0.074
SVR0.7970.5910.7571.2060.9590.3021.4331.162−0.303
STL-VMD-LGBM0.6040.4930.8280.6740.5480.7690.8060.6480.625
VMD-LGBM0.6040.4930.8280.6830.5560.7620.8280.6640.601
STL-LGBM0.6920.5530.7610.8410.6820.6141.2531.028−0.166
LGBM0.8510.6600.6571.2891.051−0.0781.5451.283−1.155
STL-VMD-RF0.4710.3490.9210.5940.4540.8610.7580.5890.741
VMD-RF0.4710.3500.9210.5940.4540.8610.7630.5970.731
STL-RF0.5830.4360.8720.7580.5910.7671.1860.9500.225
RF0.7560.5370.7941.2210.9620.2861.4741.201−0.422
Disclaimer/Publisher’s Note: The statements, opinions and data contained in all publications are solely those of the individual author(s) and contributor(s) and not of MDPI and/or the editor(s). MDPI and/or the editor(s) disclaim responsibility for any injury to people or property resulting from any ideas, methods, instructions or products referred to in the content.

