Abstract
The high concentrations of particulate matter (PM) in the atmosphere have adverse effects on both the environment and human health, as well as on urban and faunal biodiversity. Short-term events, such as the burning of fireworks, attributable to human activity, result in a significant and rapid increase in PM concentration levels within the atmosphere. We present findings derived from observations made using low-cost PM sensors deployed as part of the Environmental Monitoring Network in Querétaro, Mexico. These sensors utilize the Environmental Geo Monitoring Stations (EMGA) device, developed by the Institute of Geosciences at UNAM. The observation period spanned from 10 December 2023 to 10 January 2024, encompassed the Christmas and New Year holidays, and focused on PM2.5 concentrations, and a comparison with a similar period from 10 February 2024 to 10 March 2024 considered a typical activity period in the area. The results reveal two substantial increases in PM2.5 concentrations (from less than 50 µg/m3 to more than 340 µg/m3) over time and spatial distribution during this period, with notable increases observed during the festive season coincident with the Christmas and New Year celebrations. Specifically, prolonged periods exceeding up to 6 h were noted on festivity days. This research offers insight into the effects, trends, and spatial–temporal distribution of pollutants within the city of Queretaro, which may be used as a reference for other cities around the world.
1. Introduction
Fine particulate matter (PM) with an aerodynamic diameter of less than 2.5 μm (PM2.5) has attracted global attention due to its effects on air quality, human health, and climate [1]. In urban areas, PM2.5 usually contains significant concentrations of inorganic and organic components, including black carbon, potentially toxic elements (PTE), and polycyclic aromatic hydrocarbons (PAH) [1,2,3], all of which pose health risks to humans and ecosystems. Once emitted into the atmosphere, this complex mixture of pollutants can be transformed based on ambient conditions and interactions among PM2.5 components with gaseous pollutants (e.g., SOx, NOx, COx, and volatile organic compounds). The atmospheric particulate system is particularly complex in urban areas due to (i) large emission volumes of PM2.5 components, (ii) gases released by anthropogenic sources, (iii) widespread distribution of emission sources, and (iv) climate. Hence, it is crucial to monitor short-term events to identify dates and spatial patterns of pollutant sources for environmental management and risk assessment [2,4]. PM2.5 is usually monitored by standard equipment in governmental networks. However, novel technologies such as low-cost sensors and environmental networks using biological indicators can provide insightful complementary particle pollution data recorded over months, years, or seasons [5,6,7,8].
New Year’s Eve is among the globally celebrated festivals as it marks the transition from the old year to the new year in the Gregorian calendar. In major cities, such celebrations directly impact the local environment, particularly the air quality [9,10]. The bursting and burning of firecrackers during New Year’s Eve festivities release substantial concentrations of PM2.5 and gases into the atmosphere. In Mexico, the use of firecrackers during the celebration of Christmas Eve is typical, providing a considerable impact on the air quality of urban areas, such as Queretaro City, in Central Mexico. Previous studies have documented the adverse effects of fireworks on air quality worldwide; for example, the significant increase in PM2.5 levels during the Diwali festival in India due to fireworks [10]. Moreover, there are regional and global effects of this anthropogenic activity, as the resultant atmospheric aerosols can alter Earth’s climate balance through direct (scattering and absorption of solar and longwave radiation), semi-direct (evaporation of cloud droplets due to solar absorption), and indirect (modification of cloud optical properties, lifetime, and albedo) effects [4].
The primary objective of burning fireworks as a recreational activity is to produce sound and light, with the secondary effect of causing emissions of gases and particles. The most common pyrotechnic mixtures comprise an oxidizer, a fuel, a source of carbon, and various additives such as chlorine donors to enhance color and other chemicals to modify appearance or sound [11]. Compounds affecting human health, such as hazardous pollutants (e.g., PM2.5 or dust), toxic gases (SOx, NOx), and almost any PTE, can be present in pyrotechnic emissions.
The use of commercial low-cost monitoring devices, such as Purple Air sensors and Smart Citizen Kit [12,13,14,15], both devices using the Plantower PMS5003 sensor, have created new opportunities for local and regional air quality monitoring. Although less precise than traditional monitoring equipment, these devices provide a cost-effective and accessible solution for environmental surveillance, enabling increased citizen participation in data collection and decision-making. Several studies conducted have demonstrated the usefulness and feasibility of low-cost PM2.5 sensors in monitoring air quality, providing valuable data for understanding air pollution and its impact on public health and environmental policies [15,16,17]. However, the use of low-cost sensors does not replace the use of reference devices with higher performance, and the performance characteristics differ from the traditional equipment [18], although they are useful to provide a better understanding of the spatial coverage and distribution of PM2.5 [19]. This study aims to measure and analyze changes in PM2.5 concentrations during the intense pyrotechnic burning activity on Christmas and New Year’s Eve in Querétaro City in central Mexico, by using low-cost PM2.5 sensors. In Mexico, pyrotechnic burning is a common practice during different festivities over the year, related to different local and regional celebrations. However, compared with other regions with intense firework activity during festivities [17,20], in Mexico, there is a lack of information on how that activity is spatial and time distributed in the urban areas. This research will contribute to a better understanding of fireworks’ impact on urban air quality during these celebrations and may provide valuable information for designing and implementing public policies aimed at mitigating their adverse effects.
2. Materials and Methods
2.1. Study Area
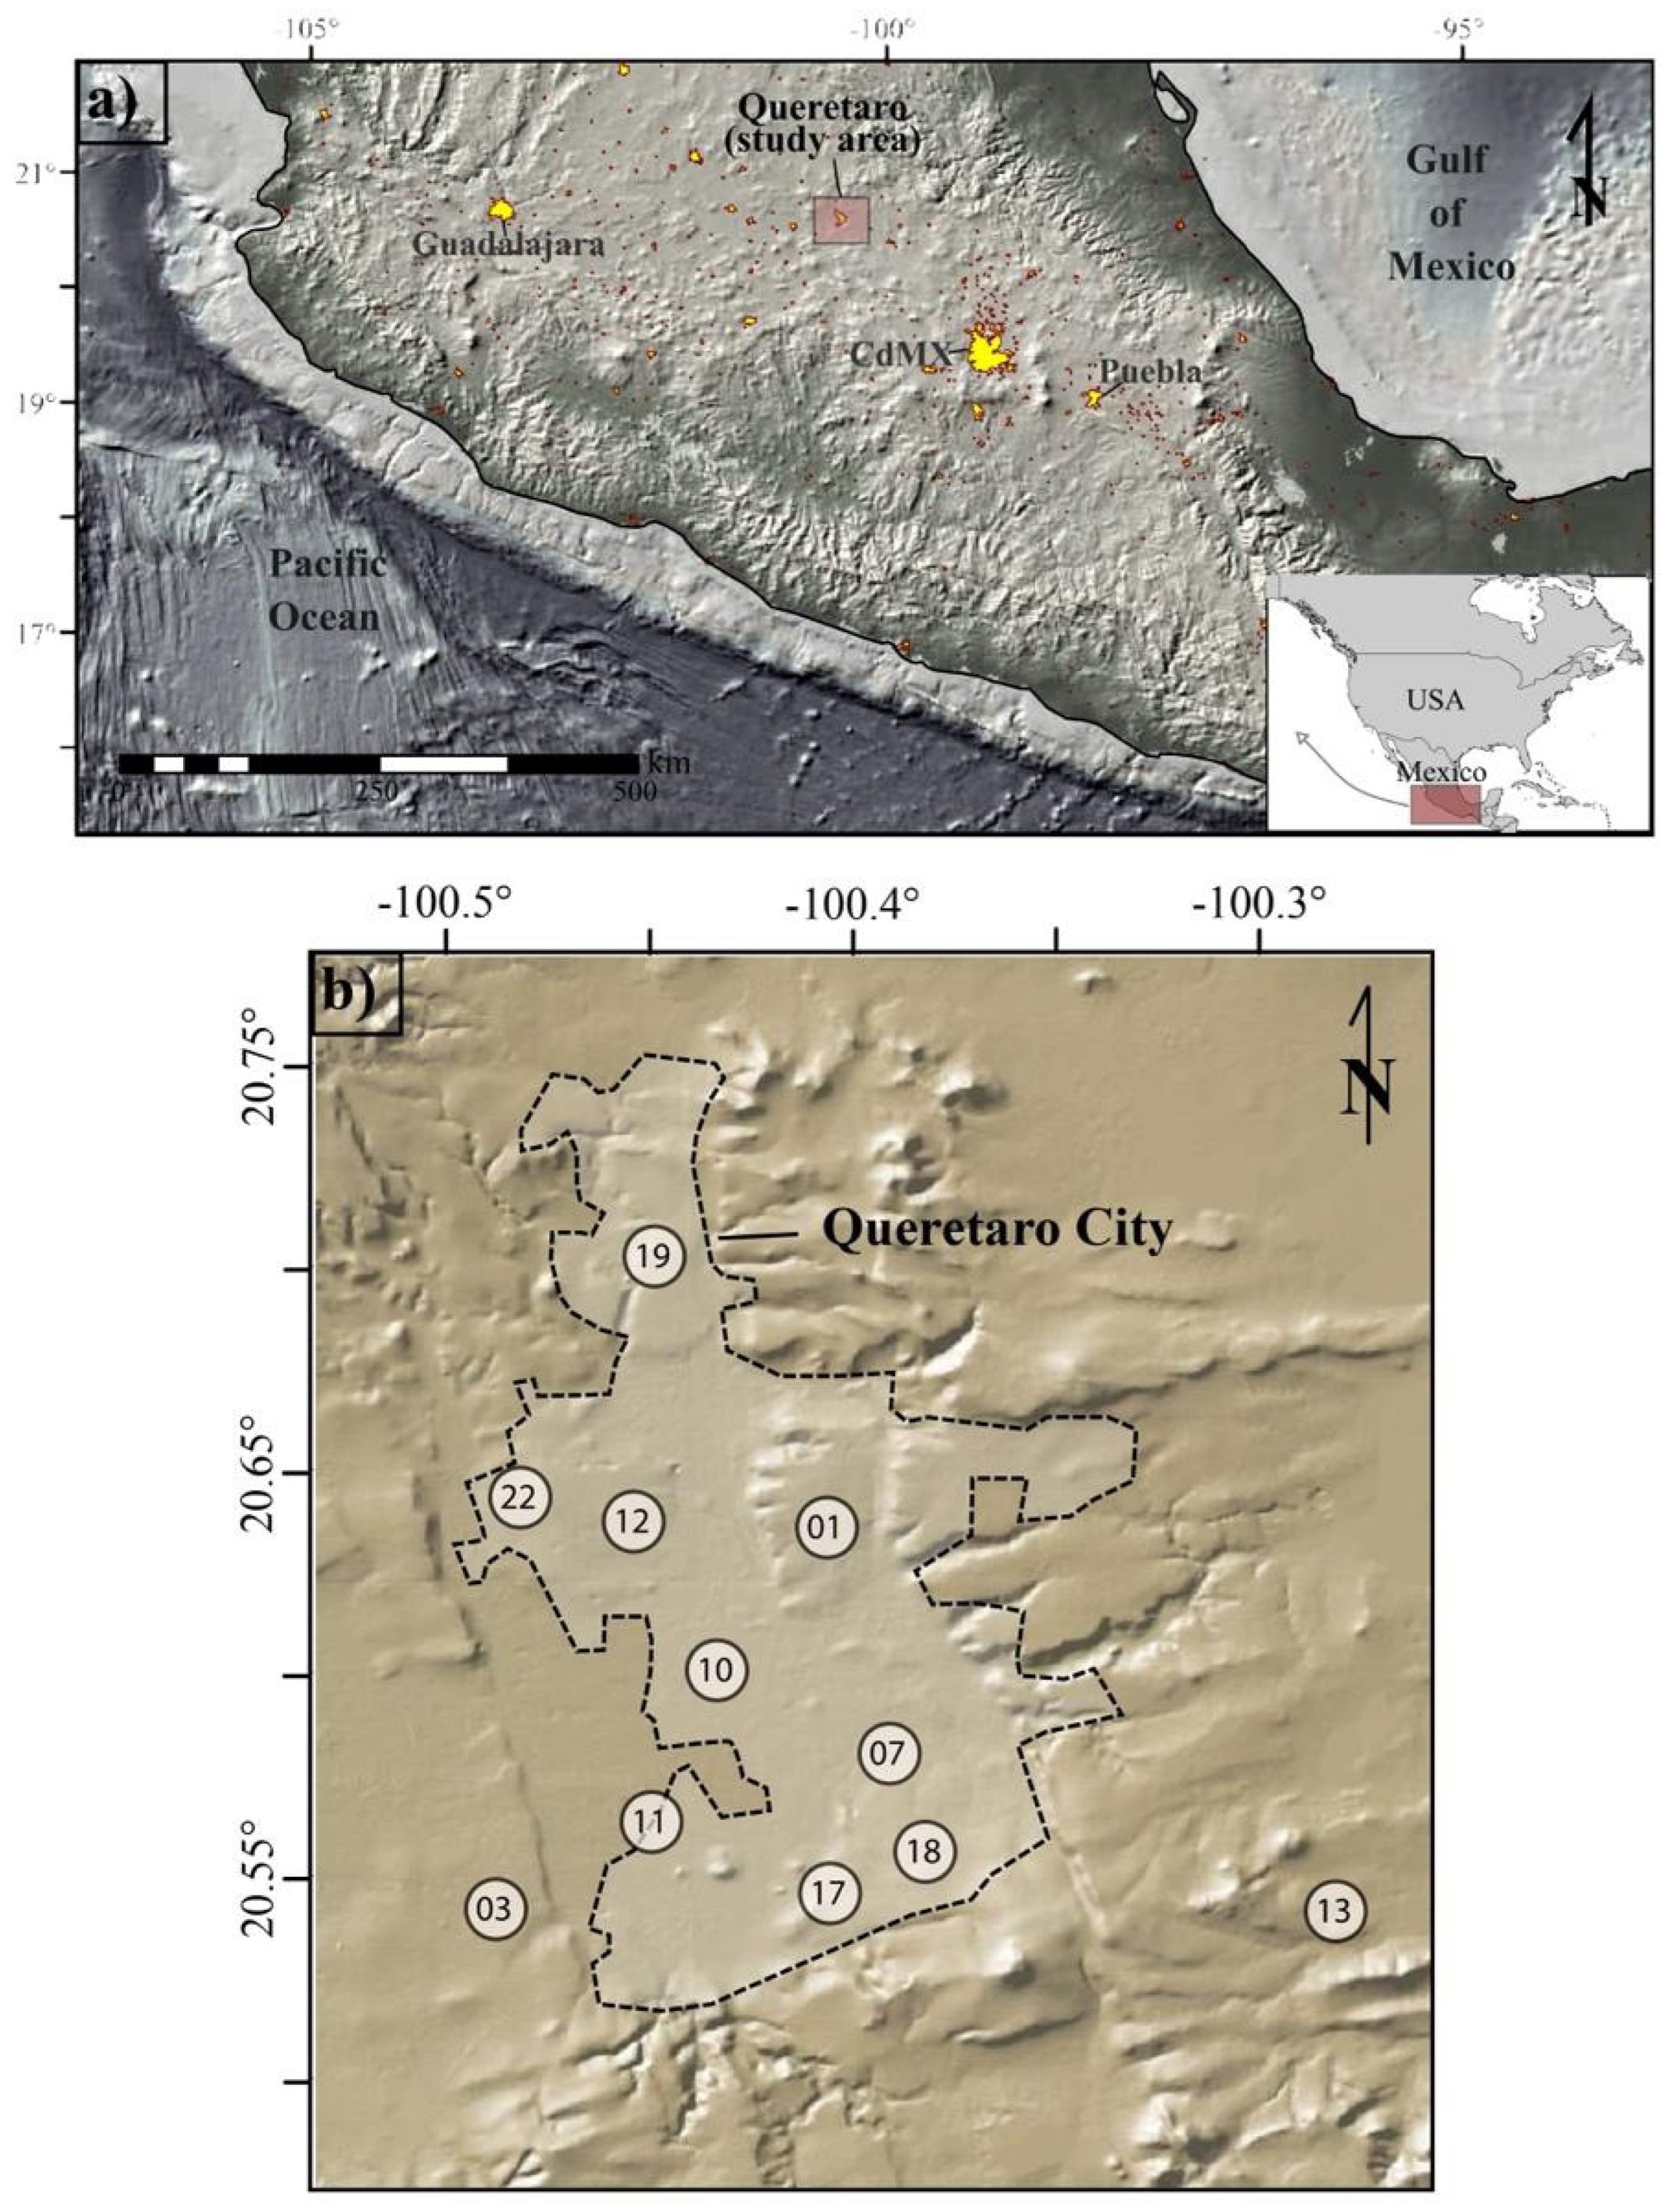
This study was conducted in the Metropolitan Area of Santiago de Queretaro City (Figure 1), which serves as the primary industrial and commercial hub of the El Bajio region, a macroregion located within the central Mexican plateau, approximately 250 km northwest of the Mexico City megalopolis. Queretaro’s urban area is situated on a high-altitude plateau, approximately 1900 m above sea level. The urban area is home to approximately 1.5 million inhabitants [21], concentrated across three municipalities: Querétaro, Corregidora, and El Marqués. The study area experiences a semi-arid climate (BSh), according to the Köppen–Geiger climate classification [22]. The average daily temperature ranges from 15 to 28 °C [21], with an annual accumulated precipitation of ca. 332 mm in 2023 [23].

Figure 1.
Location of Querétaro city compared to other cities (in yellow) in central Mexico (a). The spatial location of the EMGA stations (indicated with numbers, e.g., 10 is STATION-10) from the environmental monitoring network of Querétaro city (b).
The city hosts significant industrial activity, with approximately 28 industrial parks scattered throughout the metropolitan area. Moreover, owing to its strategic central location within the country, Queretaro serves as a major transportation hub, experiencing heavy traffic of cargo transport vehicles bound for Mexico City and other regions, as well as substantial local vehicle traffic. Industrial operations and the high volume of vehicular traffic represent potential sources of atmospheric pollutants, with temporal and geographical variations depending on human activity. In addition, Queretaro is immersed in a heavily industrial and agricultural region towards the west, which can contribute to the air pollutants measured in its atmosphere.
2.2. Instrumentation and Data Acquisition
In situ measurements were gathered from 11 sites within the Environmental Monitoring Network of the Metropolitan Area of Queretaro City initiated by the Instituto de Geociencias at the Universidad Nacional Autonoma de Mexico (IGc-UNAM), shown in Figure 1. This network is comprised of Environmental Geo Monitoring Stations (EMGA) designed and developed by the IGc-UNAM, which continuously monitors eight environmental variables in real-time: particulate matter (PM), PM2.5 and PM10 concentrations, temperature, atmospheric pressure, relative humidity, environmental noise, and intensity of the Earth’s magnetic field. Data is collected every 4 min and promptly transmitted to a data processing, storage, and visualization platform via the Internet. The design of the EMGA is simple and can be constructed in any electronic workshop, as it does not use surface-mounted devices; maintenance is simplified as all sensors are connected to the circuit board by cables. It can also be easily modified to delete sensors or include others (for more details, see [24]). This makes EMGA an attractive alternative to similar commercial monitors such as PurpleAir.
All EMGAs were installed outdoors, typically at a 5 to 10 m distance to streets and/or major avenues in the city, at heights ranging from 2 to 3 m above ground level. This study is focused specifically on PM2.5 temperature and relative humidity, continuously recorded over a period of up to 30 days spanning from 10 December 2023 to 10 January 2024. For reference, a similar period from 10 February 2024 to 10 March 2024 was recorded, considered a typical activity period in the area.
The EMGAs use a commercial low-cost Plantower PMS5003 optical particulate matter sensor for sizes of 2.5 and 10 µm where their concentrations are determined. The use and performance of these sensors have been scrutinized and discussed by various researchers [25,26,27,28], who proposed diverse methodologies for evaluating their accuracy and precision. The reliability of the data obtained with these sensors is subject to debate, particularly when compared with high-precision reference equipment. Nonetheless, multiple studies agree that data obtained from these sensors, although lacking the precision of high-performance equipment, are valuable for detecting atmospheric pollutants. Unlike high-precision equipment, which incurs substantial installation and maintenance costs, these sensors are affordable and facilitate the establishment of dense air quality monitoring networks at a reduced expense, enabling the observation of spatial discrepancies and seasonal variations in urban environments. These sensors are the ones integrated into low-cost commercial equipment networks like Purple Air, which boasts thousands of devices installed across the USA, with their performance and validity assessed in various studies [12,13,15,16].
In this study, raw mass concentration (µg/m3) data were selected from each sensor for PM2.5 with raw data collected every 4 min on the original time series [17]. Up to 30 days of data was analyzed for each of the 11 stations. The data series underwent hourly averaging for each sensor, followed by the application of a correction factor per hour to mitigate the standard error of underestimation in the sensor model, as described by [28]. Subsequently, a statistical analysis was conducted with an algorithm, applied to the data series to filter out outliers, excluding from the calculation of hourly averages any data points that deviated beyond one standard deviation of the data set (σ). This process effectively eliminated outlier data from the time series, enhancing its quality and reliability, and eliminating less than 10% of the data.
3. Results
3.1. Time Series
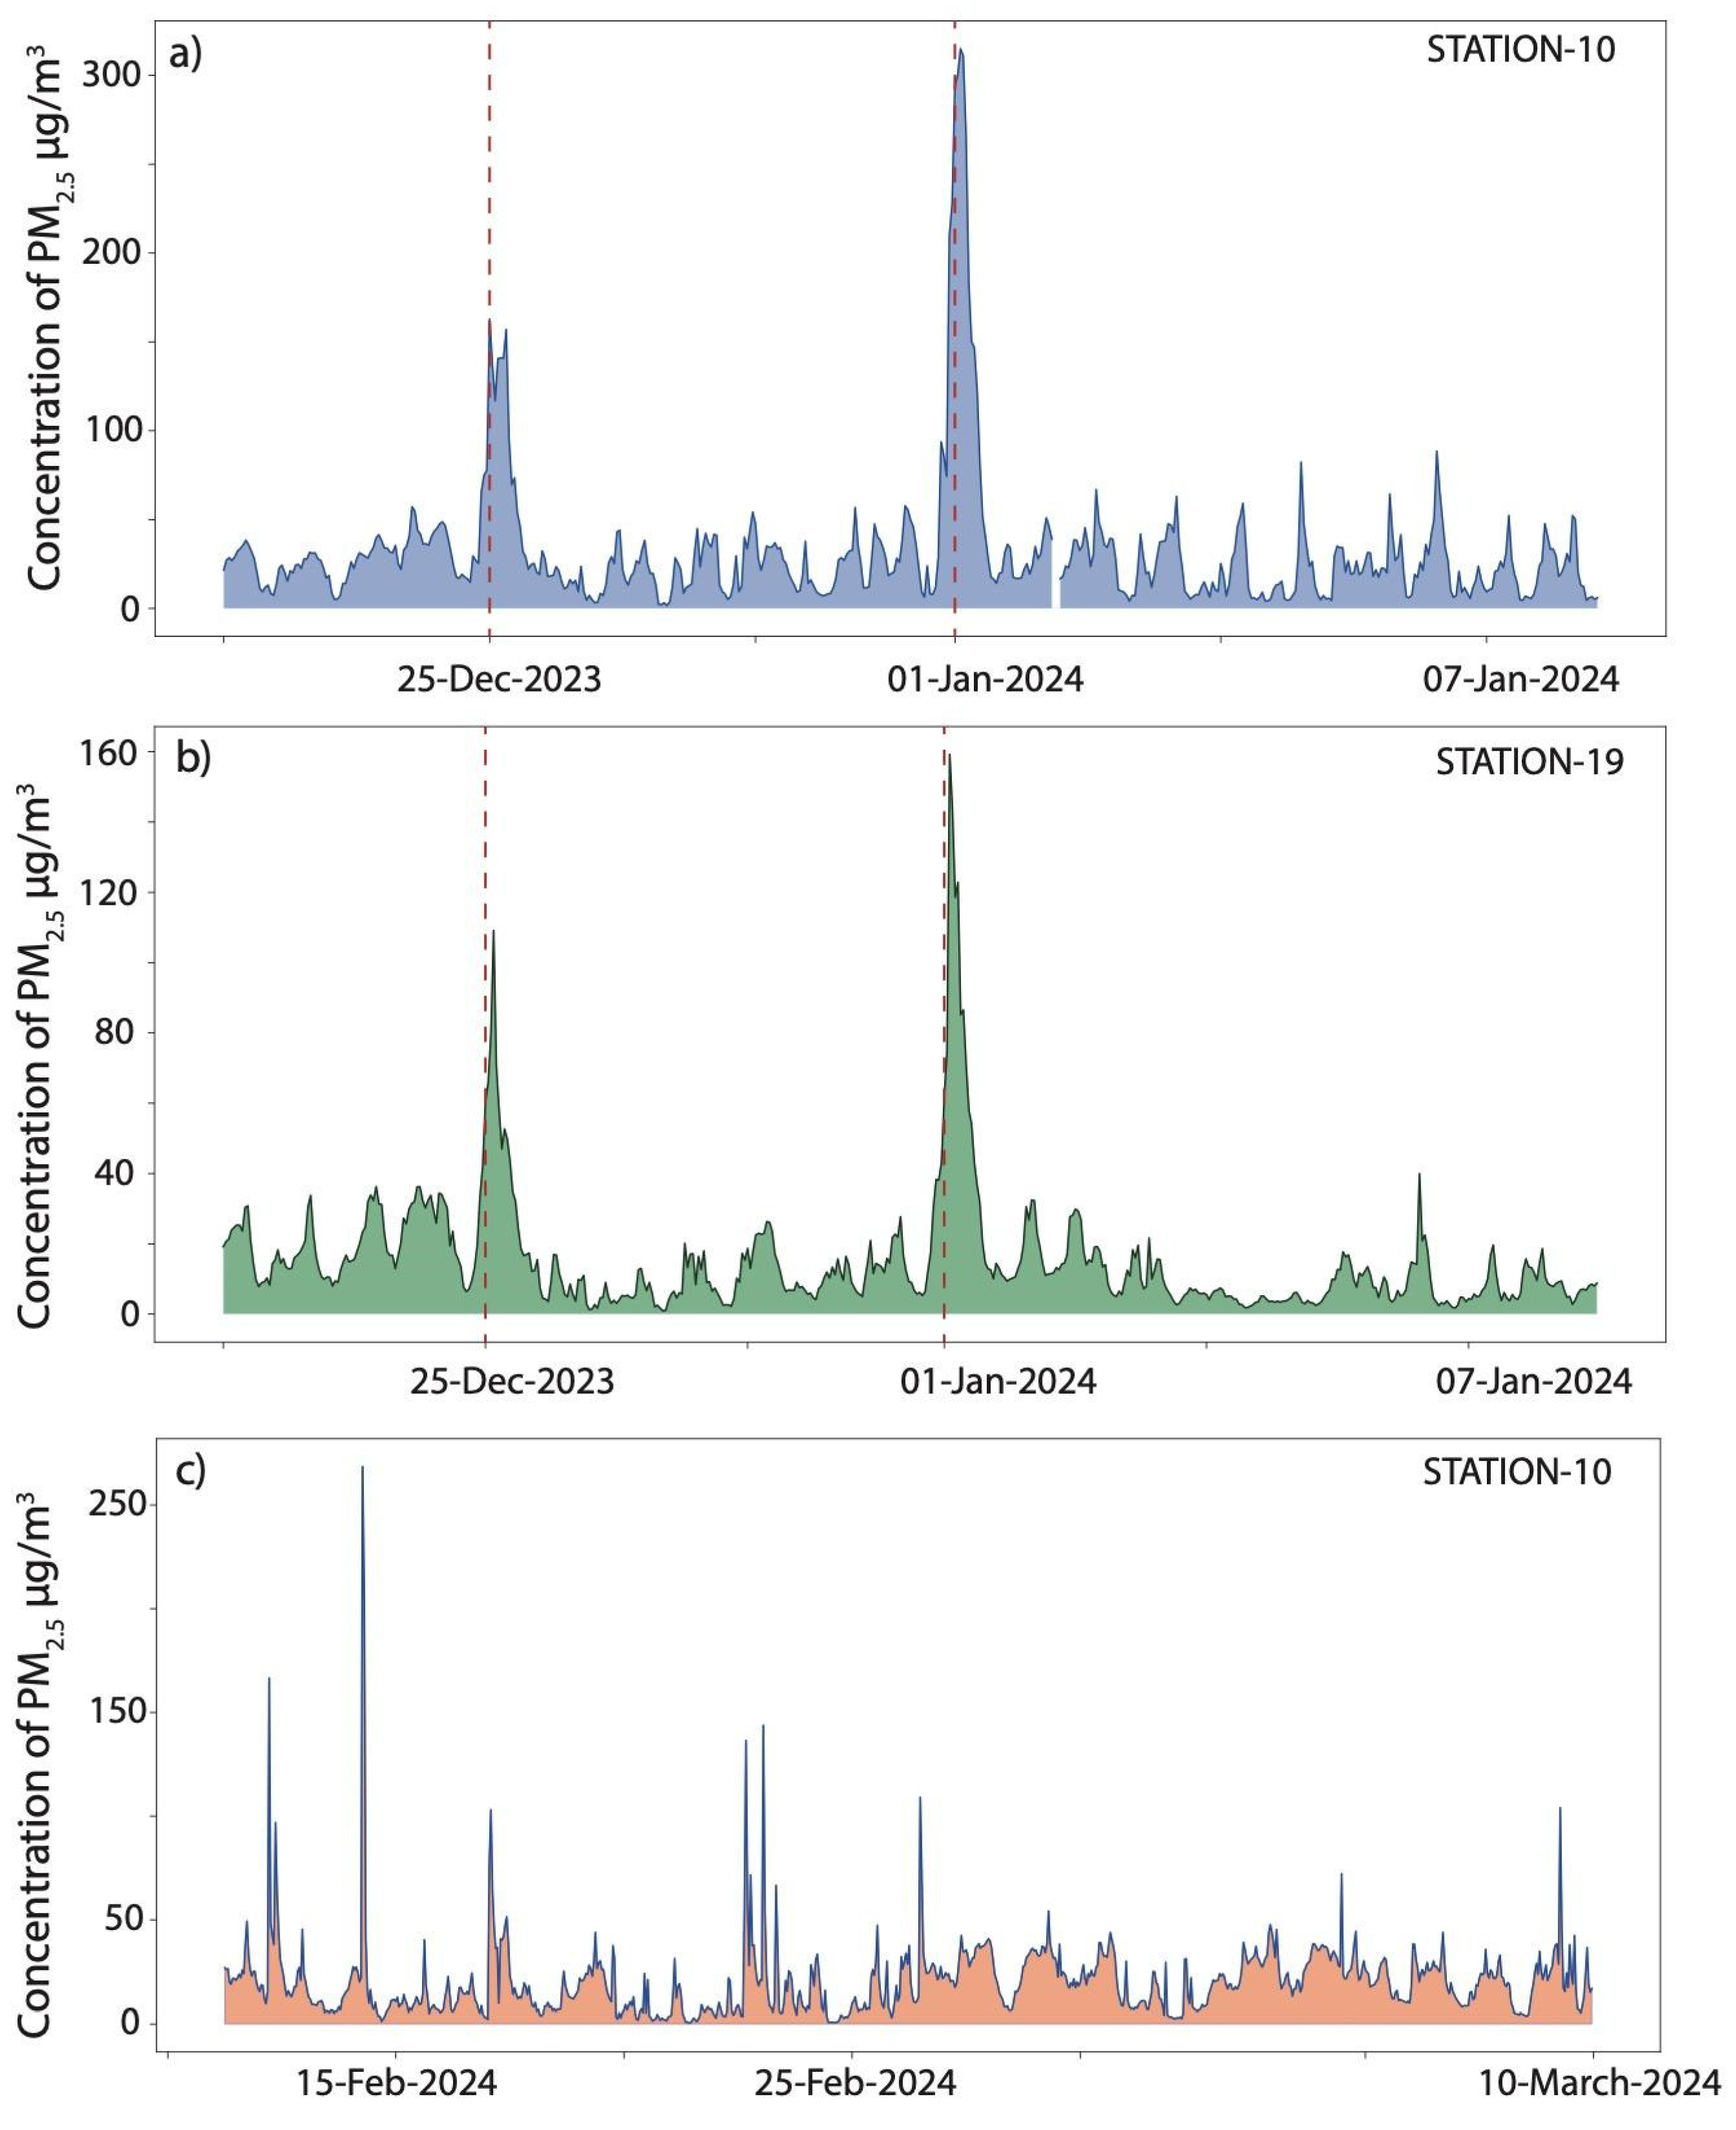
The time series of 1 h averages of the PM2.5 concentrations at three of the eleven sites are shown in Figure 2. These sites were selected based on the maximum values recorded during Christmas and New Year’s Eve celebrations: STATION-10 with the highest, STATION-19 with intermediate, and STATION-13 with the lowest values. We used those three reference stations to compare the maximum and minimum values during the 30-day record. Additionally, a comparison was made with a time series from STATION-10 (with the highest values recorded in this study), for a subsequent period of equal duration, characterized by a typical activity in the city without important celebrations. This was done to establish a pattern of variation among the spatially obtained results. The rest of the stations showed similar time series results.
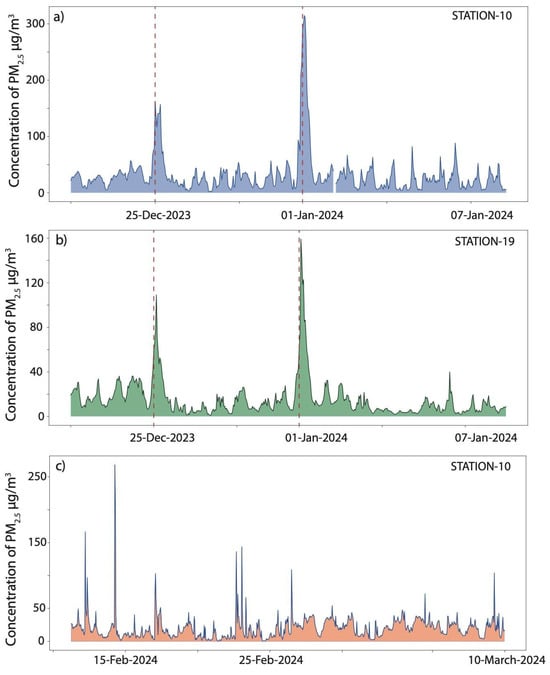
Figure 2.
Time series showing increases in PM2.5 concentrations at three monitoring sites: (a) STATION-10; (b) STATION-19; (c) STATION-10. Vertical lines show the beginning of the Christmas and New Year’s Eve celebrations. Figures on different scales for the concentration of PM2.5.
STATION-10 (Figure 2a) and STATION-19 (Figure 2b) depict the temporal records of hourly averages from 10 December to 10 January, exhibiting typical variations for different days of the week, with PM2.5 values averaging below 50 µg/m3. The blank spaces represent periods during which the equipment did not record data attributable to specific site-related issues. Within the time series, two broad peaks are evident, showing a significant increase in the late hours of 24 and 31 December, considerably exceeding 150 µg/m3 and 300 µg/m3, respectively. These increases persist for at least 6 h during these specific events and coincide with the Christmas and New Year festivities, with the elevated PM2.5 recordings directly linked to fireworks burning in the vicinity. Traffic and industrial activity (among other factors) are the main contributors to PM2.5 concentrations in the environment, with average PM2.5 concentrations below 30 µg/m3.
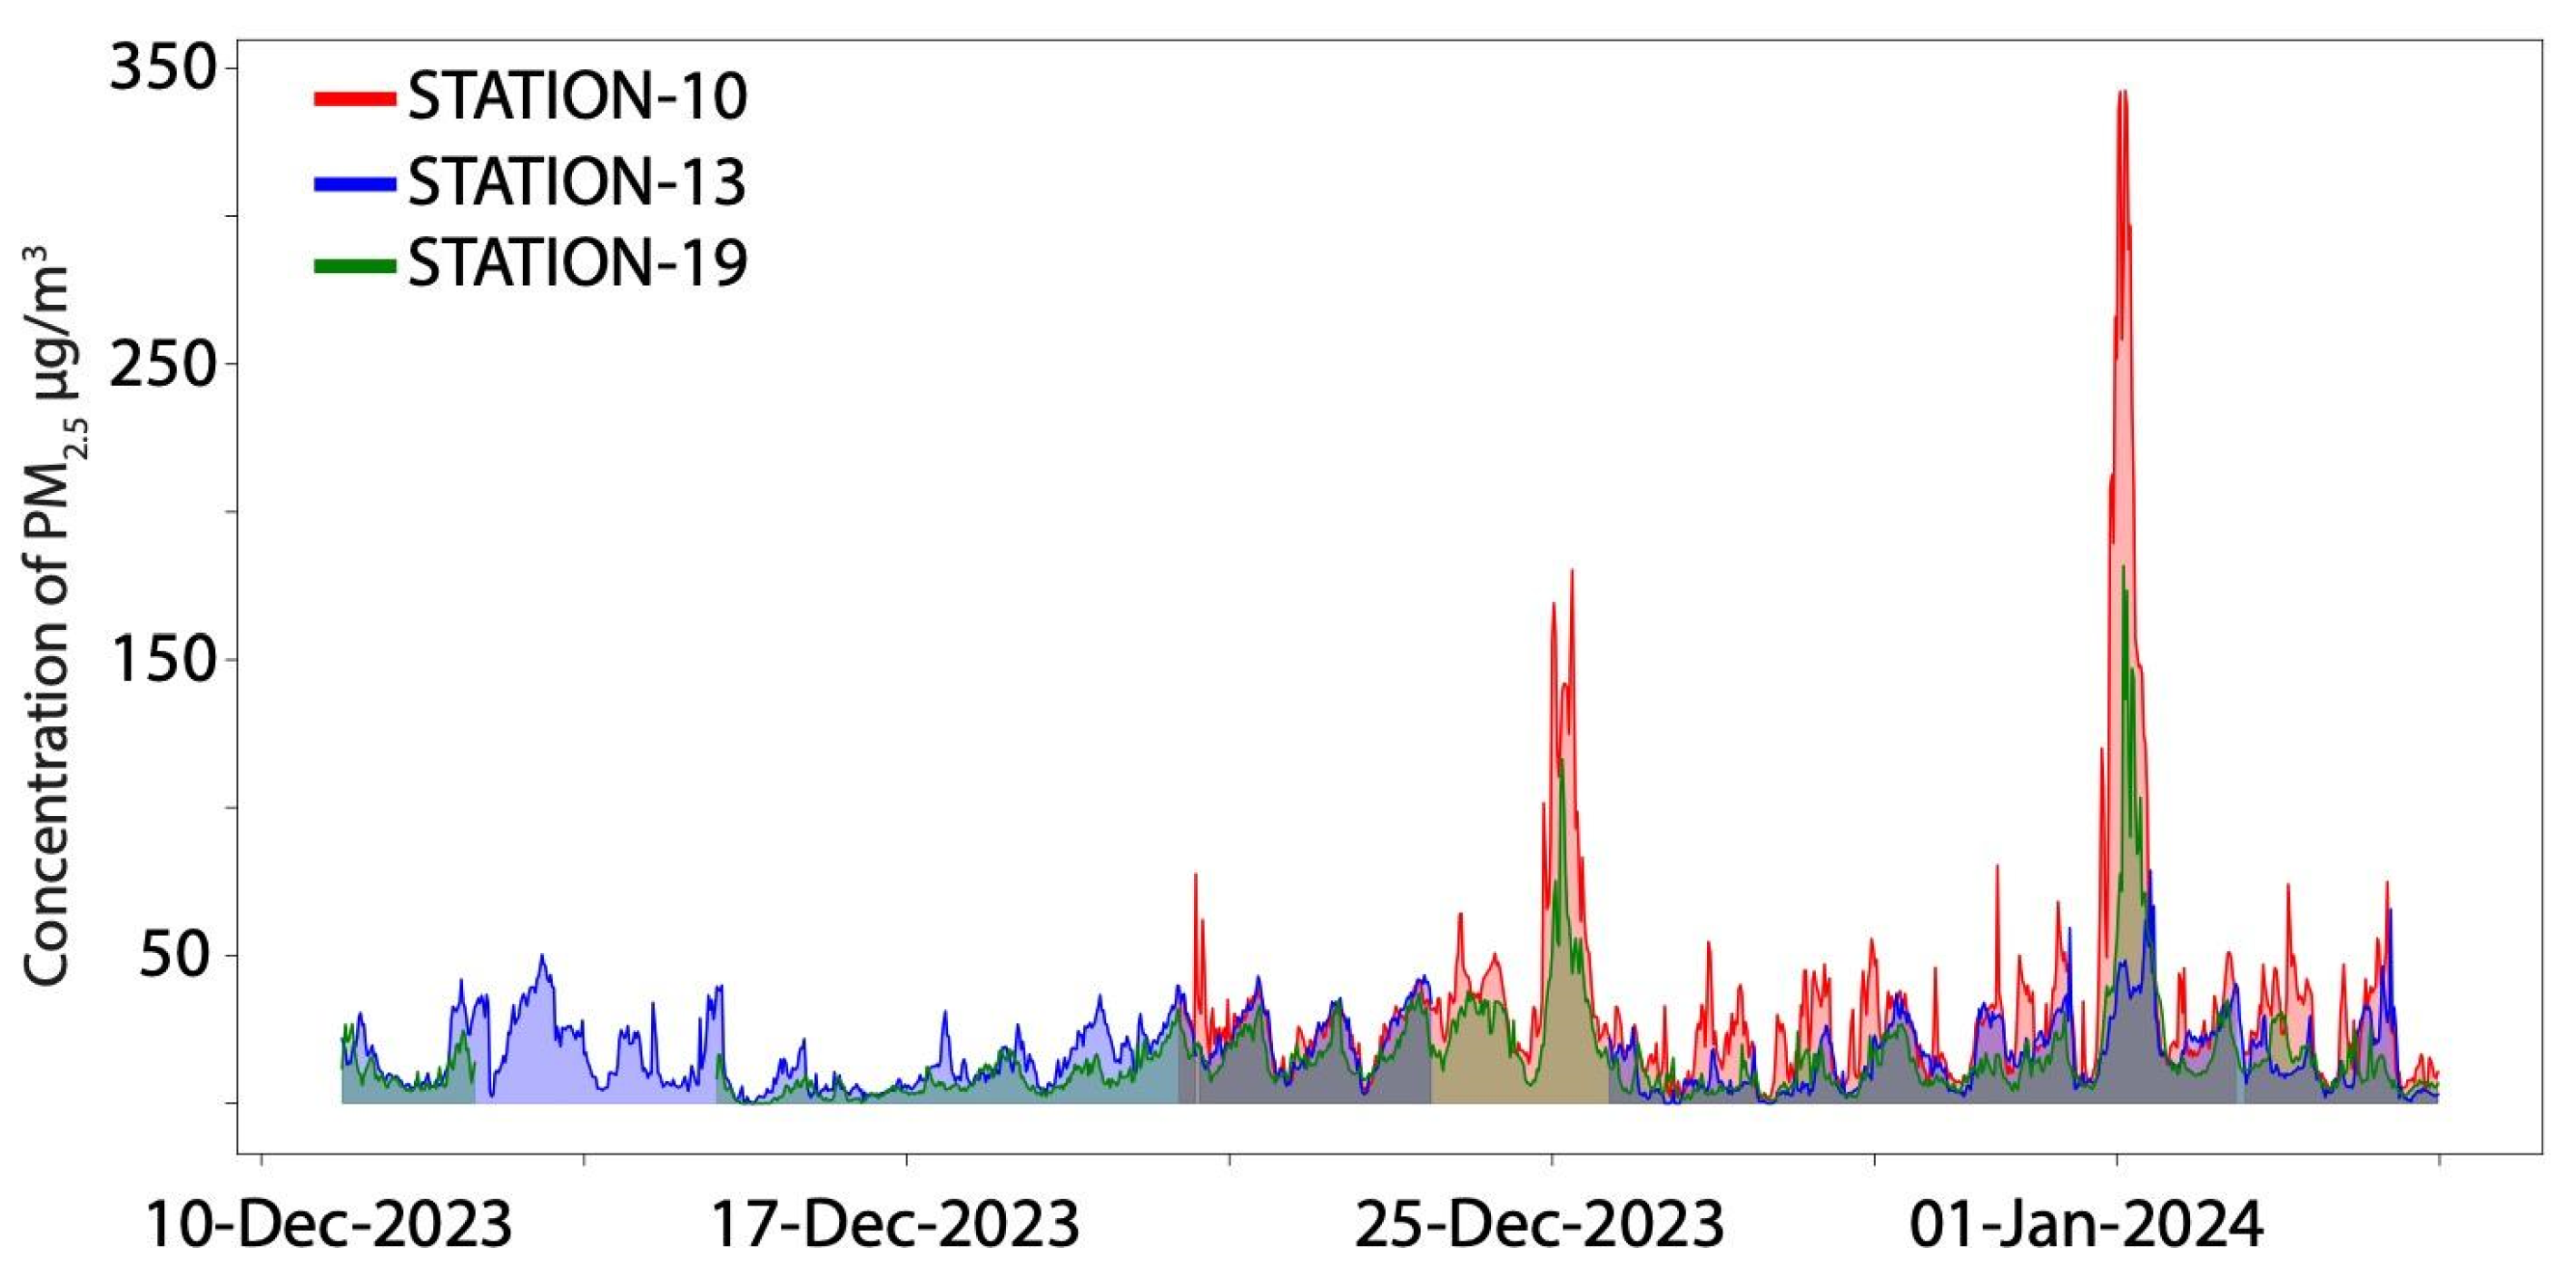
Figure 2c illustrates the time series for STATION-10 from 10 February to 10 March 2024, displaying several peaks with high PM2.5 concentration values, of less than 30 min in duration. These peaks are probably due to isolated local events and are of much shorter duration than the peaks related to the festivities mentioned above. Figure 3 presents a comparison among three stations with the highest, intermediate, and lowest PM2.5 values (STATION-10, STATION-19, and STATION-13, respectively). For STATION-10 and STATION-19, a similar trend of increased PM2.5 concentrations was observed, albeit in varying proportions, between 24 December 2023 and 1 January 2024. For STATION-13, located in the middle of an industrial area and separated several kilometers from urban areas, during Christmas and New Year’s Eve, the human activity related to transit and industry was minimal, and there were no sources of firecrackers nearby, so the increase of the PM2.5 was minimal during these periods.

Figure 3.
Comparison among three time series showing increases in PM2.5 concentrations at three monitoring sites: STATION-10 in red; STATION-13 in blue; and STATION-19 in green.
3.2. Meteorological Conditions and PM2.5 Relationship
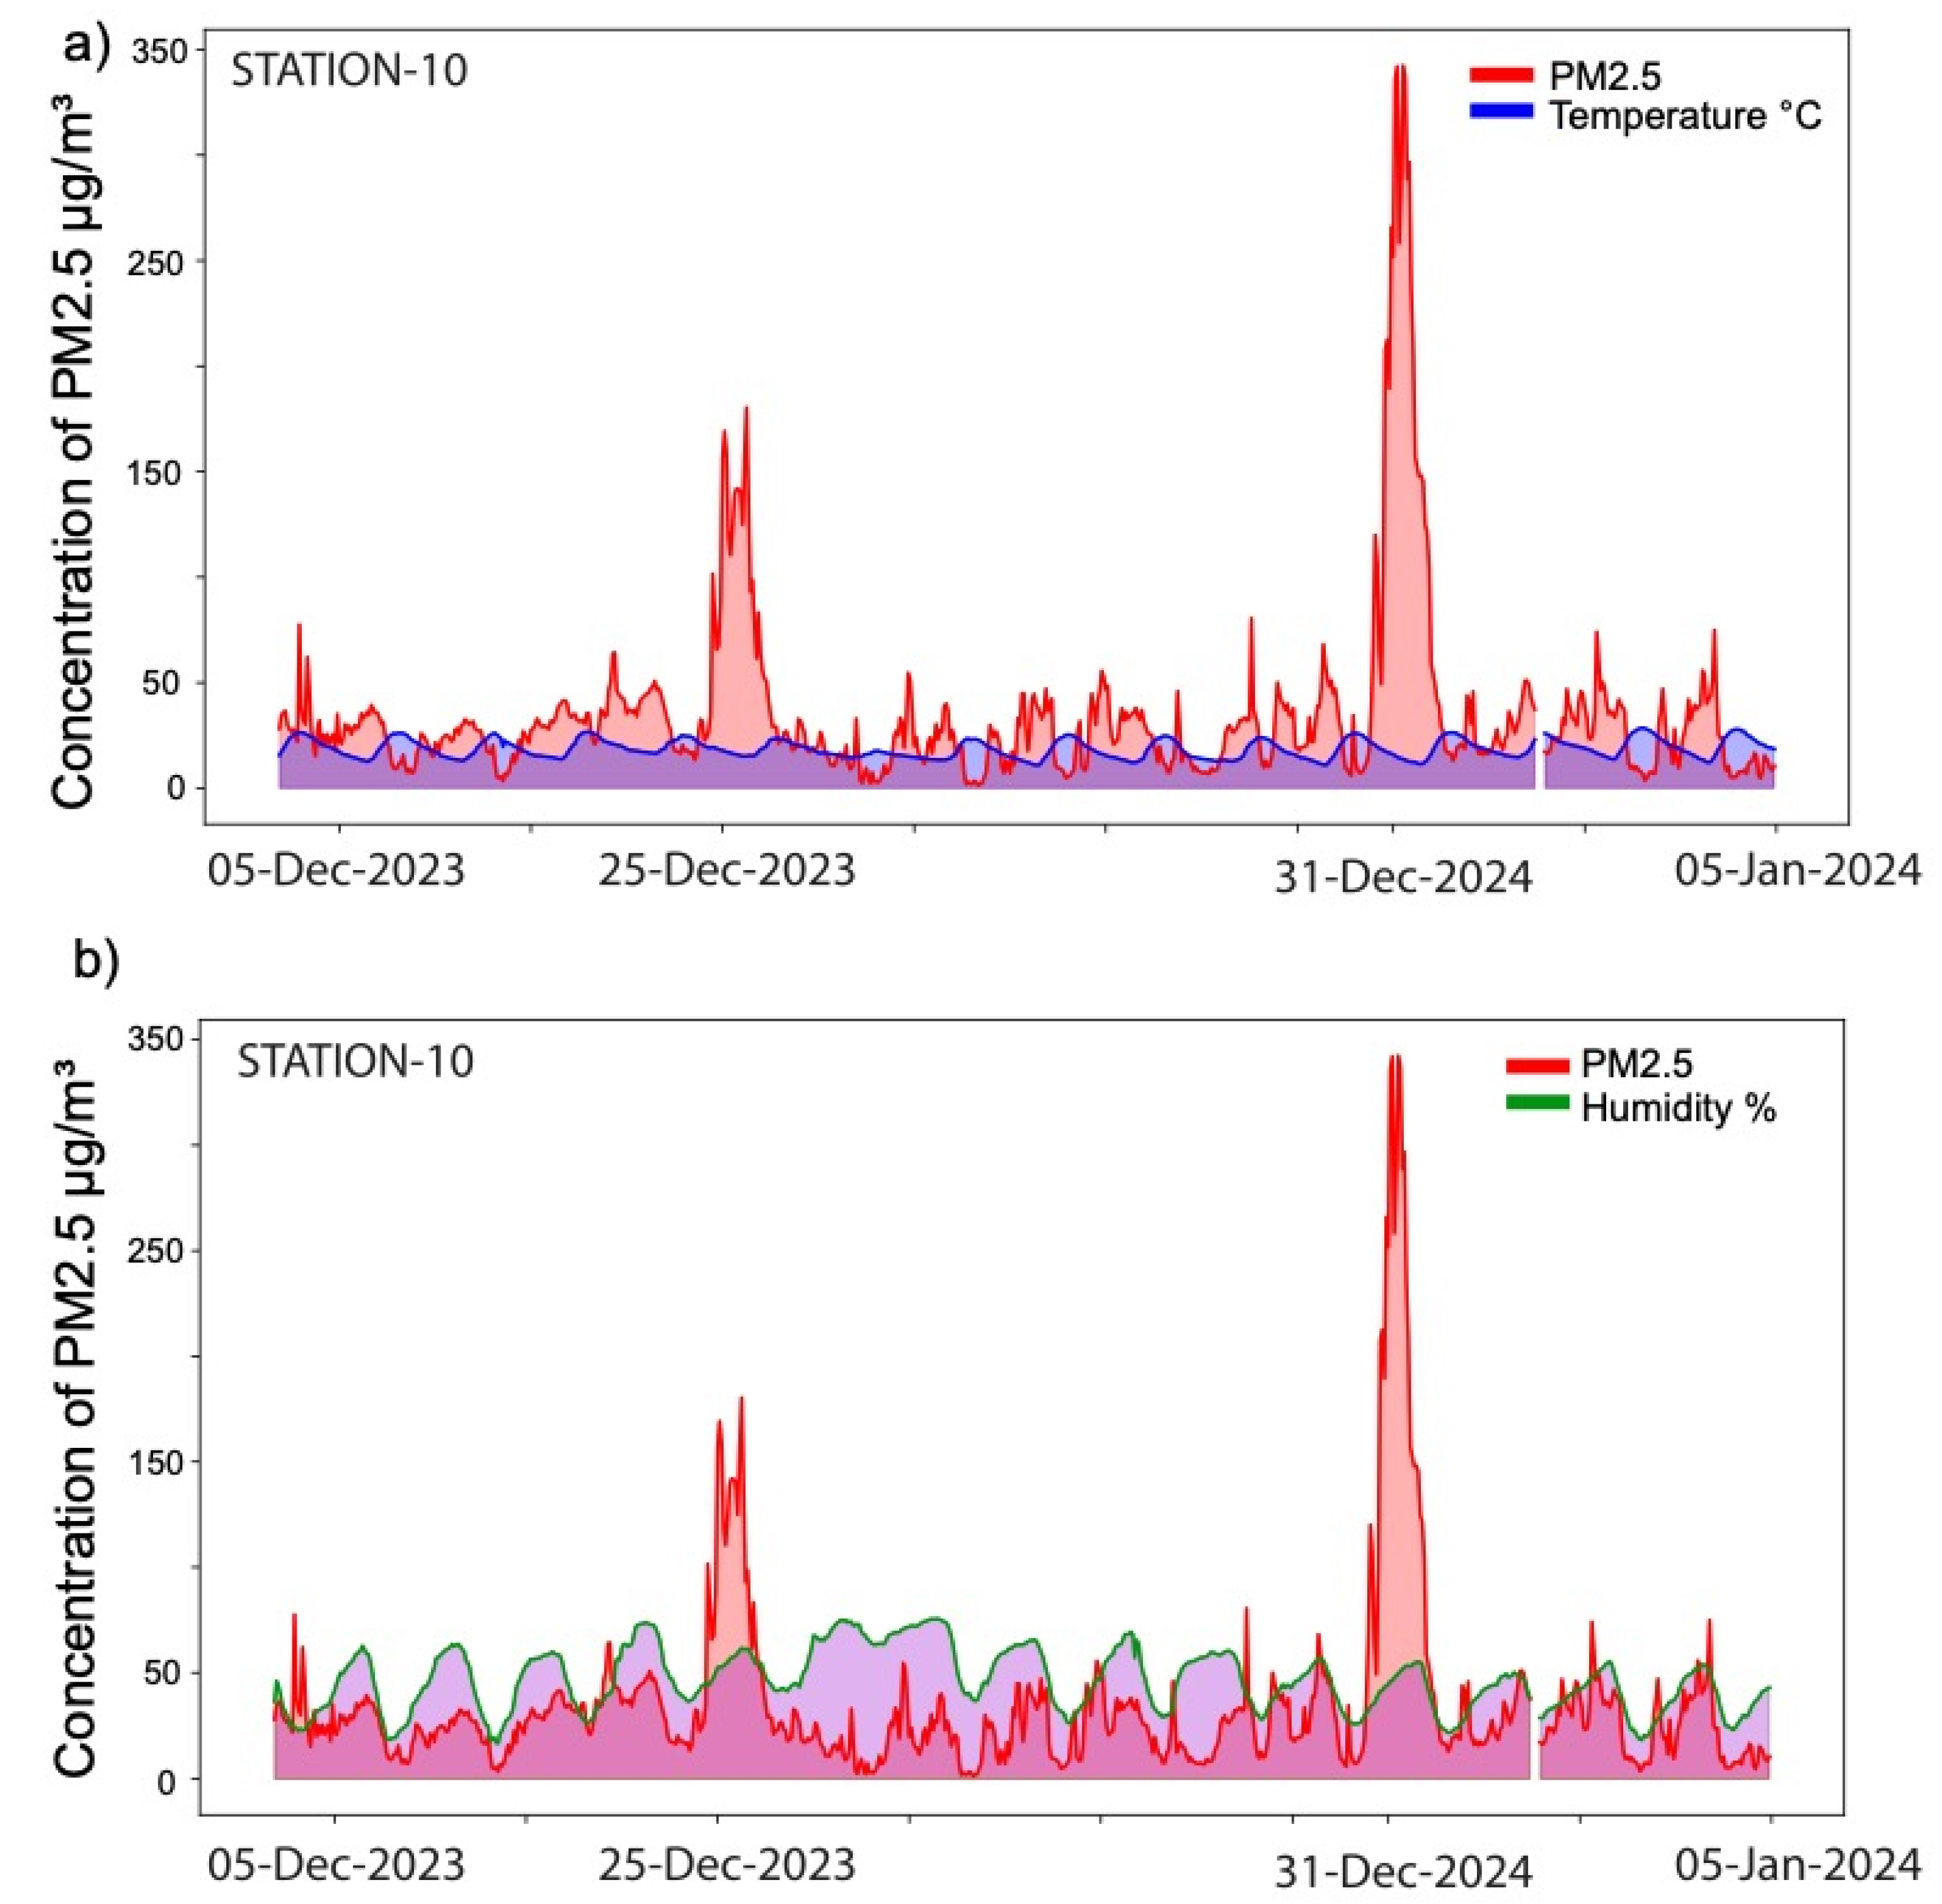
Figure 4 compares the PM2.5 concentrations at STATION-10 with temperature and relative humidity. Figure 4a shows that the temperature had a daily variation between 10° C and 20° C. However, no specific correlation with the significant increase in PM2.5 concentrations was observed for 24–25 December and 31 December–1 January. Furthermore, during the period studied, there was no rainfall. Humidity showed daily variations (Figure 4b) but no correlation with the high PM2.5 concentrations. This suggests that the abrupt increase in these values is not correlated with meteorological conditions, indicating that the high concentrations of PM2.5 recorded are likely of an anthropic origin, associated with the burning of fireworks.
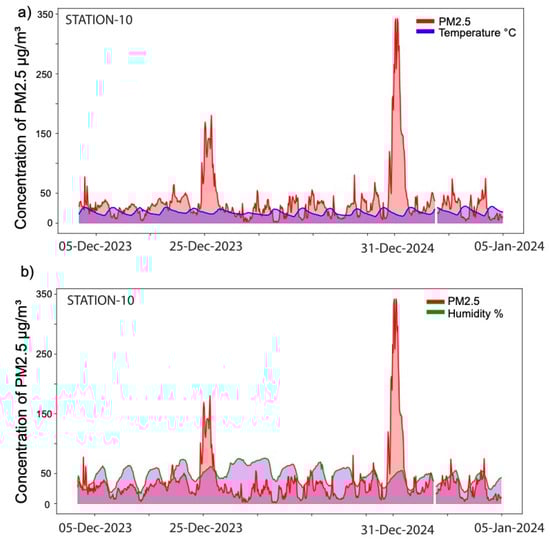
Figure 4.
Comparison with temperature (a) and humidity (b) dependence of the PM2.5 concentrations at STATION-10.
3.3. Diurnal Trends
Based on the typical patterns of PM2.5 emissions into the atmosphere, the PM2.5 concentrations were grouped to examine the daily variations and their dependence on human activities. This involved calculating hourly averages and filtering out outliers, as previously described. The data were then organized by day of the week, from Monday to Sunday, and further segmented by time of day, from 0 a.m. to 11:59 p.m.
STATION-10 (Figure 5a) and STATION-19 (Figure 5b) depicted notable increases in PM2.5 concentrations during the late hours of Sunday 24 and the early hours of Monday 25, as well as for Sunday 31 and Monday 01, corresponding to Christmas and New Year’s celebrations. This pattern coincides with periods of high pyrotechnic activity. STATION-13 (Figure 5c; with the lowest records for the studied period) exhibited a similar trend to Figure 5d, indicating that regular human activity such as transit and industry is the principal source of PM2.5, and the pyrotechnic activity in this area was less intense.
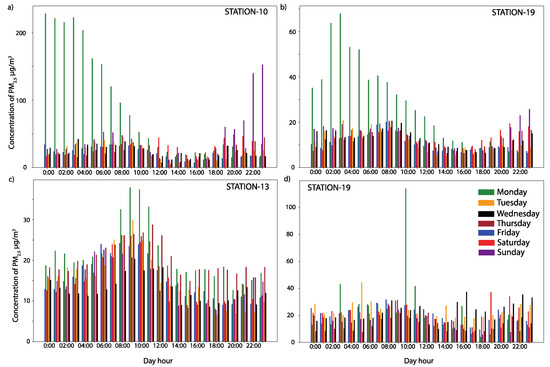
Figure 5.
Trends by day of the week from Monday to Sunday, and by hour of the day. (a–c) illustrate the hourly and daily trend of PM2.5 concentrations during Christmas and New Year’s Eve. (d) shows the weekly trend for a regular season, from 10 February to 10 March 2024.
Figure 5d illustrates the daily PM2.5 records from 10 February to 10 March 2024, from STATION-19, representing typical activity patterns over four consecutive weeks. The graph highlights the days of the week that, on average, contribute to higher levels of PM2.5 in the environment, with notable peaks corresponding to peak traffic hours in the city, usually from 7 to 10 a.m. and 6 to 8 p.m.
3.4. Hourly Trends
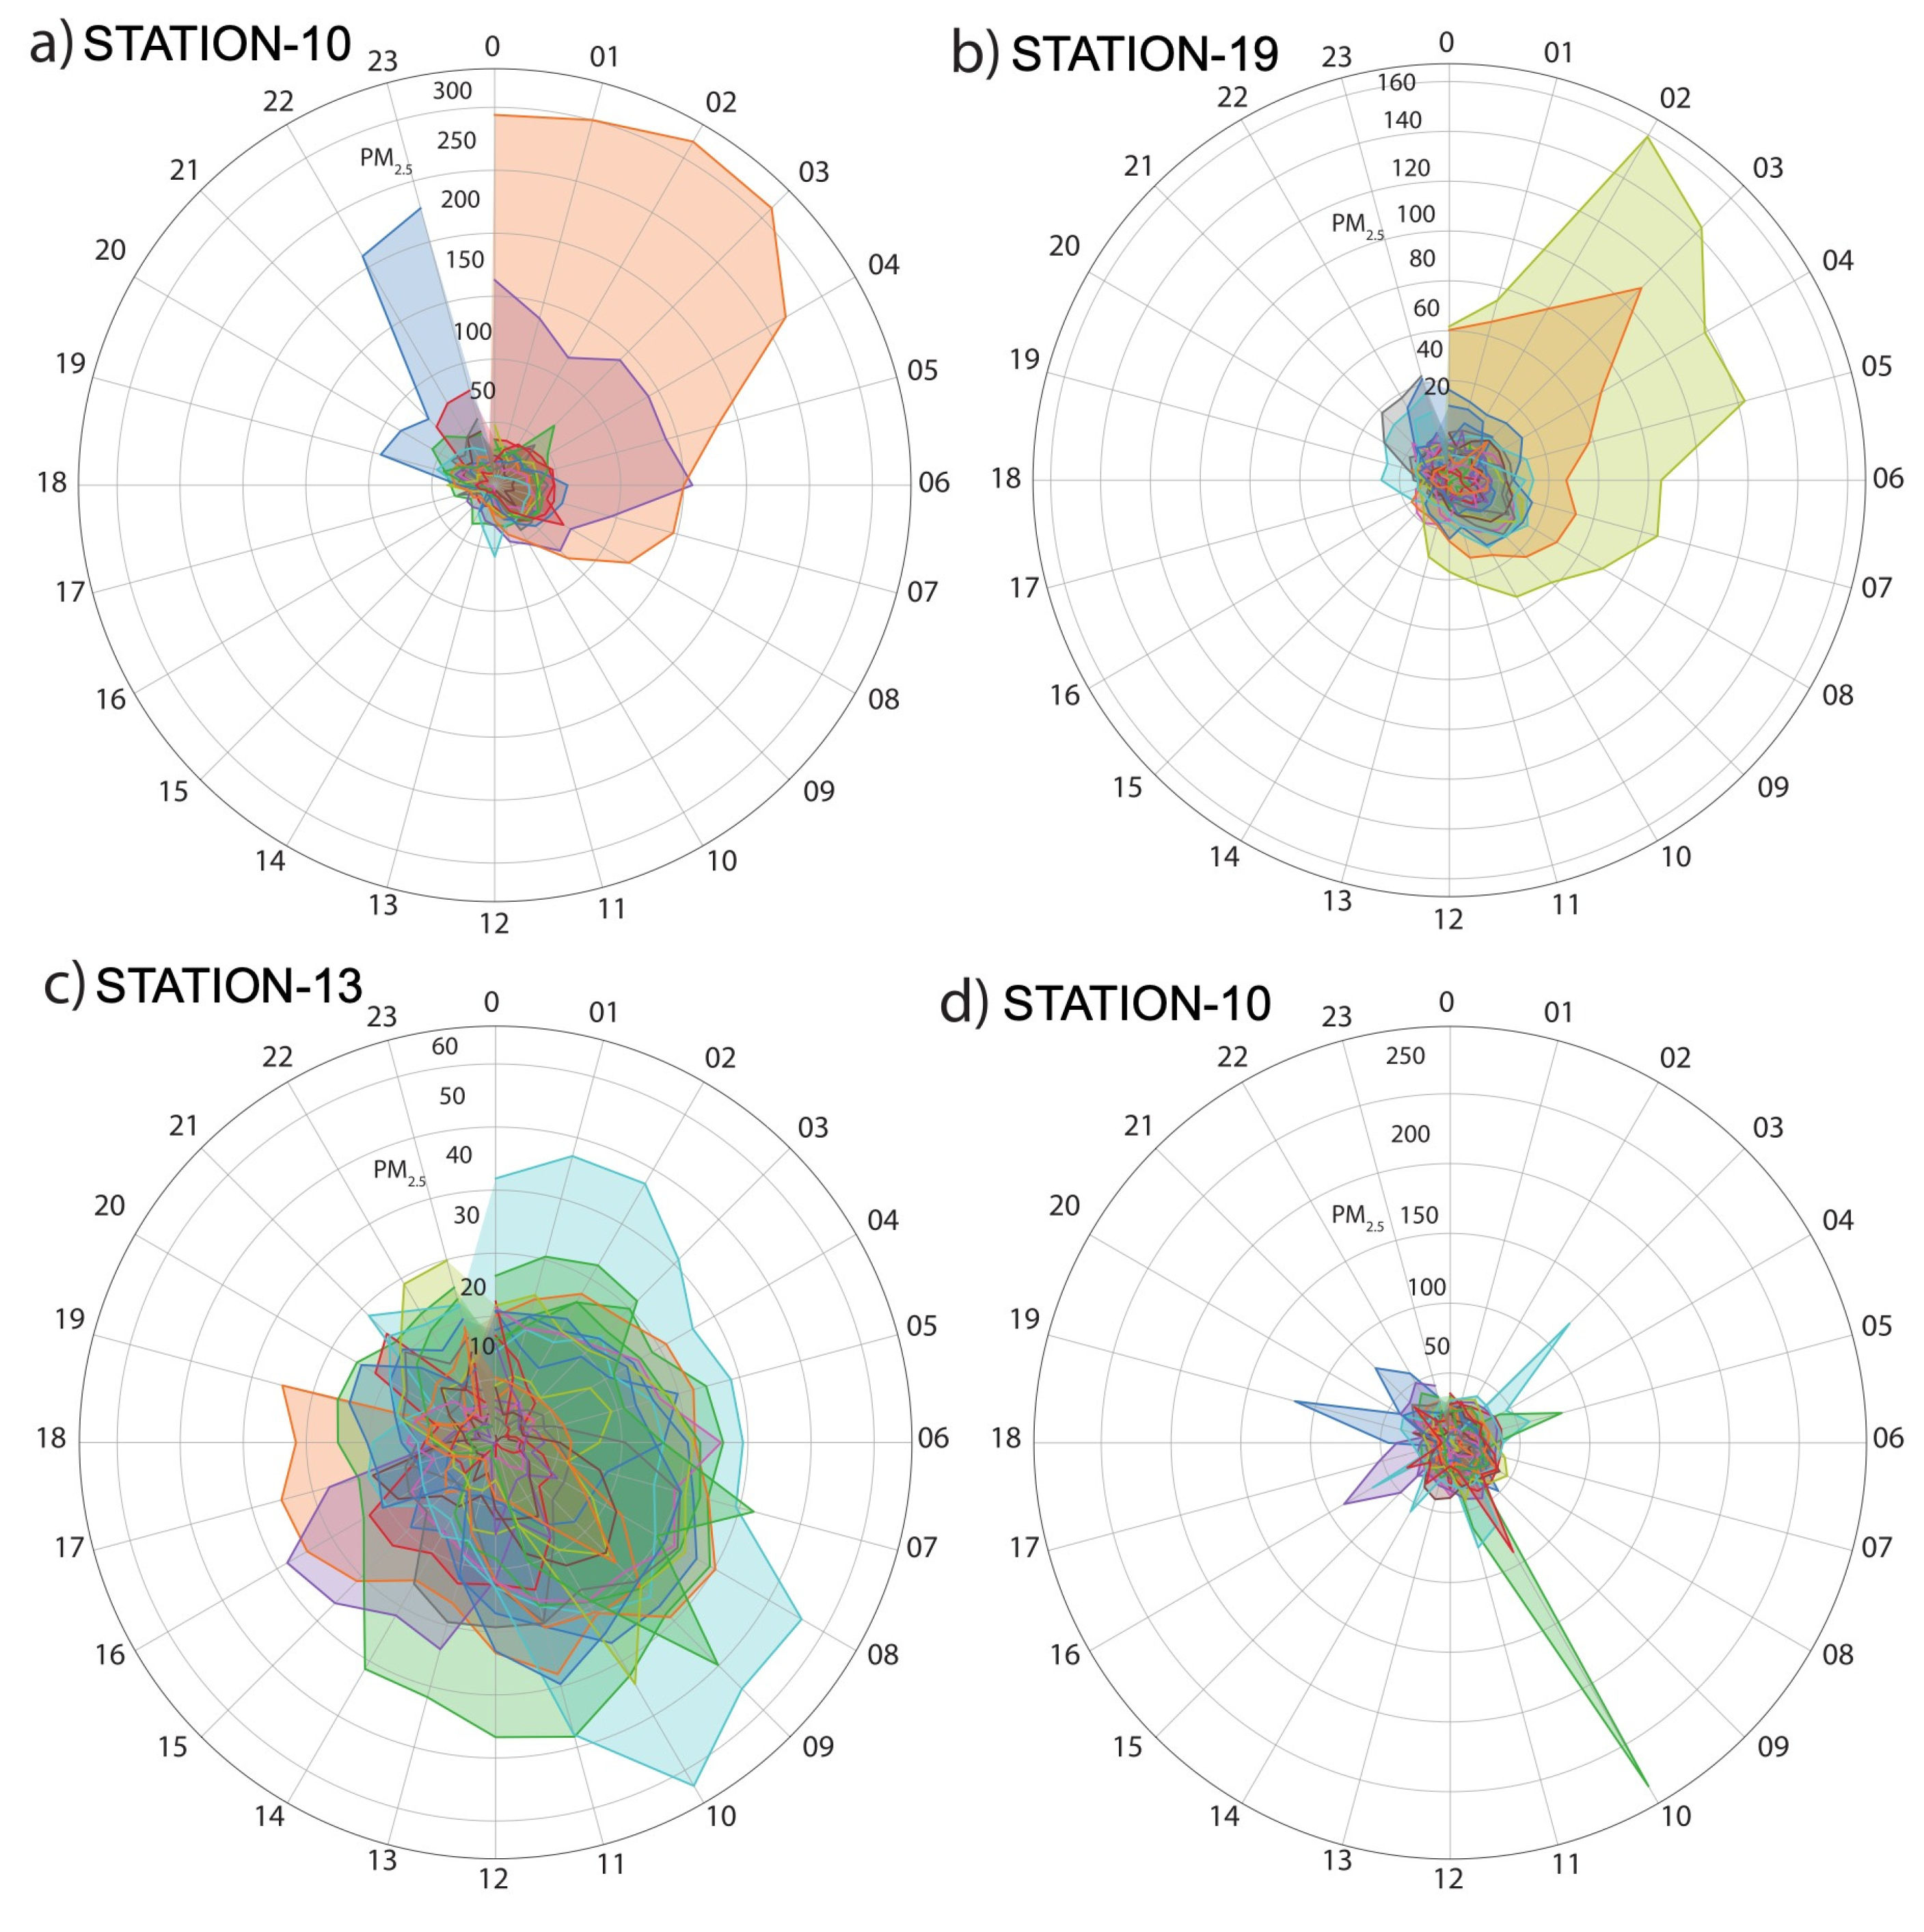
To understand the specific daily variations, the time series are shown in polar form in Figure 6. This represents a daily radial axis of concentration of PM2.5 by each hour of the day, enabling visualization of hourly variations from 0 to 11:59 p.m. for each day within the date range of this study. Each different color represents a different day during the period analyzed.
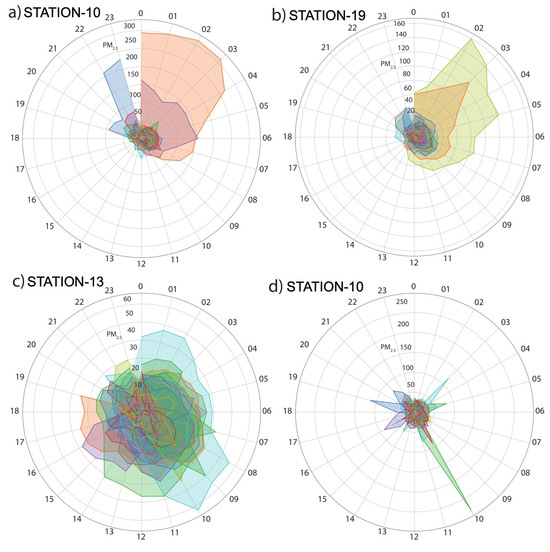
Figure 6.
Polar representation showing trends of PM2.5 concentrations in hourly averages. Each different color indicates hourly averages for a full day of data. The radial axis shows the PM2.5 concentrations; Clockwise numeration shows the hourly distribution of PM2.5 from 0 to 23 h.
Figure 6a,b depict the polar graphs, illustrating the hourly behavior of stations STATION-10 and STATION-19, respectively. Two curves can be observed, with a noticeable increase from 9 p.m. to 7 a.m. of the next day. This period coincides with the pyrotechnic burning starting around 9 p.m. on 24 December 2023, continuing until around 7 a.m. A similar behavior is observed from 31 December 2023 to 1 January 2024. This aligns with observations from the comparison of time series data for the study period. Figure 6c displays the polar projection for the STATION-13 sensor, which recorded the lowest concentration of PM2.5 during the studied period. Here, the burning of pyrotechnics was considerably lower compared to other stations in the city. Figure 6d shows the polar projection of STATION-10 for the period between 10 February and 10 March 2024. Although the daily trends differ from those of STATION-13, as they correspond to different social environments, a similarity in maximum averages can be observed. Neither of the two projections exhibit sustained peaks for several hours, as observed in STATION-10 and STATION-19.
3.5. Histograms
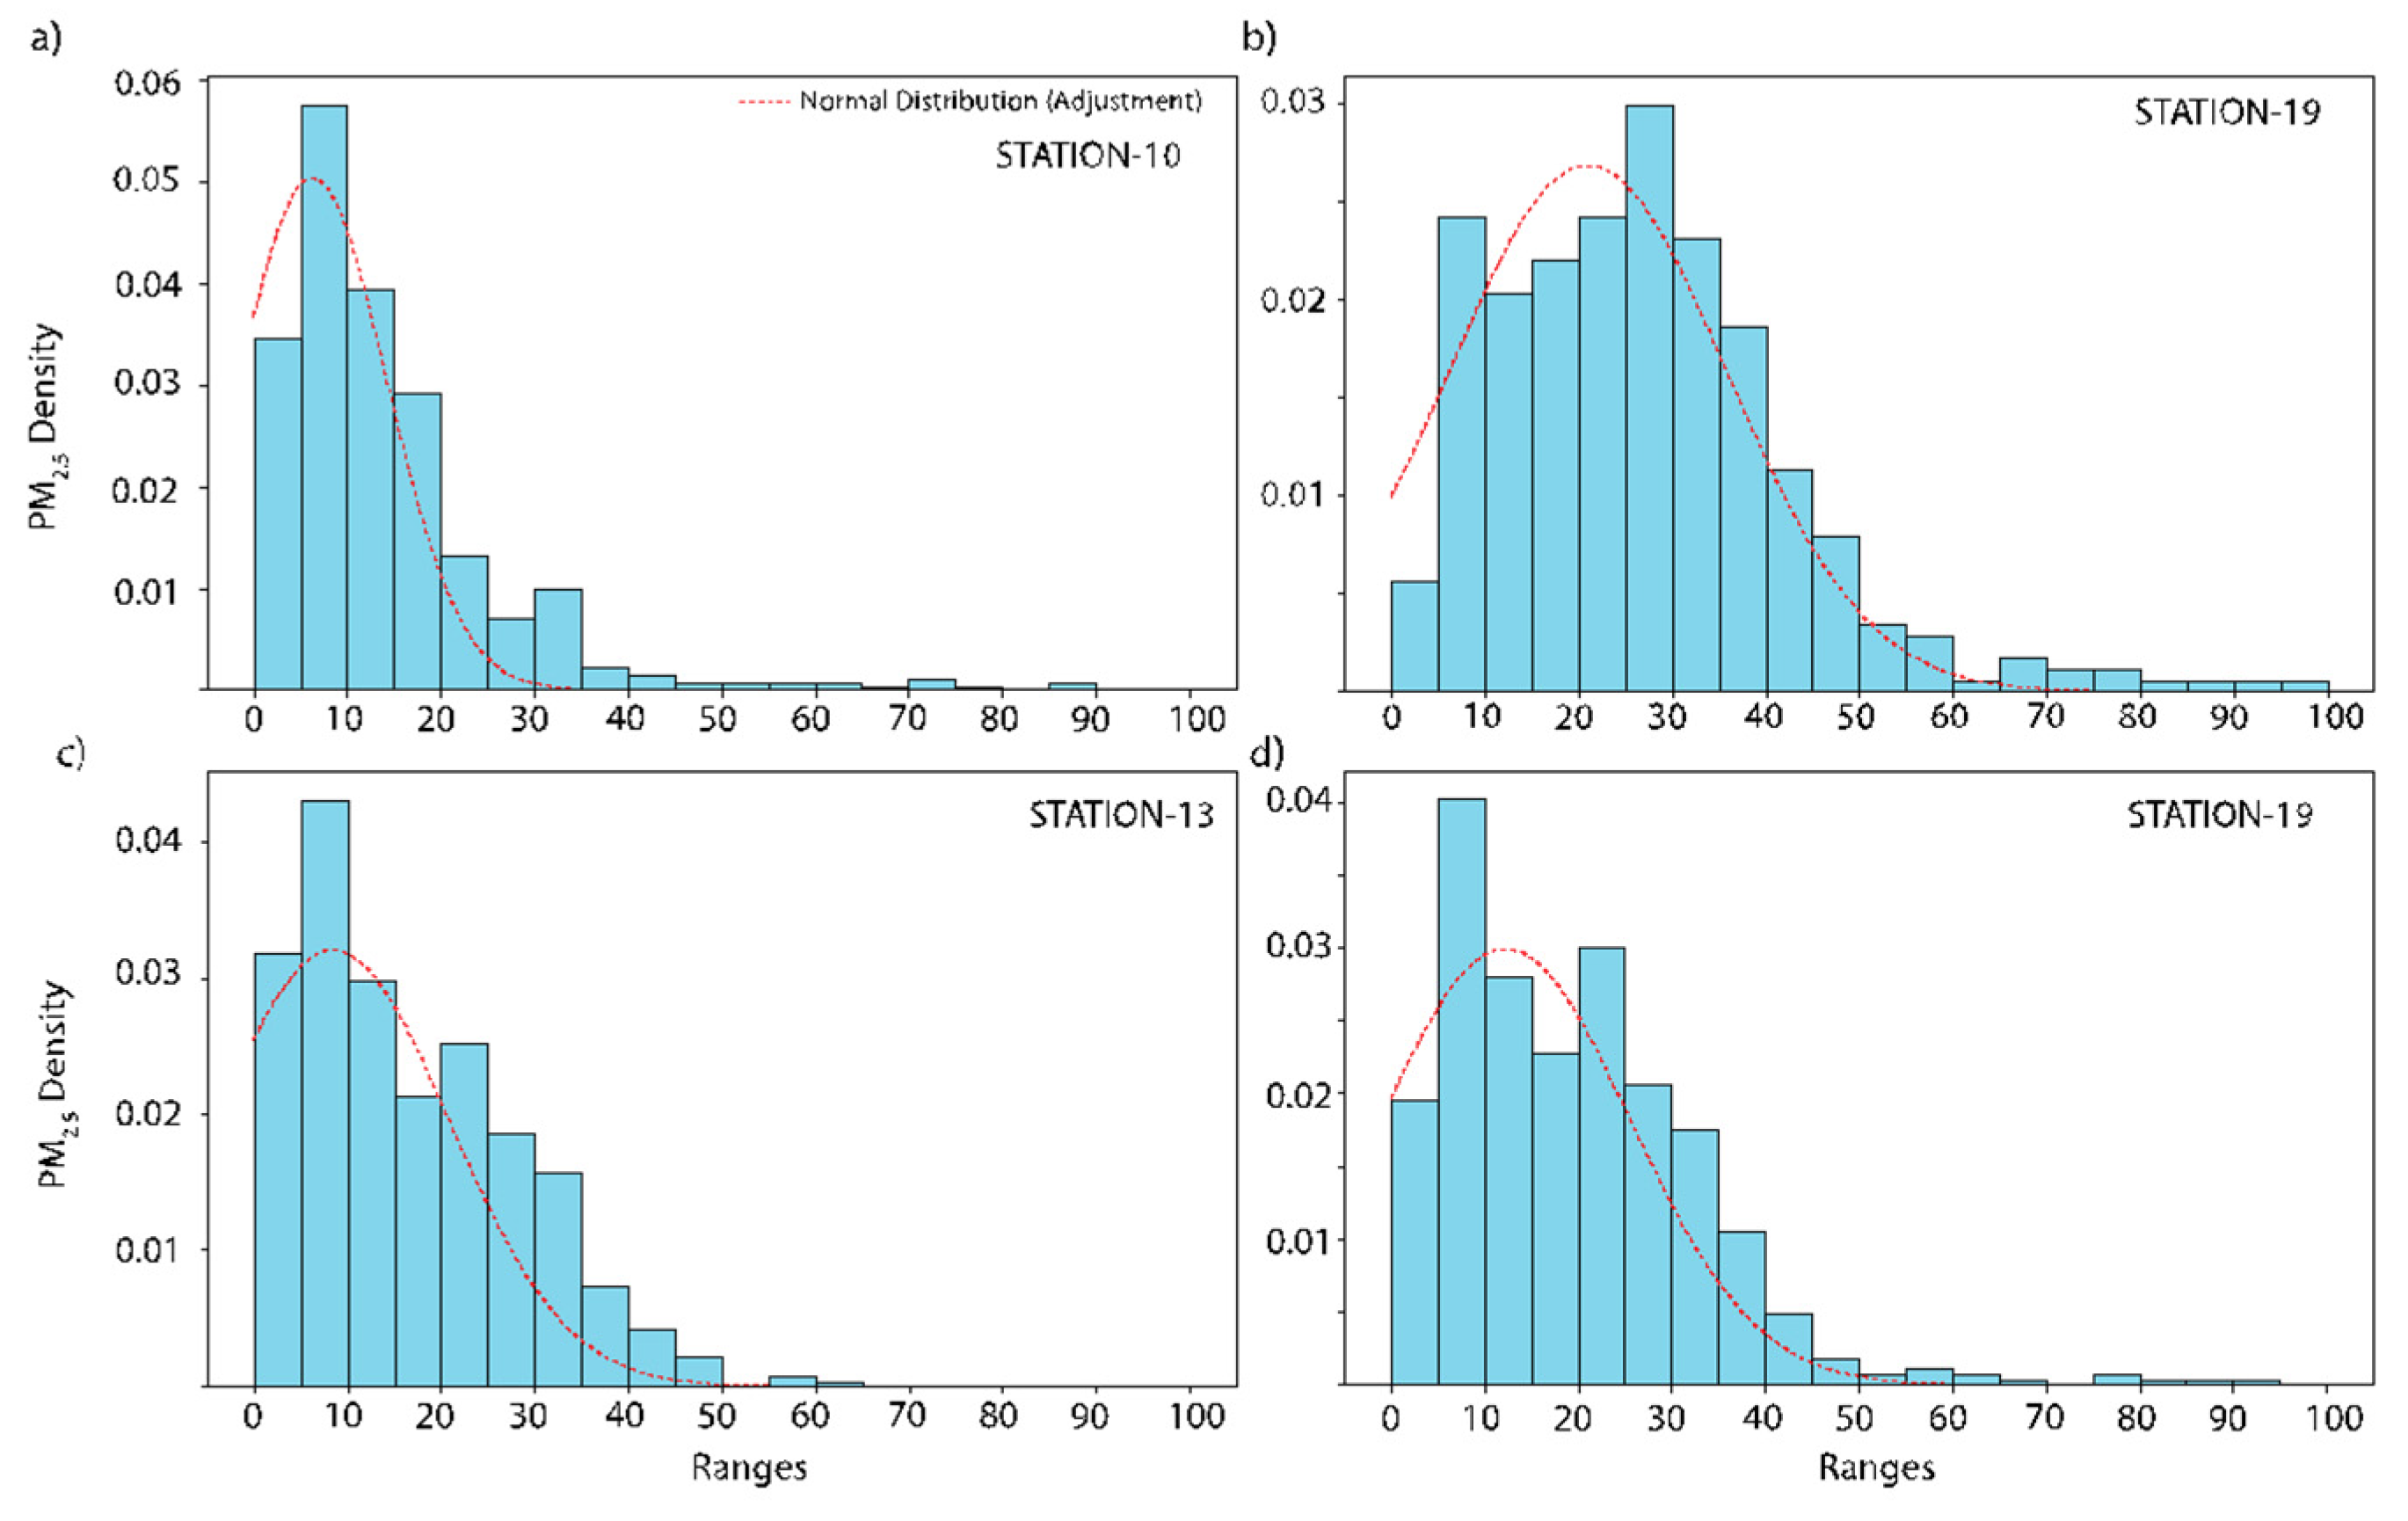
To evaluate the statistical impact of these short-term events, which nonetheless have a high environmental significance [9,29], histograms were constructed for each station for the period of this study. PM2.5 concentrations were grouped into ranges of PM2.5 concentrations of 5 µg/m3 each. A Gaussian (normal) distribution curve was fitted to the histogram to show the distribution of occurrence density for each PM2.5 concentration range.
Figure 7a–c present the histograms for STATION-19, STATION-10, and STATION-13, respectively, over the festivities period. It is observed that in STATION-19 and STATION-13, the distribution of PM2.5 concentrations extends up to 40 and 50 µg/m3, with very similar distributions. In the case of STATION-10, concentrations extend up to 50 and 60 µg/m3, with a similar but slightly higher distribution, compared to that of STATION-19 and STATION-13. Figure 7d illustrates the histogram of data recorded between February and March 2024 for STATION-19, representing normal anthropogenic activities. A distribution with a similar trend to those shown by Figure 7a–c is observed, but the 95% limits of the normal distribution are reduced to 40 and 50 µg/m3. This demonstrates that in longer time series, these short-lived events become diluted and challenging to detect, yet their environmental impacts remain significant.

Figure 7.
Histograms of PM2.5 concentrations grouped into 5 µg/m3 ranges and fitted to a normal distribution. (a–c) show the histograms for PM2.5 concentrations during Christmas and New Year’s Eve. (d) shows the histogram for a regular season, from 10 February to 10 March 2024.
3.6. Spatial Distribution of PM2.5
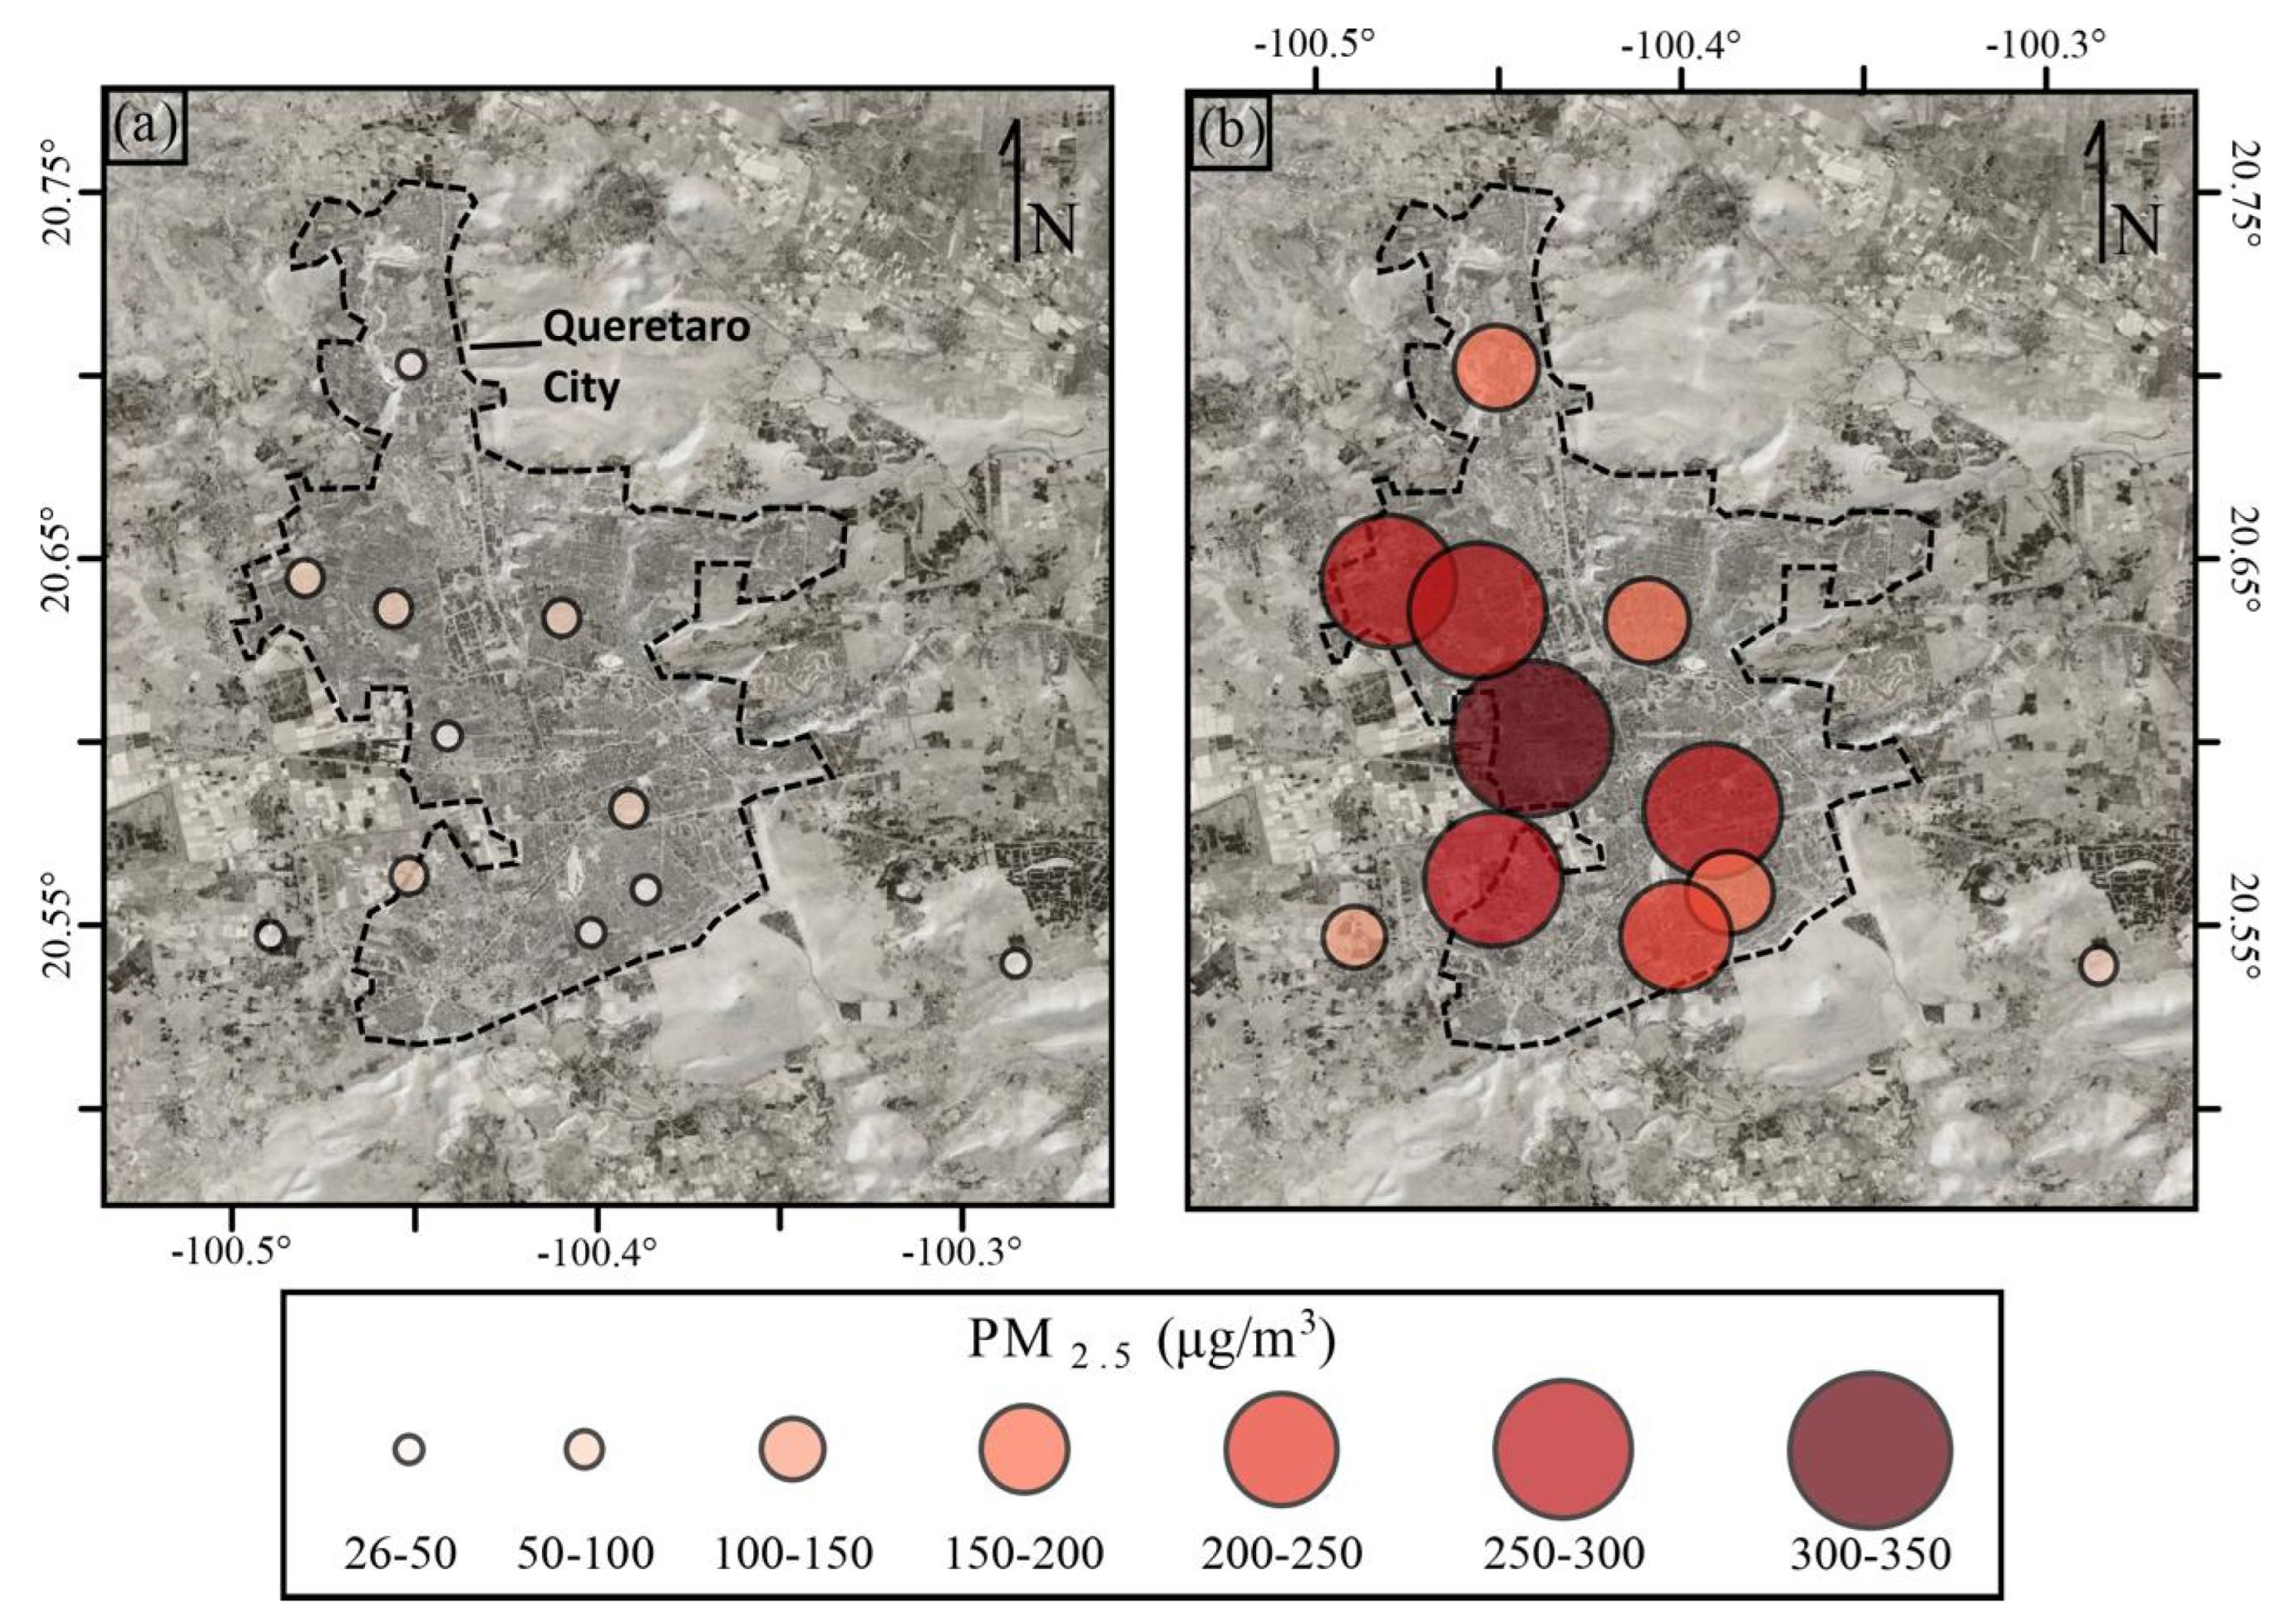
During the early hours of 1 January 2024, from 0 am to 7 am (GMT-6), EMGA sensors observed a notable increase in PM2.5 recordings, some of them up to 1000% higher than the usual values during the same hours. Figure 8a displays the maximum values recorded for 12 February 2024 (Monday), considered a random typical day of activity in the city. Figure 8b illustrates the spatial distribution of PM2.5 records, highlighting the highest readings observed at STATION-10, located in the central area of the city, for New Year’s Eve. During the celebration, the highest records of PM2.5 in this study were observed.
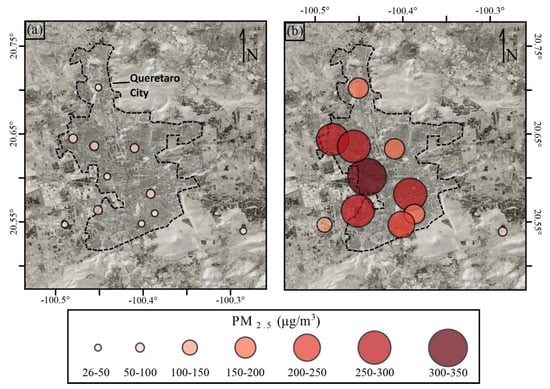
Figure 8.
Spatial distribution of maximum PM2.5 concentrations recorded in the monitoring network for 12 February 2024 (a); and for 1 January 2024 (b).
This region is recognized as one of the most densely populated areas in the city and is adjacent to two important industrial zones. Additionally, it is characterized by nearby neighborhoods where various regional and local festivities, such as religious festivals, occur more frequently than in other parts of the city. Conversely, the lowest readings correspond to STATION-13, located in the southwest area of the city. This site is positioned between the Bernardo Quintana Industrial Park and the Cimatario National Park ecological reserve and boasts one of the lowest population densities in the city. Despite experiencing intense activity on regular working days and hours, human activity, including both traffic and industrial activities, is notably diminished during the early hours of 1 January, compared to other parts of the city, resulting in the lowest PM2.5 recordings among all stations during that period. Table 1 presents the maximum PM2.5 concentration values recorded by the stations for 1 January and 12 February.

Table 1.
Maximum PM2.5 concentrations were recorded at monitoring stations for 1 January and 12 February 2024.
4. Discussion
The use of low-cost sensors presents a feasible and economical alternative for monitoring air quality in urban settings exposed to various sources of pollution. While these sensors may not offer the same level of precision as reference equipment, they serve as valuable tools for identifying the sources and dispersion of contaminants stemming from human activities, as well as their correlation with climatic variables like temperature, humidity, and other climate conditions [19,30,31,32,33]. The data presented in this study highlight contamination sources from burning pyrotechnics, over several hours and distributed across the city. They demonstrate the utility of low-cost monitoring networks to track such time-limited processes, and how they affect the environment spatially in a large city such as Queretaro.
Real-time recordings provided by sensors enable the observation of varying environmental conditions (deterioration of air quality), including changes in particulate matter concentration. Short-term fluctuations, spanning from minutes to hours, are frequently linked to human activity, which can exert significant short- and medium-term impacts on the environment. In this study, we analyze the substantial increase in atmospheric PM2.5 concentration resulting from burning fireworks. Spatially, Figure 8b illustrates station distribution and their peak values recorded during the early hours of 1 January 2024, showing considerable increases across most stations compared to typical values depicted in Figure 8a. The spatial distribution identifies areas where firework burning was more intense during that period, associating it as a source of contamination during short-term events.
Complementing spatial distribution, time series analysis reveals PM2.5 concentration variations over time. A significant increase is observed in PM2.5 concentrations recorded on 25 and 31 December across most stations, indicating a substantial rise in atmospheric pollutants generated during a few hours due to burning fireworks. Each station’s location reflects changes corresponding to the predominant human activity in its area. For instance, STATION-13, situated in an industrial area, exhibits no significant increase in PM2.5 concentration during these holidays, suggesting lower human activity compared to residential areas like stations 10 and 19. This underscores the anthropogenic influence on PM2.5 concentrations during short-duration events.
Weekly and hourly trends display a consistent pattern aligned with human activity, with PM2.5 concentration fluctuations marked by peak times of anthropogenic activity such as vehicular traffic and industrial operations. However, as depicted in Figure 7a,b and Figure 8a,b, pyrotechnic activity disrupts these trends, substantially elevating PM2.5 concentrations compared to periods of lower activity.
Real-time monitoring proves crucial, allowing for the recording and characterization of short-lived events in time and space. Despite their brief duration, such events significantly impact environmental conditions, potentially affecting human health and urban fauna diversity. Figure 8 demonstrates how high PM2.5 concentrations may go statistically unnoticed in longer-term records, with only more frequent concentrations observed in the normal distribution. This fact underscores the challenge of quantifying and associating short-term effects with other anthropogenic and environmental issues, such as forest fires, outdoor waste burning, accidental fires, and barbecues, among others.
The bursting and burning of firecrackers during festivities can cause important damage to human health every year. Consumer firework-related physical injuries can be devastating, leading to permanent vision loss, limb amputations, and, in some cases, death [34,35,36]. On the other hand, exposure to PM2.5 can cause acute and chronic health problems, with evidence showing that exposure to the particulate matter is linked to cardiovascular disorders such as heart attacks, heart failure, arrhythmias, and strokes [37,38]. More critical are the respiratory effects, such as asthma attacks and exacerbated respiratory symptoms like sneezing, wheezing, and shortness of breath, as exposure to PM2.5 is associated with those respiratory disorders [38,39,40]. In Mexico, the national regulations (NOM-025-SSA1-2021) establish a maximum exposure to concentration averages of 45 µg/m3 to prevent a health risk for the population [41]. This regulation is concordant with the US EPA 40 CFR part 50 [42]. The results presented in this work show how the increased PM2.5 concentrations considerably surpass the limits established by the Mexican and international regulations during the pyrotechnic burning activities. As a general diagnosis of the air quality situation in Queretaro during Christmas and New Year’s Eve, it can be said that the urban area presents a prominent spike of PM2.5 as a result of the intense burning of pyrotechnics among other materials such as bonfires.
With high concentrations of PM2.5 recorded during Christmas and New Year’s Eve, health issues manifest as cardiopulmonary problems, alongside visual and auditory overstimulation. The sudden loud noises and intense brightness of fireworks trigger fear and confusion among animals. Pet dogs often display signs of fear, particularly in response to noise, such as heightened activity, panting, vocalizations, blinking, and seeking out hiding spots [43]. It is worth noting that not all individuals respond identically to stress, which may explain why some do not exhibit obvious signs of fear [43].
5. Conclusions
The recording of environmental pollution through the use of low-cost sensors such as EMGA provides valuable data for monitoring human activity. This study highlights particularly short-term events such as burning fireworks. These brief events may go unnoticed in long-term time series of low resolution. Additionally, the importance of low-cost and dense environmental monitoring networks is demonstrated, providing data over long periods and enabling spatial analysis, thereby inferring anthropogenic impacts on environmental conditions. In this study, we show how two events lasting approximately 10 h resulted in particulate matter concentrations up to 10 times higher than on a regular day, surpassing any national and international regulations. This could have negative consequences for human health and urban fauna diversity. Analyzing these events can facilitate the design of mitigation measures to reduce environmental damage.
Author Contributions
A.R.-T.: conceptualization, writing, interpretation, figures, technical development, and programming of the device and the visualization platform; H.E.I.-O.: technical development of the equipment, reviewing; H.N.B.: conceptualization, funding acquisition, writing, reviewing, technical development of the device; D.S.: funding acquisition, reviewing; R.G.-G.: writing, interpretation, reviewing, figures; A.G.C.-M.: writing, interpretation, reviewing; L.E.S.-R.: writing, interpretation, reviewing, figures; M.A.E.C. (Mauro A. E. Chaparro): writing, interpretation, reviewing; M.A.E.C. (Marcos A. E. Chaparro): writing, interpretation, reviewing. All authors have read and agreed to the published version of the manuscript.
Funding
This work was funded by UNAM-DGAPA PAPIIT IG-101921. Rodríguez-Trejo acknowledges the support from CONAHCYT for the postdoctoral fellowship EPM 2022 (1). The APC was funded by the MDPI Editorial Team.
Institutional Review Board Statement
Not applicable.
Informed Consent Statement
Not applicable.
Data Availability Statement
Data will be made available on request.
Acknowledgments
This work was supported by project DGAPA PAPIIT IG-101921. Special thanks to J. Escalante-González from IGc for his technical support. The authors thank the editors and two anonymous reviewers whose comments improved this manuscript.
Conflicts of Interest
The authors declare no conflicts of interest.
References
- Li, Y.; Zhang, Z.; Liu, H.; Zhou, H.; Fan, Z.; Lin, M.; Wu, D.; Xia, B. Characteristics, sources and health risk assessment of toxic heavy metals in PM2.5 at a megacity of southwest China. Environ. Geochem. Health 2016, 38, 353–362. [Google Scholar] [CrossRef] [PubMed]
- Chen, L.; Pang, X.; Li, J.; Xing, B.; An, T.; Yuan, K.; Dai, S.; Wu, Z.; Wang, S.; Wang, Q.; et al. Vertical profiles of O3, NO2 and PM in a major fine chemical industry park in the Yangtze River Delta of China detected by a sensor package on an unmanned aerial vehicle. Sci. Tot. Environ. 2022, 845, 157113. [Google Scholar] [CrossRef] [PubMed]
- Feng, B.; Li, L.; Xu, H.; Wang, T.; Wu, R.; Chen, J.; Zhang, Y.; Liu, S.; Ho, S.S.H.; Cao, J.; et al. PM2.5-bound polycyclic aromatic hydrocarbons (PAHs) in Beijing: Seasonal variations, sources, and risk assessment. J. Environ. Sci. 2019, 77, 11–19. [Google Scholar] [CrossRef] [PubMed]
- Chhabra, A.; Turakhia, T.; Sharma, S.; Saha, S.; Iyer, R.; Chauhan, P. Environmental impacts of fireworks on aerosol characteristics and radiative properties over a mega city, India. City Environ. Interact. 2020, 7, 100049. [Google Scholar] [CrossRef]
- McIntosh, G.; Gómez-Paccard, M.; Osete, M.L. The Magnetic Properties of Particles Deposited on Platanus x hispanica Leaves in Madrid, Spain, and their Temporal and Spatial Variations. Sci. Total. Environ. 2007, 382, 135–146. [Google Scholar] [CrossRef] [PubMed]
- Paoli, L.; Winkler, A.; Guttova, A.; Sagnotti, A.; Grassi, A.; Lackovicova, A.; Senko, D.; Loppi, S. Magnetic properties and element concentrations in lichens exposed to airborne pollutants released during cement production. Environ. Sci. Pollut. Res. 2019, 24, 12063–12080. [Google Scholar] [CrossRef] [PubMed]
- Castañeda-Miranda, A.G.; Chaparro, M.A.E.; Pacheco-Castro, A.; Chaparro, M.A.E.; Böhnel, H.N. Magnetic Biomonitoring of Atmospheric Dust Using Tree Leaves of Ficus Benjamina in Querétaro (México). Environ. Monit. Assess. 2020, 192, 382. [Google Scholar] [CrossRef] [PubMed]
- Chaparro, M.A.E.; Buitrago Posada, D.; Chaparro, M.A.E.; Molinari, D.; Chiavarino, L.; Alba, B.; Marié, D.C.; Natal, M.; Böhnel, H.N.; Vaira, M. Urban and suburban’s airborne magnetic particles accumulated on Tillandsia capillaris. Sci. Tot. Environ. 2024, 907, 167890. [Google Scholar] [CrossRef]
- Lin, C.C. A review of the impact of fireworks on particulate matter in ambient air. J. Air Waste Manag. Ass. 2016, 66, 1171–1182. [Google Scholar] [CrossRef]
- Ambade, B. The air pollution during Diwali festival by the burning of fireworks in Jamshedpur city, India. Urban Clim. 2018, 26, 149–160. [Google Scholar] [CrossRef]
- Rossol, M. Arts, Crafts, Theater, and Entertainment. In Encyclopedia of Toxicology, 3rd ed.; Wexler, P., Ed.; Academic Press: Oxford, UK, 2014; pp. 317–322. [Google Scholar] [CrossRef]
- Ardon-Dryer, K.; Dryer, Y.; Williams, J.N.; Moghimi, N. Measurements of PM2.5 with PurpleAir under atmospheric conditions. Atmos. Meas. Tech. 2020, 13, 5441–5458. [Google Scholar] [CrossRef]
- Barkjohn, K.K.; Gantt, B.; Clements, A.L. Development and application of a United States-wide correction for PM2.5 data collected with the PurpleAir sensor. Atmos. Meas. Tech. 2021, 14, 4617–4637. [Google Scholar] [CrossRef] [PubMed]
- Camprodon, G.; González, Ó.; Barberán, V.; Pérez, M.; Smári, V.; de Heras, M.Á.; Bizzotto, A. Smart Citizen Kit and Station: An open environmental monitoring system for citizen participation and scientific experimentation. HardwareX 2019, 6, e00070. [Google Scholar] [CrossRef]
- Farooqui, Z.; Biswas, J.; Saha, J. Long-Term Assessment of PurpleAir Low-Cost Sensor for PM2.5 in California, USA. Pollutants 2023, 3, 477–493. [Google Scholar] [CrossRef]
- Stavroulas, I.; Grivas, G.; Michalopoulos, P.; Liakakou, E.; Bougiatioti, A.; Kalkavouras, P.; Fameli, K.M.; Hatzianastassiou, N.; Mihalopoulos, N.; Gerasopoulos, E. Field evaluation of low-cost PM2.5 sensors (Purple Air PA-II) under variable urban air quality conditions, in Greece. Atmosphere 2020, 11, 926. [Google Scholar] [CrossRef]
- Mousavi, A.; Yuan, Y.; Masri, S.; Barta, G.; Wu, J. Impact of 4th of July fireworks on spatiotemporal PM2.5 concentrations in California based on the PurpleAir Sensor Network: Implications for policy and environmental justice. Int. J. Environ. Res. Public Health 2021, 18, 5735. [Google Scholar] [CrossRef] [PubMed]
- He, M.; Kuerbanjiang, N.; Dhaniyala, S. Performance characteristics of the low-cost Plantower PMS optical sensor. Aerosol Sci. Technol. 2020, 54, 232–241. [Google Scholar] [CrossRef]
- Jaffe, D.A.; Thompson, K.; Finley, B.; Nelson, M.; Ouimette, J.; Andrews, E. An evaluation of the US EPA’s correction equation for PurpleAir sensor data in smoke, dust, and wintertime urban pollution events. Atmos. Meas. Tech. 2023, 16, 1311–1322. [Google Scholar] [CrossRef]
- Zhang, X.; Shen, H.; Li, T.; Zhang, L. The effects of fireworks discharge on atmospheric PM2. 5 concentration in the Chinese Lunar New Year. Int. J. Environ. Res. Public Health 2020, 17, 9333. [Google Scholar] [CrossRef]
- Instituto Nacional de Estadística y Geografía (INEGI). Censo de población y vivienda 2020. México: Instituto Nacional de Estadística y Geografía. 2020. Available online: https://www.inegi.org.mx/programas/ccpv/2020/ (accessed on 19 March 2024).
- García, E. Modificaciones al Sistema de Clasificación Climática de Köppen; Universidad Nacional Autónoma de México: Mexico City, Mexico, 2020; Available online: http://www.publicaciones.igg.unam.mx/index.php/ig/catalog/view/83/82/251-1 (accessed on 19 March 2024).
- Comisión Nacional del Agua (CONAGUA). Precipitación (mm) por Entidad Federativa y Nacional. 2023. Available online: https://smn.conagua.gob.mx/tools/DATA/Climatolog%C3%ADa/Pron%C3%B3stico%20clim%C3%A1tico/Temperatura%20y%20Lluvia/PREC/2023.pdf (accessed on 19 March 2024).
- Rodríguez-Trejo, A.; Ibarra-Ortega, H.; Böhnel, H.N.; Salcedo González, D.; Magaldi Hermosillo, A.; Marcos, A.E.C.; Mauro, A.E.C.; Márquez Ramírez, V.H.H.; Corbo Camargo, F. Red de monitoreo para la evaluación del impacto de la actividad antropogénica en condiciones ambientales mediante el uso de sensores geo-ambientales, en entornos urbanos de México: Estudio en la ciudad de Querétaro. Geos 2022, 42, 145. [Google Scholar]
- Kuula, J.; Mäkelä, T.; Aurela, M.; Teinilä, K.; Varjonen, S.; González, Ó.; Timonen, H. Laboratory evaluation of particle-size selectivity of optical low-cost particulate matter sensors. Atmos. Meas. Tech. 2020, 13, 2413–2423. [Google Scholar] [CrossRef]
- Giordano, M.R.; Malings, C.; Pandis, S.N.; Presto, A.A.; McNeill, V.; Westervelt, D.M.; Beekmann, M.; Subramanian, R. From low-cost sensors to high-quality data: A summary of challenges and best practices for effectively calibrating low-cost particulate matter mass sensors. J. Aerosol. Sci. 2021, 158, 105833. [Google Scholar] [CrossRef]
- Kaur, K.; Kelly, K.E. Laboratory evaluation of the Alphasense OPC-N3, and the Plantower PM2.5S5003 and PM2.5S6003 sensors. J. Aerosol Sci. 2023, 171, 106181. [Google Scholar] [CrossRef]
- Searle, N.; Kaur, K.; Kelly, K. Identifying a performance change in the Plantower PM2.5S 5003 particulate matter sensor. J. Aerosol Sci. 2023, 174, 106256. [Google Scholar] [CrossRef]
- Gouder, C.; Montefort, S. Potential impact of fireworks on respiratory health. Lung India 2014, 31, 375–379. [Google Scholar] [CrossRef]
- Badura, M.; Batog, P.; Drzeniecka-Osiadacz, A.; Modzel, P. Evaluation of low-cost sensors for ambient PM2.5 monitoring. J. Sens. 2018, 2018, 5096540. [Google Scholar] [CrossRef]
- Tryner, J.; L’Orange, C.; Mehaffy, J.; Miller-Lionberg, D.; Hofstetter, J.C.; Wilson, A.; Volckens, J. Laboratory evaluation of low-cost PurpleAir PM monitors and in-field correction using co-located portable filter samplers. Atmos. Environ. 2020, 220, 117067. [Google Scholar] [CrossRef]
- Nguyen, N.H.; Nguyen, H.X.; Le, T.T.; Vu, C.D. Evaluating low-cost commercially available sensors for air quality monitoring and application of sensor calibration methods for improving accuracy. Open J. Air Poll. 2021, 10, 1–17. [Google Scholar] [CrossRef]
- Karaoghlanian, N.; Noureddine, B.; Saliba, N.; Shihadeh, A.; Lakkis, I. Low cost air quality sensors “PurpleAir” calibration and inter-calibration dataset in the context of Beirut, Lebanon. Data Brief. 2022, 41, 108008. [Google Scholar] [CrossRef]
- Puri, V.; Mahendru, S.; Rana, R.; Deshpande, M. Firework injuries: A ten-year study. J. Plast. Reconstr. Aesthetic Surg. 2009, 62, 1103–1111. [Google Scholar] [CrossRef]
- Tandon, R.; Agrawal, K.; Narayan, R.P.; Tiwari, V.K.; Prakash, V.; Kumar, S.; Sharma, S. Firecracker injuries during Diwali festival: The epidemiology and impact of legislation in Delhi. Indian J. Plast. Surg. 2012, 45, 97–101. [Google Scholar] [CrossRef] [PubMed]
- Turgut, F.; Bograd, A.; Jeltsch, B.; Weber, A.; Schwarzer, P.; Ciotu, I.M.; Amaral, J.; Menke, M.N.; Thommen, F.; Tandogan, T.; et al. Occurrence and outcome of firework-related ocular injuries in Switzerland: A descriptive retrospective study. BMC Ophthalmol. 2022, 22, 296. [Google Scholar] [CrossRef]
- Krittanawong, C.; Qadeer, Y.K.; Hayes, R.B.; Wang, Z.; Thurston, G.D.; Virani, S.; Lavie, C.J. PM2.5 and cardiovascular diseases: State-of-the-Art review. Int. J. Cardiol. Cardiovasc. Risk Prev. 2023, 19, 200217. [Google Scholar] [CrossRef] [PubMed]
- Garcia, A.; Santa-Helena, E.; De Falco, A.; de Paula Ribeiro, J.; Gioda, A.; Gioda, C.R. Toxicological effects of fine particulate matter (PM2.5): Health risks and associated systemic injuries—Systematic review. Water Air Soil Poll. 2023, 234, 346. [Google Scholar] [CrossRef]
- Ren, M.; Fang, X.; Li, M.; Sun, S.; Pei, L.; Xu, Q.; Ye, X.; Cao, Y. Concentration-Response Relationship between PM 2.5 and Daily Respiratory Deaths in China: A Systematic Review and Metaregression Analysis of Time-Series Studies. BioMed. Res. Int. 2017, 2017, 5806185. [Google Scholar] [CrossRef] [PubMed]
- Cao, Q.; Rui, G.; Liang, Y. Study on PM2.5 pollution and the mortality due to lung cancer in China based on geographic weighted regression model. BMC Public Health 2018, 18, 925. [Google Scholar] [CrossRef]
- Mexicanos, P. Norma Oficial Mexicana NOM-025-SSA1-2021, Salud Ambiental. Criterio para Evaluar la Calidad del Aire Ambiente, con Respecto a las Partículas Suspendidas pm10 y pm2. 5. Valores Normados para la Concentración de Partículas Suspendidas PM10 y PM2.5 en el Aire Ambiente, Como Medida de Protección a la Salud de la Población Prefacio. Available online: https://www.dof.gob.mx/nota_detalle.php?codigo=5633855&fecha=27/10/2021#gsc.tab=0 (accessed on 19 March 2024).
- US EPA 40 CFR PART 50–National Primary and Secondary Ambient Air Quality Standards. Appendix L to Part 50-Reference Method for the Determination of Fine Particulate Matter as PM2.5 in the Atmosphere. 71 FR 61226, 17 October 2006. Available online: https://www.ecfr.gov/current/title-40/chapter-I/subchapter-C/part-50 (accessed on 19 March 2024).
- Gähwiler, S.; Bremhorst, A.; Tóth, K.; Riemer, S. Fear expressions of dogs during New Year fireworks: A video analysis. Sci. Rep. 2020, 10, 16035. [Google Scholar] [CrossRef]

Disclaimer/Publisher’s Note: The statements, opinions and data contained in all publications are solely those of the individual author(s) and contributor(s) and not of MDPI and/or the editor(s). MDPI and/or the editor(s) disclaim responsibility for any injury to people or property resulting from any ideas, methods, instructions or products referred to in the content. |
© 2024 by the authors. Licensee MDPI, Basel, Switzerland. This article is an open access article distributed under the terms and conditions of the Creative Commons Attribution (CC BY) license (https://creativecommons.org/licenses/by/4.0/).