Article

Unintended Consequences of Urban Expansion and Gold Mining: Elevated Indoor Radon Levels in Gauteng Communities’ Neighboring Gold Mine Tailings

by
Khathutshelo Vincent Mphaga
1,*,
Wells Utembe
1,2,
Busisiwe Shezi
1,3,
Thokozani P. Mbonane
1 and
Phoka C. Rathebe
1
1
Department of Environmental Health, Faculty of Health Sciences, Doornfontein Campus, University of Johannesburg, Johannesburg 2006, South Africa
2
National Health Laboratory Service, Toxicology and Biochemistry Department, National Institute for Occupational Health, Johannesburg 2000, South Africa
3
Environment and Health Research Unit, South African Medical Research Council, Johannesburg 2094, South Africa
*
Author to whom correspondence should be addressed.
Atmosphere 2024, 15(8), 881; https://doi.org/10.3390/atmos15080881
Submission received: 18 June 2024 / Revised: 17 July 2024 / Accepted: 23 July 2024 / Published: 24 July 2024
(This article belongs to the Section Air Quality)

Abstract

:
The province of Gauteng in South Africa has a rich history of gold mining, which has driven economic growth and urbanization. Gold mining has also created over 270 gold mine tailings (GMT), now surrounded by human settlements due to a housing shortage. These GMT pose a health risk as they harbor elevated uranium, which over time undergoes radioactive decay to produce radon, a known lung carcinogen. This study aimed to investigate the potential correlation between the proximity to gold mine tailings (GMT) and indoor radon concentrations in Gauteng’s residential dwellings. Volume activity of radon (VAR) inside 330 residential dwellings was measured in residential dwellings located proximally (<2 km) and distally (>2 km) to gold mine tailings using AlphaE radon monitors during winter. An interviewer-administered questionnaire was utilized to obtain data on factors that may influence indoor radon activities. Descriptive statistics and bivariate logistic regression analyzed the influence of proximity to gold mine tailings and dwelling characteristics on VAR. Furthermore, VAR was compared to the World Health Organization (WHO) radon reference level of 100 Bq/m3. Residential dwellings near gold mine tailings had significantly higher average indoor radon concentrations (103.30 Bq/m3) compared to the control group (65.19 Bq/m3). Residential dwellings proximal to gold mine tailings were three times more likely to have VAR beyond the WHO reference level of 100 Bq/m3. Furthermore, they had estimated annual effective doses of 2.60 mSv/y compared to 1.64 mSv/y for the control group. This study highlighted a concerning association between proximity to gold mine tailings and elevated indoor radon levels. Public health interventions prioritizing residential dwellings near gold mine tailings are crucial. Educational campaigns and financial assistance for radon mitigation systems in high-risk dwellings are recommended. Residents near gold mine tailings are encouraged to ensure continuous natural ventilation through frequent opening of windows and doors.

1. Introduction

Gauteng is the most populous province in South Africa and has a rich history of gold mining, which has driven economic growth and urbanization [1,2,3]. The pursuit of gold led to the creation of over 270 gold mine tailings (GMT), which are now surrounded by sprawling human settlements due to a housing shortage [4,5,6,7,8]. The GMT (gold mine tailings) consist of finely crushed, sand-like waste material resulting from the process of extracting and milling gold ore [9]. These waste materials, also known as tailings, are susceptible to being dispersed as dust particles. In the past, GMT were typically deposited in low-lying areas close to the mining location, away from human settlements [7,9]. Due to a shortage of safe land, some formal and informal human settlements are now located proximally to GMT [10]. In Gauteng, South Africa (SA), this situation is particularly concerning, with some communities residing directly across the road from GMT, while others have even been built on top of them [2,11]. This demonstrates a blatant disregard for the recommended 500-meter (m) exclusion or buffer zone [1,5,6,10,12,13,14]. While efforts have been made to relocate people near GMT, the government has also allowed new housing developments near GMT [2,11]. As a result, an increasing number of homes have been constructed close to these GMT, making it difficult for residents to avoid coming into contact with the tailings [2]. The main radiation concern in South Africa is that approximately 1.6 million people live near mine dumps (including gold mine tailings) where radionuclides can be released into the indoor environment or carried to homes through the atmosphere as windblown dust or radon [12,13,15]. Residents in these communities may face elevated radiation exposure risks due to poorly managed GMT facilities, which are accessible to the public and sometimes used by members of the public as building material [11,12,13,16]. Furthermore, tailings may also be transported to the surrounding communities through runoffs from the GMT [17].
These GMT contain a combination of dangerous heavy metals such as uranium [9,18]. Recent studies have found high levels of radioactive uranium-238 (238U) in mine tailings and the surrounding areas [15,19,20,21]. Gold mine tailings in Gauteng had an average 238U concentration of 785.3–13.7 Bq/kg [22], and soil samples within 50–200 m of the GMT showed levels ranging from 278 to 256 Bq/kg [15,23]. In addition, elevated uranium concentrations have been found in water resources in regions dominated by GMT [23,24]. These studies have shown that uranium can migrate from the ground and the GMT to the surrounding areas, potentially leading to high indoor radon gas levels in communities proximal to GMT. Radon is produced as uranium-238 decays, and its release rate is linked to the presence of uranium in rocks, soils, building materials, water supply, and outdoor air [25]. Additionally, underlying geology as well as the surface characteristics of the area also play a significant role in radon exhalation [26,27]. In South Africa, GMT represents a potentially hazardous source of radon due to the elevated uranium concentrations in the tailings [28]. In Gauteng Province, various geological and industrial factors could potentially increase the risk of indoor radon exposure, particularly in areas with tectonic faults, earthquakes, and mine tremors. Even though Gauteng is not situated on a major tectonic plate boundary, intra-plate activity can still occur [29]. Additionally, the risk of earthquakes in this region is classified as medium, and numerous small-scale earthquakes have been reported in recent years [29,30]. Studies in areas with tectonic seismic activity have shown increased radon concentrations following earthquakes [31]. Moreover, Gauteng has a long history of mining activity, and tremors induced by mining are frequent [29]. These factors may increase the permeability of the subsurface, allowing radon gas to move toward the surface and subsequently into residential dwellings [31]. Furthermore, abandoned mine shafts in Gauteng can further serve as conduits for radon gas to migrate upwards, potentially increasing indoor radon concentrations in nearby structures [32]. This situation is exacerbated by the lack of seismic design considerations in most buildings, potentially making them more susceptible to radon ingress [29].
Radon is a colorless, odorless, and tasteless gas that cannot be detected by human senses [33,34]. Radon gas travels along the path of least resistance from the ground into the atmosphere and can seep into buildings as a result. It enters buildings through various routes, such as cracks in solid floors, construction joints, cracks in walls at ground and below-ground levels, gaps in suspended floors, gaps around service pipes, and cavities in walls [35,36]. While radon exposure outdoors is generally not a concern, it can build up to hazardous levels in enclosed spaces, particularly in homes [37,38,39]. Radon gas is a significant source of natural radiation exposure. Indoor radon concentration is influenced by geological factors, such as the soil beneath the dwelling, and dwelling characteristics, like cracks and ventilation [38,39]. Additionally, the presence of GMT near human settlements may increase indoor radon exposure [11,12,13,16]. Radon from the GMT can be carried by windblown dust into nearby homes, leading to increased indoor radon levels. Additionally, erosion and runoffs may transport tailings material with high 238U concentrations to nearby residential areas, further elevating indoor radon levels [12,13,32,40]. Radon, specifically 222Rn, is the primary concern for human health [41,42]. In poorly ventilated dwellings and in regions where good ventilation is not practiced, radon can accumulate to high levels, posing health risks [33,34]. South Africa’s warm climate may favor better ventilation conditions, potentially reducing indoor radon concentrations [43,44,45,46]. However, this needs to be confirmed through proper studies. This dense, highly radioactive gas emits alpha particles (namely, 218Po and 214Po), causing damage to the respiratory system upon inhalation [46,47]. A statistically significant linear relationship has been found between increased radon concentrations and an increased risk for lung cancer [48,49,50], Chronic Obstructive Pulmonary Diseases (COPD) [51,52], and leukemia [53,54]. According to the WHO, indoor radon exposure is accountable for 3–16% of lung cancer cases, making it the leading cause of lung cancer in non-smokers and second among smokers [35,48]. As a result, most international organizations, including the WHO, EPA, and IARC, recognize radon gas and its decay as a human carcinogen [15,33,35]. Hence, the WHO recommends that indoor radon levels should be kept below 100 Bq/m3, with a maximum limit of 300 Bq/m3 if lower levels may not be achieved [25,55]. Furthermore, the IAEA advocates for nationwide radon surveys and public awareness campaigns on indoor radon exposure risks within member states, including South Africa. In South Africa, the National Nuclear Regulator has set a reference level of 300 Bq/m3 for indoor radon exposure. Despite known health risks, South Africa has conducted limited radon research [25,53], with most studies focusing on respiratory problems associated with dust exposure near GMT [56,57,58].
There have been small-scale indoor radon exposure studies near GMT in South Africa with inconclusive findings. One study found no link [25], while another reported significantly higher radon levels in homes near GMT compared to a control area [20]. This inconsistency underscores the need for a more thorough investigation. Hence, this study’s aim was to evaluate an association between indoor radon exposure in dwellings proximal to GMT. The absence of comprehensive data on indoor radon levels near GMT poses a significant threat to public health in South Africa. South Africa has not developed a national radon strategy to safeguard the public against indoor radon exposure, and this has been attributed to a lack of reliable information regarding indoor radon exposure and a lack of funding for a nationwide radon survey [54]. The country has not developed indoor radon maps, and as a result, possible indoor radon exposure hotspots are not known. Residents could be unknowingly exposed to harmful levels of radon, increasing their risk of lung cancer. Immediate investigation was necessary, especially in Gauteng Province of South Africa, where a large population resides near GMT. This study investigated the link between the proximity to GMT and indoor radon concentrations in Gauteng, a province where gold mine tailings dominate the landscape, and a growing housing crisis that has led to settlements near these tailings. We compared indoor radon levels in residential dwellings near and far from the tailings, estimated the percentage exceeding the WHO’s recommended limits of 100 Bq/m3, and analyzed the influence of dwelling characteristics on indoor radon concentration. This investigation sheds light on the potential public health threat posed by abandoned gold mine tailings and the urgent need for radon mitigation strategies in Gauteng.

2. Materials and Methods

2.1. Sample and Sampling

A quantitative cross-sectional study was conducted to investigate the potential correlation between indoor radon exposure and proximity to GMT in Gauteng, South Africa’s most densely populated province, home to over 15 million people [58]. The radon survey took place in 330 randomly selected residential buildings in the Riverlea and Orlando East communities from June to July 2023. A comprehensive list of all residential dwellings in these areas was obtained from the City of Johannesburg website, and Microsoft Excel 365 (Version 2406) was used to selectively identify potential participants. A sample size calculator (EPINFO version 7) was used to determine a sample size of 476 residential houses/householders, with 238 in Riverlea and 238 in Orlando East, representing two distinct population groups. This was based on an estimated total housing stock of 7477, an expected frequency of 20% at a 95% confidence level, and a 5% margin of error. The residential buildings in the exposed group were situated 0.1–2 km from the gold mine tailings in Riverlea, an area with elevated natural soil uranium concentrations. On the other hand, the unexposed (control/reference) group consisted of houses in Orlando East, an area unaffected by mining or gold mine tailings, with the nearest gold mine tailings located more than 2 km away from Orlando East. This study was important because previous research has established a connection between respiratory issues and residing near gold mines or gold mine tailings [11,28,57,58,59]. In Riverlea, dust pollution has become worse due to ongoing mine dump reclamation for gold recovery, resulting in poor ambient air quality [18]. A previous study conducted at Riverlea reported that the average annual prevailing wind direction was easterly, with a tendency for flows to concentrate in northwesterly and northeasterly directions, suggesting that the wind could carry dust from the GMT towards Riverlea [28]. Conversely, Orlando East, located 5 km from Riverlea in the City of Johannesburg metropolitan area, region D, had no history of mining or gold mine tailings, making it an ideal unexposed group for the study. The nearest gold mine tailings are situated more than 2 km from the community (see Figure 1 below).

2.2. Inclusion and Ethical Consideration

This study recruited participants exclusively from Riverlea and Orlando East. One adult per household was allowed to take part, and minors were not included due to ethical considerations. All participants provided informed consent. This study excluded high-rise and non-residential buildings. Ethical clearance and approval (REC-1889-2023) were obtained from the Research Ethics Committee at the University of Johannesburg. Safeguards, such as the use of unique identifiers, were implemented to ensure confidentiality and anonymity.

2.3. Data Collection

A standardized questionnaire administered by interviewers was utilized to gather information on residences, encompassing ventilation practices, building attributes, and occupant demographics. The research questionnaire was created using information from reputable sources, such as the World Health Organization (WHO) and the International Atomic Energy Agency (IAEA) [35,36]. The questionnaire was carefully designed to ensure that participants with varying levels of literacy and language comprehension could provide accurate data. It covered all the important factors contributing to increased indoor radon exposure, such as dwelling characteristics (e.g., house age, structural defects), occupancy, and occupants’ ventilation habits. The data collection team included community members who were fluent in the languages spoken in their communities. Participants for the radon survey were recruited through door-to-door visits to ensure a representative sample. Researchers provided information and addressed concerns during the visits. A pilot study using a 47-question questionnaire was conducted in June 2023 to evaluate data collection methods. A pilot study with 16 residents from the two communities was used to test research tool and methodology appropriateness for participants with diverse socioeconomic backgrounds. Results and feedback obtained from the pilot study led to refinements for the main survey. Certain questions were adjusted or removed to enhance participant comprehension and data quality. Questions about house materials, income, and soil type were modified or removed to enhance participant understanding and data accuracy. The questionnaire’s reliability was evaluated using Cronbach’s alpha statistic, resulting in a favorable outcome (>7). The average radon activity concentration was measured for 2 h using an AlphaE radon monitor [59]. To minimize interference, AlphaE radon monitors were positioned inside the room (i.e., living room or bedroom), above the floor, and away from walls, doors, windows, and other sources of radiation. The AlphaE radon monitors used in the study were individually calibrated by the manufacturer (Bertin Technology) and by a local laboratory (Selectech). The local laboratory (Selectech) calibrated AlphaE radon monitors by exposing them to a known concentration of radon gas in a sealed container alongside a working reference unit (AlphaGUARD). This device employs a silicon detector to measure alpha radiation emitted during radon decay and a Gore-Tex membrane to ensure that external factors do not interfere with the measurement, allowing only radon gas to enter the chamber for detection. The monitor has a measurement range of 20 Bq/m3 to 10 MBq/m3 and can store up to 8500 datasets [60,61]. The collected data were transferred to Microsoft Excel for analysis after being downloaded to a PC using DataVIEW communication software PRO version. Although the AlphaE radon monitors provide real-time monitoring and accurate detection of low-level radon, their response to changes in radon concentration is slower compared to other detectors due to wide alpha particle sensitivity [62].

2.4. Radon Mapping

Indoor radon measurement results and GIS coordinates from COJ online maps were used to assess the impact of GMT on radon levels. The proximity of each community to GMT was determined using Google Earth. A comprehensive indoor radon distribution map was generated using ArcGIS software (version 10.5), identifying areas exceeding the WHO reference level of 100 Bq/m3 (red dots) and those below the WHO reference level of 100 Bq/m3 (green dots). The map also highlighted the presence of nearby mine tailings (yellow shapes).

2.5. Statistical Analysis

A comprehensive statistical analysis was performed using IBM SPSS Statistics version 29. The normality of the data distribution was assessed using both the Shapiro–Wilk test and visual inspection through a histogram and Q–Q plot. Descriptive statistics, including minimum, maximum, mean, and standard deviation (SD), were calculated to summarize the house characteristics and associated indoor radon concentration levels. Additionally, logistic regression was utilized to investigate the association between indoor radon exposure and other potential factors that may affect radon concentration levels. Significance was determined by a confidence interval (CI) of 95% and a p-value of <0.05. This technique allowed for the identification of additional variables associated with elevated indoor radon levels in the studied communities beyond the proximity to GMT. Radon’s effective dose was calculated for respective communities using average indoor radon concentration.

2.6. Annual Effective Dose for Radon Exposure

The annual effective dose from radon gas exposure in residential houses in Riverlea and Orlando East was calculated based on an average concentration of radon gas. By applying the UNSCEAR-2000 model, the annual mean dosage (measured in mSv per year) for residents of Riverlea and Orlando East due to indoor radon was estimated using the following formula:
E = C × F × H × T × D,
where
C = represents the indoor concentration of radon in Bq/m3;
F = is the adjustment factor for indoor radon measurement (0.4);
H = is the occupancy factor (0.8);
T = is the number of hours in a year (24 h × 365 days = 8760 h yr−1);
D = is the dose conversion factor (9 × 10⁻⁶ mSv h−1 per Bq m−3).

3. Results

3.1. Participation Rate and Participant Demographic Characteristics

Out of the 472 potential participants, 89 (18.9%) could not be located, and 52 (11.0%) declined to participate. Ultimately, 331 individuals agreed to take part in this study, resulting in a participation rate of approximately 70.1%. The participant distribution was nearly even, with 166 participants (50.2%) residing in Riverlea and 165 participants (49.8%) residing in Orlando East. Most participants were female, with 199 females (60.4%) and 132 males (39.6%). Gender distribution was consistent across both communities. In Orlando East, 42.4% of the participants were aged 60–69, while in Riverlea, around 27.1% fell into the same age bracket.

3.2. Description of Surveyed Houses

Table 1 presents the dwelling characteristics of the participants in Riverlea and Orlando East. Most dwellings in both communities were over 41 years old (Riverlea: 80.1%, Orlando East: 84.2%). However, Orlando East displayed a slightly higher proportion of older dwellings compared to Riverlea. Brick houses were the dominant dwelling type in both communities (Riverlea: 100%, Orlando East: 96.4%). However, a small number of dwellings in Orlando East were classified as shacks (2.4%), which were absent in Riverlea. Metal roofing was more common in Orlando East (92.1%) compared to Riverlea (16.3%). Conversely, most dwellings in Riverlea had asbestos roofs (77.7%) compared to a negligible presence in Orlando East (2.4%). Concrete slabs were the predominant foundation type in both communities (Riverlea: 94.5%, Orlando East: 99.4%, respectively). A higher proportion of dwellings in Orlando East had four or more rooms (84.2%) compared to Riverlea (65.1%). Dwellings in Riverlea displayed a lower prevalence of cracks or openings in the foundation or floor (47.2%) compared to Orlando East (61.8%). The distribution of household occupancy was similar across both communities. Most dwellings were occupied by more than four people (Riverlea: 71.2%, Orlando East: 71.3%). Almost all dwellings in both communities received their water supply from the municipality and relied primarily on electricity (Riverlea: 100%, Orlando East: 98.2%). A small number of dwellings in Orlando East utilized alternative energy sources like solar or wood (less than 1%). Daily natural ventilation by opening windows and doors was less frequent in Orlando East (64.8%) compared to Riverlea (89.8%). Dwellings in Orlando East also had a higher proportion of occupants who reported never opening windows and doors (1.2%). A small percentage of respondents reported that they exclusively open windows or doors during specific activities in Riverlea (0.6%) and Orlando East (0.6%), respectively. A higher percentage of Riverlea residents, 52.4%, reported spending 21 or more hours indoors per day, compared to 34.5% in Orlando East. Prior radon testing was minimal in both communities, with only 1.8% of dwellings in each community having been tested previously. The temperature inside residential dwellings in the two communities showed minor variation. In Riverlea, 60.4% of dwellings had temperatures above 17.55 degrees Celsius (°C) during radon measurement, compared to 58.8% in Orlando East.

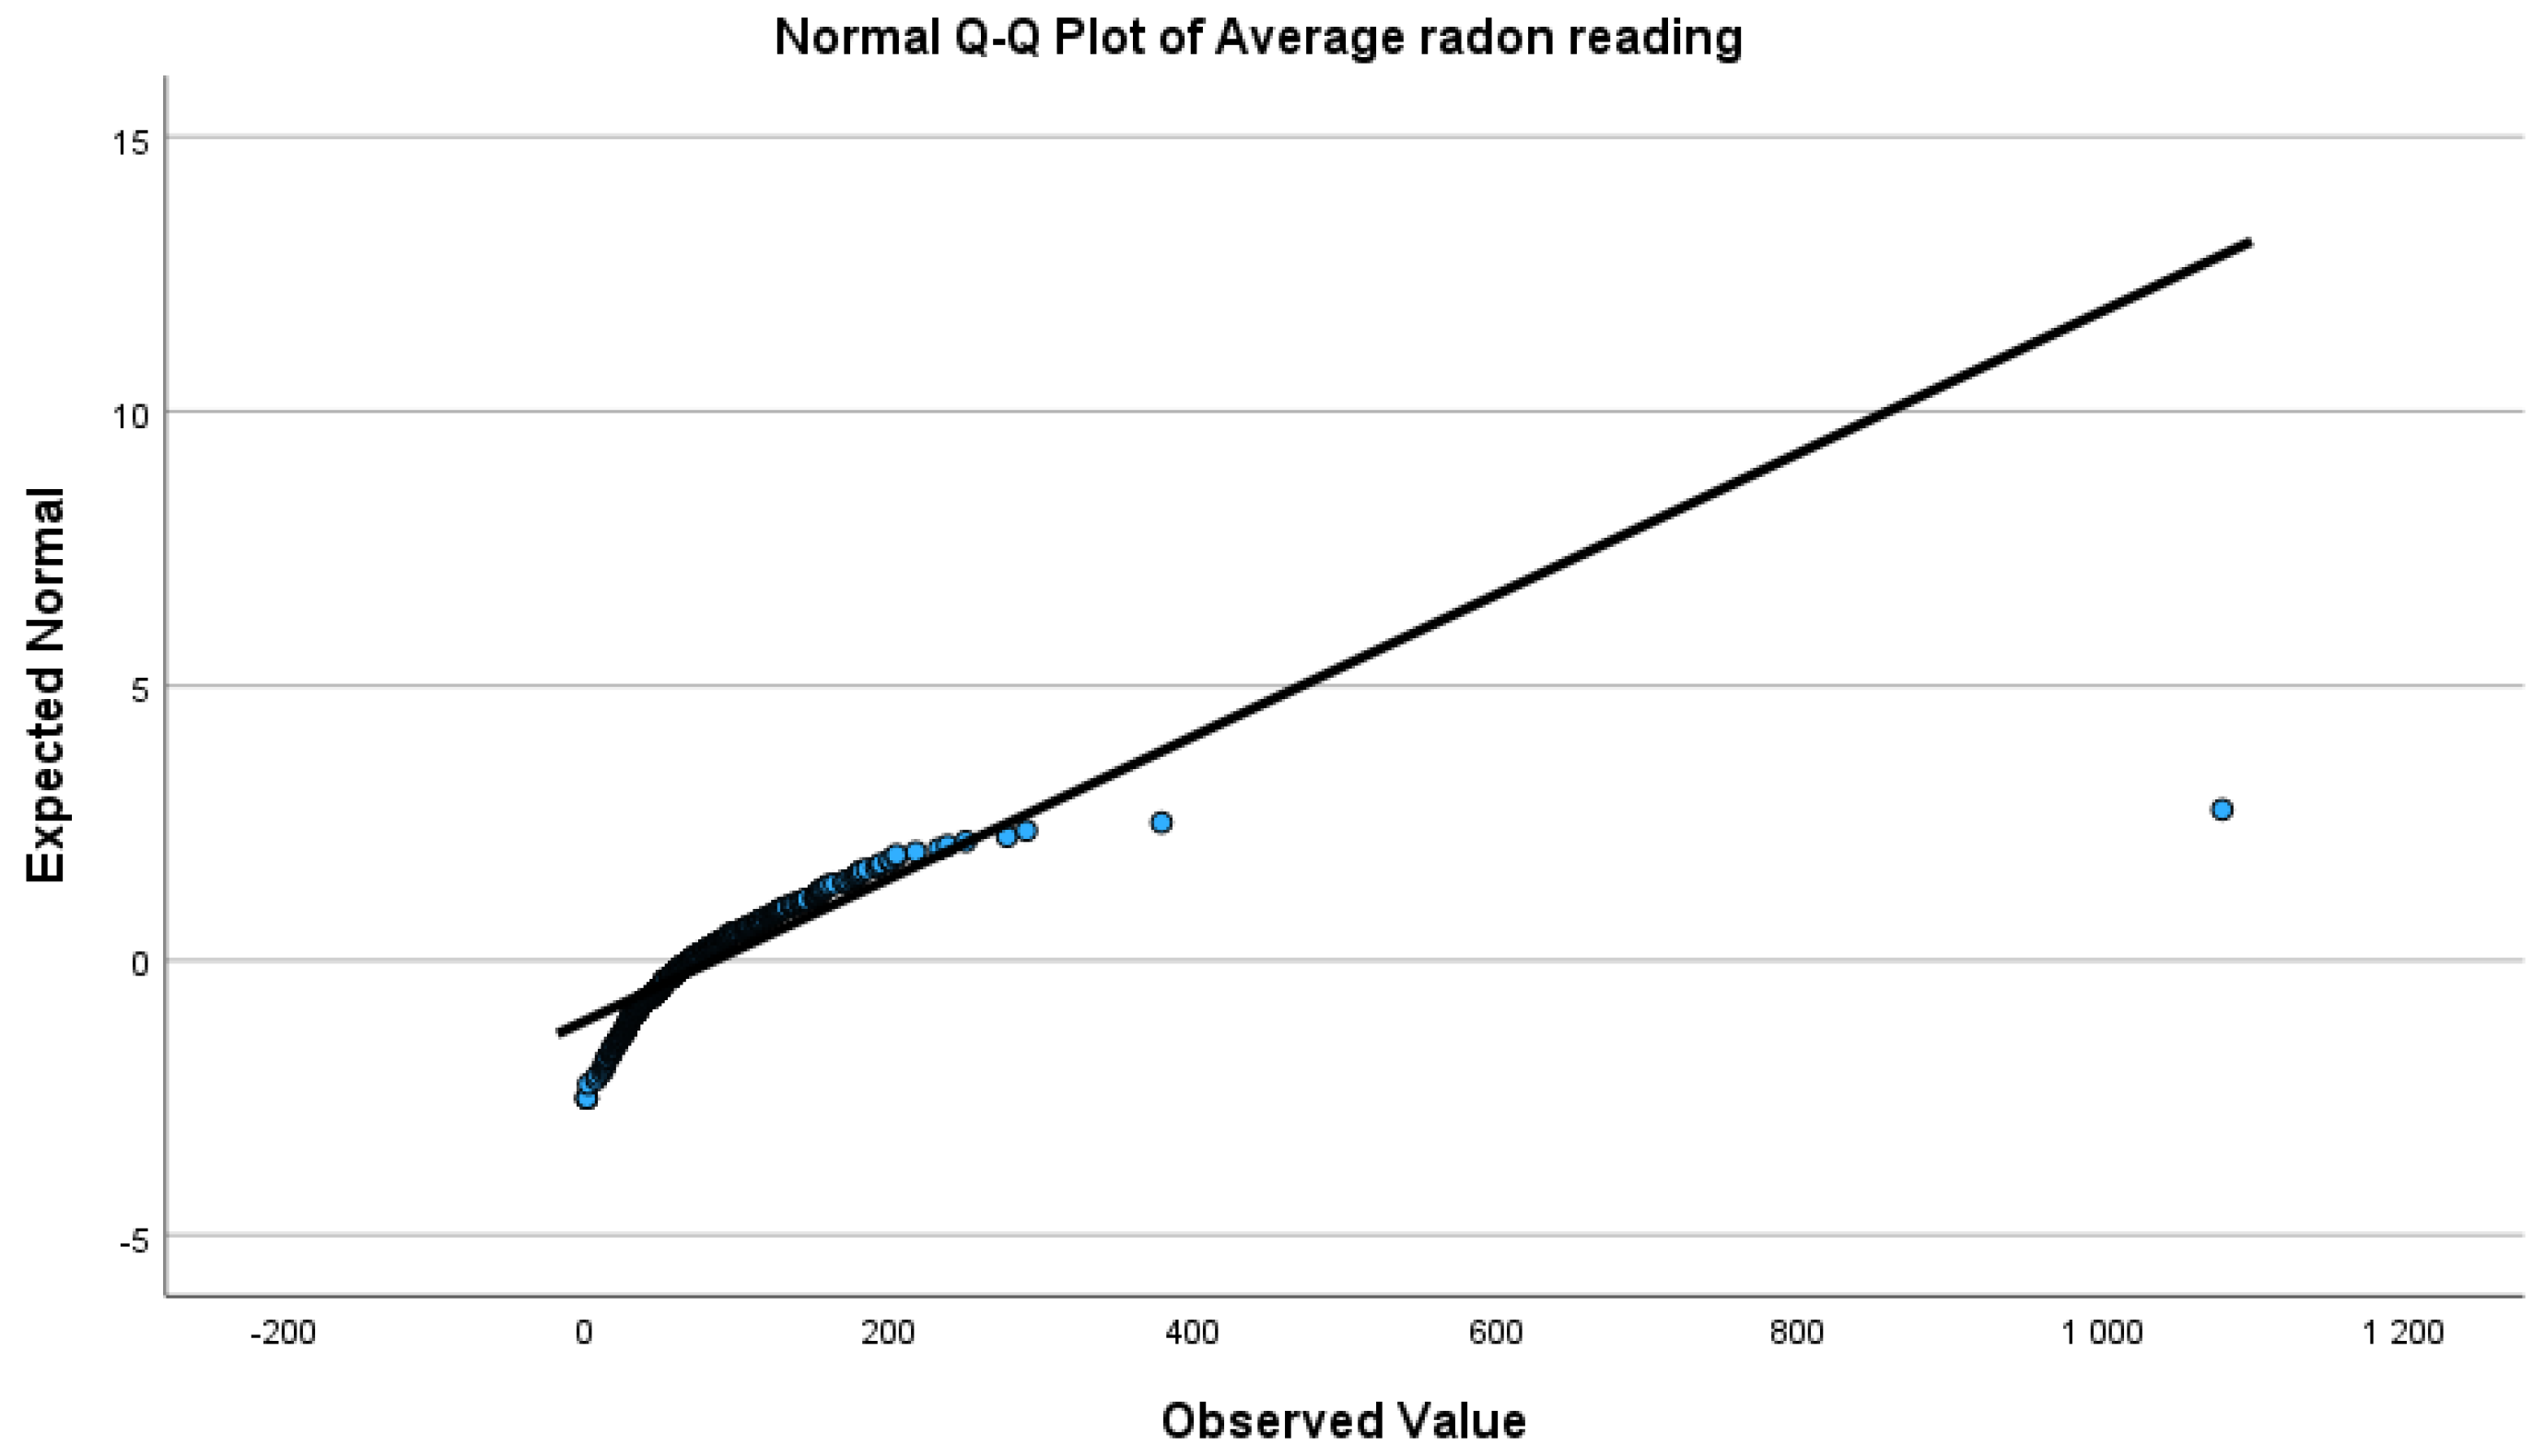
3.3. Indoor Radon Data Normality Test

The measured indoor radon levels were used to create a histogram shown in Figure 2. In addition, a graphical method was utilized to assess the normality of the data. This procedure involved the use of cumulative frequency distribution and normalizing Q–Q plots, as shown in Figure 3. Furthermore, the data were subjected to examination using the Shapiro–Wilk normality test.
The histogram in Figure 2 above displays the measured indoor radon concentrations. The average radon distribution depicted above is marked by a skewed distribution, with numerous small values and fewer large values. Specifically, the indoor radon distribution is right-skewed, with a limited number of outliers. The indoor radon concentration average was 84.246 Bq/m3 with a standard deviation of 77.428. The lowest observed radon gas concentration was 0, and the highest concentration was 1078.850 Bq/m3, as illustrated in Figure 2.
To evaluate the normality of indoor radon concentrations, a quantile–quantile (Q–Q) plot (Figure 3) was utilized. The blue dots depicted in the Q–Q plot correspond to indoor radon measurements taken from 330 residential dwellings. Upon visual examination of the Q–Q plot, it became evident that there was a notable deviation from the expected diagonal line, indicating a non-normal distribution of the data. This observation was corroborated by the results of the Shapiro–Wilk normality test. The test statistic produced a p-value of less than 0.05, signifying statistically significant evidence that the radon concentration data do not adhere to a normal distribution.

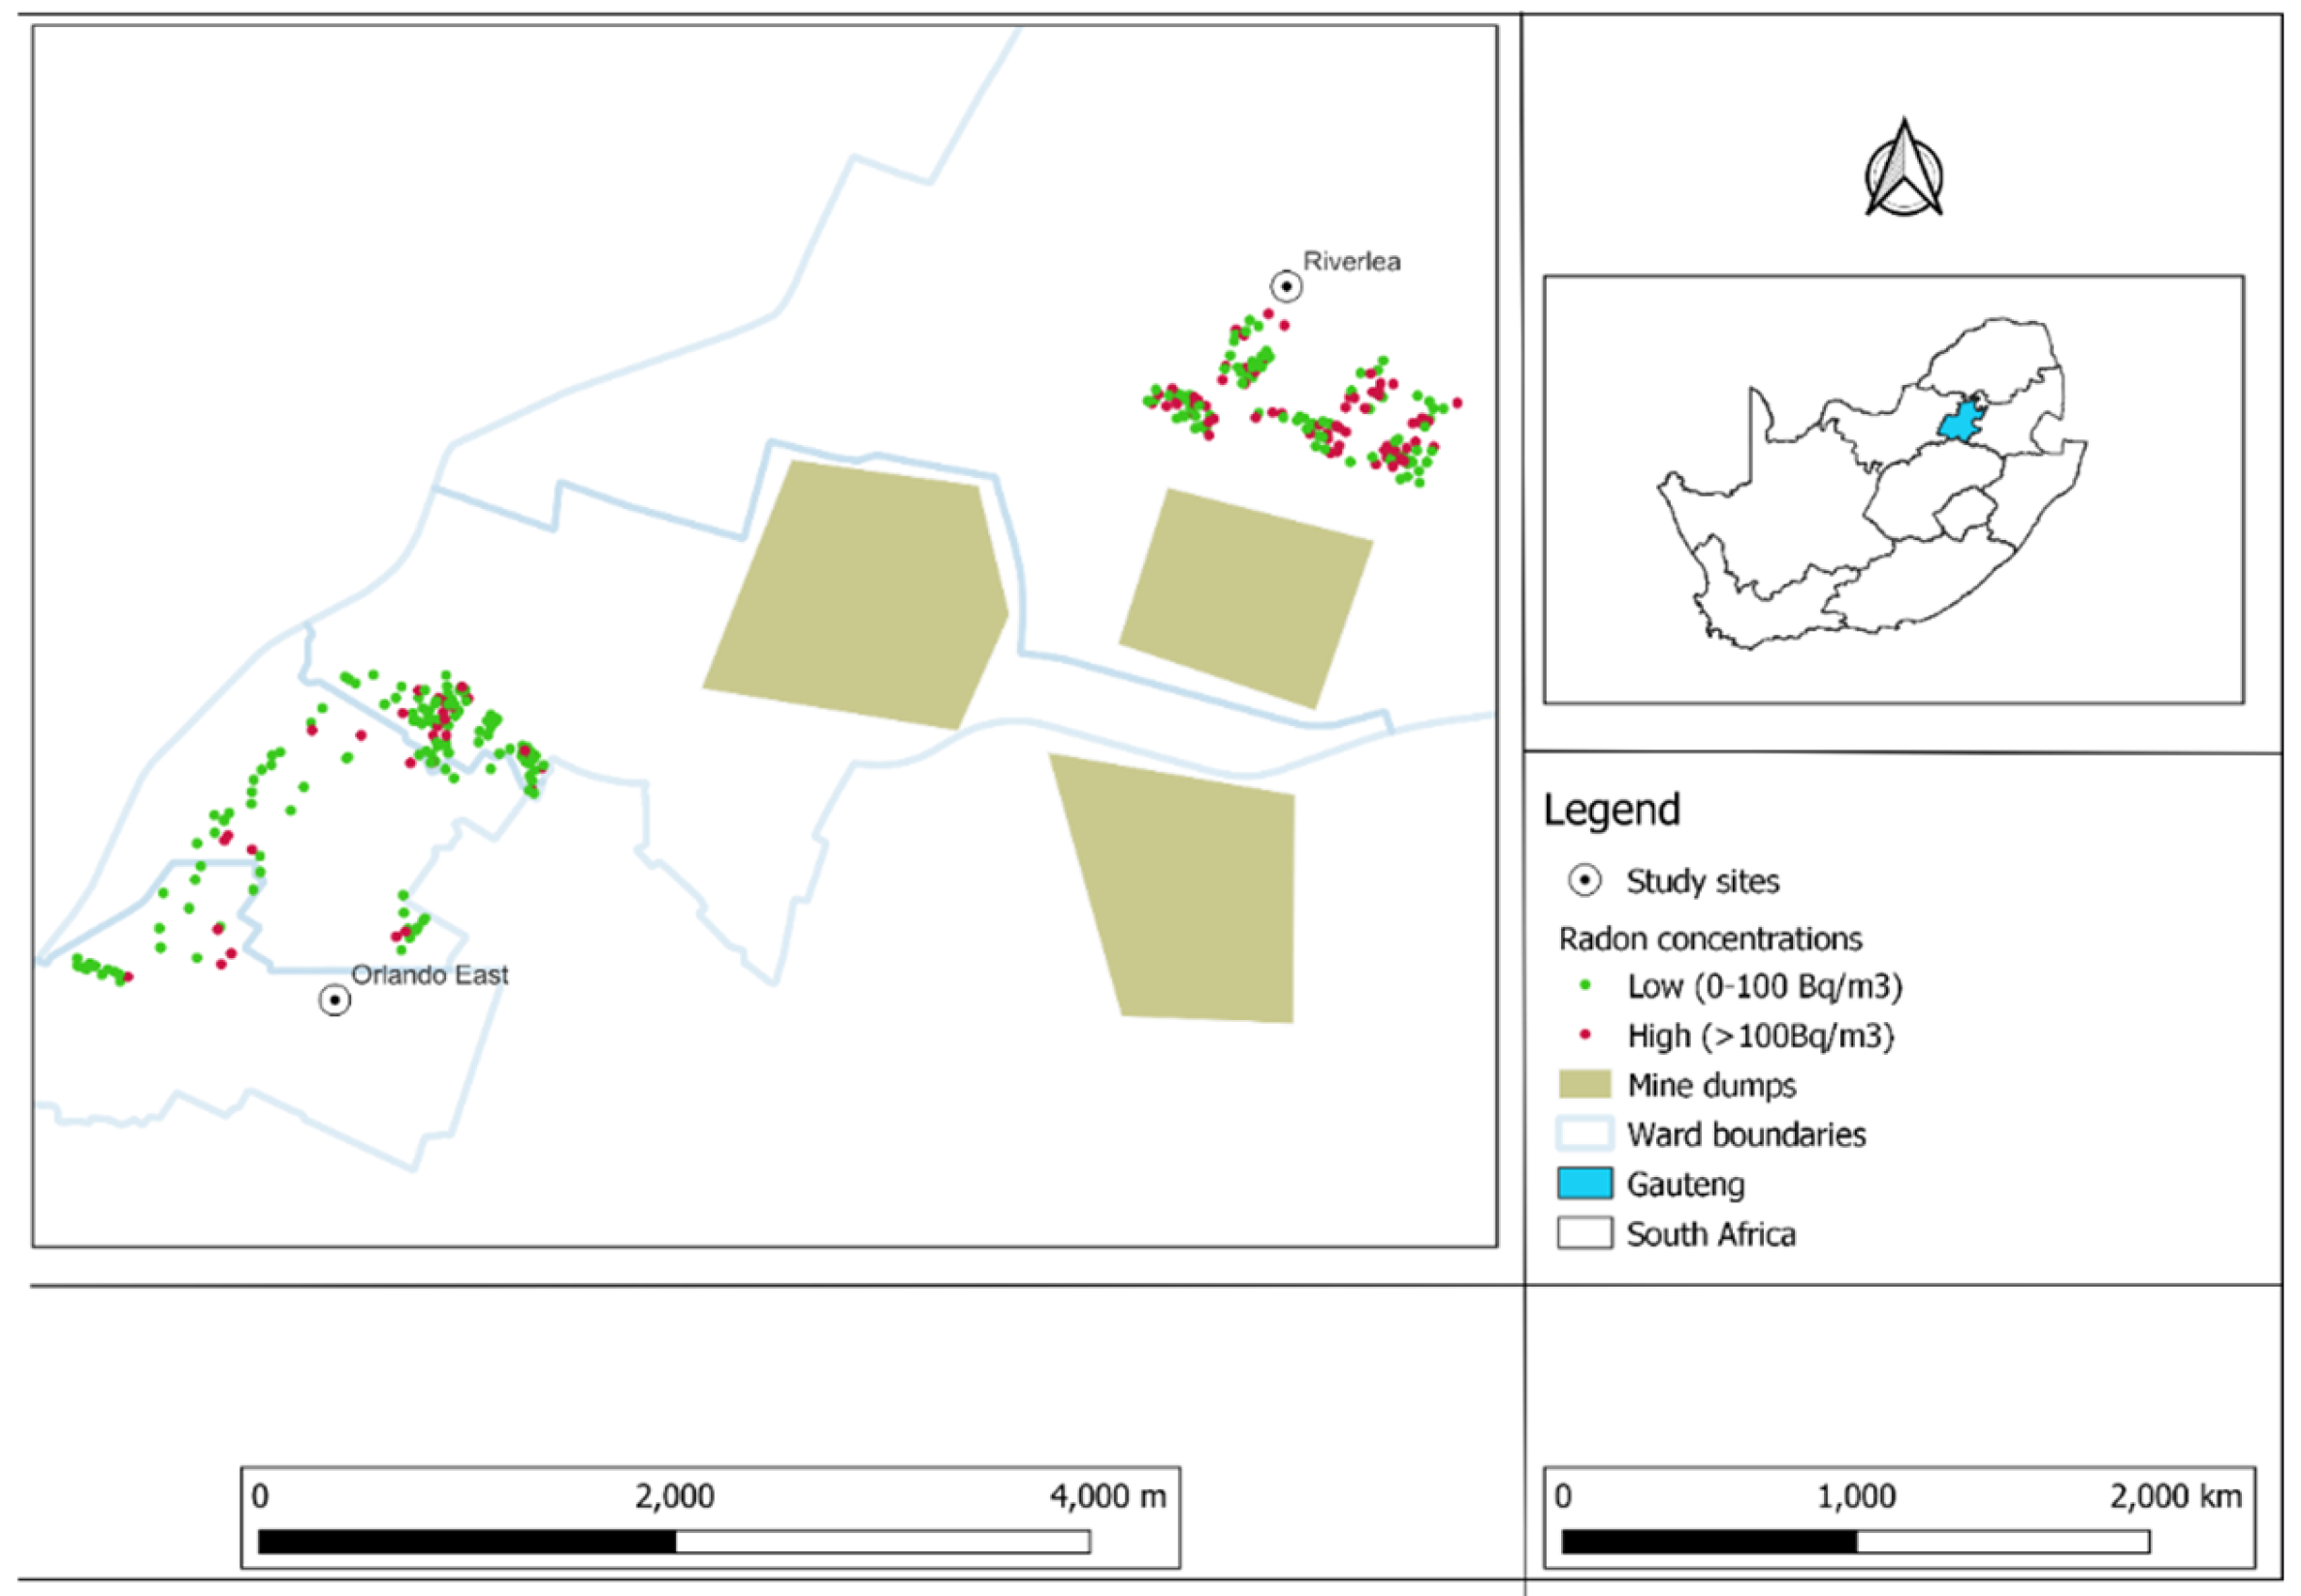
3.4. Spatial Distribution of Indoor Radon Concentration

During the visual analysis of the map depicted in Figure 4, it was noted that there are significant spatial variations in indoor radon concentration. The map in Figure 4 shows that red dots represent radon measurements exceeding WHO 100 Bq/m3, while blue dots represent radon measurements below WHO 100 Bq/m3. The map indicates that more residential dwellings in Riverlea had indoor radon concentration above 100 Bq/m3 compared to Orlando East.

3.5. The Association between House Characteristics and Indoor Radon Levels

Table 2 presents a comprehensive analysis of indoor radon concentrations across different house characteristics using descriptive statistics. In Riverlea, the range of radon levels in dwellings was wider, spanning from 11.07 to 1078.85 Bq/m3, compared to Orlando East, which ranged from 0 to 379.13 Bq/m3. The average radon concentration in Riverlea was higher at 103.30 Bq/m3, in contrast to 65.19 Bq/m3 in Orlando East. Additionally, the standard deviation in Riverlea was significantly higher at 94.91 Bq/m3, indicating a larger spread of data points around the mean in this area. Brick houses were the dominant dwelling type (98.2%), encompassing a broad spectrum of radon levels (0–1078.85 Bq/m3) with an average of 84.76 Bq/m3 (SD = 77.99 Bq/m3). The limited number of dwellings were classified as sheds/wendy houses (n = 2) and shacks (n = 4). This prevented drawing any definitive conclusions regarding the influence of house type on radon concentration. Dwellings that are more than 40 years old had a lower average indoor radon concentration of 81.69 Bq/m3 (standard deviation = 50.94 Bq/m3) compared to houses between 11 and 20 years old, which had an average of 157.70 Bq/m3 (standard deviation = 257.99 Bq/m3). Dwellings with metal roofs had the highest average radon concentration (75.57 Bq/m3, SD = 91.20 Bq/m3) compared to dwellings with tile roofs, which had a lower average concentration (83.25 Bq/m3, SD = 51.02 Bq/m3). Dwelling with a concrete slab foundation had a higher average indoor radon concentration (84.09 Bq/m3, SD = 78.29 Bq/m3) compared to other foundation types. Dwellings without cracks had a higher average indoor radon concentration (91.60 Bq/m3, SD = 100.11 Bq/m3) compared to those with cracks (78.54 Bq/m3, SD = 51.97 Bq/m3). Elevated indoor radon concentrations were mostly observed when the temperature inside the dwelling was below 17.54 degrees Celsius (90.81 Bq/m3, SD = 104.55 Bq/m3).

3.6. The Association between House Characteristics and WHO Radon Reference Level

This study explored the connection between average indoor radon levels and various house characteristics. These characteristics include location (specifically, proximity to GMT), house age, house type, roof, foundation, and floor types, as well as the presence or absence of cracks on the floor. In this analysis, the indoor radon level was treated as a dichotomous categorical variable by assigning 0 if indoor radon levels were below 100 Bq/m3 and 1 if above 100 Bq/m3. By establishing a cut-off point of 100 Bq/m3, this study sought to identify which independent variables were associated with radon levels below or above the World Health Organization’s reference level. Table 3 presents the results of this analysis. In Riverlea, 68% of dwellings had radon levels exceeding 100 Bq/m3, whereas in Orlando East, only 31% exceeded this threshold. Newer homes (less than 10 years old) generally had lower levels of radon, with only 4% exceeding the WHO limit, compared to 31% in homes older than 41 years. All housing units (100%) that surpassed the WHO reference level were classified as brick houses. The majority of residences were built on concrete slab foundations, with 86% of them having radon levels below 100 Bq/m3. Dwellings with four or more rooms were more likely to exceed the WHO reference level (74.8%), compared to one-room dwellings (1.0%). Daily ventilation was most common across both radon level categories, while dwellings with frequent ventilation (daily ventilation) were more likely to have an indoor radon concentration below 100 Bq/m3. A greater proportion of living rooms (83.3%) showed radon concentrations above 100 Bq/m3, as opposed to bedrooms (16.7%). The distribution of radon levels across different temperature ranges was quite uniform. In the cooler temperature range (0.01 to 17.54 °C), slightly fewer homes 45.9% had radon levels below 100 Bq/m3, while 46.5% had levels exceeding 100 Bq/m3.
The results of the bivariate and multivariate logistic regression analyses are presented in Table 4. We investigated housing characteristics related to the detection of indoor radon concentrations exceeding the WHO reference level of 100 Bq/m3. Homes in Riverlea were four times more likely to have indoor radon concentrations above the WHO reference level compared to those in Orlando East (OR: 4.23, 95% CI; 2.12–8.38, p-value: 0.00). Similarly, homes with cracks were more likely to have indoor radon concentrations above the WHO reference level of 100 Bq/m3 compared to those without cracks. This insignificant association was observed in both bivariate (OR: 1.20, 95% CI: 0.75–1.93) and multivariate logistic regression models (OR: 1.59, 95% CI: 0.94–2.70, p 0.08). Ventilation displayed a positive association with indoor radon concentration in a multivariate logistic regression model (OR: 1.15, 95% CI: 0.82–1.60), with a p-value of 0.39. The presence of indoor smoking showed an association with an increased likelihood of surpassing the WHO reference level. This was observed in both the bivariate analysis (OR: 1.24, 95% CI: 0.75–2.04) and the multiple logistic regression (OR: 1.56, 95% CI: 0.91–2.70). However, this association did not reach statistical significance, with a p-value of 0.10. Furthermore, other housing characteristics such as house age, floor type, roof type, number of rooms and occupants, and ventilation did not exhibit any significant associations in the analysis.

3.7. Annual Effective Dose for Radon Exposure

The average indoor radon concentrations in Riverlea and Orlando East were 103.30 ± 94.91 Bq/m3 and 65.19 ± 47.83 Bq/m3, respectively. To calculate the annual effective dose, the following formula was used:
E = C × F × H × T × D,
Riverlea = 103.30 Bq/m3 × 0.4 × 0.8 × 8 760 (9 × 10⁻⁶) = 2.60 mSv/y
Orlando East = 65.19 Bq/m3 × 0.4 × 0.8 × 8 760 (9 × 10⁻⁶) = 1.64 mSv/y
Based on the results, the average annual effective dose of radon gas in residential homes for the residents in Riverlea and Orlando East was found to be 2.60 mSv/y and 1.64 mSv/y, respectively.

4. Discussion

Radon gas, a naturally occurring radioactive gas, and its decay products pose a significant health risk in residential settings worldwide. It is estimated to contribute to around 21,000 annual deaths related to lung cancer [35,39,42]. This colorless, odorless, and tasteless gas poses a particular challenge due to its imperceptibility [33]. The only reliable method to identify elevated radon levels is through indoor radon testing [63]. This study was significant as it enhanced the body of knowledge by delving deeper into the complex interplay between indoor radon concentrations, proximity to gold mine tailings (GMT), and a range of other house-specific factors. By examining the influence of GMT, this research expands upon previous surveys and offers valuable insights into potential environmental sources of residential radon exposure.

4.1. Average Volume Activity of Radon (VAR)

This study investigated the influence of proximity to GMT on the volume activity of radon. Dwellings proximal to GMT had significantly higher average VAR (103.30 ± 94.91 Bq/m3) compared to dwellings located far from GMT (65.19 ± 47.83 Bq/m3). Both communities had an average VAR exceeding the global average IRC of 39 Bq/m3 [35,63,64,65]. In other radon-related studies conducted in South Africa, specifically in the Gauteng Province near gold mine tailings, Dehkodi [66] and Moshupya [25] found lower average volume activity of radon (VAR) of 38 Bq/m3 and 46 Bq/m3, respectively. The reduced VAR observed near GMT in their studies may be attributed to the presence of vegetation covering some of the tailings, which potentially limited the dispersion of radon gas from the tailings to the surrounding communities [25]. While this current study did not measure ambient radon concentration, previous studies have confirmed that ambient radon concentration is higher near GMT, as reported by Moshupya et al. [21]. The elevated levels of the volume activity of radon observed in this study were in agreement with findings from other local studies conducted in similar settings, which also reported higher average VAR near GMT [20,21]. Beyond South African borders, elevated indoor radon concentrations proximal to mining grounds (including tailing facilities) have been reported in the USA [41] and Tanzania [67,68], and extremely high indoor radon concentration was reported in Poland [32], Slovenia [68], and Bulgaria [69]. The significantly higher average indoor radon concentration in three European studies may be due to the fact that long-term airtight conditions are common in Europe due to the fact that double doors and windows are used [68]. These findings underscore VAR fluctuation even within closely situated areas. Importantly, the average VAR observed in this study and the previous study conducted in Gauteng exceeded the global average, which the World Health Organization (WHO) emphasizes as carrying a potential risk of lung cancer because there is no safe threshold for indoor radon exposure [25,35]. The risk escalates with prolonged exposure, and cases have been reported in homes below the global average of 39 Bq/m3 [35].
There may be several reasons for the different VAR observed in our study and other local studies. The variation in the average VAR could be because of the spatial differences in radon parent radionuclides found in the surveyed area. This is because the measurements were taken in different locations with varying geological formations [25,63]. Variations in sampling techniques, duration, and placement of detectors across the studies may have contributed to the observed discrepancies [35]. The World Health Organization has highlighted the importance of standardized sampling protocols to ensure accurate and comparable data [35]. Furthermore, heterogeneity of the GMT may be responsible for variable average VAR observed in local studies [20,21,25,66]. Tailings with higher radium concentrations will naturally release more radon into the surrounding communities. This variability in radium content across different tailing sites likely contributed to the observed differences in indoor radon concentrations. It is suggested that future studies should consider incorporating three measurement points, at the tailings, outside dwellings, and inside dwellings, in order to establish a clearer understanding of the link between indoor radon exposure and proximity to gold mine tailings.

4.2. Volume Activity of Radon (VAR) in Relation to WHO Reference Level

A noticeable contrast in VAR became apparent between Riverlea (exposed group) and Orlando East (control or reference group). Riverlea’s dwellings displayed a significantly higher prevalence (68%) exceeding the 100 Bq/m3 threshold compared to Orlando East (31%). This disparity is clearly illustrated in the indoor radon map depicted in Figure 4. Dwellings surpassing the WHO threshold may necessitate mitigation in accordance with the WHO comprehensive global initiative [63]. Bivariate and multivariate logistic regression analysis corroborated the significance of location (p-value < 0.001) as a significant predictor of elevated indoor radon levels. This study found that Riverlea was associated with over four (4) times higher odds of exceeding the WHO radon threshold compared to Orlando East. This validates the observed geographical disparity in radon risk, as Riverlea is located near three gold mine tailings, while Orlando East is more than 2 km farther away. These findings align with similar studies conducted in South Africa [20,21] and abroad [67,68,69,70], which also showed higher radon concentrations in dwellings closer to mine fields. For instance, studies in Tanzania found higher indoor radon exposure in dwellings near mine fields compared to those located 7 km away [67,68]. In a study conducted in Bulgaria, the probability of exceeding the WHO reference limit was higher amongst dwellings situated 1 km from the mine tailings compared to those that were 2–3 km away from the mine tailings [69]. Studies in the USA [41] and Europe [32] also reported higher radon levels in homes near mine fields, exceeding the EPA action level and WHO reference level, respectively. However, a recent South African study found average indoor radon concentrations lower than the WHO reference level near gold mine tailings [25]. From a public health standpoint, a reference level of 100 Bq/m3 can be justified due to the anticipated effective reduction in radon-related health risks for a population [25,35]. It is important to emphasize that there is no known threshold below which exposure to radon does not pose a potential risk for developing lung cancer [27,35,39]. Consequently, the level of risk from indoor radon exposure in Riverlea was significantly higher when compared to Orlando East, based on the overall average VAR levels. The comparison of indoor radon concentration levels from this study to the WHO reference suggests that residents living near the three gold mine tailings in Riverlea are in peril [28]. The likelihood of developing lung cancer, as well as the risk associated with leukemia and other cancers such as melanoma, kidney, and prostate cancers, may also be elevated [66,67]. However, it is crucial to acknowledge that because there is no safe threshold for indoor radon exposure, there may still be potential health risks among Orlando East residents, even when more dwellings report indoor radon levels below the reference level of 100 Bq/m3.

4.3. Association between Indoor Radon Concentration (IRC) Levels with Other Factors

Many studies [41,62,67] have demonstrated the impact of housing characteristics on the volume activity of radon (VAR). This particular study examined the dwelling characteristics of households in Riverlea and Orlando East to evaluate their potential influence on volume activity radon inside residential dwellings. Dwellings with cracks were more likely to have indoor radon concentrations above the WHO reference level of 100 Bq/m3. This finding was aligned with the understanding that cracks and openings provide pathways for radon gas to enter the dwelling from the soil [35,36]. This was consistent with the existing body of knowledge that suggests that dwellings with structural defects such as cracks were more likely to have elevated indoor radon exposure [25,36,41,70]. This finding was inconsistent with a Spanish study that investigated the association between house age, construction materials, and radon concentration, finding higher levels in new and traditionally renovated houses compared to older houses [71]. This is likely due to improved airtightness in modern dwellings, trapping radon gas that would otherwise escape.
Ventilation demonstrated a negative correlation with radon levels, indicating that effective ventilation practices can potentially lower indoor radon concentrations. However, this correlation did not reach statistical significance, likely due to confounding variables and limitations in the short-term measurement techniques used. This finding was not entirely unexpected. Previous research by Villalba Espinosa et al. (2020) employed a simpler design, directly measuring radon levels in a house with and without ventilation [72]. Their study yielded a clear and statistically significant decrease (average 62%) in radon concentration upon ventilation system activation [72]. While our own study did not achieve the same level of statistical significance, the parallel trend towards lower radon levels with increased ventilation suggests a genuine effect, while the positive association between indoor tobacco smoking and radon levels in our study was not statistically significant. Indoor cigarette smoking does not directly impact the release of radon gas from soil, basements, faults, or building materials. However, smoking can significantly increase the airborne concentration of radon’s harmful decay products [73]. Studies indicate that cigarette smoke serves as a carrier for these radioactive particles [74]. The higher number of aerosol particles in smoke-filled rooms creates more surface area for radon progeny to attach to, decreasing their deposition on surfaces and keeping them suspended in the air for longer periods [75]. This prolonged airborne presence increases the likelihood of inhalation and subsequent lung deposition, thereby intensifying the adverse health effects of radon exposure, even if the initial radon gas level remains constant.
Most homes that exceeded the WHO reference level were constructed with brick walls and had concrete slab foundations, which was in line with the findings of a US study indicating that houses built with concrete and cement had the highest indoor radon levels recorded [41]. These types of homes typically feature solid structural components, and the use of cement, concrete, and bricks is common due to their ability to withstand adverse weather conditions such as heavy winds and rain [41,54]. Such dwellings are usually tightly sealed, creating conditions conducive to the accumulation of potential radon gas from beneath and around the house [41]. An important correlation was found between roofing materials and radon levels, with homes featuring metal roofing exhibiting indoor radon concentrations above the WHO reference level of 100 Bq/m3. The study’s results revealed variations in average indoor radon concentrations based on the location of the room tested. Most radon tests conducted in living rooms exceeded the WHO reference level in comparison to readings from bedrooms, which contradicted earlier studies that found higher indoor radon concentration levels in bedrooms compared to living rooms [75,76,77,78]. Typically, bedrooms are known to have higher indoor radon levels than living rooms due to lower ventilation rates, as fresh air circulation can reduce indoor radon exposure. This inconsistent finding warrants further investigation using long-term measurement techniques.

4.4. Annual Effective Dose

Using Equation (1), an annual effective dose for indoor radon exposure was estimated. It was found that the effective doses received by Riverlea and Orlando East residents were 2.60 mSv/y and 1.64 mSv/y, respectively. Although these values were variable, it is worth noting that for both communities the effective dose was above the limit of 1 mSv/y recommended for public exposure by the National Nuclear Regulator [21,54] and ICRP [62,79,80]. The annual effective dose received by members of the communities being studied was higher than the global average annual dose from exposure due to radon, which is estimated to be 1.15 mSv [36]. The annual effective dose reported in this study was significantly higher than that reported in earlier studies [62,80]. On the contrary, the annual effective dose observed in this study was lower than the effective dose observed in a study conducted in Tanzania [67] and in South Africa [20]. This exceptionally high dose observed in this study coincided with high indoor radon concentrations observed in Riverlea and Orlando East, respectively. The high doses observed in this study could indicate a greater probability of radon-induced health problems, which is associated with substantial exposure to high radiological doses from radon in these communities [21].

4.5. Recommendations

Based on the findings of this study and existing knowledge, several key recommendations can be made for house characteristics to minimize indoor radon concentrations in the communities proximal to GMT. Residents must repair cracks and openings in the foundation and walls. As demonstrated in this study and corroborated by previous research, cracks and openings act as pathways for radon gas to enter the dwelling. During construction, builders should prioritize sealing cracks and ensuring a well-integrated building to limit radon infiltration. Residents must also consider alternative building materials (i.e., wood) to brick and concrete slabs. This study, along with the US study referenced, suggests that houses built with brick walls and concrete slab foundations tend to have higher radon concentrations. While these materials offer durability, exploring alternative building materials with higher permeability, such as wood frames, could be beneficial in radon-prone areas. Furthermore, residents must prioritize adequate natural or mechanical ventilation. While the statistical significance of this study was inconclusive, the observed trend aligns with prior research demonstrating that effective ventilation practices can lower indoor radon levels. House designs should incorporate features that encourage natural ventilation, such as open floor plans and placement of windows and doors to maximize cross-ventilation. The use of mechanical ventilation systems may also be necessary in some cases. For existing homes with radon levels exceeding WHO thresholds, the government should consider providing financial assistance to subsidize the installation of radon mitigation systems. The government can play a crucial role in raising public awareness about the dangers of radon gas and the importance of testing homes. Educational campaigns can inform residents about risk factors, testing procedures, and mitigation strategies.

4.6. Strength and Limitations

This study employed a well-defined sampling strategy, utilizing a random selection process to recruit participants from two distinct communities (Riverlea and Orlando East) known to have varying levels of exposure to gold mine tailings. A pilot study was conducted to assess the clarity and appropriateness of the questionnaire for the target population, leading to refinements that improved data quality. The study also benefited from the use of AlphaE radon monitors, recognized for their accuracy in detecting low radon levels. However, the measurement duration of 2 h may not fully capture seasonal variations in radon concentration. The overall participation rate of 70.1% was significantly higher than that observed in other radon studies [37].

5. Conclusions

This study investigated the influence of gold mine tailings on indoor radon concentrations (IRC) in residential dwellings. The findings reveal a clear association between proximity to tailings and elevated IRC. Homes in Riverlea, situated near the tailings (<2 km), exhibited significantly higher average IRC compared to the control group in Orlando East, exceeding the WHO recommended reference level of 100 Bq/m3. The findings of this study challenge the long-held belief that the South African climate may lead to better ventilation conditions resulting in lower indoor radon concentrations. However, this study found that homes near gold mine tailings had significantly higher indoor radon concentrations than the control group, even exceeding the WHO recommended reference level. This contradicts the notion that South Africa’s climate universally mitigates radon risk. The fact that indoor radon levels in the control area were significantly higher than the global radon average suggests that indoor radon exposure may pose a serious health risk even beyond gold mine tailings. These findings highlight the importance of conducting radon surveys, particularly the influence of specific environmental factors like gold mine tailings, which can significantly elevate indoor radon levels even in climates typically associated with good ventilation.
This study also identified specific dwelling characteristics that influence IRC. Dwellings constructed of brick with concrete slab foundations were more likely to have elevated radon levels, whereas those built primarily of metal and wood had lower concentrations. These findings suggested that structural defects, tobacco smoking indoors, and ventilation played an important role in radon concentration. Given the concerning levels of radon exposure observed in Riverlea, it is imperative that cost-effective mitigation measures (i.e., adequate natural ventilation) are implemented. Public health interventions should prioritize residents living near gold mine tailings. Educational campaigns to raise awareness about radon risks and testing procedures are crucial. Additionally, financial assistance programs to subsidize the installation of radon mitigation systems in high-risk dwellings would be beneficial.

Author Contributions

Conceptualization, K.V.M. and P.C.R.; methodology, K.V.M.; software, T.P.M. and B.S.; validation, W.U. and P.C.R.; formal analysis, K.V.M. and T.P.M.; investigation, K.V.M.; resources, P.C.R. and K.V.M.; data curation, K.V.M.; writing—original draft preparation, K.V.M.; writing—review and editing, P.C.R., W.U., T.P.M. and B.S.; visualization, K.V.M.; supervision, P.C.R. and W.U.; project administration, K.V.M. and P.C.R.; funding acquisition, P.C.R. All authors have read and agreed to the published version of the manuscript.

Funding

The Principal Investigator (P.C.R.) received funding from NRF (Support for Y-rated Researchers Programme (Grant number—CSRP23030380716) which was used during data collection, analysis, and project conclusion phases.

Institutional Review Board Statement

This study was conducted in accordance with the Declaration of Helsinki and approved by the University of Johannesburg Faculty of Health Sciences Research Ethics Committee (REC) (Clearance Number REC-1889-2023) and the Higher Degree Committee (HDC-01-115-2022).

Informed Consent Statement

Informed consent was obtained from all subjects involved in the study.

Data Availability Statement

All data are available upon request by emailing the corresponding author.

Acknowledgments

We would like to express our gratitude to the study participants for their willingness to welcome us into their homes and allow us to conduct this study. Additionally, I am thankful for the support provided by the Riverlea Mining Forum. Special thanks to Charlse van der Merwe from Riverlea and Buthi Mandla from Orlando East for their invaluable assistance with data collection.

Conflicts of Interest

The authors declare no conflicts of interest. The funder had no role in the design of the study; in the collection, analyses, or interpretation of data; in the writing of the manuscript; or in the decision to publish the results.

References

  1. Kneen, M.A.; Ojelede, M.E.; Annegarn, H.J. Housing and population sprawl near tailings storage facilities in the Witwatersrand: 1952 to current. S. Afr. J. Sci. 2015, 111, 9. [Google Scholar] [CrossRef] [PubMed]
  2. International Human Rights Clinic, Harvard Law School. The Cost of Gold: Environmental, Health, and Human Rights Consequences of Gold Mining in South Africa’s West and Central Rand; International Human Rights Clinic, Harvard Law School: Harvard, MA, USA, 2016. [Google Scholar]
  3. Khanyile, S. Development of Human Settlements and Mining Areas: 1956–2013. Gauteng City-Region Observatory (GCRO). 2016. Available online: https://www.gcro.ac.za/outputs/map-of-the-month/detail/development-of-human-settlements-and-mining-areas-1956-2013/ (accessed on 5 April 2024).
  4. Ongori, J.N.; Lindsay, R.; Newman, R.T.; Maleka, P.P. Determining the radon exhalation rate from a gold mine tailings dump by measuring the gamma radiation. J. Environ. Radioact. 2015, 140, 16–24. [Google Scholar] [CrossRef]
  5. Utembe, W.; Faustman, E.; Matatiele, P.; Gulumian, M. Hazards identified and the need for health risk assessment in the South African mining industry. Hum. Exp. Toxicol. 2015, 34, 1212–1221. [Google Scholar] [CrossRef]
  6. Chanda-Kapata, P. Public health and mining in East and Southern Africa: A desk review of the evidence. In Zambia Ministry of Health with Training and Research Support Centre in the Regional Network for Equity in Health in East and Southern Africa (EQUINET); EQUINET DISCUSSION PAPER 121; April 2020; Available online: https://equinetafrica.org/sites/default/files/uploads/documents/EQ%20Diss121%20Mining%20and%20health%20April2020.pdf (accessed on 23 June 2024).
  7. Broadhurst, J.; Amaral Filho, J.; Moyo, A.; Nwaila, P.; N’Gandu, H.S.; Shongwe, B.; Sibanda, L.; Stander, H.M.; Harrison, S.T. Resource Efficient and Socially Responsible Approaches for the Integrated Management of Mine Waste: Understanding the Risks, Opportunities, Enablers and Barriers; South African Water Research Commission Report No. 2580/1/19; Department of Chemical Engineering University of Cape Town: Cape Town, South Africa, 2019; ISBN 978-0-6392-0077-4. [Google Scholar]
  8. Mapanga, W.; Norris, S.A.; Chen, W.C.; Blanchard, C.; Graham, A.; Baldwin-Ragaven, L.; Boyles, T.; Donde, B.; Greef, L.; Huddle, K.; et al. Consensus study on the health system and patient-related barriers for lung cancer management in South Africa. PLoS ONE 2021, 16, e0246716. [Google Scholar] [CrossRef]
  9. Gulumian, M.; Annegarn, H.; Voyi, K.; Spiers, G.; Mine Health and Safety Council (MHSC). Adverse Health Impacts Associated with Dust Emissions from Gold Mine Tailings. Project Annual Report—Year 1. Available online: https://mhsc.org.za/sites/default/files/public/research_documents/SIM%20100801%20Year%201%20Report_0.pdf (accessed on 15 June 2024).
  10. Kengni, B.; Nkosi, V. Analysis of the current legal framework protecting the health of communities near gold mine tailings in South Africa. S. Afr. Public Law 2023, 37, 19. [Google Scholar] [CrossRef]
  11. The Bench Marks Foundation. Policy Gap 12 Soweto Report: “Waiting to Inhale” A Survey of Household Health in Four Mine-Affected Communities. 2016. Available online: https://media.business-humanrights.org/media/documents/files/documents/Benchmarks_policy_gap_12.pdf (accessed on 11 February 2022).
  12. Liefferink, M. Rehabilitation of Mine Contaminated Eco-Systems: A Contribution to a Just Transition to a Low Carbon Economy to Combat Unemployment and Climate Change; Federation for a Sustainable Environment: Sandton, South Africa, 2017. [Google Scholar]
  13. Liefferink, M. Selected extracts from South Africa’s environmental legislation: Challenges with the management of gold tailings within the Witwatersrand gold fields and case studies. In Proceedings of the 22nd International Conference on Paste, Thickened and Filtered Tailings, Crawley, WA, Australia, 8 May 2019; Australian Centre for Geomechanics: Crawley WA, Australia, 2019; pp. 53–67. Available online: https://papers.acg.uwa.edu.au/p/1910_0.04_Liefferink/ (accessed on 15 May 2024).
  14. Stassen, W. Gauteng’s Mine dumps Brimming with Radioactive Uranium. Health E-News. 15 October 2015. Available online: https://health-e.org.za/2015/10/15/gautengs-mine-dumps-brimming-with-radioactive-uranium/ (accessed on 22 February 2022).
  15. Zupunski, L.; Street, R.; Ostroumova, E.; Winde, F.; Sachs, S.; Geipel, G.; Nkosi, V.; Bouaoun, L.; Haman, T.; Schüz, J.; et al. Environmental exposure to uranium in a population living in close proximity to gold mine tailings in South Africa. J. Trace Elem. Med. Biol. 2023, 77, 127141. [Google Scholar] [CrossRef] [PubMed]
  16. Radebe, M.; Mathuthu, M. An Overview of Radon Emanation Measurement System for South African Communities. In Rare Earth Elements—Emerging Advances, Technology Utilization, and Resource Procurement; IntechOpen: London, UK, 2023. [Google Scholar] [CrossRef]
  17. Moreno, M.E.; Acosta-Saavedra, L.C.; Meza-Figueroa, D.; Vera, E.; Cebrian, M.E.; Ostrosky-Wegman, P.; Calderon-Aranda, E.S. Biomonitoring of metal in children living in a mine tailings zone in Southern Mexico: A pilot study. Int. J. Hyg. Environ. Health 2010, 213, 252–258. [Google Scholar] [CrossRef]
  18. Mpanza, M.; Adam, E.; Moolla, R. Dust Deposition Impacts at a Liquidated Gold Mine Village: Gauteng Province in South Africa. Int. J. Environ. Res. Public Health 2020, 17, 4929. [Google Scholar] [CrossRef]
  19. Winde, F.; Erasmus, E.; Geipel, G. Uranium contaminated drinking water linked to leukaemia—Revisiting a case study from South Africa taking alternative exposure pathways into account. Sci. Total Environ. 2017, 574, 400–421. [Google Scholar] [CrossRef]
  20. Kamunda, C.; Mathuthu, M.; Madhuku, M.J. Determination of radon in mine dwellings of gauteng province of South Africa using AlphaGUARD radon professional monitor. J. Environ. Toxicol. Stud. 2017, 1, 1–4. [Google Scholar] [CrossRef]
  21. Moshupya, P.; Abiye, T.; Mouri, H.; Levin, M.; Strauss, M.; Strydom, R. Assessment of Radon Concentration and Impact on Human Health in a Region Dominated by Abandoned Gold Mine Tailings Dams: A Case from the West Rand Region, South Africa. Geosciences 2019, 9, 466. [Google Scholar] [CrossRef]
  22. Kamunda, C.; Mathuthu, M.; Madhuku, M. An assessment of radiological hazards from gold mine tailings in the Province of Gauteng in South Africa. Int. J. Environ. Res. Public Health 2016, 13, 138. [Google Scholar] [CrossRef]
  23. Njinga, R.L.; Tshivhase, V.M. Lifetime cancer risk due to gamma radioactivity in soils from Tudor Shaft mine environs, South Africa. J. Radiat. Res. Appl. Sci. 2016, 9, 310–315. [Google Scholar] [CrossRef]
  24. Winde, F.; Geipel, G.; Espina, C.; Schüz, J. Human exposure to uranium in South African gold mining areas using barber-based hair sampling. PLoS ONE 2019, 14, e0219059. [Google Scholar] [CrossRef]
  25. Moshupya, P.M.; Mohuba, S.C.; Abiye, T.A.; Korir, I. Evaluation of Indoor Radon Activity Concentrations and Controls in Dwellings Surrounding the Gold Mine Tailings in Gauteng Province of South Africa. Int. J. Environ. Res. Public Health 2023, 20, 7010. [Google Scholar] [CrossRef] [PubMed]
  26. Winde, F.; de Villiers, A.B. The nature and extent of uranium contamination from tailings dams in the Witwatersrand gold mining area (South Africa). In Proceedings of the Uranium in the Aquatic Environment: Proceedings of the International Conference Uranium Mining and Hydrogeology III and the International Mine Water Association Symposium Freiberg, Berlin, Germany, 15–21 September 2002; Springer: Berlin/Heidelberg, Germany, 2022; pp. 889–898. [Google Scholar]
  27. Smit, H.; Bezuidenhout, J. Influence of climate and weather on the mitigation of radon exposure in two towns of the Western Cape, South Africa. J. Radiat. Res. Appl. Sci. 2021, 14, 236–245. [Google Scholar] [CrossRef]
  28. Kootbodien, T.; Iyaloo, S.; Wilson, K.; Naicker, N.; Kgalamono, S.; Haman, T.; Mathee, A.; Rees, D. Environmental silica dust exposure and pulmonary tuberculosis in Johannesburg, South Africa. Int. J. Environ. Res. Public Health 2019, 16, 1867. [Google Scholar] [CrossRef]
  29. Uzoegbo, H.C.; Li, K. Mineinduced seismic events and its effect on nearby settlements in South Africa. Retrieved 2002, 5, 1–16. [Google Scholar]
  30. Think Hazard. Gauteng, South Africa. Report Generated on 24 September 2020. Available online: https://thinkhazard.org/en/report/2708-south-africa-gauteng (accessed on 12 June 2024).
  31. Benà, E.; Ciotoli, G.; Ruggiero, L.; Coletti, C.; Bossew, P.; Massironi, M.; Mazzoli, C.; Mair, V.; Morelli, C.; Galgaro, A.; et al. Evaluation of tectonically enhanced radon in fault zones by quantification of the radon activity index. Sci. Rep. 2022, 12, 21586. [Google Scholar] [CrossRef]
  32. Wysocka, M.; Nowak, S.; Chałupnik, S.; Bonczyk, M. Radon Concentrations in Dwellings in the Mining Area—Are There Observed Effects of the Coal Mine Closure? Int. J. Environ. Res. Public Health 2022, 19, 5214. [Google Scholar] [CrossRef] [PubMed]
  33. Eidy, M.; Regina, A.C.; Tishkowski, K. Radon Toxicity. [Updated 26 January 2024]. In StatPearls; StatPearls Publishing: Treasure Island, FL, USA, 2024. Available online: https://www.ncbi.nlm.nih.gov/books/NBK562321/ (accessed on 13 June 2023).
  34. Keith, S.; Doyle, J.R.; Harper, C.; Mumtaz, M.; Tarrago, O.; Wohlers, D.W.; Diamond, G.L.; Citra, M.; Barber, L.E. Toxicological Profile for Radon; Agency for Toxic Substances and Disease Registry (US): Atlanta, GA, USA, 2012. [Google Scholar]
  35. World Health Organization. WHO Handbook on Indoor Radon: A Public Health Perspective; World Health Organization: Geneva, Switzerland, 2009; Available online: https://apps.who.int/iris/handle/10665/44149 (accessed on 1 February 2023).
  36. International Atomic Energy Agency (IAEA). Design and Conduct of Indoor Radon Surveys; Safety Reports Series No. 98, Austria. 2019. Available online: https://www-pub.iaea.org/MTCD/Publications/PDF/PUB1848_web.pdf (accessed on 13 February 2023).
  37. Karam, A.; Venter, N. Affordable housing on contaminated land in Johannesburg. Acta Structilia J. Phys. Dev. Sci. 2007, 14, 35–37. [Google Scholar]
  38. Lorenzo-González, M.; Ruano-Ravina, A.; Peón, J.; Piñeiro, M.; Barros-Dios, J.M. Residential radon in Galicia: A cross-sectional study in a radon-prone area. J. Radiol. Prot. 2017, 37, 728–741. [Google Scholar] [CrossRef] [PubMed]
  39. Lecomte, J.-F.; Solomon, S.; Takala, J.; Jung, T.; Strand, P.; Murith, C.; Kiselev, S.; Zhuo, W.; Shannoun, F.; Janssens, A. ICRP publication 126: Radiological protection against radon exposure. Ann. ICRP 2014, 43, 5–73. [Google Scholar] [CrossRef] [PubMed]
  40. Haakonde, T.; Yabe, J.; Choongo, K.; Chongwe, G.; Nchima, G. Uranium exposure and health risk implications: A preliminary study among the residents living around uranium mining sites in the Southern Province of Zambia. Environ. Adv. 2021, 5, 100098. [Google Scholar] [CrossRef]
  41. Yazzie, S.A.; Davis, S.; Seixas, N.; Yost, M.G. Assessing the Impact of Housing Features and Environmental Factors on Home Indoor Radon Concentration Levels on the Navajo Nation. Int. J. Environ. Res. Public Health 2020, 17, 2813. [Google Scholar] [CrossRef]
  42. Ruano-Ravina, A.; Kelsey, K.T.; Fernández-Villar, A.; Barros-Dios, J.M. Action levels for indoor radon: Different risks for the same lung carcinogen? Eur. Respir. J. 2017, 50, 1701609. [Google Scholar] [CrossRef]
  43. Leuschner, A.H.; Steyn, A.; Strydom, R.; De Beer, G.P. Indoor Radon Concentrations in South African Homes; International Radiation Protection Association: Montreal, BC, Canada, 1992. [Google Scholar]
  44. Leuchner, A.H.; Van As, D.; Grundling, A.; Steyn, A. A survey of indoor radon exposure in South Africa. Clean Air J. 1989, 7, 7. [Google Scholar] [CrossRef]
  45. Mphaga, K.V.; Utembe, W.; Rathebe, P.C. Radon exposure risks among residents proximal to gold mine tailings in Gauteng Province, South Africa: A cross-sectional preliminary study protocol. Front. Public Health 2024, 12, 1328955. [Google Scholar] [CrossRef] [PubMed]
  46. Ansre, C.Y. Dose Assessment of Radon Levels in the South-Dayi District of the Volta Region, Ghana. Doctoral Dissertation, University of Ghana, Accra, Ghana, 2015. [Google Scholar]
  47. Pantelić, G.; Čeliković, I.; Živanović, M.; Vukanac, I.; Nikolić, J.K.; Cinelli, G.; Gruber, V. Qualitative overview of indoor radon surveys in Europe. J. Environ. Radioact. 2019, 204, 163–174. [Google Scholar] [CrossRef]
  48. Lorenzo-González, M.; Ruano-Ravina, A.; Torres-Durán, M.; Kelsey, K.T.; Provencio, M.; Parente-Lamelas, I.; Leiro-Fernández, V.; Vidal-García, I.; Castro-Añón, O.; Martínez, C.; et al. Lung cancer and residential radon in never-smokers: A pooling study in the Northwest of Spain. Environ. Res. 2019, 172, 713–718. [Google Scholar] [CrossRef] [PubMed]
  49. Gariazzo, C.; Binazzi, A.; Alfò, M.; Massari, S.; Stafoggia, M.; Marinaccio, A. Predictors of lung cancer risk: An ecological study using mortality and environmental data by municipalities in Italy. Int. J. Environ. Res. Public Health 2021, 18, 1896. [Google Scholar] [CrossRef] [PubMed]
  50. Torres-Durán, M.; Ruano-Ravina, A.; Parente-Lamelas, I.; Leiro-Fernández, V.; Abal-Arca, J.; Montero-Martínez, C.; Pena-Álvarez, C.; González-Barcala, F.J.; Castro-Añón, O.; Golpe-Gómez, A.; et al. Lung cancer in never-smokers: A case–control study in a radon-prone area (Galicia, Spain). Eur. Respir. J. 2014, 44, 994–1001. [Google Scholar] [CrossRef] [PubMed]
  51. Yitshak-Sade, M.; Blomberg, A.J.; Zanobetti, A.; Schwartz, J.D.; Coull, B.A.; Kloog, I.; Dominici, F.; Koutrakis, P. County-level radon exposure and all-cause mortality risk among Medicare beneficiaries. Environ. Int. 2019, 130, 104865. [Google Scholar] [CrossRef]
  52. Turner, M.C.; Krewski, D.; Chen, Y.; Pope, C.A.; Gapstur, S.M.; Thun, M.J. Radon and COPD mortality in the American Cancer Society Cohort. Eur. Respir. J. 2012, 39, 1113–1119. [Google Scholar] [CrossRef]
  53. Zlobina, A.; Farkhutdinov, I.; Carvalho, F.P.; Wang, N.; Korotchenko, T.; Baranovskaya, N.; Farkhutdinov, A. Impact of environmental radiation on the incidence of cancer and birth defects in regions with high natural radioactivity. Int. J. Environ. Res. Public Health 2022, 19, 8643. [Google Scholar] [CrossRef] [PubMed]
  54. Oancea, S.C.; Rundquist, B.C.; Simon, I.; Swartz, S.; Zheng, Y.; Zhou, X.; Sens, M.A.; Schwartz, G.G. County level incidence rates of chronic lymphocytic leukemia are associated with residential radon levels. Futur. Oncol. 2017, 13, 1873–1881. [Google Scholar] [CrossRef]
  55. Maheso, A.M.; Bezuidenhout, J.; Newman, R.T. Indoor Radon Levels in Homes and Schools in the Western Cape, South Africa—Results from a Schools Science Outreach Initiative and Corresponding Model Predictions. Int. J. Environ. Res. Public Health 2023, 20, 1350. [Google Scholar] [CrossRef]
  56. Iyaloo, S.; Kootbodien, T.; Naicker, N.; Kgalamono, S.; Wilson, K.S.; Rees, D. Respiratory Health in a Community Living in Close Proximity to Gold Mine Waste Dumps, Johannesburg, South Africa. Int. J. Environ. Res. Public Health 2020, 17, 2240. [Google Scholar] [CrossRef]
  57. Nkosi, V.; Wichmann, J.; Voyi, K. Mine dumps, wheeze, asthma, and rhinoconjunctivitis among adolescents in South Africa: Any association? Int. J. Environ. Health Res. 2015, 25, 583–600. [Google Scholar] [CrossRef]
  58. Nkosi, V.; Wichmann, J.; Voyi, K. Chronic respiratory disease among the elderly in South Africa: Any association with proximity to mine dumps? Environ. Health 2015, 14, 33. [Google Scholar] [CrossRef] [PubMed]
  59. Statistics South Africa. Mid-Year Population Estimates. 2022. Available online: https://www.statssa.gov.za/publications/P0302/MidYear2022.pdf (accessed on 21 May 2023).
  60. Saphymo GmbH. AlphaE Hand-Held Device for Radon Concentration & Personal Radon Exposure: User Manual 07/2016. Germany. 2016. Available online: https://www.radonshop.com/mediafiles/Anleitungen/Radon/Bertin_AlphaE/Bertin_AlphaE_ManualEN.pdf (accessed on 10 September 2023).
  61. Bertin Technologies. AlphaE User Manual: Hand-Held Device for Radon Concentration & Personal Radon Exposure; Bertin Instruments: Paris, France, 2020. [Google Scholar]
  62. Dimitrova, I.; Georgiev, S.; Mitev, K.; Todorov, V.; Dutsov, C.; Sabot, B. Study of the performance and time response of the RadonEye Plus2 continuous radon monitor. Measurement 2023, 207, 112409. [Google Scholar] [CrossRef]
  63. Kitson-Mills, D.; Sovoe, S.; Opoku-Ntim, I.; Kyei, K.A.; Marnotey, S.N.; Anim-Sampong, S.; Kwabeng, M.A.; Otoo, F.; Baiden, F. An assessment of indoor radon level in a suburb of Ghana. Environ. Res. Commun. 2019, 1, 061002. [Google Scholar] [CrossRef]
  64. Tsapalov, A.; Kovler, K. Short- versus long-term tests of indoor radon for risk assessment by Monte-Carlo method towards effective measurement strategy. Indoor Air 2022, 32, e13166. [Google Scholar] [CrossRef] [PubMed]
  65. Kovler, K.; Tsapalov, A. A challenging path to rational and harmonised international regulation of indoor radon. Radiat. Prot. Dosim. 2023, 199, 1047–1055. [Google Scholar] [CrossRef]
  66. Dehkordi, A.N. Assessment of radiation doses to the West Rand public due to inhalation of 222Rn and its daughter products. In Faculty of Science; University of Witwatersrand: Johannesburg, South Africa, 2012. [Google Scholar]
  67. Mlay, G.M.; Makundi, I.N. Assessment of indoor radon-222 concentrations in the vicinity of Manyoni uranium deposit, Singida. Tanzan. J. Sci. 2018, 44, 191–206. [Google Scholar]
  68. Mohammed, N.; Focus, E. Indoor radon concentration levels and annual effective doses for residence of houses near uranium deposit in Bahi district, Dodoma, Tanzania. Tanzan. J. Sci. 2018, 44, 159–168. [Google Scholar]
  69. Kobal, I.; Vaupotič, J.; Gregorič, A.; Uralbekov, B. Comparison of approaches in Slovenia and Kazakhstan in managing exposure to radon. In Uranium-Past and Future Challenges: Proceedings of the 7th International Conference on Uranium Mining and Hydrogeology; Springer International Publishing: Berlin/Heidelberg, Germany, 2015; pp. 689–698. [Google Scholar]
  70. Ivanova, K.; Badulin, V. Indoor Radon Measurement in Former Uranium Mining Regions in Bulgaria. Invited Papers 2012, 255–258. [Google Scholar] [CrossRef]
  71. Grzywa-Celińska, A.; Krusiński, A.; Mazur, J.; Szewczyk, K.; Kozak, K. Radon—The Element of Risk. The Impact of Radon Exposure on Human Health. Toxics 2020, 8, 120. [Google Scholar] [CrossRef]
  72. Baeza, A.; García-Paniagua, J.; Guillén, J.; Montalbán, B. Influence of architectural style on indoor radon concentration in a radon prone area: A case study. Sci. Total Environ. 2018, 610–611, 258–266. [Google Scholar] [CrossRef]
  73. Villalba Espinosa, P.; Hidalgo García, D.; Arco Díaz, J.; Villalba Moreno, J. Study of Radon concentrations in a single-family home and their relationship with the ventilation system. Rev. Construcción 2020, 19, 443–456. [Google Scholar] [CrossRef]
  74. Ghany, H.A.A. The Association between Indoor Radon and Tobacco Smoke. Indoor Built Environ. 2006, 15, 289–293. [Google Scholar] [CrossRef]
  75. Jasaitis, D.; Girgždys, A. The investigation of tobacco smoke influence on the changes of indoor radon and its short-lived decay products volumetric activities. J. Environ. Eng. Landsc. Manag. 2013, 21, 59–66. [Google Scholar] [CrossRef]
  76. Sherafat, S.; Mansour, S.N.; Mosaferi, M.; Aminisani, N.; Yousefi, Z.; Maleki, S. First indoor radon mapping and assessment excess lifetime cancer risk in Iran. MethodsX 2018, 6, 2205–2216. [Google Scholar] [CrossRef]
  77. Otoo, F.; Darko, E.; Garavaglia, M.; Giovani, C.; Pividore, S.; Andam, A.; Amoako, J.; Adukpo, O.; Tandoh, J.; Inkoom, S. Seasonal indoor radon studies in buildings of Accra Metropolis of Greater Accra region of Ghana. Radioprotection 2018, 53, 199–206. [Google Scholar] [CrossRef]
  78. Yassin, S.; Al Sersawi, M.; Abuzerr, S.; Darwish, M. Indoor radon levels in the dwellings of the Gaza governorate neighborhoods’, Palestine. Int. J. Radiat. Res. 2019, 17, 541–548. [Google Scholar]
  79. Brenner, D. Protection against radon-222 at home and at work. ICRP Publication 65. Int. J. Radiat. Biol. 1994, 66, 413. [Google Scholar] [CrossRef]
  80. Ajayi, O.S.; Olubi, O.E. Investigation of indoor radon levels in some dwellings of southwestern Nigeria. Environ. Forens. 2016, 17, 275–281. [Google Scholar] [CrossRef]
Figure 1. Map of the study area.
Atmosphere 15 00881 g001
Figure 2. A histogram of the radon concentration survey performed in 330 sample points.
Atmosphere 15 00881 g002
Figure 3. Quantile–quantile (Q–Q) plot for assessing data normality.
Atmosphere 15 00881 g003
Figure 4. Map showing indoor radon levels between two communities.
Atmosphere 15 00881 g004
Table 1. Dwelling characteristics.
Riverlea
n = 166 (50.2%)
Orlando East
n = 165 (49.8%)
House ageLess than 10 years10 (6%)5 (3%)
11–20 Years9 (5.4%)7 (4.2%)
21–40 Years14 (8.4%)14 (8.5%)
More than 41133 (80.1%)139 (84.2%)
House typeShed/Wendy house0 (0%)2 (1.2%)
Shack0 (0%)4 (2.4%)
Brick house166 (100.0%)159 (96.4%)
Roof typeMetal roofing27 (16.3%)152 (92.1%)
Asbestos129 (77.7%)4 (2.4%)
Concrete tile10 (6.0%)7 (4.3%)
Other0 (0.0%)2 (1.2%)
FoundationConcrete slab156 (94.5%)164 (99.4%)
Stones and mortar9 (5.5%)0 (0.0%)
Wood0 (0.0%)1 (0.6%)
RoomsOne room0 (0.0%)5 (3.0%)
Two to three rooms58 (34.9%)21 (12.7%)
Four rooms and above108 (65.1%)139 (84.2%)
Cracks or openings Yes102 (61.8%)77 (47.2%)
No63 (38.2%)86 (52.8%)
Number of occupantsOne 7 (4.3%)7 (4.3%)
Two to three40 (24.5%)40 (24.4%)
More than four116 (71.2%)117 (71.3%)
Water supplyMunicipal supply165 (100.0%)164 (100.0%)
Other0 (0.0%)0 (0.0%)
Energy sourceElectricity 166 (100%)162 (98.2%)
Solar0 (0%)1 (0.6%)
Wood0 (0.0%)1 (0.6%)
Other0 (0.0%)1 (0.6%)
Ventilation Daily149 (89.8%)107 (64.85)
More than once a week15 (9.0%)30 (18.2%)
Less than once a week0 (0.0%)12 (7.3%)
Only during certain activities1 (0.6%)14 (8.5%)
Do not ventilate at all1 (0.6%)2 (1.2%)
Hours indoorsLess than 5 h17 (10.2%)0 (0.0%)
6–10 h17 (10.2%)12 (7.3%)
11–15 h21 (12.7%)35 (21.2%)
16–20 h24 (14.5%)61 (37.0%)
21–24 h87 (52.4%)57 (34.5%)
Tested for radon in the pastYes3 (1.8%)3 (1.8%)
No163 (98.2%)162 (98.2%)
Temperature<17.54 °C
>17.55 °C
65 (39.4%)
100 (60.4%)
68 (41.2%)
97 (58.8%)
Table 2. Association between house characteristics and indoor radon levels.
Variablesn (%)RangeAverage (SD)
MinMax
House locationRiverlea165 (50%)11.071078.85103.30 (94.91)
Orlando East165 (50%)0379.1365.19 (47.83)
House typeShed/Wendy house2 (0.6%)50.5869.3759.98 (13.29)
Shack4 (1.2%)17.2792.9754.67 (31.04
Brick house324 (98.2%)01078.8584.76 (77.99)
House Age1–5 years old6 (2%)50.81142.0587.53 (30.24)
6–10 years old9 (3%)10.07379.13103.88 (112.44)
11–20 years old16 (5%)01078.85157.70 (257.99)
21–40 years old28 (9%)12.40204.0459.99 (46.98)
Older than 40 years271 (82%)0277.2581.69 (50.94)
Roof-typeCorrugated Iron/zinc181 (54.8%)01078.8575.57 (91.20)
Asbestos130 (40%)12.23277.2596.19 (55.34)
Tile17 (5.2%)11.07179.2583.25 (51.02)
House foundationConcrete slab319 (97%)01078.8584.09 (78.29)
Stone and mortar9 (2.7%)25.35184.7485.65 (53.23)
Wood1 (0.3%)99.4899.4899.48 (-)
Floor-typeWood5 (1.5%)28.62193.2189.14 (68.30)
PVC flooring8 (2.4%)21.38111.3469.50 (31.04)
Tiles294 (89.1%)01078.8584.71 (80.38)
Concrete slab19 (5.8%)13.12204.2584.58 (48.40)
Stones4 (1.2%)24.06142.6871.97 (55.00)
Cracks on the floorNo148 (54.7%)01078.8591.60 (100.11)
Yes179 (45.3%)1.19379.1378.54 (51.97)
Temperature<17.54 °C133 (40.30%)01078.8590.81 (104.55)
>17.55 °C197 (59.70%)0289.9679.81 (51.50)
Table 3. Association between house characteristics and WHO radon reference level.
Dwelling CharacteristicsAverage Radon Reading
<100 Bq/m3>100 Bq/m3
Dwelling location Riverlea97 (42.0%)68 (68.7%)
Orlando East134 (58.0%)31 (31.3%)
House ageLess than 10 years11 (4.7%)4 (4.0%)
11–20 Years10 (4.3%)6 (6.1%)
21–40 Years23 (10.0%)5 (5.0%)
More than 41187 (81.0%)84 (84.9%)
House typeShed/Wendy house2 (0.9%)0 (0.0%)
Shack4 (1.7%)0 (0.0%)
Brick house225 (97.4%)99 (100.0%)
Roof typeMetal roofing138 (59.7%)41 (41.4%)
Asbestos80 (34.6%)52 (52.5%)
Concrete tile13 (5.7%)6 (6.1%)
Other2 (0.8%)0 (0%)
FoundationConcrete slab225 (97.4%)94 (95.9%)
Stone and mortar5 (2.2%)4 (4.1%)
Wood1 (0.4%)0 (0.0%)
FloorWood3 (1.3%)2 (2.0%)
PVC flooring6 (2.6%)2 (2.0%)
Tiles207 (89.6%)87 (87.9%)
Concrete slab 12 (5.2%)7 (7.1%)
Stones3 (1.3%)1 (1.0%)
RoomsOne room4 (1.7%)1 (1.0%)
Two to three rooms54 (23.4%)24 (24.2%)
Four rooms and above173 (74.9%)74 (74.8%)
Cracks or openings Yes128 (56.1%)51 (51.5%)
No100 (43.9%)48 (48.5%)
Number of occupantsOne 10 (4.4%)4 (4.1%)
Two to three57 (24.9%)22 (22.7%)
More than four162 (70.7%)71 (73.2%)
Ventilation Daily173 (74.8%)83 (83.8%)
More than once a week35 (15.2%)9 (9.1%)
Less than once a week11 (4.8%)1 (1.0%)
Only during certain activities11 (4.8%)4 (4.0%)
Do not ventilate at all11 (4.8%)4 (4.0%)
Temperature0.01–17.54 °C106 (45.9%)46 (46.5%)
17.55 °C and above125 (54.1%)53 (52.5%)
Room testedLiving room189 (87.5%)80 (83.3%)
Bedroom27 (12.5%)16 (16.7%)
Table 4. Association between radon levels and dwelling locations.
Housing Characteristics VariableBivariate Logistic Model
OR (95% CI)
≥100 Bq/m3
Multivariate Logistic Model
OR (95% CI)
≥100 Bq/m3
p Value
Dwelling location3.03 (0.20–0.54)4.23 (2.14–8.38)0.00
House age1.07 (0.80–1.43)1.19 (0.86–1.63)0.27
Roof type1.36 (0.97–1.91)0.89 (0.55–1.43)0.64
Floor type1.04 (0.73–1.50)0.95 (0.63–1.43)0.86
Number of rooms1.02 (0.62–1.68)1.17 (0.66–2.05)0.57
Cracks or openings1.20 (0.75–1.93)1.59 (0.94–2.70)0.08
Number of occupants1.09 (0.70–1.69)1.18 (0.74–1.87)0.46
Ventilation0.86 (0.63–1.17)1.15 (0.82–1.60)0.39
Smoking indoors1.24 (0.75–2.04)1.56 (0.91–2.70)0.10
Disclaimer/Publisher’s Note: The statements, opinions and data contained in all publications are solely those of the individual author(s) and contributor(s) and not of MDPI and/or the editor(s). MDPI and/or the editor(s) disclaim responsibility for any injury to people or property resulting from any ideas, methods, instructions or products referred to in the content.

