Article

Characteristics of Vegetation Photosynthesis under Flash Droughts in the Major Agricultural Areas of Southern China

1
School of Geography and Planning, Huaiyin Normal University, Huai’an 223300, China
2
College of Geodesy and Geomatics, Shandong University of Science and Technology, Qingdao 266590, China
3
School of Geographical Sciences, Nanjing University of Information Science and Technology, Nanjing 210044, China
*
Author to whom correspondence should be addressed.
Atmosphere 2024, 15(8), 886; https://doi.org/10.3390/atmos15080886
Submission received: 3 June 2024 / Revised: 20 July 2024 / Accepted: 21 July 2024 / Published: 25 July 2024
(This article belongs to the Special Issue The Water Cycle and Climate Change (3rd Edition))

Abstract

:
Flash droughts adversely affect agriculture and ecosystems due to their rapid depletion of soil moisture (SM). However, few studies assessed the impacts of flash droughts on crops, especially in the agricultural regions of southern China. In this study, we investigated flash droughts using crop root zone SM in the main agricultural region of southern China. Additionally, solar-induced chlorophyll fluorescence (SIF) served as a vegetation index to explore the crop response to flash droughts. The results reveal that the SIF exhibited an upward trend from 2001 to 2020 in the study area, indicating the enhanced photosynthetic capacity of crops and subsequent yield improvement. Hotspots of flash drought frequency occurred in the eastern areas of both the upper and lower Yangtze River regions, specifically in areas where the most rapid types of flash droughts were particularly prevalent. The average duration of flash droughts in the southern agricultural region was 6–12 pentads, a sufficiently long duration to significantly hinder crop photosynthesis, resulting in negative SIF standardized anomalies. The area affected by flash droughts in the southern agricultural region presented a downward trend during 2001–2020, with flash droughts of the longest duration in the recent decade, specifically in 2019, 2010, and 2013. The response frequency and time of SIF to flash droughts were >80% and <2 pentads, respectively, indicating that crops in the study area have a high sensitivity to flash droughts. In the northern part of the middle Yangtze River region and the southwestern and southeastern parts of the South China region, the mean values of the standardized anomalies of the SIF were lower than −0.5 during flash droughts, suggesting that crops in these areas were severely affected by flash droughts. During the late summer of 2019, the study area experienced a precipitation shortage coupled with high evapotranspiration capacity. This unfavorable combination of meteorological conditions can quickly lead to a substantial depletion of SM, ultimately triggering flash droughts that can be devastating for crops. Our findings can enhance the understanding of the impacts of flash droughts on crops in agricultural regions, as well as provide early warning signals of flash droughts for farmers to make appropriate mitigation strategies.

1. Introduction

The terrestrial water balance is vulnerable to hydrological disequilibrium, and this increases the likelihood of droughts when there is greater warming over land areas than the oceans [1]. Drought is a natural disaster phenomenon of water deficits due to prolonged atmospheric dryness, and drought events can adversely affect ecosystems and limit socio-economic sustainable development [2]. In general, droughts are characterized by a slow onset, often taking several months or longer to attain notable extents and intensities. However, the atmospheric circulation features associated with extreme dryness can persist for several weeks, accompanied by high temperatures and evapotranspiration capacity, resulting in a swift depletion of soil moisture (SM), and this can subsequently trigger a rapid onset of drought [3,4,5,6]. The rapid onset of drought, known as a flash drought, can cause crops to deteriorate rapidly, with potential impacts on agriculture, fire potential, and livestock health [7,8,9,10,11]. The National Integrated Drought Information System (NIDIS) is part of the National Oceanic and Atmospheric Administration (NOAA) and defines flash drought and describes its impacts and forecasting methods (https://www.drought.gov/what-is-drought/flash-drought, accessed on 5 July 2024). The potentially destructive impacts of flash droughts on agricultural production and socio-economics may exceed those of slowly evolving droughts [12,13]. Well-studied cases of flash droughts include the central U.S. drought that began in May 2012 [14], the South African drought event that began in November 2015 [15], and the southern China drought that began in the late summer of 2019 [16]. Flash droughts exhibit a strong correlation with high evapotranspiration capacity and low SM triggered by heatwaves, causing severe damage to ecosystems [4,17,18]. Overall, there is an urgent need to precisely detect flash droughts and evaluate their progression and ecological impacts, especially in agricultural regions.
SM dominates the drying stress on ecosystem production [19], so SM can be used as a key variable to monitor flash droughts [20]. Some scholars analyzed the spatio-temporal characteristics of flash droughts using surface or root zone SM [21,22,23,24]. The currently available SM data were obtained from remote sensing products, reanalysis products, and model simulation datasets. Most available SM datasets lack sufficient soil stratification information or spatial resolution. For example, the European Space Agency Climate Change Initiative for Soil Moisture (ESA CCI SM, satellite-based SM) mainly provided SM information for the surface layer [21,25]; the fifth-generation reanalysis dataset from the European Centre for Medium Range Weather Forecasts (ERA5) and the data from the Global Land Data Assimilation System (GLDAS) mainly provide SM information (about four soil layers) with a spatial resolution of about 0.25° [18,26,27,28]. For analysis, the SM characteristics at regional scales with high spatial resolution and finer soil stratification are required.
Drought is more destructive to vegetation with shallow root depths, especially crops. Scholars applied remotely sensed vegetation indicators, including the normalized difference vegetation index (NDVI) and the leaf area index (LAI), to assess the response patterns of vegetation ecosystems to drought conditions [29,30,31,32]. However, traditional vegetation indices have a delayed response to droughts, making it difficult to monitor the effects of flash droughts on vegetation in a timely manner [3,13]. Solar-induced chlorophyll fluorescence (SIF) is fluorescence emitted at 650–800 nm wavelength after the absorption of photosynthetically active radiation by vegetative chloroplasts under sunlight irradiation [33]. The intensity of SIF is related to the photosynthetic capacity, thereby providing a direct indication of the dynamic variations in actual photosynthesis within plants. The correlation between SIF and gross primary productivity (GPP) was found to potentially exceed that between NDVI and GPP [34]. Furthermore, the almost linear relationship between SIF and GPP allows the utilization of SIF as a proxy indicator for GPP at the ecosystem level [35,36]. Therefore, SIF can be effectively used as a “probe” of the vegetation physiological state and can reflect rapid changes in the photosynthesis capacity of terrestrial vegetation and related stress effects [3,33,37].
The availability of high-quality SIF products, including contiguous SIF (CSIF) and global orbiting carbon observatory-2 (OCO-2) SIF (GOSIF) datasets [36,38], facilitated the utilization of SIF as a powerful tool for directly monitoring environmental stress, photosynthetic capacity, and productivity characteristics within regional ecosystems [37,39,40,41]. For example, Umuhoza, et al. [42] used GOSIF to explore the characteristics of vegetation dynamics in Africa and found that the SIF values of most vegetation areas showed an increasing trend during 2000–2017. Li, et al. [43] investigated the characteristics of peak photosynthesis timing (PPT) in boreal ecosystems using CSIF and GOSIF datasets and concluded that PPT trended earlier over the past two decades due to increasing temperature.
Several studies focused on the impacts of traditional slow-evolving droughts on ecological indicators (e.g., GPP and SIF) [40,44,45,46]. For example, Geng, Yang and Liu [40] analyzed the characteristics of GOSIF and drought stress in the Yellow River basin in China and found that GOSIF can effectively monitor the response of vegetation growth to drought conditions in this region. Gampe, et al. [47] found an increasing impact of warm droughts on Northern Hemisphere ecosystems using the standardized precipitation evapotranspiration index (SPEI) method and GPP data. There were also studies on the effects of flash droughts on ecosystems [37,48]. Poonia, Goyal, Jha, and Dubey [8] investigated the ecosystem response to flash droughts in India based on SM and GPP data, noting that GPP was able to respond to 95% of flash droughts, with high response frequency occurring mainly in the Ganga basin and southern India. O and Park [17] concluded that the impacts of flash droughts on global ecosystems are spatially diverse, and that flash droughts in arid areas exert greater stress on vegetation than those in humid areas. However, there is limited research on the impacts of flash droughts on ecosystems based on SIF data, especially in agricultural areas.
The productivity of croplands is required for food security. In recent decades, the patterns of croplands and food production underwent significant alternations due to climate change and human activities [49,50]. Southern China not only has a high level of economic development, but also a large area of traditional agricultural areas [51]. Despite the relatively abundant annual precipitation in the agricultural areas of southern China, this region experiences significant fluctuation in short-term precipitation. Combined with the high-water demand of crops, this predisposition increases the likelihood of flash droughts, potentially having a substantial impact on agricultural production. For example, southern China experienced a devastating flash drought event during the late summer of 2019, resulting in huge losses to crops and associated economies [16,52]. Therefore, this study assessed the response characteristics of vegetation photosynthesis capacity to flash droughts in the main agricultural areas of southern China using high-resolution SM and SIF datasets. The objectives of this study encompassed three crucial aspects. Firstly, we aimed to investigate the patterns of meteorological, SM, and SIF variables in the major agricultural regions of southern China from 2001 to 2020. Secondly, we sought to explore the characteristics of SM-derived flash droughts and the associations with meteorological variables. Lastly, we aimed to explore the response of vegetation photosynthesis capacity to flash droughts in the study area. Our findings provide insight into how regional crop photosynthesis capacity reacts to flash droughts, thereby serving as a valuable guide to develop strategies to safeguard food security.

2. Materials and Methods
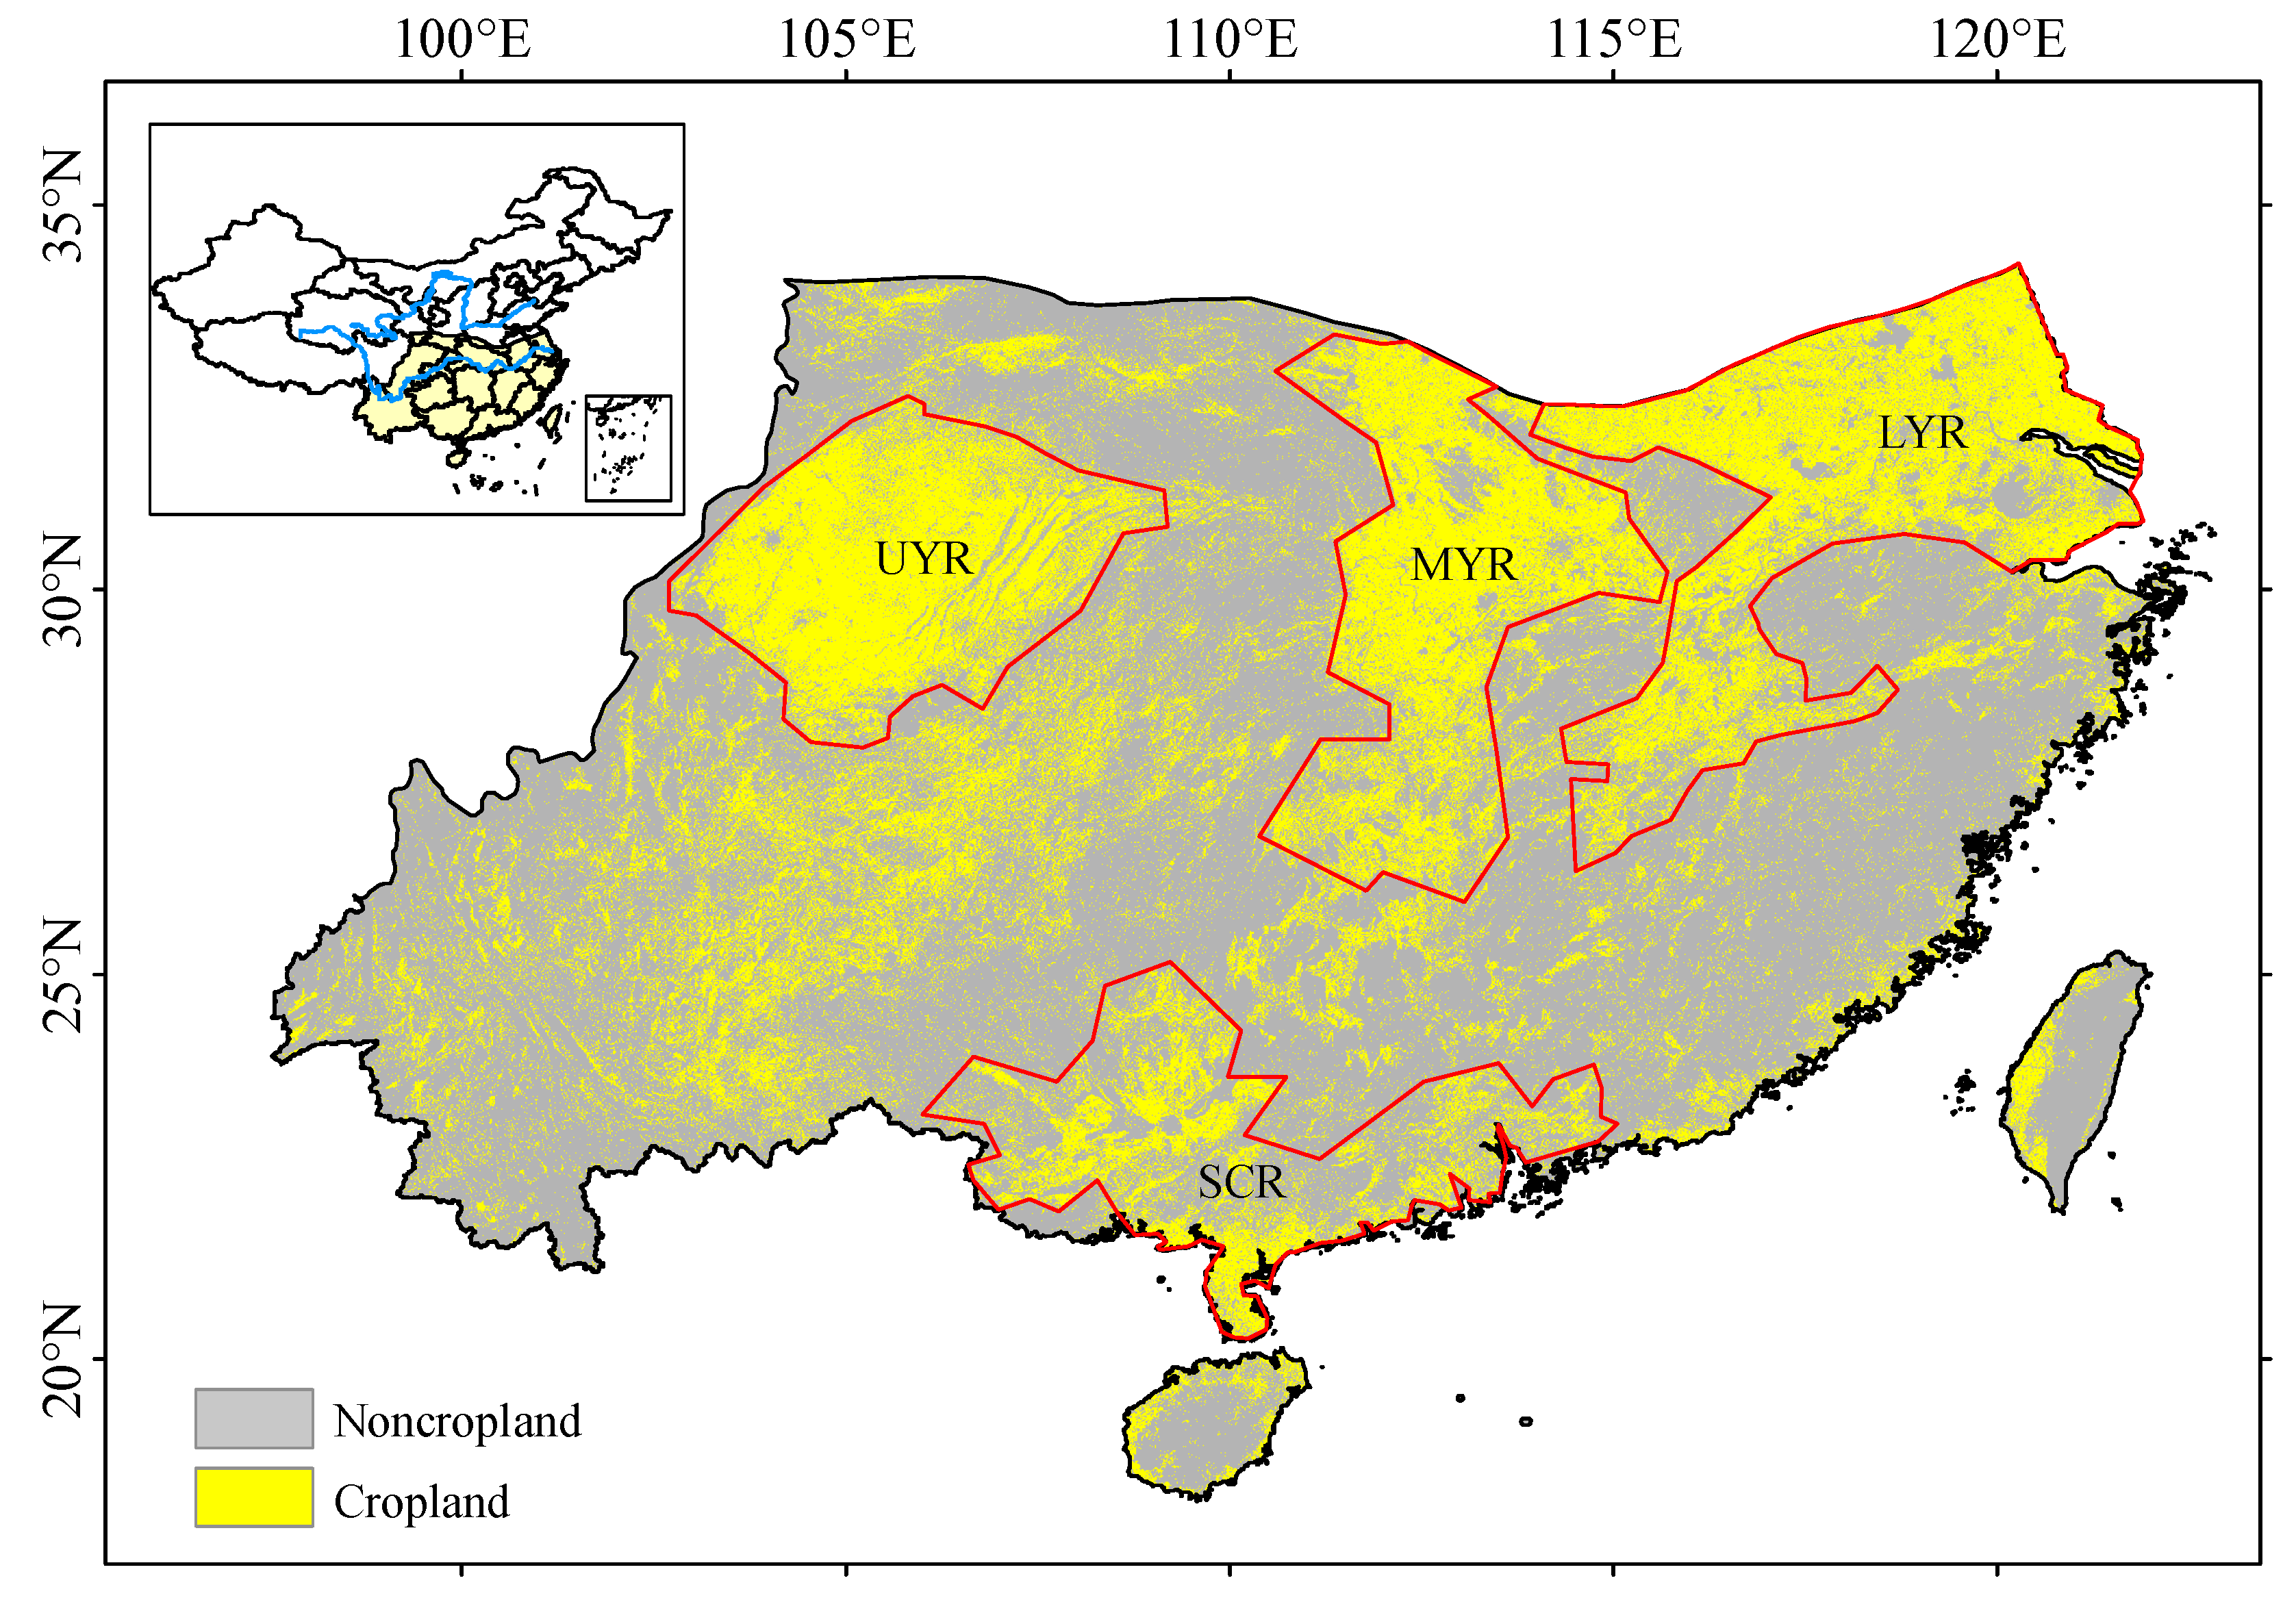
2.1. Study Area

In this study, Southern China refers to the southern part of the eastern monsoon zone of China (Figure 1). This region has a complex human and geographical environment, covering about 25% of China’s land area and 60% of China’s population [53]. The region is dominated by subtropical and tropical monsoon climate types, with winter average temperatures exceeding 0 °C and annual precipitation above 800 mm. We applied high-quality land cover data produced by Yang and Huang [54], which encompassed Landsat and Moderate-resolution Imaging Spectroradiometer (MODIS) data, along with the random forest algorithm. We used annual land cover with a resolution of 30 m from 2001 to 2020 (https://zenodo.org/records/4417810, accessed on 5 July 2024), including nine types: forest, grassland, shrub, cropland, water, snow/ice, barren, impervious, and wetland. A cropland type was defined as cropland on the same grid that did not change in at least 11 years during 2001–2020 (Figure 1). In this way, we roughly divided southern China into four major agricultural regions based on a grid of highly agglomerated cropland: the upper Yangtze River region (UYR) (i.e., the Sichuan Basin), the middle Yangtze River region (MYR) (mainly including Hubei and Hunan provinces), the lower Yangtze River region (LYR) (mainly including Jiangsu, Anhui, and Jiangxi provinces), and the South China region (SCR) (mainly including Guangdong and Guangxi provinces). These four major agricultural zones mainly produce rice and wheat.

2.2. Data

SMCI 1.0 (SM of China based on in situ data, version 1.0) utilized various factors (e.g., ERA5-land meteorological data, land cover, and soil data) to predict SM through the random forest method. The results of SMCI 1.0 were validated by 1648 local observation stations [55]. SMCI 1.0 can provide important supplementary data to the SM derived from model and remote sensing techniques for a more accurate meteorological, hydrological, and ecological process. SMCI 1.0 provided high spatio-temporal resolution of SM with 10 depth layers at 10 cm intervals. To facilitate analysis and understanding, we treated the SM of the SMCI 1.0 set at n cm as the average SM from n − 10 cm to n cm, e.g., the SM at 10 cm as the average SM from 0 to 10 cm, and the SM at 50 cm as the average SM from 40 to 50 cm. We mainly used the data from SMCI 1.0 (the top five soil layers, i.e., 0–50 cm) on a 9 km (0.1° spatial resolution) daily SM from 2001 to 2020 to identify flash droughts. We calculated the 0–30 cm and 0–50 cm SM (SMCI 1.0) using the soil layer thickness weighting methods.
ERA5 is an enhanced iteration of ERA-Interim, integrating multiple data sources through a 4D-Var assimilation technique to guarantee the data quality [56,57,58]. In this study, ERA5 SM included 0–7 cm and 7–28 cm layers during 1981–2020, allowing comparison of flash drought data with the SMCI 1.0 data. We aggregated ERA5 SM values of 0–28 cm via the soil layer thickness weighting methods. ERA5 SM has an hourly time scale and a spatial resolution of 0.25°. To facilitate the comparison and analysis with the SMCI 1.0 data, we processed the ERA5 SM hourly data into daily series, and then processed it to 0.1° spatial resolution by the bilinear interpolation method.
Daily 0.25° gridded observational meteorological data (CN05.1) for 2001–2020 were available from the Climate Change Research Center of the Chinese Academy of Sciences. These observations encompassed precipitation (P), relative humidity (RH), wind speed, maximum temperature (Tmax), and minimum temperature (Tmin). The CN05.1 dataset was compiled utilizing the anomaly approach, drawing upon observed data from approximately 2400 meteorological stations across China [59]. This set of observations was of high quality and was widely used in Chinese meteorology studies [60,61,62]. To minimize the error due to spatial mismatch, we uniformly resampled the CN05.1 data to 0.1°spatial resolution by the bilinear interpolation approach.
We employed two sets of SIFs and one set of GPP data during 2001–2020 to explore the impact of flash drought on vegetation photosynthesis in the agricultural areas of southern China. The CSIF data were produced utilizing a neural network algorithm that incorporated surface reflectance from MODIS and SIF from OCO-2 [38]. The CSIF data were obtained from the National Tibetan Plateau/Third Pole Environment Data Central in China (https://data.tpdc.ac.cn/zh-hans/data/d7cccf31-9bb5-4356-88a7-38c5458f052b, accessed on 5 July 2024). These data were collected under clear sky conditions, with a temporal resolution of four days and a spatial resolution of 0.05°. GOSIF data were developed through a data-driven method based on discrete OCO-2 SIF soundings, MODIS data, and meteorological reanalysis data [36]. The 8-day GOSIF data with a spatial resolution of 0.05° were obtained at http://data.globalecology.unh.edu/data/GOSIF_v2/8day/, accessed on 5 July 2024. The 8-day GPP with 0.05° spatial resolution was constructed via the robust linear relationships of GOSIF and tower GPP observations [36], and the data available online are at http://data.globalecology.unh.edu/data/GOSIF-GPP_v2/8day/Mean/, accessed on 5 July 2024. CSIF, GOSIF, and GPP can accurately measure vegetation growth and its drought stress response [35,37,40,63,64]. Shekhar, Buchmann, and Gharun [41] compared four SIF products across all land cover types, finding that CSIF and GOSIF predicted GPP better than the light use efficiency (LUE) SIF and harmonized SIF. To minimize errors due to SMCI 1.0 spatio-temporal matching, we first linearly interpolated the CSIF (4-day), GOSIF (8-day), and GPP (8-day) data into daily series, and then uniformly interpolated these data into 0.1° spatial resolution data via a bilinear interpolation method.

2.3. Potential Evapotranspiration (PET) and Vapor Pressure Deficit (VPD)

PET is difficult to measure directly, so it is usually estimated using empirical formulas. The two methods commonly used to estimate PET are the Thornthwaite and Penman–Monteith approaches [65,66,67,68]. The Thornthwaite method is mainly based on temperature and latitude information and the Penman–Monteith method requires more input variables. Because of its simplicity and the reliability of the results, the Thornthwaite method is widely used in hydroclimatic investigations [66,69,70]. We applied an adjusted Thornthwaite method to calculate daily PET [71]:
P E T = 0 ,                   T e f 0   ° C C × 16 × 10 × T e f I a ,       0   ° C < T e f < 26.5   ° C C × 415.85 + 32.24 × T e f 0.43 × T e f 2 ,    T e f 26.5   ° C
where T e f denotes effective temperature, and is calculated as a function of the daily mean temperature (Tmean = (Tmax + Tmin)/2) and the daily temperature amplitude (A = Tmax − Tmin):
T e f = k × T m e a n + A = 0.5 × k × 3 × T m a x T m i n
where k represents a calibration coefficient. The PET value of the Thornthwaite method with k = 0.69 is close to that of the Penman–Monteith method [18]. I and C are the thermal index and the conversion factor (monthly to daily scales), respectively. A detailed description of these formulas can be found in the relevant references [18,72].
VPD is an important indicator of atmospheric water demand, and can be expressed as the difference between the saturation vapor pressure ( e s ) and the actual vapor pressure ( e a ) [20,68]. The saturation vapor pressure can be expressed as follows:
e 0 T = 0.6108 × exp 17.27 × T T + 237.3
where e 0 ( T ) denotes the saturation vapor pressure (kPa) corresponding to the air temperature T (°C). The e s for a given day is typically expressed as the average e s corresponding to the daily Tmax and Tmin [73].
e s = e 0 T m a x + e 0 T m i n 2
The e a can be calculated as:
e a = e s × R H 100
where RH stands for relative humidity and ranges from 0 to 100. Ultimately, VPD = e s e a .

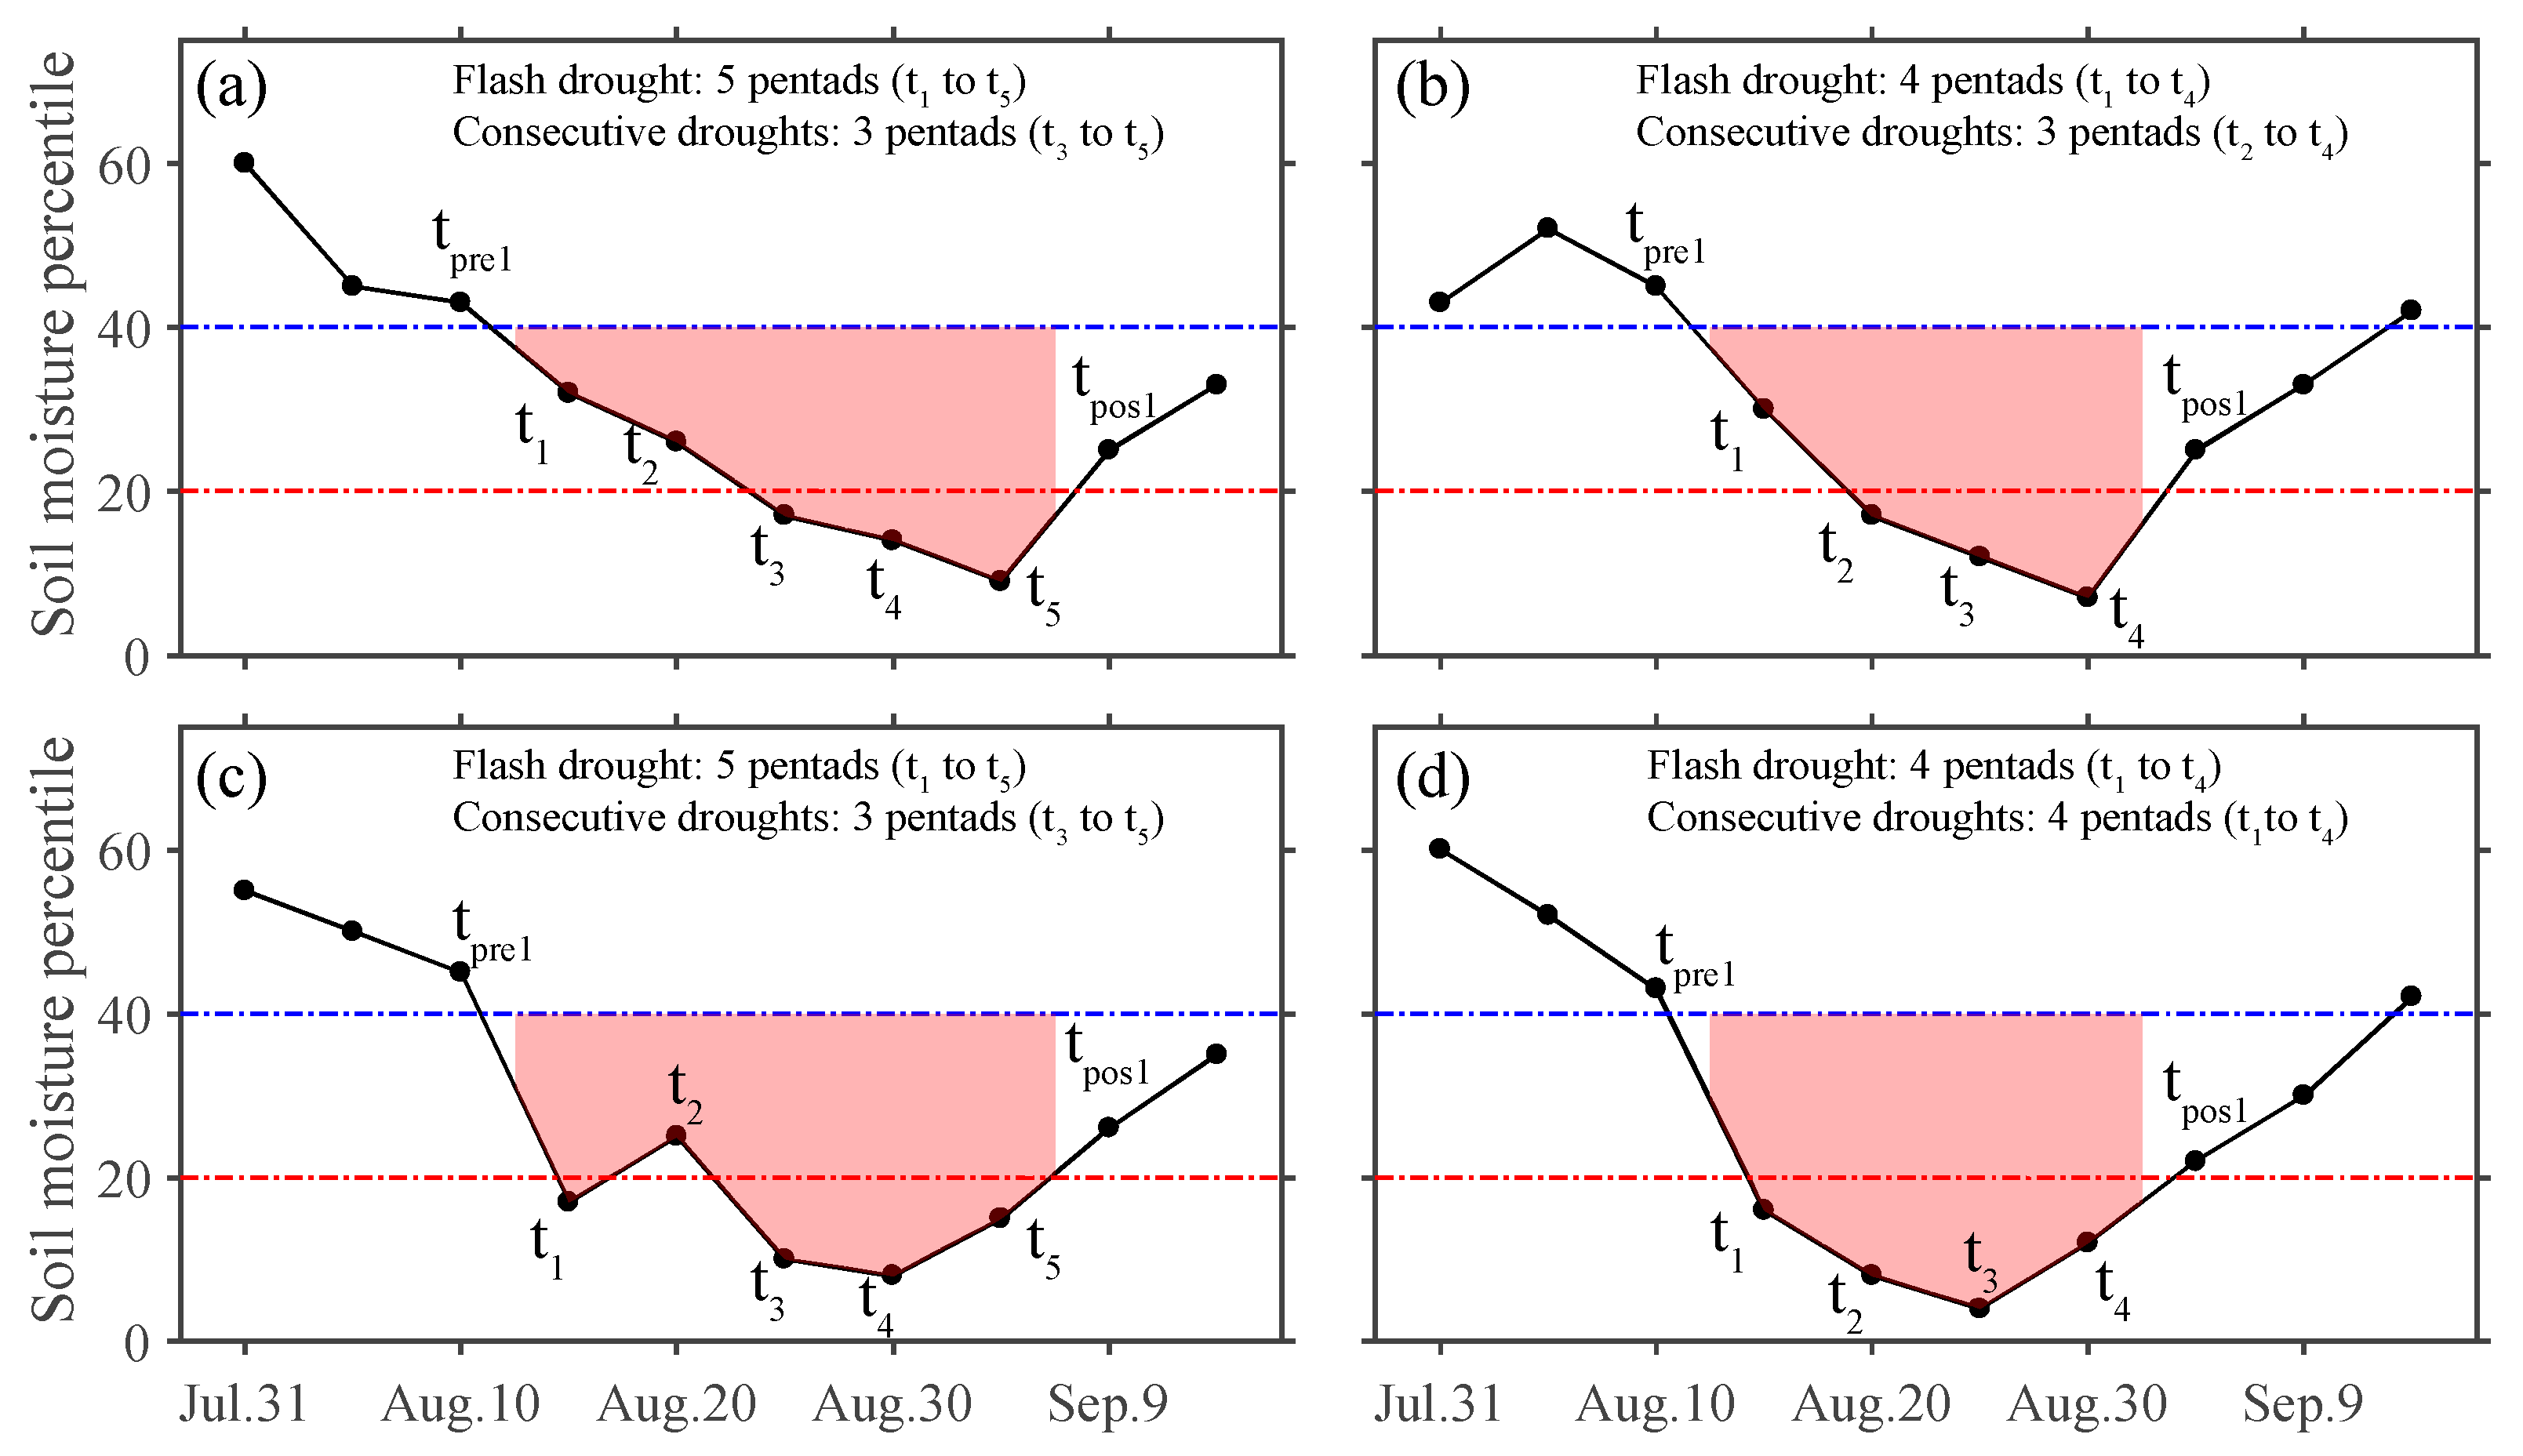
2.4. Flash Drought Definition

SM can be used as a key variable to identify flash droughts [20,23]. The main crops in the four major agricultural regions of southern China are rice and wheat, with root depths that are generally within 50 cm [74,75]. Therefore, we applied 0–50 cm SM (SMCI 1.0) to monitor flash droughts in the study area. Daily SM was fused to a pentad mean (5-day average) to reduce the noise in daily variability and then converted to a percentile series (excluding February 29 in leap years). The percentile of SM for a given grid was determined by all pentad series (73 pentads in a year) for the entire study period (2001–2020) for that grid. We applied the following criteria to identify flash droughts [20,23], as categorized into four specific cases (scenarios):
C a s e 1 = S M   ( t p r e 1 )     40 t h   percentile 20 t h   percentile < S M ( t 1,2 ) < 40 t h   percentile S M t 3 , , n   20 t h   percentile ,     5 n 18
C a s e 2 = S M ( t p r e 1 )     40 t h   percentile 20 t h   percentile < S M ( t 1 ) < 40 t h   percentile S M t 2 , , n   20 t h   percentile ,     4 n 18
C a s e 3 = S M   ( t p r e 1 )     40 t h   percentile S M t 1   20 t h   percentile 20 t h   percentile < S M ( t 2 ) < 40 t h   percentile S M t 3 , , n   20 t h   percentile ,     5 n 18
C a s e 4 = S M   ( t p r e 1 )     40 t h   percentile S M t 1 , , n   20 t h   percentile ,     4 n 18
where SM(tpre1) represents the SM of the pentad before the flash drought onset, and t1 and tn denote the beginning and termination dates of flash droughts. These four cases of flash droughts exhibit the following features: (1) the pentad mean SM percentile experiences a significant decrease, transitioning from a value greater than or equal to the 40th percentile at tpre1 to a value less than or equal to the 20th percentile within four pentads (rapid phase); (2) the duration of the drought phase was characterized by SM below or equal to the 20th percentile for a minimum of three consecutive pentads to ensure a substantial impact; (3) a flash drought event lasts a minimum of four pentads and a maximum of 18 pentads (distinguish a prolonged drought event); (4) the flash drought came to an end when SM again exceeded the 20th percentile. The onset speed of flash drought increased from Case 1 to Case 4 (Figure 2).

2.5. Standardized Anomaly

In order to capture drought stress signals, standardized meteorological variables such as P, PET, Tmax, and VPD, along with vegetative photosynthesis variables such as SIF and GPP were employed. The standardized anomaly can be determined using the following calculation [37]:
A i , j = X i , j X j ¯ σ i
where A i , j represents the anomaly of X in pentad j of year i. Here, X j ¯ signifies the average value of X in pentad j for the period 2001–2020. Furthermore, σ i denotes the standard deviation of X in pentad j during 2001–2020.
The response characteristics of vegetation photosynthesis capacity to flash droughts are usually characterized by response frequency and time [3,8]. On a grid scale, the response frequency is expressed by dividing the number of flash droughts that exhibit negative SIF or GPP anomalies by the total count of flash droughts. A higher response frequency indicates a greater risk to the ecosystem. Response time is the time when the first negative SIF or GPP anomaly occurs during a flash drought. A shorter response time indicates a more rapid response by vegetation photosynthesis to flash droughts.

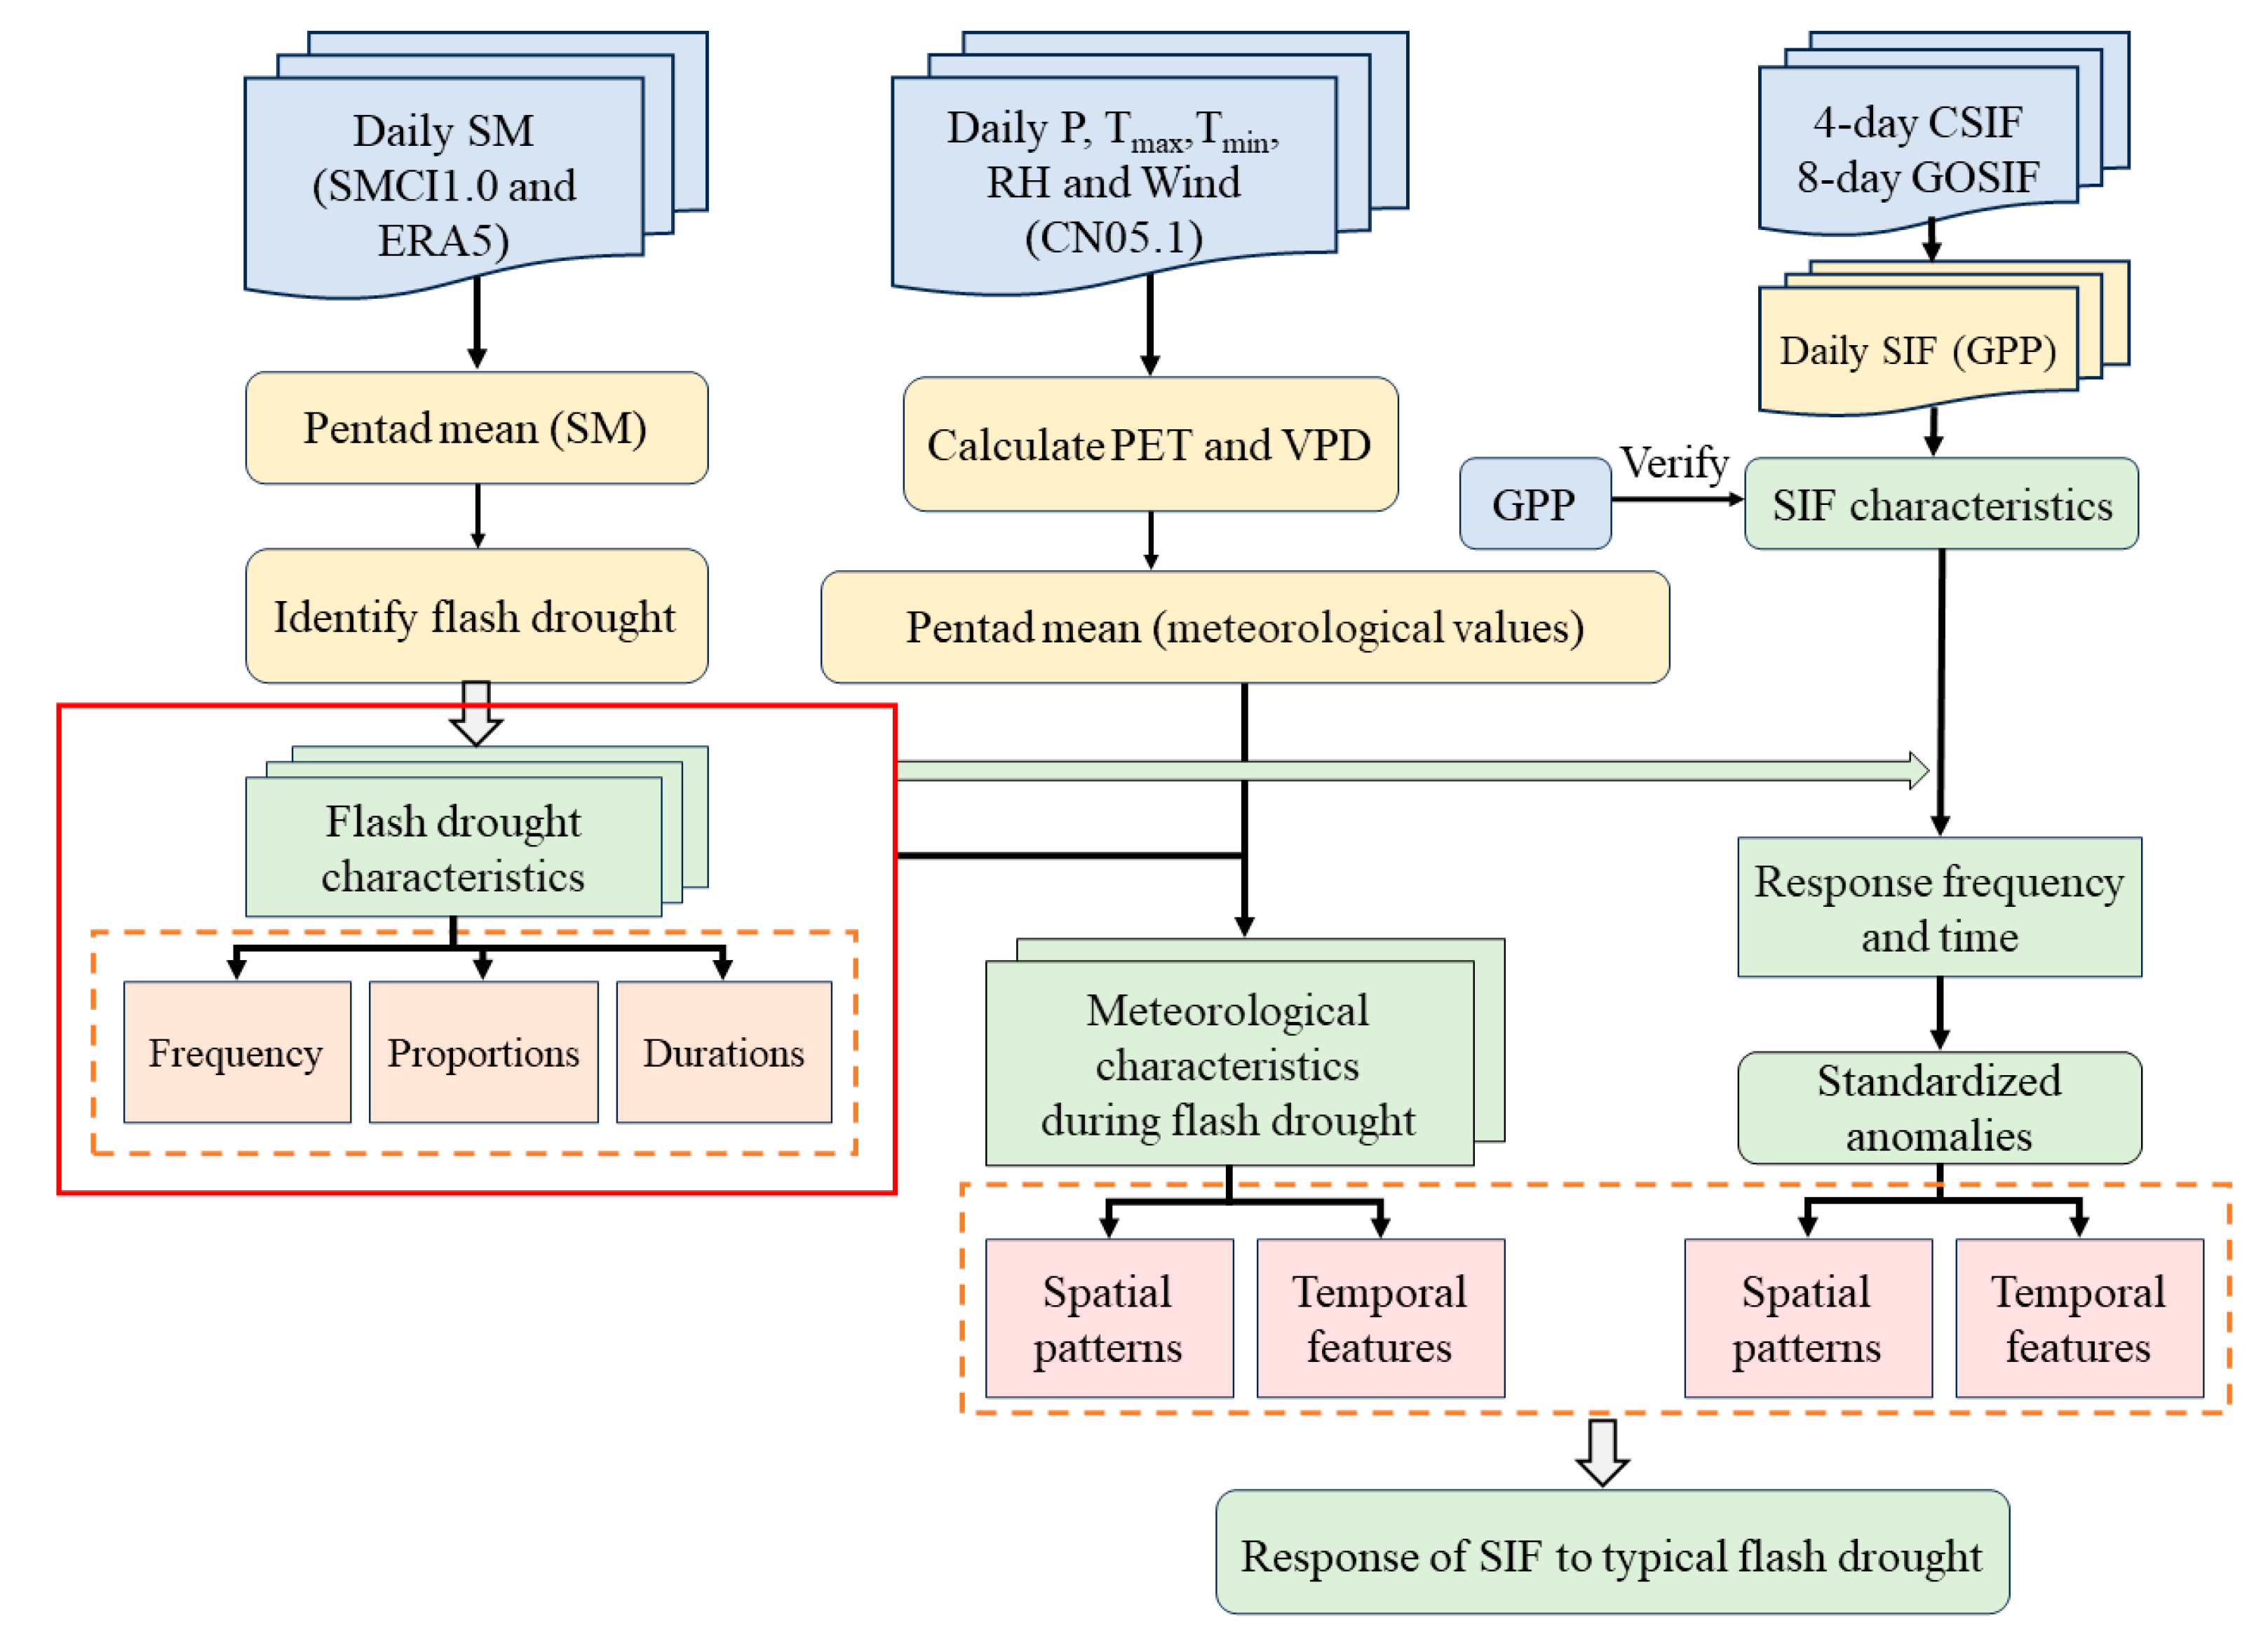
2.6. Overview of Methodologies

As shown in Figure 3, we first calculated the pentad mean SM, meteorological variables, and SIFs based on daily values. The identification of flash droughts with specific four cases was performed based on the pentad mean SM. We then explored the frequency and duration characteristics of flash droughts in the agricultural areas of southern China. Next, we investigated the meteorological characteristics under flash drought conditions, and then analyzed the response characteristics of SIF to flash droughts. Finally, we explored the response characteristics of vegetation photosynthesis capacity to flash droughts by analysis of a typical event in 2019.

3. Results

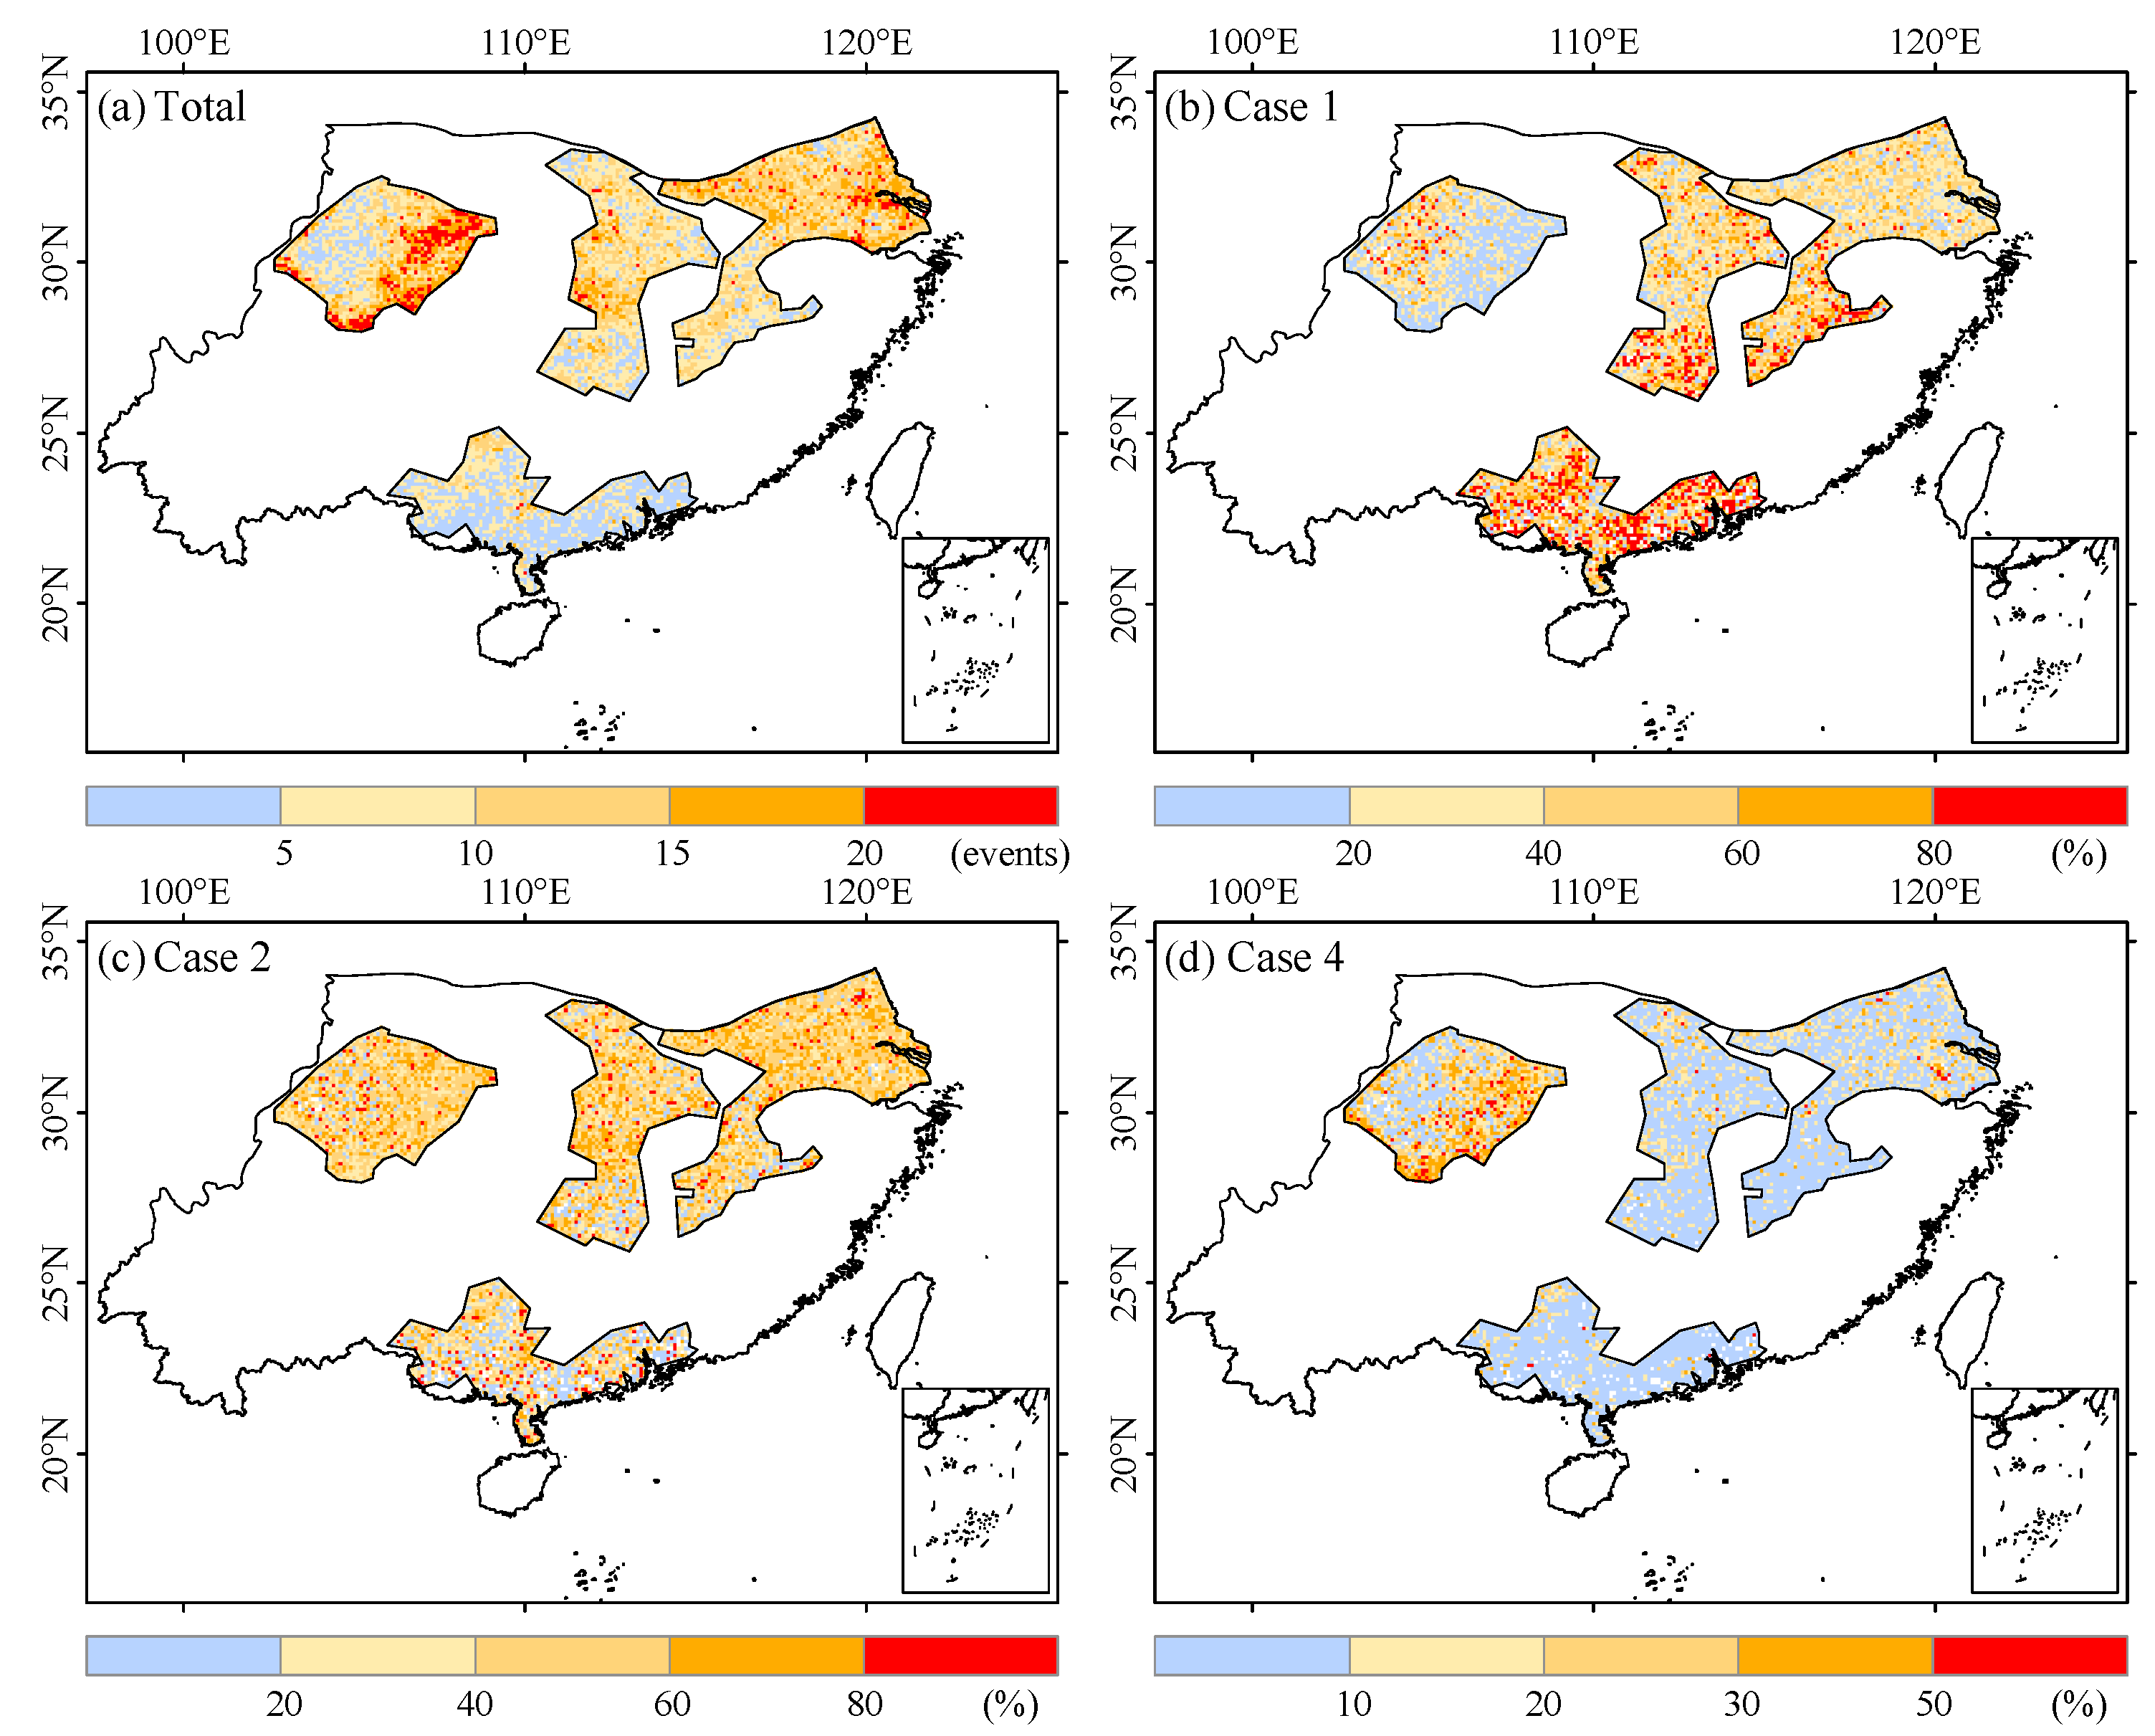
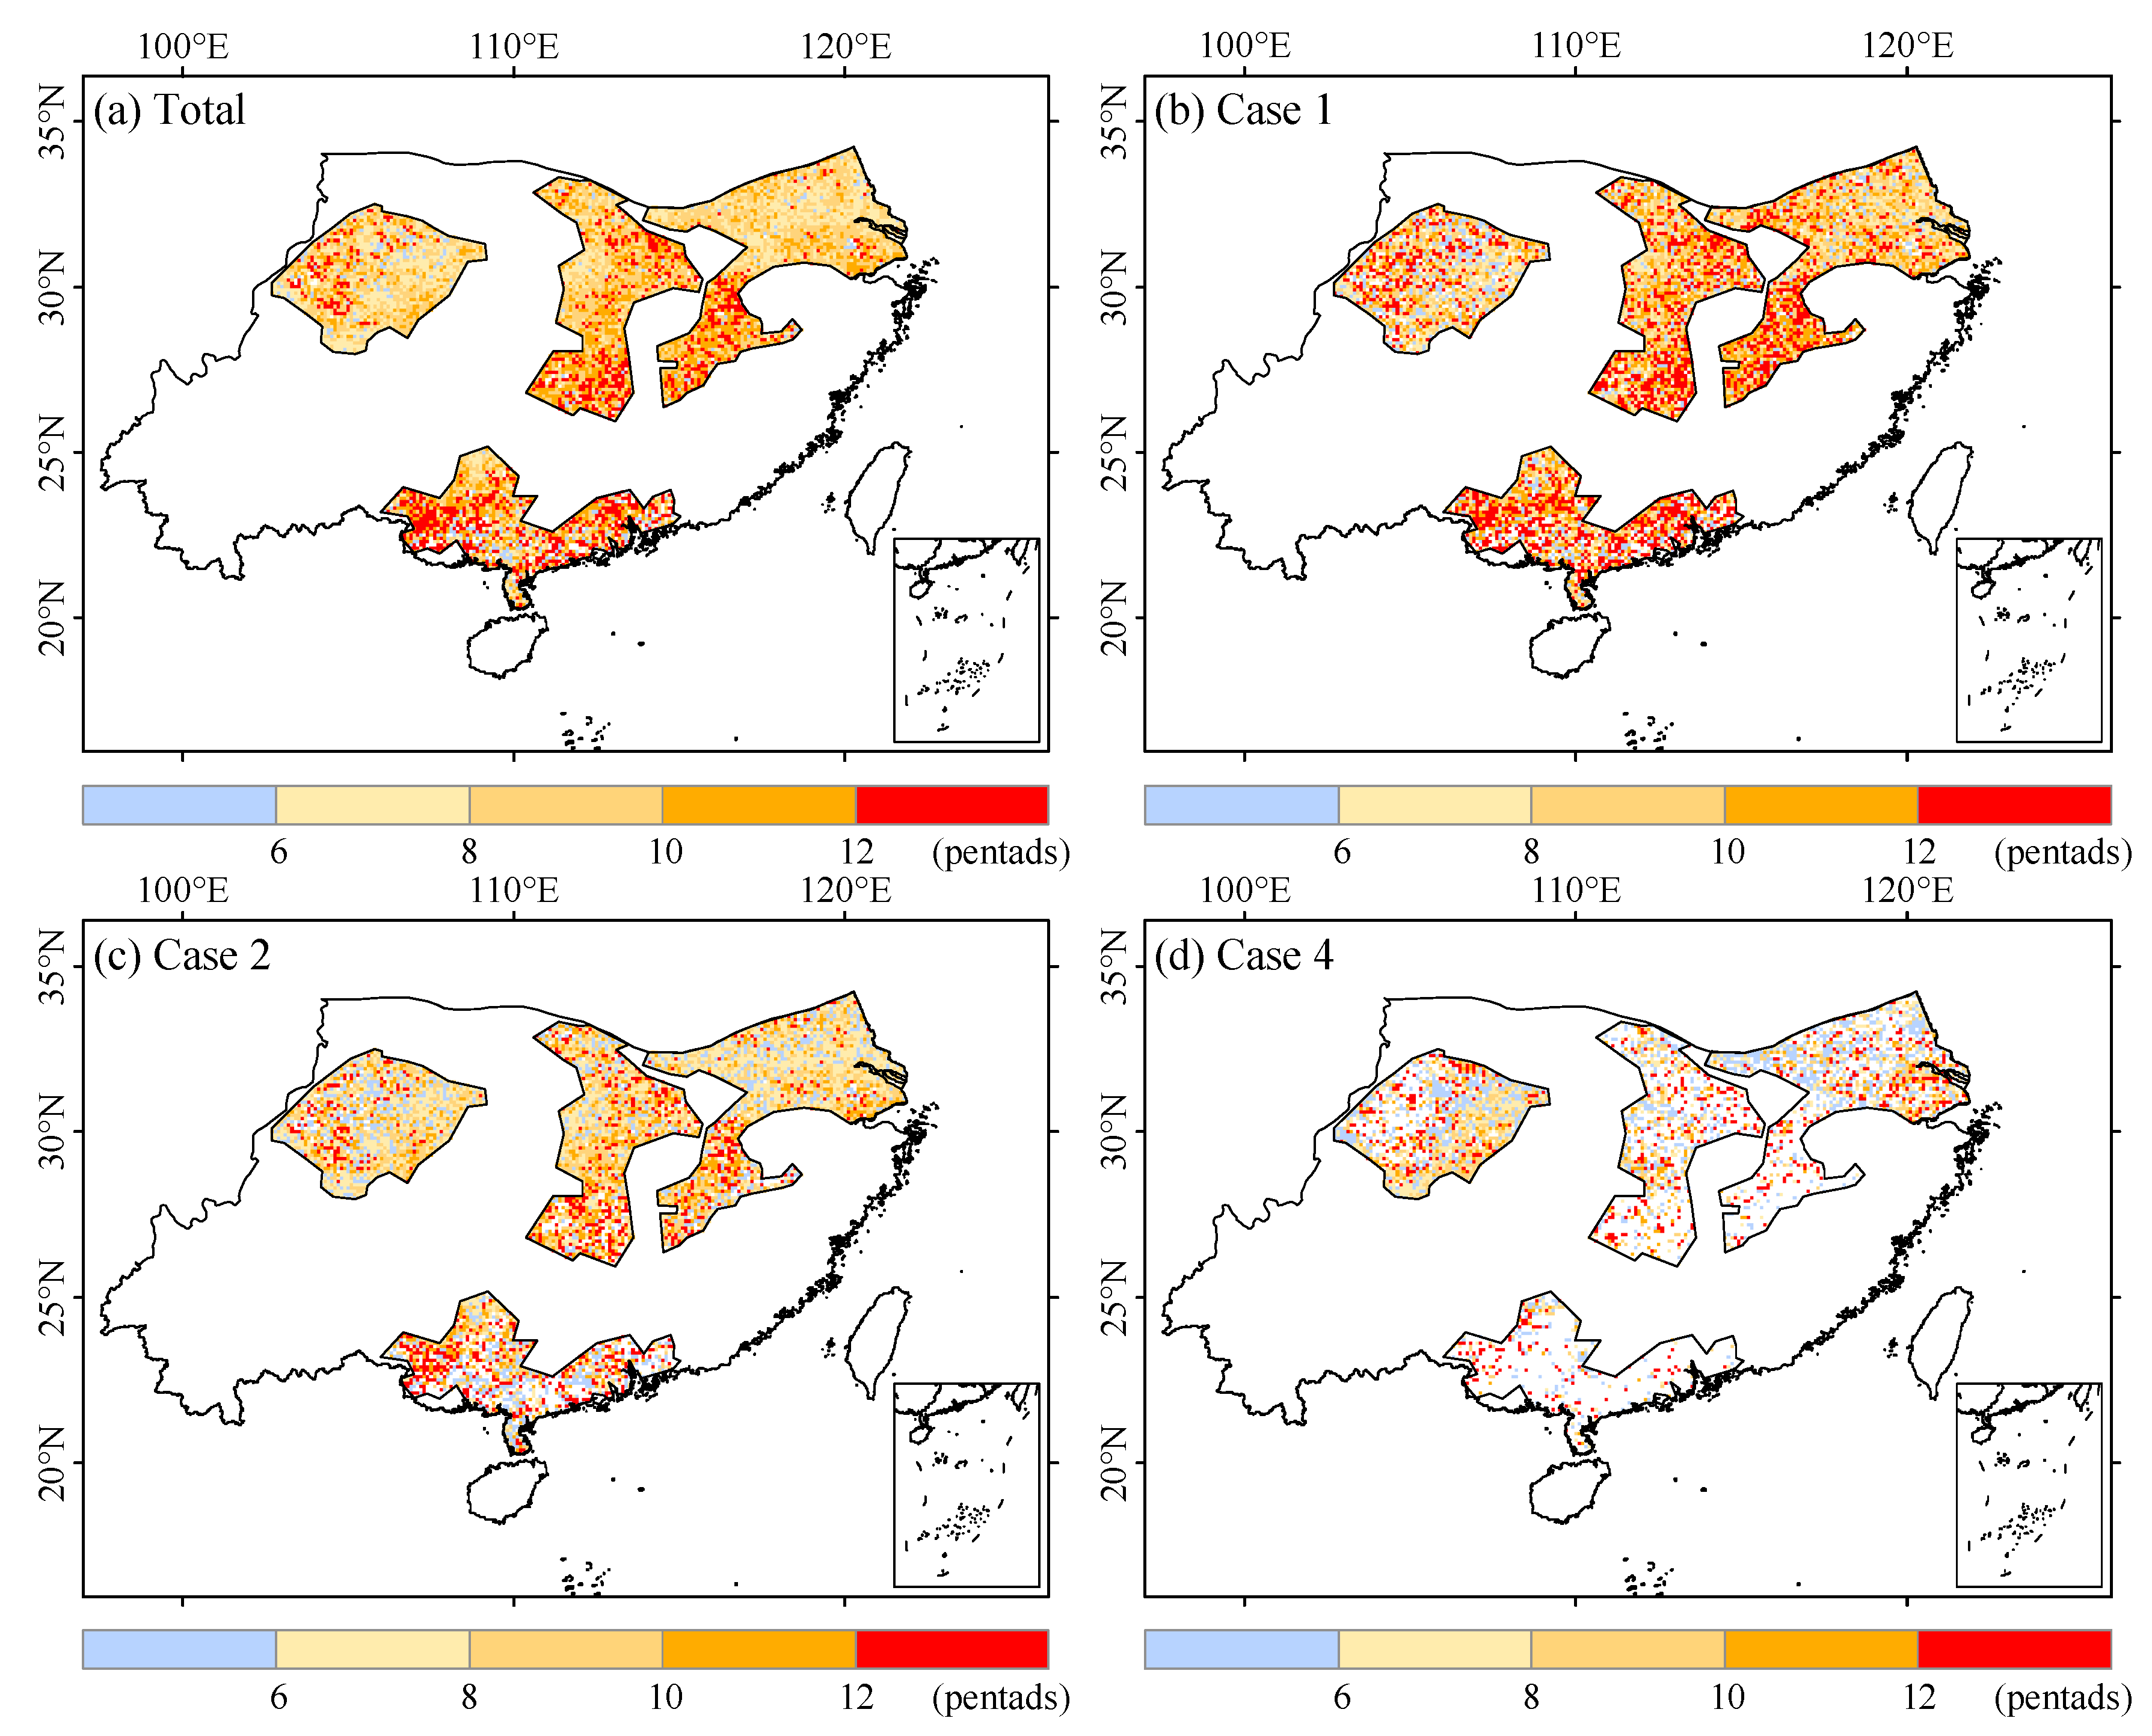
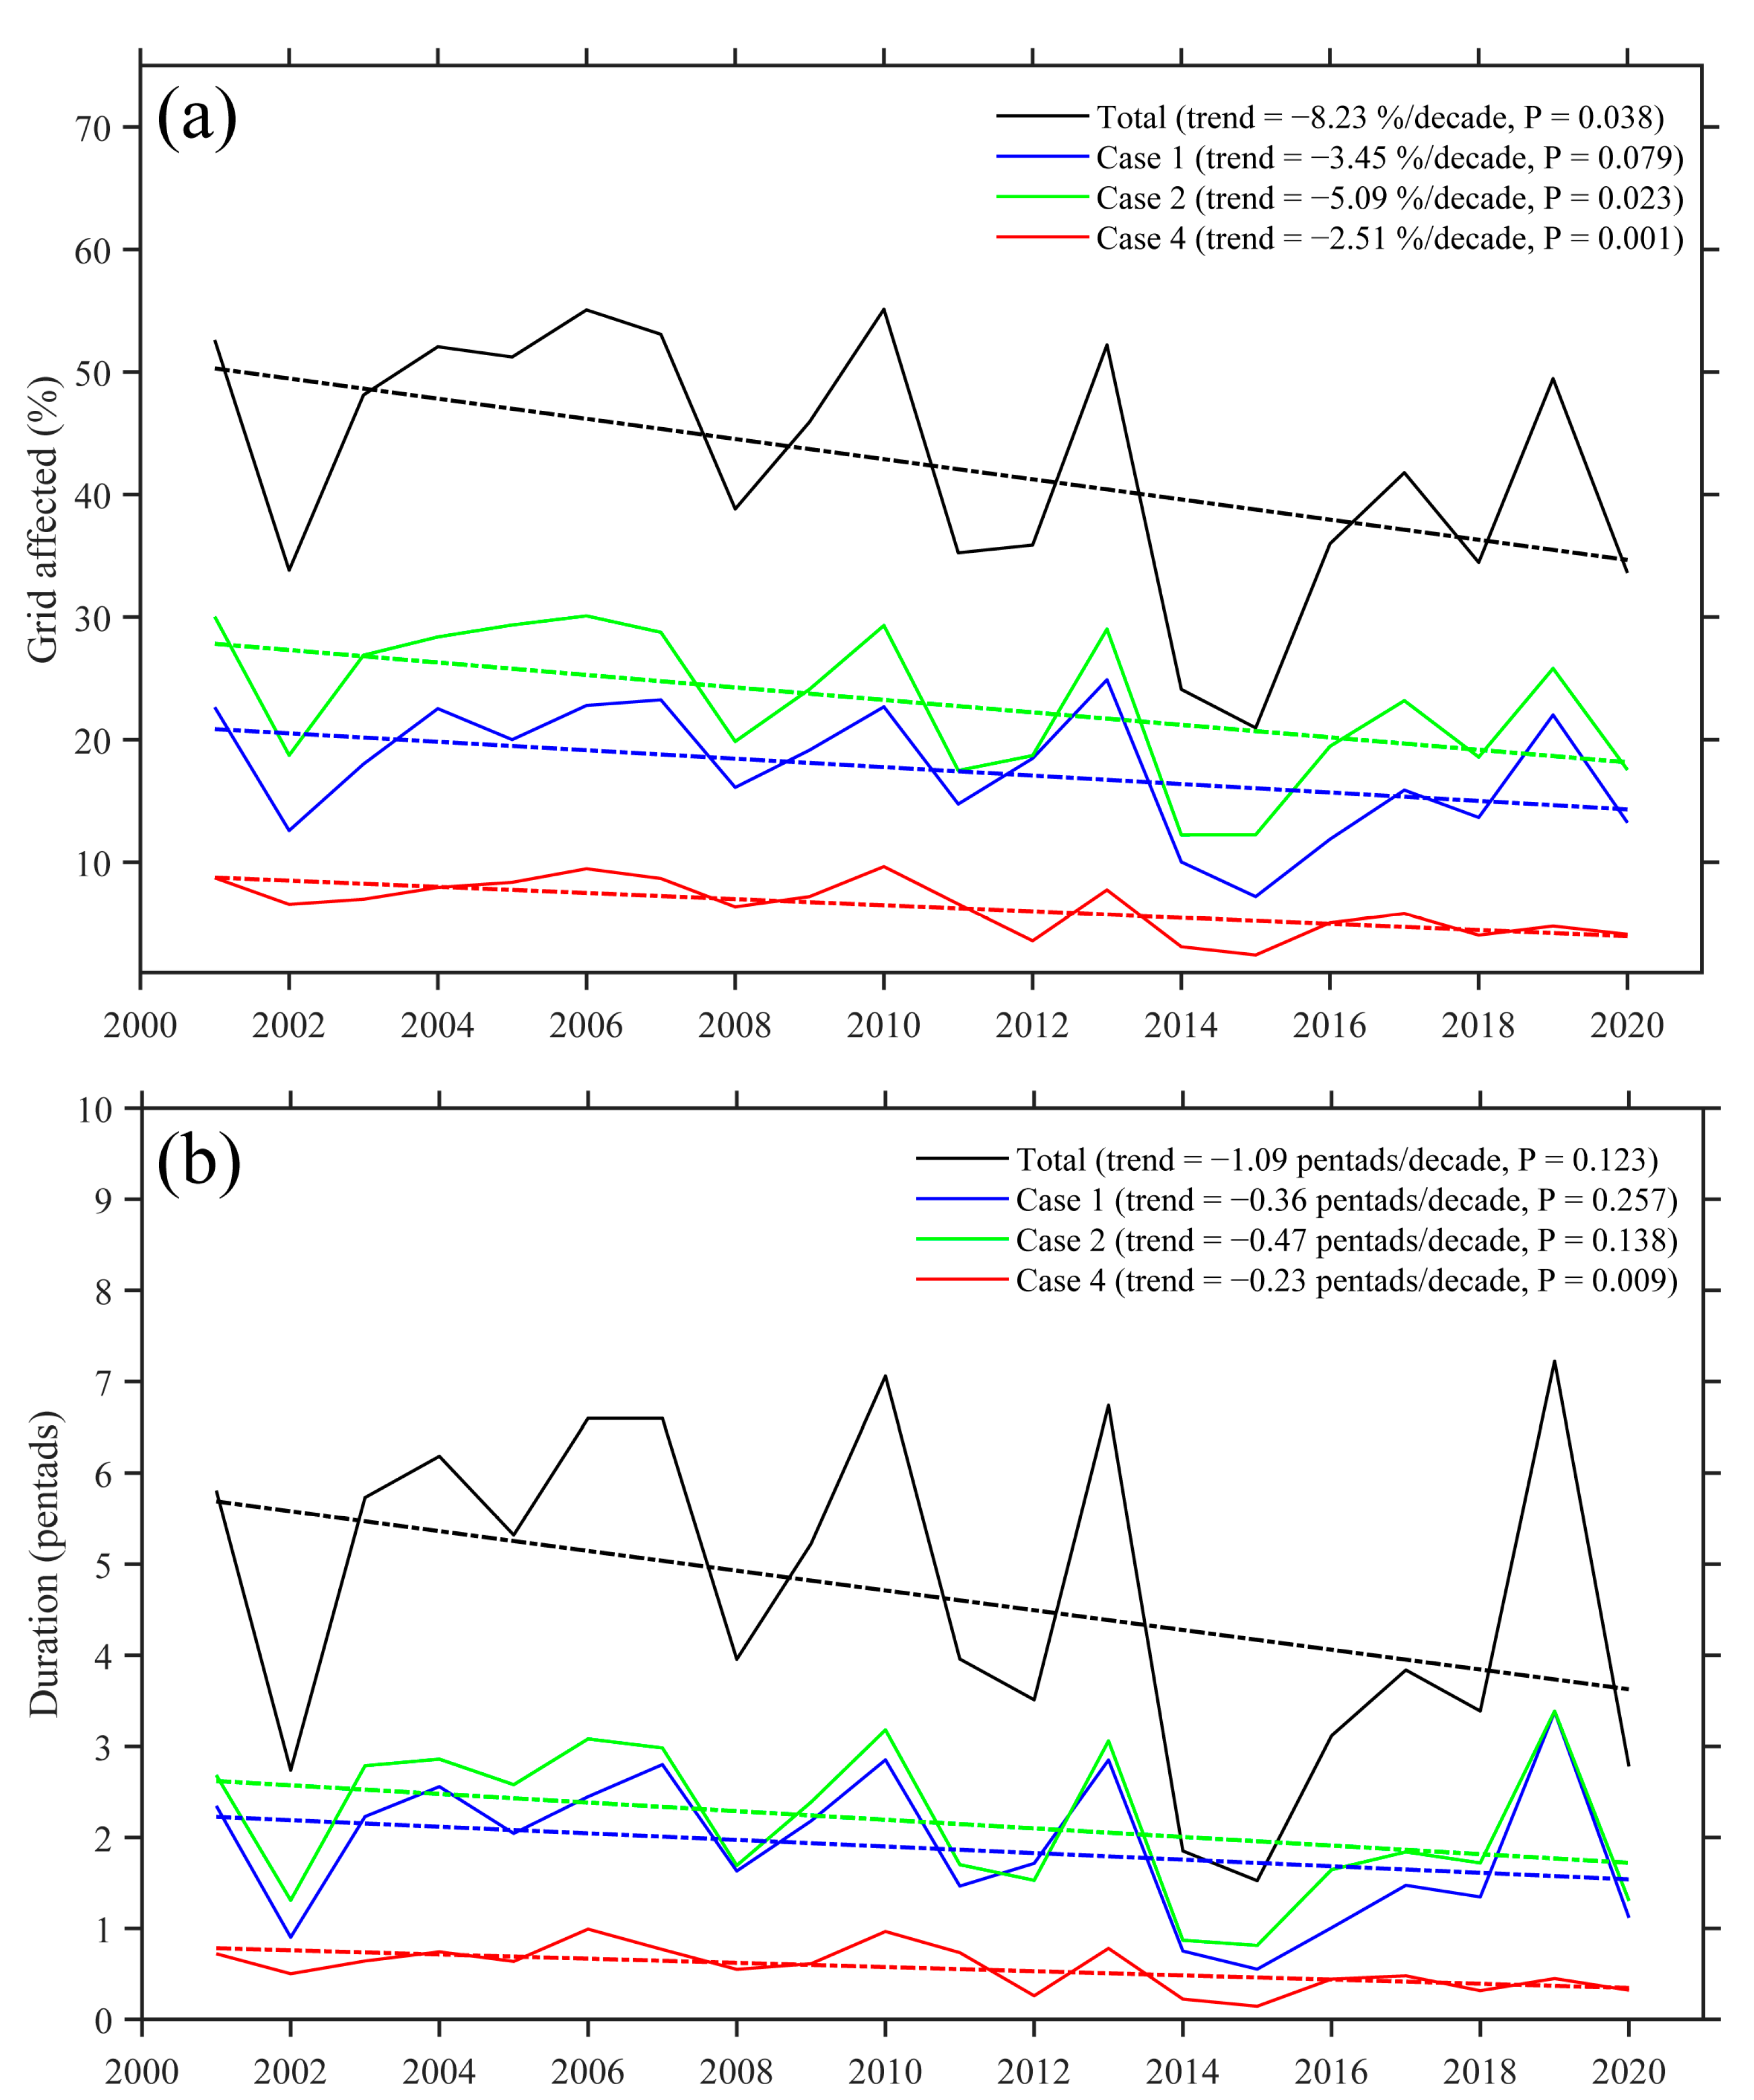
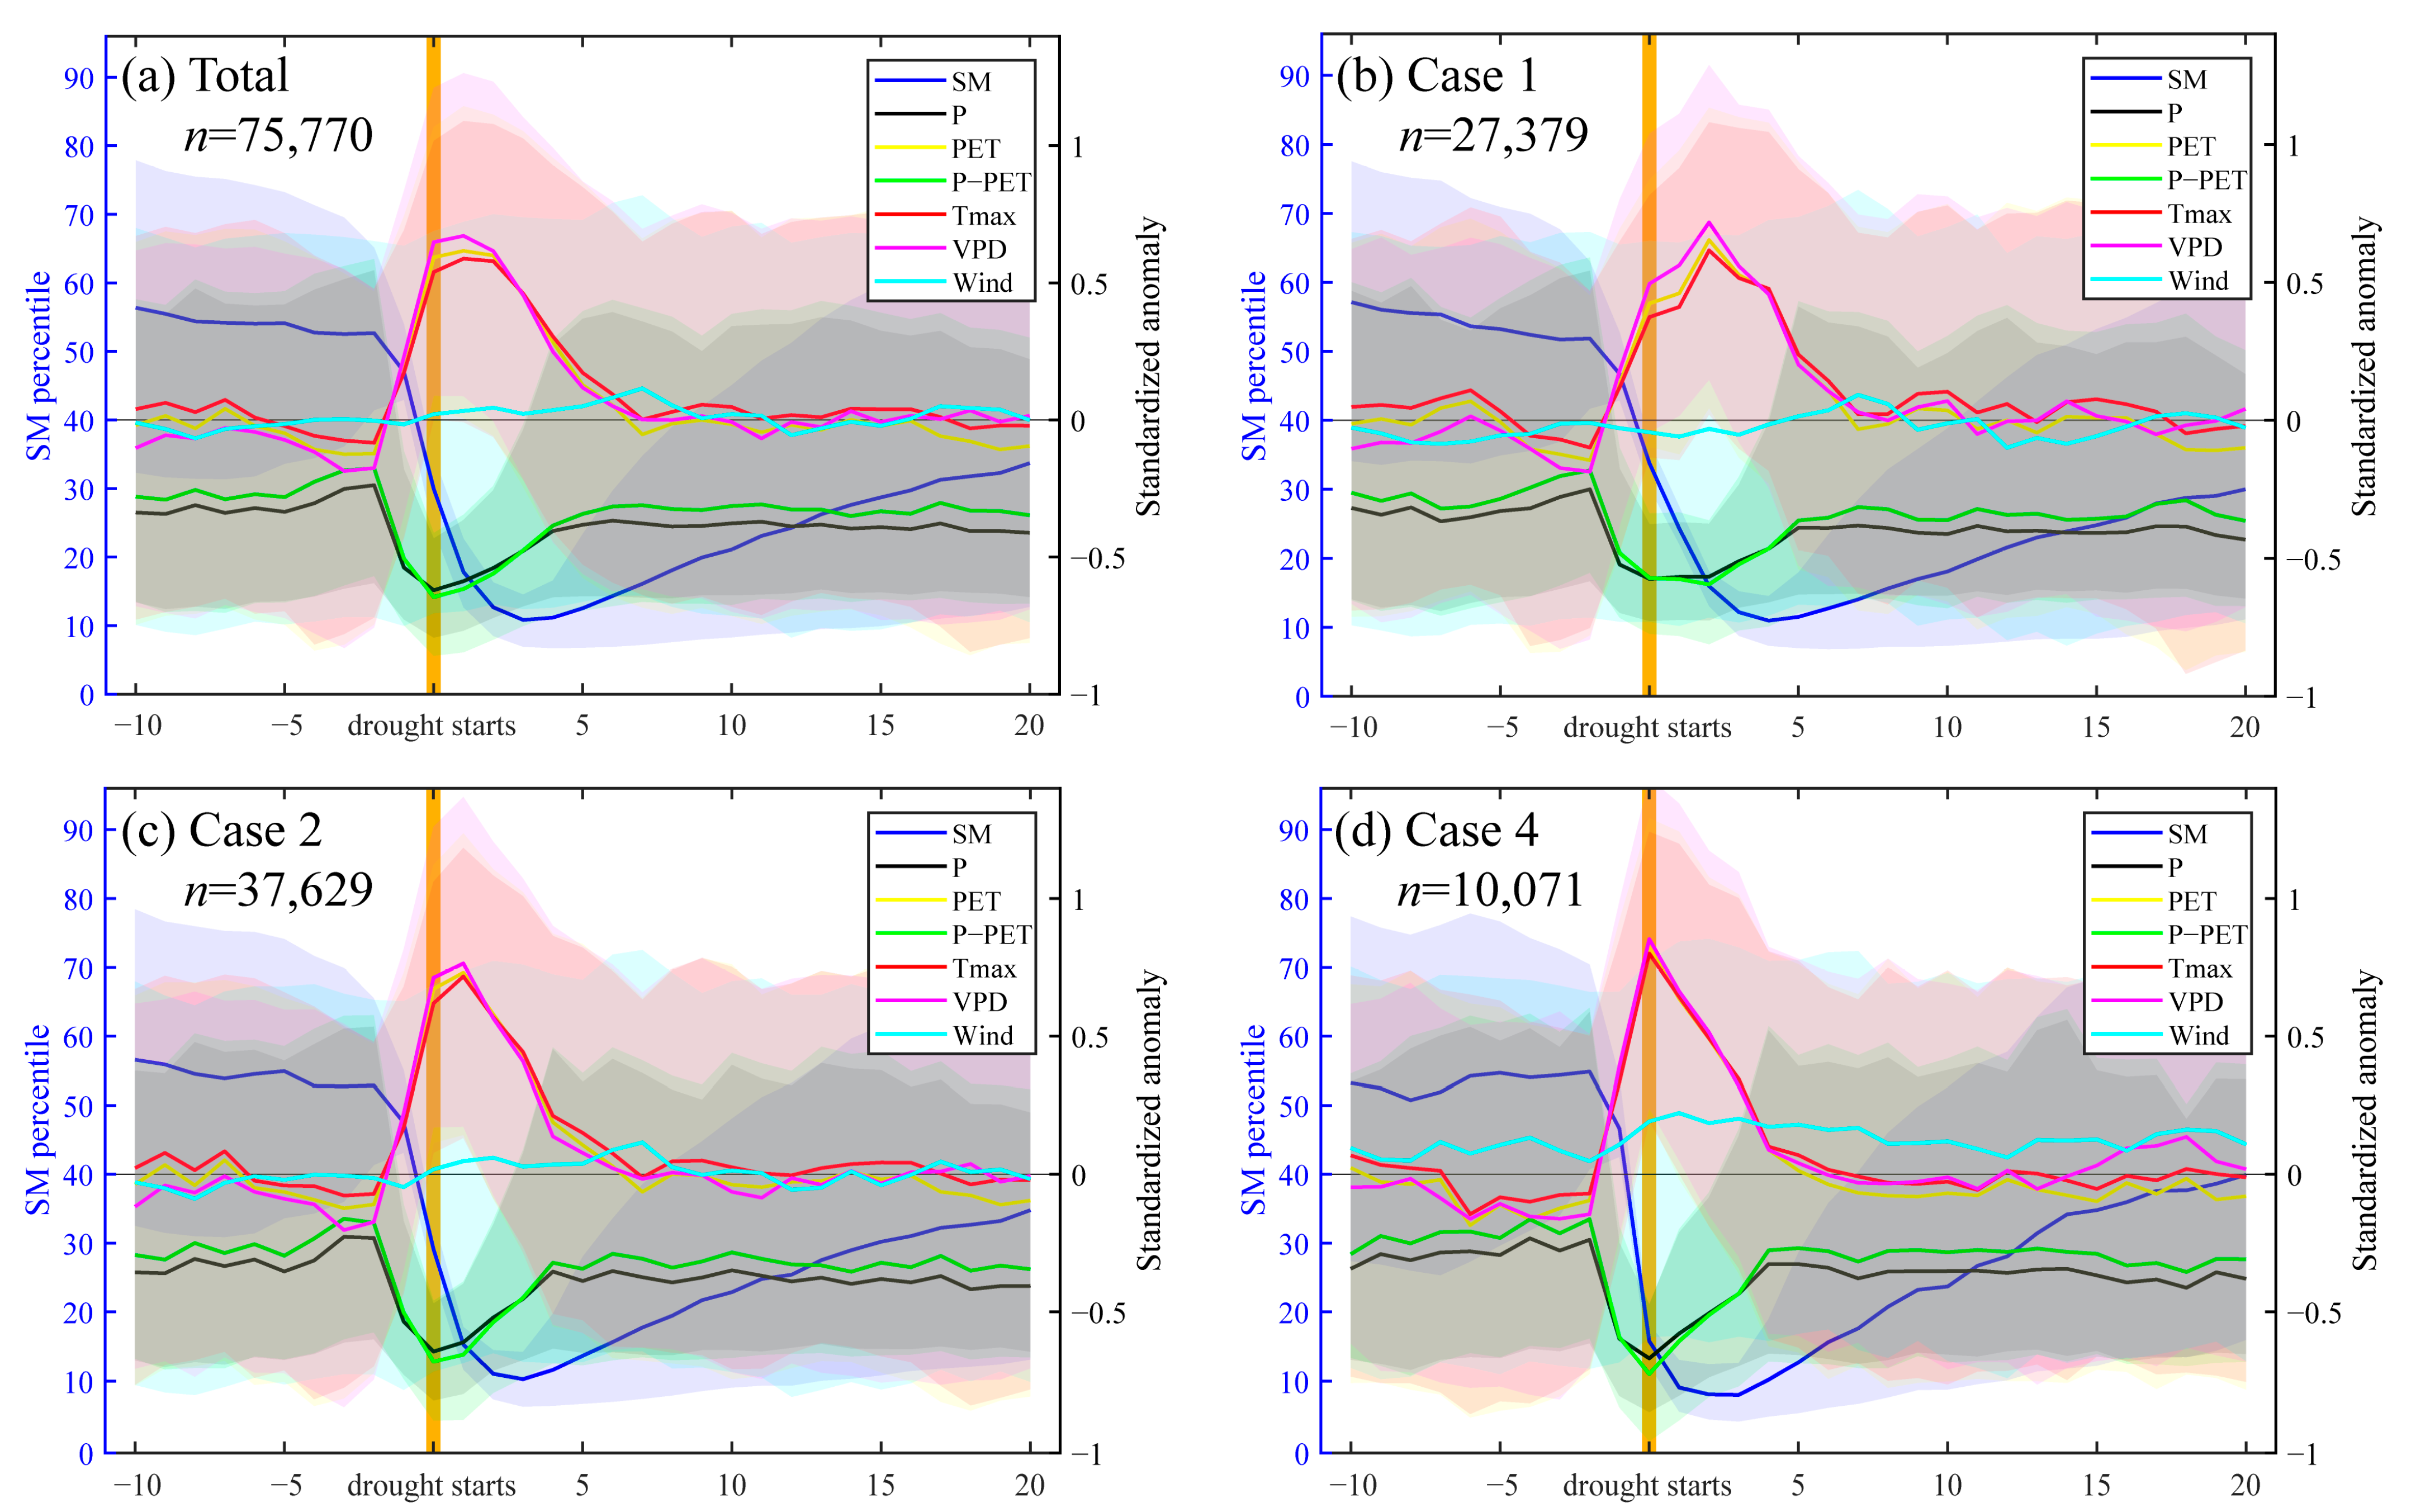
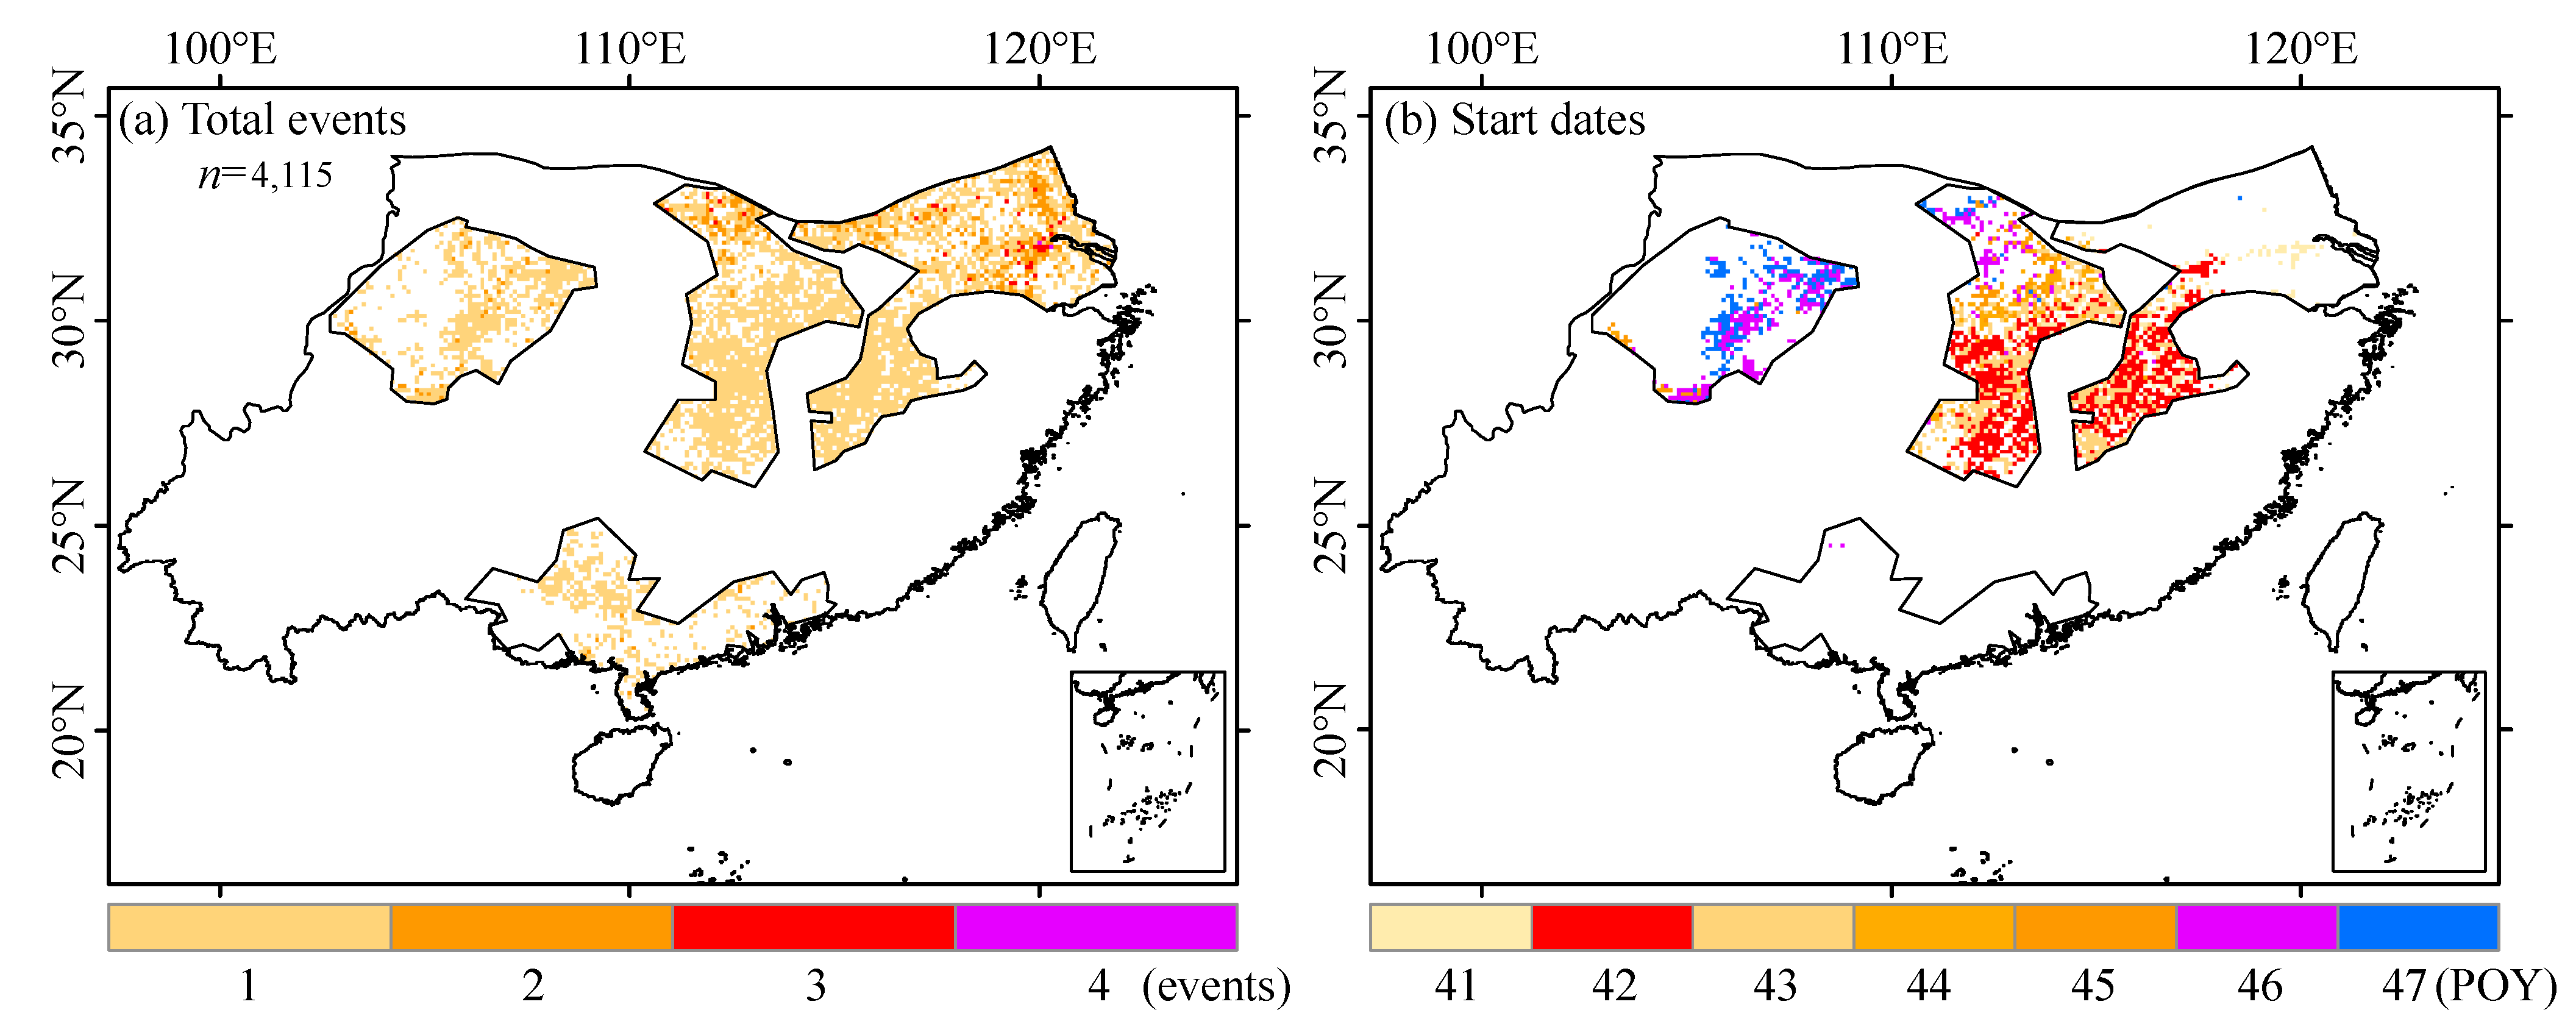
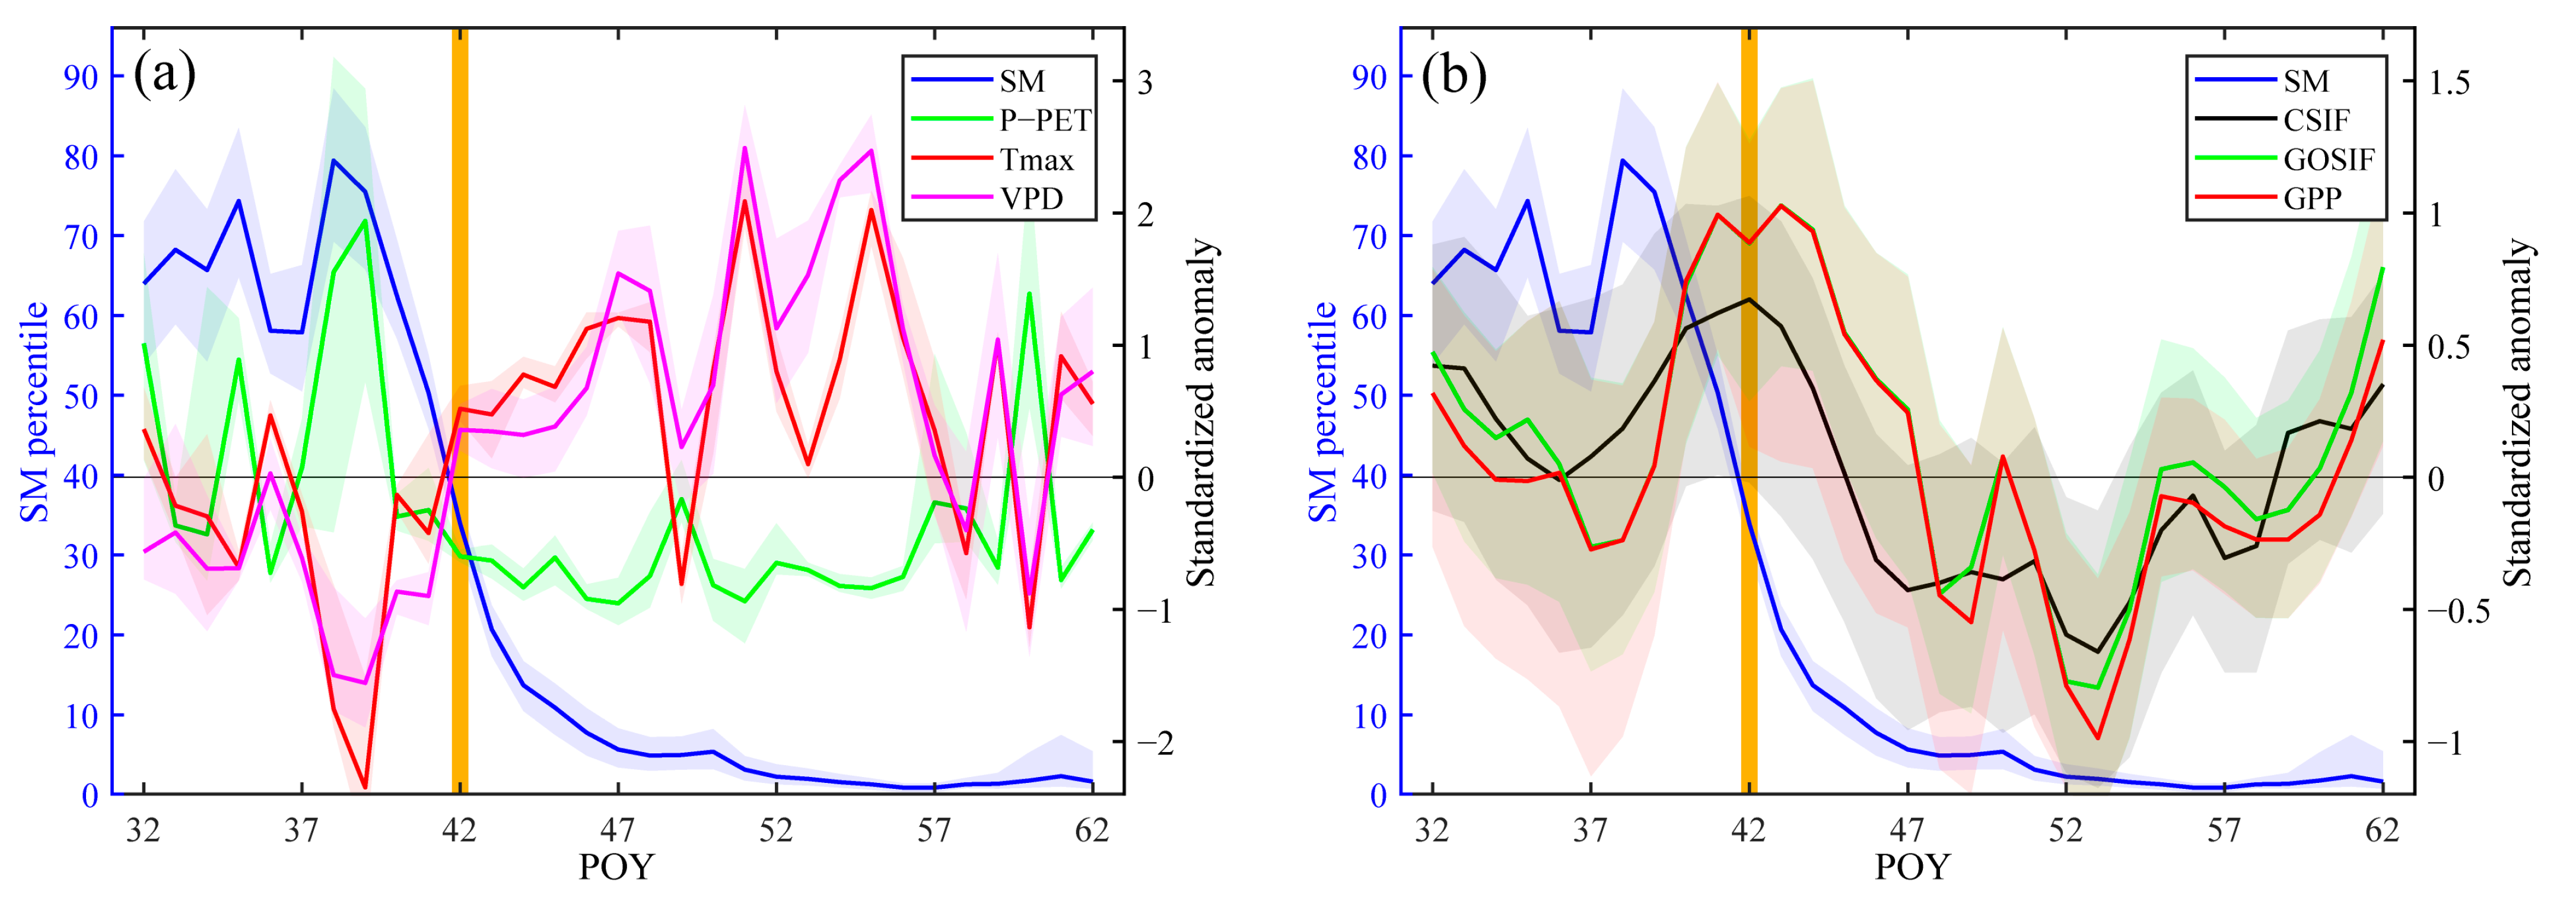
3.1. Flash Droughts and Associated Meteorological Characteristics

The correlation coefficients of the daily SM series from 2001 to 2020 were high between SMCI 1.0 and ERA5 (Figure S1, Supplementary Materials), and were greater than 0.7 in most parts of the study area. Thus, the SMCI 1.0 dataset better reflects the SM characteristics for the study area. The spatial patterns of CSIF, GOSIF, and GPP exhibited fundamental similarities (Figure 4). The values were high in the SCR region, with annual means of GOSIF and CSIF basically exceeding 0.2 mW·m−2·nm−1·sr−1, and annual means of GPP exceeding 4 gC·m−2·d−1. The agricultural regions in the Yangtze River basin (UYR, MYR, and LYR) have annual means of SIF ranging from 0.05 to 0.2 mW·m−2·nm−1·sr−1, and annual means of GPP ranging from 2 to 4 gC·m−2·d−1. The trends of CSIF, GOSIF, and GPP in the study area were relatively similar (Figure S2), with clear greening trends of vegetation in most of the zones.
The total number of flash droughts in the study area was 5–20 events during 2001–2020 (Figure 5a). The total frequency was high (>15 events) in the eastern part of the UYR, the central part of the MYR, and the eastern part of the LYR. We decomposed the total frequency of flash droughts into Case 1, Case 2, and Case 4 events based on the rapidity of drought occurrence. Case 3 events were not analyzed in this study due to very low frequency. Areas with mostly (80%) Case 1 events were mainly in the southern part of the MYR and LYR, and most of the SCR (Figure 5b). Overall, there were fewer Case 2 events than Case 1 events, with proportions mainly in the range of 20–60% in the crop areas of the Yangtze River basin (Figure 5c). Case 4 events accounted for less than 10% in most regions, with a few exceptions of high values in the eastern areas of UYR (Figure 5d).
The average durations of flash drought events were determined by dividing the total durations by the total frequency count. As shown in Figure 6a, the mean durations of total flash drought events were mainly concentrated in 6–12 pentads, and their spatial characteristics were almost inversely distributed with the total frequency characteristics. The mean durations of the Case 1 events were more than 10 pentads in most regions (Figure 6b). The spatial durations of Case 2 events were similar to those of the total events, but the specific values were relatively small (Figure 6c). There were almost no Case 4 events in most of the SCR and in the southern parts of the MYR and LYR, so we used white to indicate the Case 4 durations in these regions (Figure 6d). It is interesting to note that for Case 4 events in most of the UYR, as well as in the central and northern areas of MYR and LYR, their mean durations were concentrated in <6 and >12 pentads, suggesting that these events with the highest rapidity of drought have either very short or very long mean durations.
We next investigated the area proportions of flash drought per year. The area proportion was defined as the number of grids with at least one flash drought event per year divided by the total count of grids across the study area. As depicted in Figure 7a, the proportion of flash drought-affected areas in the main agricultural areas in the southern parts of China showed a significant decreasing trend (−8.23%/decade), consistent with decreasing trends of Case 1, Case 2, and Case 3 events. Relatively large proportions of area with total flash droughts were recorded in 2001, 2004, 2005, 2006, 2007, 2010, 2013, and 2019, accounting for about half of the total grids. The area proportion changes of Case 1, Case 2, and Case 3 events mirrored those of the total events, yet the specific proportion values were notably lower, especially for the Case 4 events. To further verify the reliability of the SMCI 1.0 in identifying the proportion of area with flash droughts, we compared the area proportions of flash droughts using 0–30 cm SM of SMCI 1.0 and 0–28 cm SM of ERA5. Although the area proportions of flash droughts based on ERA5 data were generally higher than those based on SMCI 1.0 (Figure S3), both data show decreasing trends in the area proportions of flash droughts from 2001 to 2020, with consistent changes. Overall, our analysis indicated that the SMC 1.0 has high reliability in recognizing flash droughts. For the extended study period of 1981–2020 (Figure S4), the area proportion of flash droughts based on ERA5 0–28 cm showed a significant upward trend (6.11%/decade), especially for Case 4 events. This suggests high long-term risks of flash droughts in the main agricultural areas of southern China, especially for the most rapidly occurring type of events (i.e., Case 4). The durations of flash droughts (trend = −1.09 pentads/decade, P = 0.123) had a slightly more decreasing trend than the proportion of area during 2001–2020 (Figure 7b). The top three years in the last two decades with long flash drought durations were 2019 (7.22 pentads), 2010 (7.06 pentads), and 2013 (6.74 pentads), indicating severe flash droughts in these years.
The standardized anomalies of precipitation were basically negative during flash drought conditions (Figure 8a), with more pronounced negative values (around −0.3) in the central and southern areas of MYR, the northern areas of LYR, and the central areas of SCR. The standardized anomalies of PET were basically positive under flash drought conditions (Figure 8b), with a range of 0.2 to 0.6, especially in the LYR region. The spatial standardized anomalies of P–PET were similar to those of the precipitation and were basically negative (Figure 8c), mainly ranging from −0.5 to −0.1. The spatial standardized anomalies of Tmax were similar to those of PET (Figure 8d), as expected, since PET was calculated from temperature and latitude information. Under flash drought conditions, the areas with standardized anomalies of VPD greater than 0.6 were significantly larger than the PET (Figure 8e), especially in the LYR and SCR. The standardized anomalies of wind speeds were positive and negative under flash drought conditions in different areas (Figure 8f), with the positive values mainly located in the UYR. The spatial standardized anomalies of these meteorological variables suggest that precipitation deficits and high temperatures tend to lead to enhanced evapotranspiration capacity, which in turn lead to P–PET exhibiting negative anomalies and ultimately tending to induce flash drought events.
To gain a clear understanding of the mechanisms behind flash droughts, we examined the temporal evolutions of meteorological variables associated with drought conditions. During flash droughts, we observed a below-normal water quantity, indicated by P and P–PET, as well as an above-normal evapotranspiration capacity, reflected in Tmax, PET, and VPD (Figure 9a). There was little obvious change in wind speed during the evolution of flash drought, suggesting less effect of wind speed on flash drought in the study area. Precipitation and P–PET generally dropped rapidly to their maximum negative values about two pentads earlier than SM. The evolutionary characteristics of meteorological variables for the Case 1 (Figure 9b), Case 2 (Figure 9c), and Case 4 (Figure 9d) events were similar to those of the total events, but the rapid phase of flash drought and total drought duration slightly differed for the different cases. Evapotranspiration capacity variables (Tmax, PET, and VPD) of Case 4 events during the drought rapid phase increased more rapidly than those of Case 1 and Case 2 events. Compared to Case 1 and Case 2 events, Case 4 events exhibited a slightly faster decrease in water volume (P, P–PET, and SM), with a more pronounced negative peak.

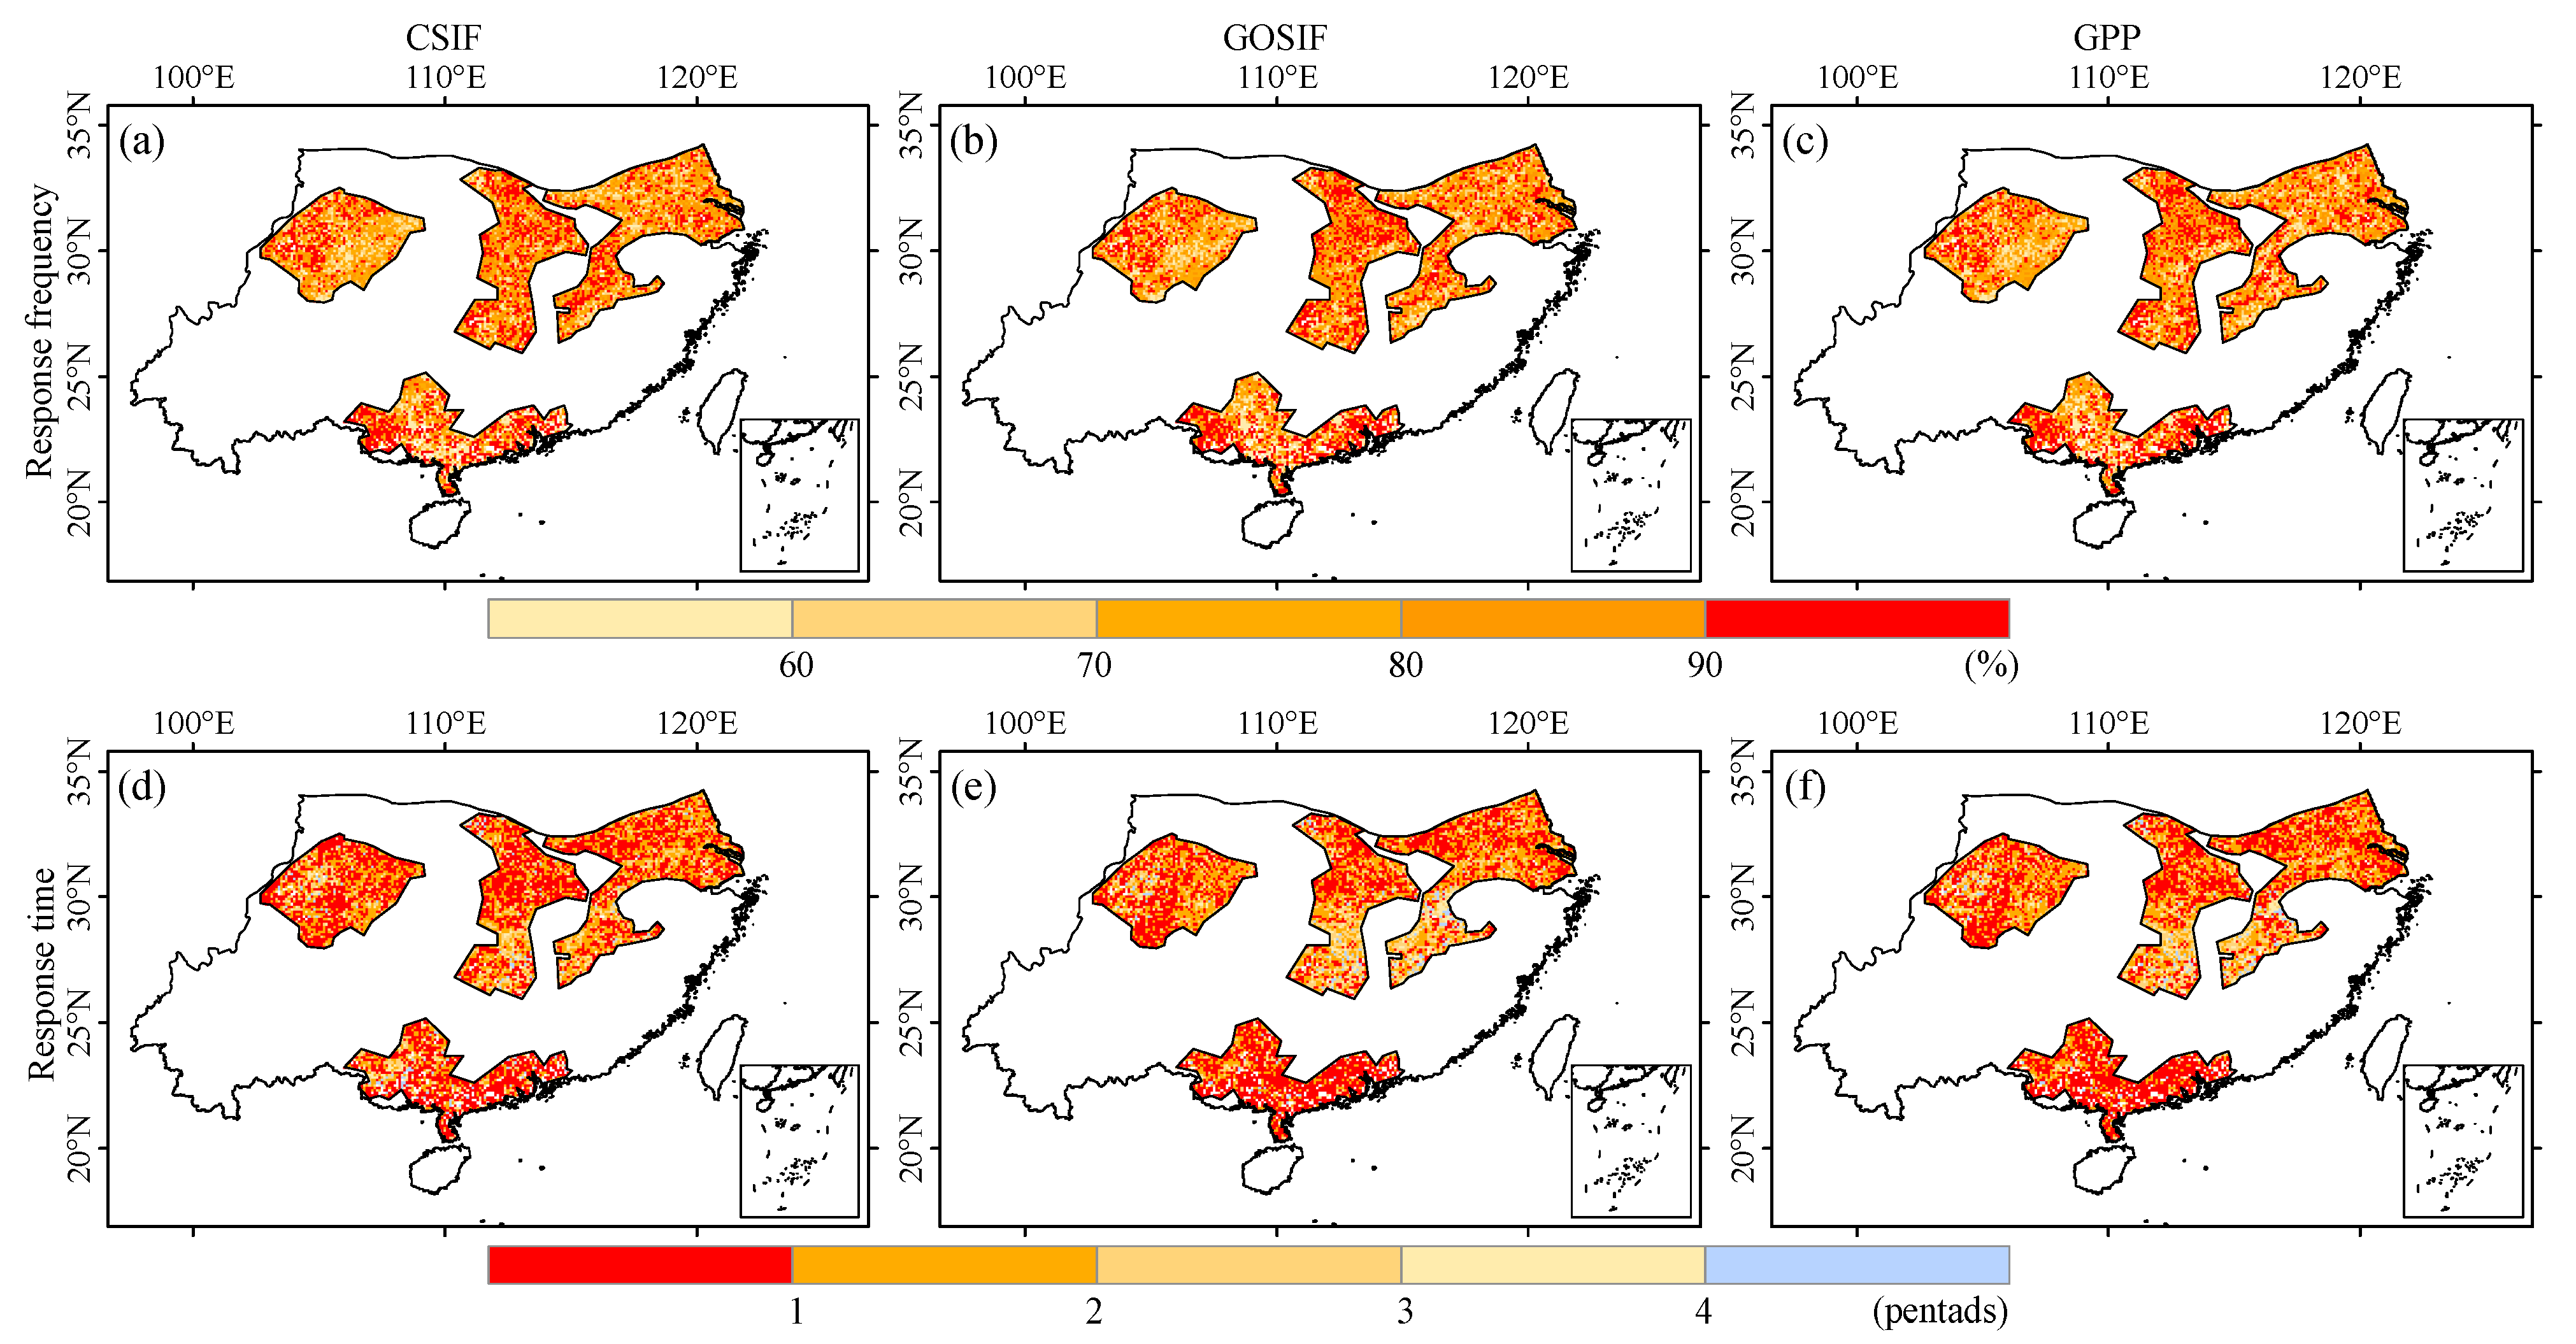
3.2. Response of Vegetation Photosynthesis to Flash Droughts

The spatial distributions of response frequencies of CSIF (Figure 10a), GOSIF (Figure 10b), and GPP (Figure 10c) during flash drought were characterized consistently, and more than half of the grids in the total region had response frequencies above 80%. The response frequency of vegetation photosynthesis capacity reached 90% in the western areas of UYR, the northern and southern areas of LYR, the southern and eastern areas of LYR, and the southwestern and eastern areas of SCR. This result indicates that flash drought can seriously alter crop photosynthesis. The response frequency of vegetation photosynthetic capacity to Case 1, Case 2, and Case 4 events was around 80% for most grids (Figure S5). Although few grids had Case 4 events, more than half of the grids had a response frequency of more than 90%, indicating that the most rapid drought events exhibit more pronounced vegetation response. The spatial distributions of the response time of CSIF (Figure 10d), GOSIF (Figure 10e), and GPP (Figure 10f) to flash droughts were also basically consistent, at generally less than three pentads. Vegetation photosynthesis capacity in most parts of the UYR, the north-central parts of the MYR, the northern regions of the LYR, and most regions of the SCR showed a negative anomaly within one pentad after the onset of flash droughts. This finding suggested that flash droughts in southern China’s agricultural regions can rapidly lead to a decrease in the photosynthetic capacity of crops, thus threatening grain yield. Overall, the response time becomes shorter with an increasing onset rate of flash drought (Figure S6).
CSIF, GOSIF, and GPP showed negative anomalies during the flash droughts in most of the study area (Figure 11). The areas with standardized anomalies of the photosynthetic capacity < −0.5 were primarily concentrated in the northern areas of the MYR and the southwestern and southeastern parts of the SCR, indicating serious effects on the crops in these areas during flash droughts.
According to the temporal evolutions of vegetation photosynthetic capacity during flash droughts (Figure 12), there were basically similar temporal changes of CSIF, GOSIF, and GPP. Prior to the onset of flash drought, the standardized anomalies of vegetation photosynthesis capacity were close to 0 (normal state). When flash drought occurred, SM decreased rapidly, with slower decreases in SIF and GPP than for SM. This reflects a lag effect in the response of vegetation to SM, indicating that vegetation has some drought resistance to low SM. For all flash drought events (Figure 12a), SM reached its lowest value at the third pentad of the flash drought period, and CSIF, GOSIF, and GPP reached their lowest values at about the fourth, seventh, and seventh pentads, respectively. This indicated that CSIF was more sensitive to SM than GOSIF and GPP. For Case 1 events (Figure 12b), SM reached its lowest value at the fourth pentad during the flash drought, and CSIF, GOSIF, and GPP reached their lowest values at about the fifth, seventh, and seventh pentads, respectively. As the onset rate of flash drought increased (Figure 12b–d), the time points at which SM and vegetative photosynthetic capacity were at their lowest values occurred earlier.
For the agricultural regions of the Yangtze River basin, the time for SM to return to normal levels was shorter in the UYR (Figure S7) than in the MYR (Figure S8) and LYR (Figure S9), which resulted in a weaker magnitude of change in the standardized anomalies of the photosynthetic capacity in the UYR compared to that in the MYR and LYR. This also led to a weaker decline in the photosynthetic capacity following the onset of flash drought. The decrease in photosynthetic capacity during flash drought was larger in the SCR than in the three grain-producing regions of the Yangtze River basin (Figure S10), and the persistently large negative anomaly was maintained for a longer period. This suggests that flash droughts in the SCR can quickly drive crop stress, making it difficult for crops to return to normal growth levels.

3.3. Typical Case of 2019 Flash Drought

The impact area was extensive and there was significant duration of flash drought in 2019, so this event was selected for further analysis. As shown in Figure 13a, MYR and LYR were more widely affected by flash drought in 2019. On the grids where flash drought occurred, about 50% of the grids had the start of a flash drought in the 41st–47th pentads (i.e., 20 July–23 August) of 2019 (Figure 13b). The largest proportion of grids experiencing flash droughts started at the 42nd pentad of 2019, and this mainly occurred in the southern parts of the MYR and LYR.
We investigated the temporal changes of meteorological variables and vegetation photosynthesis capacity during a typical flash drought event based on all grids where the flash drought event started at the 42nd pentad of 2019. As shown in Figure 14a, Tmax and VPD rose dramatically in the 1–3 pentads preceding the onset of flash drought. These conditions led to a substantial enhancement in evapotranspiration capacity, ultimately resulting in a sharp decline in P–PET and consequently a rapid depletion of SM. Tmax and VPD exhibited largely positive anomalies during the 42nd–57th pentads of 2019, especially at the 51st and 55th pentads (standardized anomaly as high as nearly 2). Standardized anomaly of P–PET was at nearly −1 for much of the 42nd–57th pentads of 2019. For specific values of meteorological variables, P–PET ranged between −2 and −5 mm for most of the 40th–62nd pentads of 2019 (Figure S11a). Despite a small increase in P–PET at the 60th pentad, which proceeded to cause a slight increase in SM, it was difficult to return to a normal SM state. Tmax was essentially above 32 °C during the 40th–55th pentads of 2019 (Figure S11b), especially the six pentads following the onset of flash drought (reached about 35 °C). The sustained high temperatures resulted in a substantial increase in VPD, with approximately five pentads of VPD as high as 1.5 kPa during this flash drought (Figure S11c). The prolonged high temperatures and high evapotranspiration capacity, as well as the shortage of atmospheric moisture, led to a prolonged period of low SM, which in turn increased the severity of this flash drought.
Photosynthetic capacity of vegetation generally reached negative anomalies with a lag of roughly 3–5 pentads in response to the 2019 flash drought (Figure 14b). Standardized anomalies of CSIF, GOSIF, and GPP were largely negative during POY 46–58 of 2019, peaking at negative anomalies (below −0.5) at the POY 53. Overall, CSIF showed less variability than the GOSIF and GPP, but was more sensitive to drought conditions than both the GOSIF and GPP. Around POY 60, a slight increase in precipitation resulted in improved growth (elevated standardized anomalies), but specific vegetation photosynthetic capacity remained at low levels (Figure S11d–f). Overall, 2019 flash drought events severely inhibited the growth of crops in the study area, resulting in a huge grain yield reduction.

4. Discussion

Serious precipitation deficits and high evapotranspiration capacity force a rapid decline in SM, triggering flash droughts, which in turn cause rapid declines in the photosynthetic capacity of crops (Figure 15). Flash droughts can occur within a few weeks, limiting the time available for early warning of droughts and the effective implementation of mitigation measures [12,20,76]. Previous studies attempted to estimate the reduction in GPP or SIF during flash droughts at the national scale or basin scale [8,37]. However, there was little investigation of the dynamic characteristics of crop photosynthesis during flash droughts, especially in agricultural areas with humid climate attributes. For this reason, we focused on the characteristics of SM-derived flash droughts in the agricultural areas of southern China in the past two decades and assessed the impacts of these events on the photosynthetic capacity of crops via high-resolution SM and SIF datasets.
The SIF values showed upward trends in the study area during 2001–2020, indicating that the crops in these regions grew better in the last two decades, allowing increased agricultural production. This finding of increased grain yields is similar to that of Pan, et al. [77], who analyzed China’s county-level grain production and found that the counties with faster average annual growth rates are mainly located in the Northeast China Plain, Huang-Huai-Hai Plain, and Middle-Lower Yangtze Plain regions. Kuttippurath and Kashyap [78] found that croplands and forests made the largest contributions to vegetation greening in India during 2000–2019, a finding that is similar to the greening of agricultural areas in southern China. Despite China encompassing only 6.6% of the world’s vegetated area, it contributes a notable 25% to the global expansion of green leafy areas. Forests and croplands contributed 42% and 32%, respectively, to the greening of vegetation in China [79]. The enhancement of vegetative greenness in agricultural regions of southern China may be related to the increase in temperature and P–PET.
In dry and hot environments, water is the main limiting factor for plant growth and photosynthesis, and increased carbon dioxide (CO2) concentration can increase the efficiency of water use by vegetation (CO2 fertilization effects). Therefore, elevated atmospheric CO2 concentration is an important driver of vegetation greening [80,81]. However, under compound heatwaves and droughts, even if the atmospheric CO2 concentration increases, the stomatal conductance of the vegetation decreases due to anomalous water scarcity, thus inhibiting vegetation photosynthesis [82]. Under climate warming, there are distinctly upward trends observed in hot and dry extremes, including compound heatwaves and droughts [83,84]. The increases in these extreme events favor the occurrence of flash droughts, which are predicted to continue to rise in the future [18,85]. Enhanced compound hot and dry events over agricultural areas (croplands) can increase risks of crop damage in adjacent areas [86,87]. Simultaneous occurrence of flash droughts increased in global major croplands under climate warming [49]. However, there is a lack of quantitative studies on the impacts of flash drought co-concurrence on the photosynthetic capacity of vegetation in agricultural areas, especially under future high-emission scenarios.
In this study, the definition of flash droughts incorporated the swift determination of SM towards drought conditions, along with the SM thresholds associated with drought categories, so a sufficiently long period of water deficits adversely affects the ecosystem. The hotspots of flash droughts were located primarily in the eastern parts of the UYR, with the most rapid type (Case 4 events) accounting for a high percentage (about 50%) of the total events in this region. This is primarily due to the anomalously strong western Pacific Subtropical High, a large-scale anticyclonic circulation that significantly influences the weather and climate in East Asia, resulting in heatwaves [88] that can quickly deplete SM and cause flash droughts, resulting in crop damage.
Flash droughts with longer average durations occurred in the southern parts of the MYR and LYR, and about half of the SCR. These areas are susceptible to prolonged control by the subtropical high, making flash droughts last longer [20]. The analysis showed an overall decreasing trend in flash droughts in the study area from 2001 to 2020. This conclusion is similar to the findings of previous studies [20,21]. When the study period was extended forward by two decades (1981–2020), flash droughts in the agricultural areas of southern China showed an upward trend. Our results are similar to the findings of previous publications [18,89]. Anthropogenic warming may accelerate hydrological cycle processes and increase the risk of precipitation whiplash events [66,90], which may increase the probability of flash droughts. Yuan, et al. [91] emphasized the risk of a long-term increase in flash drought frequency may still exist under climate warming in China. El Nino-Southern Oscillation (ENSO) can highly influence precipitation volatility [90], which governs the long-term changes in precipitation, PET, and VPD in southern China, which are crucial factors in the occurrence of flash droughts. An elevated frequency of El Nino can increase the risk of flash drought co-concurrence in global major croplands [49]. The influence of ENSO on flash droughts in major agricultural regions of southern China under different emission scenarios in the future will require further in-depth investigation.
During the SM-derived flash drought, P and P–PET showed rapid downward trends prior to the SM. Tmax, PET, and VDP were similarly variations, with roughly opposite changes to the SM under SM-derived flash drought. These results demonstrate that it is feasible to use simple water balance (P–PET) and evaporative stress ratio (ESR) to identify flash droughts [18,92,93]. Both historical and future high-resolution SM data are difficult to obtain, especially in soils with deep crop roots (about 50 cm depth). Both P–PET and ESR can identify flash droughts, but the actual evapotranspiration in ESR is more difficult to obtain and varies widely between algorithms. Surface SM and root zone SM lagged behind P–PET by 1–2 pentads and 2–3 pentads, respectively, under conditions of P–PET-derived flash droughts [18]. This suggests the feasibility of early warning for flash droughts stemming from SM depletion. P–PET-derived flash droughts are capable of capturing the rapid drought intensification that leads to SM depletion and drought impacts. Therefore, future work should examine P–PET-derived flash drought impacts on crop SIF, especially for different emission scenarios.
Vegetation relies mainly on SM for water uptake, affecting transpiration, stomatal conductance, and stem–water dynamics [8,94]. Rapid declines in SM can reduce stomatal conductance to prevent additional water loss [95]. At the same time, the rate of carbon dioxide diffusion into the plant leaves can decrease, resulting in weakened overall plant photosynthesis capacity with a decrease in SIF. The average response frequency of SIF in major agricultural areas in southern China was above 80% during flash drought, and the average response time was within two pentads. The high response frequency of SIF implies that crops are more sensitive to flash droughts and cannot tolerate a rapid decline in SM to a drought condition that lasts for several weeks. Although flash droughts do not affect the vegetation in humid regions as severely as in dry regions due to the longer duration of water stress in the arid zone, these events can cause irreversible damage to crop yields, even in the SM recovery phase. The relationship between fluorescence and photosynthesis is altered under enhanced water stress due to environmental changes [37]. This complex relationship needs to be further explored to better understand the response characteristics of SIF to the evolution of flash drought.
A unique perspective of this study is the use of high-resolution SM and SIF datasets. SMCI 1.0 provides daily high-resolution SM data with 10 cm intervals up to 100 cm (10 layers), incorporating a large number of in situ SM and reanalysis data using a machine-learning approach [55]. We applied the top five layers (0–50 cm) of SM to identify flash droughts. This can reasonably reflect the impact on crops, since most crops grown in southern China have their major root systems within 50 cm [74,75]. CSIF and GOSIF are derived by fusing MODIS and carbon satellite observations using a deep learning approach [36,38], and can robustly reflect the impacts of flash droughts on crop growth. To maintain consistency with the spatial resolution of SM, the SIF was resampled to 0.1°, although this may increase the uncertainty of the impacts of flash droughts on SIF.

5. Conclusions

Flash droughts can cause a rapid SM depletion, which can limit the ability of crops to adjust their physiological activities in a timely manner, ultimately posing a serious threat to food security. Therefore, there is an urgent need to investigate the characteristics of flash droughts in agricultural areas and the consequences of these droughts on crop photosynthetic capacity. Southern China’s agricultural regions are vital for both the livelihoods of a large population and economic output. Further research on the high risk of flash droughts in this region is needed to provide crucial early warning information to protect agricultural production and the associated economy. This study explored the characteristics of flash droughts and their impacts on SIF in the agricultural regions of southern China from 2001 to 2020 using high-resolution datasets for SM and SIF. The main conclusions are as follows:
(1) The southern areas of agricultural regions exhibited relatively high SIF values. This may be attributed to the relatively abundant P–PET and SM. The general upward trends of SIF in most regions of the study area indicate that crop growth improved in these regions during the last two decades, contributing favorably to agricultural yield increases. The increase in SIF is mainly due to increases in temperature, P–PET, and SM, with sufficient water and heat resources for the growth of crops.
(2) The hotspots of flash droughts were located primarily in the eastern parts of the UYR and LYR, with a high percentage of the most rapid category events (Case 4 events) in these regions. The average duration of flash droughts in the southern agricultural region was 6–12 pentads, long enough to exert adverse effects on crops. Although there was a decreasing trend in flash droughts from 2001 to 2020, generally increasing trends were observed in the extended study period from 1981 to 2020. This suggests that the southern agricultural regions remain vulnerable to flash droughts under long-term climate warming. Additionally, P–PET provides a relatively effective early warning signal for SM-derived flash droughts (agricultural type), which should facilitate the identification of meteorological flash droughts.
(3) Crops in the southern agricultural region exhibited a notably negative response to flash droughts. The response frequency of SIF was basically more than 80% and the response time was basically within two pentads. This result implied that flash droughts present a great threat to crops in the study area, as there is not sufficient time to take mitigation measures. In late July 2019, severe flash drought occurred in the southern agricultural zones, especially in the MYR and LYR regions. This drought was triggered by a rapid decline in P–PET and a rapid increase in Tmax (VPD), ultimately leading to a rapid depletion of SM. Consequently, this drought caused a rapid decline in the photosynthetic capacity of crops in the affected region, resulting in a significant reduction in food production.
Overall, SIF exhibits promising advantages in terms of vegetation response to flash droughts. The cumulative and lagged effects on ecosystems as flash droughts evolve into prolonged droughts need to be explored in depth in the next study. The results of this study may provide great potential for leveraging SIF as a tool to monitor ecosystem resistance against flash droughts, thereby enhancing the ability to assess the potential impacts of droughts on ecosystems and develop appropriate countermeasures for different vegetation types under different climatic characteristics. In agricultural regions with hotspots of flash droughts, there should be a prioritizing of crop varieties that exhibit robust resistance to flash droughts to optimize the regional cropping structure, thereby enabling resilience against the adverse effects of drought. Furthermore, enhancing water utilization efficiency within agricultural areas and implementing water-conserving irrigation practices are strategic measures aimed at mitigating the detrimental impacts of flash droughts on crop health and productivity.

Supplementary Materials

The following supporting information can be downloaded at: https://www.mdpi.com/article/10.3390/atmos15080886/s1, Figure S1. (a) Correlation coefficients between daily SM of 0–10 cm for SMCI1.0 and daily SM of 0–7 cm for ERA5, (b) correlation coefficients between daily SM of 0–30 cm for SMCI1.0 and daily SM of 0–28 cm for ERA5, and (c) Correlation coefficients between daily SM of 0–100 cm for SMCI1.0 and daily SM of 0–100 cm for ERA5; Figure S2. Spatial trends of (a,b) CSIF, (c,d) GOSIF, and (e,f) GPP during 2001–2020. Significance tests were conducted using p < 0.1; Figure S3. Annual changes in area proportions of flash droughts based on (a) ERA5 with 0–28 cm SM and based on (b) SMCI1.0 with 0–30 cm SM; Figure S4. The area (grid) proportions of flash droughts based on 0–28 cm SM of ERA5 data during 1981−2020; Figure S5. Response frequency of CSIF, GOSIF, and GPP to Case 1, Case 2, and Case 4 flash droughts in the main southern agricultural areas of China during 2001−2020; Figure S6. The same as Figure S5 but for the response time; Figure S7. Temporal evolution of CSIF, GOSIF, and GPP during flash droughts for (a) total, (b) Case 1, (c) Case 2, and (d) Case 4 events in the UYR during 2001−2020. In each subplot, the left y-axis of represents the SM percentile, whereas the right y-axis denotes the standardized anomalies of the vegetation indices. Lines indicate the median values, and shading denotes the interquartile range. Additionally, the total number of flash drought events at the grid scale is labeled as “n”; Figure S8. The same as Figure S7, but for the MYR; Figure S9. The same as Figure S7, but for the LYR; Figure S10. The same as Figure S7, but for the SCR; Figure S11. Temporal evolution of (a) P–PET, (b) Tmax, (c) VPD, (d) CSIF, (e) GOSIF, and (f) GPP during 2019 flash droughts in the main southern agricultural areas of China. In each subplot, the left y-axis of represents the SM percentile, whereas the right y-axis denotes the standardized anomalies of the vegetation indices. Lines indicate the median values, and shading denotes the interquartile range. A total of 727 grids had a flash drought start in the 42nd pentad of 2019. POY: pentad of year.

Author Contributions

Conceptualization, Y.Z.; methodology, Y.Z., F.L. and T.L.; software, Y.Z. and F.L.; validation, F.L. and Y.Z.; formal analysis, Y.Z. and F.L.; investigation, F.L. and T.L.; data curation, Y.Z. and T.L.; writing—original draft preparation, Y.Z.; writing—review and editing, Y.Z. and C.C.; visualization, F.L. and Z.L.; supervision, C.C.; funding acquisition, Y.Z. All authors have read and agreed to the published version of the manuscript.

Funding

This study was jointly supported by the MOE (Ministry of Education in China) Project of Humanities and Social Sciences (19YJCZH259), and the National Natural Science Foundation of China (41907384), and the Qinglan Project funded by universities in Jiangsu Province (2023).

Institutional Review Board Statement

Not applicable.

Informed Consent Statement

Not applicable.

Data Availability Statement

The data that support our research findings are available from the corresponding author on request. The data are not publicly available due to privacy.

Acknowledgments

We are very grateful to the anonymous reviewers for their constructive comments and thoughtful suggestions.

Conflicts of Interest

The authors declare no conflict of interest.

References

  1. IPCC. Summary for policymakers. In Climate Change 2021: The Physical Science Basis. Contribution of Working Group I to the Sixth Assessment Report of the Intergovernmental Panel on Climate Change; Masson-Delmotte, V., Zhai, P., Pirani, A., Connors, S.L., Péan, C., Berger, S., Caud, N., Chen, Y., Goldfarb, L., Gomis, M.I., et al., Eds.; Cambridge University Press: Cambridge, UK, 2021. [Google Scholar]
  2. Wan, L.; Bento, V.A.; Qu, Y.; Qiu, J.; Song, H.; Zhang, R.; Wu, X.; Xu, F.; Lu, J.; Wang, Q. Drought characteristics and dominant factors across China: Insights from high-resolution daily SPEI dataset between 1979 and 2018. Sci. Total Environ. 2023, 901, 166362. [Google Scholar] [CrossRef] [PubMed]
  3. Yang, L.; Wang, W.; Wei, J. Assessing the response of vegetation photosynthesis to flash drought events based on a new identification framework. Agric. For. Meteorol. 2023, 339, 109545. [Google Scholar] [CrossRef]
  4. Zhang, Y.; You, Q.; Chen, C.; Xin, L. Flash droughts in a typical humid and subtropical basin: A case study in the Gan River Basin, China. J. Hydrol. 2017, 551, 162–176. [Google Scholar] [CrossRef]
  5. Otkin, J.A.; Anderson, M.C.; Hain, C.; Mladenova, I.E.; Basara, J.B.; Svoboda, M. Examining rapid onset drought development using the thermal infrared-based evaporative stress index. J. Hydrometeorol. 2013, 14, 1057–1074. [Google Scholar] [CrossRef]
  6. Otkin, J.A.; Zhong, Y.; Hunt, E.D.; Christian, J.I.; Basara, J.B.; Nguyen, H.; Wheeler, M.C.; Ford, T.W.; Hoell, A.; Svoboda, M.; et al. Development of a flash drought intensity index. Atmosphere 2021, 12, 741. [Google Scholar] [CrossRef]
  7. Svoboda, M.; Lecomte, D.; Hayes, M.; Heim, R.; Gleason, K.; Angel, J.; Rippey, B.; Tinker, R.; Palecki, M.; Stooksbury, D. The drought monitor. Bull. Am. Meteorol. Soc. 2002, 83, 1181–1190. [Google Scholar] [CrossRef]
  8. Poonia, V.; Goyal, M.; Jha, S.; Dubey, S. Terrestrial ecosystem response to flash droughts over India. J. Hydrol. 2022, 605, 127402. [Google Scholar] [CrossRef]
  9. Christian, J.I.; Basara, J.B.; Hunt, E.D.; Otkin, J.A.; Xiao, X. Flash drought development and cascading impacts associated with the 2010 Russian heatwave. Environ. Res. Lett. 2020, 15, 094078. [Google Scholar] [CrossRef]
  10. Otkin, J.A.; Anderson, M.C.; Hain, C.; Svoboda, M.; Johnson, D.; Mueller, R.; Tadesse, T.; Wardlow, B.; Brown, J. Assessing the evolution of soil moisture and vegetation conditions during the 2012 United States flash drought. Agric. For. Meteorol. 2016, 218, 230–242. [Google Scholar] [CrossRef]
  11. Barbosa, H.A. Flash drought and its characteristics in northeastern South America during 2004–2022 using satellite-based products. Atmosphere 2023, 14, 1629. [Google Scholar] [CrossRef]
  12. Otkin, J.A.; Shafer, M.; Svoboda, M.; Wardlow, B.; Anderson, M.C.; Hain, C.; Basara, J. Facilitating the use of drought early warning information through interactions with agricultural stakeholders. Bull. Am. Meteorol. Soc. 2015, 96, 1073–1078. [Google Scholar] [CrossRef]
  13. Sungmin, O.; Park, S.K. Flash drought drives rapid vegetation stress in arid regions in Europe. Environ. Res. Lett. 2023, 18, 014028. [Google Scholar] [CrossRef]
  14. Basara, J.B.; Christian, J.I.; Wakefield, R.A.; Otkin, J.A.; Hunt, E.H.; Brown, D. The evolution, propagation, and spread of flash drought in the central United States during 2012. Environ. Res. Lett. 2019, 14, 084025. [Google Scholar] [CrossRef]
  15. Yuan, X.; Wang, L.; Wood, E.F. Anthropogenic intensification of southern African flash droughts as exemplified by the 2015/16 season. Bull. Am. Meteorol. Soc. 2018, 99, S86–S90. [Google Scholar] [CrossRef]
  16. Wang, Y.; Yuan, X. Anthropogenic speeding up of south China flash droughts as exemplified by the 2019 summer-autumn transition season. Geophys. Res. Lett. 2021, 48, e2020GL091901. [Google Scholar] [CrossRef]
  17. Sungmin, O.; Park, S.K. Global ecosystem responses to flash droughts are modulated by background climate and vegetation conditions. Commun. Earth Environ. 2024, 5, 88. [Google Scholar] [CrossRef]
  18. Zhang, Y.; You, Q.; Chen, C.; Wang, H.; Ullah, S.; Shen, L. Characteristics of flash droughts and their association with compound meteorological extremes in China: Observations and model simulations. Sci. Total Environ. 2024, 916, 170133. [Google Scholar] [CrossRef] [PubMed]
  19. Liu, L.; Gudmundsson, L.; Hauser, M.; Qin, D.; Li, S.; Seneviratne, S.I. Soil moisture dominates dryness stress on ecosystem production globally. Nat. Commun. 2020, 11, 4892. [Google Scholar] [CrossRef] [PubMed]
  20. Zhang, Y.; You, Q.; Mao, G.; Chen, C.; Li, X.; Yu, J. Flash drought characteristics by different severities in humid subtropical basins: A case study in the Gan River Basin, China. J. Clim. 2021, 34, 7337–7357. [Google Scholar] [CrossRef]
  21. Liu, Y.; Zhu, Y.; Zhang, L.; Ren, L.; Yuan, F.; Yang, X.; Jiang, S. Flash droughts characterization over China: From a perspective of the rapid intensification rate. Sci. Total Environ. 2020, 704, 135373. [Google Scholar] [CrossRef]
  22. Zha, X.; Xiong, L.; Liu, C.; Shu, P.; Xiong, B. Identification and evaluation of soil moisture flash drought by a nonstationary framework considering climate and land cover changes. Sci. Total Environ. 2023, 856, 158953. [Google Scholar] [CrossRef] [PubMed]
  23. Yuan, X.; Wang, Y.; Ji, P.; Wu, P.; Sheffield, J.; Otkin, J.A. A global transition to flash droughts under climate change. Science 2023, 380, 187–191. [Google Scholar] [CrossRef] [PubMed]
  24. Osman, M.; Zaitchik, B.F.; Badr, H.S.; Christian, J.I.; Tadesse, T.; Otkin, J.A.; Anderson, M.C. Flash drought onset over the contiguous United States: Sensitivity of inventories and trends to quantitative definitions. Hydrol. Earth Syst. Sci. 2021, 25, 565–581. [Google Scholar] [CrossRef]
  25. Gruber, A.; Scanlon, T.; van der Schalie, R.; Wagner, W.; Dorigo, W. Evolution of the esa cci soil moisture climate data records and their underlying merging methodology. Earth Syst. Sci. Data 2019, 11, 717–739. [Google Scholar] [CrossRef]
  26. Zhou, Y.; Dong, X.; Chen, H.; Cao, L.; Shao, Q.; Sun, S.; Yang, B.; Rao, J. Sub-seasonal variability of surface soil moisture over Eastern China. Clim. Dyn. 2020, 55, 3527–3541. [Google Scholar] [CrossRef]
  27. Rodell, M.; Houser, P.R.; Jambor, U.; Gottschalck, J.; Mitchell, K.; Meng, C.J.; Arsenault, K.; Cosgrove, B.; Radakovich, J.; Bosilovich, M.; et al. The global land data assimilation system. Bull. Am. Meteorol. Soc. 2004, 85, 381–394. [Google Scholar] [CrossRef]
  28. Guan, Y.; Gu, X.; Slater, L.J.; Li, J.; Kong, D.; Zhang, X. Spatio-temporal variations in global surface soil moisture based on multiple datasets: Intercomparison and climate drivers. J. Hydrol. 2023, 625, 130095. [Google Scholar] [CrossRef]
  29. Gitelson, A.; Viña, A.; Inoue, Y.; Arkebauer, T.; Schlemmer, M.; Schepers, J. Uncertainty in the evaluation of photosynthetic canopy traits using the green leaf area index. Agric. For. Meteorol. 2022, 320, 108955. [Google Scholar] [CrossRef]
  30. Ding, J.; Yang, T.; Zhao, Y.; Liu, D.; Wang, X.; Yao, Y.; Peng, S.; Piao, S. Increasingly important role of atmospheric aridity on Tibetan alpine grasslands. Geophys. Res. Lett. 2018, 45, 2852–2859. [Google Scholar] [CrossRef]
  31. Deng, Y.; Wang, X.; Wang, K.; Ciais, P.; Tang, S.; Jin, L.; Li, L.; Piao, S. Responses of vegetation greenness and carbon cycle to extreme droughts in China. Agric. For. Meteorol. 2021, 298–299, 108307. [Google Scholar] [CrossRef]
  32. Meng, F.; Liu, D.; Wang, Y.; Wang, S.; Wang, T. Negative relationship between photosynthesis and late-stage canopy development and senescence over Tibetan plateau. Glob. Chang. Biol. 2023, 29, 3147–3158. [Google Scholar] [CrossRef]
  33. Mohammed, G.H.; Colombo, R.; Middleton, E.M.; Rascher, U.; van der Tol, C.; Nedbal, L.; Goulas, Y.; Pérez-Priego, O.; Damm, A.; Meroni, M.; et al. Remote sensing of solar-induced chlorophyll fluorescence (sif) in vegetation: 50 years of progress. Remote Sens. Environ. 2019, 231, 111177. [Google Scholar] [CrossRef] [PubMed]
  34. Jeong, S.-J.; Schimel, D.; Frankenberg, C.; Drewry, D.T.; Fisher, J.B.; Verma, M.; Berry, J.A.; Lee, J.-E.; Joiner, J. Application of satellite solar-induced chlorophyll fluorescence to understanding large-scale variations in vegetation phenology and function over Northern high latitude forests. Remote Sens. Environ. 2017, 190, 178–187. [Google Scholar] [CrossRef]
  35. Miao, J.; An, R.; Zhang, Y.; Xing, F. Substantial reduction in vegetation photosynthesis capacity during compound droughts in the three-river headwaters region, China. Remote Sens. 2023, 15, 4943. [Google Scholar] [CrossRef]
  36. Li, X.; Xiao, J. A global, 0.05-degree product of solar-induced chlorophyll fluorescence derived from OCO-2, MODIS, and reanalysis data. Remote Sens. 2019, 11, 517. [Google Scholar] [CrossRef]
  37. Yao, T.; Liu, S.; Hu, S.; Mo, X. Response of vegetation ecosystems to flash drought with solar-induced chlorophyll fluorescence over the Hai river basin, China during 2001–2019. J. Environ. Manag. 2022, 313, 114947. [Google Scholar] [CrossRef] [PubMed]
  38. Zhang, Y.; Joiner, J.; Alemohammad, S.H.; Zhou, S.; Gentine, P. A global spatially contiguous solar-induced fluorescence (CSIF) dataset using neural networks. Biogeosciences 2018, 15, 5779–5800. [Google Scholar] [CrossRef]
  39. Hu, Z.; Piao, S.; Knapp, A.K.; Wang, X.; Peng, S.; Yuan, W.; Running, S.; Mao, J.; Shi, X.; Ciais, P.; et al. Decoupling of greenness and gross primary productivity as aridity decreases. Remote Sens. Environ. 2022, 279, 113120. [Google Scholar] [CrossRef]
  40. Geng, G.; Yang, R.; Liu, L. Downscaled solar-induced chlorophyll fluorescence has great potential for monitoring the response of vegetation to drought in the Yellow River Basin, China: Insights from an extreme event. Ecol. Indic. 2022, 138, 108801. [Google Scholar] [CrossRef]
  41. Shekhar, A.; Buchmann, N.; Gharun, M. How well do recently reconstructed solar-induced fluorescence datasets model gross primary productivity? Remote Sens. Environ. 2022, 283, 113282. [Google Scholar] [CrossRef]
  42. Umuhoza, J.; Jiapaer, G.; Tao, Y.; Jiang, L.; Zhang, L.; Gasirabo, A.; Umwali, E.D.; Umugwaneza, A. Analysis of fluctuations in vegetation dynamic over Africa using satellite data of solar-induced chlorophyll fluorescence. Ecol. Indic. 2023, 146, 109846. [Google Scholar] [CrossRef]
  43. Li, G.; Wu, C.; Chen, Y.; Huang, C.; Zhao, Y.; Wang, Y.; Ma, M.; Ding, Z.; Yu, P.; Tang, X. Increasing temperature regulates the advance of peak photosynthesis timing in the boreal ecosystem. Sci. Total Environ. 2023, 882, 163587. [Google Scholar] [CrossRef] [PubMed]
  44. Xu, S.; Li, J.; Zhang, T. Effects of drought on ecosystem evapotranspiration and gross primary productivity in the Haihe River Basin. Phys. Chem. Earth Parts A/B/C 2024, 135, 103619. [Google Scholar] [CrossRef]
  45. Pandiyan, S.; Navaneethan, C.; Vijayan, R.; Gunasekaran, G.; Khan, K.Y.; Guo, Y. Evaluation of drought using satellite solar-induced chlorophyll fluorescence during crop development stage over Xinjiang, China. Measurement 2022, 187, 110327. [Google Scholar] [CrossRef]
  46. Liu, Y.; You, C.; Zhang, Y.; Chen, S.; Zhang, Z.; Li, J.; Wu, Y. Resistance and resilience of grasslands to drought detected by sif in Inner Mongolia, China. Agric. For. Meteorol. 2021, 308–309, 108567. [Google Scholar] [CrossRef]
  47. Gampe, D.; Zscheischler, J.; Reichstein, M.; O’Sullivan, M.; Smith, W.K.; Sitch, S.; Buermann, W. Increasing impact of warm droughts on northern ecosystem productivity over recent decades. Nat. Clim. Chang. 2021, 11, 772–779. [Google Scholar] [CrossRef]
  48. Zhao, Y.; Xiong, L.; Yin, J.; Zha, X.; Li, W.; Han, Y. Understanding the effects of flash drought on vegetation photosynthesis and potential drivers over China. Sci. Total Environ. 2024, 931, 172926. [Google Scholar] [CrossRef]
  49. Mahto, S.S.; Mishra, V. Increasing risk of simultaneous occurrence of flash drought in major global croplands. Environ. Res. Lett. 2023, 18, 044044. [Google Scholar] [CrossRef]
  50. Cui, X.; Zhong, Z. Climate change, cropland adjustments, and food security: Evidence from China. J. Dev. Econ. 2024, 167, 103245. [Google Scholar] [CrossRef]
  51. Zhang, Q.; Han, L.; Zeng, J.; Wang, X.; Lin, J. Climate factors during key periods affect the comprehensive crop losses due to drought in Southern China. Clim. Dyn. 2020, 55, 2313–2325. [Google Scholar] [CrossRef]
  52. Chen, L.; Li, Y.; Ge, Z.-A.; Lu, B.; Wang, L.; Wei, X.; Sun, M.; Wang, Z.; Li, T.; Luo, J.-J. Causes of the extreme drought in late summer–autumn 2019 in Eastern China and its future risk. J. Clim. 2023, 36, 1085–1104. [Google Scholar] [CrossRef]
  53. Fan, J.; Zhou, K.; Sheng, K.; Guo, R.; Chen, D.; Wang, Y.; Liu, H.; Wang, Z.; Sun, Y.; Zhang, J.; et al. Territorial function differentiation and its comprehensive regionalization in China. Sci. China Earth Sci. 2023, 66, 247–270. [Google Scholar] [CrossRef]
  54. Yang, J.; Huang, X. The 30 m annual land cover dataset and its dynamics in China from 1990 to 2019. Earth Syst. Sci. Data 2021, 13, 3907–3925. [Google Scholar] [CrossRef]
  55. Li, Q.; Shi, G.; Shangguan, W.; Nourani, V.; Li, J.; Li, L.; Huang, F.; Zhang, Y.; Wang, C.; Wang, D.; et al. A 1 km daily soil moisture dataset over China using in situ measurement and machine learning. Earth Syst. Sci. Data 2022, 14, 5267–5286. [Google Scholar] [CrossRef]
  56. Di Napoli, C.; Barnard, C.; Prudhomme, C.; Cloke, H.L.; Pappenberger, F. Era5-heat: A global gridded historical dataset of human thermal comfort indices from climate reanalysis. Geosci. Data J. 2021, 8, 2–10. [Google Scholar] [CrossRef]
  57. Martius, O.; Pfahl, S.; Chevalier, C. A global quantification of compound precipitation and wind extremes. Geophys. Res. Lett. 2016, 43, 7709–7717. [Google Scholar] [CrossRef]
  58. Hersbach, H.; Bell, B.; Berrisford, P.; Hirahara, S.; Horányi, A.; Muñoz-Sabater, J.; Nicolas, J.; Peubey, C.; Radu, R.; Schepers, D.; et al. The ERA5 global reanalysis. Q. J. R. Meteorol. Soc. 2020, 146, 1999–2049. [Google Scholar] [CrossRef]
  59. Wu, J.; Gao, X. A gridded daily observation dataset over China region and comparison with the oher datasets. Chin. J. Geophys. 2013, 56, 1102–1111. (In Chinese) [Google Scholar]
  60. Wu, J.; Gao, X.; Giorgi, F.; Chen, D. Changes of effective temperature and cold/hot days in late decades over China based on a high resolution gridded observation dataset. Int. J. Climatol. 2017, 37, 788–800. [Google Scholar] [CrossRef]
  61. Miao, Y.; Wang, A. A daily 0.25 × 0.25 hydrologically based land surface flux dataset for conterminous China, 1961–2017. J. Hydrol. 2020, 590, 125413. [Google Scholar] [CrossRef]
  62. Hosseini-Moghari, S.-M.; Sun, S.; Tang, Q.; Groisman, P.Y. Scaling of precipitation extremes with temperature in China’s mainland: Evaluation of satellite precipitation data. J. Hydrol. 2022, 606, 127391. [Google Scholar] [CrossRef]
  63. Wang, Y.; Xiao, J.; Li, X.; Niu, S. Global evidence on the asymmetric response of gross primary productivity to interannual precipitation changes. Sci. Total Environ. 2022, 814, 152786. [Google Scholar] [CrossRef] [PubMed]
  64. Zhao, A.; Wang, D.; Xiang, K.; Zhang, A. Vegetation photosynthesis changes and response to water constraints in the Yangtze river and Yellow river basin, China. Ecol. Indic. 2022, 143, 109331. [Google Scholar] [CrossRef]
  65. Thornthwaite, C.W. An approach toward a rational classification of climate. Geogr. Rev. 1948, 38, 55–94. [Google Scholar] [CrossRef]
  66. Zhang, Y.; You, Q.; Ullah, S.; Chen, C.; Shen, L.; Liu, Z. Substantial increase in abrupt shifts between drought and flood events in China based on observations and model simulations. Sci. Total Environ. 2023, 876, 162822. [Google Scholar] [CrossRef] [PubMed]
  67. Vicente-Serrano, S.M.; Beguería, S.; Lópezmoreno, J.I. A multiscalar drought index sensitive to global warming: The standardized precipitation evapotranspiration index. J. Clim. 2010, 23, 1696–1718. [Google Scholar] [CrossRef]
  68. Ford, T.W.; Labosier, C.F. Meteorological conditions associated with the onset of flash drought in the eastern United States. Agric. For. Meteorol. 2017, 247, 414–423. [Google Scholar] [CrossRef]
  69. Li, Y.; Qin, Y.; Rong, P. Evolution of potential evapotranspiration and its sensitivity to climate change based on the Thornthwaite, Hargreaves, and Penman–monteith equation in environmental sensitive areas of China. Atmos. Res. 2022, 273, 106178. [Google Scholar] [CrossRef]
  70. Aschonitis, V.; Touloumidis, D.; Ten Veldhuis, M.-C.; Coenders-Gerrits, M. Correcting thornthwaite potential evapotranspiration using a global grid of local coefficients to support temperature-based estimations of reference evapotranspiration and aridity indices. Earth Syst. Sci. Data 2022, 14, 163–177. [Google Scholar] [CrossRef]
  71. Trajkovic, S.; Gocic, M.; Pongracz, R.; Bartholy, J. Adjustment of Thornthwaite equation for estimating evapotranspiration in Vojvodina. Theor. Appl. Climatol. 2019, 138, 1231–1240. [Google Scholar] [CrossRef]
  72. Chang, X.; Wang, S.; Gao, Z.; Luo, Y.; Chen, H. Forecast of daily reference evapotranspiration using a modified daily Thornthwaite equation and temperature forecasts. Irrig. Drain. 2019, 68, 297–317. [Google Scholar] [CrossRef]
  73. Allen, R.G.; Pereira, L.S.; Raes, D.; Smith, M. Crop evapotranspiration. Guidelines for computing crop water requirements. Fao Irrig. Drain. Pap. 1998, 56, 60–64. [Google Scholar]
  74. Liang, L.; Xu, G.; Ding, Q.; Wang, J.; Xing, Q.; Torotwa, I. Post-paddy tillage affects soil physical processes of rain-fed rice–wheat rotation. Soil Sci. Soc. Am. J. 2023, 87, 30–42. [Google Scholar] [CrossRef]
  75. Yang, L.; Wu, P.; Liao, M.; Peng, J.; Tang, Z.; Long, H.; Zhang, H.; Yu, X. Three- dimensional modeling and visualization of rice root system based on the improved dual-scale automaton and l-system. Comput. Electron. Agric. 2022, 195, 106823. [Google Scholar] [CrossRef]
  76. Ford, T.W.; Mcroberts, D.B.; Quiring, S.M.; Hall, R.E. On the utility of in situ soil moisture observations for flash drought early warning in Oklahoma, USA. Geophys. Res. Lett. 2015, 42, 9790–9798. [Google Scholar] [CrossRef]
  77. Pan, J.; Chen, Y.; Zhang, Y.; Chen, M.; Fennell, S.; Luan, B.; Wang, F.; Meng, D.; Liu, Y.; Jiao, L.; et al. Spatial-temporal dynamics of grain yield and the potential driving factors at the county level in China. J. Clean. Prod. 2020, 255, 120312. [Google Scholar] [CrossRef]
  78. Kuttippurath, J.; Kashyap, R. Greening of india: Forests or croplands? Appl. Geogr. 2023, 161, 103115. [Google Scholar] [CrossRef]
  79. Chen, C.; Park, T.; Wang, X.; Piao, S.; Xu, B.; Chaturvedi, R.K.; Fuchs, R.; Brovkin, V.; Ciais, P.; Fensholt, R.; et al. China and india lead in greening of the world through land-use management. Nat. Sustain. 2019, 2, 122–129. [Google Scholar] [CrossRef] [PubMed]
  80. Zhu, Z.; Piao, S.; Myneni, R.B.; Huang, M.; Zeng, Z.; Canadell, J.G.; Ciais, P.; Sitch, S.; Friedlingstein, P.; Arneth, A.; et al. Greening of the earth and its drivers. Nat. Clim. Chang. 2016, 6, 791–795. [Google Scholar] [CrossRef]
  81. Yang, Y.; Roderick, M.L.; Guo, H.; Miralles, D.G.; Zhang, L.; Fatichi, S.; Luo, X.; Zhang, Y.; McVicar, T.R.; Tu, Z.; et al. Evapotranspiration on a greening earth. Nat. Rev. Earth Environ. 2023, 4, 626–641. [Google Scholar] [CrossRef]
  82. Xu, W.; Yuan, W.; Wu, D.; Zhang, Y.; Shen, R.; Xia, X.; Ciais, P.; Liu, J. Impacts of record-breaking compound heatwave and drought events in 2022 China on vegetation growth. Agric. For. Meteorol. 2024, 344, 109799. [Google Scholar] [CrossRef]
  83. Zhang, Y.; You, Q.; Mao, G.; Chen, C.; Ye, Z. Short-term concurrent drought and heatwave frequency with 1.5 and 2.0 °C global warming in humid subtropical basins: A case study in the Gan River Basin, China. Clim. Dyn. 2019, 52, 4621–4641. [Google Scholar] [CrossRef]
  84. Tripathy, K.P.; Mukherjee, S.; Mishra, A.K.; Mann, M.E.; Williams, A.P. Climate change will accelerate the high-end risk of compound drought and heatwave events. Proc. Natl. Acad. Sci. USA 2023, 120, e2219825120. [Google Scholar] [CrossRef] [PubMed]
  85. Sreeparvathy, V.; Srinivas, V.V. Meteorological flash droughts risk projections based on CMIP6 climate change scenarios. NPJ Clim. Atmos. Sci. 2022, 5, 77. [Google Scholar] [CrossRef]
  86. Fitton, N.; Alexander, P.; Arnell, N.; Bajzelj, B.; Calvin, K.; Doelman, J.; Gerber, J.S.; Havlik, P.; Hasegawa, T.; Herrero, M.; et al. The vulnerabilities of agricultural land and food production to future water scarcity. Glob. Environ. Chang. 2019, 58, 101944. [Google Scholar] [CrossRef]
  87. Wang, A.; Tao, H.; Ding, G.; Zhang, B.; Huang, J.; Wu, Q. Global cropland exposure to extreme compound drought heatwave events under future climate change. Weather Clim. Extrem. 2023, 40, 100559. [Google Scholar] [CrossRef]
  88. Hao, Z.; Chen, Y.; Feng, S.; Liao, Z.; An, N.; Li, P. The 2022 Sichuan-Chongqing spatio-temporally compound extremes: A bitter taste of novel hazards. Sci. Bull. 2023, 68, 1337–1339. [Google Scholar] [CrossRef] [PubMed]
  89. Meng, C.; Dong, Z.; Liu, K.; Wang, Y.; Zhang, Y.; Zhu, Y. Identification and analysis of evolution characteristics of flash drought based on three-dimensional perspective: A case study in the Jialing river basin. Urban Clim. 2024, 53, 101803. [Google Scholar] [CrossRef]
  90. Swain, D.L.; Langenbrunner, B.; Neelin, J.D.; Hall, A. Increasing precipitation volatility in twenty-first-century California. Nat. Clim. Chang. 2018, 8, 427–433. [Google Scholar] [CrossRef]
  91. Yuan, X.; Wang, L.; Wu, P.; Ji, P.; Sheffield, J.; Zhang, M. Anthropogenic shift towards higher risk of flash drought over China. Nat. Commun. 2019, 10, 4661. [Google Scholar] [CrossRef]
  92. Christian, J.I.; Basara, J.B.; Hunt, E.D.; Otkin, J.A.; Furtado, J.C.; Mishra, V.; Xiao, X.; Randall, R.M. Global distribution, trends, and drivers of flash drought occurrence. Nat. Commun. 2021, 12, 6330. [Google Scholar] [CrossRef] [PubMed]
  93. Nguyen, H.; Wheeler, M.C.; Otkin, J.A.; Frost, A.J.; Stone, R.C.; Cowan, T. Using evaporative stress index to monitor flash drought in Australia. Environ. Res. Lett. 2019, 14, 064016. [Google Scholar] [CrossRef]
  94. He, P.; Ma, X.; Sun, Z.; Han, Z.; Ma, S.; Meng, X. Compound drought constrains gross primary productivity in Chinese grasslands. Environ. Res. Lett. 2022, 17, 104054. [Google Scholar] [CrossRef]
  95. Chen, F.; Wang, H.; Zhao, F.; Wang, R.; Qi, Y.; Zhang, K.; Zhao, H.; Tang, G.; Yang, Y. The response mechanism and threshold of spring wheat to rapid drought. Atmosphere 2022, 13, 596. [Google Scholar] [CrossRef]
Figure 1. Location of the four major agricultural regions in southern China (UYR: the upper Yangtze River region; MYR: the middle Yangtze River region; LYR: the lower Yangtze River region; and SCR: the South China region).
Atmosphere 15 00886 g001
Figure 2. Illustration the definitions of flash drought with minimum durations based on SM percentiles. (ad) denote Case 1, Case 2, Case 3, and Case4, respectively.
Atmosphere 15 00886 g002
Figure 3. Flowchart illustrating the methodologies utilized in this study.
Atmosphere 15 00886 g003
Figure 4. Spatial patterns of annual averages of (a) CSIF, (b) GOSIF, and (c) GPP for the period of 2001–2020.
Atmosphere 15 00886 g004
Figure 5. Spatial patterns of (a) total flash drought frequency and proportions of (b) Case 1, (c) Case 2, and (d) Case 4 events relative to the total events during 2001–2020.
Atmosphere 15 00886 g005
Figure 6. Mean durations of flash droughts for (a) total, (b) Case 1, (c) Case 2, and (d) Case 4 events during 2001–2020.
Atmosphere 15 00886 g006
Figure 7. (a) The area (grid) proportions of flash droughts and (b) the durations of flash droughts during 2001–2020.
Atmosphere 15 00886 g007
Figure 8. Spatial patterns of standardized anomalies of (a) precipitation, (b) PET, (c) P–PET, (d) Tmax, (e) VPD, and (f) wind speed under flash droughts during 2001–2020.
Atmosphere 15 00886 g008
Figure 9. Temporal features of meteorological variables during flash drought conditions for (a) total, (b) Case 1, (c) Case 2, and (d) Case 4 events in the main agricultural areas of southern China during 2001–2020. In each subplot, the left y-axis represents the SM percentile, whereas the right y-axis denotes the standardized anomalies of the meteorological variables. Lines indicate the median values, and shading denotes the interquartile range. Additionally, the total number of flash drought events at the grid scale is labeled as “n”.
Atmosphere 15 00886 g009
Figure 10. (ac) Response frequency and (df) response time of CSIF, GOSIF, and GPP to flash droughts in the main agricultural areas of southern China during 2001–2020.
Atmosphere 15 00886 g010
Figure 11. Mean standardized anomalies of (a) CSIF, (b) GOSIF, and (c) GPP during flash droughts in the study area during 2001–2020.
Atmosphere 15 00886 g011
Figure 12. Temporal evolution of CSIF, GOSIF, and GPP during flash droughts for (a) total, (b) Case 1, (c) Case 2, and (d) Case 4 events in the study area during 2001–2020. In each subplot, the left y-axis represents the SM percentile, whereas the right y-axis denotes the standardized anomalies of the vegetation indices. Lines indicate the median values, and shading denotes the interquartile range. Additionally, the total number of flash drought events at the grid scale is labeled as “n”.
Atmosphere 15 00886 g012
Figure 13. Spatial distributions of (a) the flash drought frequency in 2019 and (b) the start dates of flash droughts during 41st–47th pentads (20 July–23 August) of 2019. POY: pentad of year. The total number of flash drought events at the grid scale is labeled as “n”.
Atmosphere 15 00886 g013
Figure 14. Temporal features of (a) meteorological and (b) vegetation indices during 2019 flash droughts in the study area. In each subplot, the left y-axis denotes the SM percentile, whereas the right y-axis denotes the standardized anomalies of the meteorological or vegetation indices. Lines indicate medians and shading indicates the interquartile range. A total of 727 grids had a flash drought start in the 42nd pentad of 2019. POY: pentad of year.
Atmosphere 15 00886 g014
Figure 15. Schematic diagram illustrating the mechanisms of flash droughts and effects on crops.
Atmosphere 15 00886 g015
Disclaimer/Publisher’s Note: The statements, opinions and data contained in all publications are solely those of the individual author(s) and contributor(s) and not of MDPI and/or the editor(s). MDPI and/or the editor(s) disclaim responsibility for any injury to people or property resulting from any ideas, methods, instructions or products referred to in the content.

