Article

Drought Dynamics and Drought Hazard Assessment in Southwest Bulgaria

Faculty of Geology and Geography, Sofia University “St. Kliment Ohridski”, 1504 Sofia, Bulgaria
*
Author to whom correspondence should be addressed.
Atmosphere 2024, 15(8), 888; https://doi.org/10.3390/atmos15080888
Submission received: 10 June 2024 / Revised: 14 July 2024 / Accepted: 20 July 2024 / Published: 25 July 2024

Abstract

:
Awareness of the potential threat posed by drought necessitates the implementation of appropriate procedures to enable effective and systematic actions aimed at mitigating, or at least partially limiting, the impacts of drought events. This paper seeks to analyze the spatial and temporal changes of atmospheric drought in the period 1961–2020 and assesses drought hazards in southwest Bulgaria, which is a region susceptible to periodic water shortages. In this study, the standardized precipitation evaporation index (SPEI), accounting for both precipitation and temperature changes, was used to analyze drought characteristics. The analysis reveals significant temporal changes and spatial differences in drought patterns across southwest Bulgaria. The northeastern part of the region, including the Sofia district, exhibits the lowest risk of drought, while the central part of the region shows a tendency toward moderate and occasional low drought events. Some stations, particularly in the southern part of the region, consistently experienced more severe drought conditions (Blagoevgrad and Sandanski), as indicated by negative SPEI values in different time scales (3, 6, and 12 months). Results indicate an increased frequency of droughts during 1990–2020 compared to 1961–1990, which was driven by climate change and human activities. Across all stations and in both SPEI time scales, the period from the early to mid-1990s was characterized by significant droughts. The study of drought hazards using short-term and long-term SPEI analysis reveals different levels of drought risk and increased hazard from the northern to southern parts of the study area. The share of areas with a high drought hazard exceeds 40% of the territory in the areas with a transitional and continental-Mediterranean climate. Based on the results, the paper highlights the need to integrate drought risk assessments with regional planning to improve agricultural resilience and water resource management in response to anticipated droughts, especially in drought-prone areas such as southwest Bulgaria.

1. Introduction

Drought is a phenomenon characterized by prolonged water shortages, comprising atmospheric conditions (below-average rainfall) as well as surface and groundwater scarcity. This scarcity results in a substantial decrease in water resources, consequently impacting the ecosystem and agriculture of the affected region, ultimately harming the local economy [1,2,3,4,5]. Predicted temperature increases and variations in the temporal and spatial distribution of rainfall are expected to alter water availability for societal, environmental, and commercial purposes [6,7,8]. In recent times, extended periods of little to no precipitation combined with heatwaves have posed a threat to crop production, energy stability, drinking water access, and ecosystems [9,10,11,12]. The long-lasting consequences of these changes might exacerbate drought occurrences. While droughts have historically been driven by natural factors, they are increasingly being linked to human activities [13,14]. Vulnerability to drought is influenced by several factors—social, economic, technological, and political—some of which can be managed. Consequently, even if droughts exhibit identical duration, intensity, and spatial coverage, they can produce varied effects. Severe, enduring droughts spanning extensive territories can lead to detrimental outcomes such as significant losses in yields, forest fires, accelerated soil degradation, desertification, heightened competition for water resources, and social unrest [15,16,17,18].
Beran and Rodier [19], followed by Hisdal and Tallaksen [20], define drought as a long-term decrease in water availability at a given time in a given area. According to Tallaksen and van Lanen [21], drought is a permanent and extensive reduction in the water below the average natural water availability in an area, which may affect all elements of the water cycle. Today’s understanding of drought types is defined by the physical aspects of the propagating hazard (e.g., meteorological or soil moisture drought) rather than the potentially impacted sector (e.g., agricultural drought) [22].
The development of drought over time and in an area varies depending on numerous climate and hydrological parameters present in a given area. However, distinct stages of its progression can always be observed. Atmospheric processes, which serve as the starting point for drought development, result from climatic variability [23,24,25]. A prolonged deficit in rainfall leads to reduced water inflow into the hydrological system. Additionally, temperature is one of the major climatic factors that influences the availability of water [26,27]. During drought, potential evapotranspiration may rise due to increased radiation, wind speed, or evaporation deficit, potentially increasing actual evapotranspiration and causing additional water loss from soil and surface water bodies [14,20]. Economic activities can influence hydrological cycle processes, such as infiltration and evapotranspiration, subsequently altering river outflow patterns [14,20].
Consequently, there may be water scarcity for economic and communal purposes, resulting in socioeconomic drought. These processes collectively embody the concept of “drought development” reflecting the changes in drought progression during the terrestrial segment of the hydrological cycle [21,28,29].
Severe droughts in recent years have led to significant economic losses, which in Europe are estimated at around 100 billion euros [30]. Summer 2003 was exceptionally hot over most of central and western Europe, ranging from Spain to Hungary and from Iceland to Greece [31]. This “mega-heatwave” in 2003 probably broke the 500-year temperature records over approximately 50% of Europe [32]. The next drought and heat wave events were recorded in Europe in 2015, 2017, 2018, 2019, 2020 and 2022 [5,33,34,35,36]. The 2022 drought event in Europe was one of the most severe in recent history, and it was particularly intense over the Iberian Peninsula, France, Italy, the northwest Balkans, Germany, the Netherlands, Poland, and Scandinavia [5,37]. Longer and more frequent droughts, compounded by continuous warming, are to be expected in southern Europe in particular [7,38,39]. Areas that are already suffering from water shortages, like the Mediterranean region, are likely to suffer even more in the future. Southern Spain, the border region between Turkey, Greece, and Bulgaria, is considered particularly vulnerable [40]. According to the results from the Coupled Model Intercomparison Project Phase 5 (CMIP5), a decrease in precipitation by about 10–20% during the period 2081–2100 in comparison to 1986–2005 is expected in southern Europe, including Romania and Bulgaria [41]. The likelihood of drought impacts occurring is defined as drought risk, which is typically seen as a function of hazard and vulnerability [42]. According to Blauhut (2020), the occurrence of drought hazard events alone does not necessarily prompt an emergency response. Whether a drought escalates to an emergency situation hinges on its effects on local stakeholders, communities, and society. This ultimate outcome is contingent upon the vulnerability of these groups to the hazard [43].
Significant research and efforts have been dedicated to investigating meteorological and hydrological drought. Among the Bulgarian studies that have identified the occurrence of meteorological droughts are the research conducted by Alexandrov [44], Nikolova et al. [45], Popova et al. [46], Radeva et al. [47], and Petkova et al. [48]. At the global scale, several studies have been published in recent years, focusing on the assessment of drought hazard and risk –Verdon-Kidd and Kiem [49], Rajsekhar et al. [50], Jia and Pan [51], Dabanli [52], Tokarczyk and Szalińska [53], Singh et al. [54], and Radeva and Nikolova [55].
The scientific publications [44,45,55,56,57,58] indicate an increase in drought frequency in Bulgaria, particularly over the past two decades. A notable water deficit has been evident across a substantial portion of Bulgaria for many years. This situation is associated with factors such as a reduction in snow cover duration, extended periods without rainfall, and elevated summer temperatures leading to rapid water evaporation from plants and soil. Approximately half of Bulgaria’s territory experiences periodic water deficits, and considering the observed climate change trends, these conditions may worsen. Therefore, there is a critical need for an active drought risk management policy in Bulgaria to protect water resources from current climate threats and expected future changes.
To effectively monitor the drought, it is important to assess its duration, magnitude, and spatial extent. These characteristics are valuable for providing an impartial and quantitative evaluation of the intensity of drought and are frequently demonstrated through the application of drought indices. These indices are formulated using several hydrological and meteorological variables that can accurately represent the different aspects of drought [27]. In this study, a drought index SPEI, calculated by both precipitation and temperature, was used to provide a comprehensive analysis of the drought characteristics in southwest Bulgaria from 1960 to 2020.
The present paper has assessed the drought hazard in the southwestern region of Bulgaria by analyzing the frequency of occurrence of droughts with different severities during the historical period from 1961 to 2020. The results of the study can be used for strategic drought risk management. Analyzing and mapping drought hazards on a regional scale is crucial for enhancing short-term disaster readiness in drought-prone areas, particularly given the recent intensification of warming trends.

2. Materials and Methods
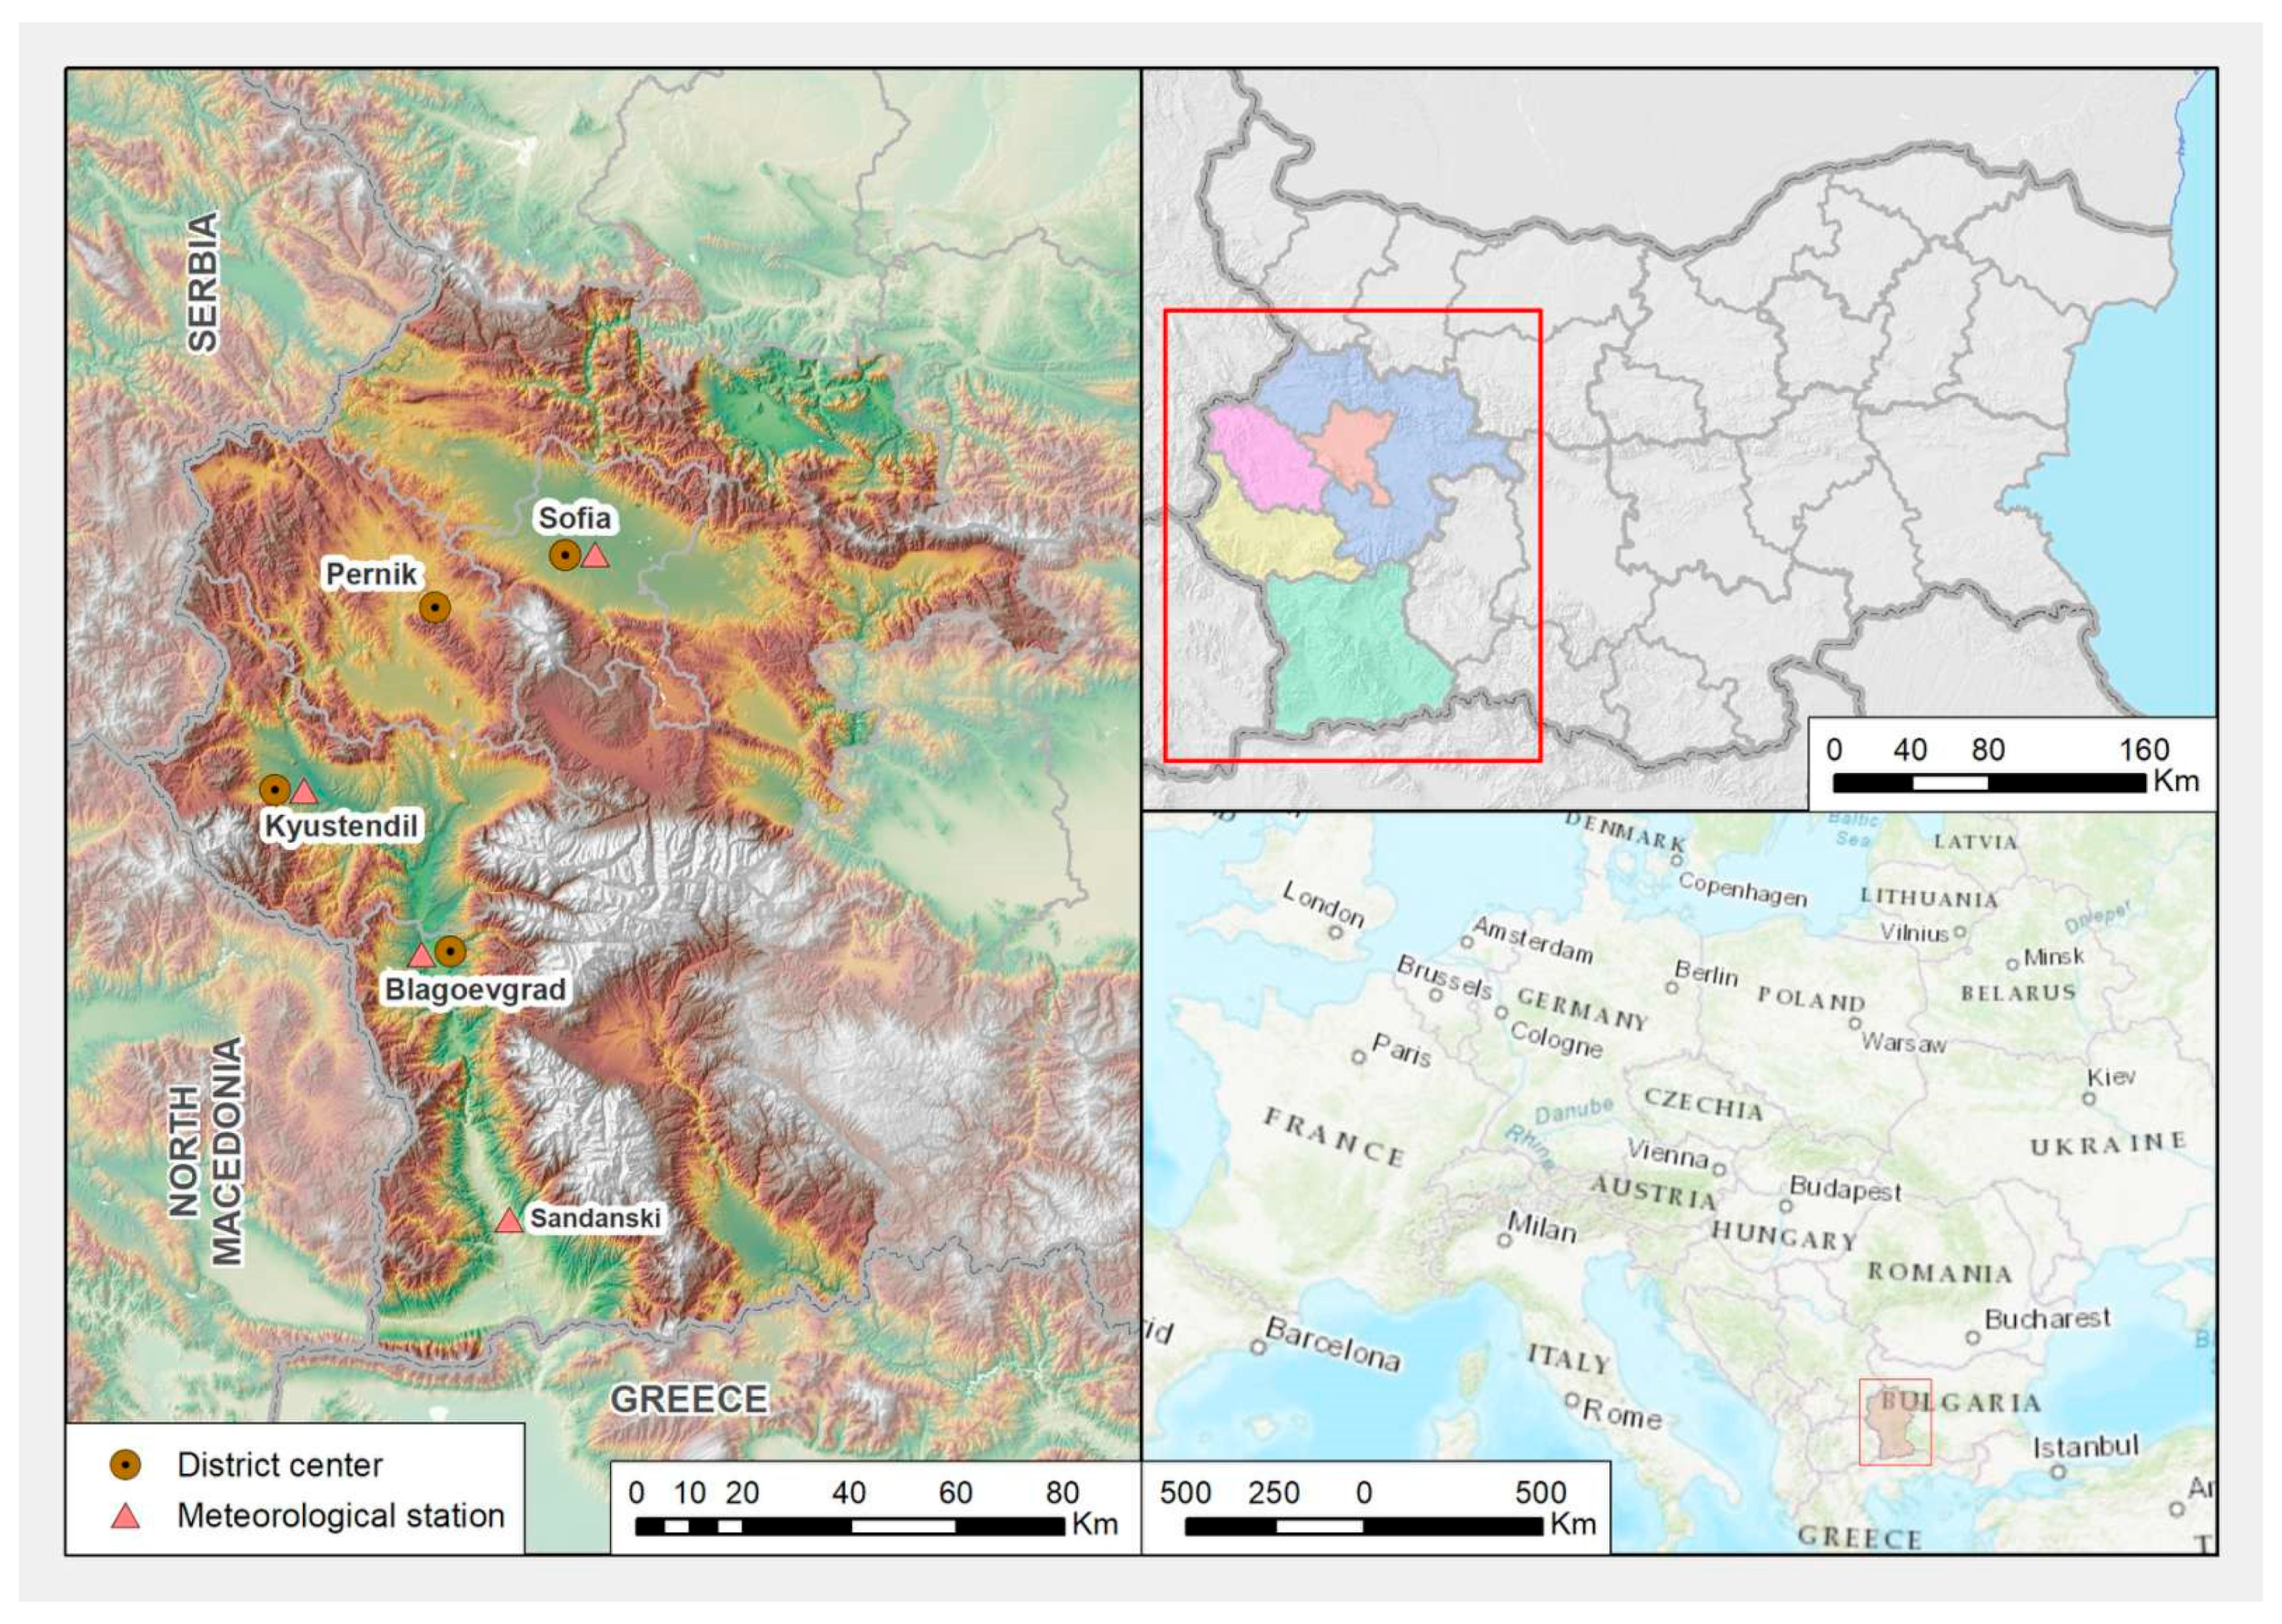
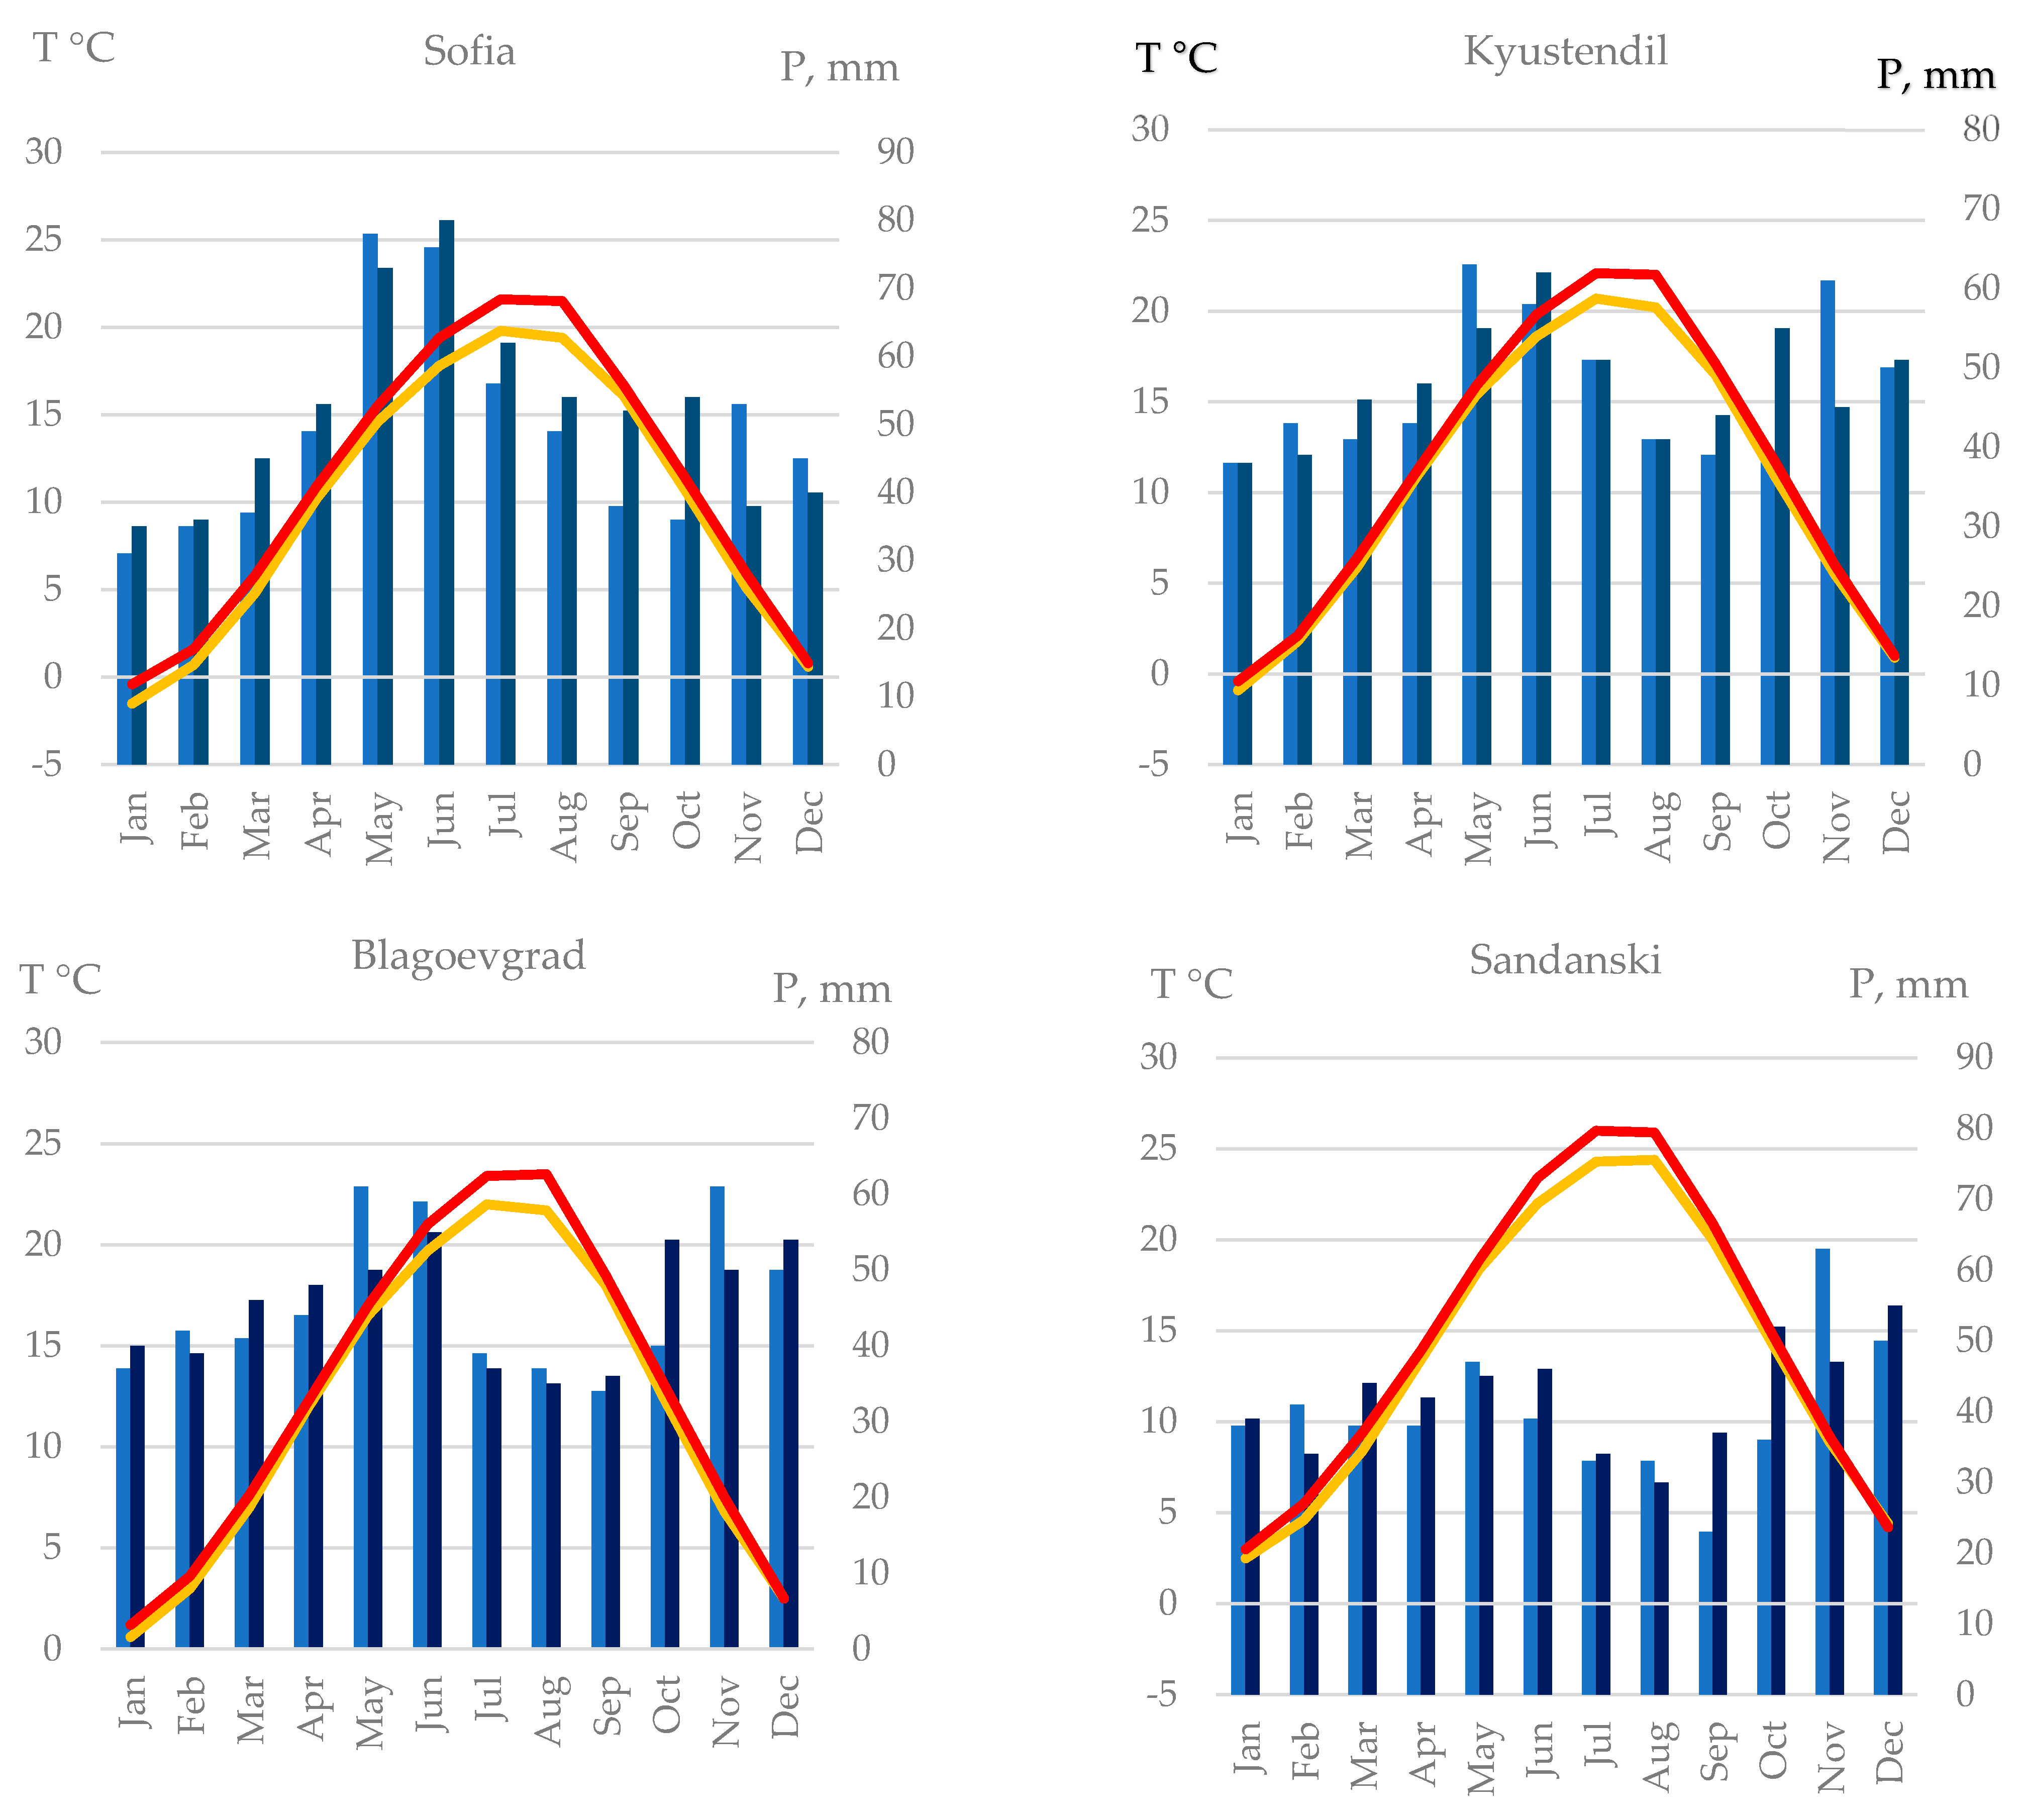
2.1. Study Area

The study area covers NUTS2 Yugozapaden located in the western peripheral portion of Bulgaria with a territory of 20,306.4 km2, which represents 18.3% of the total territory of the country. It borders the Republic of Serbia and north Macedonia to the west and Greece to the south. Located within its boundaries is the capital city, Sofia (Figure 1). It includes the territories of the districts of Blagoevgrad, Kyustendil, Pernik, Sofia, and the city of Sofia (the capital city), comprising 52 municipalities, 48 cities, and 904 villages. The territory encompasses various natural zones, including mountains, basins, gorges, and river valleys, with mountains being the dominant feature. The highest mountains in Bulgaria, including Rila, Pirin, and the western parts of the Rhodopes, are located in this region.
The area is drained by the trans-boundary Struma River system. It also includes parts of the watershed of the rivers Iskar and Mesta. The climate is moderate continental in the northern part of the region, transitional continental in the middle, and with continental-Mediterranean characteristics in the southernmost parts. The location in various geographical and climatic conditions results in variations in hydroclimatic conditions from north to south. Most of the study area falls under the Cf climate type as per Köppen’s classification, indicating a temperate climate without a dry season. The D climate type (snow climate) characterizes the mountainous region, whereas the southern part of the area experiences a Cs climate type (temperate with dry summer). The highest mountain peaks, Cherni vrah and Musala, have an E climate type, which means a cold climate without forest vegetation [59]. The annual precipitation in the region under study varies between 500–550 and 1200–1300 mm. The highest monthly precipitation occurs in June, except for the southern part of the region, where it falls in winter [60]. As we move from north to south, the frequency of snowfall and the number of snow cover days decreases across the investigated region.
Agricultural land accounts for 32%, forested and semi-natural areas comprise 63%, while urbanized regions occupy 4.9% of the area of NUTS 2 Yugozapaden (Figure 2). Overall, 63% of the population lives in the capital, and the remaining 39% resides in the other four districts. The population density, at 105 persons per square kilometer, considerably exceeds the national average of 66.3 persons per square kilometer, which is largely due to the Sofia city district. In 2019, the region contributed 57.9% to the gross value added of services nationwide, with industry representing 34.7%, and agriculture and forestry constituting a modest 14.4% [61].

2.2. Data and Methods

The study analyzes SPEI-3, 6 and 12 based on monthly air temperature and precipitation data for the period 1961–2020 from four meteorological stations: Sofia, Kyustendil, Blagoevgrad, and Sandanski (Figure 1). The stations are representative of the regions with different climatic conditions. According to the Koppen climate classification [59], Sofia and Kyustendil are in the Cfb climate zone, Blagoevgrad is in Cfa and Sandanski is in Csa (Table 1).
The SPEI [63] was used for drought occurrence and severity evaluation because it combines precipitation and temperature data. The index was computed as the difference between the cumulative precipitation and the potential evapotranspiration. SPEI-3, SPEI-6 and SPEI-12 were analyzed because these indices are generally associated with agricultural and hydrological drought, and the agriculture and water are more vulnerable to drought sectors.
To obtain information on the spatial distribution of drought, we used the data from the Global SPEI database (https://spei.csic.es/database.html, accessed on 10 June 2024). The downloaded SPEI data are in netCDF format with a spatial resolution of 0.5°. The calculated SPEI values in the platform are based on monthly precipitation and potential evapotranspiration data from the Climatic Research Unit of the University of East Anglia. SPEI-3, 6 and 12 for the period 1961–2020 were used for the study. The data were processed in the ArcGIS Pro environment to extract individual pixel centroid values from the input GRID. The results show good synchronicity with the SPEI, which is calculated using station data. The correlation coefficients between SPEI based on station data and SPEI for the nearest individual pixel centroid extracted from the Global SPEI database vary from 0.70 to 0.81 for SPEI-3 and from 0.68 to 0.84 for SPEI-6. A similar correlation was established for SPEI-12 also. In both cases, the correlation is statistically significant at level 0.05 and decreases from north to south (Table 2).
To estimate seasonal drought, SPEI-3 was used as follows: for winter, we extracted the values for February, which is based on the total rainfall and temperature for December, January and February; for spring, we took SPEI-3 for May (March, April and May), for summer—the values of the indices for August (June, July and August) and for autumn—the indices for November (September, October, November). The seasons are defined according to [60]. SPEI-6 was used to determine drought characteristics in cold (November–April) and warm (May-October) periods. The present study focuses on moderate, severe and extreme droughts classified according to the values of SPEI (Table 3), [63,64].
The percentage of negative SPEI-3 values for each season over the investigated period was calculated to determine the frequency of dry seasons. We are analyzing the frequency of all dry seasons, regardless of drought severity, as well as the frequency of combined severe and extreme drought events.
Based on the station data maximum drought duration (D), drought magnitude (DM) and average drought intensity (ADI) were determined. We consider the longest sequence of consecutive negative SPEI values to determine the maximum drought duration. According to Cetinkaya and Gunacti [65] and Svoboda et al. [64], drought starts when the SPEI becomes −1 or less and continues until the index reaches values equal to or greater than 0. In the present analyses, the threshold “0” for identifying dry events was used instead of −1, allowing us to include dry events with shorter durations and lower severity [66,67,68]. When the SPEI values are between −1 and 0, we consider this condition as near normal or mild drought conditions [52].
Drought magnitude (DM) represents the positive sum of consecutive negative drought index values over the drought period. It was determined according to Mckee et al. [69] using the following formula:
DM = j = 1 x SPEI i , j
where j is the first month when SPEI becomes negative and x is the last consecutive month with a negative index value.
Drought magnitude (DM) and duration (D) were utilized to calculate the average drought intensity (ADI) over the duration, following the methodologies of McKee et al. [63] and Bonaccorso et al. [70].
ADI = DM D
Drought hazard was determined by calculation of the drought hazard index (DHI), which incorporates both drought severity and probability occurrence. For DHI calculation, a weighting system was applied using the ranking percentiles of SPEI-3 and SPEI-6 extracted from the Global SPEI database. Weight scores are determined according to the SPEI classification as follows: weight = 1 for normal to mild drought (MLD), weight = 2 for moderate drought (MD), weight = 3 for severe drought (SD), and weight = 4 for extreme drought. Further, following the methodology applied by [50,51], each weighted category was divided into four ratings (using the equal break of the cumulative distribution), and the ratings were assigned based on the probability of occurrence of the selected category (Table 3). The DHI was determined as
DHI = MLDr × MLDw + MDr × MDw + SDr × SDw + EDr × EDw
where MLDr, MDr, SDr, and EDr are the ratings of Mild, Moderate, Severe, and Extreme drought categories, and MLDw, MDw, SDw, and EDw are the weights of drought categories.
The DHI values were then classified into five classes of drought hazard (very low; low, moderate, high and very high) using the quantile method.
The drought hazard indices (DHIs) were calculated based on the SPEI-3, SPEI-6, and SPEI-12 extracted from the Global SPEI database, and the data were then joined to the original points used to derive the SPEI values. To perform the spatial analysis, the DHI data were interpolated by the Spline interpolation method. To acquire comprehensive insights into the spatial distribution patterns of drought hazards and severity within the studied area, an analysis of the spatial distribution of areas with different degrees of drought hazard at the level of individual administrative districts was carried out.

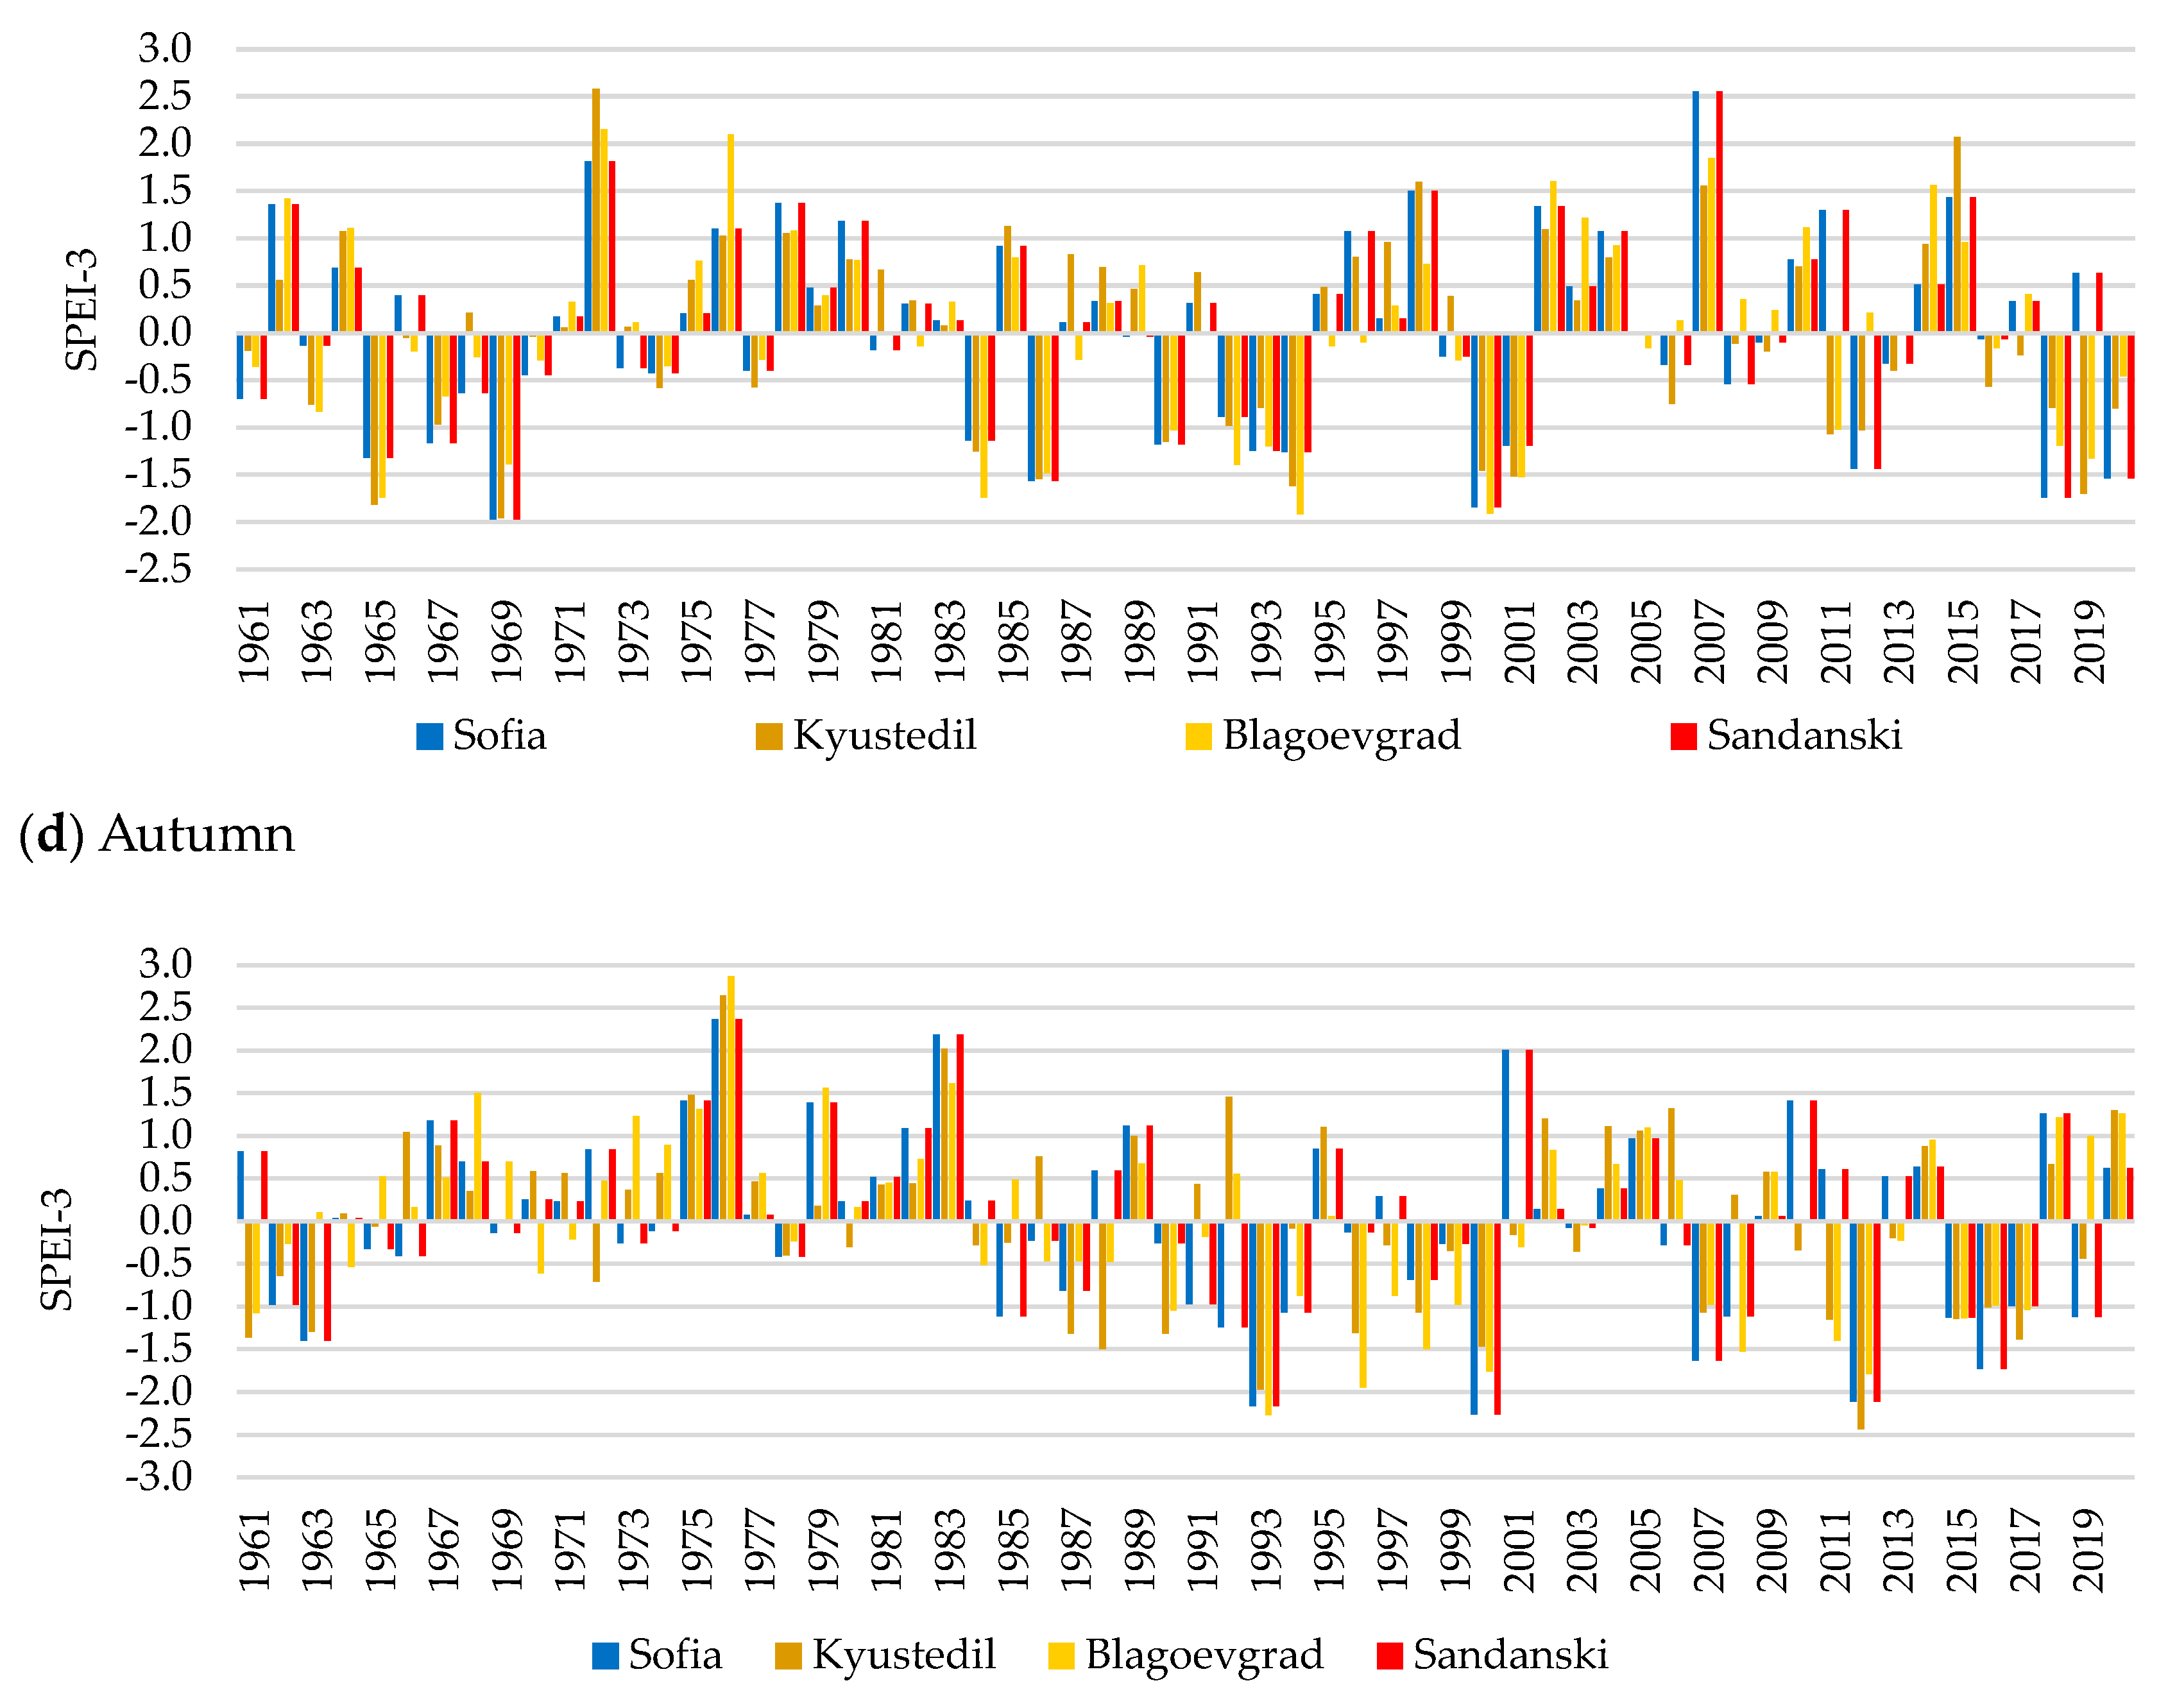
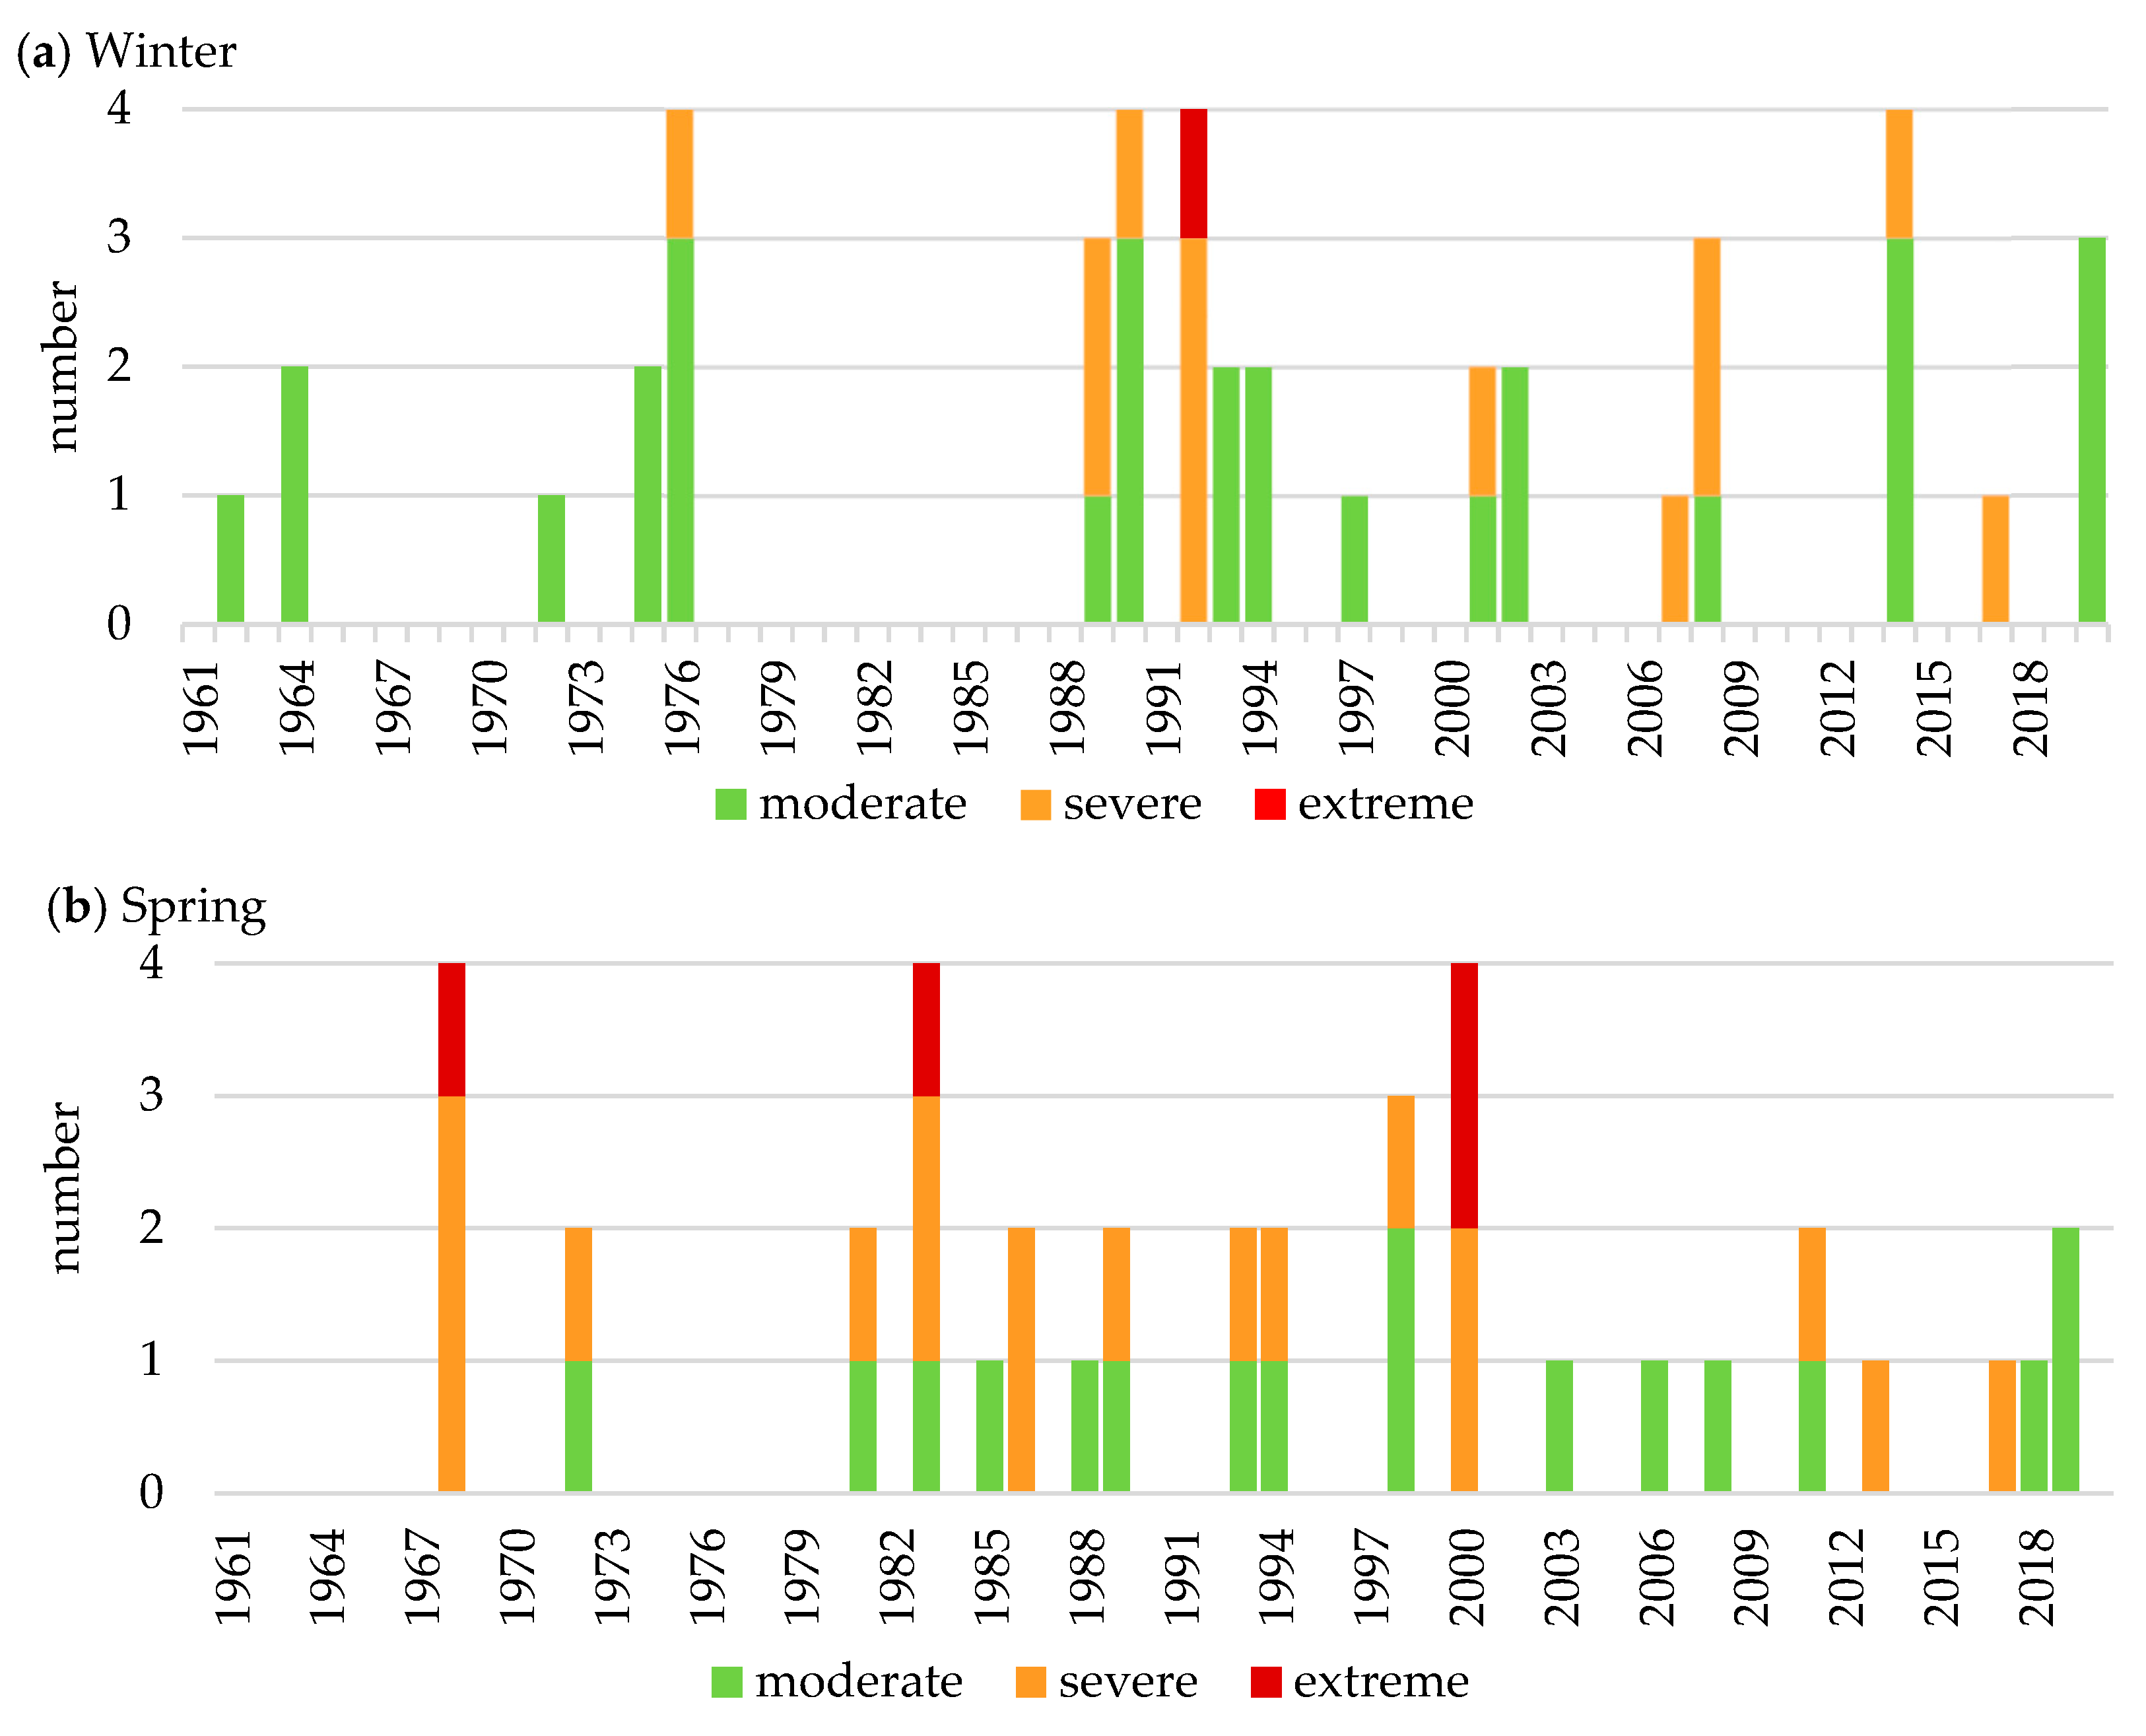
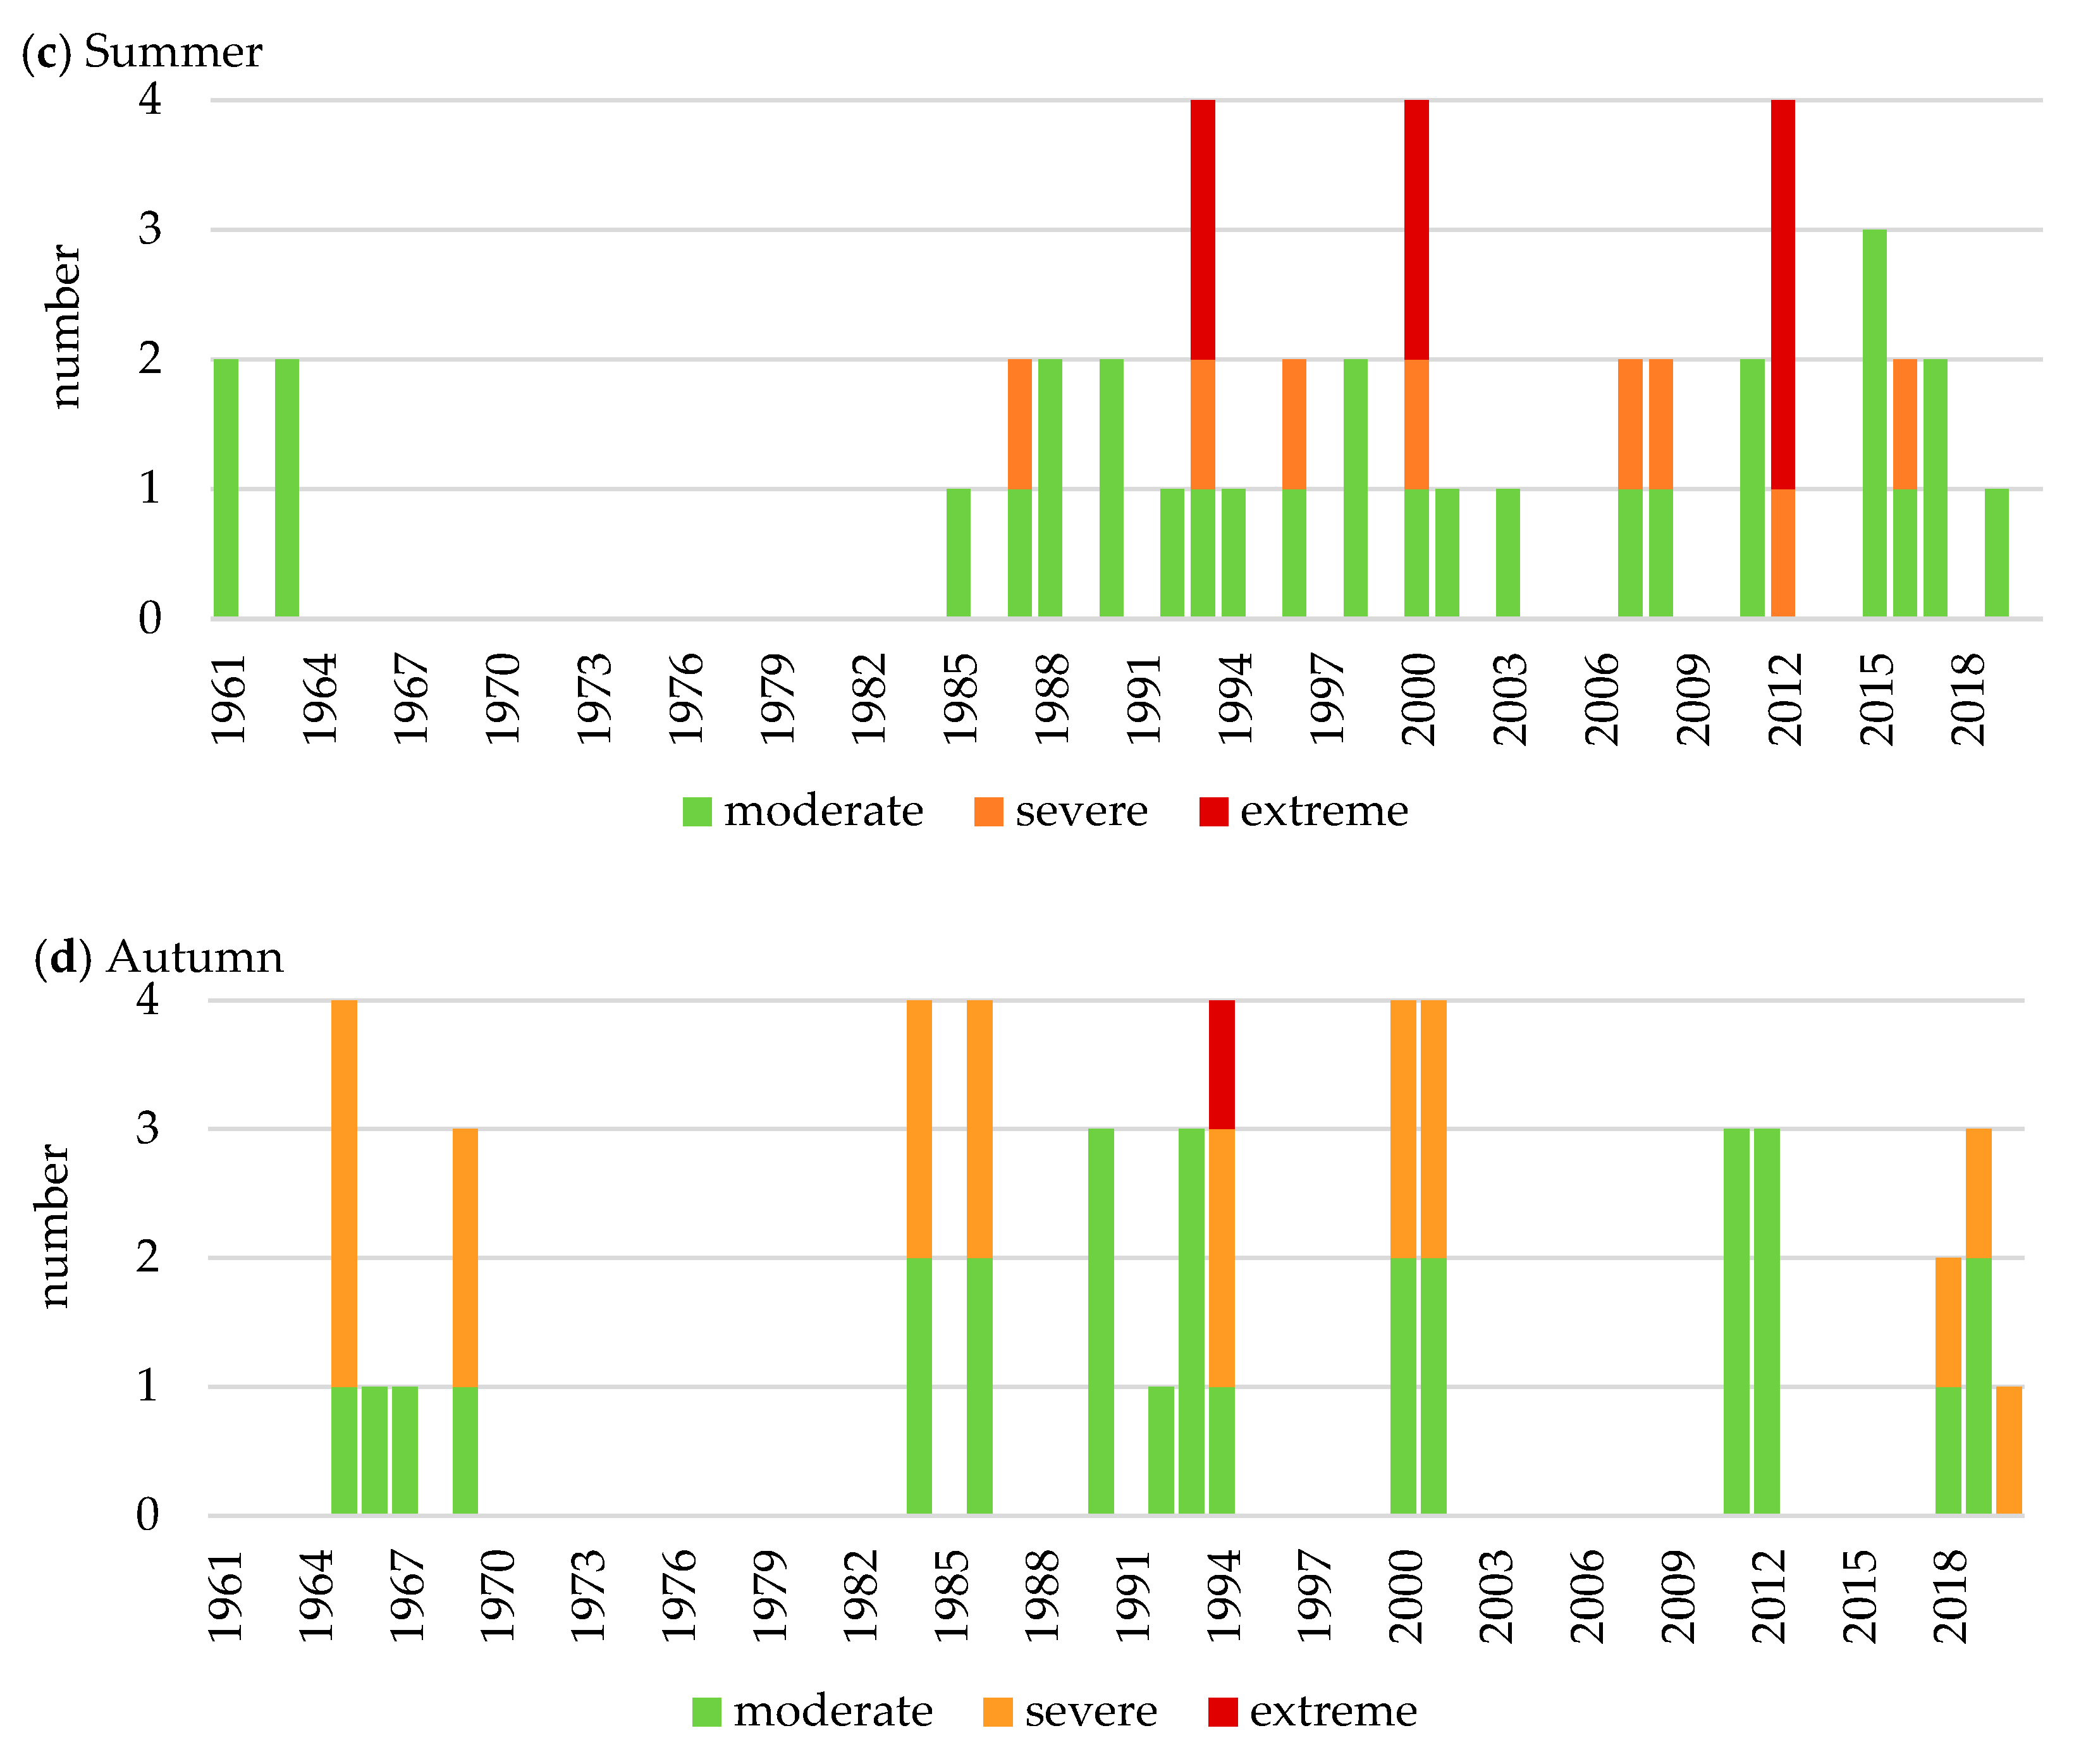
3. Results and Discussion

The study area experiences its highest monthly air temperatures during July and August with Sandanski station recording the highest average temperature in August, exceeding 25 °C for the period 1991–2020. In January, in the northern part of the region (stations Sofia and Kyustendil), the monthly air temperatures are slightly below 0 °C, while winter temperatures in the southern part remain above freezing (Figure 3). The annual cycle of precipitation shows a spring peak in the northern region (station Sofia), whereas in the southern region (stations Blagoevgrad and Sandanski), the precipitation maximum occurs in November and December. When comparing the periods 1991–2020 and 1961–1990, all stations show an increase in air temperature with the most significant rise occurring during the summer months. In contrast, monthly precipitation amounts remain largely unchanged, except for October, where a notable increase in precipitation is recorded at all stations. In the southern stations of Blagoevgrad and Sandanski, August precipitation decreases, and coupled with rising temperatures, this trend contributes to increased drought conditions.
Spatial–temporal drought characteristics at short, medium, and longer time scales play a critical role in shaping management strategies due to their impacts on regional agriculture and water resources [71]. Analyzing drought in the short term (3-month SPEI) is essential for understanding the frequency of dry events particularly regarding their effects on the agricultural sector. Mid-term analysis (employing 6-month and 9-month SPEI) helps in evaluating prolonged drought instances lasting a season or more. Long-term drought analysis (utilizing 12-month and 24-month SPEI) is necessary for delineating drought patterns over an extensive period exceeding the preceding time frames. The present paper focuses on short and mid-term drought patterns analyzing seasonal drought as well as drought occurrence in cold (November–April) and warm (May–October) parts of the year.

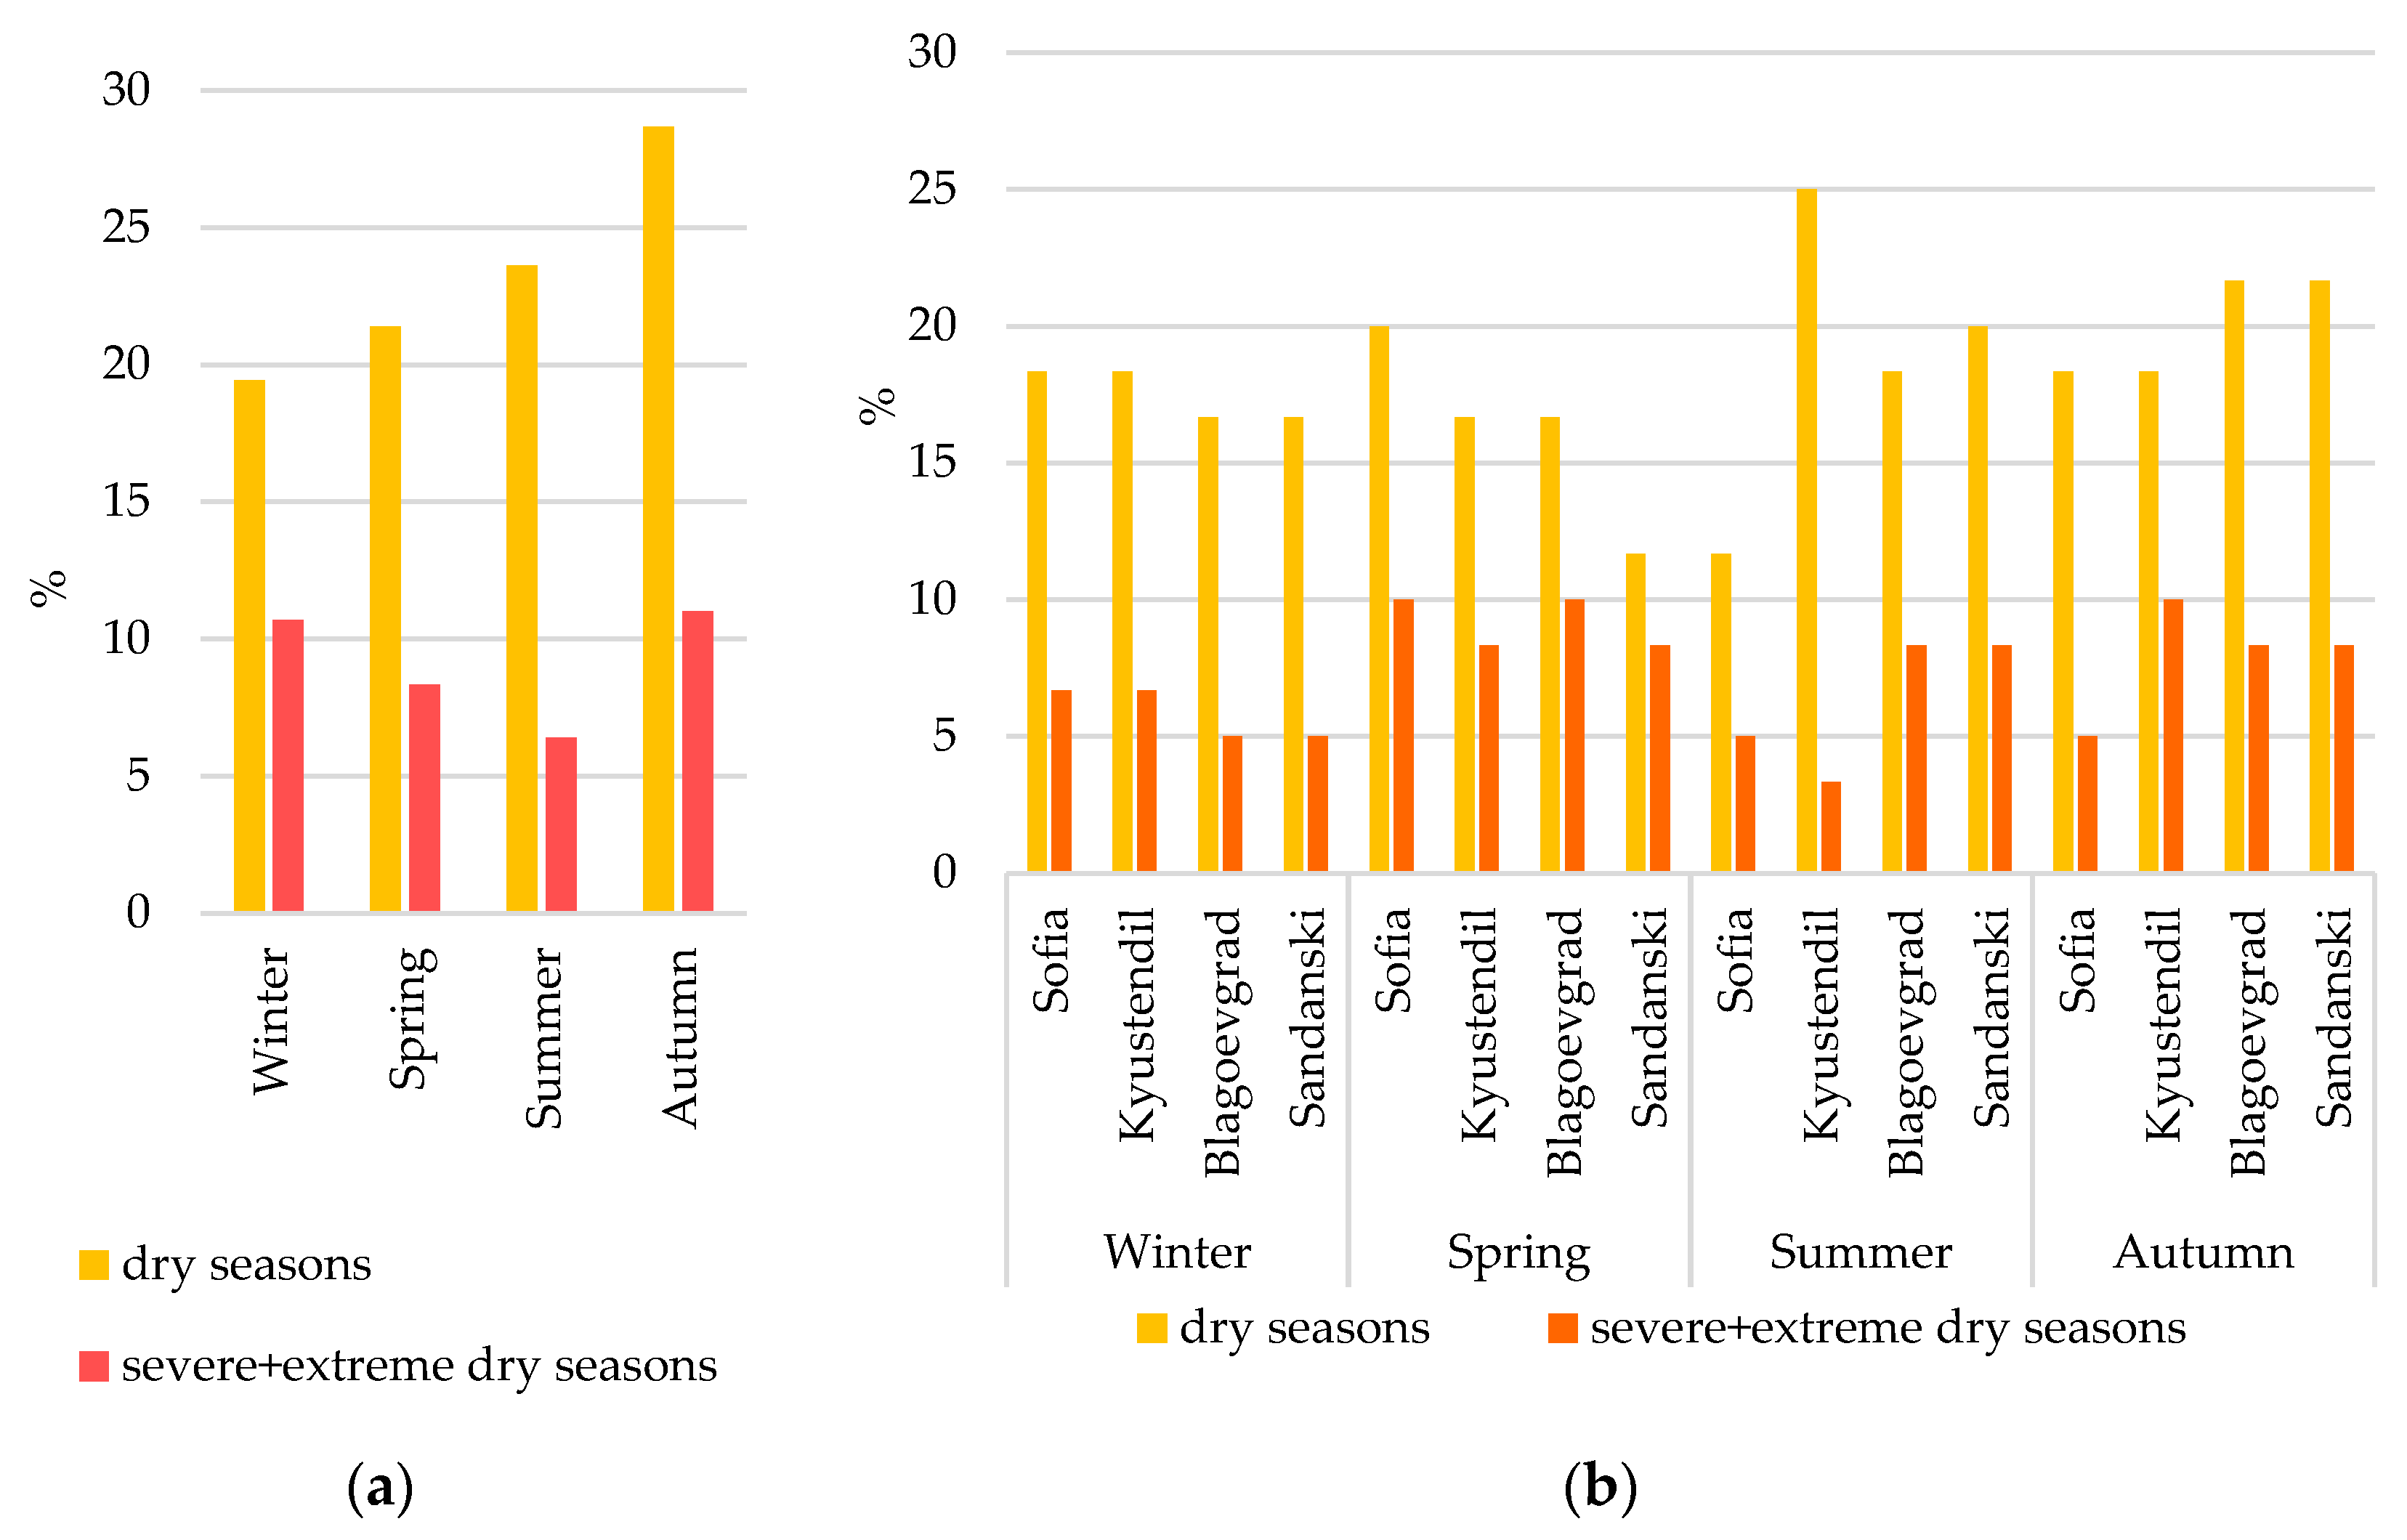
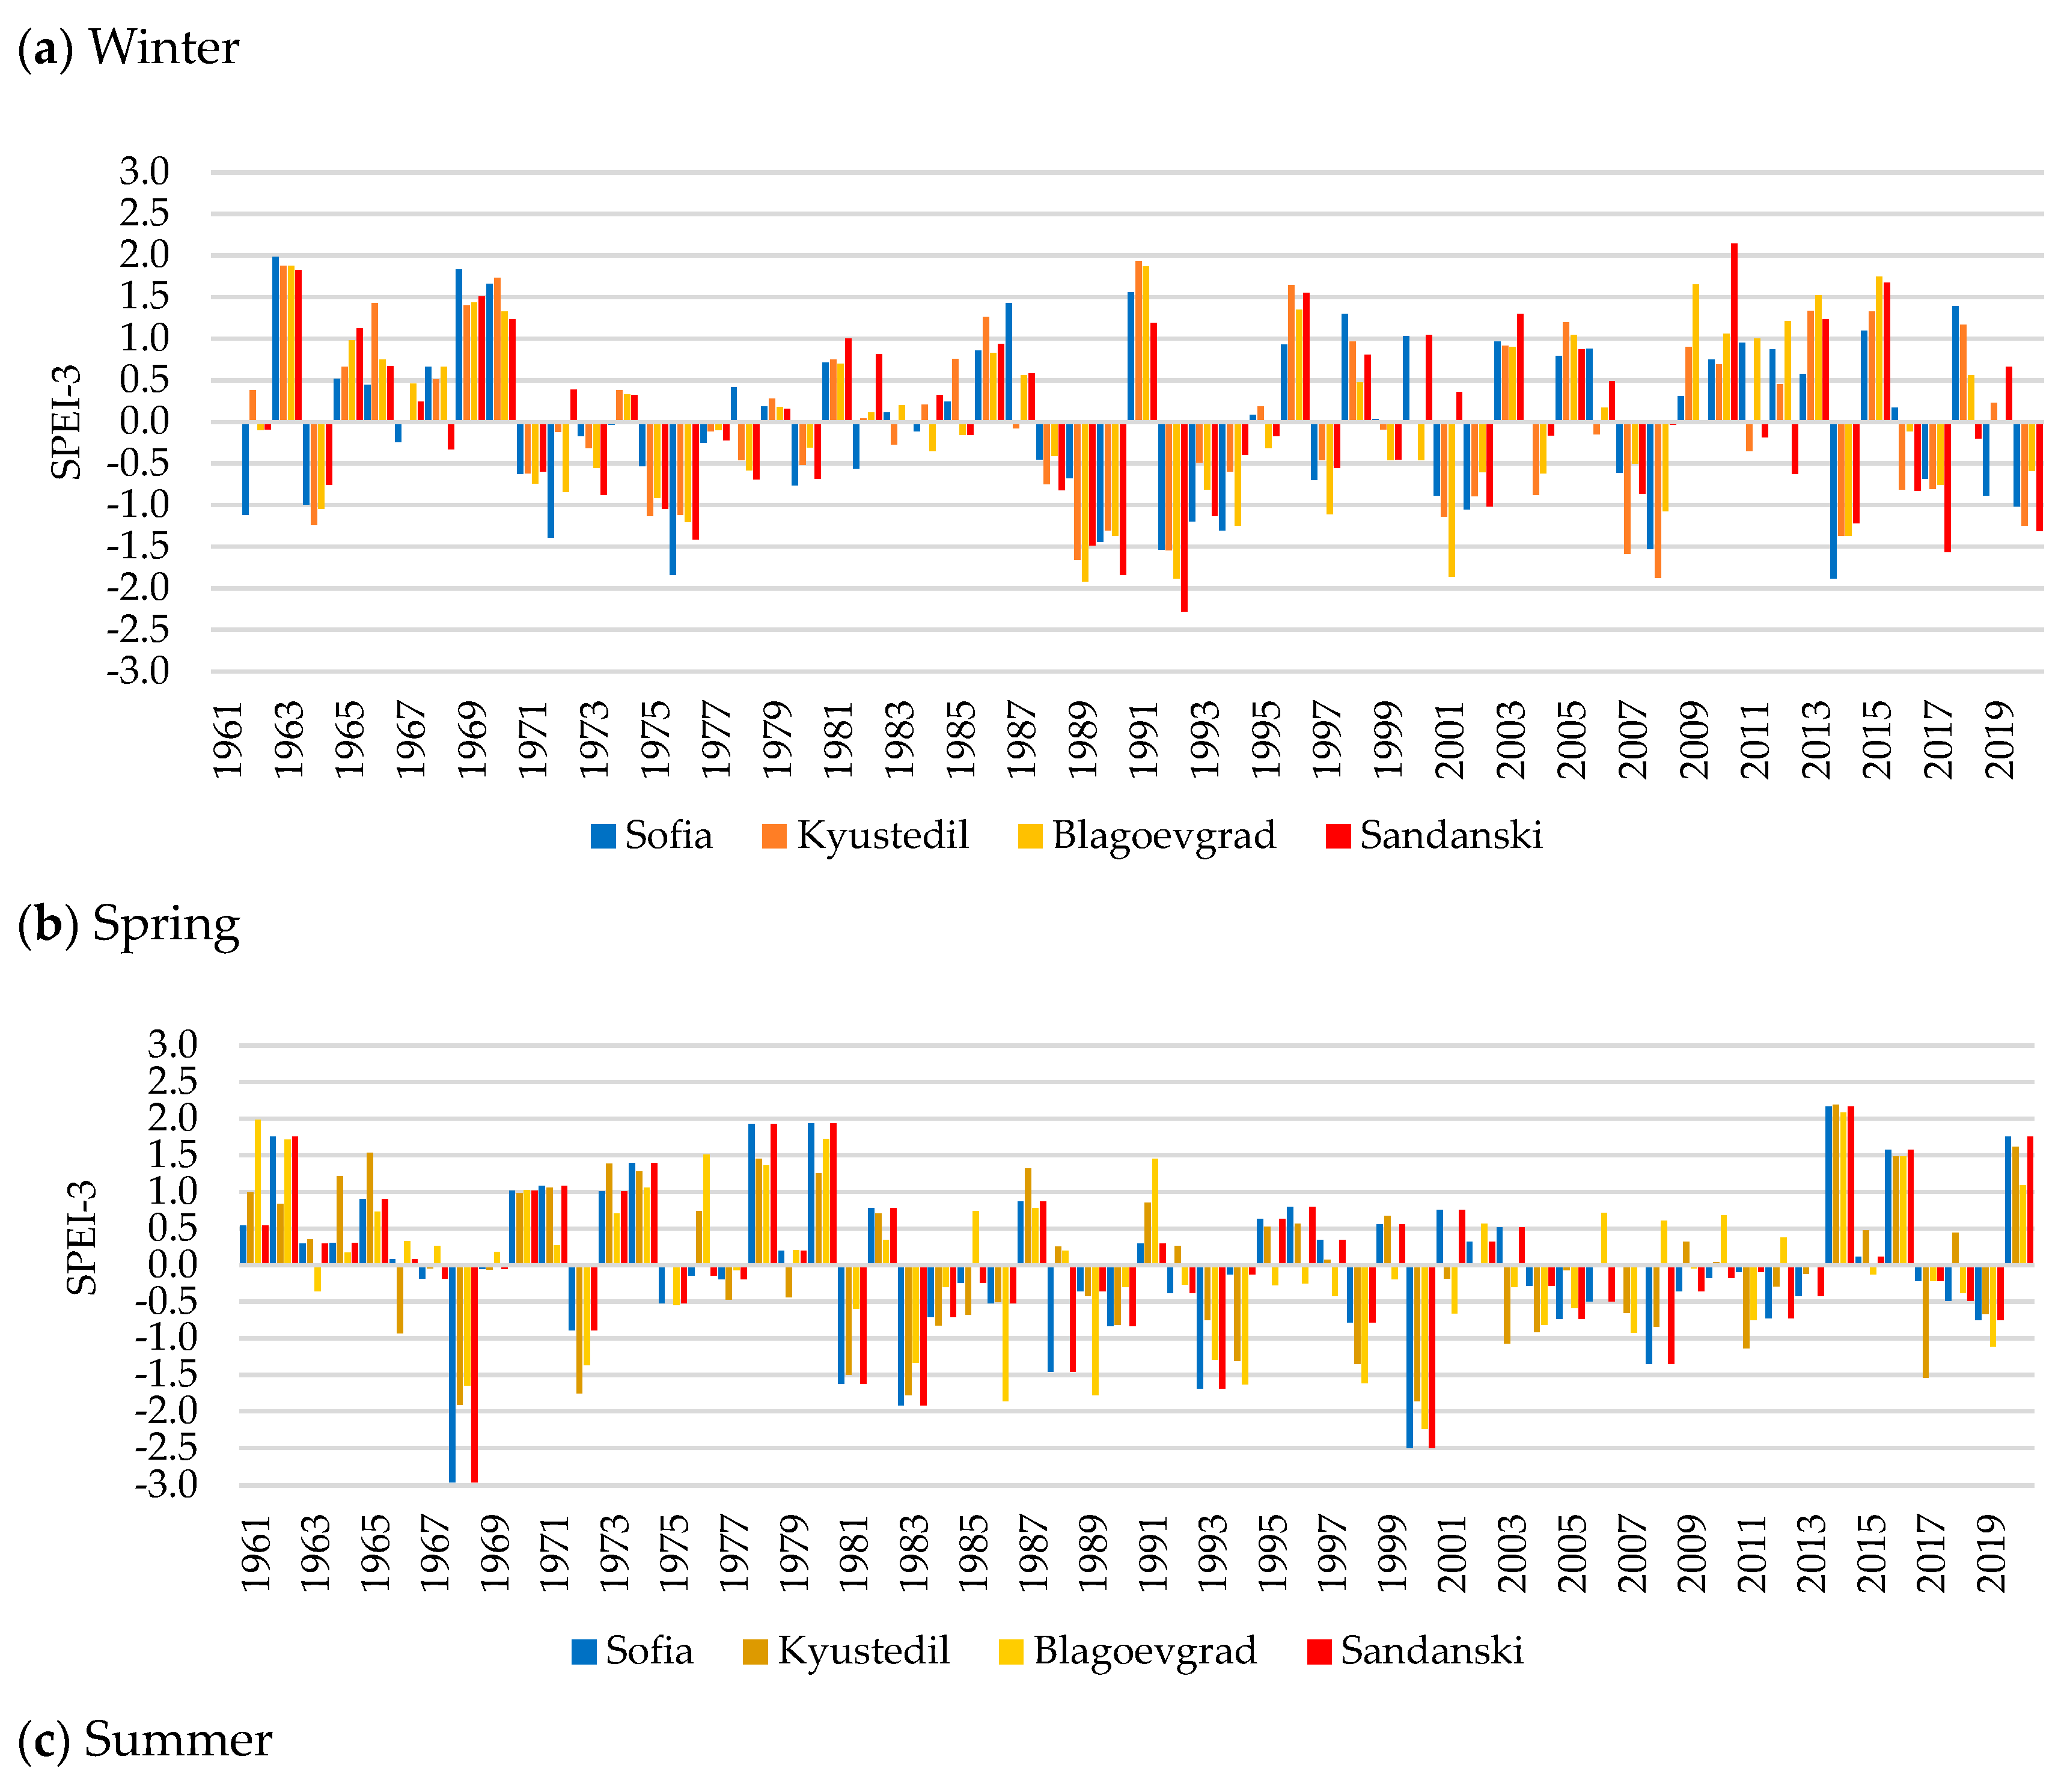
Drought Occurrence and Frequency

A comprehensive analysis of drought necessitates an examination of both its spatial and temporal dimensions. The analysis of the seasonal distribution of drought frequency over the period 1961–2020, based on SPEI-3, reveals a consistent prevalence of near-normal conditions or mild drought across all seasons. Averaging over the study area, the autumn is characterized by the highest frequency of drought events. Furthermore, this period also witnesses the greatest occurrence of severe and extreme drought events. Although a high frequency of drought events is noted in the summer months also, the incidence of extreme drought conditions during this season is the lowest compared to other seasons (Figure 4a). Winter and spring seasons have a lower frequency of drought occurrence, but winter, like autumn, has a higher frequency of extreme drought events than spring and summer.
The analysis of drought frequency based on station data shows similar results, with some variations across the territory (Figure 4b). For winter and spring, the frequency of occurrence of droughts decreases from north to south (from Sofia to Sandanski). For autumn, opposite trends are observed—in general, in this season, droughts are more frequent in the southern part of the studied territory (stations Sandanski and Kyustendil). The largest territorial differences in the frequency of drought were found for summer. Kustendil has the highest frequency of dry summers. Sofia tends to have a lower frequency of extreme/severe dry seasons compared to the other stations, particularly in summer and autumn.
Figure 5 illustrates the temporal variations of the average SPEI calculated based on station data on a 3-month time scale for the individual stations used in this study and various seasons. The SPEI winter trends demonstrate fluctuations, exhibiting both positive and negative deviations, throughout the observed period. In the period from 1970 to 1980, all regions underwent conditions indicative of normal conditions or mild drought. The years between 1987 and 1990 were characterized by drought events with the index descending to −1.5 for all stations in 1992 and −2.00 in 1996 for Sofia and Blagoevgrad, respectively (Figure 5a). Sofia and Kyustendil show similar patterns of variability in drought conditions. Both experienced severe droughts at the end of the 1980s, early 1990s, and again in 2017. Blagoevgrad and Sandanski have fewer instances of extreme drought conditions concentrated only in the early 1990s, suggesting that they may be less prone to severe droughts in winter.
Similar to the winter data, the SPEI-3 for the spring season exhibits fluctuations over the years. In the years 1968 and 2000, the index drops below 2, indicating severe drought conditions, especially for the Sofia and Sandanski regions. The period between 1981 and 2013 exhibited frequent negative SPEI values across all regions, suggesting a tendency toward drier conditions. Sandanski appears to have the most pronounced fluctuations with the lowest SPEI values, indicating a susceptibility to spring droughts. Some years, like 1968, 1983, 1993, and 2000, had negative SPEI values across all regions. This could mean that larger-scale climate changes are affecting the whole area being studied (Figure 5b).
From the 1960s through the early 1980s, the pattern of summer conditions exhibited no definitive trend toward pronounced droughts. In the early 1960s and 1980s, occasional droughts were observed, especially in Kyustendil. In the 1990s, frequent drought events occurred, which were particularly severe in Sofia, Blagoevgrad, and Sandanski. The following two decades had variable conditions with a notable increase in drought events from the middle 2000s. Blagoevgrad experienced droughts of lesser intensity, whereas other regions exhibited a propensity toward drier conditions. Sofia, Kyustendil, and Sandanski experienced more frequent and severe droughts, especially in 2012 (Figure 5c).
Based on the SPEI-3 results, each location has experienced varying degrees of drought conditions during the autumn season. The Sofia region is characterized by considerable interannual variability in SPEI values, with periods of significant drought in the mid-1960s, around 2000, and at the end of the period. In specific years such as 1990, 1993, 1994, 2000, 2012, and 2020, Sofia faced two or more drought seasons, with 1993 and 2000 marked by particularly extreme conditions. In contrast, from 1961 to 1990, there was only one season with extreme drought, while moderate droughts occurred in fifteen seasons. However, from 1991 to 2020, there was a sevenfold increase in the annual frequency of drought seasons.
The Kyustendil region demonstrates a similar frequency and severity of drought events, indicating more prevalent and prolonged drought conditions. This tendency became particularly pronounced in the mid-1980s through to the early 1990s, as highlighted by some of the highest SPEI values observed in the stations under examination. The years 1990, 2000, and 2011 were particularly dry, each experiencing three drought seasons.
Blagoevgrad’s SPEI value patterns exhibit the highest values in the 1990s. Throughout the study period, the Blagoevgrad region experienced the lowest number of drought seasons, totaling 28. However, it had the most instances where droughts lasted two or more seasons, with 12 occurrences. Notably, nine of these extended drought periods took place between 1991 and 2020. The specific years with more than two drought seasons in a single year included 1990, 1993, 1994, and 2000.
The Sandanski region presents high instances of extremely negative SPEI values; significant drought events were observed in 1969 and the early 2000s (Figure 5d) with a total of 31 drought seasons have been recorded. Similar to other regions, two or more drought seasons per year were observed in the period from 1990 to 2020, with eight instances reported. In 1993, drought conditions were recorded throughout the year, encompassing all four seasons.
The analysis of the frequency of drought severity at investigated stations across multiple years, categorized into three severity levels: moderate, severe, and extreme, shows a predominance of moderate drought in winter and severe drought in spring. The extreme drought is more characteristic of summer (Figure 6). In the winter season, moderate droughts are the most frequent. The years 1976, 1990, 2014, and 2020 show a relatively higher frequency of moderate droughts (Figure 6a). Severe droughts are less frequent, with a small peak occurring in the early 1990s and 2008. Extreme drought conditions occurred only in 1992 in one station.
For the spring season, moderate and severe droughts were most detected. The driest springs were observed in 1968 and 2000 when severe or extreme drought occurred in all investigated stations. Among the years with dry springs is also 1983 (Figure 6b).
In summer, the drought events were observed in the second half of the investigated period. The analysis of drought patterns from 1961 to 2020 reveals that moderate droughts were the most commonly recorded at weather stations during the summer months. Severe droughts occurred less frequently than moderate ones. Extreme droughts were represented by the fewest occurrences—only in 1993, 2000, and 2012 (Figure 6c). The driest summer was in 2012 when severe drought was recorded in one of the investigated stations and extreme drought was recorded in the others.
As with the summer, moderate droughts in autumn are the most frequent with severe droughts occurring less often and non-extreme conditions being detected. The data indicate fluctuations in the number of stations reporting moderate and severe droughts. The driest autumn is the autumn of 1994, which is followed by those in 1965, 1984, 1986, 2000, and 2001 (Figure 6d).
In an analysis of drought statistics in southwest Bulgaria from 1961 to 2020, including maximum drought duration, drought magnitude, and average drought intensity, distinct patterns emerged when assessing both the short-term (SPEI-3) and long-term (SPEI-6, 12) indices (Table 4). For SPEI-3, which reflects shorter-term drought conditions, the duration of the longest droughts on record ranged from 18 to 34 months, occurring mostly between 1992 and 1995. The most severe drought, as indicated by the lowest value of SPEI, is registered in Blagoevgrad, while Sandanski has the most intense drought, given its high average intensity (Table 4).
According to the SPEI-6 index, which accounts for longer-term drought trends, all stations reported longer durations of drought periods compared to SPEI-3, ranging from 29 to 47 months. According to this index, the longest drought was recorded in Sandanski (the southernmost part of the investigated area), which lasted 47 months, starting in June 1991. The most severe long-term drought conditions were recorded in Blagoevgrad, starting in March 1999 (Table 4).
SPEI-12 indicates the most severe drought conditions with the lowest SPEI values and highest drought magnitude (DM). Blagoevgrad experienced the longest drought among the four stations, lasting 75 months from June 1996 to August 2002. The lowest SPEI value was −2.89, indicating a severe drought and significantly higher (93.73) drought magnitude values, highlighting the cumulative impact of prolonged drought.
For instance, in the Sofia region, SPEI-3 indicates that a drought began in August 1992 and ended in May 1994, lasting for 22 months. This index captures immediate changes in precipitation, reflecting short-term drought conditions that impact agriculture, water supply, and soil moisture. In contrast, SPEI-6 reveals the drought starting in September 1992 and ending in April 1995, lasting for 32 months. The number of dry months reached 46 according to SPEI-12, with the lowest SPEI value of −3.58 occurring in the period from December 1998 to September 2002. This extended duration suggests that the recovery of groundwater resources, vegetation, and reservoir levels required additional time even after the immediate drought impacts subsided (Table 4).
At all stations and in SPEI time scales of 1, 3, and 12 months, the early to mid-1990s was a period marked by significant droughts, except the long-term droughts that began in Blagoevgrad the early 2000s and in Kyustendil in the beginning of 2011 (Table 4). SPEI values are generally negative, indicating severe to extreme drought conditions, while average drought intensity values are around −1.2, highlighting the intense nature of drought events (Table 4). The small differences in the start and end months between SPEI-3 and SPEI-6 reflect the lag in the reporting of drought conditions by the medium-term index. This lag indicates that the initial drought conditions were not severe enough to immediately affect the medium-term index, but as the drought continues, its cumulative effects become more pronounced.
Based on the DHI, it is found that drought severity increases from north to south. Regions in the northern part face a very low drought hazard, whereas the territories in the southern part are at a higher hazard (Figure 7). The northeastern part of the region, including the Sofia district, exhibits the lowest drought hazard, and the central part of the region shows a predisposition to moderate and low drought events. According to the DHI, which was calculated based on SPEI-3, territories with very low and low drought hazards predominate, and extreme drought is characteristic of the most southwestern parts of the region. The medium-term drought hazard map (according to SPEI-6) shows a decrease in areas with very low and low drought hazards and an increase in areas susceptible to moderate hazards. With high and very high hazards is the southern part of the region. The long-term drought hazard map based on SPEI-12 exhibits results similar to those of the SPEI-6 map with an increase in areas susceptible to low drought hazards and a reduction in territories at moderate and very high drought hazard risk, the latter now concentrated exclusively in the southernmost part of the studied region.
A detailed distribution of the share of areas with different drought hazards within the administrative regions is given in Table 5. In general, medium-term (SPEI-6) and long-term (SPEI-12) drought increases the degree of drought hazard compared to short-term drought (SPEI-3), especially in the northern part of the studied region. In comparison to the short-term drought, a significant decrease in the territories with very low and low hazards and an increase in the areas (by 20%) with a moderate drought hazard is found for the mid-term drought (SPEI-6) for the Pernik district and also for Blagoevgrad. According to SPEI-3 and SPEI-6, the share of areas with a high and very high drought hazard increases in the areas with a transitional and continental-Mediterranean climate (Kyustendil and Blagoevgrad) and slightly decreases according to SPEI-12.
The analysis of drought hazards in southwest Bulgaria, using a standardized precipitation evapotranspiration index (SPEI) for time scales of 3, 6 and 12 months, shows the necessity of a thorough study of drought dynamics and its influence on local agriculture and water resources system management. The results indicate that the autumn months have more drought episodes, which have the highest frequency of both severe and extreme droughts. Similarly, Stoyanova and Nikolova [58], utilizing SPI-3, obtained comparable findings. Their results showed that drought events were predominantly frequent during spring and summer with more instances of extreme drought occurring in autumn and winter compared to spring and summer. Assessing seasonal drought variations is crucial for agricultural planning and water management because dry events occur mainly during the vegetation periods, which is the time for crop development and harvest. The relatively lower frequency of extreme droughts in summer, despite being a typically dry season, suggests a change in drought patterns that could be attributed to climate change over the analyzed period. Winter season with a lower frequency of droughts presents a higher rate of the most severe weather events than spring and summer. The absence of enough rainfall in the winter time could lead to the situation when water resources are depleted during the upcoming dry months, which would aggravate the water shortage issues. A spatial analysis of the drought conditions in southwestern Bulgaria reveals great regional variations. The southern parts of the study area (Sandanski) show a higher frequency of drought conditions in all seasons in contrast to Sofia. Although it is the capital and the most densely populated area, it shows lower frequencies of extreme and severe conditions. These differences underscore the importance of drought management strategies that are region-specific. For further research, the socioeconomic impacts should be integrated with the climate analysis, which would make it possible to have a more comprehensive understanding of the drought impact and would help with increasing the resilience capacity of the population and economy.

4. Conclusions

The study examines the spatiotemporal changes in atmospheric drought in southwestern Bulgaria from 1961 to 2020. The SPEI was chosen for assessing drought occurrence and severity due to its incorporation of both precipitation and temperature data. SPEI indices at the time scales of 3, 6 and 12 months were specifically examined, as these time scales are typically linked to agricultural and hydrological droughts and could contribute significantly to the understanding of drought evolution. The results indicate that after averaging for the region, mild droughts are prevalent throughout the investigated period, with autumn registering the highest number of droughts, including severe and extreme ones. On the other hand, an analysis of SPEI based on data from selected meteorological stations indicates that the driest summers occurred in 1993, 2000, and 2012. Additionally, severe droughts were more frequently observed during the spring in certain years. The spatiotemporal analysis shows that Sandanski (southernmost territories) is the most drought-affected area, while Sofia experiences fewer drought events. The SPEI shows varying drought conditions over the study period, with some regions experiencing particularly severe droughts in the early 1990s and early 2000s.
The obtained results outline the different degrees of intensity of the drought and the differentiated influence of the climatic conditions in the studied territory. Analysis of drought statistics, including maximum duration, magnitude, and average intensity, demonstrates significant drought events in the early to mid-1990s, with the SPEI-3, SPEI-6 and SPEI-12 indicating severe to extreme drought conditions. According to the long-term (SPEI-12) analysis, the longest drought period lasts up to 75 months.
Hazard mapping based on the short-term, medium-term and long-term SPEI analysis shows that different regions demonstrate different levels of drought hazard with the southern parts of the region highly susceptible to droughts. Conversely, the northeastern part, including the Sofia region, has the lowest drought hazard.
The present study provides an in-depth understanding of drought dynamics over the study period, highlighting the importance of these analyses in the development of effective drought management plans. Understanding both short-term and long-term drought conditions is critical for the effective management of water resources. Short-term indices like SPI-3 can help with making immediate decisions regarding agriculture and water supply, while long-term indices like SPIE-6 and 12 are crucial for reservoir management, groundwater assessment, and long-term planning in the water sector. Farmers can utilize SPIE-3 to plan agricultural crops and determine their irrigation needs promptly, while the SPIE-6 and 12 indexes are essential for comprehending long-term trends in soil moisture and effectively planning future crop planting seasons. By identifying areas of severe drought and analyzing the intensity and duration of drought, policymakers and stakeholders will be better equipped to implement targeted actions designed to mitigate the impacts of drought on agriculture, ecosystems and water management, addressing both immediate and prolonged effects of drought.

Author Contributions

Conceptualization, N.N. and K.R.; methodology, N.N. and K.R.; data processing, N.N., L.T. and S.M; analysis, N.N., K.R., L.T. and S.M.; writing—original draft preparation, K.R. and N.N.; writing—review and editing, N.N. and K.R.; visualization, N.N. and L.T. All authors have read and agreed to the published version of the manuscript.

Funding

This research and APC were funded by the National Science Fund, Ministry of Education and Science (Bulgaria), under the project “The Nexus Approach in Agriculture. The water-food nexus in the context of climate change”, supported by the Ministry of Education and Science (MES) of Bulgaria (Agreement No. KП-06-KOCT-2/17.05.2022).

Institutional Review Board Statement

Not applicable.

Informed Consent Statement

Not applicable.

Data Availability Statement

The data presented in this study are available on request from the corresponding author. The data are not publicly available due to privacy

Acknowledgments

The work was partly supported by the National Science Program “Environmental Protection and Reduction of Risks of Adverse Events and Natural Disasters” (Agreement № Д01-27/06.02.2024) and the project No BG-RRP-2.004-0008-C01 (SUMMIT-Sofia University Marking Momentum for Innovation and Technological Transfer), funded by the European Union—NextGenerationEU through the National Recovery and Resilience Plan of the Republic of Bulgaria. We would also like to thank the anonymous reviewers for their time and comments.

Conflicts of Interest

The authors declare no conflicts of interest.

References

  1. Brás, A.; Seixas, J.; Carvalhais, N.; Jägermeyr, J. Severity of drought and heatwave crop losses tripled over the last five decades in Europe. Environ. Res. Lett. 2021, 16, 065012. [Google Scholar] [CrossRef]
  2. Ciais, P.; Reichstein, M.; Viovy, N.; Granier, A.; Ogée, J.; Allard, V.; Aubinet, M.; Buchmann, N.; Bernhofer, C.; Carrara, A.; et al. Europe-wide reduction in primary productivity caused by the heat and drought in 2003. Nature 2005, 437, 529–533. [Google Scholar] [CrossRef] [PubMed]
  3. FAO. Drought emergency. Emergency Ministerial-Level Meeting. Summary of the Co-Chairs; FAO: Rome, Italy, 2011. [Google Scholar]
  4. Grayson, M. Agriculture and drought. Nature 2013, 501, S1. [Google Scholar] [CrossRef] [PubMed]
  5. Tripathy, P.; Mishra, A. How unusual is the 2022 European compound drought and heatwave event? Geophys. Res. Lett. 2023, 50, e2023GL105453. [Google Scholar] [CrossRef]
  6. IPCC: Climate Change 2021: The Physical Science Basis. Contribution of Working Group I to the Sixth Assessment Report of the Intergovernmental Panel on Climate Change; IPCC 2021: Geneva, Switzerland. [CrossRef]
  7. Trenberth, K.; Dai, A.; van der Schrier, G.; Jones, P.D.; Barichivich, J.; Briffa, K.R.; Sheffield, J. Global warming and changes in drought. Nat. Clim. Change 2014, 4, 17–22. [Google Scholar] [CrossRef]
  8. Vicente-Serrano, S.M.; Beguería, S.; López-Moreno, J.I. A multiscalar drought index sensitive to global warming: The standardized precipitation evapotranspiration index. J. Clim. 2010, 23, 1696–1718. [Google Scholar] [CrossRef]
  9. AghaKouchak, A.; Feldman, D.; Hoerling, M.; Huxman, T.; Lund, J. Water and climate: Recognize anthropogenic drought. Nature 2015, 524, 409–411. [Google Scholar] [CrossRef]
  10. Diffenbaugh, N.S.; Swain, D.L.; Touma, D. Anthropogenic warming has increased drought risk in California. Proc. Natl. Acad. Sci. USA 2015, 112, 3931–3936. [Google Scholar] [CrossRef]
  11. Lesk, C.; Rowhani, P.; Ramankutty, N. Influence of extreme weather disasters on global crop production. Nature 2016, 529, 84–87. [Google Scholar] [CrossRef] [PubMed]
  12. Niggli, L.; Huggel, C.; Muccione, V.; Neukom, R.; Salzmann, N. Towards improved understanding of cascading and interconnected risks from concurrent weather extremes: Analysis of historical heat and drought extreme events. PLoS Clim. 2022, 1, e0000057. [Google Scholar] [CrossRef]
  13. Chen, H.; Sun, J. Changes in drought characteristics over China using the standardized precipitation evapotranspiration index. J. Clim. 2015, 28, 5430–5447. [Google Scholar] [CrossRef]
  14. Van Loon, A.F.; Gleeson, T.; Clark, J.; Van Dijk, A.I.J.M.; Stahl, K.; Hannaford, J.; Di Baldassarre, G.; Teuling, A.J.; Tallaksen, L.M.; Uijlenhoet, R.; et al. Drought in the Anthropocene. Nat. Geosci. 2016, 9, 89–91. [Google Scholar] [CrossRef]
  15. Bruins, H.J.; Berliner, P. Bioclimatic aridity, climatic variability, drought and desertification: Definitions and management options. Geo J. Libr. 1998, 41, 97–116. [Google Scholar] [CrossRef]
  16. Field, J.A.; Breshears, D.D.; Bradford, J.B.; Law, D.J.; Feng, X. Forest management under megadrought: Urgent needs at finer scale and higher intensity. Front. For. Glob. Change 2020, 3, 502669. [Google Scholar] [CrossRef]
  17. MacDonald, G.M. Severe and sustained drought in southern California and the West: Present conditions and insights from the past on causes and impacts. Quat. Int. 2007, 173–174, 87–100. [Google Scholar] [CrossRef]
  18. Quiring, S.M.; Papakryiakou, T.N. An evaluation of agricultural drought indices for the Canadian prairies. Agric. For. Meteorol. 2003, 118, 49–62. [Google Scholar] [CrossRef]
  19. Beran, M.A.; Rodier, J.A. Hydrological Aspects of Drought: A Contribution to the International Hydrological Programme, (Studies and Reports in Hydrology IHP; UNESCO: Paris, France, 1985. [Google Scholar]
  20. Hisdal, H.; Stahl, K.; Tallaksen, L.M.; Demuth, S. Have streamflow droughts in Europe become more severe or frequent? Int. J. Climatol. 2001, 21, 317–333. [Google Scholar] [CrossRef]
  21. Tallaksen, L.M.; Van Lanen, H.A.J. Hydrological Drought, Processes and Estimation Methods for Streamflow and Groundwater, Developments in Water Sciences; Elsevier: Amsterdam, The Netherlands, 2004; p. 48. [Google Scholar]
  22. UNDRR. Global Assessment Report on Disaster Risk Reduction; United Nations Office for Disaster Risk Reduction (UNDRR): Geneva, Switzerland, 2019. [Google Scholar]
  23. Stahl, K.; Hisdal, H.; Hannaford, J.; Tallaksen, L.M.; Lanen, H.; Sauquet, É.; Sauquet, E.; Demuth, S.; Fendekova, M.; Jódar, J. Streamflow trends in Europe: Evidence from a dataset of near-natural catchments. Hydrol. Earth Syst. Sci. 2010, 14, 2367–2382. [Google Scholar] [CrossRef]
  24. Sheffield, J.; Wood, E.F. Global Trends and Variability in Soil Moisture and Drought Characteristics, 1950–2000, from Observation-Driven Simulations of the Terrestrial Hydrologic Cycle. J. Clim. 2008, 21, 432–458. [Google Scholar] [CrossRef]
  25. Haile, G.G.; Tang, Q.; Sun, S.; Huang, Z.; Zhang, X.; Liu, X. Droughts in East Africa: Causes, impacts and resilience. Earth-Sci. Rev. 2019, 193, 146–161. [Google Scholar] [CrossRef]
  26. Rebetez, M.; Mayer, H.; Dupont, O.; Schindler, D.; Gartner, K.; Kropp, J.; Menzel, A. Heat and drought 2003 in Europe: A climate synthesis. Ann. For. Sci. 2006, 63, 569–577. [Google Scholar] [CrossRef]
  27. Salimi, H.; Asadi, E.; Darbandi, S. Meteorological and hydrological drought monitoring using several drought indices. Appl. Water Sci. 2021, 11, 11. [Google Scholar] [CrossRef]
  28. Laaha, G.; Parajka, J.; Viglione, A.; Koffler, D.; Haslinger, K.; Schöner, W.; Zehetgruber, J.; Blöschl, G. A three-pillar approach to assessing climate impacts on low flows. Hydrol. Earth Syst. Sci. 2016, 20, 3967–3985. [Google Scholar] [CrossRef]
  29. Tsakiris, G.; Nalbantis, I.; Vangelis, H.; Verbeiren, B.; Huysmans, M.; Tychon, B.; Jacquemin, I.; Canters, F.; Vanderhaegen, S.; Engelen, G.; et al. A system-based paradigm of drought analysis for operational management. Water Resour. Manag. 2013, 27, 5281–5297. [Google Scholar] [CrossRef]
  30. Beniston, M. The 2003 Heat Wave in Europe: A Shape of Things to Come? An Analysis Based on Swiss Climatological Data and Model Simulations. Geophys. Res. Lett. 2004, 31, L02202. [Google Scholar] [CrossRef]
  31. Barriopedro, D.; Fischer, E.M.; Luterbacher, J.; Trigo, R.M.; García-Herrera, R. The Hot Summer of 2010: Redrawing the Temperature Record Map of Europe. Science 2010, 332, 220–224. [Google Scholar] [CrossRef] [PubMed]
  32. Baruth, B.; Bassu, S.; Bussay, A.; Ceglar, A.; Cerrani, I.; Chemin, Y.; De Palma, P.; Fumagalli, D.; Lecerf, R.; Manfron, G.; et al. Crop Monitoring in Europe, JRC MARS Bulletin; Publications Office of the European Union: Luxembourg, 2020; Volume 28, p. JRC120746. [Google Scholar]
  33. Boergens, E.; Güntner, A.; Dobslaw, H.; Dahle, C. Quantifying the Central European Droughts in 2018 and 2019 with 512 GRACE Follow-On. Geophys. Res. Lett. 2020, 47, e2020GL087285. [Google Scholar] [CrossRef]
  34. Liu, Z.; Li, C.; Zhou, P.; Chen, X. A probabilistic assessment of the likelihood of vegetation drought under varying climate conditions across China. Sci. Rep. 2016, 6, 3510. [Google Scholar] [CrossRef] [PubMed]
  35. Ionita, M.; Tallaksen, L.M.; Kingston, D.G.; Stagge, J.H.; Laaha, G.; Lanen, H.A.J.; Van Scholz, P.; Chelcea, S.M.; Haslinger, K.; Van Lanen, H.A.J.; et al. The European 2015 drought from a climatological perspective. Hydrol. Earth Syst. Sci. 2017, 21, 1397–1419. [Google Scholar] [CrossRef]
  36. Peters, W.; Bastos, A.; Ciais, P.; Vermeulen, A. A historical, geographical and ecological perspective on the 2018 European summer drought. Philos. Trans. R. Soc. B 2020, 375, 20190505. [Google Scholar] [CrossRef] [PubMed]
  37. Faranda, D.; Pascale, S.; Bulut, B. Persistent anticyclonic conditions and climate change exacerbated the exceptional 2022 European-mediterranean drought. Environ. Res. Lett. 2023, 18, 034030. [Google Scholar] [CrossRef]
  38. Fischer, E.M.; Sippel, S.; Knutti, R. Increasing probability of record-shattering climate extremes. Nat. Clim. Change 2021, 11, 689–695. [Google Scholar] [CrossRef]
  39. Spinoni, J.; Vogt, J.; Naumann, G.; Barbosa, P.; Dosio, A. Will drought events become more frequent and severe in Europe? Int. J. Climatol. 2017, 38, 1718–1736. [Google Scholar] [CrossRef]
  40. EEA. European Waters—Assessment of Status and Pressures; EEA: Boston, MA, USA, 2018; ISBN 978-92-9213-947-6. [Google Scholar]
  41. IPCC. SPM—Summary for Policymakers. In Global Warming of 1.5°C. An IPCC Special Report on the Impacts of Global Warming of 1.5°C above Pre-Industrial Levels and Related Global Greenhouse Gas Emission Pathways, in the Context of Strengthening the Global Response to the Threat of Climate Change, Sustainable Development, and Efforts to Eradicate Poverty; Masson-Delmotte, V., Zhai, P., Pörtner, H.-O., Roberts, D., Skea, J., Shukla, P.R., Pirani, A., Moufouma-Okia, W., Péan, C., Pidcock, R., et al., Eds.; Cambridge University Press: Cambridge, UK; New York, NY, USA, 2022; pp. 3–24. [Google Scholar] [CrossRef]
  42. Blauhut, V.; Gudmundsson, L.; Stahl, K. Towards pan-European drought risk maps. Quantifying the link between drought indices and reported drought impacts. Env. Res. Lett. 2015, 10, 14008. [Google Scholar] [CrossRef]
  43. Blauhut, V. The triple complexity of drought risk analysis and its visualization via mapping: A review across scales and sectors. Earth-Sci. Rev. 2020, 210, 103345. [Google Scholar] [CrossRef]
  44. Alexandrov, V. Methods for Monitoring and Estimation of Drought Vulnerability in Bulgaria; National Institute of Meteorology and Hydrology and Bulgarian Academy of Sciences: Sofia, Bulgaria, 2011; p. 216. (In Bulgarian) [Google Scholar]
  45. Nikolova, N.; Alieva, G.; Voislavova, I. Drought periods in non-mountainous part of South Bulgaria on the background of climate change. Geogr. Pannonica 2012, 16, 18–25. [Google Scholar] [CrossRef]
  46. Popova, Z.; Ivanova, M.; Martins, D.; Pereira, L.S.; Doneva, K.; Alexandrov, V.; Kercheva, M. Vulnerability of Bulgarian agriculture to drought and climate variability with focus on rainfed maize systems. Nat. Hazards 2014, 74, 865–886. [Google Scholar] [CrossRef]
  47. Radeva, K.; Nikolova, N.; Gera, M. Assessment of hydro-meteorological drought in the Danube Plain, Bulgaria. Hrvat. Geogr. Glas. 2018, 80, 7–25. [Google Scholar] [CrossRef]
  48. Petkova, B.; Kuzmova, K.; Berova, M. The main abiotic stress factors limiting crop cultivation and production in Bulgaria. Climate changes, drought, water deficit and heat stress. Agric. Sci. Agrar. Nauk. 2019, 11, 13–22. Available online: http://agrarninauki.au-plovdiv.bg/2019-2/02_26/ (accessed on 15 June 2024). [CrossRef]
  49. Verdon-Kidd, D.C.; Kiem, A.S. Quantifying drought risk in a non-stationary climate. J. Hydrometeorol. 2010, 11, 1019–1031. [Google Scholar] [CrossRef]
  50. Rajsekhar, D.; Singh, V.P.; Mishra, A.K. Integrated drought causality, hazard, and vulnerability assessment for future socioeconomic scenarios: An information theory perspective. J. Geophys. Res. Atmos. 2015, 120, 6346–6378. [Google Scholar] [CrossRef]
  51. Jia, H.; Pan, D. Drought risk assessment in Yunnan province of China based on wavelet analysis. Adv. Meteorol. 2016, 2016, 1579415. [Google Scholar] [CrossRef]
  52. Dabanlı, İ. Drought risk assessment by using drought hazard and vulnerability indexes. Nat. Hazards Earth Syst. Sci. Discuss. 2018. [Google Scholar] [CrossRef]
  53. Tokarczyk, T.; Szalińska, W. Drought hazard assessment in the process of drought risk management. Acta Sci. Pol. Form. Circumiectus 2018, 18, 217–229. [Google Scholar] [CrossRef]
  54. Singh, G.R.; Jain, M.; Gupta, V. Spatiotemporal assessment of drought hazard, vulnerability and risk in the Krishna river basin, India. Nat. Hazards 2019, 99, 611–635. [Google Scholar] [CrossRef]
  55. Radeva, K.; Nikolova, N. Hydrometeorological Drought Hazard and Vulnerability Assessment for Northern Bulgaria. Geogr. Pannonica 2020, 24, 112–123. [Google Scholar] [CrossRef]
  56. Koleva, E.; Alexandrov, V. Drought in the Bulgarian low regions during the 20th century. Theor. Appl. Climatol. 2008, 92, 113–120. [Google Scholar] [CrossRef]
  57. Stoyanova, R.; Nikolova, N. Meteorologica. Drought in Southwest Bulgaria during the period 1961–2020. J. Geogr. Inst. Jovan Cvijić SASA 2022, 72, 243–255. [Google Scholar] [CrossRef]
  58. Evgeniev, R.; Malcheva, K.; Marinova, T.; Chervenkov, H.; Bocheva, L. Assessment of drought in Bulgaria in recent years through the standardized precipitation index. Int. Multidiscip. Sci. GeoConf. SGEM 2023, 23, 245–252. [Google Scholar] [CrossRef]
  59. Rachev, G.; Nikolova, N. Climate of Bulgaria. In Annual of Sofia University “St. Kliment Ohridski”; Book 2—Geography; Faculty of Geology and Geography: Sofia, Bulgaria, 2009; Volume 101, pp. 17–29. (In Bulgarian) [Google Scholar]
  60. Topliysky, D. The Climate of Bulgaria; Foundation Amstels: Sofia, Bulgaria, 2006; 300p. (In Bulgarian) [Google Scholar]
  61. Nacional Statistical Institute Bulgaria. Available online: https://www.nsi.bg/index.php (accessed on 1 March 2024).
  62. Kottek, M.; Grieser, J.; Beck, C.; Rudolf, B.; Rubel, F. World Map of the Köppen-Geiger climate classification updated. Meteorol. Z. 2006, 15, 259–263. [Google Scholar] [CrossRef]
  63. McKee, T.B.; Doesken, N.J.; Kleist, J. The relationship of drought frequency and duration to time scales. In Proceedings of the 8th Conference on Applied Climatology, Anaheim, CA, USA, 17–22 January 1993; Volume 17, pp. 179–183. [Google Scholar]
  64. Svoboda, M.; Hayes, M.; Wood, D. Standardized Precipitation Index: User Guide (WMO-No. 1090); World Meteorological Organization: Geneva, Switzerland, 2012; Available online: https://library.wmo.int/doc_num.php?explnum_id=7768 (accessed on 10 June 2024).
  65. Cetinkaya, C.P.; Gunacti, M.C. Meteorological and Agricultural Drought Risk Assessment via Kaplan–Meier Survivability Estimator. Agriculture 2024, 14, 503. [Google Scholar] [CrossRef]
  66. Domínguez-Castro, F.; Vicente-Serrano, S.M.; Tomás-Burguera, M.; Peña-Gallardo, M.; Beguería, S.; El Kenawy, A.; Luna, Y.; Morata, A. High spatial resolution climatology of drought events for Spain: 1961–2014. Int. J. Clim. 2019, 39, 5046–5062. [Google Scholar] [CrossRef]
  67. Limones, N.; Pita-López, M.F.; Camarillo-Naranjo, J.M. A new index to assess meteorological drought: The Drought Exceedance Probability Index (DEPI). Atmósfera 2021, 35, 67–88. [Google Scholar] [CrossRef]
  68. Nikolova, N.; Micu, D.M.; Dumitrescu, A.; Radeva, K.; Paraschiv, M.; Cheval, S.; Todorov, L. A SPEI-Based Approach to Drought Hazard, Vulnerability and Risk Analysis in the Lower Danube River Region. In The Lower Danube River, Earth and Environmental Sciences Library; Negm, A., Zaharia, L., Ioana-Toroimac, G., Eds.; Springer: Cham, Switzerland, 2022. [Google Scholar] [CrossRef]
  69. McKee, T.B.; Doesken, N.J.; Kleist, J. Drought monitoring with multiple time scales. In Proceedings of the 9th Conference on Applied Climatology, Dallas, TX, USA, 15–20 January 1995; p. 233236. [Google Scholar]
  70. Bonaccorso, B.; Bordi, I.; Cancelliere, A.; Rossi, G.; Sutera, A. Spatial variability of drought: An analysis of the SPI in Sicily. Water Resour. Manag. 2003, 17, 273–296. [Google Scholar] [CrossRef]
  71. Choudhary, A.; Senthil-Kumar, M. Drought: A context-dependent damper and aggravator of plant diseases. Plant Cell Environ. 2024, 47, 2109–2126. [Google Scholar] [CrossRef] [PubMed]
Figure 1. Study area with the location of the meteorological stations. The red rectangle showed the territory for which SPEI data were downloaded from the global SPEI database (see Section 2.2).
Atmosphere 15 00888 g001
Figure 2. Land cover map of the study area (NUST 2 Yugozapaden).
Atmosphere 15 00888 g002
Figure 3. Climate charts for selected meteorological stations (yellow line—average monthly temperature for 1961–1990; red line—average monthly temperature for 1991–2020; light blue bar—the monthly amount of precipitation for 1961–1990; dark blue bar–the monthly amount of precipitation for 1991–2020).
Atmosphere 15 00888 g003
Figure 4. Frequency of dry seasons as a percentage of all years in the period 1961–2020: (a) average for the study area based on model data from SPEI database; (b) based on station data.
Atmosphere 15 00888 g004
Figure 5. Time sequences of seasonal SPEI.
Atmosphere 15 00888 g005aAtmosphere 15 00888 g005b
Figure 6. Number of stations with different drought severity (based on data from four investigated stations).
Atmosphere 15 00888 g006aAtmosphere 15 00888 g006b
Figure 7. Drought hazard index based on SPEI-3, SPEI-6 and SPEI-12.
Atmosphere 15 00888 g007
Table 1. Meteorological stations used in the research—location and climate zones.
StationsAltitude
(m a.s.l.)
Latitude (N)Longitude (E)Climate Zone
Sofia58642°39′23°23′Cfb
Kyustendil52042°16′22°43′Cfb
Blagoevgrad42442°00′23°05′Cfa
Sandanski20641°33′23°16′Csa
The description of climate code is as follows [62]: Cfb—temperate, without dry season, warm summer; Cfa—temperate, without dry season, hot summer; Csa—temperate, dry summer, hot summer.
Table 2. Correlation coefficients between SPEI, calculated based on station data and SPEI for the nearest individual pixel centroid extracted from the Global SPEI database.
Pixel Centroid CoordinatesSPEI-3 SPEI-6 SPEI-12
Sofia42°45′ N; 23°15′ E0.810.840.86
Kyustendil42°15′ N; 22°46′ E0.790.780.78
Blagoevgrad42°15′ N; 23°15′ E0.720.720.71
Sandanski41°45′ N; 23°15′ E0.700.680.65
Table 3. Drought categories based on SPEI probability (%).
SPEIDrought Category
2.3SPEI < −2.0extremely dry
4.4−2.0 < SPEI < −1.5severely dry
9.2−1.5 < SPEI < −1.0moderately dry
68.2−1 < SPEI < 1.0near normal
9.21.0 < SPEI < 1.5moderately wet
4.41.5 < SPEI < 2.0very wet
2.32.0 < SPEIextremely wet
After: Dabanli [52].
Table 4. Maximum drought duration, drought magnitude, and average drought intensity in southwest Bulgaria for SPEI-3 and SPEI-6 over the period 1961–2020.
Meteorological StationMaximum Duration/Months/Start EndLowest SPEI ValuesDMADI
SPEI-3
Sofia22Aug 1992May 1994−2.0921.22−0.96
Kyustendil28Oct 1992Jan 1995−1.9325.26−0.90
Blagoevgrad34Sep 1992Jun 1995−2.2742.12−1.24
Sandanski18Jul 1992Dec 1993−2.3524.92−1.38
SPEI-6
Sofia32Sep 1992Apr 1995−2.0737.65−1.18
Kyustendil29Dec 1992Apr 1995−1.9434.11−1.18
Blagoevgrad41Mar 1999Jul 2002−2.7949.78−1.21
Sandanski47Jun 1991Apr 1995−2.7559.60−1.27
SPEI-12
Sofia46Dec 1998Sep 2002−3.5856.80−1.23
Kyustendil33Feb 2011Oct 2013−2.0537.09−1.12
Blagoevgrad75Jun 1996Aug 2002−2.8993.73−1.23
Sandanski45Dec 1991Aug 1995−2.4929.48−0.66
Table 5. Areas with different drought hazards (in % of the territory of the district).
NUTS 3 Drought Hazard
Very LowLowModerateHighVery High
Sofia citySPEI-3964
SPEI-67426
SPEI-1230691
SofiaSPEI-355396
SPEI-666331
SPEI-1258357
PernikSPEI-323365
SPEI-6 1585
SPEI-12 694
KyustendilSPEI-3 144244
SPEI-6 450424
SPEI-12 193744
BlagoevgradSPEI-3422213519
SPEI-6 1434015
SPEI12 27233515
Disclaimer/Publisher’s Note: The statements, opinions and data contained in all publications are solely those of the individual author(s) and contributor(s) and not of MDPI and/or the editor(s). MDPI and/or the editor(s) disclaim responsibility for any injury to people or property resulting from any ideas, methods, instructions or products referred to in the content.

