Article

Spatiotemporal Patterns of Typhoon-Induced Extreme Precipitation in Hainan Island, China, 2000–2020, Using Satellite-Derived Precipitation Data

1
School of Ecology, Hainan University, Haikou 570228, China
2
Center for Eco-Environment Restoration Engineering of Hainan Province, Hainan University, Haikou 570228, China
3
Hainan Meteorological Information Center, Hainan Key Laboratory of South China Sea Meteorological Disaster Prevention and Mitigation, Haikou 570203, China
4
School of Earth Science and Engineering, Hebei University of Engineering, Handan 056038, China
5
Lanzhou Central Meteorological Observatory, Lanzhou 730020, China
*
Author to whom correspondence should be addressed.
Atmosphere 2024, 15(8), 891; https://doi.org/10.3390/atmos15080891
Submission received: 20 June 2024 / Revised: 18 July 2024 / Accepted: 19 July 2024 / Published: 25 July 2024
(This article belongs to the Special Issue Extreme Weather Events in a Warming Climate)

Abstract

:
Extreme precipitation events induced by tropical cyclones have increased frequency and intensity, significantly impacting human socioeconomic activities and ecological environments. This study systematically examines the spatiotemporal characteristics of these events across Hainan Island and their influencing factors using GsMAP satellite precipitation data and tropical cyclone track data. The results indicate that while the frequency of typhoon events in Hainan decreased by 0.3 events decade−1 from 1949 to 2020, extreme precipitation events have increased significantly since 2000, especially in the eastern and central regions. Different typhoon tracks have distinct impacts on the island, with Track 1 (Northeastern track) and Track 2 (Central track) primarily affecting the western and central regions and Track 3 (Southern track) impacting the western region. The impact of typhoon precipitation on extreme events increased over time, being the greatest in the eastern region, followed by the central and western regions. Incorporating typhoon precipitation data shortened the recurrence interval of extreme precipitation in the central and eastern regions. Diurnal peaks occur in the early morning and late evening, primarily affecting coastal areas. Typhoon duration (CC_max = 0.850) and wind speed (CC_max = 0.369) positively correlated with extreme precipitation, while the pressure was negatively correlated. High sea surface temperature areas were closely associated with extreme precipitation events. The atmospheric circulation indices showed a significant negative correlation with extreme precipitation, particularly in the western and central regions. ENSO events, especially sea surface temperature changes in the Niño 1 + 2 region (−0.340 to −0.406), have significantly influenced typhoon precipitation characteristics. These findings can inform region-specific disaster prevention and mitigation strategies for Hainan Island.

1. Introduction

Typhoon disasters pose a major threat to socioeconomic development and human security, often causing extreme precipitation upon landfall that can lead to secondary disasters such as floods, landslides, and mudslides [1,2,3,4]. The southeastern coastal regions of China are particularly vulnerable to these impacts due to frequent tropical cyclone activities, which are the primary contributors to extreme precipitation events [3,4,5]. Since 2020, Hainan Island has been impacted by several powerful typhoons, including Kompasu (2118), Nasha (2220), Rai (2122), and Lionrock (2117). These storms have brought heavy rainfall and destructive winds, resulting in extreme precipitation and severely affecting sustainable development. The urbanization process on the island increases the surface roughness, which in turn amplifies the strength of typhoon-induced extreme precipitation (TIEP) [3,4,5,6]. This problem is particularly acute in the coastal areas of Hainan where the population and infrastructure are concentrated, further exacerbating the adverse effects of TIEPs [3,4,7]. This situation shows significant challenges to the development of the Hainan Free Trade Port. Therefore, it is essential to systematically investigate the spatial and temporal patterns and formation mechanisms of extreme precipitation events on Hainan Island.
With global warming, there has been a notable increase in the frequency of tropical cyclones over the past three decades [3,4,8]. Simultaneously, the impact of these cyclones on extreme precipitation events in China’s southeastern coastal regions has become more pronounced [3,4,9]. Notably, more than 40 percent of such events are attributable to tropical cyclones [1,3,4,10]. With global warming, both the severity of tropical cyclones and the magnitude of associated extreme precipitation events have consistently risen [1,2,3,4,11]. This trend indicates a complex evolution in the spatiotemporal dynamics of typhoon activities, potentially increasing the risk of extreme precipitation in the future.
In recent years, there has been a significant decrease in the number of tropical cyclones affecting Hainan Island. Paradoxically, the frequency of days with extreme heavy rainfall events influenced by these cyclones, as well as the total precipitation from these events, has increased [3,4,12]. The average annual frequency, precipitation amount, and the proportion of typhoon precipitation to the total annual precipitation on Hainan Island all demonstrate a downward trend. Yet, the maximum precipitation during typhoon events and the maximum daily precipitation present a slight upward trend [3,4,13]. In contrast, another study reports a mild downward trend in maximum daily precipitation across different precipitation intensity levels [3,4,14]. These conflicting findings may result from the limited number of in situ observations, which may not adequately represent conditions across Hainan Island’s complex topography. Additionally, most studies have relied on daily precipitation data, which offers relatively low temporal resolution and fails to capture the detailed spatiotemporal structure of extreme typhoon precipitation. Consequently, there is an urgent need for systematic analysis of the spatiotemporal patterns of extreme precipitation events induced by typhoons on Hainan Island, using high-resolution gridded precipitation data.
Previous studies on extreme precipitation have largely relied on indices from meteorological stations, such as daily precipitation amounts [3,4,15]. These indices often fail to capture the detailed spatiotemporal patterns of extreme typhoon precipitation due to the sparse and uneven distribution of stations on Hainan Island, especially in regions with complex terrain. However, recent advances in satellite remote sensing technology compensate for these shortcomings by providing high-resolution precipitation data with more comprehensive and continuous spatial and temporal coverage [3,4,14,16]. This improvement is crucial in areas like oceans where traditional surface observation coverage is sparse. Global analyses using data from the Global Precipitation Measurement (GPM) satellite have uncovered distinct diurnal peaks in tropical cyclone precipitation, which are typically elusive in station-based observations [17]. Therefore, compared with the station, higher temporal and spatial resolution data can be used to conduct a multi-scale study on the extreme precipitation pattern of the typhoon on Hainan Island.
While previous studies have examined extreme precipitation changes globally, the unique topographic and climatic features of Hainan Island, a typical tropical island, significantly influence the spatial distribution of typhoon-induced extreme precipitation. The factors influencing the intensity and spatial distribution of TIEP include the dynamics of typhoon movement, such as stalling, local terrain, and moisture availability [3,4]. As typhoons make landfall on Hainan Island, their forward motion typically decelerates, extending their duration over the region. This deceleration is especially pronounced in the central and western mountainous terrain, where orographic effects further intensify precipitation. Furthermore, Hainan Island’s maritime environment provides a continuous supply of water vapor, unlike inland regions where typhoons rapidly lose their moisture source after landfall. This sustained moisture availability, combined with the aforementioned factors, contributes to the intensification of typhoon-induced extreme precipitation events on the island. Radar observations and numerical modeling experiments focused on specific cases have corroborated the enhancement of typhoon precipitation in the central and western mountainous areas of Hainan Island [18,19]. In China, the precipitation associated with landfalling typhoons is strongly influenced by the storm’s intensity and translational speed [20,21]. However, the characterization of these relationships for Hainan Island is hindered by the lack of long-term observational data. Concurrently, rising sea surface temperatures (SSTs), associated with global climate change, are expected to increase the likelihood of severe precipitation events related to typhoons. These elevated SSTs significantly influence the occurrence and magnitude of extreme precipitation events [22,23]. Analyses of historical climate data reveal that typhoon activity frequency along the southern coast of Hainan Island is significantly modulated by large-scale climate patterns, particularly the El Niño-Southern Oscillation (ENSO) [24]. Therefore, from a climatological perspective, it is essential to consider the influence of large-scale SST patterns on extreme typhoon precipitation. This approach allows for a more comprehensive assessment of the spatial extent and intensity of extreme typhoon precipitation on Hainan Island, accounting for both local and remote climate drivers.
Recent studies have advanced our understanding of the spatiotemporal characteristics of extreme typhoon-induced precipitation on Hainan Island. However, significant knowledge gaps persist, particularly regarding spatiotemporal resolution, multi-scale analysis, and comprehensive quantification of influencing factors. To address these limitations, this study aims for: (1) Utilize high spatiotemporal resolution satellite-retrieved precipitation data to reveal the fine spatiotemporal pattern of extreme typhoon precipitation on Hainan Island; (2) Explore the distribution patterns and variation characteristics of extreme typhoon precipitation across multiple spatiotemporal scales; (3) Comprehensively analyze the interactions between typhoon characteristics and environmental fields and other factors and quantitatively assess their impacts on extreme typhoon precipitation; and (4) Integrate typhoon track information to examine regional differences in extreme typhoon precipitation across Hainan Island and explore their underlying causes. This study utilizes high-resolution long-term gridded precipitation data in conjunction with optimal typhoon track data to investigate the distribution characteristics of extreme precipitation events associated with typhoons on Hainan Island across multiple scales.

2. Materials and Methods

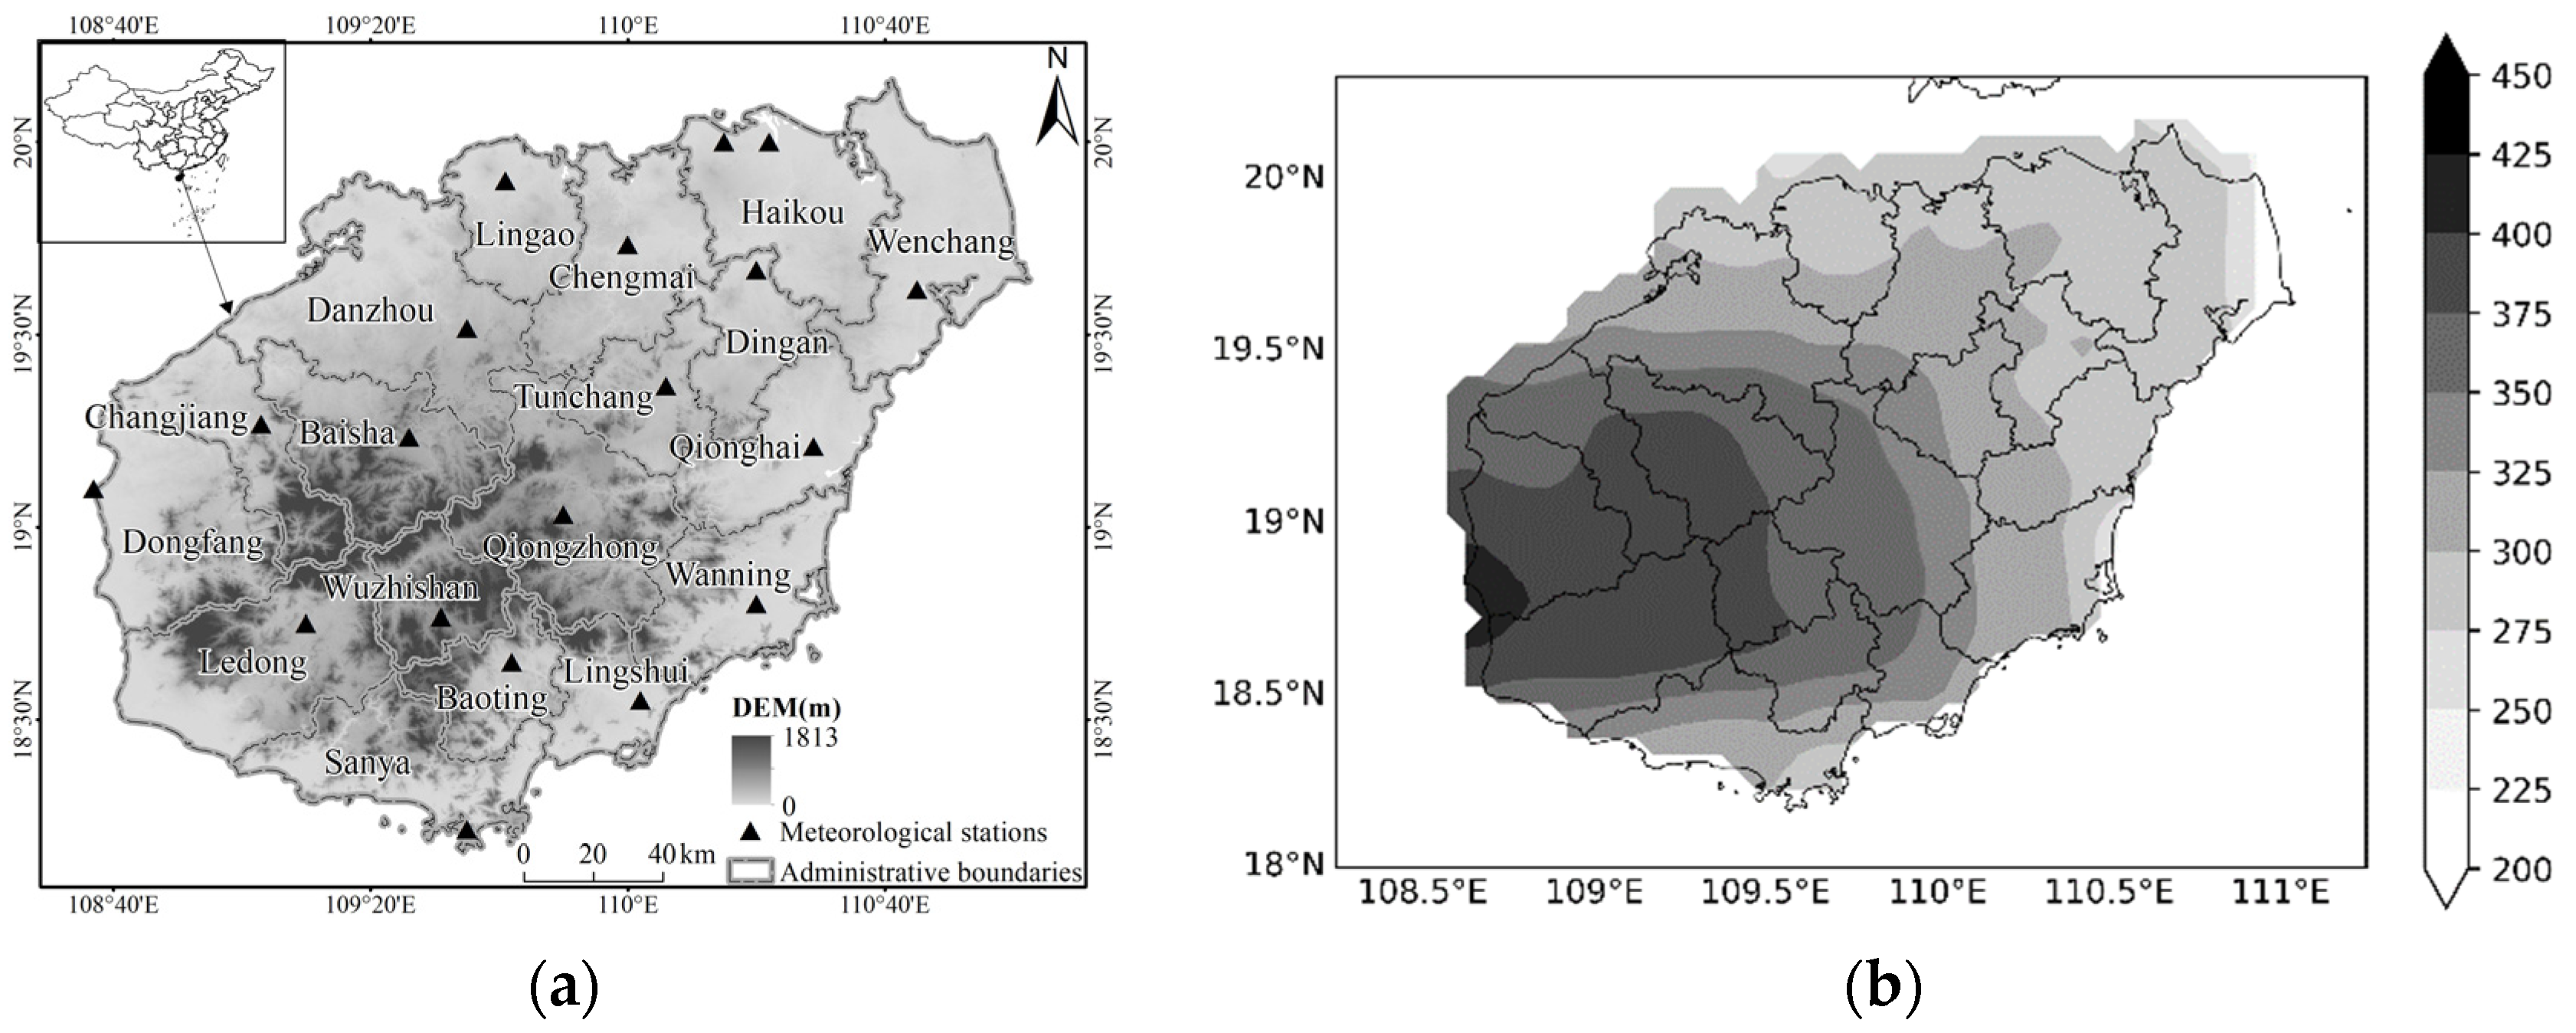
2.1. Overview of the Study Area

Hainan Island, China’s second-largest island (≈34,000 km2), is located in the northwestern South China Sea (18°10′–20°10′ N, 108°37′–111°03′ E). The island’s topography exhibits a distinctive annular structure, with the central highlands, notably Wuzhishan (1840 m a.s.l.) and Yinggeling (1812 m a.s.l.), descending to the surrounding lowlands (Figure 1a). Its tropical monsoon climate has average annual temperatures of 22.5–25.6 °C and precipitation of 1500–2500 mm, with distinct dry and wet seasons [25].
Rainfall distribution across Hainan Island is heterogeneous, governed by the tropical monsoon circulation. The rainy season, spanning from April to October, contributes over 70% of the annual precipitation. Hainan’s location makes it highly typhoon-prone, with tropical cyclones from the northwestern Pacific typically affecting the island from May through November.
Figure 1b shows the multi-year average typhoon-induced precipitation (TIP), affecting virtually all of Hainan Island. TIP varies spatially, averaging 250–450 mm annually. Western and central mountainous regions receive the highest rainfall (>350 mm/year), while precipitation decreases towards coastal areas. The northeastern region (such as Wenchang) experiences the lowest TIP (<300 mm/year), while western parts (such as Dongfang and Ledong) receive the highest (>400 mm/year).
Combining Figure 1a and Figure 1b reveal that high TIP areas encompass the entire mountainous region and western plains. Exceptions include certain mountainous areas around Baoting and Sanya, which do not exhibit elevated precipitation values. This pattern is likely due to the orographic effects in central and western Hainan Island, where the forced ascent of moist air associated with typhoons enhances rainfall, making these regions more vulnerable to direct impacts from typhoons.

2.2. Datasets

This study uses historical tropical cyclone track data (1949–2020) from the Shanghai Typhoon Institute of the China Meteorological Administration. The dataset includes tropical cyclone metrics such as center coordinates, 2-min average maximum wind speeds (m s−1), and minimum central pressure (hPa). Data from 2000–2020 were selected to examine the recent distribution of TIP over Hainan Island.
Precipitation data is from the Global Satellite Mapping of Precipitation (GsMAP) Reanalysis product by the Japan Aerospace Exploration Agency (JAXA). The GsMAP Reanalysis dataset features a fine spatial resolution of 0.1° and a temporal resolution of 1 h. It spans the period from April 2000 to December 2020 and provides extensive geographic coverage from 60° N to 60° S. Previous research validates its reliability for Hainan Island, showing correlations up to 0.870 on a monthly scale, with slight overestimation [26].
Sea surface temperature (SST) data is sourced from the National Centers for Environmental Information (NCEI) NOAA Optimum Interpolation Sea Surface Temperature (OISST) platform. This dataset combines satellite, ship, and buoy observations, using optimal interpolation at 0.25° × 0.25° resolution from 1981 to 2024. This study utilizes essential atmospheric circulation indices, such as the Niño SST (available at https://www.cpc.ncep.noaa.gov/data/indices/sstoi.indices, last accessed on 1 May 2024) and the Northern Hemisphere Subtropical High Area Index, among others. The latter indices are obtained from the National Climate Center of the China Meteorological Administration (available at https://cmdp.ncc-cma.net/Monitoring/cn_index_130.php, last accessed on 1 May 2024). The monthly averages of these indices are used to investigate their correlations with tropical cyclone activity. Comprehensive results are in Appendix A, while the main text focuses on significantly correlated indices.

2.3. Methodology

Statistical analyses of return period events commonly assume that extreme events follow the generalized extreme value (GEV) distribution [27]. This assumption is based on the premise that typhoon-induced extreme precipitation is independent and identically distributed (i.i.d.), providing a foundation for applying the GEV model with these datasets. The GEV probability density function (PDF) is [28]:
H i ( x μ , σ , ξ ) = 1 σ [ 1 + ξ ( x μ σ ) ] ( 1 + 1 ξ ) e x p ( [ 1 + ξ ( x μ σ ) ] 1 ξ ) ,
where μ is the location parameter, σ is the scale parameter, and ξ is the shape parameter. In Section 3.3 we use data from different time scales to calculate recurrence intervals for 25, 50, 100, 200, and 300-year return period events.
For trend analysis, the Theil–Sen regression method was used due to its robustness to outliers [29]. Data were smoothed using a three-point average method. Pearson correlation coefficients assessed relationships between typhoon extreme precipitation characteristics and total precipitation amounts.

2.4. Definition of Typhoon Precipitation and Typhoon-Induced Precipitation Extremes

Typhoon-induced precipitation (TIP) was defined as the precipitation occurring within an area covered by a 2.5° influence radius (≈260–277 km on Hainan Island) centered on the typhoon’s track [26]. Typhoons directly impacting Hainan (2000–2020) were identified using best track data and GsMAP precipitation data. GsMAP data (0.1° spatial, 1-h temporal resolution) were clipped to Hainan’s terrestrial boundaries using an official map [Map Approval Number: GS(2019)1822]. Extreme precipitation events were identified using 95th and 99th percentile values (C95 and C99) of non-typhoon precipitation as thresholds, calculated on a monthly scale for multiple temporal scales (1 h, 3 h, 6 h, 12 h and 24 h). Section 3.4 uses the 99th percentile for spatial distribution analysis.
Based on typhoon precipitation data, the K-means clustering algorithm was used to partition Hainan Island into three distinct regions (Figure 2): 1. Eastern region: plains with uniform typhoon precipitation due to minimal topographic variation. 2. Central region: Mountainous with heterogeneous precipitation due to orographic effects. 3. Western region: Northwestern and southwestern plains with lower precipitation intensities.

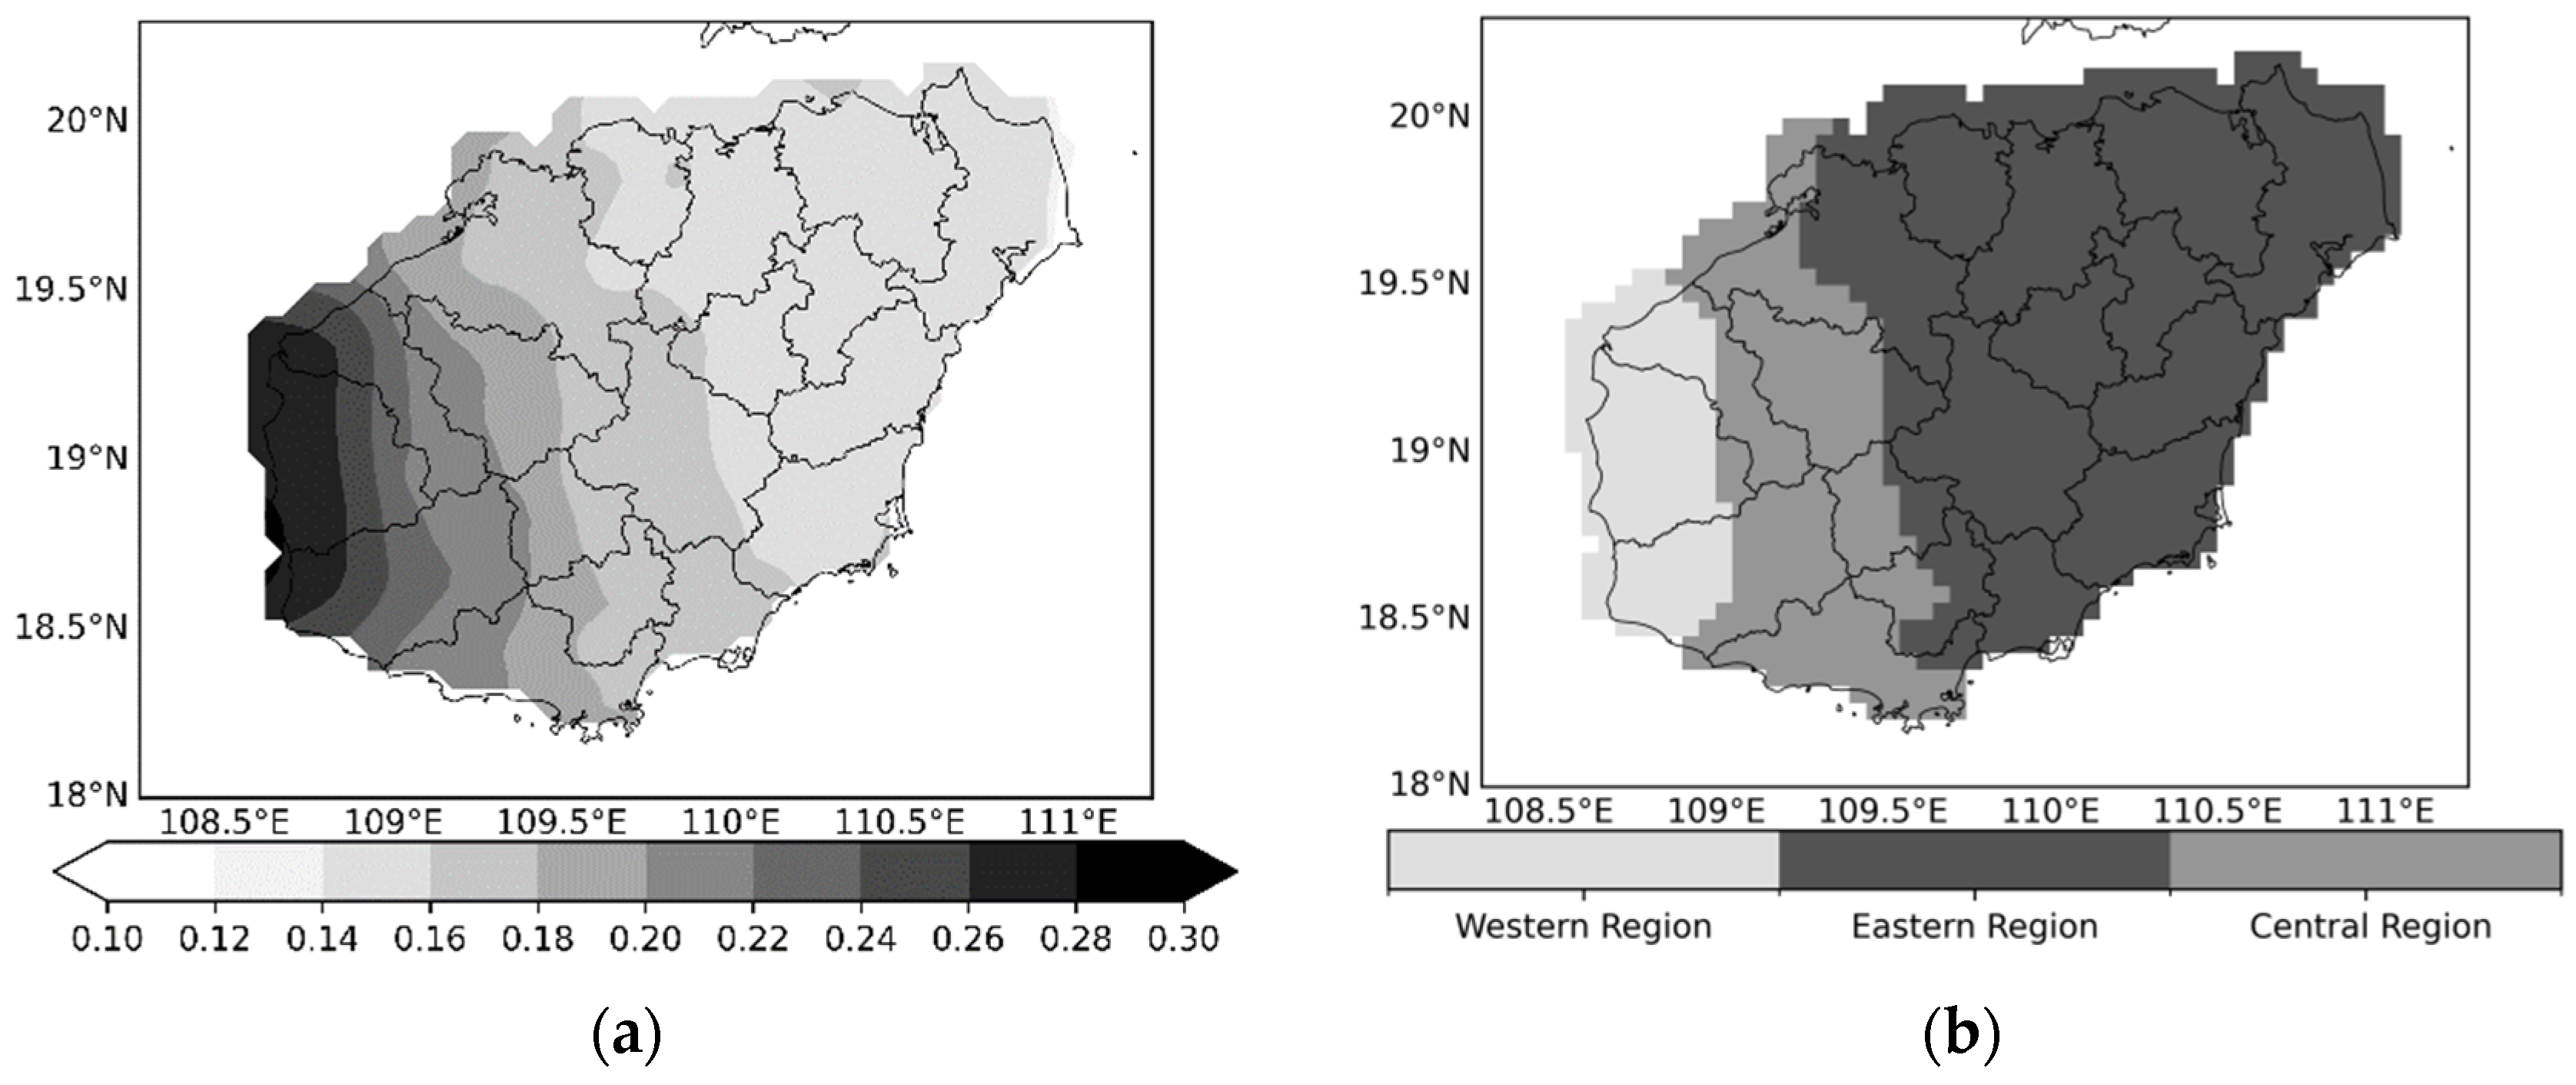
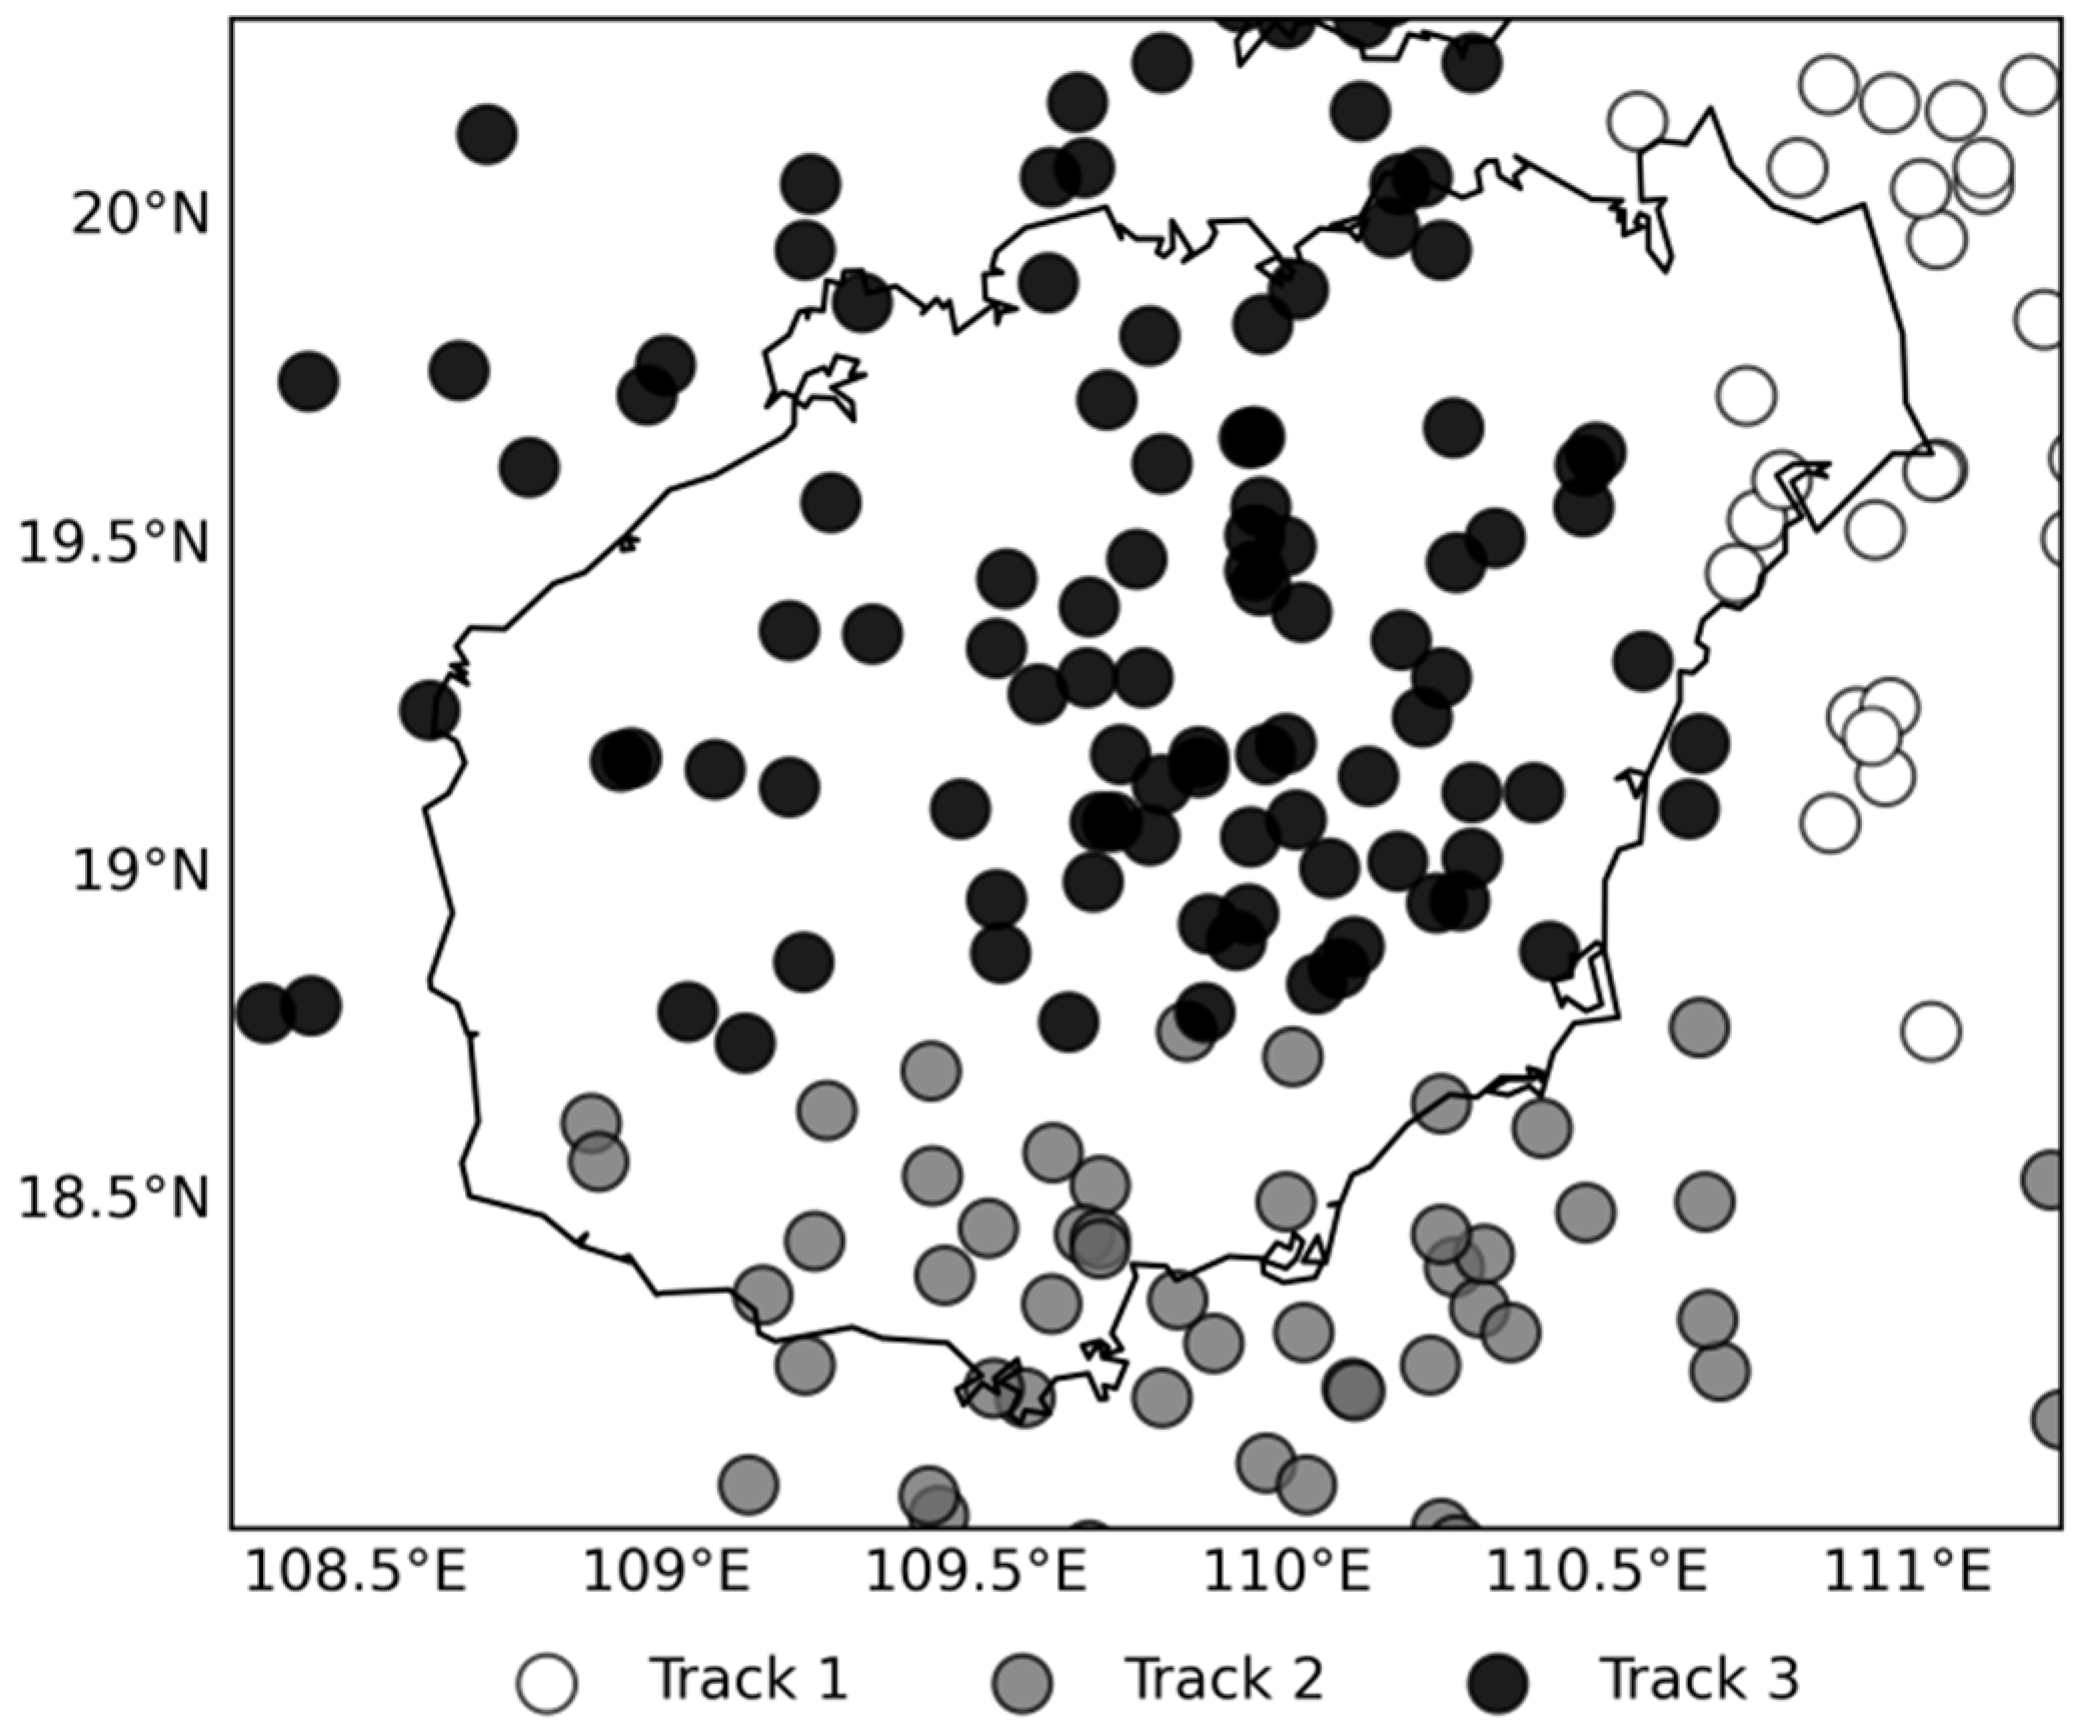
2.5. Typhoon-Induced Extreme Precipitation’s Regionalization and the Typhoon Track Cluster

This study uses the K-means clustering algorithm to objectively delineate the Hainan Island’s terrestrial regions. Based on multi-year average typhoon precipitation relative to total precipitation (Figure 2a), three distinct regions were identified on Hainan Island: the eastern region, central region, and western region (Figure 2b).
The eastern region, situated on the island’s eastern side, primarily comprises plains with relatively flat terrain. This area experiences weaker typhoon precipitation intensity due to minimal topographic variation, which does not favor orographic lifting. Consequently, the spatial distribution of typhoon precipitation in this region is notably uniform, exhibiting minimal local variability. Conversely, the central region, located in the center of Hainan Island, features a rugged and varied landscape dominated by mountains. This region harbors the island’s principal mountain ranges with high elevations that enhance orographic lifting on the windward slopes, frequently resulting in intense precipitation events. The complex topography introduces significant spatial heterogeneity in typhoon precipitation, with pronounced disparities in rainfall between mountainous and valley areas. The western region, encompassing the northwestern and southwestern plains, is positioned on the leeward side of the monsoonal currents and exhibits less topographic relief. While typhoons impact this region, the absence of substantial orographic lift leads to comparatively lower precipitation intensities during such events. This regional classification provides a framework for analyzing typhoon-induced precipitation patterns across Hainan Island’s diverse topography.
Figure 2. (a) Multi-year average typhoon precipitation ratio; (b) Spatial distribution zones of typhoon-induced extreme precipitation (TIEP).
Atmosphere 15 00891 g002
To identify extreme precipitation events induced by specific typhoons, K-means clustering analysis was used to categorize the typhoon trajectories affecting Hainan Island from 2000 to 2020. Typhoon metrics including the typhoon center positions, typhoon movement speeds, and typhoon intensities were examined to classify them into three distinct groups (Figure 3). Subsequent analyses of these categorized typhoons were based on these classifications.
The cluster analysis yielded three typhoon track groups (Figure 3): Typhoons in the first group (Track 1) primarily originated from the southeast of Hainan Island, traversing the central region of the island from east to west, characterized by relatively high movement speeds and moderate intensities.
The second group (Track 2) predominantly arose from the southern sea area of Hainan Island, progressing from south to north across the island’s southern tip, with rapid movement speeds but lesser intensities compared to Track 1.
The third group (Track 3) exhibited more varied trajectories, including typhoons forming near Hainan Island and moving northward, and those passing east to west over the northern part. Slowest speeds but generally stronger intensities, are associated with higher frequency of extreme precipitation events. Detailed characteristics of each track group, including average speeds, intensities, and associated precipitation patterns, are presented in Appendix A, Table A2.
Following the classification of these typhoon tracks, this study examined the differences in extreme precipitation characteristics events triggered by each typhoon category. Typhoon-induced precipitation data were correlated with their respective track categories, to quantify the frequency and average intensity of extreme precipitation events across various temporal scales (e.g., 1 h, 6 h, and 12 h durations).

3. Results

3.1. Spatiotemporal Analysis

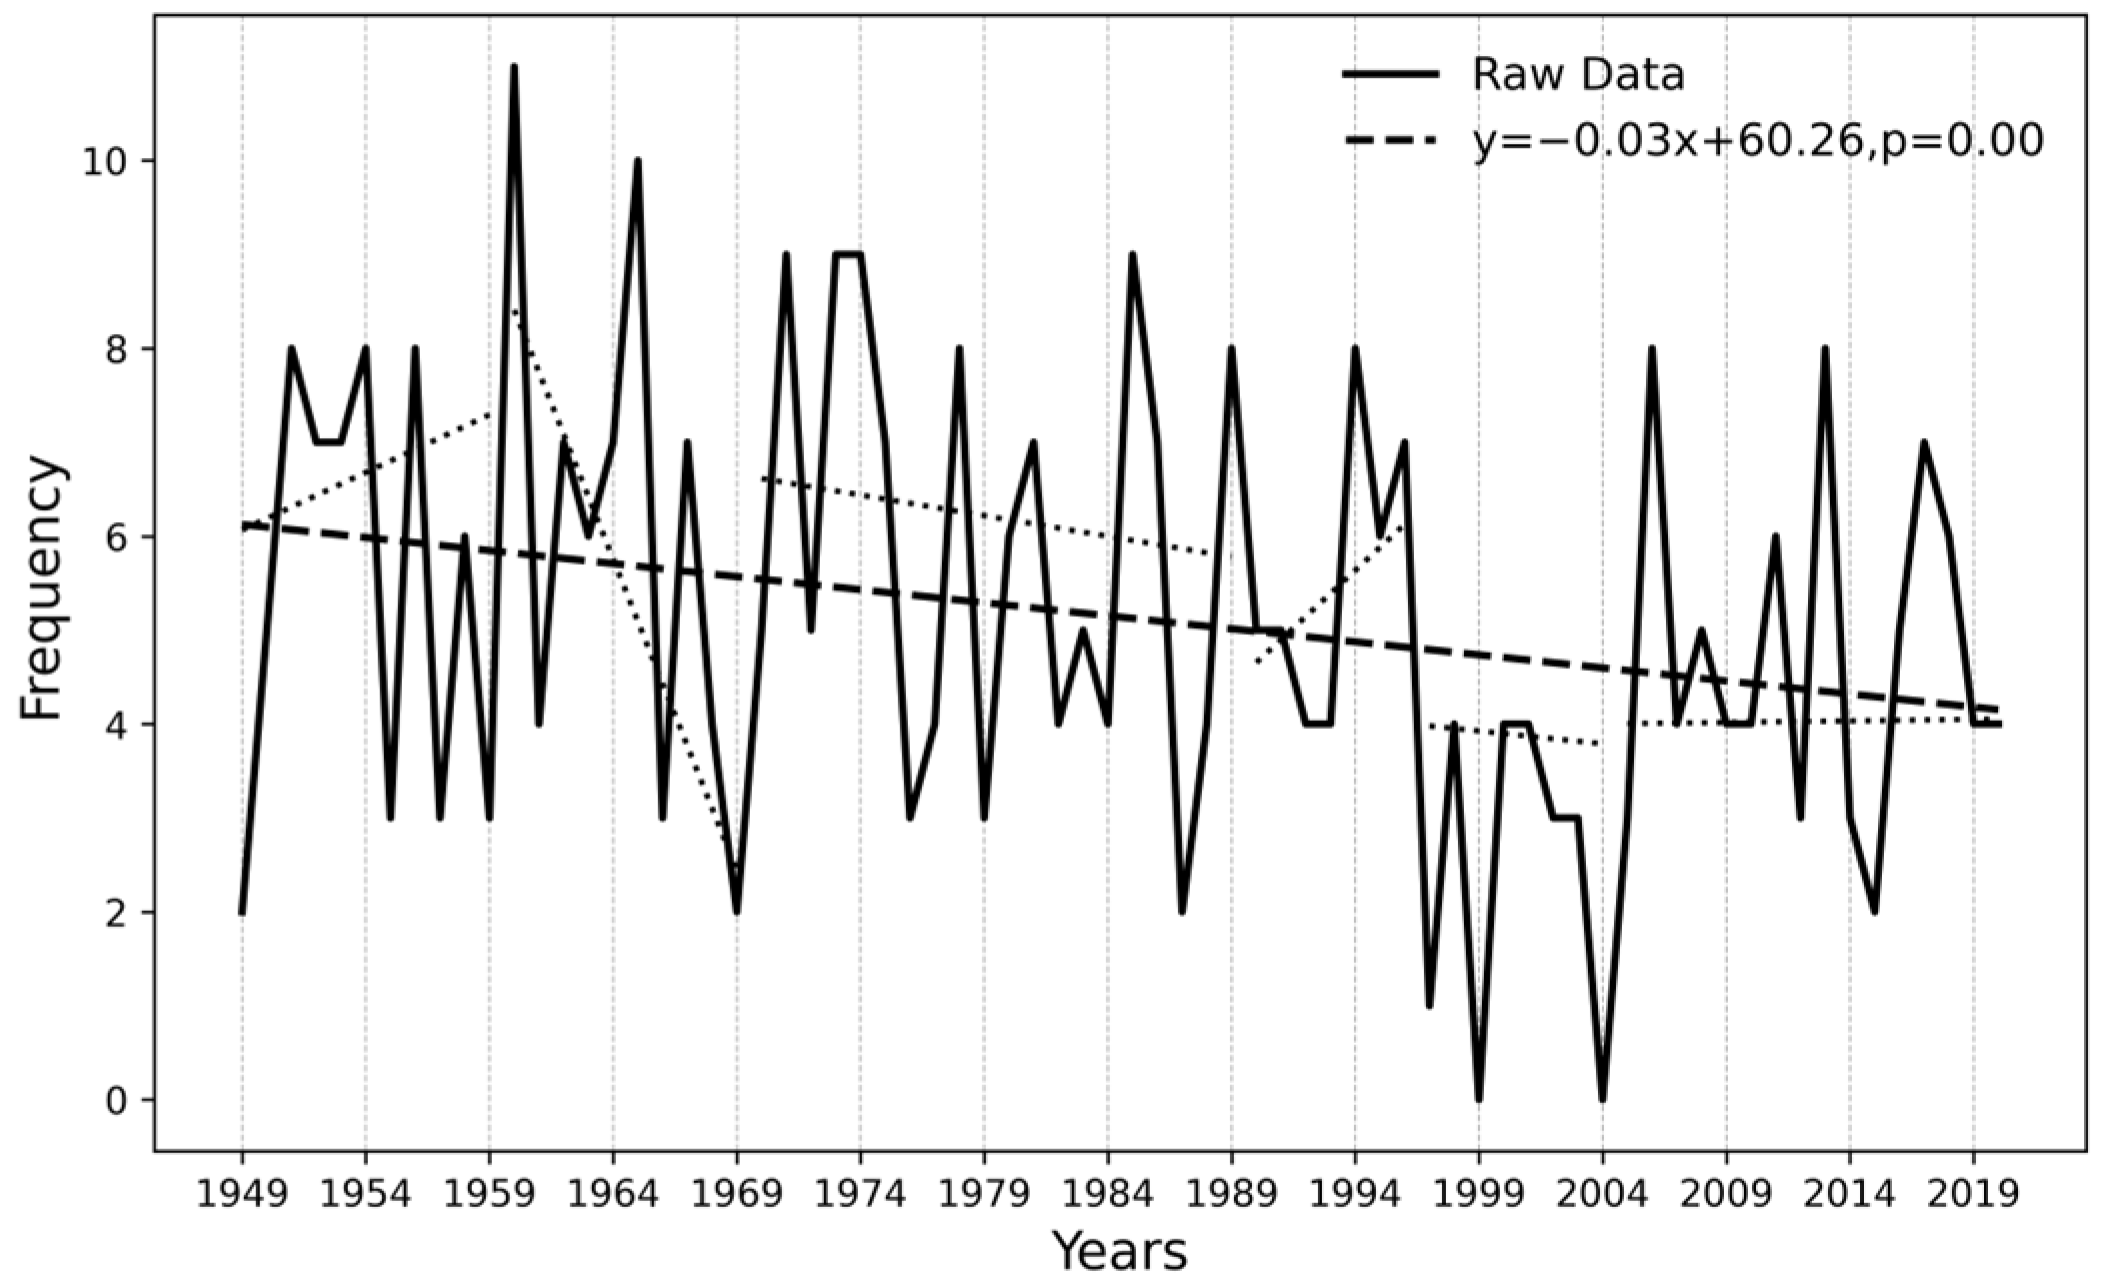
3.1.1. Change in Typhoon Frequency

Figure 4 presents the number of typhoons affecting Hainan Island from 1949 to 2020. Over this period, typhoon frequency shows a statistically significant declining trend of 0.3 events decade−1 (p = 0.00) with notable inter-decadal variability. Specifically, the mid-1950s and mid-1960s experienced higher frequencies of typhoon events, averaging around 6 events year−1, with some years reaching up to ten events. The years from 1949 to 1959 were marked by a significant increase in typhoon activity, culminating in 1960 with 11 events, the highest annual count observed in the past seventy years. From 1960 to 1989, although the overall number of typhoons began to decline, the rate of decrease slowed, with most years recording fewer than four events per year. The period from the 1990s to the early 2010s witnessed larger fluctuations, with typhoon counts in some years approaching eight, indicating a pattern of initial increase followed by a decrease. Over the last two decades (2000–2020), typhoon events affecting Hainan have fluctuated between three to six events annually. This analysis aligns with Wu’s findings, indicating a significant reduction in typhoon frequency impacting Hainan Island from 1962 to 2005 [12].

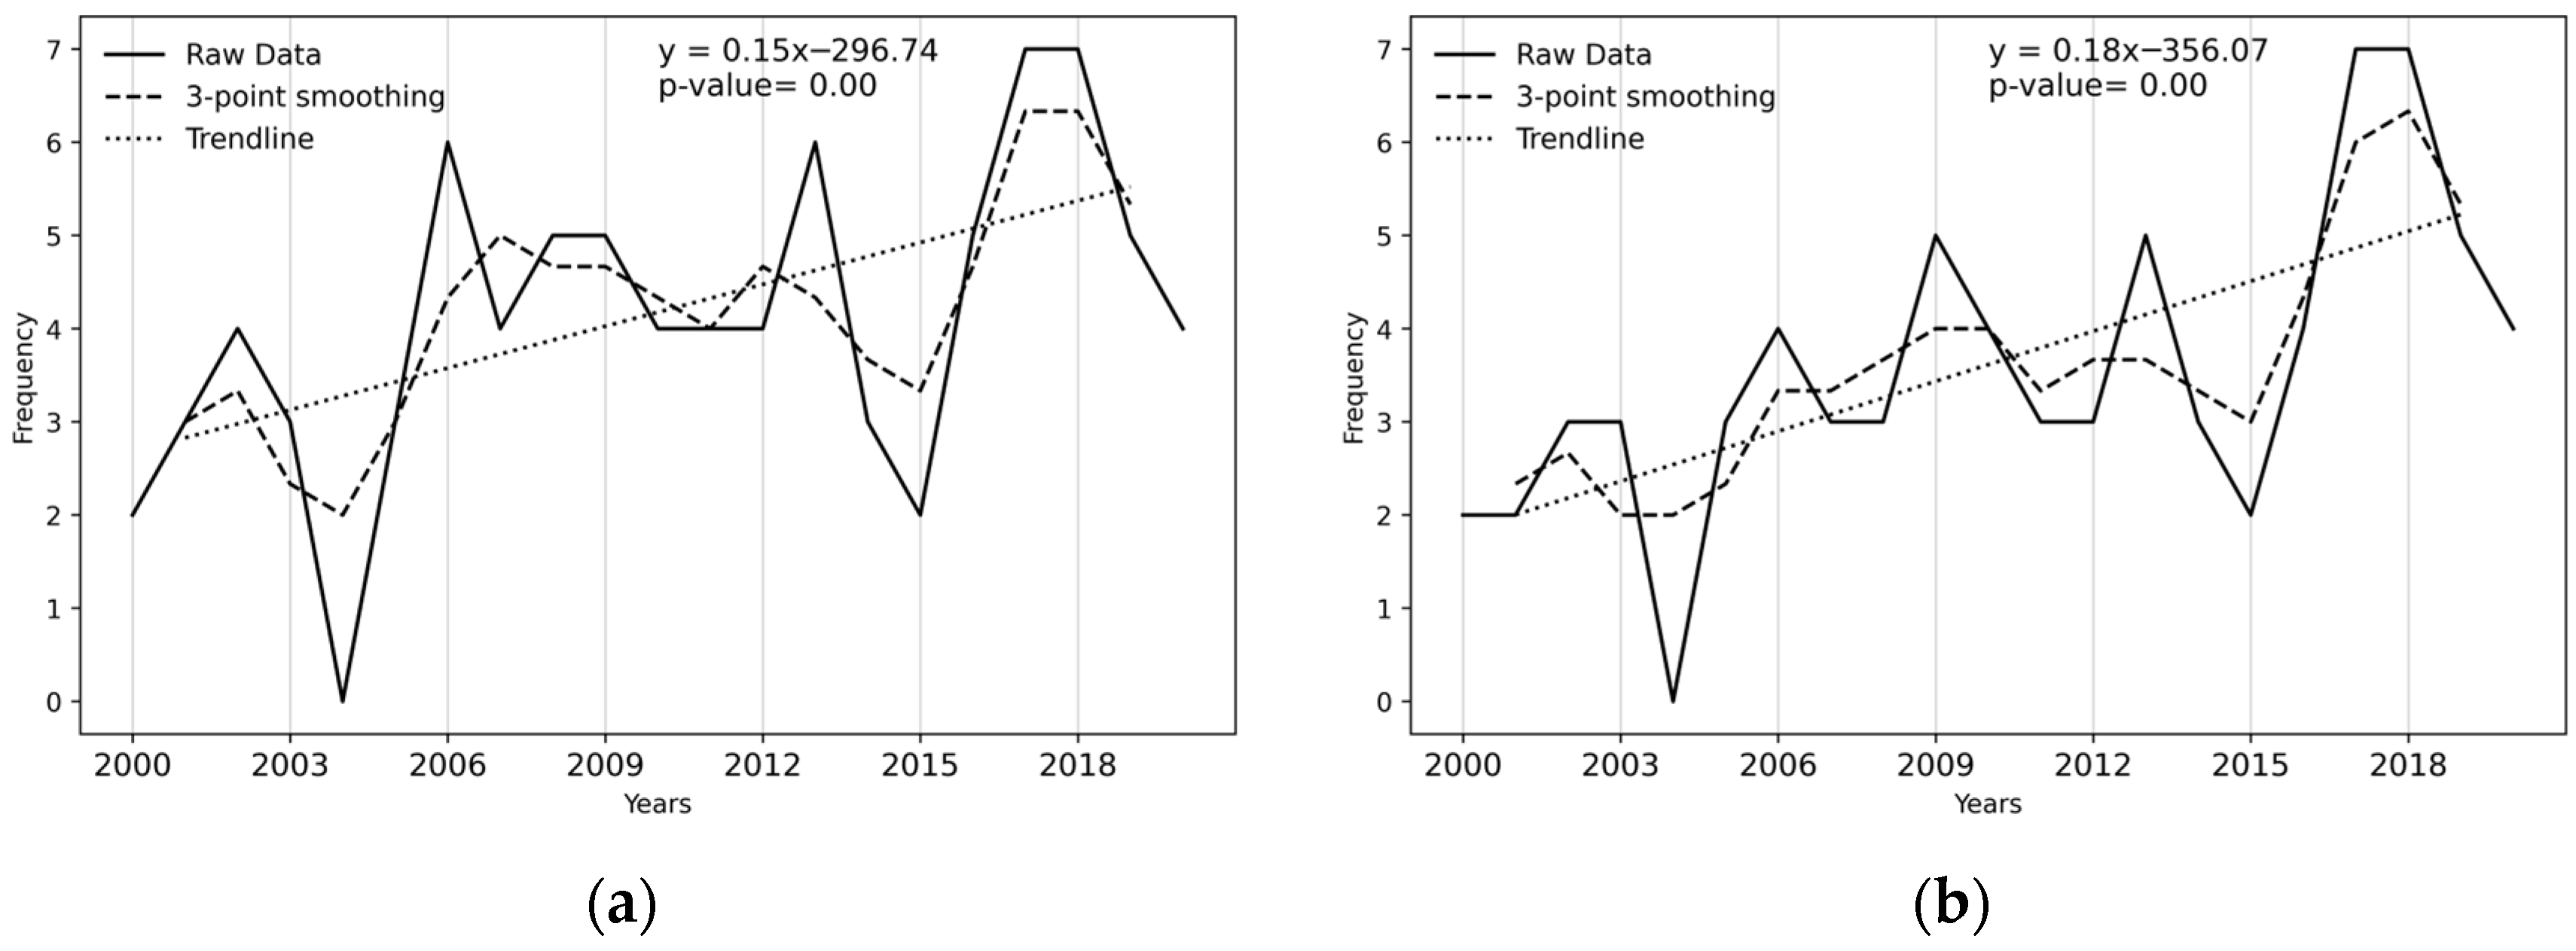
3.1.2. Change in the Frequency of Extreme Precipitation

Figure 5 shows the temporal variability of extreme precipitation events associated with typhoons affecting Hainan Island from 2000 to 2020. These events were identified using GsMAP precipitation data, employing the 95th and 99th percentile as hourly thresholds. The results reveal an upward trend in the frequency of these extreme events at both thresholds: a 1.5 events decade−1 increase at the 95th percentile threshold and a 1.8 events decade−1 increase at the 99th percentile threshold. The higher rate of increase at the 99th percentile threshold suggests an intensification in the severity of extreme precipitation events. This trend indicates that the more extreme rainfall events are escalating more substantially compared to less extreme ones.

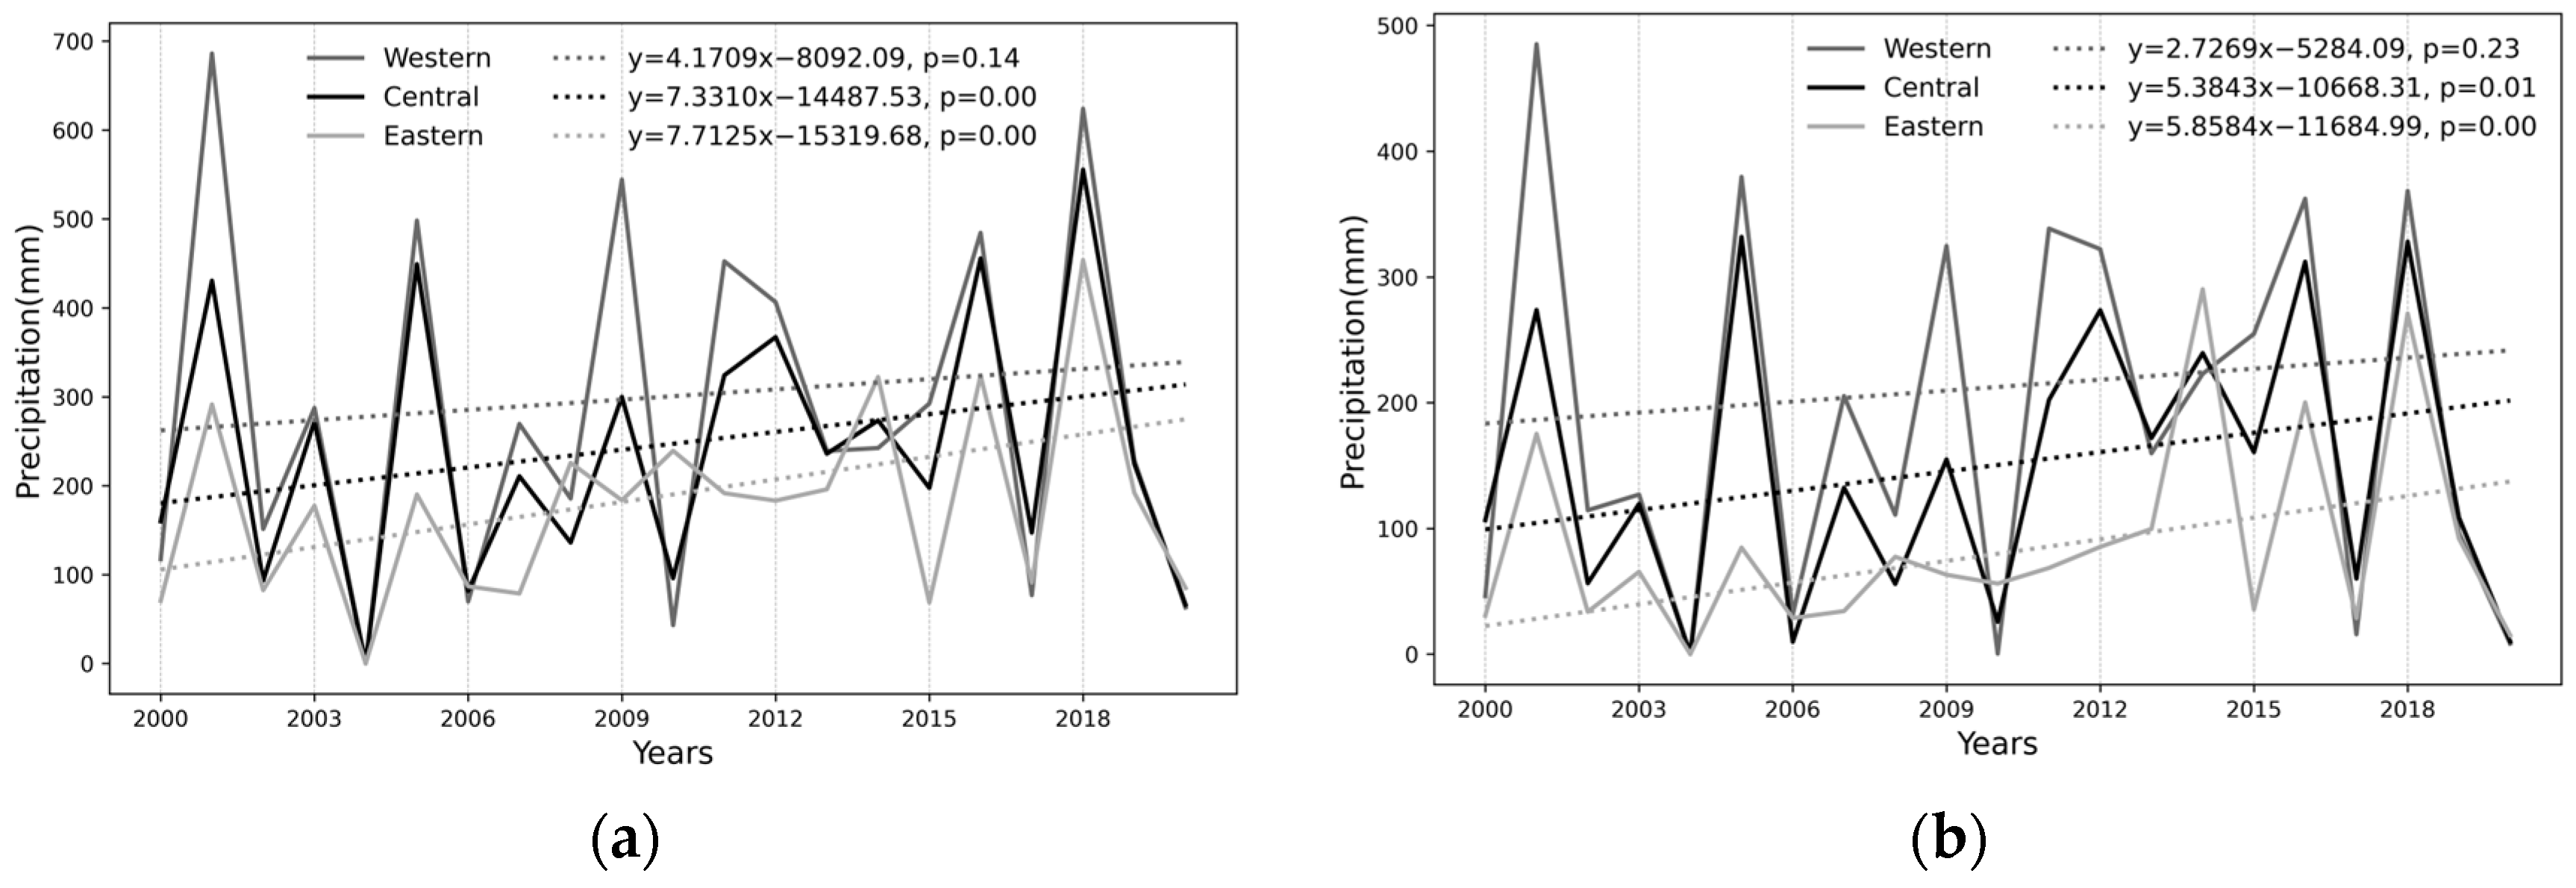
3.1.3. Change in Extreme Precipitation and Contribution

Figure 6 shows the time series of the total extreme precipitation associated with typhoons affecting Hainan Island from 2000 to 2020, based on GsMAP data at the 95th and 99th percentile thresholds on an hourly scale. Excluding 2004, which had no typhoon impacts, the data shows significant interannual variability in extreme precipitation. The years 2001, 2011, 2016, and 2018 experienced notably higher levels of extreme precipitation. 2001 recorded exceptionally high values, with 686 mm at the 95th percentile and 378 mm at the 99th percentile in the western region. The total extreme precipitation (TEP) across the regions of Hainan Island shows a gradient from the western region (most severe impacts), to the central and eastern regions, respectively.
Trend analysis of typhoon-associated extreme precipitation in Hainan Island reveals an increasing pattern across the sub-regions. Extreme precipitation events at both the 95th and 99th percentile thresholds show a consistent upward trend in the central and eastern regions.
At the 95th percentile threshold, the eastern region shows the most pronounced upward trend, with an increase of 77.1 mm decade−1 in extreme precipitation. This trend suggests an escalating frequency and intensity of extreme rainfall during typhoon events in this area. Extreme precipitation in the central region shows marked increases at both percentile thresholds: 73.3 mm decade−1 (95th percentile) and 58.6 mm decade−1 (99th percentile). This consistent rise suggests a uniform intensification of extreme rainfall events during typhoons across different intensity levels. In contrast, the western region demonstrates a more modest change, with a slight upward trend of 27.3 mm decade−1 observed only at the 99th percentile threshold, indicating that only the most extreme events are intensifying in this area.
Figure 7 presents a time series of the ratio between extreme precipitation and total typhoon-induced precipitation (TIP) over Hainan Island from 2000 to 2020. The analysis uses the 95th and 99th percentiles as hourly thresholds, based on GsMAP satellite-retrieved precipitation data. The extreme precipitation proportion exhibits significant inter-annual variability, influenced by tropical depressions and monsoon systems. Years 2003, 2005, 2012, 2014, and 2018 recorded higher ratios, exceeding 80% at the 95th percentile threshold. 2014 marked the peak contribution with extreme precipitation comprising 96.9% (95th percentile threshold) and 88.1% (99th percentile threshold) of the typhoon-induced precipitation.
The trend analysis indicates a general increase in the proportion of extreme precipitation relative to the total typhoon precipitation across Hainan Island. The eastern region shows a pronounced increase of 14.2% decade−1 at the 95th percentile, suggesting a rising frequency of extreme precipitation events. The central region exhibits an increase of 12.1% decade−1 and 11.3% decade−1 at the 95th and 99th percentiles, respectively. The western region displays a more moderate growth, with trends of 6.9% decade−1 and 5.0% decade−1 at these thresholds.

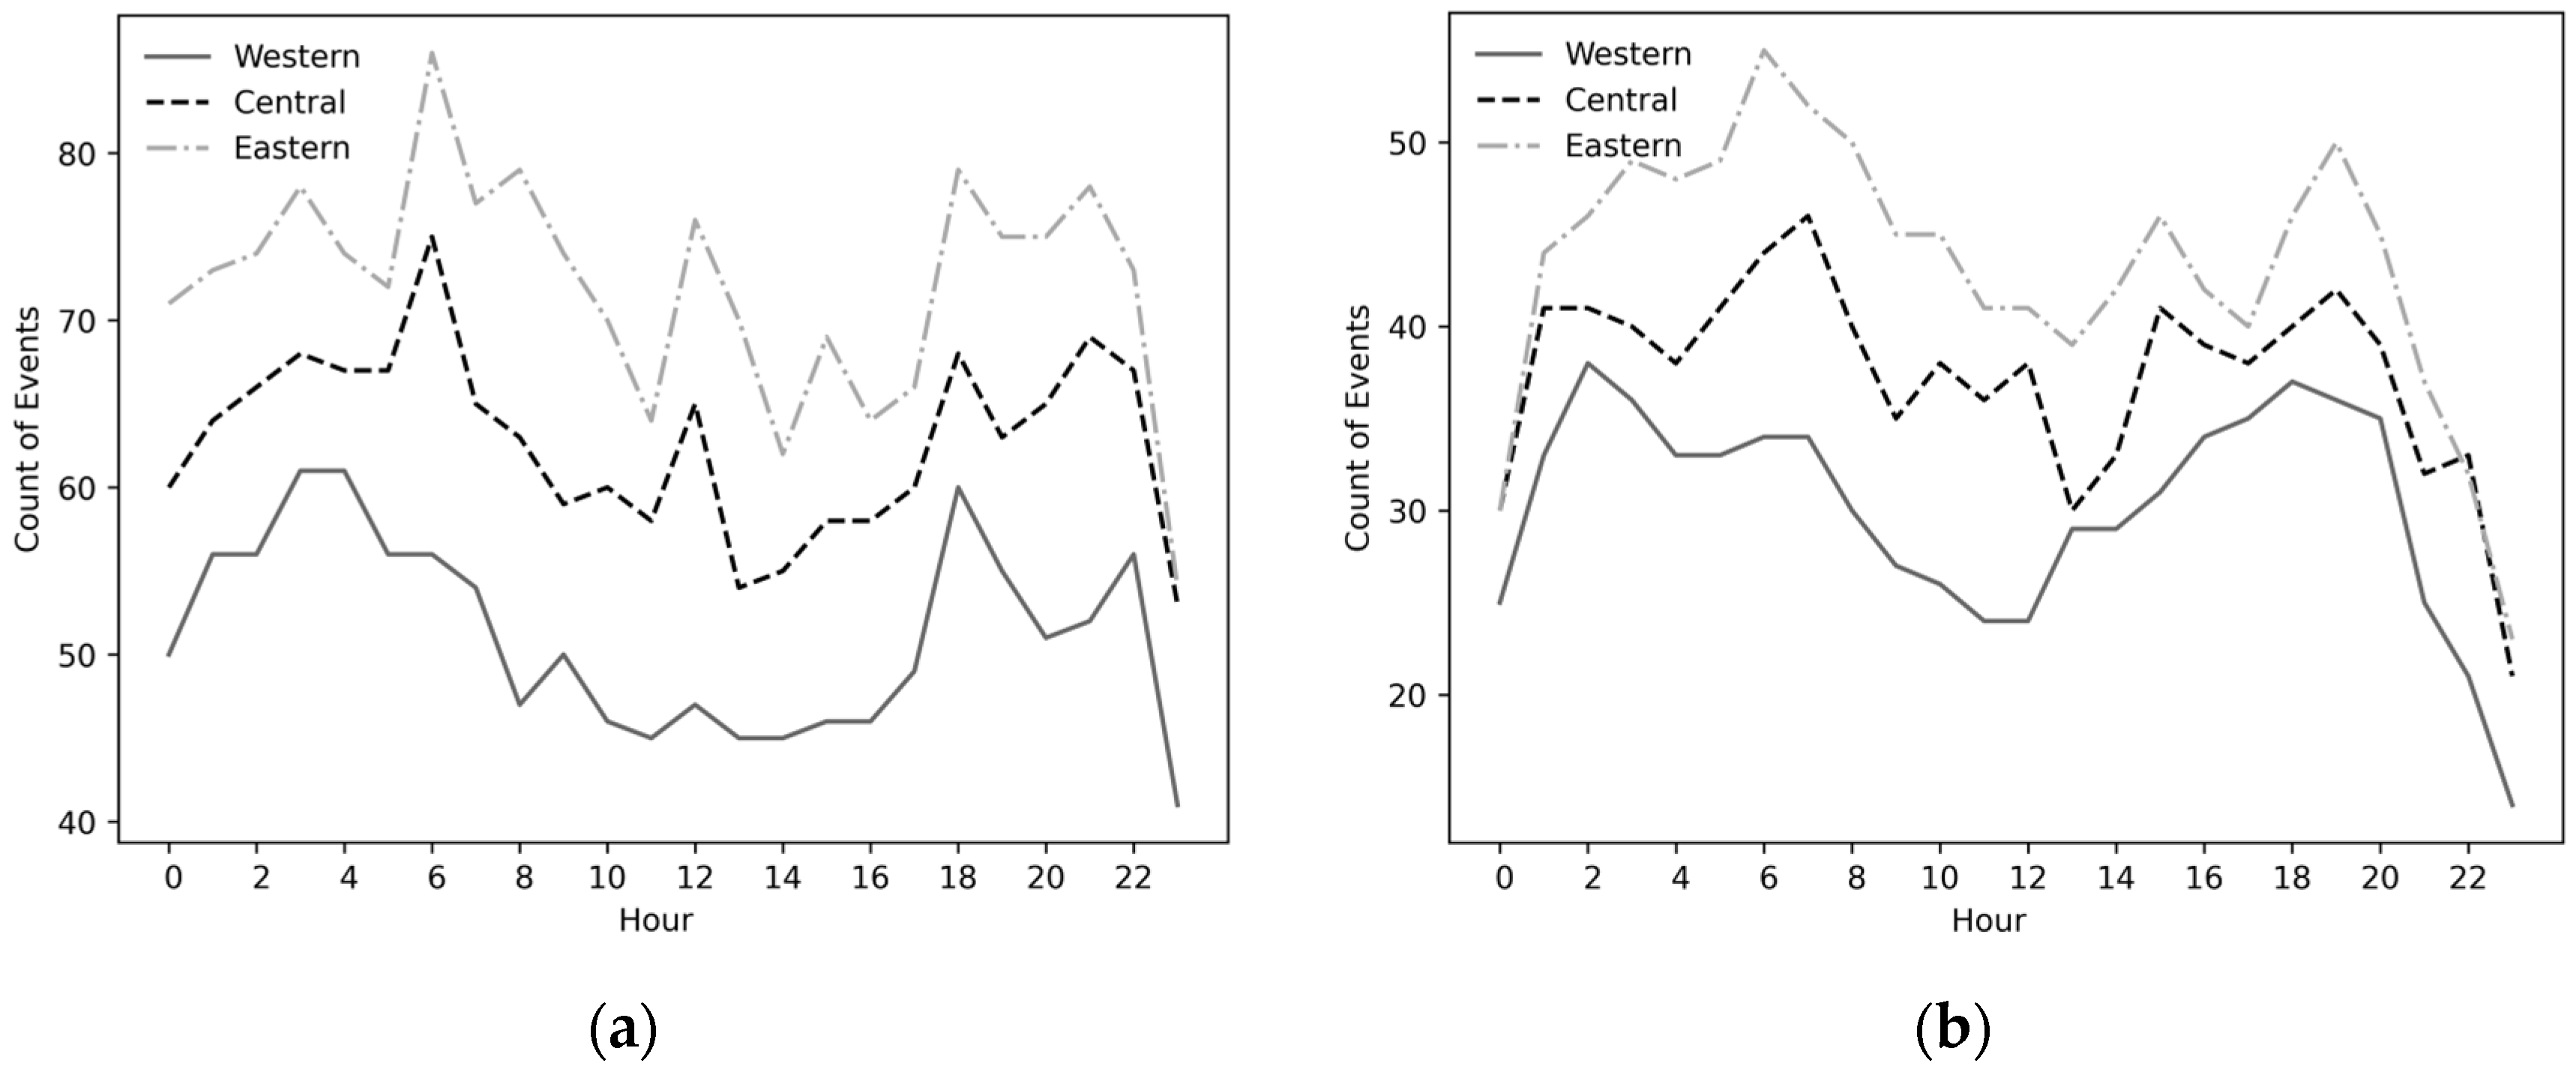
3.1.4. Intra-Day Changes in Extreme Precipitation

Figure 8 depicts the diurnal cycle of extreme precipitation across three sub-regions. The data shows a bimodal distribution, with maxima during the early morning hours (0200–0700 h at UTC) and late afternoon to evening (1800–2000 h at UTC), and minima around 0000 and 1200 h UTC. Hainan Island’s tropical monsoon climate is characterized by intense solar radiation, which enhances surface heating and promotes convective activity. This convective peak in the late afternoon often triggers significant precipitation events. Conversely, by the early morning, surface cooling increases atmospheric stability, promoting water vapor condensation and precipitation formation. The eastern region experiences the highest frequency of extreme precipitation, with over 50 occurrences at the 99th percentile during several hours. The western region records these events less frequently. These findings align with research by Manuel F. Rios Gaona [17], who reported that the highest rainfall during typhoon events typically occurs at 0200, 0500, 1400, and 1800 h UTC [3].

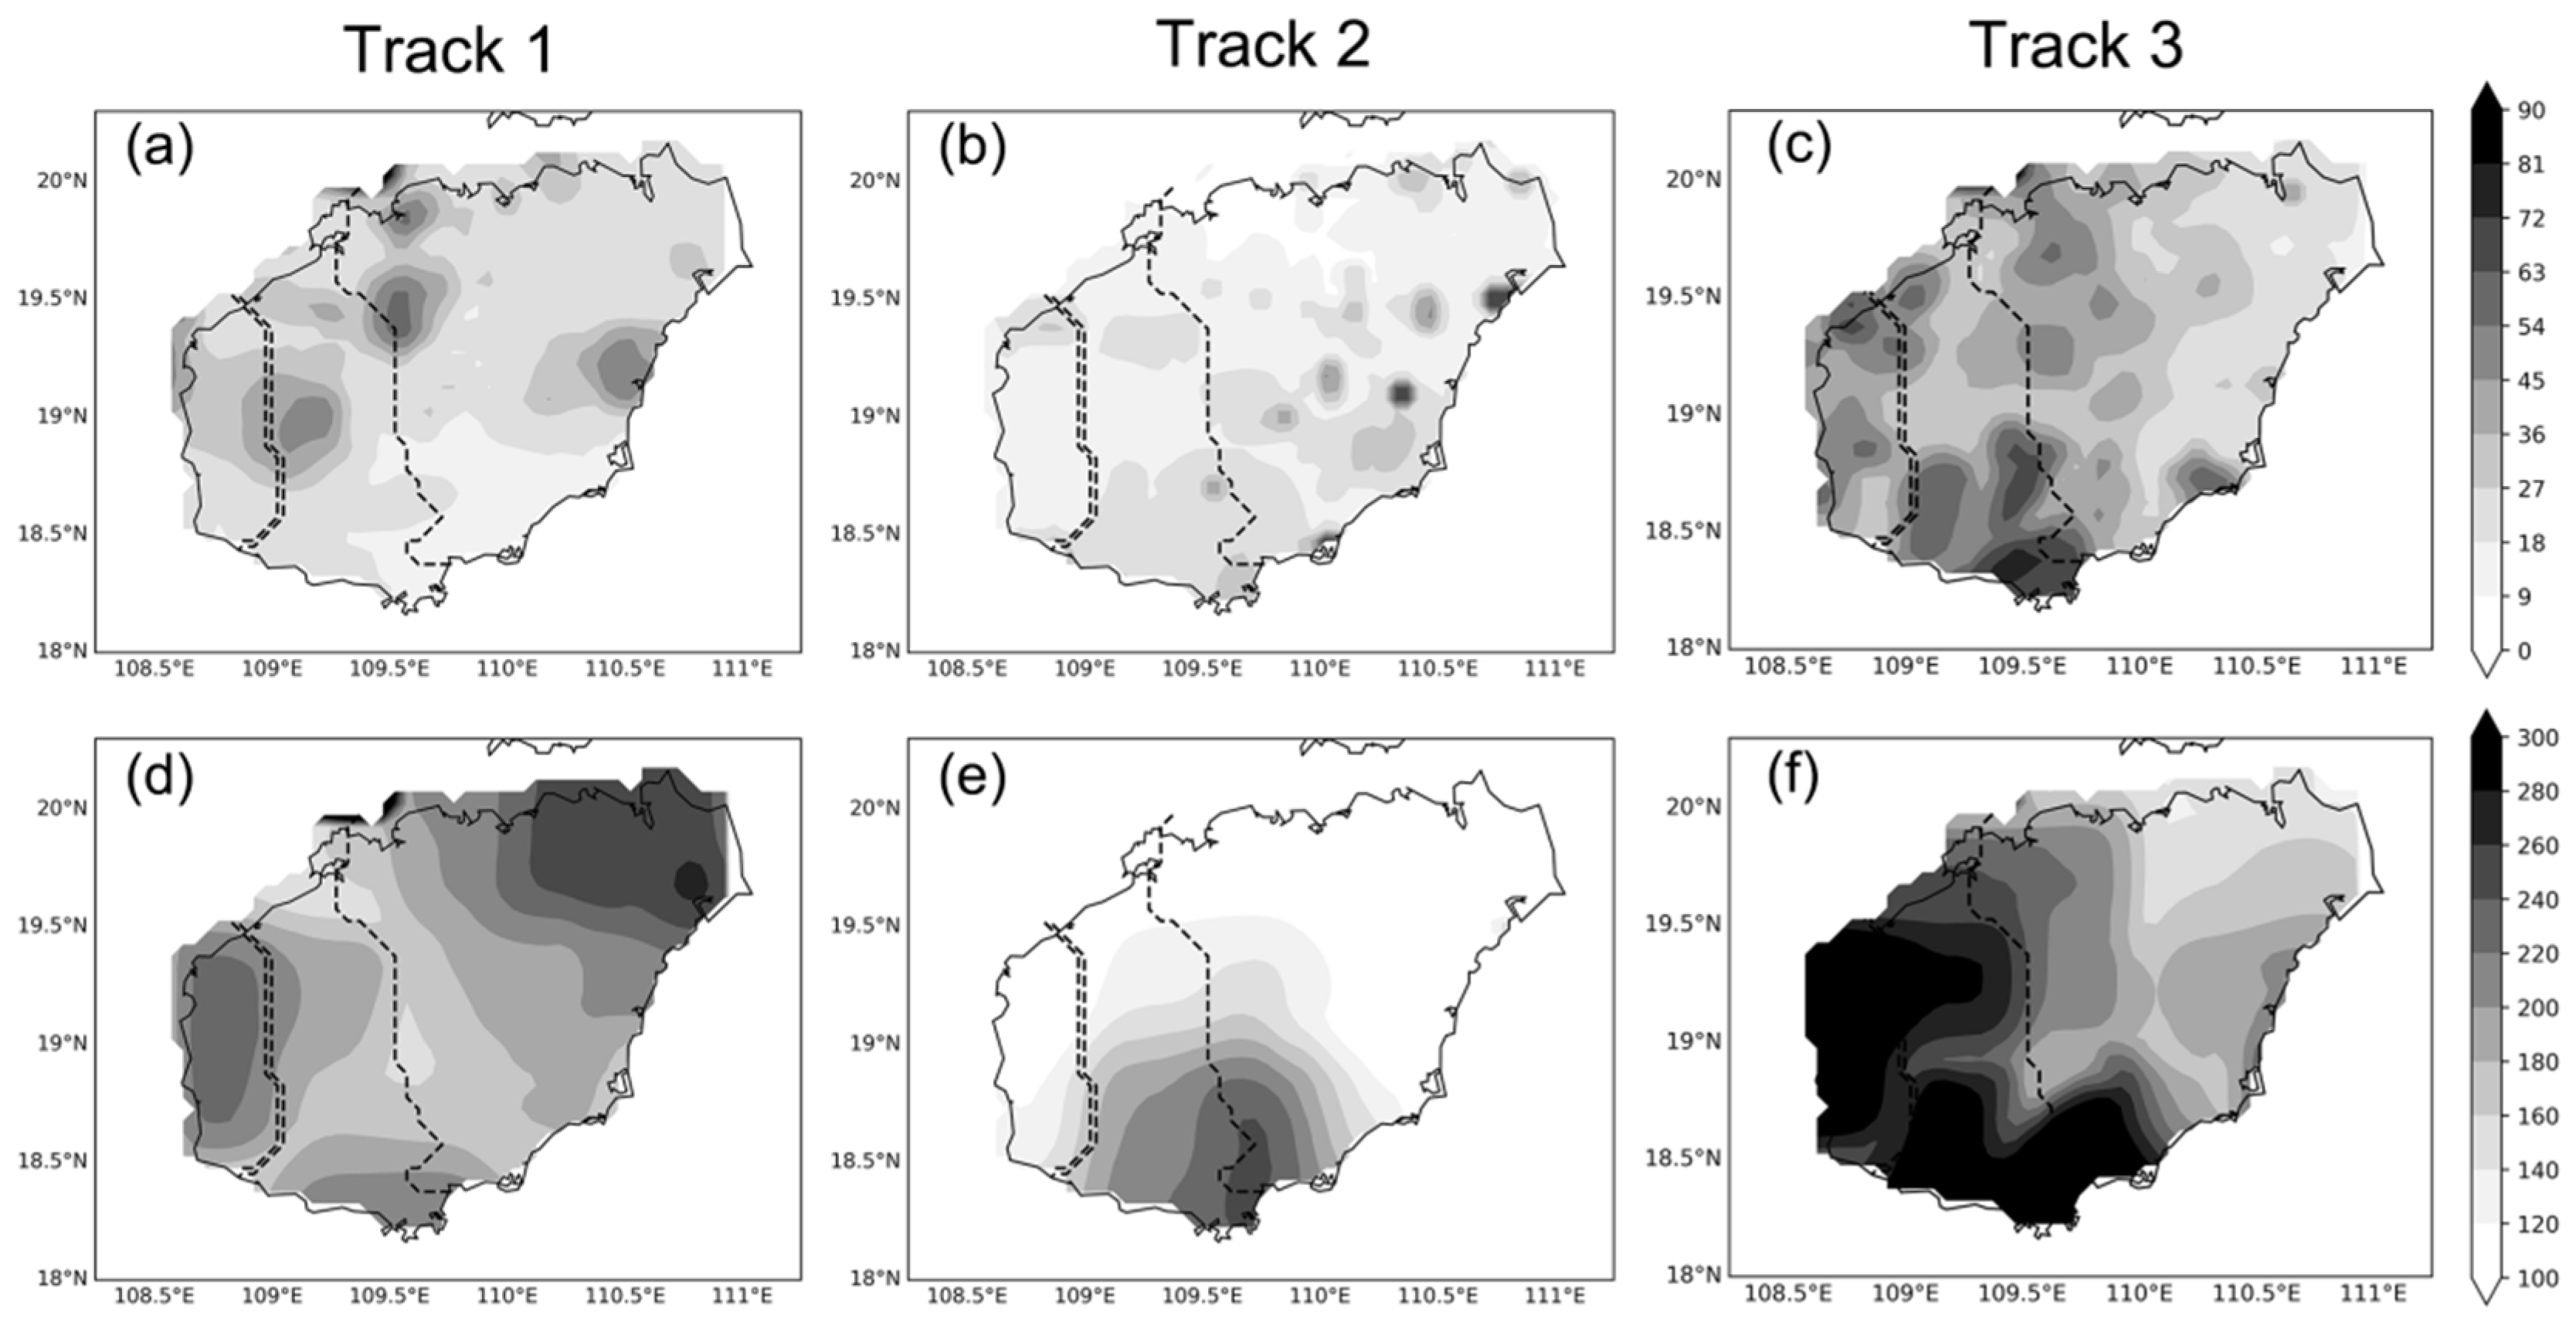
3.1.5. Spatial Distribution of the Maximum Precipitation

Figure 9 illustrates the intensity patterns of the maximum hourly and daily precipitation from typhoons following different trajectories. The analysis reveals significant spatial variability, highlighting the critical role of the typhoon paths in shaping precipitation distribution. For Track 1 high hourly precipitation rates in Baisha, Danzhou, and Qionghai, while other areas experience more moderate precipitation. Track 2 is associated with lower hourly precipitation, peaking in Qionghai and Wenchang. Track 3 produces the most intense typhoon-induced precipitation (TIP), especially in the western and central regions, with Sanya recording an extreme hourly maximum of 91 mm/h.
Daily precipitation patterns also vary by track. Track 1 typhoons bring increased daily precipitation to eastern regions (Haikou and Wenchang) and western areas, with lower amounts in central mountainous regions. Track 2 typhoons show prominent daily precipitation maxima in central and eastern regions, especially near Sanya and Lingshui, decreasing westward and northward. This pattern suggests weakening typhoon intensity or moisture content as systems move inland. Track 3 typhoons consistently generate higher daily precipitation rates across western and central regions, reaching a maximum of 354 mm day−1, indicating severe impacts.

3.2. Typhoon Contributions to Extreme Precipitation

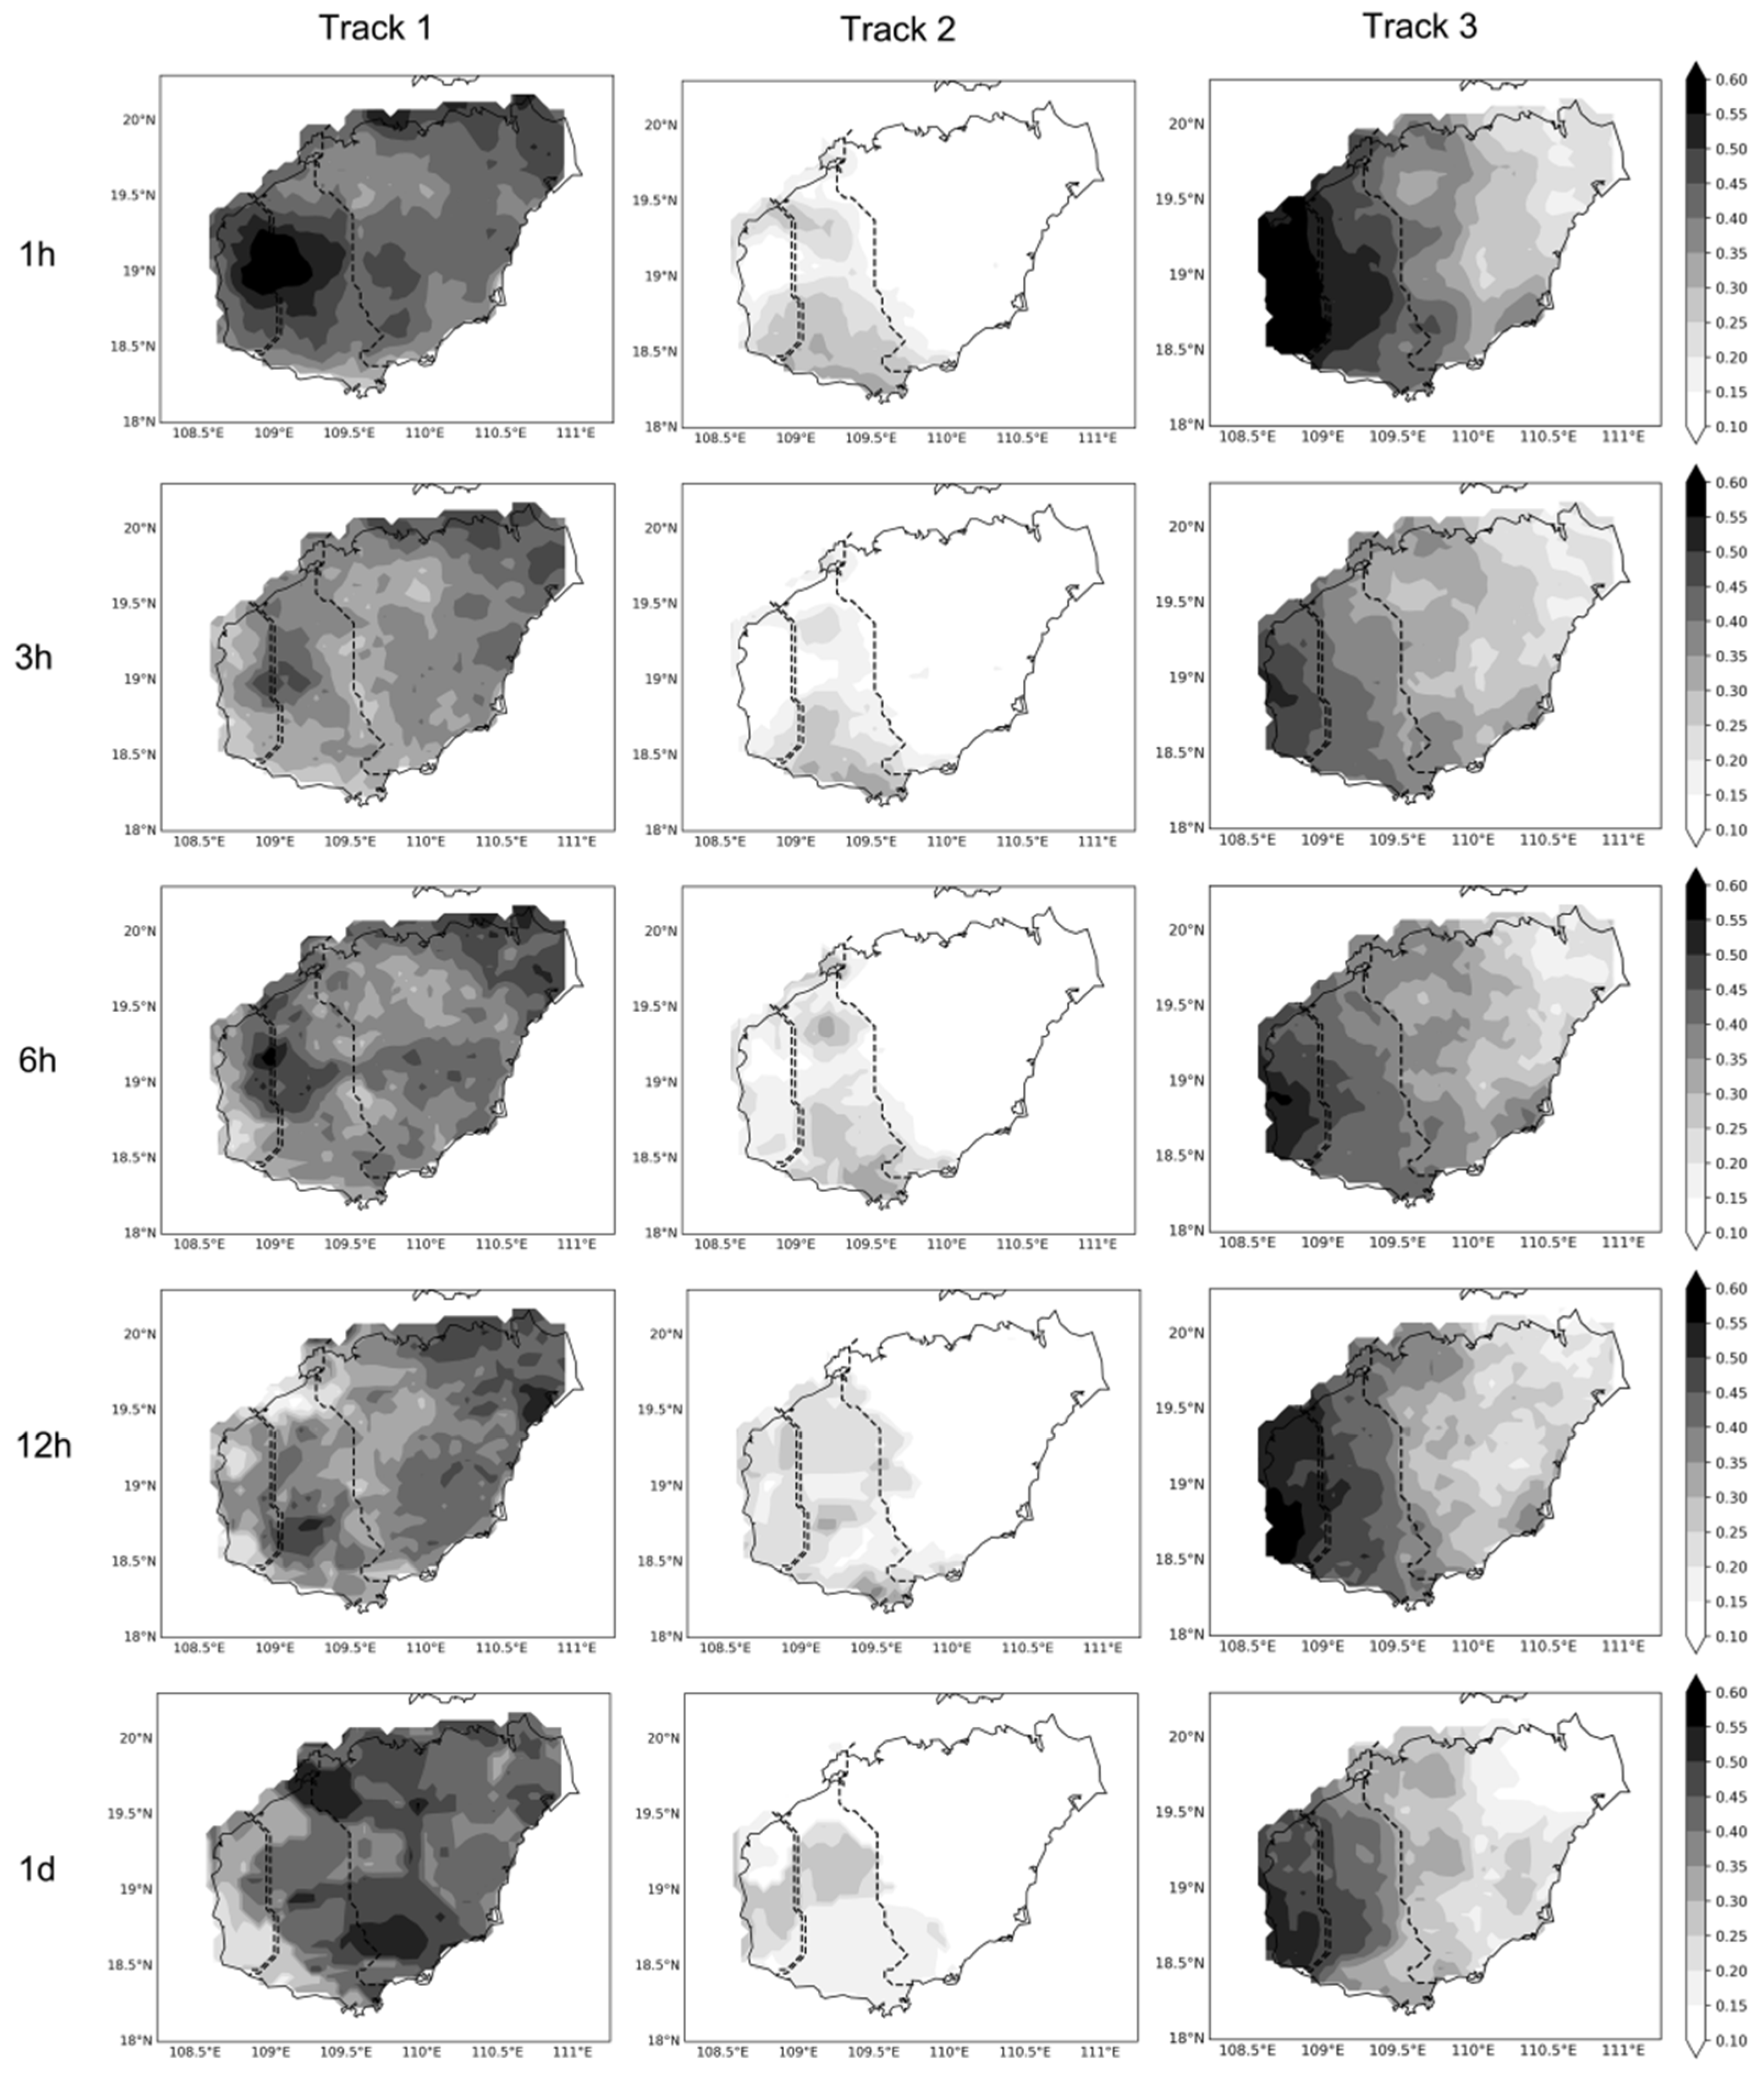
3.2.1. Spatial Distribution of the Contribution Rates

With hourly precipitation data from 2000 to 2020, this study applies the 95th and 99th percentile values as thresholds to define typhoon-induced extreme precipitation (TIEP) events. We quantify the contribution of typhoons to extreme precipitation at various temporal scales (1 h, 3 h, 6 h, 12 h, and 1 day), denoted as C95 and C99 (Figure 10 and Figure 11). Results reveal that as the thresholds increase, typhoon contribution to extreme precipitation events decreases, with the C95 values exceeding those of C99. This suggests that typhoons exert a more substantial influence on the lower tail of the extreme precipitation distribution.
Distinct spatial and temporal variations in contribution rates are observed across different typhoon tracks. For Track 1, the highest C95 values are recorded in the western, central, and eastern regions, especially around Haikou, with a noticeable decline from coastal to inland areas. C99 values show variations across different temporal scales, with higher rates progressively shifting from southeast to northwest as the temporal scale increases. For Track 2, elevated C95 values are primarily noted in the western and central regions, exhibiting a gradient decrease from southwest to northeast. C99 values similarly affect these areas, but the peak values gradually shift toward the northern sectors of the central and western regions as the temporal scale extends. Track 3 demonstrates a significant west-to-east decreasing trend in both C95 and C99 distribution, with the western regions identified as zones of high extreme precipitation contribution rates.

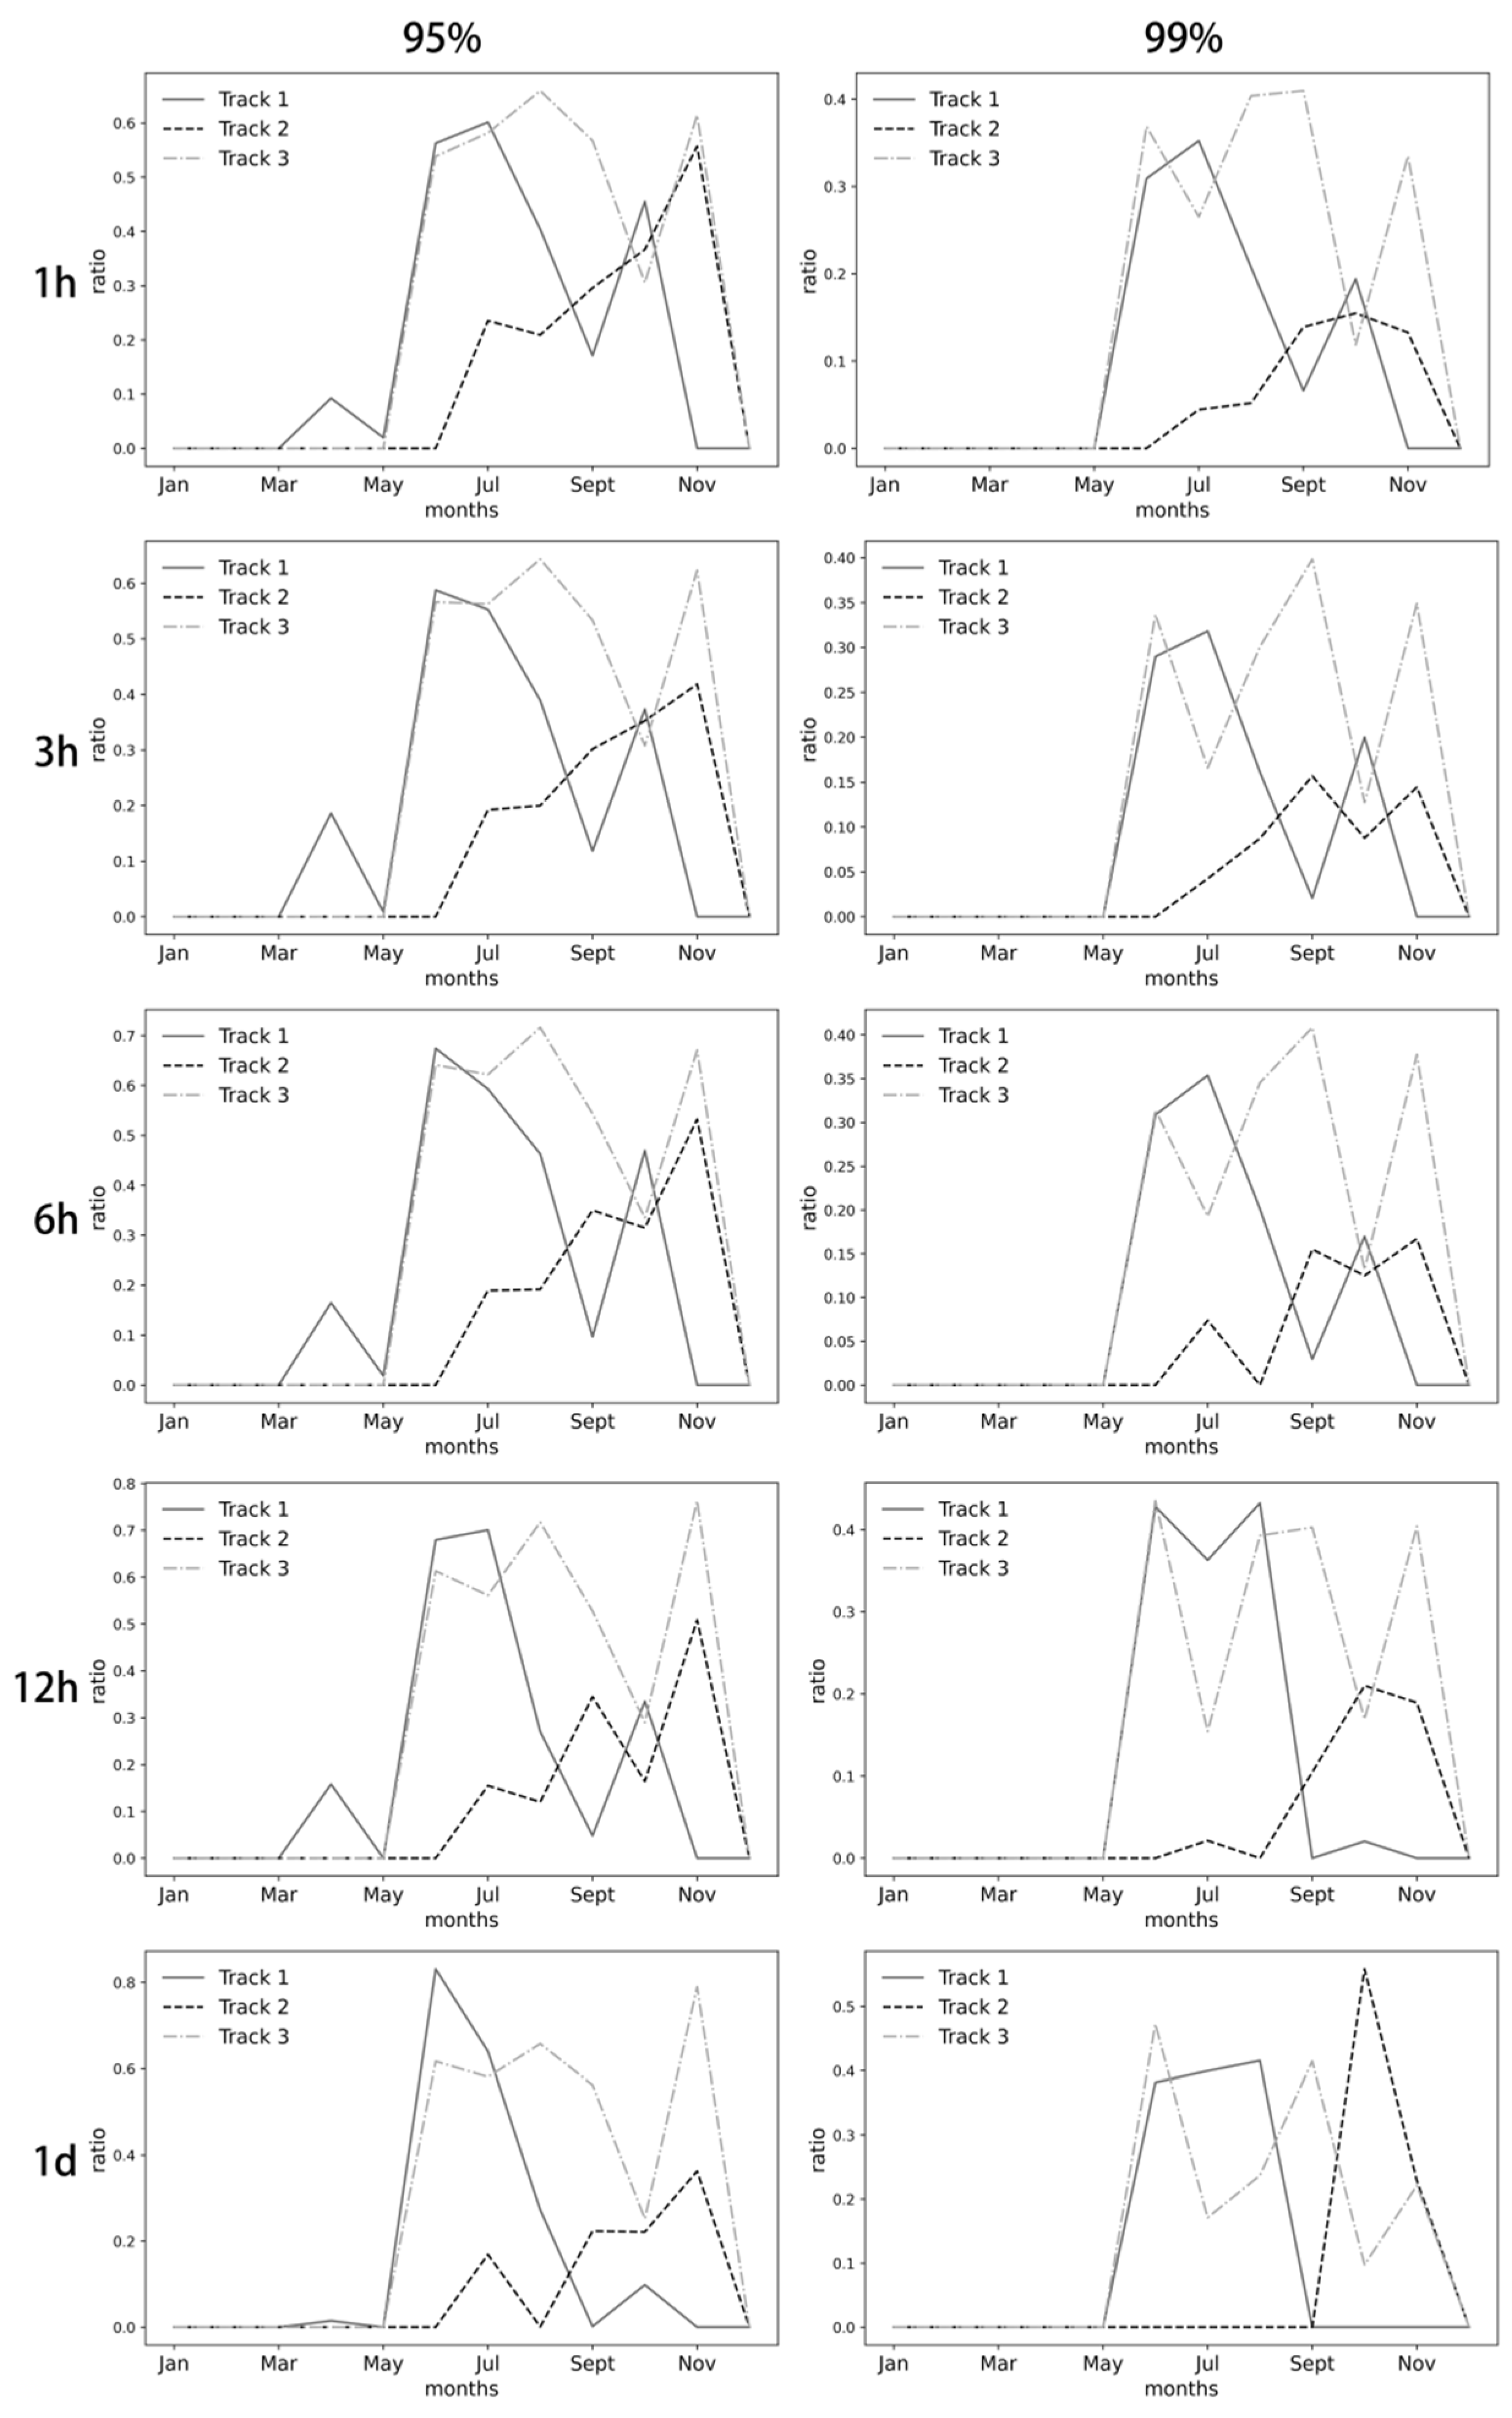
3.2.2. Intra-Annual Change in the Contribution Rate

This study delineates variations in the contribution rates of typhoon precipitation to Hainan Island across different tracks on a monthly scale (Figure 12). Results reveal an increasing trend in the overall typhoon contribution rates over expansion time scales, with C95 consistently exceeding C99.
There are notable differences in the temporal contribution rates among the typhoons following different tracks. Track 1 typhoons exhibit peak contribution rates between June and August, significantly impacting the terrestrial regions of Hainan Island during this period. High contribution rates are also observed in October, but gradually decline with increasing time scales, indicating that typhoons in October generally exert a relatively brief and weaker impact before swiftly relocating. Track 2 typhoons display varied seasonal patterns. At an hourly scale, a notable peak occurs from September to November. As time scales increase, contribution rates significantly amplify from June to August, albeit with a decline in the 1-day scale contribution rates during these months. This pattern indicates a broader temporal impact of these typhoons on Hainan Island, with extreme precipitation events primarily concentrated between September and November. Track 3 typhoons show a more consistent pattern, affecting Hainan Island from June to November. However, the impacts are comparatively moderate in July and October, potentially linked to the specific climatic dynamics inherent to this track.

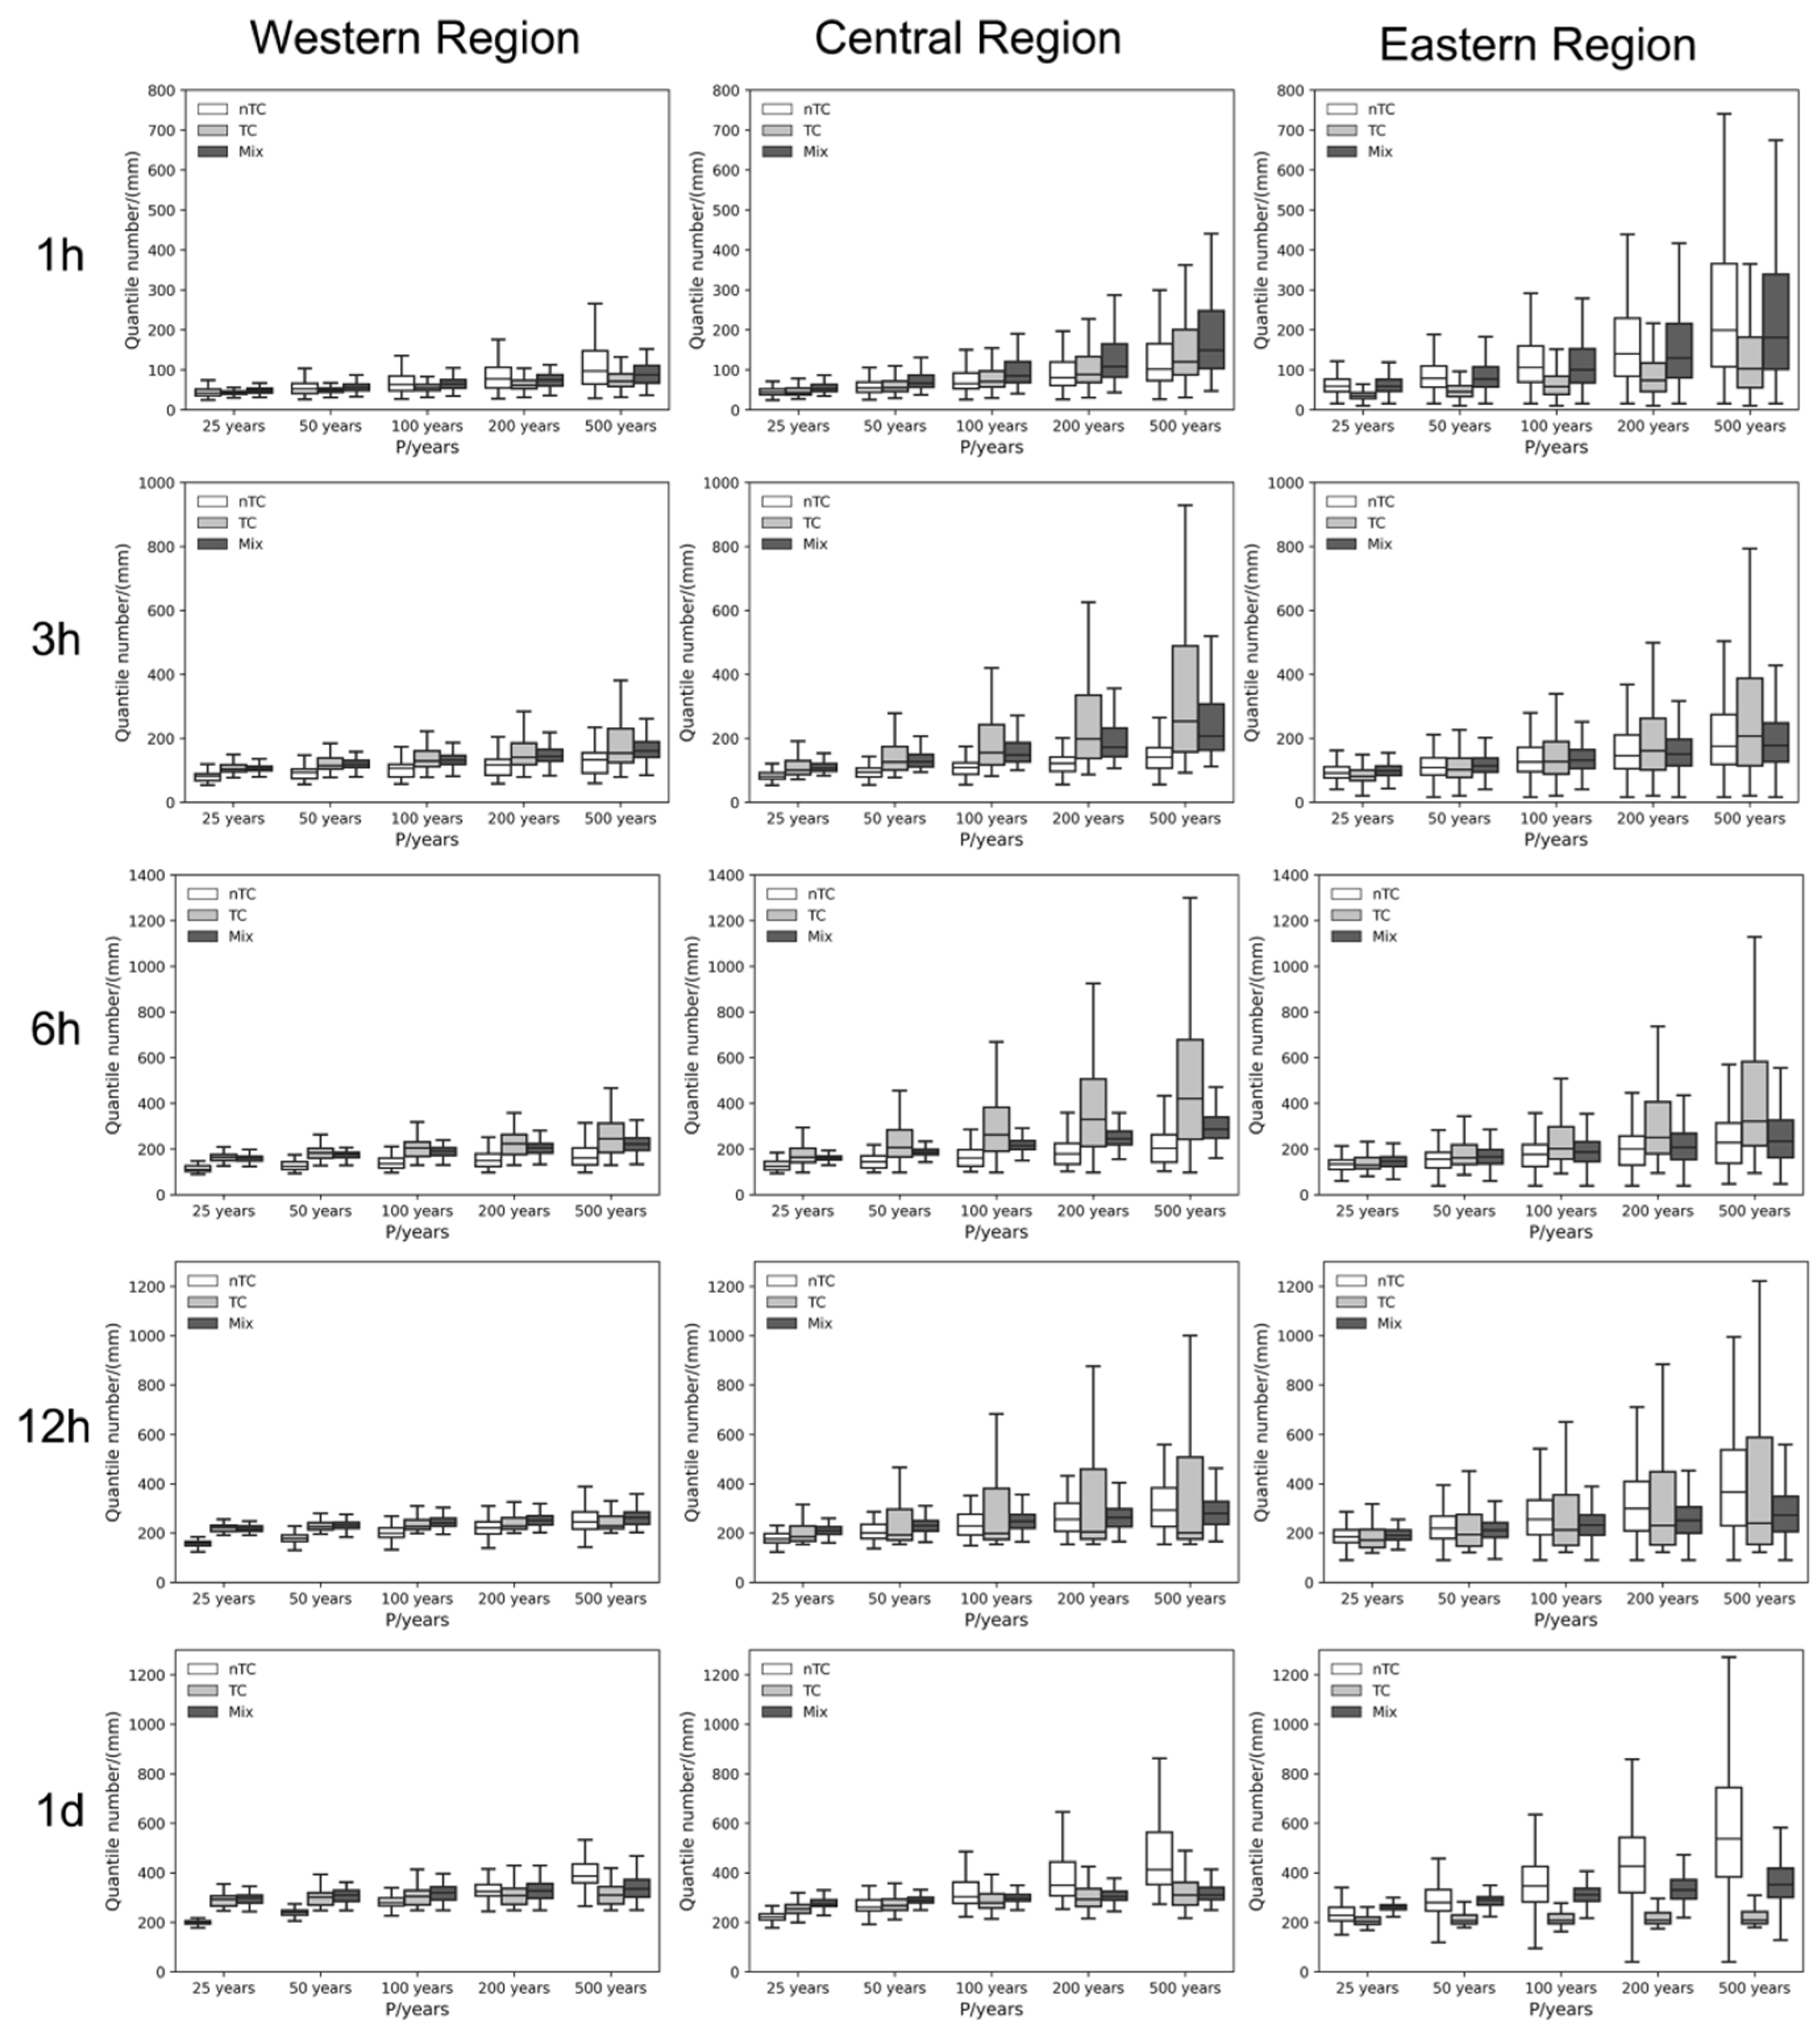
3.3. Statistical Analysis of Extreme Values

This study employs the GEV distribution model to estimate and simulate the return levels of precipitation under varying return periods (P) on Hainan Island (Figure 13). Percentiles are categorized into three groups: “TC” for typhoon periods, “nTC” for non-typhoon periods, and “Mix” for both periods combined. The analysis reveals distinct spatial variations in these percentiles across different regions and time scales.
For any given return period, the eastern region of Hainan Island experiences a higher percentile for nTC compared to Mix, suggesting a dominant influence of non-typhoon precipitation. Conversely, in the central and western regions, Mix percentiles are higher than those for nTC, indicating that the inclusion of typhoon data significantly alters the statistical characteristics of extreme precipitation events, potentially shortening their return periods.
On shorter return periods, both the western and eastern regions exhibit a higher Mix percentile compared to nTC. However, this relationship reverses in favor of nTC on longer return periods (12 h or 1 day). Additionally, the percentiles for TC initially increase and subsequently decrease, a pattern that likely reflects the short-duration impacts of typhoons, which typically affect the island for 2 to 3 days and may not persist throughout an entire day. The transient nature of typhoon-induced precipitation is critical for accurate statistical analysis. When examining longer time periods, these brief but intense rainfall events can lead to underestimation of percentiles if not properly accounted for. This potential bias highlights the importance of careful methodology in resampling and statistical assessments of extreme precipitation events.

3.4. Factors Influencing the TIEP

3.4.1. Extreme Precipitation in Relation to Air Pressure, Wind Speed, and Precipitation

This study examines the determinants of extreme precipitation events by analyzing the relationships between typhoon characteristics (duration, pressure, and wind speed) and the precipitation amounts across different regions of Hainan Island from 2000 to 2020 (Table 1).
The analysis reveals a consistent positive correlation between the duration of typhoon activities and total island extreme precipitation (TIEP) across Hainan Island. This suggests that longer-lasting typhoons tend to produce a greater amount of TIEP. In contrast, atmospheric pressure and precipitation are generally negatively correlated, except for the Track 1 region; lower pressure and increased precipitation during typhoons. Wind speed exhibits a positive correlation with precipitation intensity, likely due to enhanced moisture transport from maritime sources to land and facilitated vertical convective transport of heat and moisture.
The Track 1 region on Hainan Island displays unique extreme precipitation characteristics. In this region, extreme precipitation is positively correlated with atmospheric pressure and negatively correlated with wind speed. This atypical relationship may be attributed to the low-pressure systems prevalent in Track 1, which are often accompanied by substantial moisture accumulation and robust convective activity conducive to extreme precipitation events. In these low-pressure environments, the ascending motion facilitates moisture condensation, thereby enhancing precipitation intensity. Moreover, an elevated pressure gradient can amplify the transport of moisture, further intensifying the precipitation dynamics. However, strong winds in this region might hinder the effective transport of moisture and disrupt convective processes, leading to a distinct impact pattern from typhoons that follow other trajectories.

3.4.2. Relationship between the Extreme Precipitation and the SST

To elucidate the relationship between extreme precipitation events and the SST, we calculated the correlation coefficients (CCs) for 2000–2020 between extreme precipitation amounts in various Hainan Island regions and SST variations in the surrounding marine areas (Figure 14). Regions traversed by typhoon centers exhibit notably higher CCs. This robust coupling between SST variations and the extreme precipitation events occurrence may be attributed to the typhoons’ transport of substantial moisture over these warmer sea areas. Typhoon path and intensity are critical determinants of local precipitation patterns. Furthermore, warmer SSTs in proximity to typhoon centers provide a rich source of heat and moisture, significantly enhancing the precipitation capacity of the typhoons.

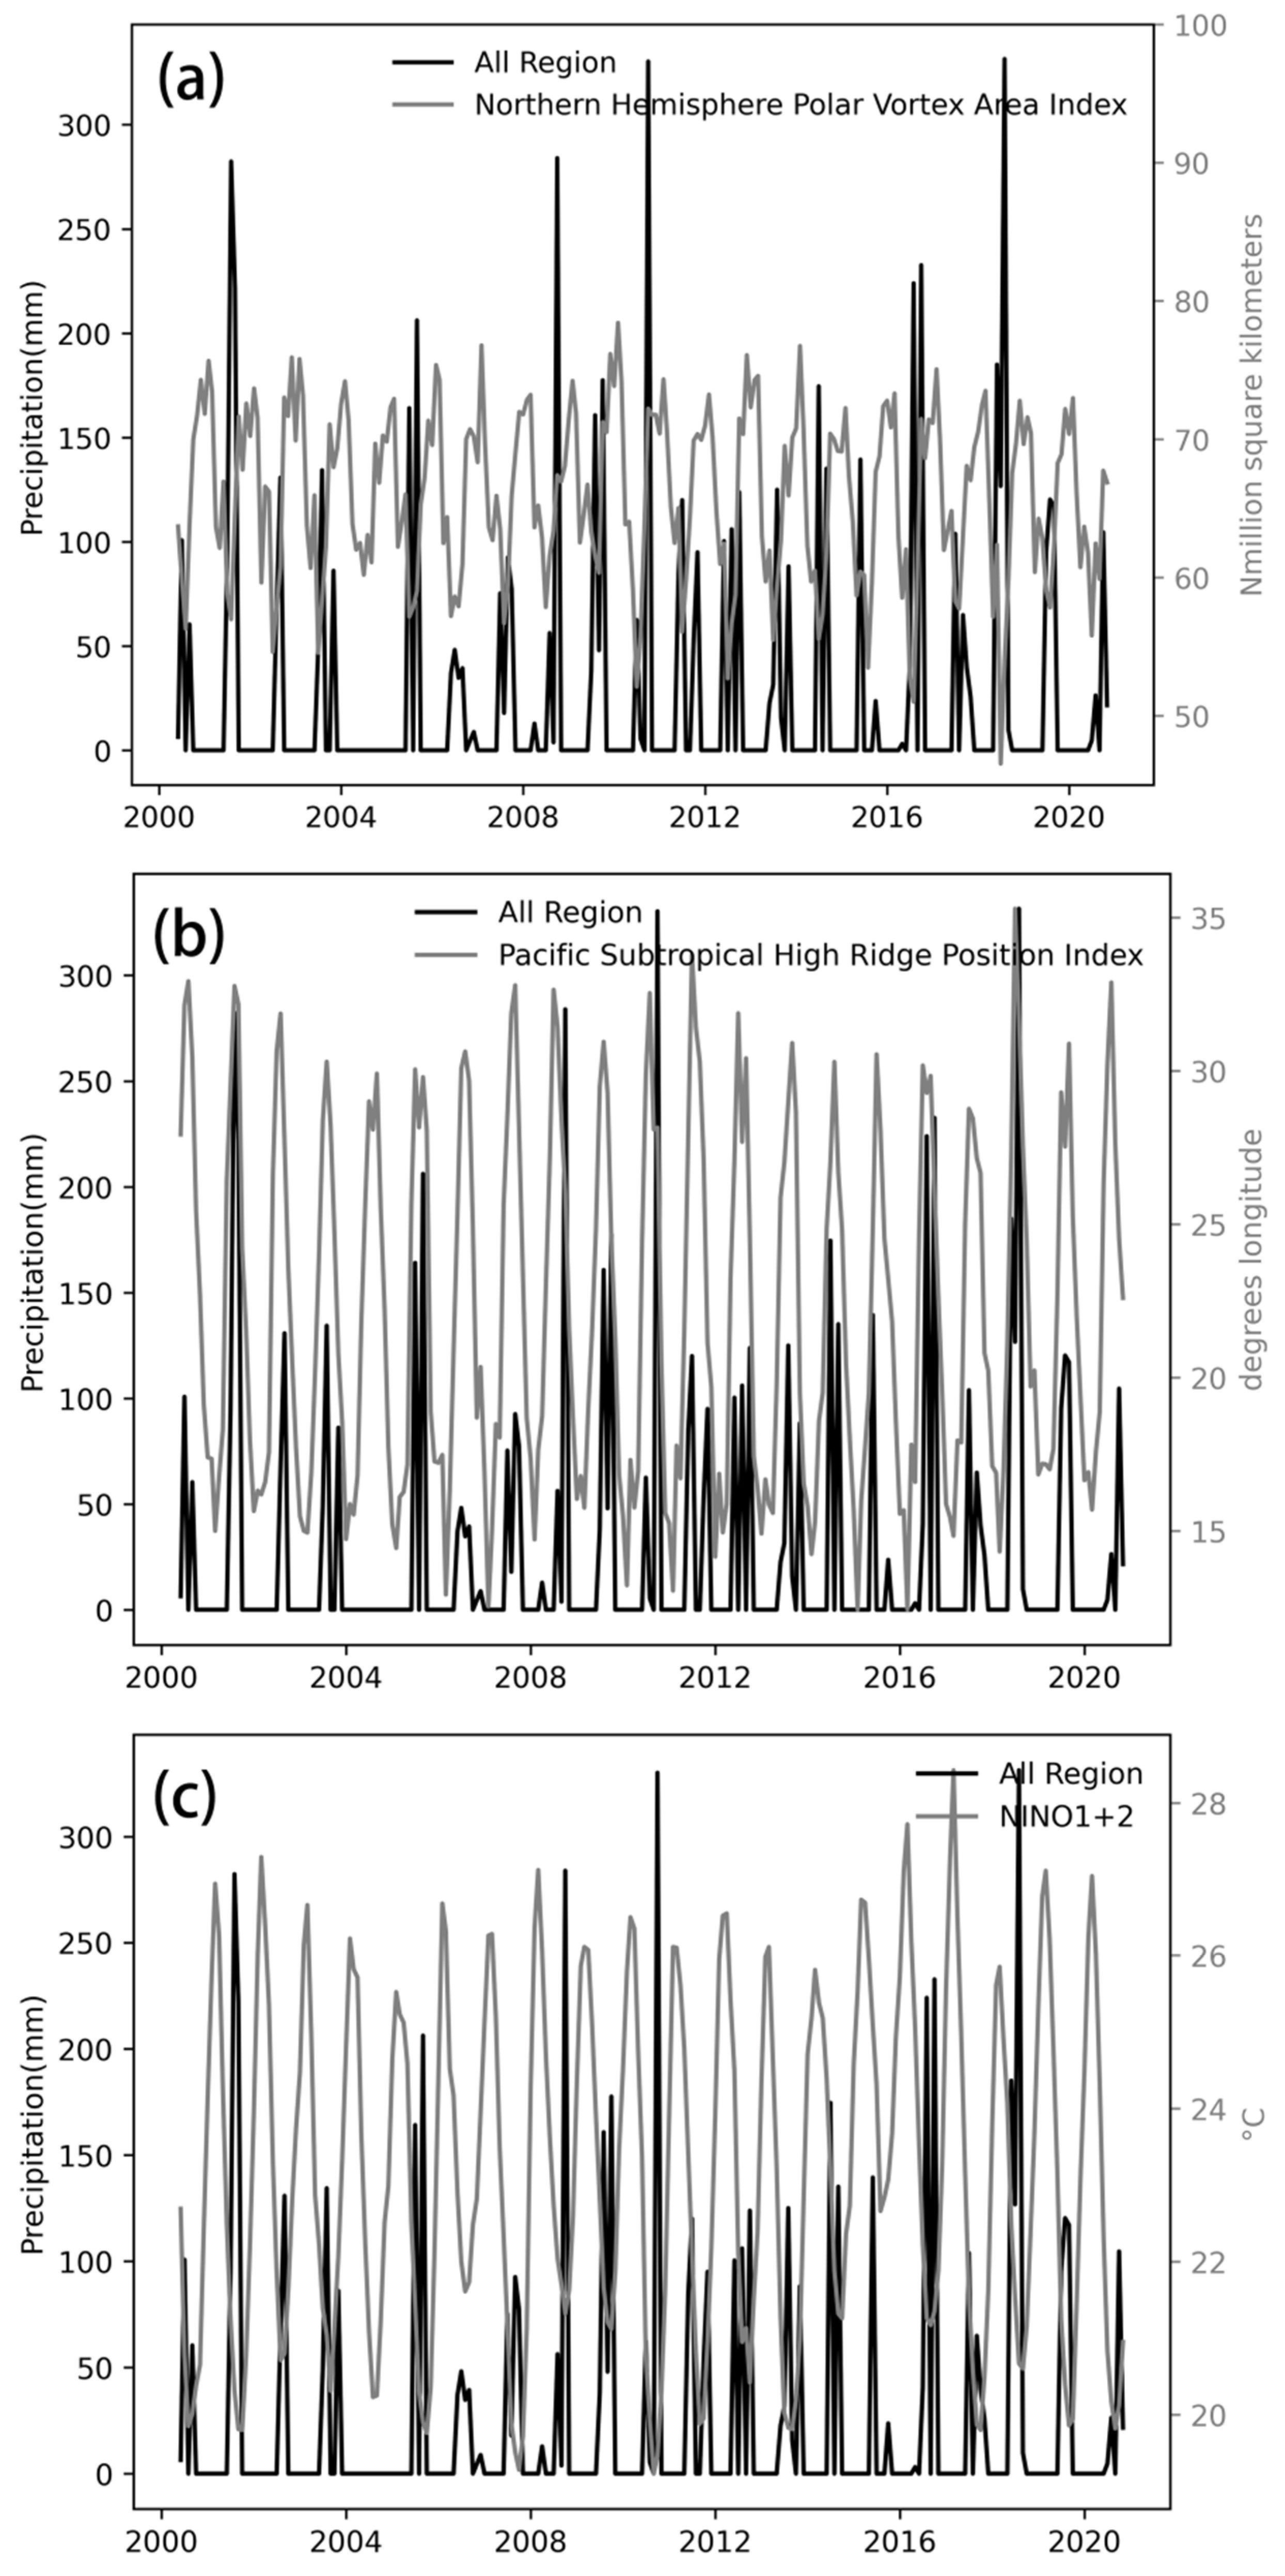
3.4.3. Extreme Precipitation in Relation to the Atmospheric Circulation and ENSO

This study examines the relationship between the TIEP and atmospheric circulation indices (Table 2). The analysis reveals a significant negative correlation between the extreme precipitation and atmospheric circulation indices, particularly strong in the western (CCs ranging from −0.303 to −0.385) and central (CCs ranging from −0.277 to −0.368) regions of Hainan Island. The correlation is comparatively weaker in the eastern region (CCs ranging from −0.172 to −0.260).
Intensification and expansion of the northern hemisphere’s polar vortex are observed to inhibit typhoon development and restrict their northward movement, consequently diminishing the precipitation associated with these systems. Furthermore, SST changes in the Niño 1 + 2 region (CCs ranging from −0.340 to −0.406) exert a significant influence on the activity of typhoon systems in the Northwest Pacific. These factors critically modulate typhoon-associated precipitation in Hainan Island. Notably, when the Western Pacific Subtropical High is elevated, a corresponding increase in extreme precipitation in Hainan is typically observed.
To delineate temporal relationships between extreme precipitation events and climatic indices, this study analyzes a time series of extreme precipitation data from Hainan Island alongside representative indices (Figure 15). The analysis demonstrates a discernible negative correlation between the TIEP and both the Northern Hemisphere Polar Vortex Area Index and the Niño 1 + 2 SST Index. Lower values of these indices are frequently associated with heightened occurrences of intense extreme precipitation.
A reduced Northern Hemisphere Polar Vortex Area Index correlates with increased frequency and intensity of polar cold air descending toward lower latitudes, instigating atmospheric circulation anomalies that precipitate heavy rainfall events. Concurrently, a lower Niño 1 + 2 SST Index, indicative of a cooler SST in the equatorial Eastern Pacific, influences global atmospheric circulation patterns. This alteration amplifies the strength and alters the position of the subtropical high, thereby elevating the potential for TIEP.
Conversely, there is a positive correlation between extreme precipitation and the Pacific Subtropical High Ridge Position Index. When the subtropical high is positioned at higher latitudes, it often results in the formation of a robust convergence zone on its southern flank. This convergence, coupled with ascending moist air, fosters conditions conducive to heavy precipitation. The intensity of the TIEP is notably enhanced under these circumstances.

4. Discussion

Typhoon intensity exhibited significant interannual variability, with 2001, 2016, and 2018 experiencing particularly elevated levels of extreme precipitation. This variability underscores the influence of natural climatic oscillations on TC-associated extreme precipitation events. Large-scale climate phenomena, including ENSO, significantly modulate typhoon frequency and intensity [10,23]. During El Niño years, studies show a substantial decrease in the passage rate and extreme wind speeds of tropical cyclones along China’s southeastern coast [30,31,32], corroborating our findings. The correlation coefficients between the Niño 1 + 2 SST Index and typhoon activity on Hainan Island range from −0.340 to −0.406, indicating a negative relationship that supports the broader impacts of Pacific Ocean SST variations on typhoon dynamics.
Global TC precipitation rates are projected to increase due to enhanced tropical water vapor from anthropogenic warming, with a median increase of 14% [1]. This projection suggests more frequent extreme typhoon-related precipitation events in the future. Studies have shown an increase in both the number of days with extreme heavy precipitation and the total precipitation volume associated with TCs [12]. These findings align with trends observed on Hainan Island, where a general increase in extreme precipitation has been noted. In the central region, extreme precipitation (95th percentile threshold) has risen by 77.1 mm decade−1, likely corresponding with increases in TC intensity and duration at landfall in recent decades [33]. Additionally, the continuous rise in global temperatures since 1960 [34] has led to higher temperatures and evaporation rates, thereby increasing the atmospheric water vapor content. This change requires more energy for water vapor condensation, resulting in prolonged energy accumulation in cloud formations before precipitation events. Consequently, the intensification of extreme precipitation acts as a significant indicator of increased heavy rainfall events [35]. Moreover, a study by Zhao, N. [36] indicates divergent trends in the maximum daily rainfall (TMDR) from tropical cyclones on Hainan Island. The frequencies for TMDR reaching thresholds of 50 mm, 100 mm, and 250 mm show a trend of decreasing by 0.7 decade−1, a slight decrease of 0.2 decade−1, and a slight increase of 0.1 decade−1, respectively. At higher thresholds, these trends suggest that extreme precipitation events are becoming more frequent, with typhoons having an increasingly severe impact on extreme precipitation patterns on Hainan Island.
Spatial analyses reveal significant variability in how different typhoon tracks contribute to extreme precipitation events on Hainan Island (Figure 10 and Figure 11). Notably, Tracks 1 and 3 significantly influence precipitation primarily in the western regions and at the northern end of the eastern regions. These observations support earlier studies [14,37,38], which show that the typical paths of these typhoons pass just north of Wuzhishan Mountain. As these typhoons approach this area, the northwesterly wind flow on the southwest flank of the typhoon center experiences orographic lifting and blocking by Wuzhishan Mountain, leading to substantial increases in precipitation. This interaction between typhoon trajectories and orographic features explains why the northwestern region of Hainan Island is particularly prone to intense rainfall. Furthermore, typhoon centers tend to slow down on the windward slopes of Wuzhishan Mountain, extending their duration in the area. Simultaneously, a weaker Western Pacific Subtropical High may diminish the steering currents at 500 hPa, further slowing typhoon movement [36]. These dynamics contribute to an increased rate of extreme precipitation in this area.
Recent studies have established a robust correlation between the inter-annual frequency of extreme summer precipitation events and SST variations [39]. Our research supports these findings, demonstrating a strong linkage between SST fluctuations and the occurrence of extreme precipitation events. Elevated SSTs provide critical thermal energy and moisture, which significantly enhance both typhoon development and precipitation capabilities, thereby directly contributing to extreme precipitation events. Additionally, increased SSTs in regions frequented by typhoon centers can intensify moisture convergence and precipitation processes through the positive feedback mechanisms of local atmospheric circulations.

5. Conclusions

This study analyzes the spatiotemporal distribution and contributing factors of typhoon-induced extreme precipitation events on Hainan Island using GsMAP satellite-retrieved precipitation data and best track data from the China Meteorological Administration. The main findings are as follows:
(1)
From 1949 to 2020, typhoon events affecting Hainan decreased by 0.3 events decade−1 (p < 0.01). However, extreme precipitation events increased by 1.5 and 1.8 events decade−1 at the 95th and 99th percentiles, respectively, from 2000 to 2020. Extreme precipitation surged by 77.1 mm decade−1 in the eastern region, 73.3 mm decade−1 in the central region, and 58.6 mm decade−1 in the western region, respectively.
(2)
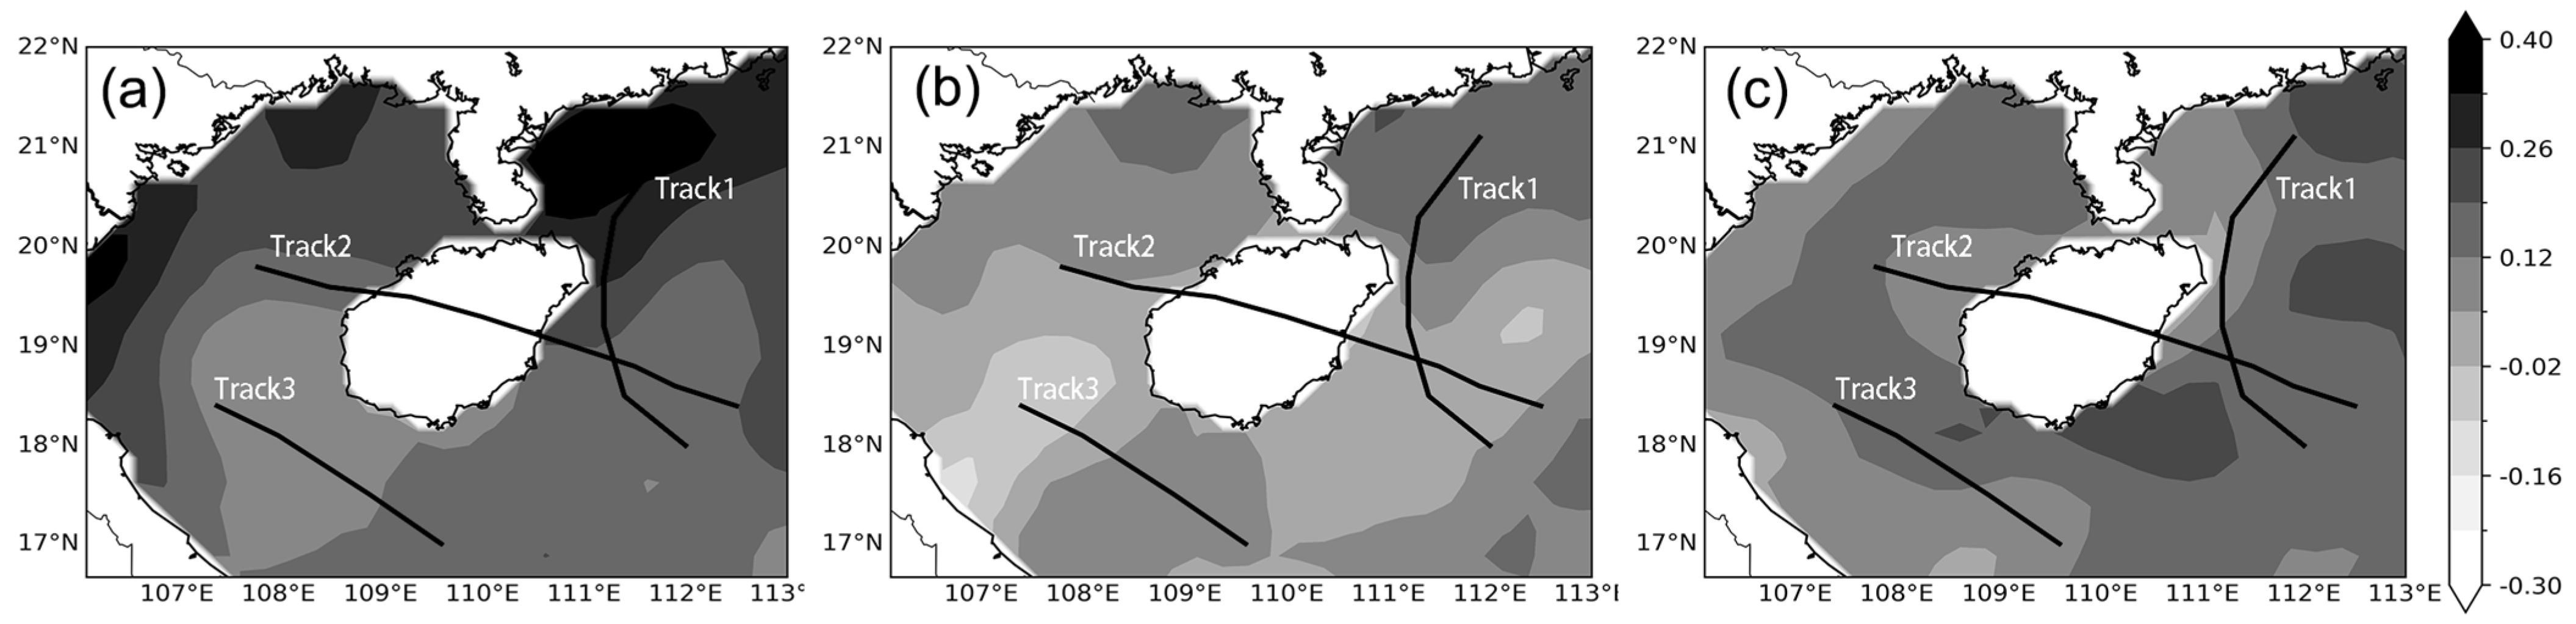
Typhoon paths significantly influence the spatial distribution of extreme precipitation events, with Track 1 and 2 affecting the western and central regions. While Track 3 primarily impacts the western region. The contribution rates of typhoons to extreme precipitation vary spatiotemporally and seasonally.
(3)
Incorporating typhoon precipitation data reduces the return period of extreme precipitation events in the central and eastern regions but extends it in the eastern region.
(4)
Typhoon duration, wind speed, and SST positively correlate with extreme precipitation volumes, while atmospheric pressure and circulation indices show negative correlations. ENSO events, particularly SST variations in the Niño 1 + 2 region (correlation coefficients ranging from −0.340 to −0.406), notably impact typhoon activity.

Author Contributions

M.X. conceived and designed the experiments; analyzed and interpreted the data; contributed reagents, materials, analysis tools, or data; and wrote the paper. Y.T. conceived and designed the experiments; performed the experiments; analyzed and interpreted the data; and wrote the paper. C.S. performed the experiments and contributed reagents, materials, analysis tools, or data. Y.X. performed the experiments and contributed analysis tools or data. M.S. assisted in the analysis and interpretation of the data and contributed materials. J.W. contributed to the acquisition and analysis of data and assisted in the preparation of the manuscript. Y.Y. contributed to experimental setup and data collection. J.D. assisted in the design of the methodology and provided critical feedback on the manuscript. L.B. oversaw the project direction and planning; contributed to the conception and design of the experiments; provided final approval of the version to be published; and ensured questions related to all aspects of the work were appropriately resolved. All authors have read and agreed to the published version of the manuscript.

Funding

This project is funded by the National Natural Science Foundation of China (No. 32260294), the Hainan University Research Fund (KYQD(ZR)-22083), and the Hainan Provincial Natural Science Foundation of China (No. 423QN208).

Institutional Review Board Statement

Not applicable.

Informed Consent Statement

Informed consent was obtained from all subjects involved in the study.

Data Availability Statement

The typhoon track data is sourced from the Shanghai Typhoon Institute under the China Meteorological Administration. Precipitation data is derived from the Global Satellite Mapping of Precipitation (GSMaP) Reanalysis product. Sea Surface Temperature (SST) data comes from multiple sources: the Niño SST indices provided by the Climate Prediction Center (CPC) of the National Centers for Environmental Prediction (NCEP) are available at https://www.cpc.ncep.noaa.gov/data/indices/sstoi.indices (accessed on 16 May 2024) additional SST data provided by the National Centers for Environmental Information (NCEI) in the United States can be accessed at https://www.ncdc.noaa.gov/oisst (accessed on 16 May 2024); and the National Climate Center of the China Meteorological Administration also offers SST indices, available at https://cmdp.ncc-cma.net/Monitoring/cn_index_130.php (accessed on 16 May 2024).

Acknowledgments

We would like to express our sincere gratitude to Weijie Liao and Shixi Li for their invaluable assistance in the preliminary work and data preparation for this study. Their contributions have been instrumental in laying the foundation for our research and analysis.

Conflicts of Interest

The authors declare no conflicts of interest.

Appendix A

Table A1. Correlation coefficients between the TIEP and typhoon features in different sub-regions with different typhoon track paths.
IndexAll RegionWestern RegionCentral RegionEastern Region
Northern Hemisphere Subtropical High Area Index0.362 ***0.415 ***0.403 ***0.306 ***
North African Subtropical High Area Index0.342 ***0.408 ***0.385 ***0.282 ***
North African–North Atlantic–North American Subtropical High Area Index 0.376 ***0.442 ***0.422 ***0.313 ***
Indian Subtropical High Area Index−0.104 −0.098 −0.110 −0.096
Western Pacific Subtropical High Area Index0.164 *0.152 *0.171 **0.152 *
Eastern Pacific Subtropical High Area Index0.370 ***0.415 ***0.408 ***0.316 ***
North American Subtropical High Area Index0.384 ***0.446 ***0.430 ***0.321 ***
Atlantic Subtropical High Area Index0.392 ***0.455 ***0.438 ***0.329 ***
South China Sea Subtropical High Area Index−0.113 −0.129 *−0.119 −0.099
North American–Atlantic Subtropical High Area Index0.394 ***0.458 ***0.441 ***0.329 ***
Pacific Subtropical High Area Index0.313 ***0.335 ***0.340 ***0.274 ***
Northern Hemisphere Subtropical High Intensity Index0.381 ***0.446 ***0.429 ***0.317 ***
North African Subtropical High Intensity Index0.357 ***0.435 ***0.407 ***0.291 ***
North African–North Atlantic–North American Subtropical High Intensity Index0.389 ***0.468 ***0.442 ***0.318 ***
Indian Subtropical High Intensity Index−0.101 −0.093 −0.105 −0.095
Western Pacific Subtropical High Intensity Index0.210 ***0.189 **0.213 ***0.199 **
Eastern Pacific Subtropical High Intensity Index0.347 ***0.395 ***0.388 ***0.293 ***
North American Subtropical High Intensity Index0.402 ***0.475 ***0.455 ***0.332 ***
North Atlantic Subtropical High Intensity Index0.401 ***0.485 ***0.456 ***0.327 ***
South China Sea Subtropical High Intensity Index−0.103 −0.117 −0.108 −0.090
North American–North Atlantic Subtropical High Intensity Index0.405 ***0.485 ***0.460 ***0.332 ***
Pacific Subtropical High Intensity Index0.315 ***0.332 ***0.340 ***0.278 ***
Northern Hemisphere Subtropical High Ridge Position Index0.475 ***0.486 ***0.500 ***0.428 ***
North African Subtropical High Ridge Position Index0.439 ***0.464 ***0.470 ***0.389 ***
Indian Subtropical High Ridge Position Index0.432 ***0.460 ***0.464 ***0.382 ***
Indian Subtropical High Ridge Position Index−0.176 **−0.127 *−0.179 **−0.175 **
Western Pacific Subtropical High Ridge Position Index0.489 ***0.489 ***0.508 ***0.447 ***
Eastern Pacific Subtropical High Ridge Position Index0.072 0.069 0.074 0.068
North American Subtropical High Ridge Position Index0.066 0.066 0.069 0.061
Atlantic Sub Tropical High Ridge Position Index0.149*0.137 *0.151 *0.141 *
South China Sea Subtropical High Ridge Position Index−0.030 0.013 −0.035 −0.037
North American–North Atlantic Subtropical High Ridge Position Index0.065 0.065 0.068 0.059
Pacific Subtropical High Ridge Position Index0.487 ***0.484 ***0.506 ***0.446 ***
Northern Hemisphere Subtropical High Northern Boundary Position Index0.111 0.104 0.113 0.104
North African Subtropical High Northern Boundary Position Index0.195 **0.191 **0.197 **0.181 **
North African–North Atlantic–North American Subtropical High Northern Boundary Position Index0.135 *0.135 *0.138 *0.125
Indian Subtropical High Northern Boundary Position Index0.078 0.079 0.073 0.075
Western Pacific Subtropical High Northern Boundary Position Index0.059 0.044 0.062 0.058
Eastern Pacific Subtropical High Northern Boundary Position Index0.310 ***0.316 ***0.319 ***0.284 ***
North American Subtropical High Northern Boundary Position Index0.185 **0.178 **0.188 **0.172 **
Atlantic Subtropical High Northern Boundary Position Index0.252 ***0.255 ***0.260 ***0.230 ***
South China Sea Subtropical High Northern Boundary Position Index−0.035 −0.041 −0.026 −0.035
North American–Atlantic Subtropical High Northern Boundary Position Index0.175 **0.170 **0.179 **0.163 *
Pacific Subtropical High Northern Boundary Position Index0.129 *0.121 0.132 *0.121
Western Pacific Sub Tropical High Western Ridge Point Index0.177 **0.179 **0.183 **0.162 *
Asia Polar Vortex Area Index−0.240 ***−0.314 ***−0.284 ***−0.185 **
Pacific Polar Vortex Area Index−0.311 ***−0.373 ***−0.358 ***−0.252 ***
North American Polar Vortex Area Index−0.306 ***−0.362 ***−0.344 ***−0.255 ***
Atlantic–European Polar Vortex Area Index−0.201 **−0.227 ***−0.230 ***−0.167 **
Northern Hemisphere Polar Vortex Area Index−0.320 ***−0.385 ***−0.368 ***−0.260 ***
Asia Polar Vortex Intensity Index−0.287 ***−0.351 ***−0.327 ***−0.232 ***
Pacific Polar Vortex Intensity Index−0.228 ***−0.303 ***−0.277 ***−0.172 **
North American Polar Vortex Intensity Index−0.242 ***−0.292 ***−0.274 ***−0.198 **
Atlantic–European Polar Vortex Intensity Index−0.216 ***−0.268 ***−0.254 ***−0.171 **
Northern Hemisphere Polar Vortex Intensity Index−0.266 ***−0.331 ***−0.308 ***−0.212 ***
Northern Hemisphere Polar Vortex Central Longitude Index−0.118 −0.128 *−0.137 *−0.099
Northern Hemisphere Polar Vortex Central Latitude Index0.175 **0.167 **0.185 **0.161 *
Northern Hemisphere Polar Vortex Central Intensity Index0.342 ***0.375 ***0.371 ***0.297 ***
Eurasian Zonal Circulation Index−0.140 *−0.223 ***−0.188 **−0.088
Eurasian Meridional Circulation Index−0.126 *−0.125 *−0.131 *−0.114
Asian Zonal Circulation Index−0.120 −0.215 ***−0.170 **−0.066
Asian Meridional Circulation Index−0.106 −0.116 −0.113 −0.093
East Asian Trough Position Index−0.056 −0.035 −0.056 −0.057
East Asian Trough Intensity Index0.399 ***0.423 ***0.427 ***0.354 ***
Tibet Plateau Region 1 Index0.411 ***0.406 ***0.426 ***0.377 ***
Tibet Plateau Region 2 Index0.410 ***0.415 ***0.428 ***0.372 ***
India–Burma Trough Intensity Index−0.203 **−0.253 ***−0.229 ***−0.165 **
Arctic Oscillation, AO−0.027 −0.016 −0.017 −0.032
Antarctic Oscillation, AAO0.007 −0.033 −0.019 0.028
North Atlantic Oscillation, NAO0.002 −0.013 0.000 0.007
Pacific/ North American Pattern, PNA0.094 0.056 0.075 0.106
East Atlantic Pattern, EA0.217 ***0.234 ***0.242 ***0.187 **
West Pacific Pattern, WP−0.108 −0.087 −0.107 −0.106
North Pacific Pattern, NP0.130 *0.120 0.132 *0.123
East Atlantic–West Russia Pattern, EA/WR−0.167 **−0.156 *−0.179 **−0.154 *
Tropical–Northern Hemisphere Pattern, TNH−0.251 ***−0.230 ***−0.253 ***−0.238 ***
Polar–Eurasia Pattern, POL0.066 0.112 0.091 0.039
Scandinavia Pattern, SCA−0.100 −0.126 *−0.108 −0.083
Pacific Transition Pattern, PT0.311 ***0.347 ***0.328 ***0.273 ***
30 hPa zonal wind Index−0.040 −0.075 −0.083 −0.009
50 hPa zonal wind Index−0.112 −0.158 *−0.162 *−0.071
Mid-Eastern Pacific 200 mb Zonal Wind Index−0.352 ***−0.350 ***−0.366 ***−0.323 ***
West Pacific 850 mb Trade Wind Index 0.111 0.096 0.110 0.107
Central Pacific 850 mb Trade Wind Index−0.110 −0.115 −0.118 −0.098
East Pacific 850 mb Trade Wind Index−0.051 −0.031 −0.049 −0.054
Atlantic–European Circulation W Pattern Index0.217 ***0.235 ***0.235 ***0.189 **
Atlantic–European Circulation C Pattern Index−0.204 **−0.225 ***−0.224 ***−0.175 **
Notes: *, **, and ***, denote the CC with p < 0.05, p < 0.01 and p < 0.001, respectively.
Table A2. Typhoon classification and extreme precipitation caused.
Start TimeEnd TimeExtreme Precipitation (mm)Track
2000/6/1 6:002000/6/1 12:000.002
2000/7/15 18:002000/7/17 0:00197.981
2000/7/19 0:002000/7/19 6:000.003
2000/9/8 12:002000/9/9 18:00184.992
2001/7/1 6:002001/7/2 6:00203.011
2001/7/25 12:002001/7/25 18:000.001
2001/8/9 18:002001/8/10 12:000.002
2001/8/28 18:002001/9/11 12:00937.603
2002/8/18 6:002002/8/19 12:00114.331
2002/9/14 6:002002/9/15 12:0030.651
2002/9/24 12:002002/9/27 0:00294.463
2002/9/27 12:002002/9/28 6:000.003
2003/7/21 0:002003/7/22 0:00147.983
2003/8/24 12:002003/8/25 12:00184.523
2003/11/17 12:002003/11/19 12:00210.653
2005/7/29 0:002005/7/30 18:00392.913
2005/9/17 18:002005/9/18 0:0049.442
2005/9/25 6:002005/9/26 18:00435.403
2006/6/28 0:002006/6/29 0:00108.621
2006/7/3 6:002006/7/4 0:00133.553
2006/8/3 6:002006/8/3 12:0021.471
2006/8/22 6:002006/8/24 18:000.001
2006/9/13 6:002006/9/13 18:000.001
2006/9/24 12:002006/9/25 0:0063.362
2006/11/13 18:002006/11/14 18:000.002
2006/12/13 6:002006/12/14 0:000.002
2007/7/3 12:002007/7/5 12:00196.833
2007/8/6 6:002007/8/7 6:000.002
2007/9/24 0:002007/9/25 6:00134.113
2007/10/2 0:002007/10/3 6:0078.922
2008/4/17 18:002008/4/19 0:000.001
2008/8/6 12:002008/8/7 6:00106.453
2008/9/29 12:002008/9/29 18:000.002
2008/10/3 0:002008/10/4 12:00214.921
2008/10/13 6:002008/10/14 18:00260.863
2009/7/11 18:002009/7/12 6:0059.243
2009/8/6 12:002009/8/9 6:00426.453
2009/9/10 18:002009/9/11 12:00117.023
2009/10/11 18:002009/10/14 0:00275.943
2009/10/19 6:002009/10/20 12:0043.722
2010/7/15 18:002010/7/17 6:0051.342
2010/7/21 12:002010/7/22 6:0058.461
2010/8/23 18:002010/8/24 0:007.682
2010/10/4 12:002010/10/10 6:00674.453
2011/6/22 18:002011/6/24 6:00189.083
2011/7/29 0:002011/7/30 0:00257.603
2011/10/3 18:002011/10/5 12:000.002
2011/11/8 0:002011/11/9 0:00142.302
2012/6/16 6:002012/6/18 0:00230.201
2012/8/17 0:002012/8/17 12:00152.553
2012/10/27 6:002012/10/28 0:00229.192
2012/10/29 0:002012/10/29 12:000.003
2013/6/22 0:002013/6/23 0:0073.553
2013/7/1 12:002013/7/2 0:0066.201
2013/8/2 0:002013/8/3 0:00138.103
2013/8/6 18:002013/8/7 6:000.002
2013/8/14 0:002013/8/14 6:0020.911
2013/9/29 12:002013/9/30 6:000.002
2013/11/4 0:002013/11/4 12:000.002
2013/11/10 6:002013/11/11 0:00120.603
2014/7/18 0:002014/7/18 18:00243.651
2014/9/7 12:002014/9/8 6:0026.801
2014/9/16 0:002014/9/16 12:00213.283
2015/6/21 12:002015/6/23 18:00413.863
2015/10/3 18:002015/10/4 6:0072.061
2016/5/27 0:002016/5/27 6:000.001
2016/7/26 6:002016/7/27 6:00133.023
2016/8/17 18:002016/8/19 0:00370.733
2016/10/12 18:002016/10/13 0:0038.162
2016/10/17 12:002016/10/19 6:00276.803
2017/7/15 0:002017/7/16 6:00156.102
2017/7/22 0:002017/7/25 6:0059.152
2017/9/14 12:002017/9/15 0:0076.332
2017/9/24 3:002017/9/25 0:00255.083
2017/10/9 12:002017/10/9 18:0045.702
2017/10/15 12:002017/10/16 6:00113.441
2017/11/12 6:002017/11/13 6:00265.962
2018/6/5 0:002018/6/7 12:00412.571
2018/7/17 15:002018/7/18 6:0097.433
2018/7/21 21:002018/7/23 21:00315.963
2018/8/9 0:002018/8/11 0:00581.261
2018/8/11 15:002018/8/12 15:00105.571
2018/8/14 21:002018/8/16 12:00178.043
2018/9/12 18:002018/9/13 12:00122.991
2019/7/2 6:002019/7/3 12:00294.383
2019/7/31 12:002019/8/2 18:00317.073
2019/8/29 0:002019/8/29 12:0095.442
2019/9/1 18:002019/9/2 12:00173.952
2019/9/3 12:002019/9/6 6:00224.512
2020/7/31 12:002020/8/1 12:0058.602
2020/10/13 0:002020/10/14 0:0080.713
2020/10/24 12:002020/10/25 12:00297.822
2020/11/14 18:002020/11/15 0:0020.402

References

  1. Knutson, T.; Camargo, S.J.; Chan, J.C.L.; Emanuel, K.; Ho, C.H.; Kossin, J.; Mohapatra, M.; Satoh, M.; Sugi, M.; Walsh, K.; et al. Tropical Cyclones and Climate Change Assessment: Part II: Projected Response to Anthropogenic Warming. Bull. Am. Meteorol. Soc. 2020, 101, E303–E322. [Google Scholar] [CrossRef]
  2. Shan, K.; Lin, Y.; Chu, P.; Yu, X.; Song, F. Seasonal advance of intense tropical cyclones in a warming climate. Nature 2023, 623, 83–89. [Google Scholar] [CrossRef] [PubMed]
  3. Lianshou, C.; Zhiyong, M.; Chunhua, C. An overview on the research of typhoon rainfall distribution. J. Mar. Meteorol. 2017, 37, 1–7. [Google Scholar]
  4. Lianshou, C.; Yinglong, X. Review of Typhoon Very Heavy Rainfall in China. Meteorol. Environ. Sci. 2017, 40, 3–10. [Google Scholar]
  5. Du, X.; Chen, H.; Li, Q.; Ge, X. Urban Impact on Landfalling Tropical Cyclone Precipitation: A Numerical Study of Typhoon Rumbia (2018). Adv. Atmos. Sci. 2023, 40, 988–1004. [Google Scholar] [CrossRef]
  6. Zhang, W.; Villarini, G.; Vecchi, G.A.; Smith, J.A. Urbanization exacerbated the rainfall and flooding caused by hurricane Harvey in Houston. Nature 2018, 563, 384–388. [Google Scholar] [CrossRef] [PubMed]
  7. Meng, C.; Xu, W.; Qiao, Y.; Liao, X.; Qin, L. Quantitative Risk Assessment of Population Affected by Tropical Cyclones Through Joint Consideration of Extreme Precipitation and Strong Wind—A Case Study of Hainan Province. Earth’s Future 2021, 9, e2021EF002365. [Google Scholar] [CrossRef]
  8. Dake, C. Global intensification of weak tropical cyclones in the past 30 years. Sci. Sin. 2024, 54, 659–660. [Google Scholar]
  9. Yongmei, W.; Fumin, R.; Weijing, L.; Wang, X.L. Climatic characteristics of typhoon precipitation over China. J. Trop. Meteorol. 2008, 14, 233–238. [Google Scholar]
  10. Zhang, Q.; Lai, Y.; Gu, X.; Shi, P.; Singh, V.P. Tropical Cyclonic Rainfall in China: Changing Properties, Seasonality, and Causes. J. Geophys. Res. Atmos. 2018, 123, 4476–4489. [Google Scholar] [CrossRef]
  11. Gori, A.; Lin, N.; Xi, D.; Emanuel, K. Tropical cyclone climatology change greatly exacerbates US extreme rainfall-surge hazard. Nat. Clim. Change 2022, 12, 171–178. [Google Scholar] [CrossRef]
  12. Wu, Y.; Wu, S.; Zhai, P. The impact of tropical cyclones on Hainan Island’s extreme and total precipitation. Int. J. Climatol. 2007, 27, 1059–1064. [Google Scholar] [CrossRef]
  13. Lu, G.; Wang, W.; Zheng, M.; Cai, Q.B. Spatial and temporal distribution characteristics of typhoon precipitation in Hainan. Trans. Atmos. Sci. 2015, 38, 710–715. [Google Scholar]
  14. Jiang, X.; Ren, F.; Li, Y.; Qiu, W.; Ma, Z.; Cai, Q. Characteristics and Preliminary Causes of Tropical Cyclone Extreme Rainfall Events over Hainan Island. Adv. Atmos. Sci. 2018, 5, 580–591. [Google Scholar] [CrossRef]
  15. Chu, P.; Chen, D.; Lin, P. Trends in precipitation extremes during the typhoon season in Taiwan over the last 60 years. Atmos. Sci. Lett. 2014, 15, 37–43. [Google Scholar] [CrossRef]
  16. Yu, C.; Hu, D.; Di, Y.; Wang, Y. Performance evaluation of IMERG precipitation products during typhoon Lekima (2019). J. Hydrol. 2021, 597, 126307. [Google Scholar] [CrossRef]
  17. Rios Gaona, M.F.; Villarini, G. Characterization of the diurnal cycle of maximum rainfall in tropical cyclones. J. Hydrol. 2018, 564, 997–1007. [Google Scholar] [CrossRef]
  18. Yan, Z.; Renyong, Y.; Shouchang, C.; Cai, Q. Observation and Simulation of Effect of Terrain on Rainstorm Amplification in Typhoon Haiyan. Meteorol. Sci. Technol. 2018, 46, 1147–1153. [Google Scholar]
  19. Yang, R.Y.; Min, J.Z.; Feng, W. Numerical simulations of the hainan island topographicefects on the rainfall of west-going typhoons. J. Trop. Meteorol. 2013, 29, 474–480. [Google Scholar]
  20. Yu, Z.; Wang, Y.; Xu, H.; Davidson, N.; Chen, Y.; Chen, Y.; Yu, H. On the Relationship between Intensity and Rainfall Distribution in Tropical Cyclones Making Landfall over China. J. Appl. Meteorol. Clim. 2017, 56, 2883–2901. [Google Scholar] [CrossRef]
  21. Lai, Y.; Li, J.; Gu, X.; Chen, Y.D.; Kong, D.; Gan, T.Y.; Liu, M.; Li, Q.; Wu, G. Greater flood risks in response to slowdown of tropical cyclones over the coast of China. Proc. Natl. Acad. Sci. USA 2020, 117, 14751–14755. [Google Scholar] [CrossRef] [PubMed]
  22. Li, X.; Han, G.; Yang, J.; Wang, C. Remote Sensing Analysis of Typhoon-Induced Storm Surges and Sea Surface Cooling in Chinese Coastal Waters. Remote Sens. 2023, 15, 1844. [Google Scholar] [CrossRef]
  23. Kawase, H.; Yamaguchi, M.; Imada, Y.; Hayashi, S.; Murata, A.; Nakaegawa, T.; Miyasaka, T.; Takayabu, I. Enhancement of Extremely Heavy Precipitation Induced by Typhoon Hagibis (2019) due to Historical Warming. Sola 2021, 17A, 7–13. [Google Scholar] [CrossRef]
  24. Zhou, L.; Gao, S.; Jia, J.; Yang, Y.; Tong, C.; Wang, A. Paleo-Typhoon Events as Indicated by Coral Reef Boulder Deposits on the Southern Coast of Hainan Island, China. Front. Mar. Sci. 2021, 8, 746773. [Google Scholar] [CrossRef]
  25. Chou, J.; Dong, W.; Tu, G.; Xu, Y. Spatiotemporal distribution of landing tropical cyclones and disaster impact analysis in coastal China during 1990–2016. Phys. Chem. Earth Parts A/B/C 2020, 115, 102830. [Google Scholar] [CrossRef]
  26. Xu, M.; Tan, Y.; Li, S.; Shang, M.; Shi, C.; Bai, L. Characterisation of Multi-Scale Spatial and Temporal Distribution of Typhoon Precipitation on Hainan Island Based on Remotely Sensed Precipitation Data. Chin. J. Trop. Agric. 2025, 45. accepted in press. [Google Scholar]
  27. Fisher, R.A.; Tippett, L.H.C. Limiting forms of the frequency distribution of the largest or smallest member of a sample. Math. Proc. Camb. 1928, 24, 180–190. [Google Scholar] [CrossRef]
  28. Jenkinson, A.F. The frequency distribution of the annual maximum (or minimum) values of meteorological elements. Q. J. R. Meteor. Soc. 1955, 81, 158–171. [Google Scholar] [CrossRef]
  29. Ohlson, J.A.; Kim, S. Linear valuation without OLS: The Theil-Sen estimation approach. Res. Account Stud. 2015, 20, 395–435. [Google Scholar] [CrossRef]
  30. Chen, Y.; Duan, Z. Impact of ENSO on typhoon wind hazard in the coast of southeast China. Nat. Hazards 2018, 92, 1717–1731. [Google Scholar] [CrossRef]
  31. Chu, P.; Zhang, H.; Chang, H.; Chen, T.L.; Tofte, K. Trends in return levels of 24-hr precipitation extremes during the typhoon season in Taiwan. Int. J. Climatol. 2018, 38, 5107–5124. [Google Scholar] [CrossRef]
  32. Liu, L.; Wang, Y. Trends in Landfalling Tropical Cyclone–Induced Precipitation over China. J. Clim. 2020, 33, 2223–2235. [Google Scholar] [CrossRef]
  33. Zhang, P.; Ren, G.; Qin, Y.; Zhai, Y.; Zhai, T.; Tysa, S.K.; Xue, X.; Yang, G.; Sun, X. Urbanization Effects on Estimates of Global Trends in Mean and Extreme Air Temperature. J. Clim. 2021, 34, 1923–1945. [Google Scholar] [CrossRef]
  34. Su, J.; Ren, G.; Zhang, Y.; Yang, G.; Xue, X.; Lee, R. Changes in extreme rainfall over mainland China induced by landfalling tropical cyclones. Environ. Res. Commun. 2022, 4, 101004. [Google Scholar] [CrossRef]
  35. Zhao, N.; Hong, J.; Lau, K.H. Impact of supply chain digitalization on supply chain resilience and performance: A multi-mediation model. Int. J. Prod. Econ. 2023, 259, 108817. [Google Scholar] [CrossRef] [PubMed]
  36. Duan, L.; Chen, L. Diagnostic Analysis and Numerical Study of Torrential Rain Associated with the Tropical Storm Fitow (0114). Chin. J. Atmos. Sci. 2005, 29, 343–353. [Google Scholar] [CrossRef]
  37. Liu, H.; Huang, X.; Fei, J.; Zhang, C.; Cheng, X. Characteristics and Preliminary Causes of Extremely Persistent Heavy Rainfall Generated by Landfalling Tropical Cyclones Over China. Earth Space Sci. 2022, 9, e2022EA002238. [Google Scholar] [CrossRef]
  38. Hatsuzuka, D.; Sato, T. Impact of SST on Present and Future Extreme Precipitation in Hokkaido Investigated Considering Weather Patterns. J. Geophys. Res. Atmos. 2022, 127, e2021JD036120. [Google Scholar] [CrossRef]
  39. Fujibe, F. Relationship between Interannual Variations of Extreme Hourly Precipitation and Air/Sea-Surface Temperature in Japan. Sola 2015, 11, 5–9. [Google Scholar] [CrossRef]
Figure 1. (a) Topographic map of Hainan Island and spatial distribution of meteorological stations; (b) multi-year average TIP.
Atmosphere 15 00891 g001
Figure 3. Spatial patterns of clustered typhoon tracks over Hainan Island.
Atmosphere 15 00891 g003
Figure 4. Number of typhoons affecting Hainan Island from 1950 to 2020. Notes: The dashed trend line is derived from Theil–Sen regression after three-point average smoothing. Dotted lines represent segmented regression after breakpoint detection, which is used to analyze the trend changes in different periods.
Atmosphere 15 00891 g004
Figure 5. Frequency of extreme precipitation events distinguished with the 95th (a) and 99th (b) percentile threshold, respectively.
Atmosphere 15 00891 g005
Figure 6. Typhoon-induced extreme precipitation in three sub-regions of Hainan Island: Analysis using 1-hour precipitation thresholds at the 95th (a) and 99th (b) percentiles.
Atmosphere 15 00891 g006
Figure 7. Temporal evolution of the ratio between typhoon-induced extreme precipitation (TIEP) and total typhoon rainfall, based on 1-h 95th (a) and 99th (b) percentile thresholds.
Atmosphere 15 00891 g007
Figure 8. Intra-day temporal pattern of extreme precipitation based on 1-h data with 95th percentile (a) and 99th percentile (b) thresholds.
Atmosphere 15 00891 g008
Figure 9. The maximum hourly precipitation and maximum daily precipitation in different typhoon tracks. Notes: The subplots of (ac) are the maximum hourly precipitation in the typhoon Tracks 1–3, respectively, while the subplots of (df) show the maximum daily precipitation in the typhoon Tracks 1–3, respectively.
Atmosphere 15 00891 g009
Figure 10. Spatial distribution of typhoon-induced extreme precipitation (TIEP) at a threshold of the 95th percentile.
Atmosphere 15 00891 g010
Figure 11. Spatial distribution of TIEP at a threshold of the 99th percentile.
Atmosphere 15 00891 g011
Figure 12. Temporal pattern of typhoon contribution to extreme precipitation for different tracks.
Atmosphere 15 00891 g012
Figure 13. TIEP in different return periods and different temporal scales.
Atmosphere 15 00891 g013
Figure 14. Spatial distribution of correlations between extreme precipitation and SST in the western, central, and eastern regions, respectively. Notes: (1) Subplots of (ac) show the correlation coefficients between extreme precipitation and SST in the western, central and eastern regions, respectively. (2) The black lines in the left diagram represent the representative paths of the three typhoon paths.
Atmosphere 15 00891 g014
Figure 15. Comparisons between the TIEP and Northern Hemisphere Polar Vortex Area Index (a), Pacific Subtropical High Ridge Position Index (b), and Niño 1 + 2 SST Index (c).
Atmosphere 15 00891 g015
Table 1. Correlation coefficients between the TIEP and typhoon features in different sub-regions with different typhoon track paths.
RegionTrackAir PressureWind SpeedDuration
All RegionsTrack 10.246−0.3270.589 **
Track 2−0.0520.1340.292
Track 3−0.1900.2570.850 ***
Western RegionTrack 10.202−0.2350.530 **
Track 20.0240.031−0.036
Track 3−0.320 *0.369 *0.674 ***
Central RegionTrack 10.263−0.2790.539 **
Track 2−0.1170.1430.101
Track 3−0.2870.336 *0.691 ***
Eastern RegionTrack 10.272−0.3580.575 **
Track 20.0920.0220.305
Track 3−0.0640.1090.612 ***
Notes: *, **, and ***, denote the CC with p < 0.05, p < 0.01 and p < 0.001, respectively.
Table 2. Correlation relationships between extreme precipitation and atmospheric circulation indices and SST indices.
IndexAll RegionsWestern RegionCentral RegionEastern Region
Asia Polar Vortex Area Index−0.240 **−0.314 **−0.284 **−0.185 *
Pacific Polar Vortex Area Index−0.311 **−0.373 **−0.358 **−0.252 **
North American Polar Vortex Area Index−0.306 **−0.362 **−0.344 **−0.255 **
Northern Hemisphere Polar Vortex Area Index−0.320 **−0.385 **−0.368 **−0.260 **
Asia Polar Vortex Intensity Index−0.287 **−0.351 **−0.327 **−0.232 **
Pacific Polar Vortex Intensity Index−0.228 **−0.303 **−0.277 **−0.172 *
Northern Hemisphere Polar Vortex Intensity Index−0.266 **−0.331 **−0.308 **−0.212 **
Pacific Subtropical High Ridge Position Index0.487 **0.484 **0.506 **0.446 **
Northern Hemisphere Subtropical High Northern Boundary Position Index0.420 **0.438 **0.446 **0.375 **
North African Subtropical High Northern Boundary Position Index0.362 **0.387 **0.386 **0.320 **
Mid-Eastern Pacific 200 mb Zonal Wind Index−0.352 **−0.350 **−0.366 **−0.323 **
Niño 1 + 2 SST−0.406 **−0.340 **−0.398 **−0.398 **
Niño 3 SST−0.274 **−0.191 *−0.252 **−0.286 **
Niño 4 SST0.0640.1170.0950.033
Niño 3.4 SST−0.107−0.026−0.076−0.134
Notes: *, and **, denote the CC with p < 0.01 and p < 0.001, respectively.
Disclaimer/Publisher’s Note: The statements, opinions and data contained in all publications are solely those of the individual author(s) and contributor(s) and not of MDPI and/or the editor(s). MDPI and/or the editor(s) disclaim responsibility for any injury to people or property resulting from any ideas, methods, instructions or products referred to in the content.

