Article

Analysis of Extreme Cold Events of December 2022 and January 2024 in the United States

1
College of Mathematics and Physics, Qingdao University of Science and Technology, Qingdao 266061, China
2
Research Institute for Mathematics and Interdisciplinary Sciences, Qingdao University of Science and Technology, Qingdao 266061, China
3
Qingdao Innovation Center of Artificial Intelligence Ocean Technology, Qingdao 266061, China
4
The First Institute of Oceanography, Ministry of Natural Resources, Qingdao 266061, China
*
Author to whom correspondence should be addressed.
Atmosphere 2024, 15(8), 893; https://doi.org/10.3390/atmos15080893 (registering DOI)
Submission received: 6 June 2024 / Revised: 10 July 2024 / Accepted: 11 July 2024 / Published: 26 July 2024
(This article belongs to the Special Issue Climate Change on Ocean Dynamics (2nd Edition))

Abstract

:
In December 2022, the United States (US) experienced an extreme cold event. Its duration was 5 days, and it ranked third in intensity (−9.16 °C) during the period from 1979 to 2022. During the Early Stage (12–16 December), the surface air temperature (SAT) anomaly peaked at 2.98 °C. In the Development Stage (17–21 December), cold air moved towards North America (NA). This event reached its peak during the Outbreak Stage (22–26 December), with a minimum SAT anomaly of −9.16 °C. Concurrently, high pressure occurred in Alaska and the Archipelago region, while low-pressure centers occurred in the US. The U-component of wind (U-wind) was in a negative anomaly in the northern part of NA. The negative anomaly of the V-component of wind (V-wind) moved southward. These atmospheric structural changes facilitated the southward movement of cold air from the Arctic to NA. Furthermore, a positive (negative) U-wind anomaly was observed to obstruct (promote) the southward progression of cold air to NA. A linear regression analysis indicated that a negative Arctic Oscillation (AO) correlated with the accumulation of cold air in the Arctic, while a positive Arctic High led to the transport of cold air to NA. In an empirical orthogonal function (EOF) analysis, EOF1 (16.3%) was characterized by a warm Arctic and cold northern part of NA pattern, reflecting the cold air from the Arctic region moving southward into NA, while EOF2 (14.4%) depicted a cold Arctic and cold NA pattern, characterizing the outbreak of cold events in the US. In January 2024, the US experienced another extreme cold event. Its maximum intensity was −9.50 °C, and its duration was 8 days. The course of the two cold events was very similar.

1. Introduction

An extreme cold event refers to a climatic extreme that typically occurs during winter, characterized by a sudden and significant decrease in temperature accompanied by strong winds, heavy rainfall, and snowfall [1,2]. It has significant impacts on human transportation, production, life, and supply transportation, and in severe cases, it might even threaten human life and safety [3,4,5]. The occurrence of extreme weather events is related to human activities [6]. Since 1990, the rate of Arctic warming has increased [7], a phenomenon known as Arctic amplification, where the rate of warming in the Arctic has exceeded the global average. In this scenario, the temperature difference between the Arctic region and other regions has become smaller and smaller [8,9,10]. In the past 50 years, winter temperatures in the United States (US) have generally trended upward [6]. However, since 2005, due to changes in temperature in the Arctic and mid-latitude regions of the Northern Hemisphere, temperatures in the US have started to decrease, leading to an increase in extreme cold events [6,7,10,11,12]. In the winter of 1989, the US experienced a severely impactful cold event [13]. As the 21st century has progressed, both the US and other continents in the Northern Hemisphere have increasingly suffered from frequent cold events. In January 2008, unusually frequent and persistent snowstorms affected China [14]. In late January 2012, an intense cold anomaly covered almost all of Europe, Mongolia, and northeastern China, lasting for about three weeks [15]. In January 2016, a historic snowstorm struck the northern and eastern US [16]. In the mid-2020/2021 period, East Asia and North America (NA) experienced three significant extreme cold events successively [17]. In December 2022, the US faced a severe cold event, and a similar experience recurred in January 2024.
Previous studies suggested that extreme cold events were directly related to atmospheric circulation patterns [6,14,16,18]. Cui and Qiao (2016) analyzed the strong snowfall in NA in January 2015, and their results indicated that abnormal conditions in the Northern Hemisphere atmospheric circulation favored the intrusion of polar cold air into NA in January 2015. When the southward-moving polar cold air encountered warm and moist air, it created conditions conducive to the formation of harsh winters and heavy snow in NA [16]. Wu et al. (2006) demonstrated that the Arctic Oscillation (AO) index in December had a strong impact on December temperature variations in NA. In years when the AO was in a negative phase and the NA temperature was a negative anomaly, the negative phase of the AO could also cause the Arctic high-pressure system to strengthen [19,20]. Regarding the extreme cold events across NA and Eurasia in 2022, their occurrence was closely related to the formation of Alaska blocking and Ural blocking [6]. In summary, the atmospheric circulation evolution accompanying each extreme cold event varied. Therefore, focusing on the extreme cold event that occurred in the US in December 2022, this study investigates its causes and the influence of the AO on it. Furthermore, it compares this event with the extreme cold event in January 2024, analyzing their similarities and differences.
In this study, we introduce the data and methods in Section 2. An analysis of the extreme cold event in December 2022 and a discussion of the cold event in January 2024 are in Section 3. Conclusions and discussion are in Section 5.

2. Data and Methods

2.1. Data

This study uses the NCEP/NCAR 2.5° × 2.5° daily reanalysis dataset, which includes temperature, geopotential height (GH), the U-component of wind (U-wind), and the V-component of wind (V-wind) parameters, covering the period from 1979 to 2024 [21,22]. The height scale of GH, U-wind, and V-wind is 500 hPa. We use the 1000 hPa temperature as a proxy for surface air temperature (SAT) in our analysis. The GH used in this study is determined by dividing geopotential by gravitational acceleration (g = 9.8 m/s). In our wind analysis, positive values of U-wind denote westerly wind, while negative values indicate easterly wind. Similarly, positive values of V-wind signify northerly wind, while negative values represent southerly wind. The AO index used in this study is derived from the time series provided by GCOS-AOPC/OOPC [23].

2.2. Definition of Extreme Cold Events

Zhang et al. (2023a) defined an extreme cold event in northeastern China in their research as follows: they concatenated the daily air temperature on day i and the nearest four days (from day i − 2 to day i + 2) during 1961–2018 on each grid point, and they selected the fifth percentile of the obtained data as the threshold of an extreme cold event on day i for this grid point [24,25]. This method defined a cold event as lasting for at least three days and also avoided mutual influences between cold events, providing a better description of a cold event occurrence. The current study draws inspiration from this method for defining cold events in the US. However, due to the different geographical regions and climate variations between the US and Northeast China, there should be some changes in the criteria for defining cold spell events.
The definition of an extreme cold event is that within a continuous timeframe, it begins on the date when the SAT anomaly falls below its 10th percentile and ends on the day immediately following the date when the SAT anomaly last fell below its 10th percentile for December, between 1979 and 2022. (First, we calculated the SAT anomaly from December 1979 to December 2022, then took the 10th percentile of this anomaly sequence as the threshold for evaluation. The threshold for the cold event in December 2022 was −5.11 °C, while in January 2024, the threshold for cold event was −6.20 °C.) We divided the time span of our study into three stages: the Early Stage (12–16 December), the Development Stage (17–21 December), and the Outbreak Stage (22–26 December). An extreme cold event occurs during the Outbreak Stage. Additionally, two indicators of extreme cold events are defined: the maximum intensity (the lowest SAT anomaly within the event) and the duration (the ending date minus the beginning date then plus 1).

2.3. Linear Regression

This study uses a linear regression analysis to calculate the contribution of the AO index to the SAT anomaly in December 2022. The results of the linear regression analysis quantify the impact of the index on the SAT [26]. The regression equation is defined as Y = a + b x + ε , where ε ~ N 0 , σ 2 ( Y represents temperature, x represents the autumn AO index, and a , b , and σ 2 are unknown parameters independent of x ).
Applying the least squares method, the deviations are minimized.
s = Σ n ( y i a b x i ) 2
By setting the partial derivatives of s to 0, we obtain the following:
s a = 2 Σ = 1 n ( y i a b x i ) = 0 s b = 2 Σ = 1 n ( y i a b x i ) x i = 0
b ^ = x y ¯ x ¯ y ¯ m 2 a ^ = x 2 ¯ · y ¯ x y ¯ · x ¯ m x 2
thereinto
m x 2 = 1 n Σ n ( x i x ¯ ) 2 = x 2 ¯ x ¯ 2

2.4. Empirical Orthogonal Function (EOF) Analysis

The algorithm for EOF decomposition is as follows:
(1) Selected data are processed into an anomaly. The result is matrix X m × n .
(2) The cross product of the matrix X and its transpose is computed, resulting in matrix C m × n .
C m × n = 1 n X × X T
(3) The eigenvalues ( λ 1 ,…, λ m ) and eigenvectors V m × m of the cross product are calculated. They satisfy the following conditions:
C m × m × V m × m = V m × m × E m × m
thereinto
E = λ 1 0       0 0 λ 2 0 0   0 λ m
The eigenvalues are arranged in descending order: λ 1 > λ 2 > > λ m . Each non-zero eigenvalue corresponds to a column of eigenvector values, also known as EOF. The eigenvector values corresponding to λ 1 are the first EOF mode, which is the first column of V .
(4) The principal components are computed by projecting the EOF onto the original matrix. This provides the time coefficients corresponding to all spatial eigenvectors.
P C m × n = V m × m T × X m × n
(5) The contribution rates are calculated. The magnitude of the variance of matrix X can be represented by the eigenvalues. Higher λ values indicate more important modes and greater contribution to the total variance. The explained variance ratio of the k -th mode is calculated as follows:
λ k i 1 m λ i × 100 %
In this process, the spatial patterns are expressed as functions of space, while the temporal patterns are represented by the PC values. We used the SAT anomaly data in December from 1979 to 2022. This dataset allows us to extract spatial modes and their corresponding time series [27]. We take the first two leading modes of the EOF.

3. Results

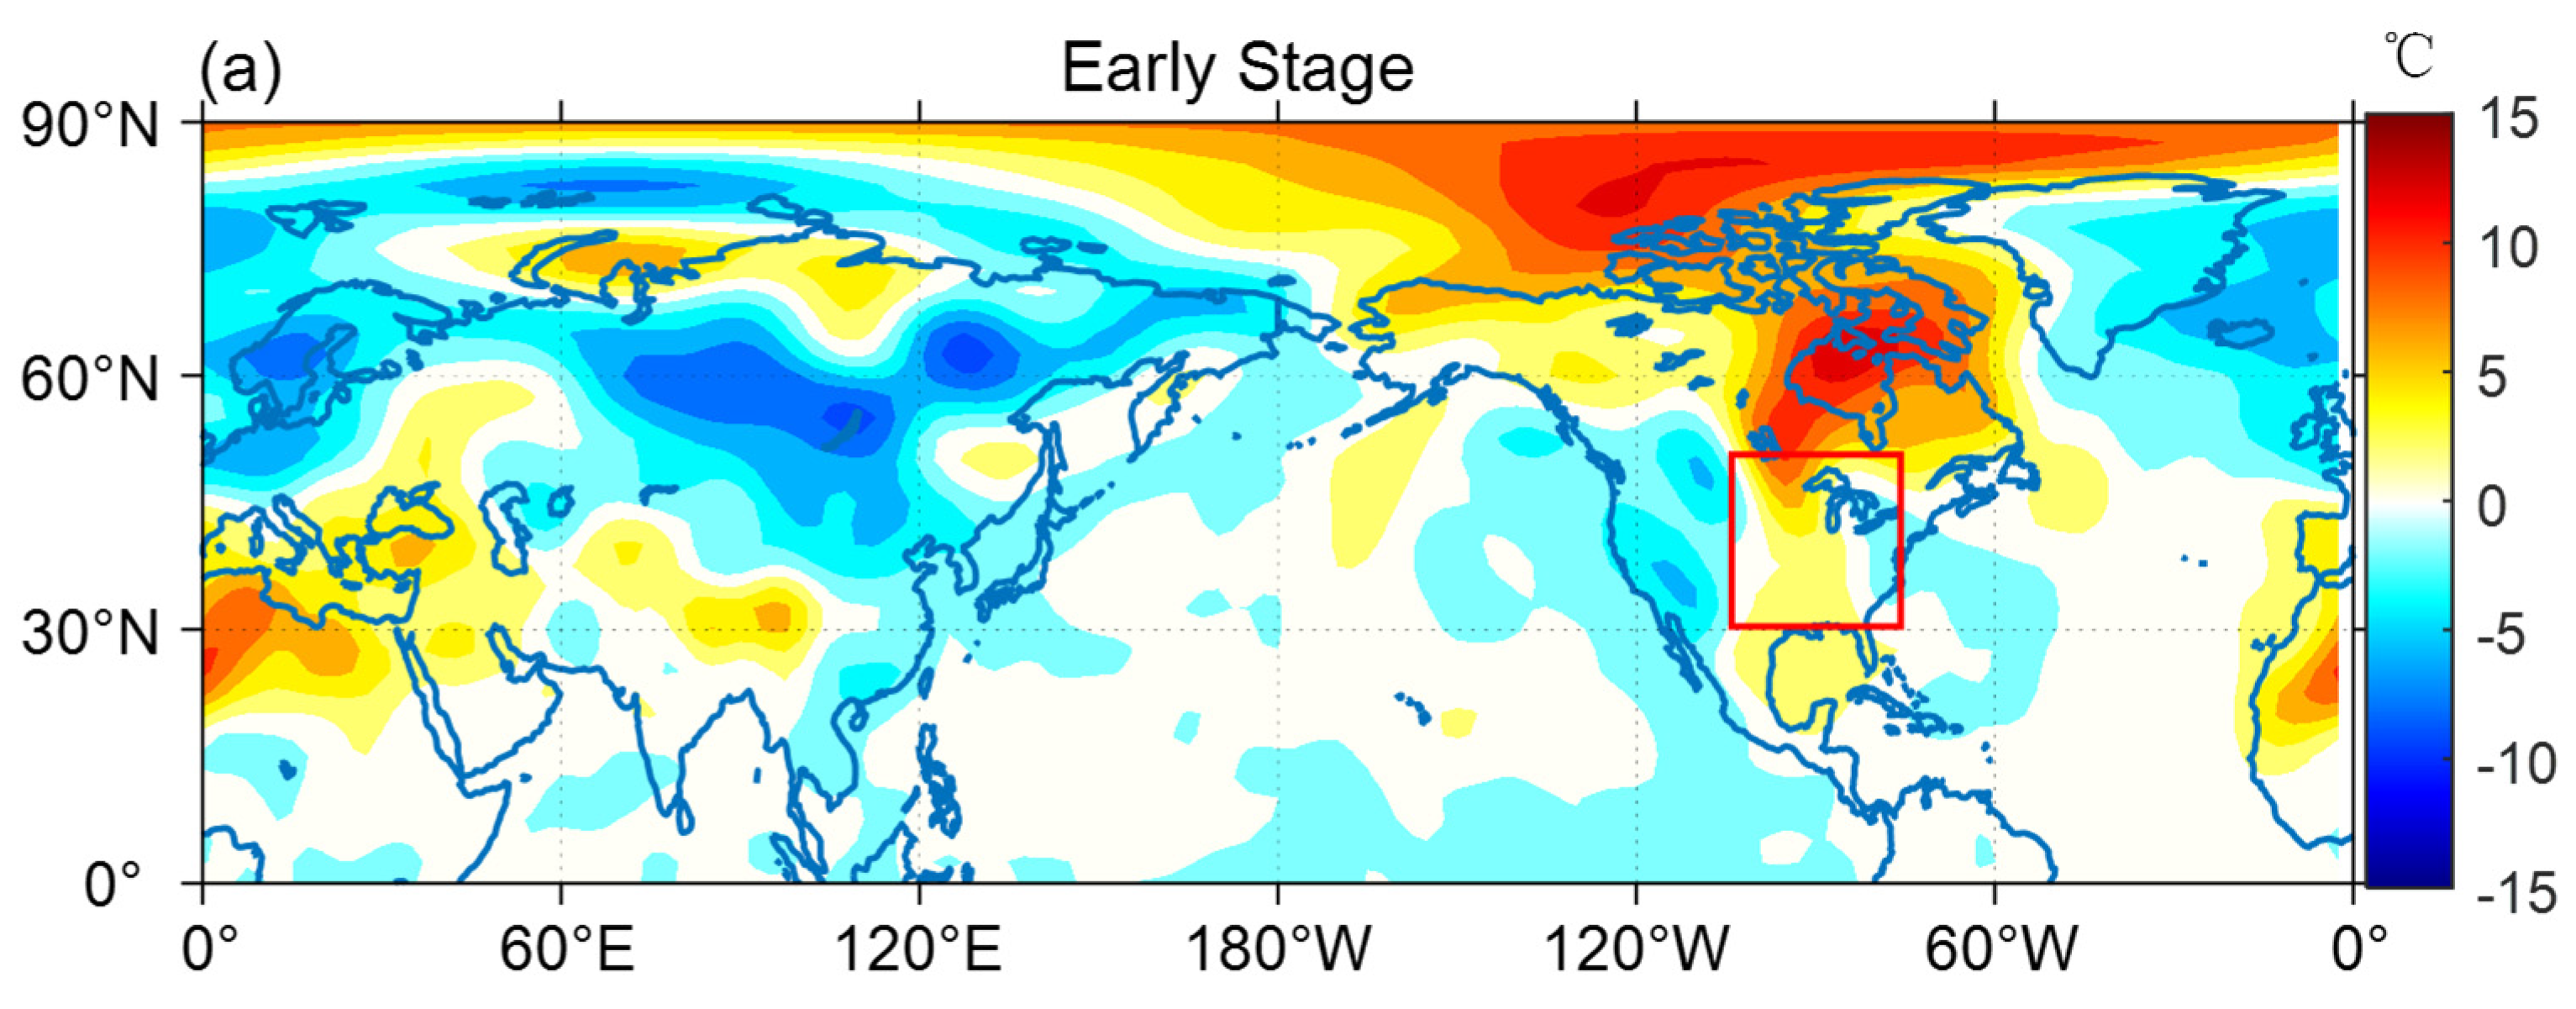
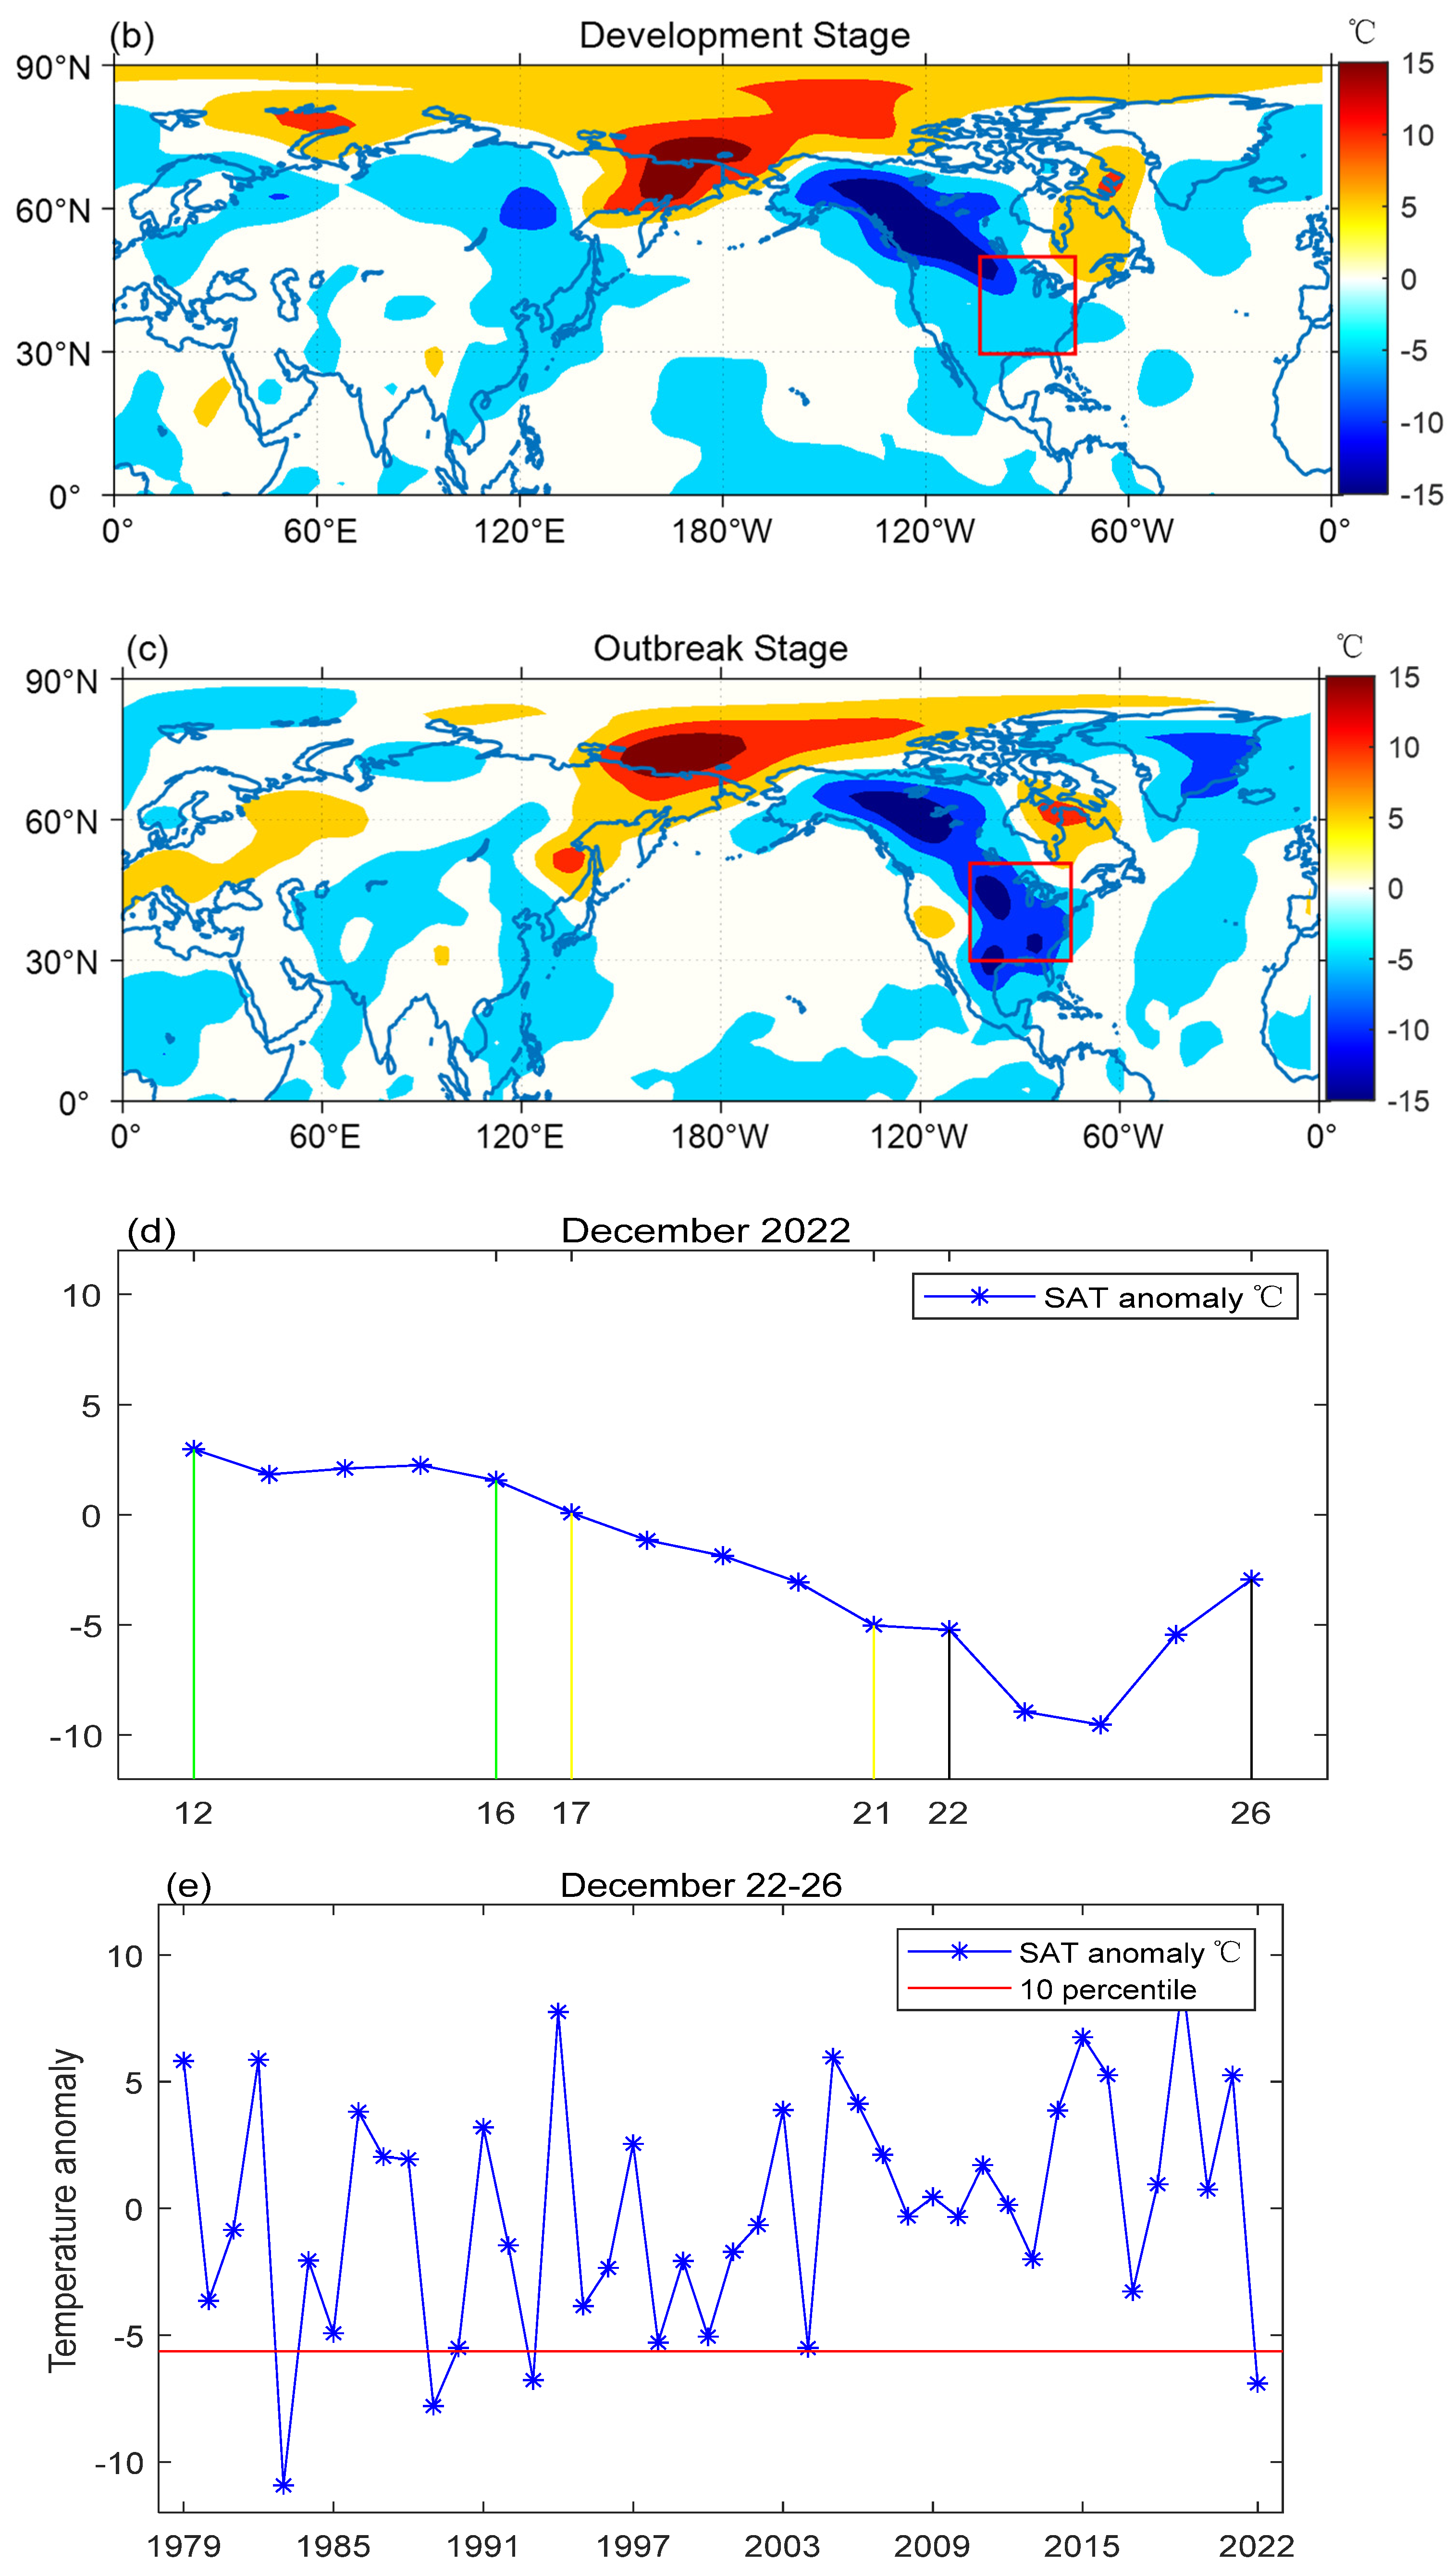
3.1. The Manifestation of the Extreme Cold Event in NA of December 2022

The distribution of the temperature anomaly in the Northern Hemisphere is shown in Figure 1a–c. It is clear that in the Early Stage, the US (75° W–105° W, 30° N–50° N, the red boxes in Figure 1a–c) had not yet been affected by cold air and was generally warming up (Figure 1a). In the Development Stage, extreme cooling had already occurred in the Canadian region (Figure 1b), while extreme cooling in the US was concentrated in the Outbreak Stage (Figure 1c). It could be inferred that the origin of the cold event was located in the northern part of NA, with cold air moving southward, passing through Canada before further infiltrating the US. However, during the same time stage, other continents in the Northern Hemisphere, such as Asia and Europe, did not experience such extreme cooling.
Figure 1d shows the SAT anomaly in the US from 12 to 26 December. In the Early Stage, it shows a warming trend compared to previous years. The arrival of the cold event caused a sharp drop in temperature in the US, with the minimum SAT anomaly reaching −9.16 °C on the 24th, and the duration was 5 days.
Figure 1e shows that the cold event occurred on 22–26 December 2022, with the strongest cooling magnitude after 1990. Only in 1983 and 1989 were there cooling magnitudes greater than this cold event.

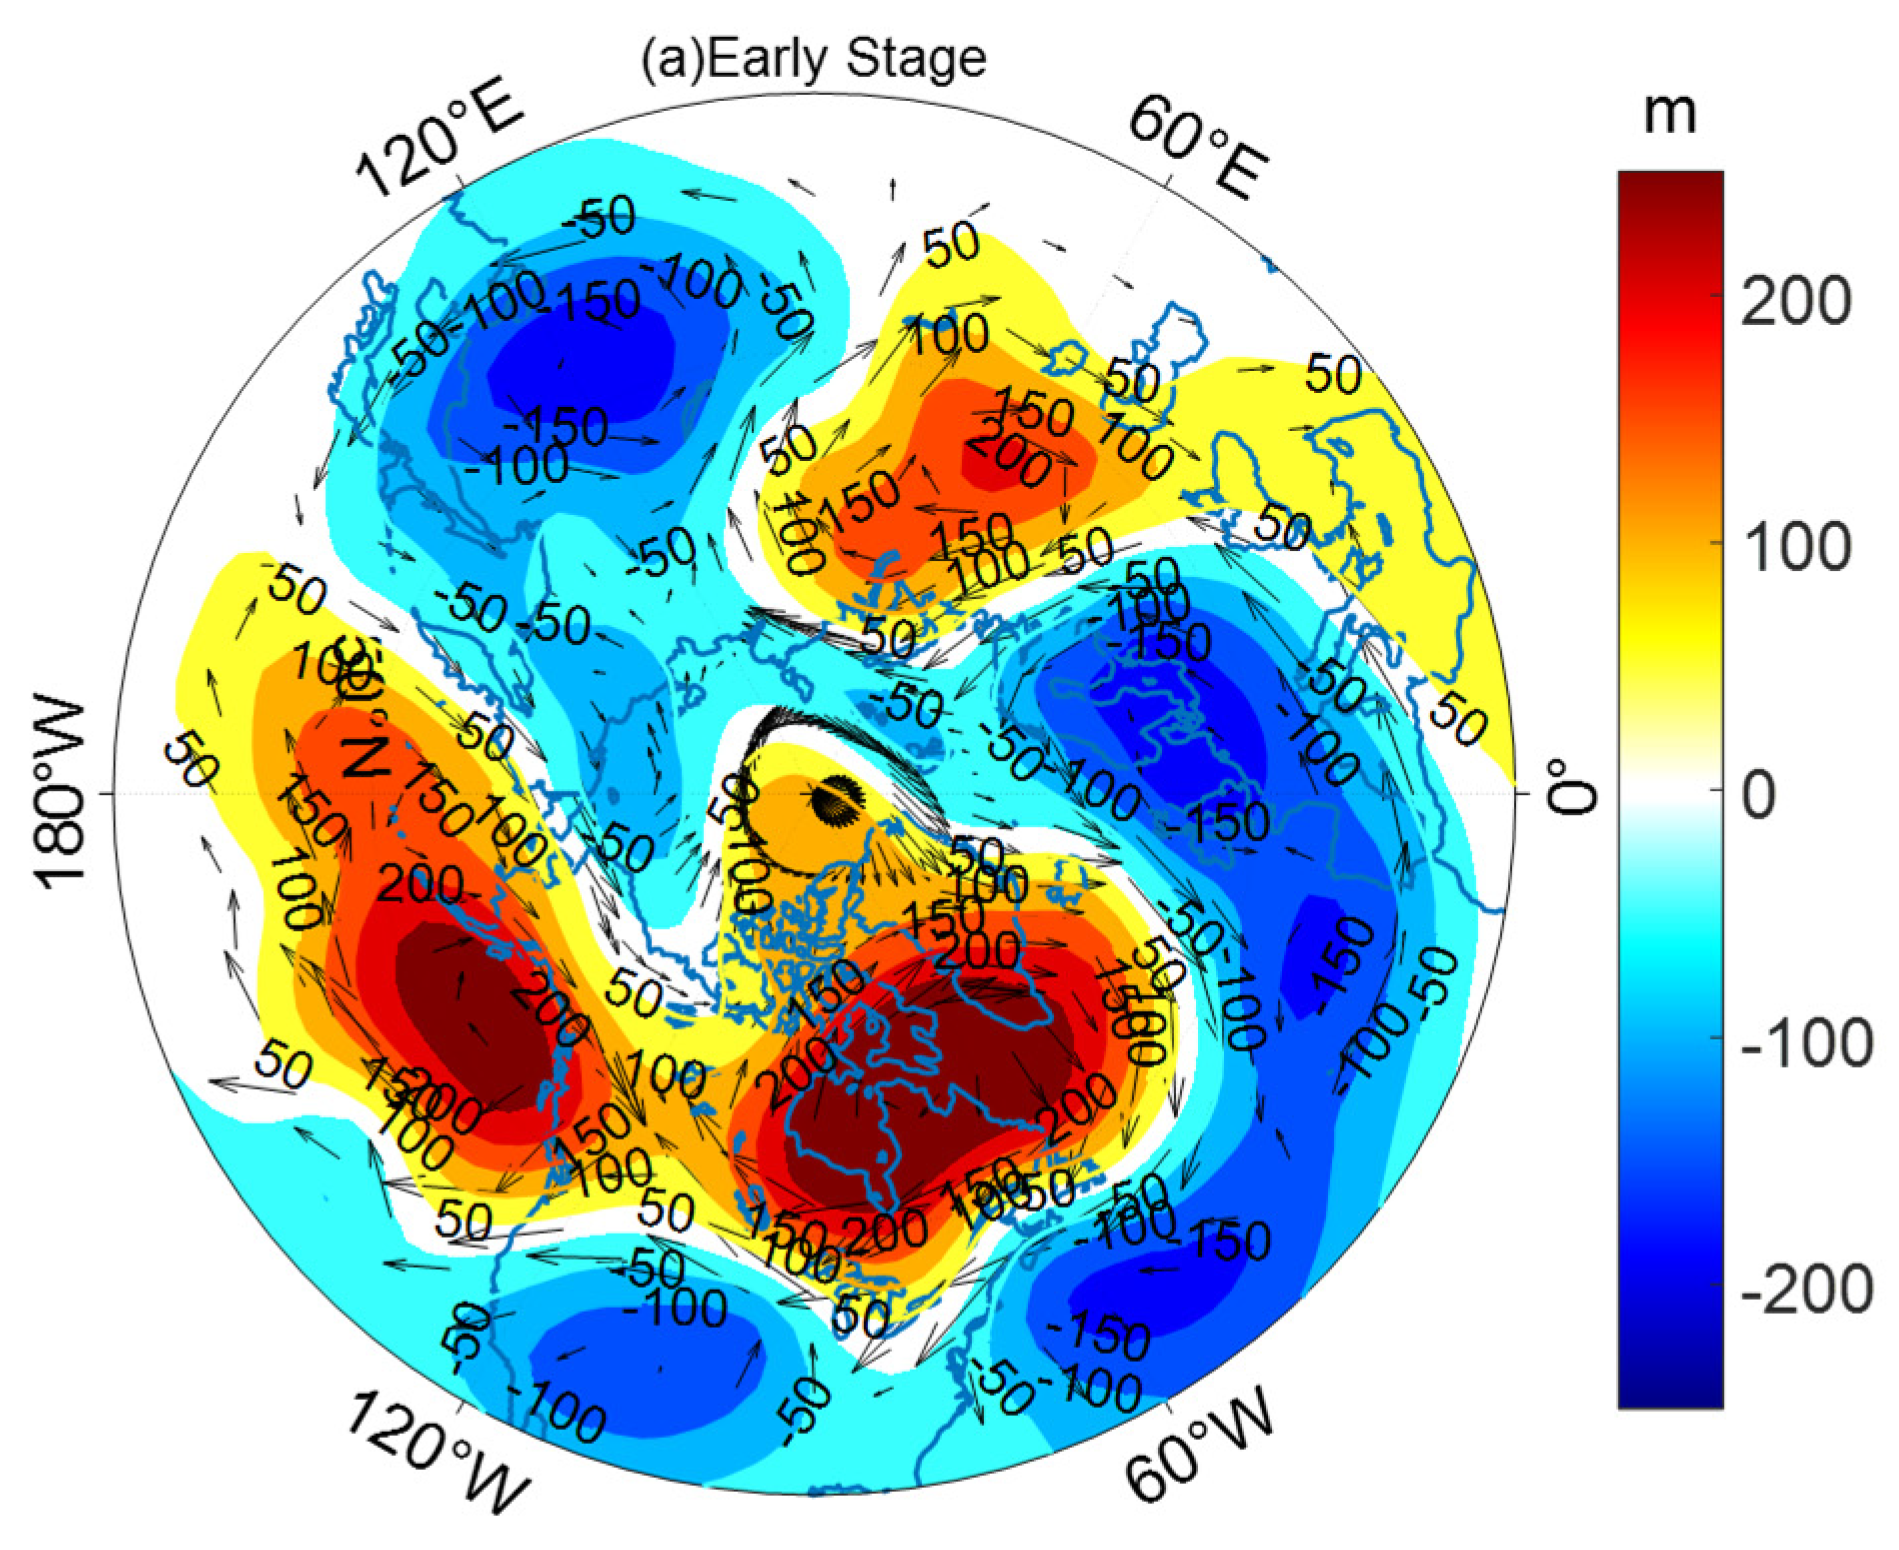
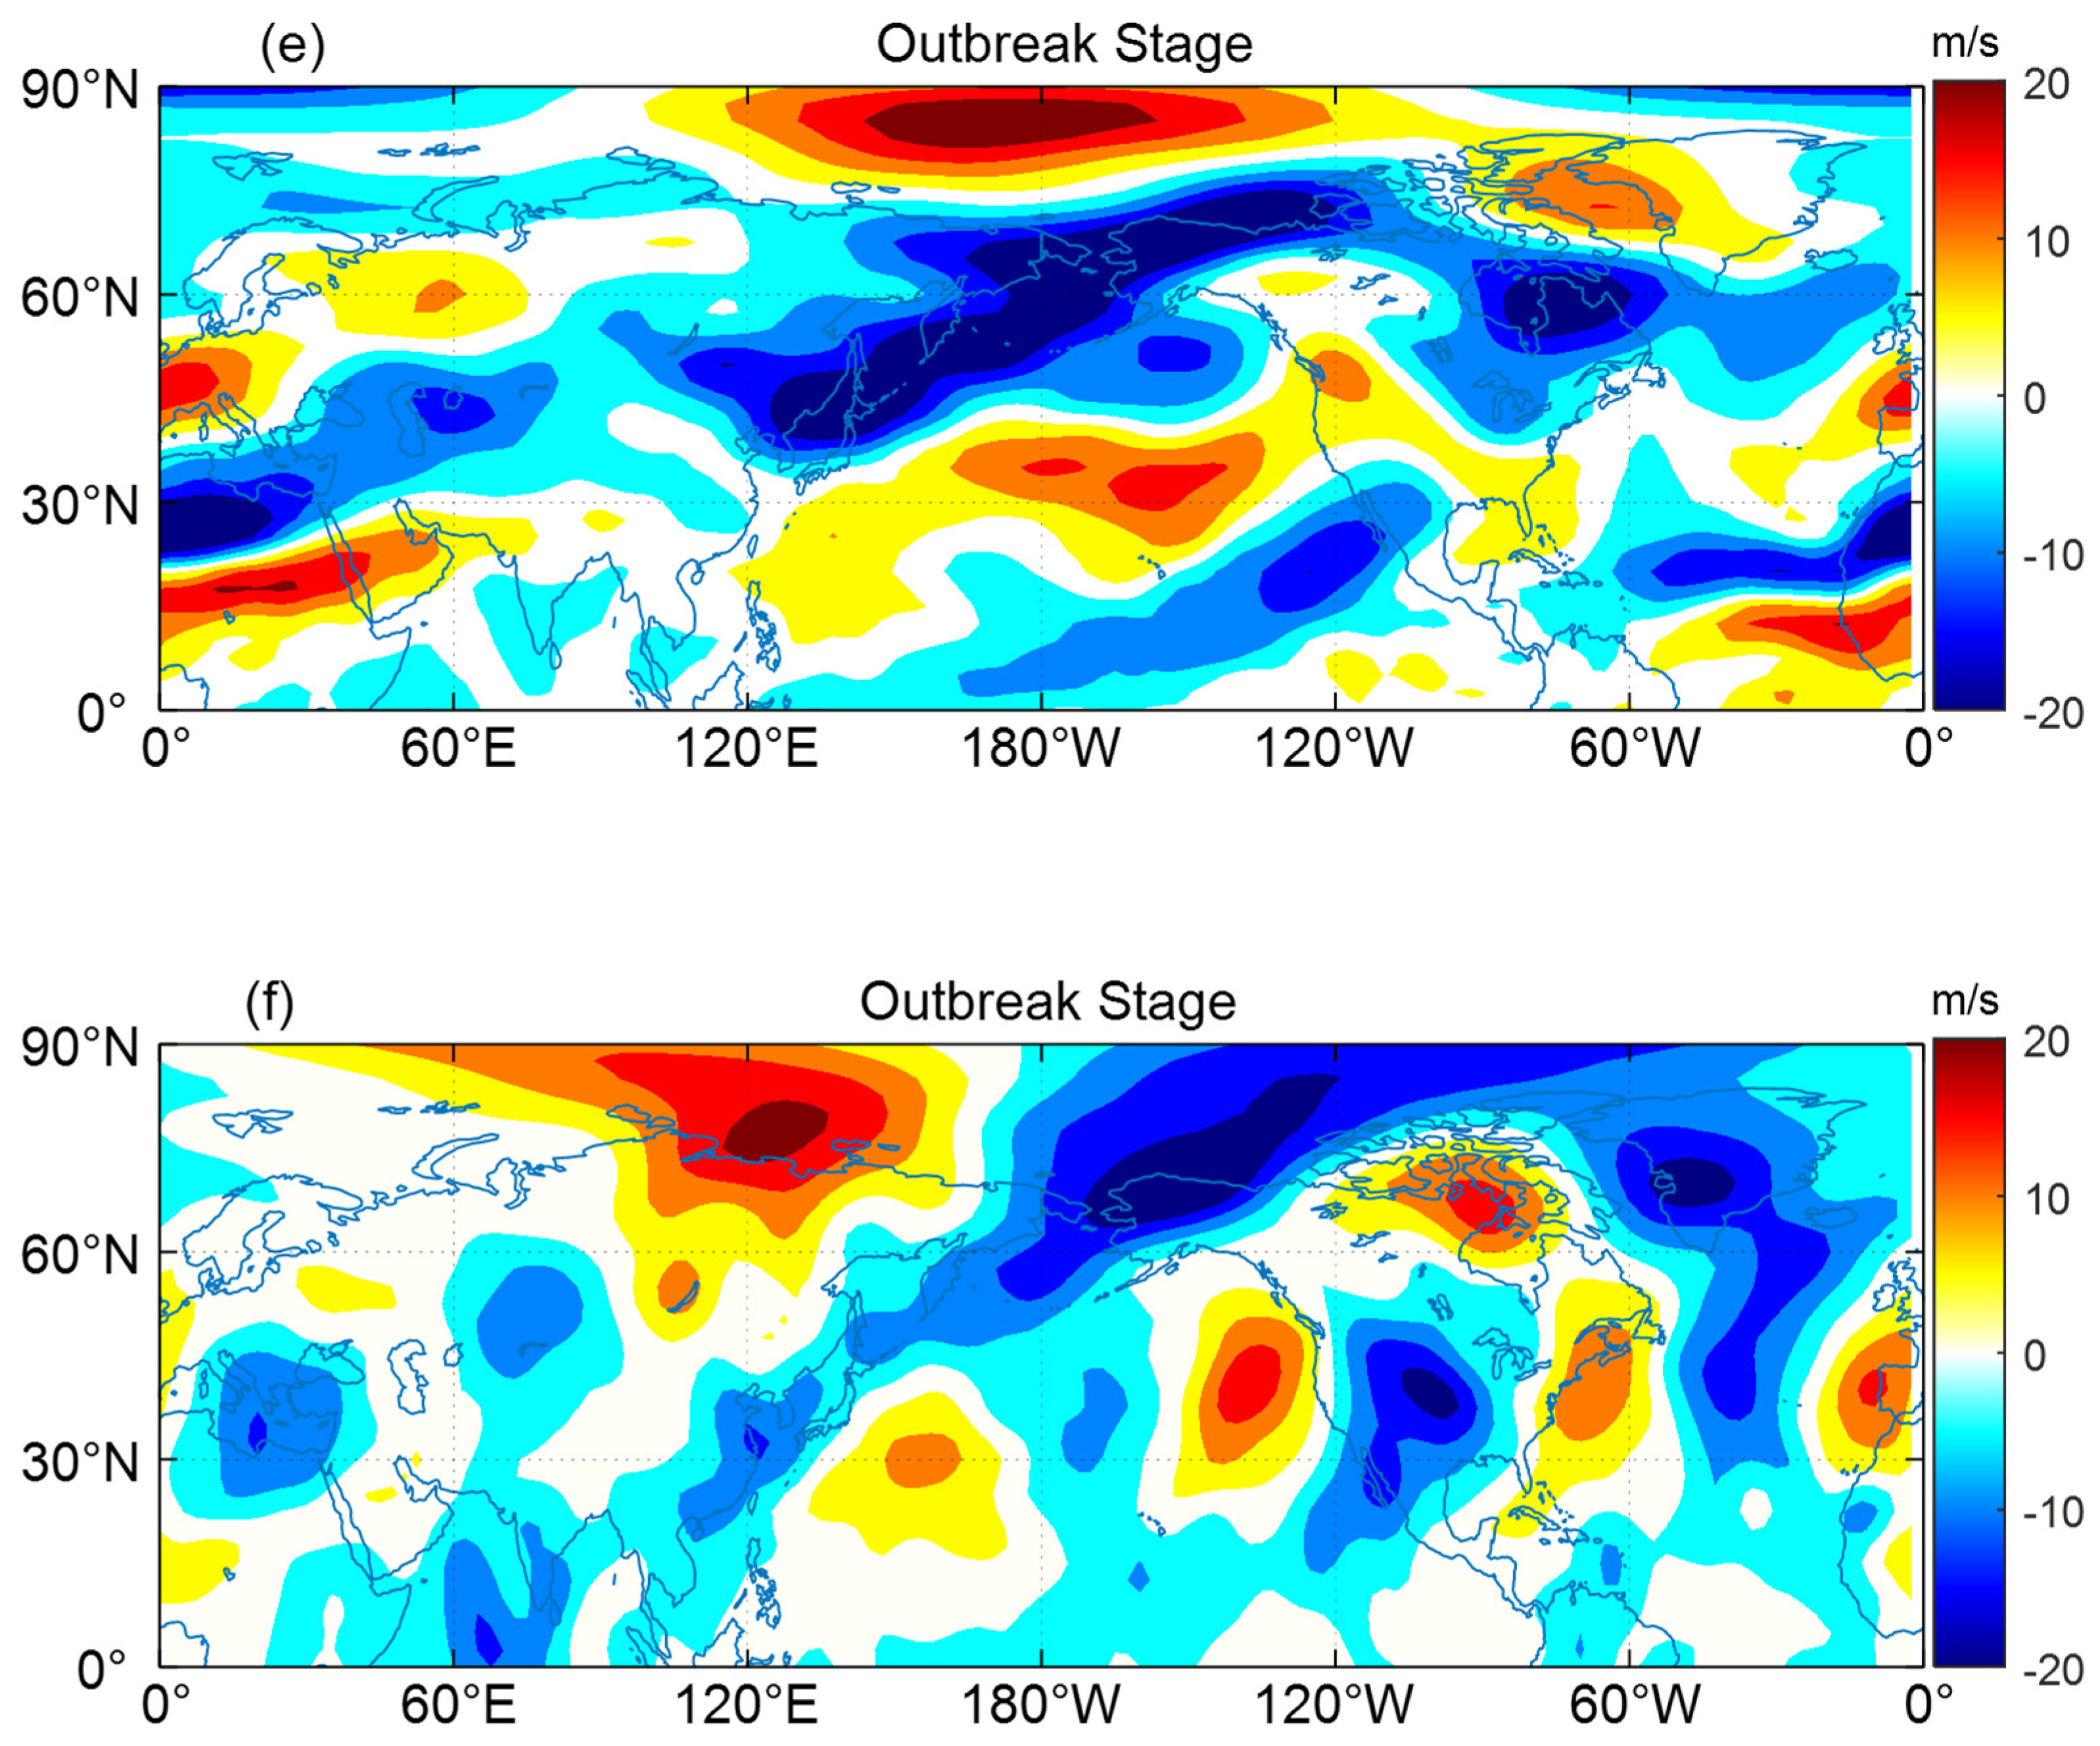
3.2. The Anomaly of Atmosphere Circulation for This Extreme Cold Event

To study the evolution of this extreme cold event, further analysis was conducted on the anomaly regarding GH, wind fields, U-wind, and V-wind. In the Early Stage, a high-pressure system existed over the Canadian Arctic Archipelago (the maximum anomaly reached 399.45 m), while another high-pressure system was present to the south of Alaska (the maximum anomaly reached 309.01 m). This pressure distribution facilitated the southward escape of Arctic cold air (Figure 2a). In the Development Stage, the high-pressure system over the Archipelago remained dominant, while the high-pressure system over Alaska shifted northward (the maximum anomaly reached 437.44 m), allowing cold air to move southward into Canada (Figure 2b). As a low-pressure center developed over the US (the minimum anomaly reached −170.01 m), cold air successfully entered the country, leading to the outbreak of this extreme cold event (Figure 2c). However, due to the barrier formed by the Rocky Mountains, the impact on the western US was relatively minor (Figure 1c).
In the Early Stage, the U-wind in the northern part of NA (60° N–70° N) exhibited a positive anomaly, while the U-wind in central NA (40° N–50° N) showed a negative anomaly (Figure 3a). Throughout NA, the V-wind was mainly a positive anomaly (Figure 3b). In this situation, cold air moving southward from the Arctic was blocked in Alaska and the northern part of NA. During the Development Stage, the positive anomaly of the U-wind in the northern part of NA (60° N–70° N) weakened and gradually transitioned to the negative anomaly (the minimum anomaly reached −18.32 m/s) (Figure 3c), while the V-wind in Alaska and the US began to show a negative anomaly (Figure 3d). In the Outbreak Stage, both the U-wind in the northern part of NA (60° N–70° N) (the minimum anomaly reached −21.18 m/s) and the V-wind in the US (the minimum anomaly reached −17.26 m/s) showed a negative anomaly, leading to an extreme cold event (Figure 3e,f). Throughout the evolution of the three stages, there was a weakening trend in both the U-wind in the northern part of NA (60° N–70° N) and the V-wind in the US, creating conditions for the southward movement of cold air. Eventually, the cold air entered NA, passing through Canada to reach the US.

3.3. The Impact of AO on This Extreme Cold Event

This study employed a regression analysis to investigate the relationship between the AO index and temperature in the US (Figure 4). The December AO index (Figure 4b) and temperature from 17 to 26 December for the years 1979–2022 were selected for the regression analysis. In Figure 4a, it can be seen that there was a positive correlation between the AO index in December and temperature from 17 to 26 December in the US. Moreover, the results for most areas were significant, with confidence levels exceeding 90%. This indicated that when the AO index entered a negative phase, it led to the formation of high-pressure systems in the Arctic region and low-pressure systems at mid-latitudes. Consequently, cold air moved southward from the Arctic into the NA region, causing the temperature in the US to decrease [18,19].
We used an EOF analysis to examine the long-term spatial variability of the SAT anomaly from 1979 to December 2022, and the results are shown in Figure 5. In EOF1 (16.3%), positive values were concentrated in the Arctic region, while negative values were concentrated in Canada (Figure 5a). PC1 showed an increasing trend (Figure 5c). This pattern corresponded with the process of cold air intrusion into NA and was similar to the results of the regression analysis multiplied by −1, indicating that the spatial distribution of EOF1 was primarily contributed by the AO. In EOF2 (14.4%), positive values appeared in Alaska and the Archipelago region, while negative values appeared in the Arctic and in NA, including the US (Figure 5b). In this mode, an extreme cold event occurred in the US [17]. Figure 5c shows the time series of these two modes.

3.4. The Outbreak Stage of Cold Event in January 2024

In January 2024, the US experienced another extreme cold event, which lasted from 14 to 21 January, with the lowest SAT anomaly at −9.50 °C (Figure 6a). This study compared this cold wave with the one that occurred in December 2022 through a simple analysis of the SAT (Figure 6b), GH (Figure 6c), wind fields, U-wind (Figure 6d), and V-wind (Figure 6e). During the outbreak of the cold event in January 2024 in the US, the northern parts of NA, including the Islands and Alaska, were under high-pressure conditions, with maximum anomaly values of 310.49 m and 389.30 m, respectively. Conversely, the US experienced low-pressure conditions, with a minimum anomaly value of −151.35 m. Similarly, the U-wind anomaly over the northern part of NA was negative, reaching a minimum of −18.21 m/s. However, the V-wind anomaly over the US, though negative, reached a minimum of only −5.27 m/s.

4. Discussion

By comparing the outcomes of the two cold events, it becomes evident that both events occurred within the same atmospheric circulation pattern (Table 1). In both cases, there were high-pressure systems over the Islands and Alaska, while the US was under the influence of a low-pressure system. This setup allowed cold air to move southward. The negative anomaly in the U-wind over the northern part of NA prevented it from blocking the southward movement of cold air, ultimately leading to the outbreak of the cold events. In the US, severe cooling occurred during both events, with temperature dropping significantly compared to other continents in the Northern Hemisphere during the same periods. However, during the second event, the V-wind over the US was weaker compared to the first event. This weakening could likely be attributed to the influence of other atmospheric oscillations or factors.
Previous studies have shown that the North Atlantic Oscillation, the Arctic Oscillation, the Pacific–North America pattern, the Pacific Decadal Oscillation, and the El Niño-Southern Oscillation have strong influences on extreme climate events in winter in NA or the Northern Hemisphere [16,25,28]. In recent years, extreme cold events have increasingly occurred on other continents in the Northern Hemisphere. In January 2021 and January 2024, eastern China experienced extreme cold events [25,28,29,30]. The lowest temperature anomaly reached −8.93 °C and −7.86 °C, respectively. Li et al. (2024) studied these cold events in China and mentioned that during the Outbreak Stage, there were high-pressure systems over the Urals and Okhotsk regions in northern East Asia, and the westerly wind over Siberia also weakened [28]. This pattern is very similar to the presence of high-pressure systems over Alaska and the Islands, along with a weakened U-wind over the northern part of NA [6], confirming that the occurrence of these cold events is due to abnormal atmospheric circulation patterns. During cold events in East Asia, the North Atlantic Oscillation and the Pacific Decadal Oscillation play significant roles. However, in the two cold events studied here, the AO is the dominant factor. Lin et al. (2024) emphasized the amplification effect of the Arctic and the impact of reduced sea ice on this phenomenon. The melting sea ice allowed the Arctic to absorb more solar radiation, reducing the temperature difference between the Arctic and the equator. This led to more frequent negative phases of Arctic Oscillations, where cold air was more easily transported southward under these conditions. This also indirectly proved that the AO is one of the important causes triggering abnormal atmospheric circulation patterns [6,30]. In terms of other oscillatory factors, Zhang et al. (2023b) elaborated on the influences of the North Atlantic Oscillation and the Western Pacific teleconnection. It has been demonstrated that the North Atlantic Oscillation and the Western Pacific teleconnection formed different GHs, and the GH acted to block and push airflow by affecting the air pressure, then caused the temperature to be different from the north and south of East Asia [25]. Zhong and Wu (2024), on the other hand, studied variations in the stratosphere.
Extreme cold events have brought enormous disasters to humanity. In December 2022, the cold event in the United States resulted in over ten thousand flights being canceled or delayed, icy roads, and blizzard conditions with near-zero visibility. It also led to power outages affecting more than 1.7 million residents and businesses, and at least 23 fatalities were reported due to this cold event [31]. The severe cold event in January 2024 in the United States caused enormous damage, with at least 92 deaths attributed to the cold weather. Over 200 million Americans were affected by heavy snow, freezing conditions, and a cold wave. Schools were closed in many areas, affecting over one million students [32]. Therefore, research into this is necessary to better prepare for future cold events.

5. Conclusions

This study investigated an extreme cold event that occurred in the US in December 2022, revealing its occurrence process. In the Early Stage, cold air could not penetrate NA, resulting in a positive SAT anomaly in the US. In the Development Stage, cold air entered NA, causing a significant drop in temperature in Canada, and the SAT anomaly in the US decreased to −5.02 °C. In the Outbreak Stage, cold air fully entered the US, with the SAT anomaly reaching a minimum of 9.16 °C. The event lasted for 5 days, setting a record since the 21st century began. In the analysis of atmospheric circulation, the GH anomaly manifested as high pressure over the Archipelago region and Alaska, with low pressure over the central and eastern parts of NA (with the low-pressure center located in the US). This structure favored the southward movement of cold air congregating in the Arctic. The U-wind in the northern part of NA showed a positive anomaly in the Early Stage, transitioning to a negative anomaly in the Development and Outbreak Stages, promoting the southward movement of cold air during this extreme cold event. Correspondingly, the V-wind in the US shifted from a positive anomaly in the Early Stage to a negative anomaly in the Development (weak) and Outbreak (strong) Stages.
A linear regression analysis examined the influence of the AO on this extreme cold event. The AO showed a positive correlation with the SAT anomaly in the US, indicating that a negative AO favored the outbreak of this extreme cold event. In the EOF analysis of the SAT anomaly, the distribution of EOF1 (16.3%) showed positive values over the Arctic and negative values over Canada, representing the southward movement of cold air into NA during the Development Stage. EOF2 (14.4%) depicted negative values over the Arctic and NA (including the US), indicating the entry of cold air into NA and the outbreak of the extreme cold event. Finally, this study compared the cold event that occurred in January 2024 with the one in December 2022, finding them to be very similar. However, during the outbreak of the January cold event, the V-wind in the US region was considerably weaker compared to the December cold event.
In the discussion of this extreme cold event, our study analyzed the roles of the atmosphere and the AO. However, the contribution of the ocean is uncertain, which could likely be the cause of the significant difference in the V-wind between the two extreme cold events. Therefore, it is necessary to further investigate the impact of ocean–atmosphere interactions on extreme cold events.

Author Contributions

Conceptualization, Y.S.; methodology, Y.S., B.C. and H.C.; software, Y.S. and B.C.; validation, Y.S. and Z.Z.; formal analysis, Y.S., B.C. and H.C.; resources, B.C.; data curation, Y.S.; writing—original draft preparation, Y.S.; writing—review and editing, Y.S., B.C. and H.C.; visualization, Y.S.; supervision, H.C. and C.X.; project administration, Z.Z., C.G. and X.S.; funding acquisition, Z.Z., C.G. and X.S. All authors have read and agreed to the published version of the manuscript.

Funding

This research is supported by the National Key Research and Development Program of China under contract No. 2022YFE0140500, the National Natural Science Foundation of China under Grant 41821004, the Laoshan Laboratory Science and Technology Innovation Project No. LSKJ202202104, the National Nature Science Foundation of China 42130406, the China-Shandong Joint Fund U1906215, the Open Fund of the Key Laboratory of Ocean Circulation and Waves, Chinese Academy of Sciences, under contract No. KLOCW2003, and the Project of Doctoral Fund of Qingdao University of Science and Technology under contract No. 12030430010550.

Institutional Review Board Statement

Not applicable.

Informed Consent Statement

Not applicable.

Data Availability Statement

The NCEP/NCAR 2.5° × 2.5° daily reanalysis dataset is from the NCEP-NCAR Reanalysis 1 website: https://psl.noaa.gov/data/gridded/data.ncep.reanalysis.html (accessed on 9 July 2023). The time series of the AO index is from the website https://psl.noaa.gov/gcos_wgsp/Timeseries/AO/ (accessed on 20 September 2023).

Conflicts of Interest

The authors declare no conflicts of interest.

References

  1. Hansen, B.B.; Isaksen, K.; Benestad, R.E.; Kohler, J.; Pedersen, Å.Ø.; Loe, L.E.; Coulson, S.J.; Larsen, J.O.; Varpe, Ø. Warmer and wetter winters: Characteristics and implications of an extreme weather event in the High Arctic. Environ. Res. Lett. 2014, 9, 114021. [Google Scholar] [CrossRef]
  2. Mingxin, L.; Yan, L.; Chunyan, L. Analysis of the characteristics and atmospheric circulation causes of two types of extreme cold events in winter in China. Plateau Meteorol 2021, 40, 603–620. (In Chinese) [Google Scholar]
  3. Smith, E.T.; Sheridan, S.C. The influence of extreme cold events on mortality in the United States. Sci. Total Environ. 2019, 647, 342–351. [Google Scholar] [CrossRef] [PubMed]
  4. Qi, Q.; Jiang, B.; Ma, W.; Marley, G. Trend analysis and spatial distribution of meteorological disaster losses in China, 2004–2015. Atmosphere 2022, 13, 208. [Google Scholar] [CrossRef]
  5. Meng, F.; Huang, H.; Guo, J.; Ren, G.; Zhang, J. Spatio-Temporal Characteristics of Extreme Cold Events and Their Impacts on Population and Economy in Tianjin Binhai New Area, China. Pol. J. Environ. Stud. 2023, 32, 2775–2785. [Google Scholar] [CrossRef]
  6. Yao, Y.; Zhuo, W.; Gong, Z.; Luo, B.; Luo, D.; Zheng, F.; Zhong, L.; Huang, F.; Ma, S.; Zhu, C. Extreme cold events in north America and Eurasia in November-December 2022: A potential vorticity gradient perspective. Adv. Atmos. Sci. 2023, 40, 953–962. [Google Scholar] [CrossRef]
  7. Cohen, J.; Screen, J.A.; Furtado, J.C.; Barlow, M.; Whittleston, D.; Coumou, D.; Francis, J.; Dethloff, K.; Entekhabi, D.; Overland, J.; et al. Recent Arctic amplification and extreme mid-latitude weather. Nat. Geosci. 2014, 7, 627–637. [Google Scholar] [CrossRef]
  8. Serreze, M.C.; Barry, R.G. Processes and impacts of Arctic amplification: A research synthesis. Glob. Planet. Change 2011, 77, 85–96. [Google Scholar] [CrossRef]
  9. Previdi, M.; Smith, K.L.; Polvani, L.M. Arctic amplification of climate change: A review of underlying mechanisms. Environ. Res. Lett. 2021, 16, 093003. [Google Scholar] [CrossRef]
  10. Vose, R.S.; Easterling, D.R.; Kunkel, K.E.; LeGrande, A.N.; Wehner, M.F.; Temperature Changes in the United States. Climate Science Special Report: Fourth National Climate Assessment 1(GSFC-E-DAA-TN49028) 2017. Available online: https://ntrs.nasa.gov/citations/20180001314 (accessed on 1 January 2024).
  11. Fall, S.; Diffenbaugh, N.S.; Niyogi, D.; Pielke Sr, R.A.; Rochon, G. Temperature and equivalent temperature over the United States (1979–2005). Int. J. Climatol. 2010, 30, 2045–2054. [Google Scholar] [CrossRef]
  12. Smith, I.A.; Fabian, M.P.; Hutyra, L.R. Urban green space and albedo impacts on surface temperature across seven United States cities. Sci. Total Environ. 2023, 857, 159663. [Google Scholar] [CrossRef]
  13. Marengo, J.; Espinoza, J.C.; Bettolli, L.; Cunha, A.P.; Molina-Carpio, J.; Skansi, M.; Correa, K.; Ramos, A.M.; Salinas, R.; Sierra, J.-P. A cold wave of winter 2021 in central South America: Characteristics and impacts. Clim. Dyn. 2023, 61, 2599–2621. [Google Scholar] [CrossRef] [PubMed]
  14. Wen, M.; Yang, S.; Kumar, A.; Zhang, P. An analysis of the large-scale climate anomalies associated with the snowstorms affecting China in January 2008. Mon. Weather Rev. 2009, 137, 1111–1131. [Google Scholar] [CrossRef]
  15. Lan, X.; Chen, W. Strong cold weather event over eurasia during the winter of 2011–2012 and downward AO signal from the stratosphere. In Взаимoдействие Пoлей и Излучения с Веществoм; 2013; pp. 68–69. Available online: https://www.elibrary.ru/item.asp?id=26670779 (accessed on 14 September 2023).
  16. Cui, H.Y.; Qiao, F.L. Analysis of the extremely cold and heavy snowfall in North America in January 2015. Atmos. Ocean. Sci. Lett. 2016, 9, 75–82. [Google Scholar] [CrossRef]
  17. Zhang, Z.; Cui, H.; Chen, B.; Cai, H.; Li, P. Effect of the Blocking High-East Asian Trough on three Extreme Cold Events in Eastern Asia. Adv. Atmos. Sci. 2023, 0029, R2. [Google Scholar]
  18. Wu, A.; Hsieh, W.W.; Shabbar, A.; Boer, G.J.; Zwiers, F.W. The nonlinear association between the Arctic Oscillation and North American winter climate. Clim. Dyn. 2006, 26, 865–879. [Google Scholar] [CrossRef]
  19. Wettstein, J.J.; Mearns, L.O. The influence of the North Atlantic–Arctic Oscillation on mean, variance, and extremes of temperature in the northeastern United States and Canada. J. Clim. 2002, 15, 3586–3600. [Google Scholar] [CrossRef]
  20. Overland, J.E.; Wang, M. The Arctic climate paradox: The recent decrease of the Arctic Oscillation. Geophys. Res. Lett. 2005, 32, 6. Available online: https://agupubs.onlinelibrary.wiley.com/doi/full/10.1029/2004GL021752 (accessed on 16 March 2024). [CrossRef]
  21. Kalnay, E.; Kanamitsu, M.; Kistler, R.; Collins, W.; Deaven, D.; Gandin, L.; Iredell, M.; Saha, S.; White, G.; Woollen, J.; et al. The NCEP/NCAR 40-year reanalysis project. In Renewable Energy; Routledge: London, UK, 2018; Volume 1, pp. 146–194. Available online: https://www.taylorfrancis.com/chapters/edit/10.4324/9781315793245-16/ncep-ncar-40-year-reanalysis-project-kalnay-kanamitsu-kistler-collins-deaven-gandin-iredell-saha-white-woollen-zhu-chelliah-ebisuzaki-higgins-janowiak-mo-ropelewski-wang-leetmaa-reynolds-roy-jenne-dennis-joseph (accessed on 9 July 2023).
  22. Leetmaa, A.; Reynolds, R.; Jenne, R.; Josepht, D. The NCEP/NCAR 40-year reanalysis project. Bull. Am. Meteor. Soc. 1996, 77, 437–471. [Google Scholar]
  23. Higgins, R.W.; Leetmaa, A.; Kousky, V.E. Relationships between climate variability and winter temperature extremes in the United States. J. Clim. 2002, 15, 1555–1572. [Google Scholar] [CrossRef]
  24. Zhang, J.; Yue, P.; Zhang, Q.; Wang, Z. Impact of tropospheric polar vortex on winter cold extremes over Northeast China. Atmos. Res. 2023, 294, 106942. [Google Scholar] [CrossRef]
  25. Zhang, Z.; Cui, H.; Chen, B.; Cai, H.; Li, P. The combined effects of North Atlantic Oscillation and Western Pacific teleconnection on winter temperature in Eastern Asia during 1980–2021. Acta Oceanol. Sin. 2023, 42, 1–9. [Google Scholar] [CrossRef]
  26. Shi, S.; Zhang, L.; Wang, G. Fractional non-linear regularity, potential and balayage. J. Geom. Anal. 2022, 32, 221. [Google Scholar] [CrossRef]
  27. Sun, J.; Kong, L.; Zhou, S. Gradient projection Newton algorithm for sparse collaborative learning using synthetic and real datasets of applications. J. Comput. Appl. Math. 2023, 422, 114872. [Google Scholar] [CrossRef]
  28. Li, X.; Cui, H.; Chen, B.; Zhang, Z.; Li, P. Causes and Mechanisms of Extreme Cold Wave Events in Eastern China in January 2021 and January 2024: A Discussion. Coast. Eng. 2024, 43, 116–128. [Google Scholar]
  29. Zhong, W.; Wu, Z. Impact of stratospheric variability on subseasonal temperature reversals during late winter over the mid-high latitudes of East Asia. Atmos. Res. 2024, 297, 107115. [Google Scholar] [CrossRef]
  30. Lin, X.; Wang, Y.; Song, L. Variation of temperature extremes in wintertime over Beijing-Tianjin-Hebei region in the era of sharp decline of Arctic sea ice. Atmos. Res. 2024, 297, 107113. [Google Scholar] [CrossRef]
  31. Available online: https://www.thepaper.cn/newsDetail_forward_21315295 (accessed on 31 December 2022).
  32. Available online: https://www.cenews.com.cn/news.html?aid=1110010 (accessed on 29 January 2024).
Figure 1. The anomaly of the surface air temperature (SAT) in the Early Stage (a), the anomaly of the SAT in the Development Stage (b), and the anomaly of the SAT in the Outbreak Stage for this extreme cold event (c): the red boxes represent the United States (US) (75° W−105° W, 30° N−50° N). Time series of regional mean of SAT anomaly in the US on 12−26 December 2022 (d): the area between the black lines represents the Outbreak Stage. Time series of the SAT anomaly in the US on 22−26 December from 1979 to 2022 (e): the red line is the 10th percentile of the SAT on December 22−26 from 1979 to 2022. The corresponding climatological variables are in December from 1979 to 2022.
Atmosphere 15 00893 g001aAtmosphere 15 00893 g001b
Figure 2. The anomaly of geopotential height (GH) (shaded) and wind fields (vectors) in the Early Stage (a), in the Development Stages (b), and in the Outbreak Stage (c). The corresponding climatological variables are in December from 1979 to 2022.
Atmosphere 15 00893 g002aAtmosphere 15 00893 g002b
Figure 3. The U−component of wind (U−wind) anomaly (a) and V−component of wind (V−wind) anomaly (b) in the Early Stage, the U−wind anomaly (c) and V−wind anomaly (d) in the Development Stage, and the U−wind anomaly (e) and V−wind anomaly (f) in the Outbreak Stage. The corresponding climatological variables are in December from 1979 to 2022.
Atmosphere 15 00893 g003aAtmosphere 15 00893 g003b
Figure 4. The regression coefficients of the December Arctic Oscillation (AO) index with temperature from 17 to 26 December of 1979−2022. The significant areas at the 90% confidence level are dotted (a). The AO Index for December of 1979−2022 (b). The corresponding climatological variables are in December from 1979 to 2022.
Atmosphere 15 00893 g004
Figure 5. The first (a) and second (b) EOF mode of the SAT anomaly in December from 1979 to 2022. The PCs of the SAT anomaly correspond to its EOF (c). The corresponding climatological variables are in December from 1979 to 2022.
Atmosphere 15 00893 g005
Figure 6. Time series of the regional mean of the SAT anomaly in the US in January 2024 (a): the area between the black dotted lines represents the cold event. The anomaly of the SAT for this extreme cold event (b): the red boxes represent the US (75° W−105° W, 30° N−50° N). The anomaly of GH (shaded) and wind fields (vectors) for this extreme cold event (c). The U−wind anomaly (d) and V−wind anomaly (e) for this extreme cold event. The corresponding climatological variables are in December from 1979 to 2022.
Atmosphere 15 00893 g006aAtmosphere 15 00893 g006b
Table 1. Comparison of the results of the two cold events.
Cold EventSAT (°C)Archipelagic High Pressure (m)Alaskan
High Pressure (m)
American Low Pressure (m)U-Wind (m/s)V-Wind (m/s)
2022.12−9.16399.45437.44−170.01−21.18−17.26
2024.1−9.50310.49389.30−151.35−18.21−5.27
Disclaimer/Publisher’s Note: The statements, opinions and data contained in all publications are solely those of the individual author(s) and contributor(s) and not of MDPI and/or the editor(s). MDPI and/or the editor(s) disclaim responsibility for any injury to people or property resulting from any ideas, methods, instructions or products referred to in the content.

