Article

Temporal Refinement of Major Primary Air Pollutant Emissions Based on Electric Power Big Data: A Case of the Cement Industry in Tangshan City

Jibei Electric Power Research Institute, State Grid Jibei Electric Power Co., Ltd., (North China Electric Power Research Institute Company Limited), Beijing 100045, China
*
Author to whom correspondence should be addressed.
Atmosphere 2024, 15(8), 895; https://doi.org/10.3390/atmos15080895 (registering DOI)
Submission received: 18 June 2024 / Revised: 20 July 2024 / Accepted: 25 July 2024 / Published: 26 July 2024
(This article belongs to the Section Air Pollution Control)

Abstract

:
High-temporal resolution and timely emission estimates are essential for developing refined air quality management policies. Considering the advantages of extensive coverage, high reliability, and near real-time capabilities, in this work, electric power big data (EPBD) was first employed to obtain accurate hourly resolved facility-level air pollutant emissions information from the cement industries in Tangshan City, China. Then, the simulation optimization was elucidated by coupling the data with the weather research and forecasting (WRF)-community multiscale air quality (CMAQ) model. Simulation results based on estimated emissions effectively captured the hourly variation, with the NMB within ±50% for NO2 and PM2.5 and R greater than 0.6 for SO2. Hourly PM2.5 emissions from clinker production enterprises exhibited a relatively smooth pattern, whereas those from separate cement grinding stations displayed a distinct diurnal variation. Despite the remaining underestimation and/or overestimation of the simulation concentration, the emission inventory based on EPBD demonstrates an enhancement in simulation results, with RMSE, NMB, and NME decreasing by 9.6%, 15.8%, and 11.2%, respectively. Thus, the exploitation of the vast application potential of EPBD in the field of environmental protection could help to support the precise prevention and control of air pollution, with the possibility of the early achievement of carbon peaking and carbon neutrality targets in China and other developing countries.

1. Introduction

Air pollution constitutes the most pressing risk for human health and ecosystems [1,2]. Under the stringent new air quality standards, an astonishing 99% of the world’s population is now breathing air that exceeds the prescribed guideline limits set by the World Health Organization (WHO) [3]. The emission inventory is an ideal method for quantifying emission levels, identifying typical sources and characteristic pollutants, and providing invaluable support for the formulation of effective policies aimed at preventing and controlling air pollution [4,5,6]. However, the traditional emission inventory is usually driven by multiplying annual or monthly activity data (usually, with lags of 1–2 years) and emission factors, inadvertently impeding the advancement of refined and precise air quality management initiatives in China [4,6].
Efforts have been made to establish daily or hourly emission inventories of different air pollutants, based on real-time emission measurements from continuous emission monitoring systems (CEMS, developed by the Chinese government since 2007) (Table A1) [7]. For example, Tang et al. [8], Liu et al. [9], and Wu et al. [6] estimated unit-level emissions of air pollutants from Chinese power plants based on time-varying emission factors derived from CEMS and statistical activity data; Bo et al. [7] and Liu et al. [10] developed an hourly and facility-level emission inventory for SO2, NO2, and particulate matter (PM) for China’s iron and steel industry, leveraging the CEMS database; Tang et al. [11] presented a comprehensive nationwide database encompassing emissions from 10 Chinese industrial sectors, utilizing the real smokestack concentrations of pollutants from the CEMS network. However, it should be mentioned that CEMS coverage is typically limited to large-scale enterprises within energy- and emission-intensive industries [6,11].
Compared to CEMS data, EPBD exhibits the advantages of extensive coverage and high reliability [12,13] in regards to industrial production and daily life [14]. Moreover, as the national strategy of energy transition and emission mitigation, electricity substitution has been actively promoted by China since 2013 [14,15,16,17]. As a result of the gradual implementation of electricity substitution policies, the proportion of electricity consumption in terminal energy usage has witnessed a significant expansion [14,15,16,17,18]. While steady advancements have been achieved in exploring the application of EPBD, researchers have mainly focused on the aspects of smart energy management, integration of renewable energy sources, condition monitoring of wind turbines, low-voltage location and control for distribution networks, as well as risk assessment of distribution network overload [13,19,20]. Recently, some scholars have commenced exploring innovative application methods of EPBD in the realm of air pollution prevention and control. For instance, Ji et al. delved into the intricate association between electricity data and air quality [21]; Wu et al. attempted to forecast industrial pollutant emissions utilizing the EPBD [22]; Zhou et al. established a high-temporal-resolution emission estimation model for air pollutants, drawing from both EPBD and other data [14,23]. However, the utilization of EPBD’s exceptional real-time characteristics for various applications is still rare.
In this study, a step-by-step method was first developed to accurately estimate hourly resolved facility-level air pollutant emissions in two types of cement industries (clinker production enterprises and separate cement grinding stations). Then, daily and hourly emission characteristics of PM2.5, SO2, and NOx from cement industries in Tangshan City China (Figure A1) were analyzed, respectively. To better illustrate the accuracy of emission estimation, a comprehensive evaluation was conducted by incorporating contrastive analysis and WRF-CMAQ simulation. Finally, the optimization of the simulation results was illustrated. This work provides a novel approach for estimating high-temporal-resolution emissions based on EPBD, which will aid in policy making and in the early achievement of carbon neutrality and clean air in China and other developing countries.

2. Data and Methods

Figure A2 illustrates the comprehensive methodology framework employed in this study, including the preprocessing of EPBD and the subsequent estimation of hourly resolved facility-level air pollutant emissions. Notably, rigorous quality control and assurance procedures were adopted during the data collection, processing, and modeling stages to ensure the accuracy and reliability of our findings.

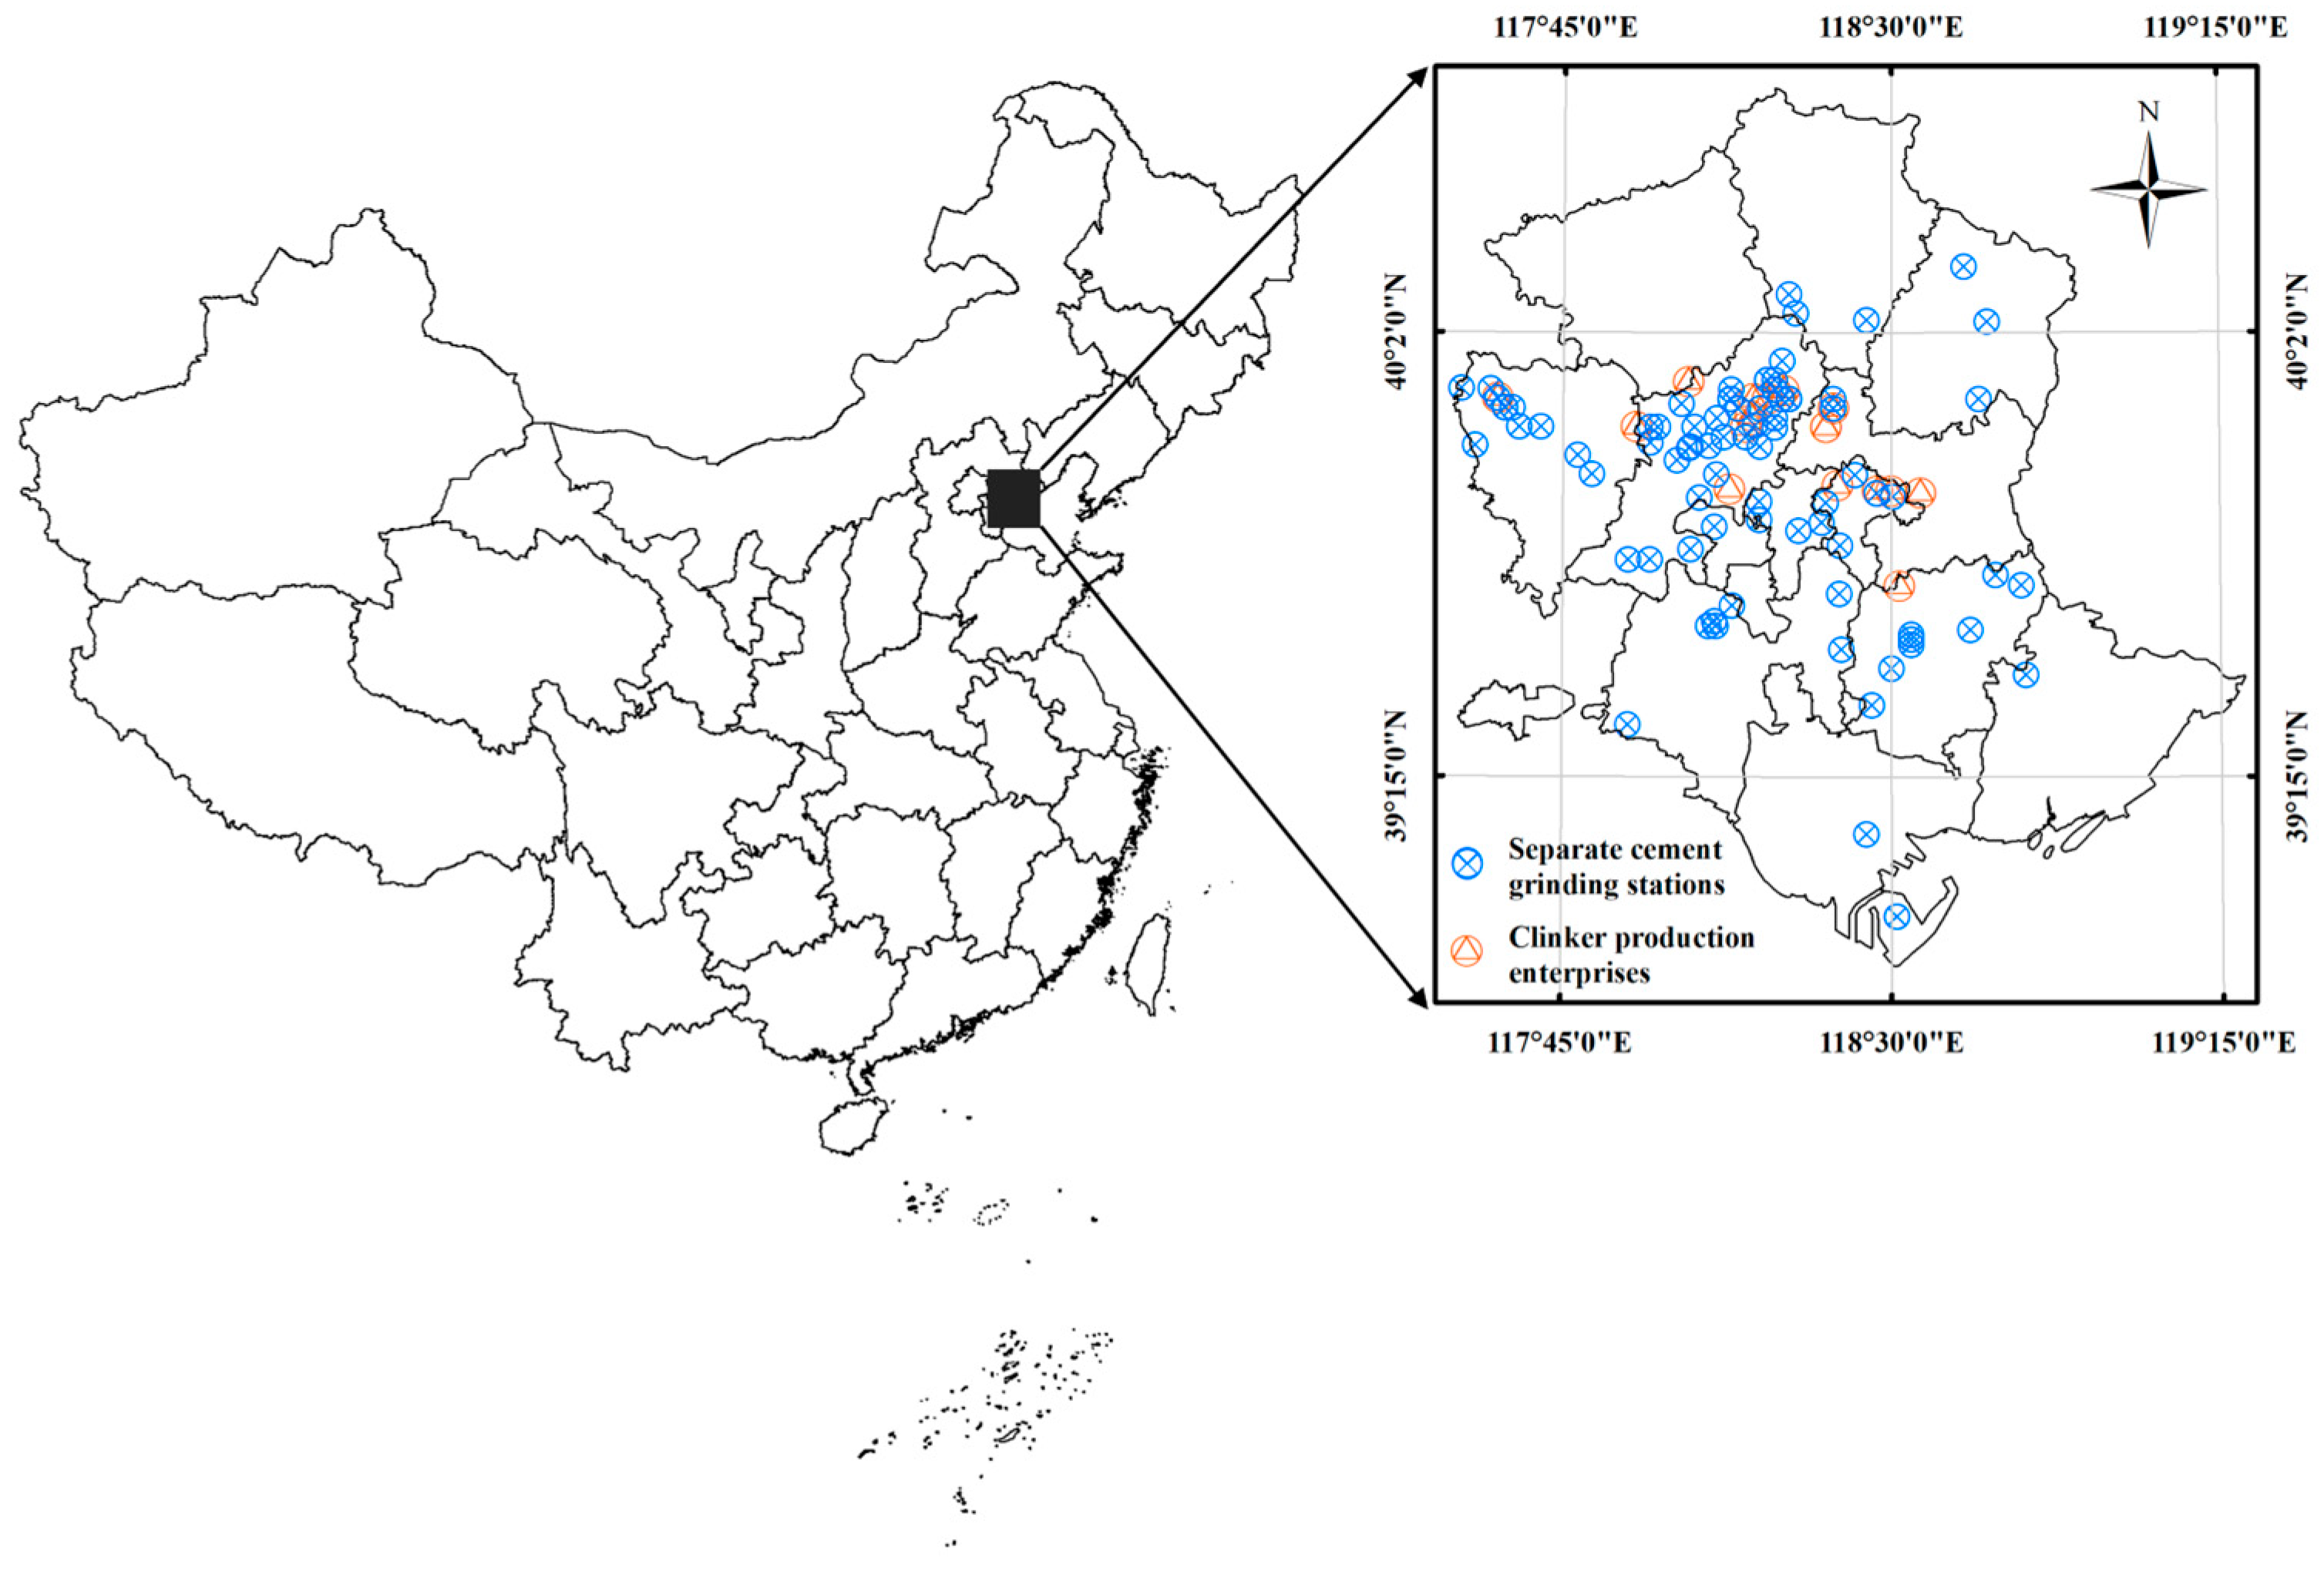
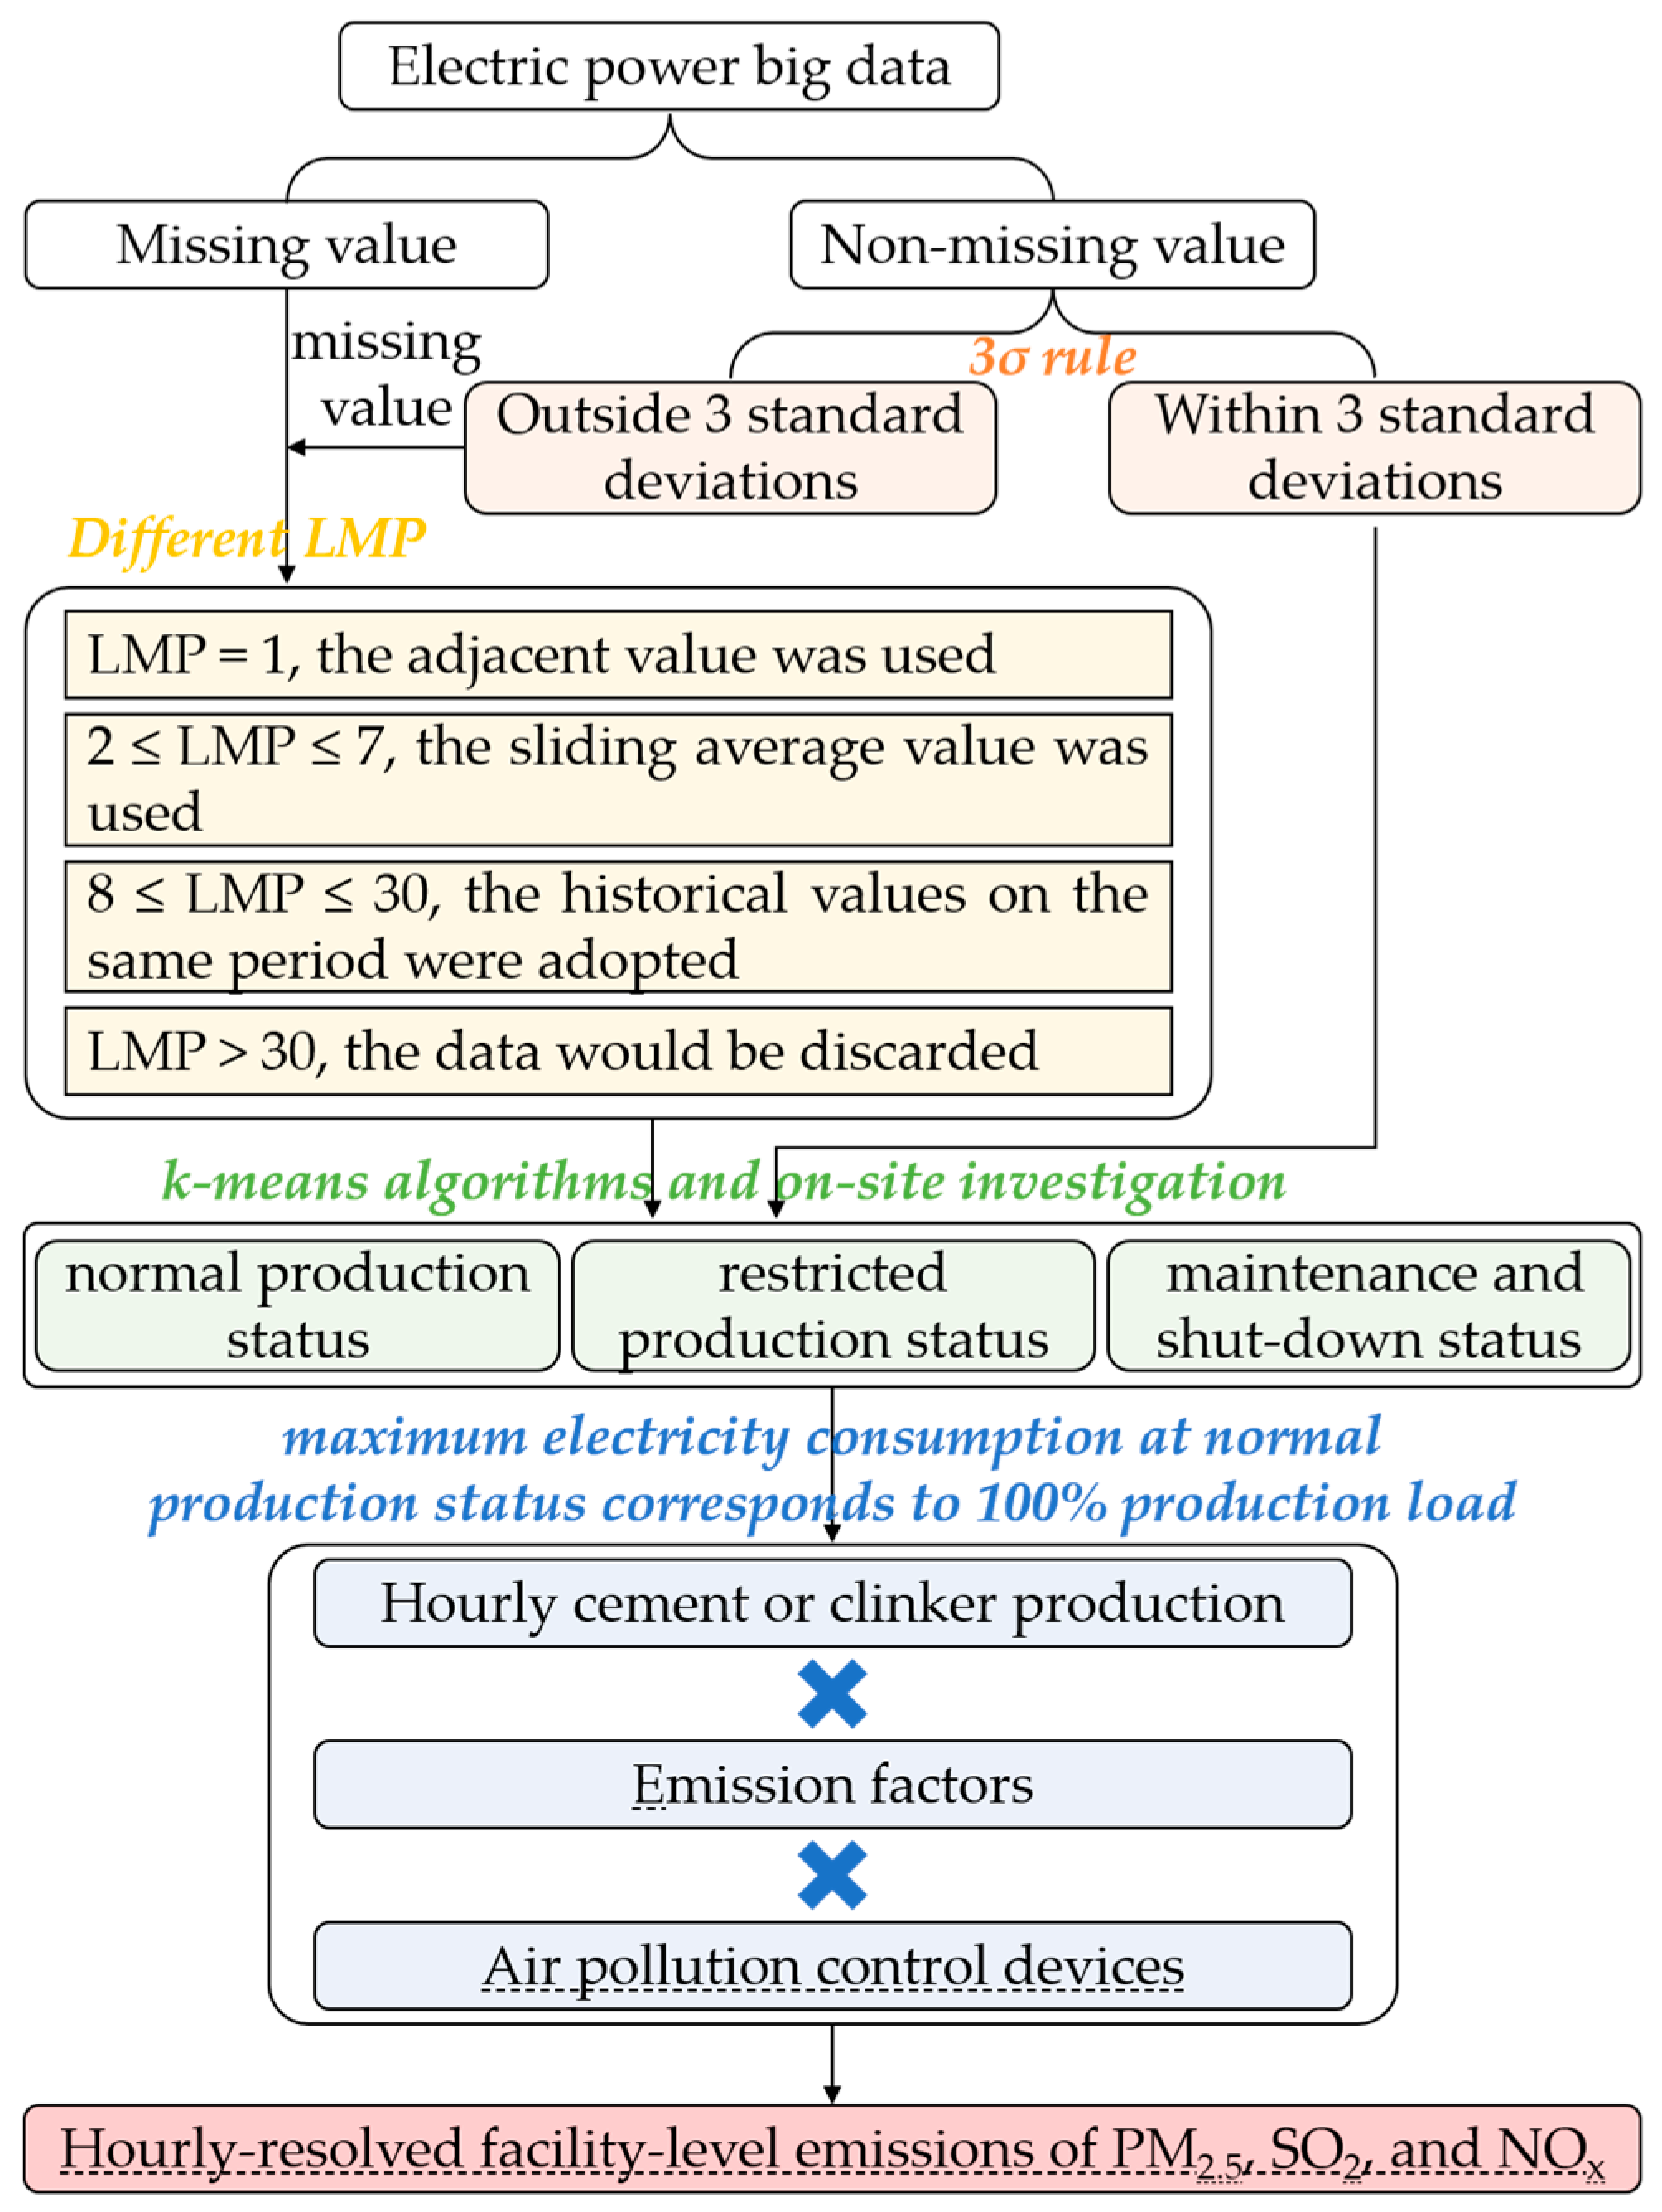
2.1. Collection and Preprocessing of Electricity Consumption Data

EPBD has emerged as a pivotal component in the comprehensive construction of intelligent, digital, informatized power grids [19]. It can be divided into three categories (including power grid operation data, customer data, and enterprise management data) and can span various fields (such as power generation, transmission, distribution, utilization, and scheduling) [12]. The electricity consumption information utilized in this study covers 83 cement industries (Figure A1) (consisting of 13 clinker production enterprises and 70 separate cement grinding stations) derived from marketing data of the State Grid Jibei Electric Power Co., Ltd., in China. It is worth noting that the EPBD still exhibits some quality problems, such as outliers and missing values, in spite of the implementation of rigorous quality control measures within existing collection, transmission, and management systems [19,24].
To address outliers in the EPBD, the 3σ rule was used to establish the upper and lower limits of the data [25]. Specifically, the data outside of the three standard deviations of the mean were identified and subsequently treated as missing values. Furthermore, a multifaceted approach considering the lengths of missing periods (LMP) was adopted to replenish the missing data [26,27]. (1) For LMP = 1, the adjacent value was used to impute the missing data; (2) for 2 ≤ LMP ≤ 7, the sliding average value was used to impute the missing data; (3) for 8 ≤ LMP ≤ 30, the historical values for the same period were adopted to fill in the gaps; (4) for LMP > 30, the data would be discarded. This comprehensive approach ensures that the EPBD used in our study is both accurate and reliable, minimizing the impact of outliers and missing values on our findings.

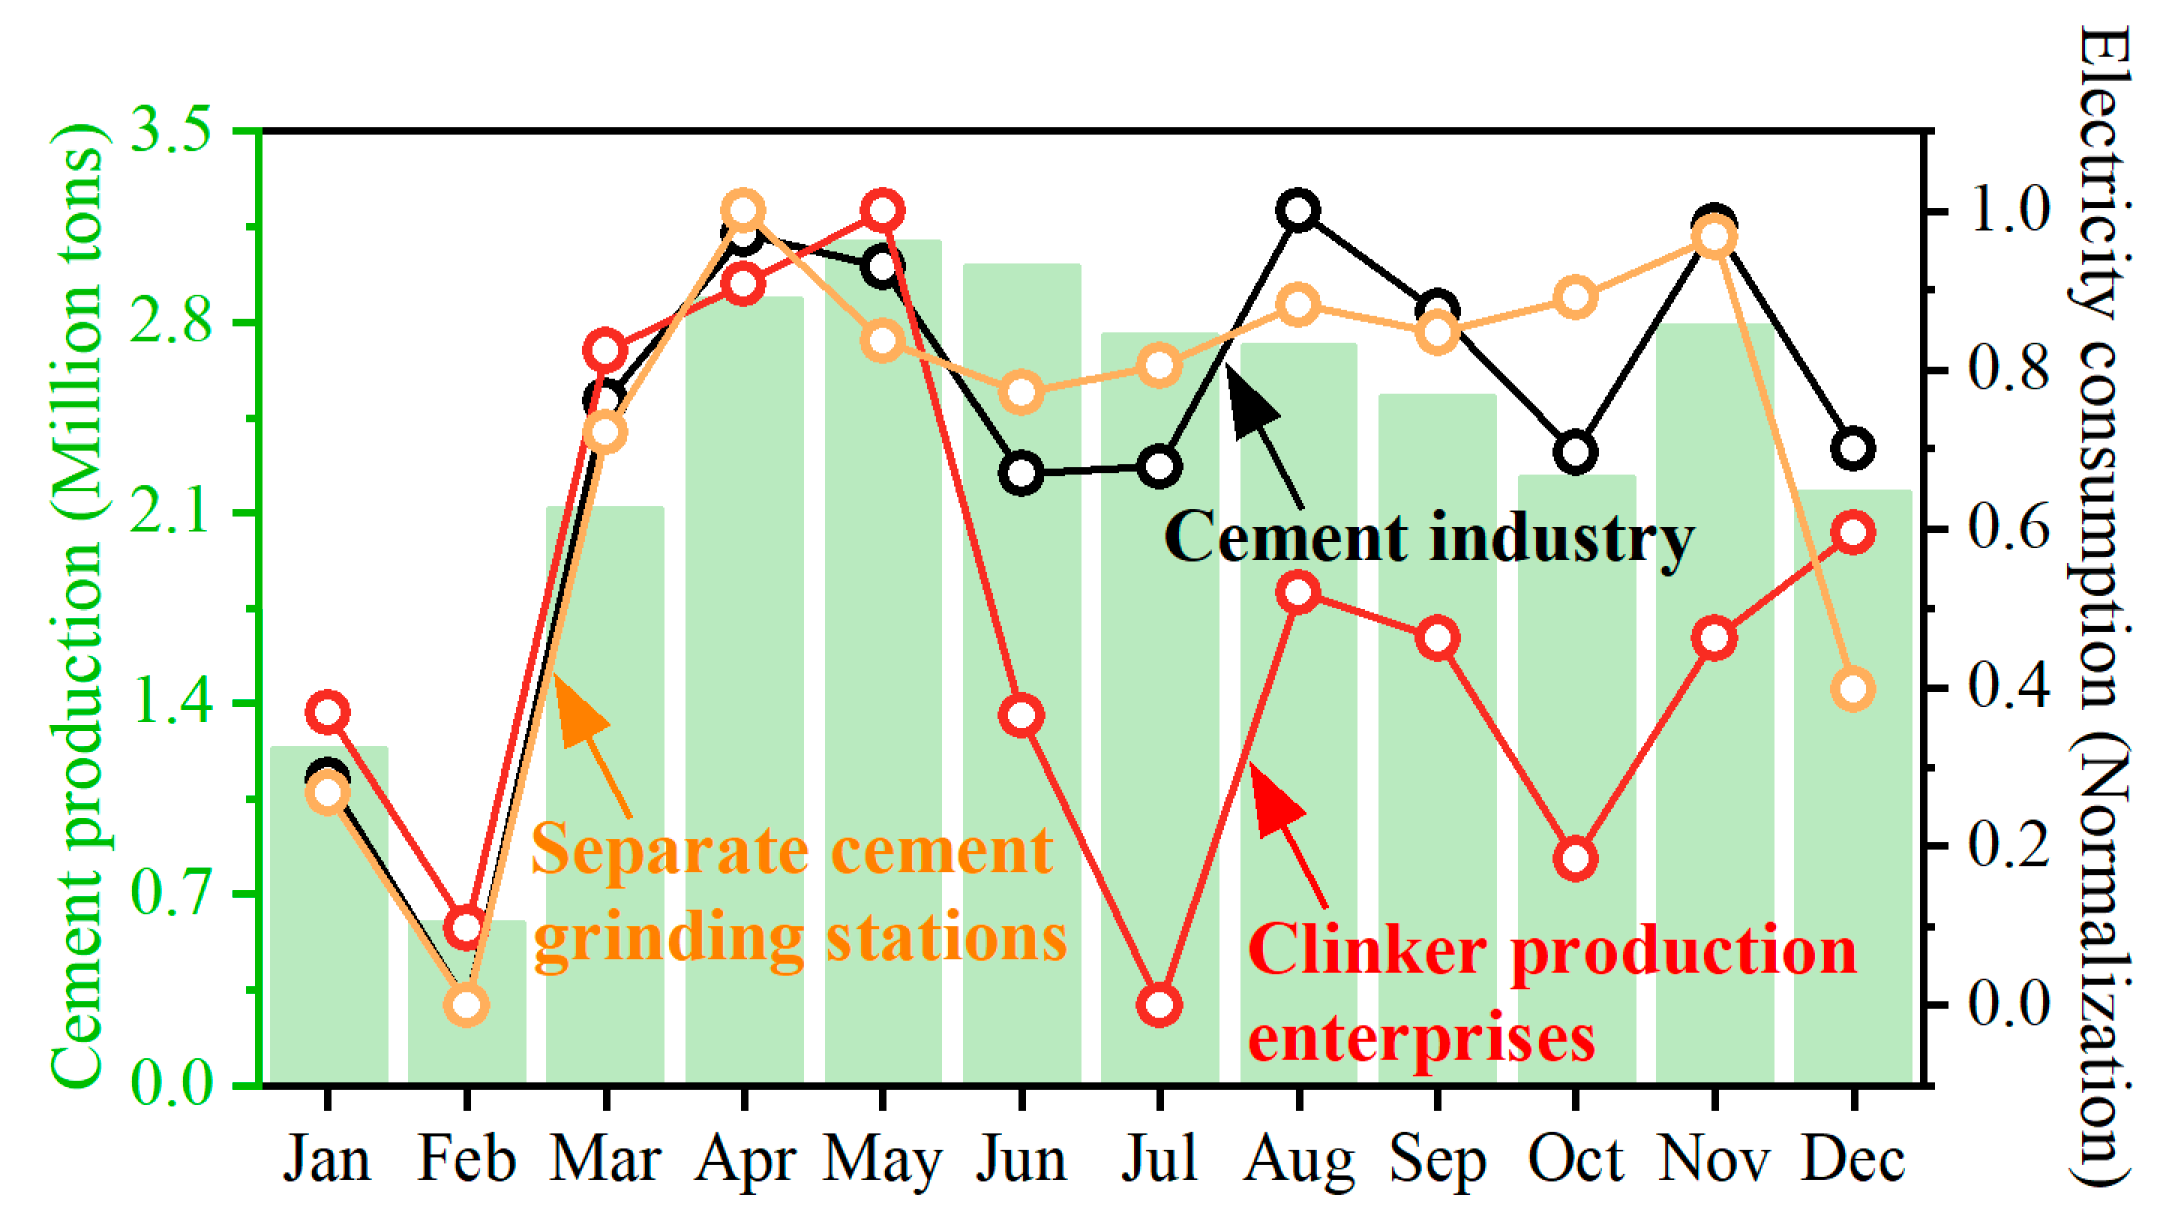
2.2. Comparison of Electric Variations with Relevant Activity Data

The fluctuation of air pollutant emissions was predominantly shaped by variations in relevant activity data [6]. As depicted in Figure 1, we conducted a comparative analysis between city-level monthly cement production and the corresponding electricity consumption profiles of the cement industries and found good agreement, with a Pearson correlation coefficient of 0.90. In addition, the peaks and valleys of monthly cement production were well captured by EPBD, indicating that electricity consumption profiles can serve as a reliable proxy for fluctuations in activity rates and even air pollutant emissions.
We further compared the monthly fluctuation of electricity consumption between the two types of cement industries. As shown in Figure 1, while the monthly electricity consumption patterns between clinker production enterprises and separate cement grinding stations exhibited a strong correlation from January to June, they diverged significantly thereafter. Specifically, during the period from July to December, the electricity consumption patterns of separate cement grinding stations formed an M-shape, with a notable peak in November. On the contrary, the electricity consumption of clinker production enterprises exhibited an N-shaped pattern, peaking in December. Furthermore, given the relatively straightforward technological process [28], the electricity consumption patterns of separate cement grinding stations demonstrated a higher degree of congruence with cement output.

2.3. Estimation of Hourly Resolved Facility-Level Emissions

In this study, a step-by-step method was employed to accurately estimate hourly resolved facility-level air pollutant emissions. Firstly, the processed electricity consumption data for each cement industry was categorized into three distinct ranges (i.e., normal production status, restricted production status, and maintenance and shut-down status, respectively) by combining k-means algorithms and on-site investigation.
Secondly, the hourly cement or clinker production was calculated by multiplying the production load with the respective capacity. Based on the on-site investigation, we assumed that the maximum electricity consumption during normal production status corresponds to a 100% production load.
Finally, air pollutant emissions were estimated by synthesizing cement or clinker production, emission factors, and the removal efficiency of air pollution control devices. The calculation formula is as follows:
E m , i = L C , i × C C , i × E F C , m × 1 η C , m + L C G , i × C C G , i × E F C G , m × 1 η C G , m
where Em,i represents the annual emissions of pollutants m in the cement industry i (t); LC,i and LCG,i represent the production load for clinker and cement grinding processes in the cement industry i, respectively; CC,i and CCG,i are the capacity of clinker and cement grinding processing in the cement industry i, respectively; EFC,m and EFCG,m are the emission factors of pollutants m in clinker and cement grinding processes; η C , m and η C G , m represent the removal efficiency for pollutants m from air pollution control devices installed for use in clinker and cement grinding processes. It is noteworthy that to accurately reflect the emission characteristics of normal production in the cement industry, while also acknowledging the constraints of data accessibility, 2019 was chosen as the representative year in our study.

2.4. Evaluation of Inventory Optimization

Two simulation scenarios, driven by original and optimized emission inventories, were employed to demonstrate the enhancement of the simulation results. Therein, the original emission inventory was accessed from the Multi-Resolution Emission Inventory in China (MEIC, http://meicmodel.org.cn/#firstPage, accessed on 25 July 2024). However, the optimized emission inventory replaced the cement emission data in the MEIC with the hourly resolved facility-level emissions estimated in this study.
Similar to the methods used in our previous study [23], WRF-CMAQ simulations were performed over three nested domains: the eastern part of China, with a resolution of 27 × 27 km (Domain 1); the northern China, with a resolution of 9 × 9 km (Domain 2); and Tangshan City, with a resolution of 3 × 3 km (Domain 3). A Lambert projection was employed, with two true latitudes of 25° N and 47° N, and centered at 118.42° E and 39.69° N. The simulation period was the two-alert span in 2019 (9–14 January and 19–24 November). More detailed model configurations have been described by Zhou et al. [23]. To evaluate the accuracy of the simulation concentrations, we gathered the hourly ground-level observed PM2.5, SO2, and NO2 concentration data for twelve stations (detailed coordinate information is shown in Table A2) in Tangshan City from the China National Environmental Monitoring Center [29]. Detailed information regarding the above variables and the respective data sources is provided in Table A3. To minimize the influence of the initial conditions, a spin-up period of 10 days was used in this study.

3. Results and Discussion

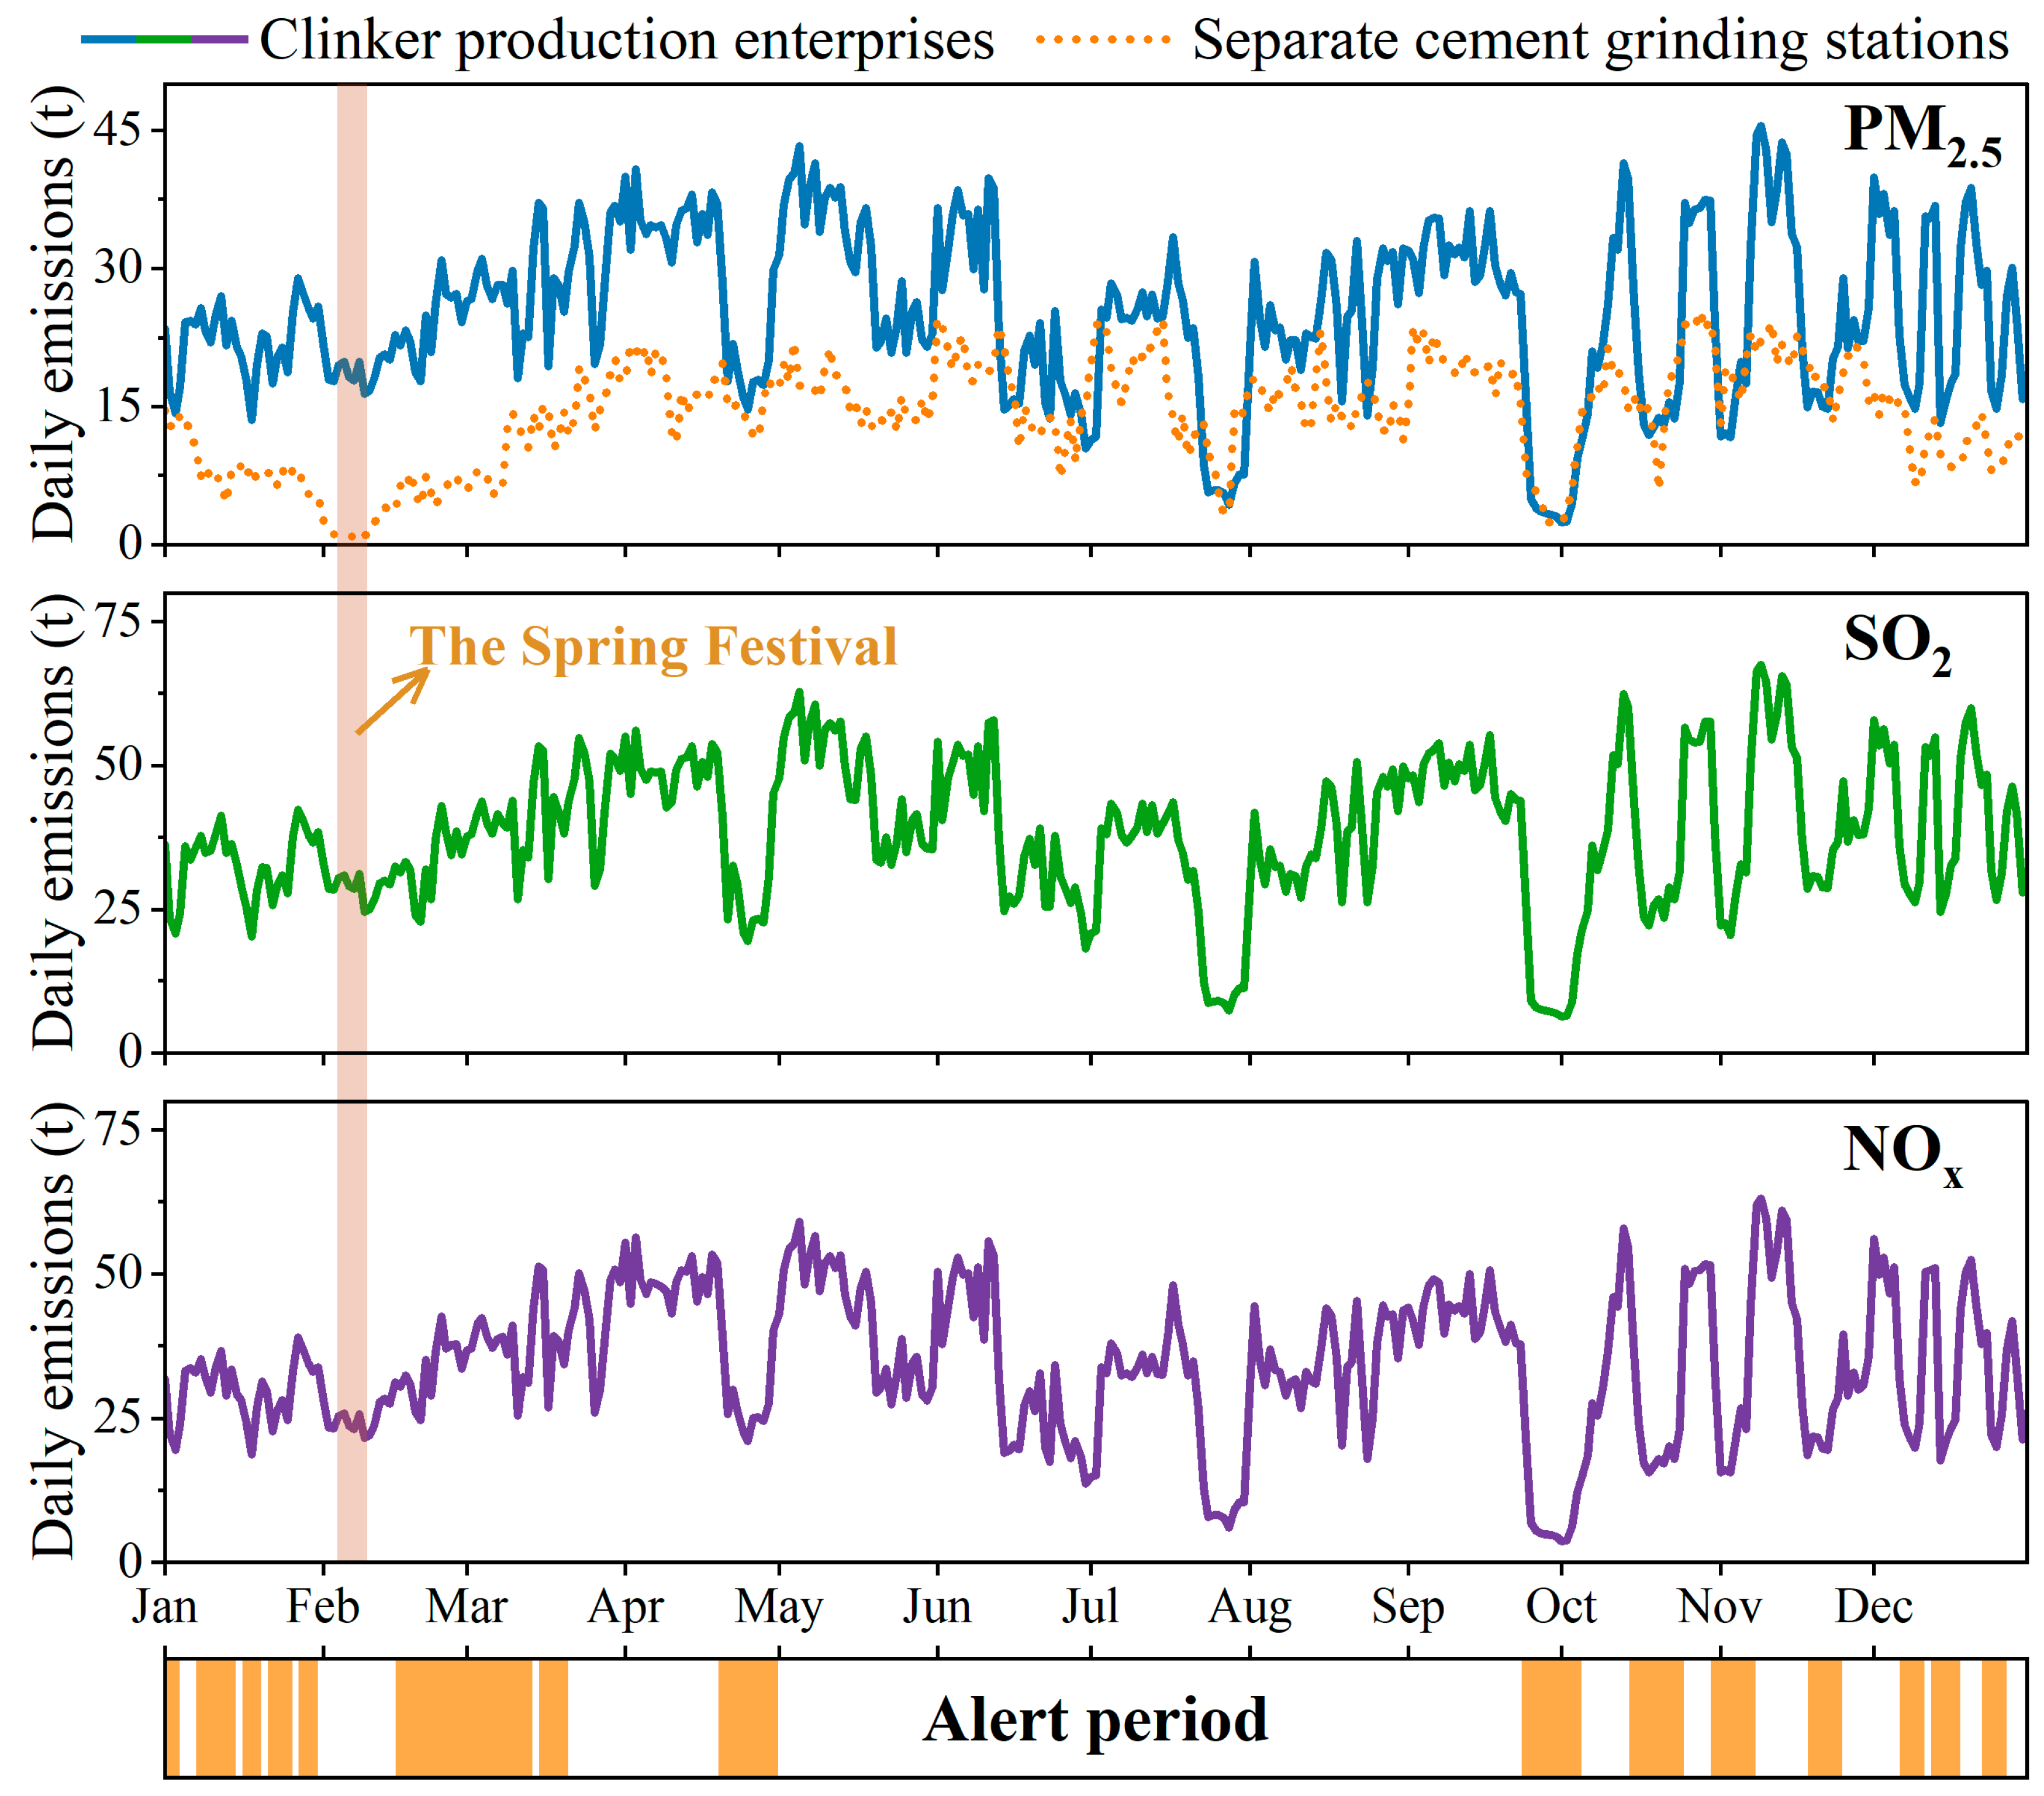
3.1. Daily and Hourly Emission Patterns from the Cement Industry

Figure 2 presents the daily emissions of PM2.5, SO2, and NOx from the cement industry in Tangshan City, China. The daily emissions of air pollutants from clinker production enterprises increased steadily and slightly throughout the period from January to May, subsequently decreased slightly in June and July, and rebounded continuously from August to the end of the year, while the daily emissions of air pollutants from separate cement grinding stations increased continuously from February to November and decreased slightly in December. During the Spring Festival holiday and periods of heavy pollution alerts, the daily emissions of air pollutants typically plummeted to their lowest levels of the year. This finding demonstrates that the emergency response mechanism for heavy pollution proposed by the Ministry of Ecology and Environment of the People’s Republic of China plays a vital role in improving air quality and protecting human health.
Figure 3 presents the hourly PM2.5 emission patterns during different seasons. Hourly PM2.5 emissions from separate cement grinding stations (Figure 3b,d,f,h) exhibit obvious temporal variation characteristics, with low emissions in the daytime and high emissions in the nighttime, affected by peak and valley electric charges [30]. In contrast to the remarkable diurnal variation between separate cement grinding stations, the hourly PM2.5 emissions from clinker production enterprises (Figure 3a,c,e,g) exhibit a relatively smooth trend. Due to the complex production procedures and high energy demands [28], PM2.5 emissions from clinker production enterprises were higher than in the separate cement grinding stations. In addition, affected by heavy pollution alert periods and fluctuations in market demand, hourly PM2.5 emissions undergo seasonal variations, with higher concentrations during summer (Figure 3c,d) and autumn (Figure 3e,f).

3.2. Uncertainty Analysis

The optimal approach for evaluating the accuracy of emission inventory is comparing atmospheric chemical transport modeling results directly with atmospheric monitoring data [31]. To better illustrate the accuracy of air pollutant emission estimations derived from EPBD, we conducted a comprehensive evaluation by incorporating contrastive analysis and CMAQ simulation. As shown in Table 1, the pollutant emissions estimated in this study were basically consistent with the MEIC inventory [4]. Specifically, pollutant emissions from clinker production enterprises and separate cement grinding stations estimated in this study were slightly lower than those in the MEIC. This discrepancy can be primarily attributed to the assumption that the maximum electricity consumption during regular production operations directly correlates with a 100% production load, while in reality, overloading situations may occur.
In addition, the corresponding performance statistics (e.g., R, RMSE, NMB, and NME, which are recommended by the U. S. Environmental Protection Agency [32]) for pollutant simulation are shown in Table 1. In this study, an NMB within ±50% and an NME within 50% are considered to be a satisfactory levels [33]. We found reasonable agreement between the modeled and observed hourly concentrations of pollutants, with NMB and NME within ±50% and 52% for NO2 and PM2.5 in both two-simulation periods. Although the values of NME and NMB for SO2 were relatively elevated, the R surpassed 0.6 and the RMSE remained below 20, suggesting that the modeled SO2 concentrations still capture the overall trend and variability.
As presented in Table 1, the modeled hourly PM2.5 concentration exhibited a high RMSE for the period 9–14 January. This elevated RMSE may be due to the intricate interplay of complex meteorological and emission conditions during the alert span [34]. Moreover, our results are generally consistent with the evaluation results of the WRF-CAMx modeling system for Shanxi Province in China [29]. Overall, the estimated pollutant emissions in this study were deemed reasonable and acceptable.

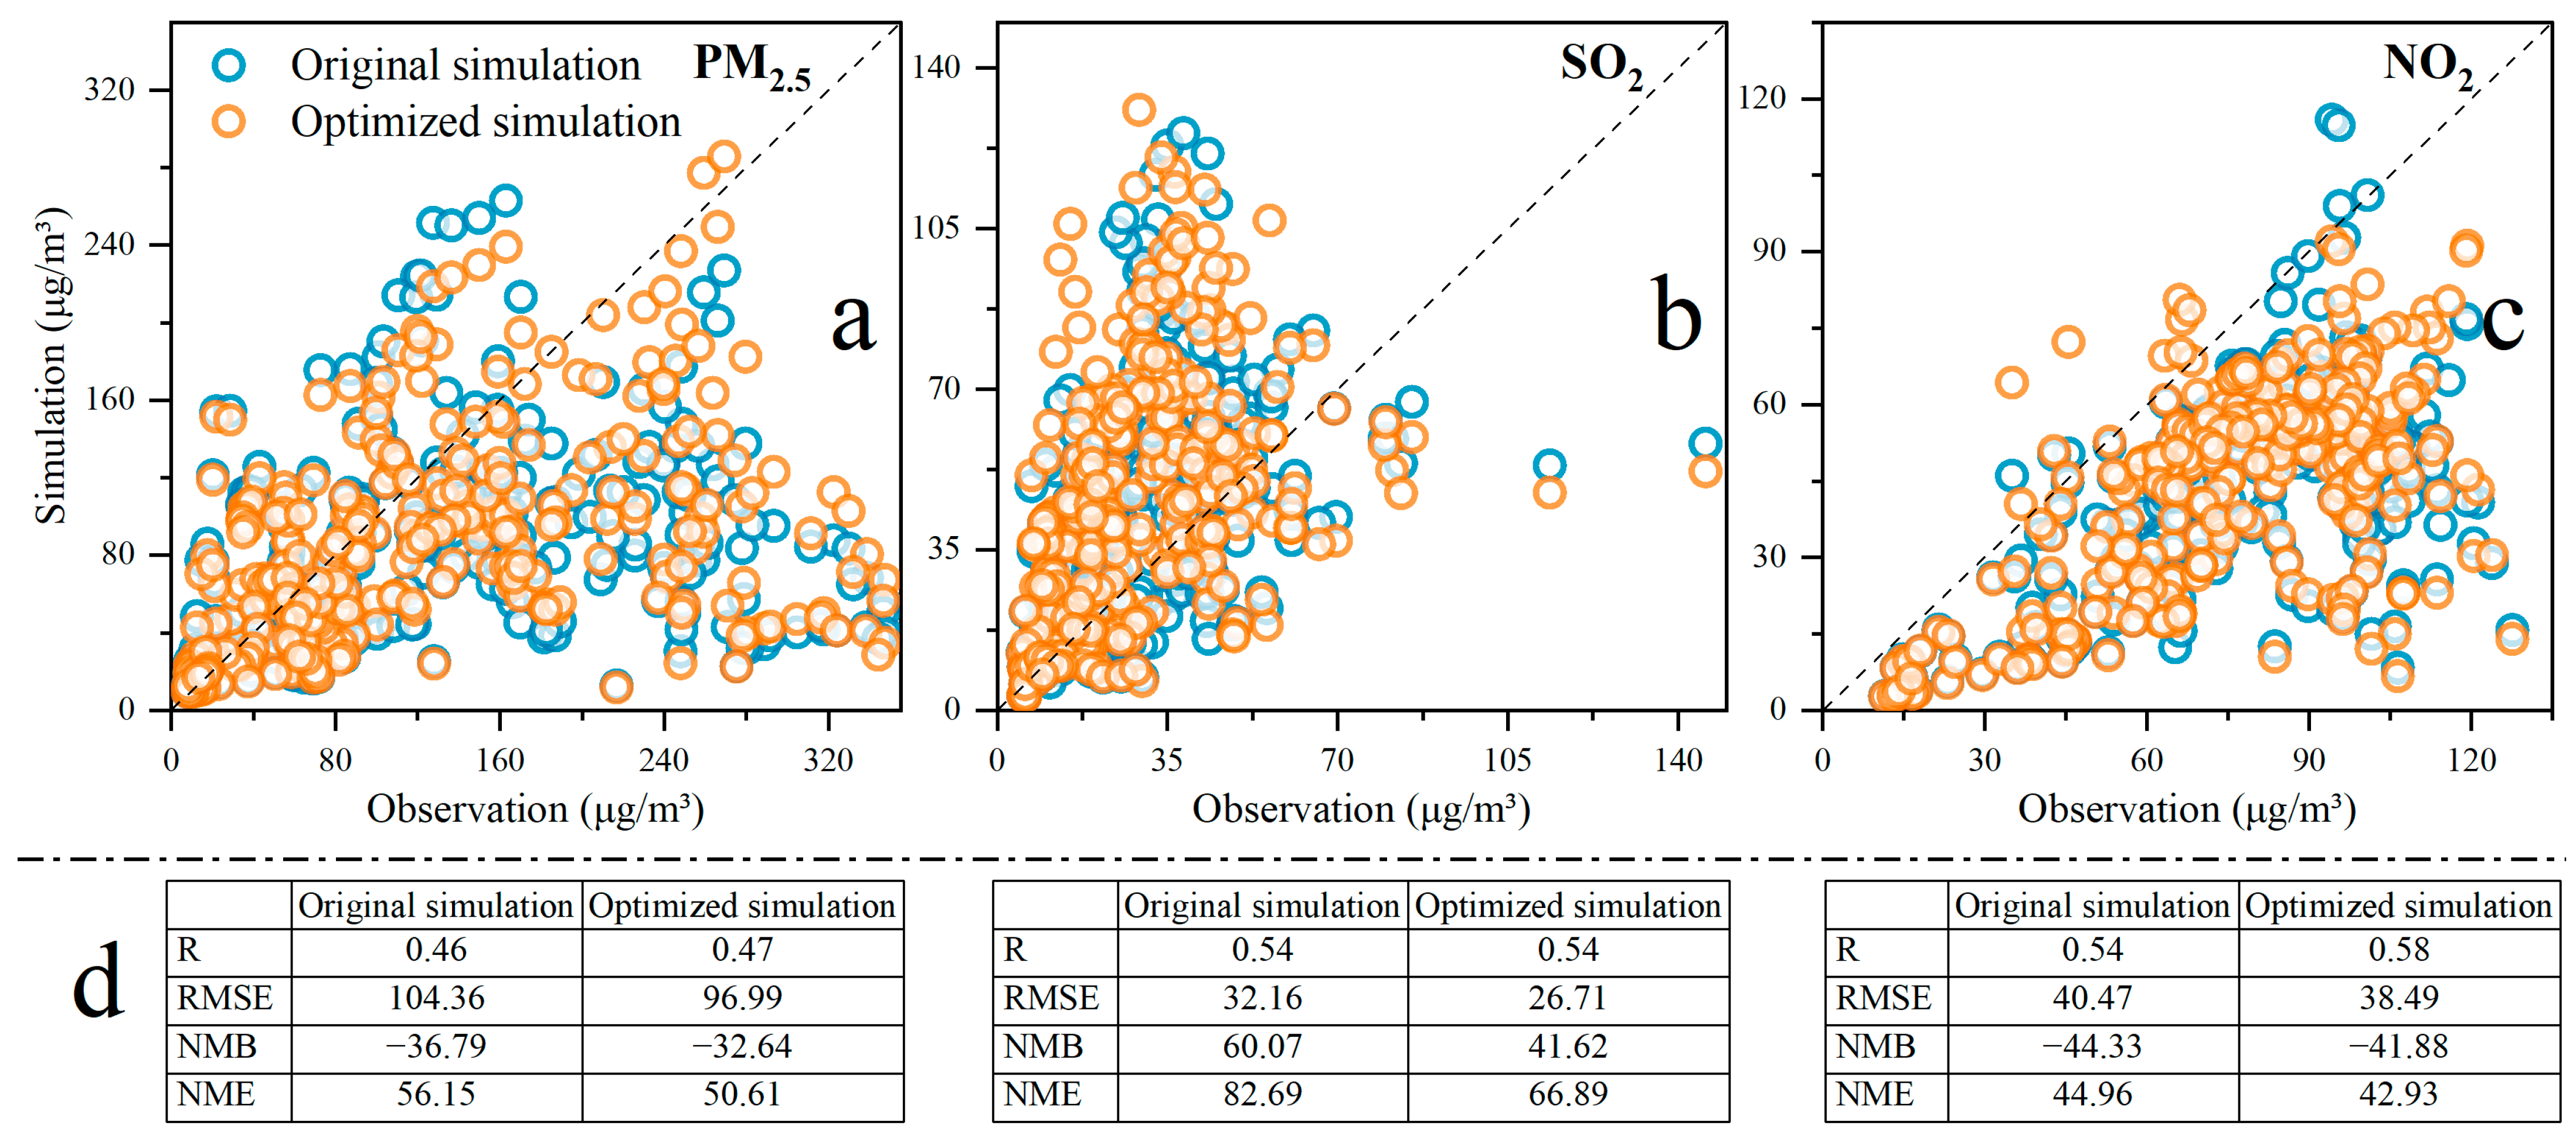
3.3. Evaluation of Simulation Optimization Results

Temporally resolved emissions are typically required by chemical transport models [4] and the scientific and precise prevention and control of air pollution, whereas information on hourly variations is rarely available from multiple sources [4]. In contrast to traditional emission inventories, the emissions estimation based on EPBD possess the capability to capture precise emission characteristics across multiple temporal scales. Figure 4 shows a comparative analysis of the simulation results from CMAQ, driven by an optimized emission inventory, with those utilizing a widely used traditional emission inventory combining default temporal profiles.
As depicted in Figure 4a–c, the hourly simulation concentration of PM2.5, SO2, and NO2, driven by an optimized emission inventory, exhibits a better consistency with the actual observations. Specifically, for SO2, while R maintains consistent, the RMSE, NMB, and NME of the optimized simulations were 26.71 μg/m3, 41.62%, and 66.89% (Figure 4d), respectively, which are lower than the levels in the original simulation. The simulation results for NO2 showed a similar pattern to that for SO2 (Figure 4d). Conversely, the RMSE and NMB results for the optimized simulations of PM2.5 were slightly higher than those from the original simulation, while the R and NME were much more accurate for the optimized simulation (Figure 4d).
Overall, despite lingering instances of underestimation and/or overestimation in the simulation concentrations, the emission inventory derived from EPBD has demonstrated a significant improvement in regards to the simulation results. These deviations in simulated concentrations could be plausibly attributed to the uncertainties in the emission inventories and insufficient understanding of the simulation mechanisms [29].

4. Conclusions

In this study, daily and hourly emissions of major primary air pollutants (PM2.5, SO2, and NOx) from two types of cement industries (clinker production enterprises and separate cement grinding stations) in Tangshan City, China, were estimated for the year 2019, based on EPBD. A step-by-step method was first developed to accurately estimate hourly resolved facility-level air pollutant emissions in cement industries. Our findings exhibit a robust correlation between the pollutant emission estimates derived from EPBD and those corroborated by available statistical data. Moreover, simulations based on these estimated emissions successfully captured the intricate hourly variations in pollutant concentrations, achieving normalized mean biases (NMB) within ±50% for NO2 and PM2.5, and correlation coefficients (R) exceeding 0.6 for SO2. Notably, despite lingering instances of underestimation and/or overestimation in the simulated concentrations, the employment of an emission inventory grounded in EPBD marked a substantial improvement in the overall accuracy and fidelity of the simulation results. This innovative methodology for estimating high-temporal-resolution emissions, leveraging EPBD’s near-real-time capabilities to achieve near-synchronous alignment between simulated result and observation data, will help to support the precise prevention and control of air pollution and contribute to the early achievement of carbon peaking and carbon neutrality targets in China and other developing countries.
There were several limitations in this study, such as the fact that the lack of high temporal resolution production data in each cement plant may lead to uncertainty in emission estimation; thus, the incomplete simulation scheme would generate underestimation and/or overestimation of the simulated concentration. Nevertheless, given the pivotal role of electrical power substitution in fostering sustainable development and reshaping the end-use energy consumption landscape, the significance of electricity in the future cannot be overstated. Consequently, further efforts are vitally required to use EPBD to elucidate the near real-time emission characteristics of air pollutants and greenhouse gases for enterprises with complex processes and high pollution emissions.

Author Contributions

Conceptualization and writing—original draft and editing, X.B.; conceptualization and methodology, P.L. and W.Z.; writing—review and editing and project administration, H.W.; data collection and investigation, C.L. and Z.Z. All authors have read and agreed to the published version of the manuscript.

Funding

This work was funded by the State Grid Corporation of China (1400-202214404A-2-0-ZN).

Institutional Review Board Statement

Not applicable.

Informed Consent Statement

Not applicable.

Data Availability Statement

Data are unavailable due to privacy or ethical restrictions.

Acknowledgments

We would like to acknowledge the editors and anonymous reviewers for their valuable suggestions and comments for improving this paper.

Conflicts of Interest

All author were employed by the company Jibei Electric Power Research Institute, State Grid Jibei Electric Power Co., Ltd. The authors declare no conflicts of interest.

Appendix A

Table A1. Studies for establishing high-temporal-resolution emission inventories based on CEMS data.
ReferenceSource CategoriesCEMS Data Coverage
Tang et al. [8]Chinese power plants95.91% of total thermal power capacity for 2016
Karplus et al. [9]256 power plants in four Chinese provinces: Guangdong, Hubei, Shandong, and Shanghai
Wu et al. [6]96.4% of total thermal power capacity from 2017 to 2020
Bo et al. [7]China’s iron and steel industry69–91% of national iron and steel production
Liu et al. [10]81% of these member companies were included in the CEMS
Tang et al. [11]Ten Chinese industrial sectors7708 generating plants across different industrial sectors from 2015 to 2018
Table A2. Detailed information from twelve observation stations in Tangshan City, China.
NumberStation NameCoordinate Information
1Fengrun District Government118.16° E, 39.83° N
2Leida Station118.13° E, 39.64° N
3Wuzi Station118.17° E, 39.63° N
4Xiaoshan Station118.19° E, 39.62° N
5Zhengtai Street Heat Station118.09° E, 39.58° N
6Jinshan School118.44° E, 39.74° N
7Government service center118.24° E, 39.67° N
8Squadron of Xiaofanggangyao Road118.21° E, 39.66° N
9Lunandianda Station118.14° E, 39.62° N
10Twelve middle schools118.17° E, 39.65° N
11The supply and marketing cooperative118.17° E, 39.63° N
12Ceramic company118.22° E, 39.67° N
Table A3. Detailed information for variables and data sources.
VariablesData Sources
EPBDState Grid Jibei Electric Power Co., Ltd., in China
Location of 83 cement industriesBai et al., 2023 [28]
LC,i and LCG,iCalculated by the ratio of actual hourly electricity consumption to maximum hourly electricity consumption
CC,i and CCG,iTangshan Municipal Ecology and Environment Bureau in China
EFC,m and EFCG,mTechnical Manual for Compilation of Air Pollution Emission Inventory [35]
η C , m and η C G , m
Hourly ground-level observed PM2.5, SO2, and NO2 concentration dataChina National Environmental Monitoring Center
Figure A1. Detailed information for the study areas and the locations of 83 cement industries.
Atmosphere 15 00895 g0a1
Figure A2. Methodology framework for preprocessing EPBD and estimating hourly resolved facility-level air pollutant emissions of cement industries in Tangshan City, China.
Atmosphere 15 00895 g0a2

References

  1. Lei, Y.; Yin, Z.C.; Lu, X.; Zhang, Q.; Gong, J.C.; Cai, B.F.; Cai, C.; Chai, Q.M.; Chen, H.P.; Chen, R.J.; et al. The 2022 report of synergetic roadmap on carbon neutrality and clean air for China: Accelerating transition in key sectors. Environ. Sci. Ecotechnol. 2024, 19, 100335. [Google Scholar] [CrossRef] [PubMed]
  2. Li, C.; van Donkelaar, A.; Hammer, M.S.; McDuffie, E.E.; Burnett, R.T.; Spadaro, J.V.; Chatterjee, D.; Cohen, A.J.; Apte, J.S.; Southerland, V.A.; et al. Reversal of trends in global fine particulate matter air pollution. Nat. Commun. 2023, 14, 5349. [Google Scholar] [CrossRef]
  3. WHO. Billions of People Still Breathe Unhealthy Air: New WHO Data. 2022. Available online: https://www.who.int/news/item/04-04-2022-billions-of-people-still-breathe-unhealthy-air-new-who-data (accessed on 7 July 2024).
  4. Li, M.; Liu, H.; Geng, G.N.; Hong, C.P.; Liu, F.; Song, Y.; Tong, D.; Zheng, B.; Cui, H.Y.; Man, H.Y.; et al. Anthropogenic emission inventories in China: A review. Natl. Sci. Rev. 2017, 4, 834–866. [Google Scholar] [CrossRef]
  5. Streets, D.G.; Devane, M.K.; Lu, Z.; Bond, T.C.; Sunderland, E.M.; Jacob, D.J. All-time releases of mercury to the atmosphere from human activities. Environ. Sci. Technol. 2011, 45, 10485–10491. [Google Scholar] [CrossRef] [PubMed]
  6. Wu, N.N.; Geng, G.N.; Qin, X.Y.; Tong, D.; Zheng, Y.X.; Lei, Y.; Zhang, Q. Daily emission patterns of coal-fired power plants in China based on multisource data fusion. ACS Environ. Au 2022, 2, 363–372. [Google Scholar] [CrossRef]
  7. Bo, X.; Jia, M.; Xue, X.D.; Tang, L.; Mi, Z.F.; Wang, S.Y.; Cui, W.G.; Chang, X.Y.; Ruan, J.H.; Dong, G.X.; et al. Effect of strengthened standards on Chinese ironmaking and steelmaking emissions. Nat. Sustain. 2021, 4, 811–820. [Google Scholar] [CrossRef]
  8. Tang, L.; Qu, J.B.; Mi, Z.F.; Bo, X.; Chang, X.Y.; Anadon, L.D.; Wang, S.Y.; Xue, X.D.; Li, S.B.; Wang, X.; et al. Substantial emission reductions from Chinese power plants after the introduction of ultra-low emissions standards. Nat. Energy 2019, 4, 929–938. [Google Scholar] [CrossRef]
  9. Karplus, V.J.; Shuang, Z.; Douglas, A. Quantifying coal power plant responses to tighter SO2 emissions standards in China. Proc. Natl. Acad. Sci. USA 2018, 115, 201800605. [Google Scholar] [CrossRef]
  10. Liu, J.; Wang, S.; Yi, H.H.; Tang, X.L.; Li, Z.L.; Yu, Q.J.; Zhao, S.Z.; Gao, F.Y.; Zhou, Y.S.; Wang, Y.X. Air pollutant emission and reduction potentials from the sintering process of the iron and steel industry in China in 2017. Environ. Pollut. 2022, 307, 119512. [Google Scholar] [CrossRef]
  11. Tang, L.; Jia, M.; Yang, J.N.; Li, L.; Bo, X.; Mi, Z.F. Chinese industrial air pollution emissions based on the continuous emission monitoring systems network. Sci. Data 2023, 10, 153. [Google Scholar] [CrossRef]
  12. Huang, Y.H.; Zhou, X.X. Knowledge model for electric power big data based on ontology and semantic web. CSEE J. Power Energy 2015, 1, 19–27. [Google Scholar] [CrossRef]
  13. Zhou, K.L.; Fu, C.; Yang, S.L. Big data driven smart energy management: From big data to big insights. Renew. Sust. Energ. Rev. 2016, 56, 215–225. [Google Scholar] [CrossRef]
  14. Zhou, W.Q.; Yang, J.Q.; Ning, L.; Wu, H.C.; Bo, Y.; Zhang, Q.; Tian, H.Z. Construction and application of air pollutant emission accounting model for iron and steel enterprises based on power big data. Res. Environ. Sci. 2014, 37, 299–307. [Google Scholar]
  15. Geng, J.Q.; Meng, W.G.; Yang, Q.R. Electricity substitution potential prediction based on Tent-CSO-CG-SSA-Improved SVM—A case study of China. Sustainability 2022, 14, 853. [Google Scholar] [CrossRef]
  16. Niu, D.X.; Gao, T.; Ji, Z.S.; Liu, Y.J.; Wu, G.Q. Analysis of the efficiency of provincial electricity substitution in China based on a three-stage DEA model. Energies 2021, 14, 6650. [Google Scholar] [CrossRef]
  17. Song, H.Y.; Hou, G.S.; Xu, S. CO2 emissions in China under electricity substitution: Influencing factors and decoupling effects. Urban Clim. 2023, 47, 101365. [Google Scholar] [CrossRef]
  18. Liddle, B.; Sadorsky, P. How much does increasing non-fossil fuels in electricity generation reduce carbon dioxide emissions? Appl. Energ. 2017, 197, 212–221. [Google Scholar] [CrossRef]
  19. Cai, D.F.; Tian, H.X.; Wang, Y.; Wang, H.G.; Zheng, H.F.; Cao, K.; Zhou, C. Electric power big data and its applications. In Proceedings of the 2016 International Conference on Energy, Power and Electrical Engineering, Shenzhen, China, 30–31 October 2016; Atlantis Press: Amsterdam, The Netherlands, 2016; pp. 181–184. [Google Scholar]
  20. Zhan, J.; Huang, J.X.; Niu, L.; Peng, X.S.; Deng, D.Y.; Deng, S.J. Study of the key technologies of electric power big data and its application prospects in smart grid. In Proceedings of the Power & Energy Engineering Conference, Hong Kong, China, 7–10 December 2014. [Google Scholar]
  21. Ji, G.Q.; Li, F.R.; Ding, J.M.; Shan, T.H.; Wang, Z.M.; Qin, L.H.; Wu, X.M. Correlation analysis between electricity consumption and air quality in Tangshan area based on data mining. Electron. World 2017, 1, 22–24. [Google Scholar] [CrossRef]
  22. Wu, L.B.; Zhou, Y.; Chen, H.B.; Yang, Z.H. Emission characteristics of industrial air pollution by using smart-grid big data. Chin. J. Environ. Manag. 2016, 8, 37–42. [Google Scholar]
  23. Zhou, W.Q.; Li, P.; Wu, H.C.; He, X.J.; Sun, S.D.; Bo, Y.; He, K.B. Research on optimizing air pollutant emission inventory based on electricity consumption data. China Environ. Sci. 2023, 43, 3350–3359. [Google Scholar]
  24. Liu, H.; Huang, F.P.; Li, H.; Liu, W.W.; Wang, T.X. A big data framework for electric power data quality assessment. In Proceedings of the 2017 14th Web Information Systems and Applications Conference (WISA), Liuzhou, China, 11–12 November 2017; pp. 289–292. [Google Scholar]
  25. Park, W.; Nam, K.; Choi, S. Determination of the minimum detectability of surface plasmon resonance devices by using the 3σ rule. J. Korean Phys. Soc. 2020, 76, 1010–1013. [Google Scholar] [CrossRef]
  26. Gao, P.Z.; Wang, M.; Ghiocel, S.G.; Chow, J.H. Missing data recovery by exploiting low-dimensionality in power system synchrophasor measurements. IEEE T. Power Syst. 2016, 31, 1006–1013. [Google Scholar] [CrossRef]
  27. Zhang, Y.T.; Liu, S.K.; Zhang, L.; Liu, C.; Liu, S.C.; Cui, Z.Q. Assessment method for power system transient stability with missing data. Proc. CSU-EPSA 2023, 35, 59–68. [Google Scholar]
  28. Bai, X.X.; Liu, W.; Wu, B.B.; Liu, S.H.; Liu, X.Y.; Hao, Y.; Liang, W.Z.; Lin, S.M.; Luo, L.N.; Zhao, S.; et al. Emission characteristics and inventory of volatile organic compounds from the Chinese cement industry based on field measurements. Environ. Pollut. 2023, 316, 120600. [Google Scholar] [CrossRef] [PubMed]
  29. Bai, X.X.; Tian, H.Z.; Liu, X.Y.; Wu, B.B.; Liu, S.H.; Hao, Y.; Luo, L.N.; Liu, W.; Zhao, S.; Lin, S.M.; et al. Spatial-temporal variation characteristics of air pollution and apportionment of contributions by different sources in Shanxi province of China. Atmos. Environ. 2021, 244, 117926. [Google Scholar] [CrossRef]
  30. Liu, X.Y.; Li, N.; Mu, H.L.; Li, M.; Liu, X.X. Multiobjective optimization and parameters study of hybrid offshore wind and pumped hydrostorage power system: Modeling and case study. J. Renew. Sustain. Energy 2021, 13, 049825. [Google Scholar] [CrossRef]
  31. Gurney, K.R.; Song, Y.; Liang, J.M.; Roest, G. Toward accurate, policy-relevant fossil fuel CO2 emission landscapes. Environ. Sci. Technol. 2020, 54, 9896–9907. [Google Scholar] [CrossRef]
  32. US EPA. Guidance on the Use of Models and Other Analyses for Demonstrating Attainment of Air Quality Goals for Ozone, PM2.5, and Regional Haze; Office of Air and Radiation/Office of Air Quality Planning and Standards: Research Triangle Park, NC, USA, 2007.
  33. Chemel, C.; Sokhi, R.S.; Yu, Y.; Hayman, G.D.; Vincent, K.J.; Dore, A.J.; Tang, Y.S.; Prain, H.D.; Figher, B.E.A. Evaluation of a CMAQ simulation at high resolution over the UK for the calendar year 2003. Atmos. Environ. 2010, 44, 2927–2939. [Google Scholar] [CrossRef]
  34. Wang, L.T.; Wei, Z.; Yang, J.; Zhang, Y.; Zhang, F.F.; Su, J.; Meng, C.C.; Zhang, Q. The 2013 severe haze over southern Hebei, China: Model evaluation, source apportionment, and policy implications. Atmos. Chem. Phys. 2014, 14, 3151–3173. [Google Scholar] [CrossRef]
  35. He, K.B. Technical Manual for Compilation of Air Pollution Emission Inventory; Tsinghua University: Beijing, China, 2018. [Google Scholar]
Disclaimer/Publisher’s Note: The statements, opinions, and data contained in all publications are solely those of the individual author(s) and contributor(s) and not of MDPI and/or the editor(s). MDPI and/or the editor(s) disclaim responsibility for any injury to people or property resulting from any ideas, methods, instructions or products referred to in the content.
Figure 1. Comparison of monthly cement production (green column), obtained from the Tangshan Monthly Statistical Report (https://www.tangshan.gov.cn/zhuzhan/sjfb/index.html, accessed on 25 July 2024), with normalized electricity consumption in the cement industries (black line) in 2019.
Atmosphere 15 00895 g001
Figure 2. Daily emission patterns of PM2.5, SO2, and NOx from the cement industry in China’s Tangshan City for the year 2019.
Atmosphere 15 00895 g002
Figure 3. Hourly PM2.5 emission patterns in different seasons from clinker production enterprises (a,c,e,g) and separate cement grinding stations (b,d,f,h) in China’s Tangshan City for the year 2019 (spring: February–April; summer: May–July; autumn: August–October; winter: November–January).
Atmosphere 15 00895 g003
Figure 4. Comparisons of hourly simulation concentrations of PM2.5 (a), SO2 (b), and NO2 (c) based on the optimized emission inventory estimated in this study (optimized simulation) and the traditional emission inventory published by the MEIC (original simulation) (note: the corresponding performance statistics are shown in (d)).
Atmosphere 15 00895 g004
Table 1. Comparison of pollutant emissions and concentrations.
CategoryCement IndustriesSourceSO2NOxPM2.5
Emissions (t)Clinker production enterprisesThis study13,930.0212,532.389160.61
MEIC14,036.0412,768.709223.31
Separate cement grinding stationsThis study//5154.02
MEIC//5208.98
CategorySimulation PeriodMeasuresSO2NO2PM2.5
Hourly Concentrations (μg/m3)9–14 JanuaryR0.630.550.61
RMSE (μg/m3)15.0950.3797.95
NMB (%)51.62−48.80−47.55
NME (%)54.6848.8051.44
19–24 NovemberR0.870.960.77
RMSE (μg/m3)18.2020.2732.82
NMB (%)38.32−30.4112.08
NME (%)41.4430.4136.54
Note: correlation coefficient (R); root mean square error (RMSE); normalized mean bias (NMB); normalized mean error (NME).
Disclaimer/Publisher’s Note: The statements, opinions and data contained in all publications are solely those of the individual author(s) and contributor(s) and not of MDPI and/or the editor(s). MDPI and/or the editor(s) disclaim responsibility for any injury to people or property resulting from any ideas, methods, instructions or products referred to in the content.

