Article

Analysis of a Rainstorm Process in Nanjing Based on Multi-Source Observational Data and Lagrangian Method

1
Nanjing Meteorological Bureau, Nanjing 210019, China
2
Key Laboratory of Ministry of Education for Meteorological Disasters/Joint International Research Laboratory of Climate and Environment Change/Collaborative Innovation Center on Forecast and Evaluation of Meteorological Disasters, Nanjing University of Information Science and Technology, Nanjing 210044, China
*
Authors to whom correspondence should be addressed.
Atmosphere 2024, 15(8), 904; https://doi.org/10.3390/atmos15080904
Submission received: 6 July 2024 / Revised: 26 July 2024 / Accepted: 27 July 2024 / Published: 29 July 2024

Abstract

:
Using multi-source observation data including automatic stations, radar, satellite, new detection equipment, and the Fifth Generation European Centre for Medium-Range Weather Forecasts Reanalysis (ERA-5) data, along with the Hybrid Single-Particle Lagrangian Integrated Trajectory (HYSPLIT) platform, an analysis was conducted on a rainstorm process that occurred in Nanjing on 15 June 2020, with the aim of providing reference for future urban flood control planning and heavy rainfall forecasting and early warning. The results showed that this rainstorm process was generated under the background of an eastward-moving northeast cold vortex and a southward retreat of the Western Pacific Subtropical High. Intense precipitation occurred near the region of large top brightness temperature (TBB) gradient values or the center of low TBB values on the northern side of the convective cloud cluster. During the heavy precipitation period, the differential propagation phase shift rate (KDP), differential reflectivity factor (ZDR), and zero-lag correlation coefficient (ρHV) detected by the S-band dual-polarization radar all increased significantly. The vertical structure of the wind field detected by the wind profile radar provided a good indication of changes in precipitation intensity, showing a strong correspondence between the timing of maximum precipitation and the intrusion of upper-level cold air. The abrupt increase in the integrated liquid water content observed by the microwave radiometer can serve as an important indicator of the onset of stronger precipitation. During the Meiyu season in Nanjing, convective precipitation was mainly composed of small to medium raindrops with diameters less than 3 mm, with falling velocities of raindrops mainly clustering between 2 and 6 m·s−1. The rainstorm process featured four water vapor transport channels: the mid-latitude westerly channel, the Indian Ocean channel, the South China Sea channel, and the Pacific Ocean channel. During heavy rainfall, the Pacific Ocean water vapor channel was the main channel at the middle and lower levels, while the South China Sea water vapor channel was the main channel at the upper level, both accounting for a trajectory proportion of 34.2%.

1. Introduction

Heavy rainfall, especially large-scale precipitation formed in a short period of time, can lead to urban flash floods, causing waterlogging and resulting in significant economic losses and casualties [1]. Against the backdrop of global warming, extreme precipitation events are becoming more frequent, especially short-term heavy rainfall events that show an increasing trend [2,3,4]. The study of Liang and Ding [5] indicates that urbanization influences have led to an increase in the frequency and intensity of extreme precipitation in the major cities along the coastal areas in China and the Yangtze River Economic Belt.
In the past few decades, many scholars have conducted research on heavy rainfall from different aspects, such as the weather systems and formation mechanisms of heavy rainfall [6,7,8], structural analysis and dynamic processes of rainstorm mesoscale systems [9,10,11,12], impact of terrain on precipitation [13,14,15], role of tropical atmospheric rivers in global heavy rainfall events [16,17,18], water vapor transport during heavy rainfall events [19,20], and numerical simulation of heavy rainfall [21,22]. These studies have all played a positive role in the forecasting of heavy rainfall. In addition, the method based on Lagrangian models has been widely applied to trace the pathways of moisture transport and changes in physical quantities along the pathways in recent years [23,24,25,26]. Guo et al. [27] compared the impact and water vaper characteristics between two types of floods in Eastern China and found that the most important moisture source for HR-induced floods in three study regions is all from East China. Shi et al. [28] quantitatively determined the water vapor transport paths and water vapor contributions on different vertical layers in each rainy season and concluded that the main source regions during the Jianghuai Meiyu season are the middle and lower levels of Eastern China and the western Pacific region.
However, due to the complex formation mechanism of extreme rainstorms, especially small-scale and sudden extreme rainstorms, there are often deviations in the forecast of the affected areas and intensity at present. In recent years, some new types of detection data with high spatiotemporal resolution have been applied in the study of rainstorms. Van et al. [29] analyzed the comprehensive relationships between kinetic energy and rainfall intensity based on precipitation measurements from an OTT Parsivel2 optical disdrometer. Zhou et al. [30] indicated that convective precipitation has a larger average raindrop diameter, lower number concentration, and higher precipitation intensity. Zhang et al. [31] analyzed the water vapor characteristics of short-term heavy rain in midsummer using microwave radiometer data. They concluded that the sum of surface vapor density (VD) and two times the 500 hPa height VD 1 h before rainfall reached 26.3 g·m−3 can be used as a judging index for the occurrence of short-term heavy rainfall. Chen Juan et al. [32] analyzed the relationship between the low-level jet of the wind profiler radar and the precipitation enhancement in the Meiyu front heavy rainfall process in Jiangxi, indicating that the advance was about 2 h and the vertical wind shear of the horizontal wind was 1 to 3 h earlier than the precipitation enhancement. Wang et al. [33] analyzed the polarization characteristics and cloud microphysical characteristics of a severe rainstorm in the southeast of Jiangsu using dual-polarization radar and other data. They concluded that the microphysical processes of the ice above the melting layer are important for the occurrence and enhancement of precipitation. In addition, the Fengyun satellite and radar data assimilation also play a good role in monitoring and forecasting heavy rain weather [34,35,36]. Most of these studies focus on the analysis of a single new type of detection data. Currently, there are few studies that comprehensively analyze heavy rainfall events using multi-source observational data.
On 15 June 2020, Nanjing experienced its first strong precipitation process since the onset of the Meiyu season. Many roads were severely flooded, with flash floods occurring in some areas of Jiangning and local landslide hazards leading to the emergency evacuation of hundreds of residents. This event had a significant impact on urban operations, road traffic, production, and daily life. Zhao et al. [22] conducted numerical simulations of this rainstorm process using the WRF model, and the results showed that the introduction of various new-type data before the numerical simulation can reduce the forecast deviation. This paper not only analyzed the observational facts such as satellite imagery, dual-polarization radar, microwave radiometer, wind profiler radar, and laser precipitation spectrometer of this event but also focused on the relationship between new types of detection data and precipitation intensity. Additionally, using the Lagrangian trajectory tracking model, the three-dimensional characteristics of water vapor transport during this heavy rainfall process were analyzed, providing a reference for future urban flood control planning, heavy rainfall forecasting, and early warning.

2. Data, Instruments, and Methods

The data used in this study includes precipitation data from the automatic stations in the East China region, ERA5 hourly reanalysis data (which has a spatial resolution of 0.25° × 0.25°), top brightness temperature (TBB) data from FY-2G infrared cloud images, microwave radiometer data, wind profiler radar data, radiosonde data and laser precipitation spectrometer data from the Nanjing National Reference Climatological Station (hereinafter referred to as the Nanjing Station), as well as S-band dual-polarization radar data from Nanjing Longwangshan.
The MP-3000A microwave radiometer is a new type of 35-channel microwave radiometer developed by the American company Radiometrics. It can retrieve temperature, relative humidity, water vapor density, and liquid water profiles from the ground to an altitude of 10 km by receiving sky brightness temperature and scanning every 2 to 3 min. The CLC-11-D fixed boundary layer wind profiler radar is a pulse Doppler radar that can continuously detect the boundary layer horizontal wind direction, horizontal wind speed, vertical velocity, and power spectrum data in all weather conditions, with a vertical detection range of 100 m to 10 km and a detection frequency of 6 min. The OTT Parsivel1 laser disdrometer is an advanced optical particle measurement instrument based on laser measurement, which can classify detected precipitation particles and measure and calculate the size and velocity of precipitation particles at the same time. It has 32 size channels and 32 velocity channels, with a sampling interval of 1 min. The S-band dual-polarization radar observation mode is a dual-transmitter and dual-receiver mode, which can obtain three radar parameters similar to those of conventional Doppler radars: horizontal reflectivity ZH, Doppler radial velocity V, and spectrum width W. It can also obtain differential reflectivity factor ZDR, differential phase shift ΦDP, differential propagation phase shift rate KDP, and zero-lag correlation coefficient ρHV, with 9 elevation angles for each volume scan and a detection frequency of 6 min.
The National Oceanic and Atmospheric Administration Hybrid Single-Particle Lagrangian Integrated Trajectory (HYSPLIT) model [37] is a model system that can handle different meteorological data inputs, different physical processes, and different emission sources, including transportation, diffusion, and deposition processes. It is a Lagrangian calculation model that can be applied to backward trajectory analysis to determine the source of air masses and establish the relationship between the source and sink.
In this study, the definitions of light rainfall and heavy rainfall are provided in Table 1.

3. Precipitation Observation and Circulation Background

3.1. Precipitation Observation

Under the influence of Meiyu front, a large-scale rainstorm occurred in Nanjing on 15 June 2020, with some areas reaching heavy torrential rain. The main heavy rainfall areas were located along the line from Pukou Qiaolin through Jiangning Hengxi to Lishui Dongping (Figure 1a). From 20:00 on 14 June to 20:00 on 15 June (Beijing time, the same below), 63 automatic stations in Nanjing registered rainfall greater than 50 mm, while 29 of these stations logged over 100 mm of rainfall. The maximum rainfall was 271.2 mm (Jiangning Lulang), reaching the level of extraordinary torrential rain and also being the national center of precipitation for that day.
From the hourly rainfall variation graph of Jiangning Lulang Station (Figure 1b), light rainfall started around 04:00 on 15 June, and the precipitation increased significantly from 07:00 to 10:00. The rainfall intensity exceeded 70 mm·h−1 continuously for 3 h, with a total accumulation of 221.2 mm within 3 h, making it historically rare. After 12:00, the rainfall notably decreased. It can be seen that this rainstorm process has the characteristics of concentrated heavy rainfall, intense short-term precipitation, and large cumulative rainfall.

3.2. Circulation Background

The occurrence and development of heavy rainfall during the Meiyu season are closely related to large-scale circulation patterns. At 20:00 on 14 June 2020, the 500 hPa geopotential height field over the mid-high latitudes of Eurasian exhibited a pattern of two troughs and one ridge. In the eastern part of Northeast China, there was a cold vortex with a cold center of −16 °C behind it. The subtropical high-pressure ridge line at 120° E was near 25° N, and the 588 line was located in the Huai River Basin. With the eastward movement of the cold vortex, by 08:00 on 15 June 2020 (Figure 2b), the subtropical high-pressure ridge line at 120° E descended southward to 22° N, while the 588 line moved southward to the Yangtze River Basin. At that time, Nanjing was in the westerly flow on the edge of the 588 line, where the cold and warm air currents converged along southern Jiangsu, conducive to the formation of heavy rainfall. At 850 hPa (Figure 2c), cold air from the rear of the cold vortex penetrated and caused a shift to northwesterly winds near Nanjing, forming a cold front shear line between the northwest and southwest winds. The southwest airflow on the southern side intensified to 16 m·s−1, and the relative humidity exceeded 95%, which provided abundant water vapor and strengthened the dynamic uplifting for heavy rainfall. Meanwhile, at 200 hPa (Figure 2a), there was a westerly jet stream zone on the north side of the South Asian high, with a core of wind speeds over 50 m·s−1 located between 35° N to 40° N and 110° E to 170° E. Nanjing was situated in the divergent area on the right side of the upper-level jet entrance, where divergence at high altitudes was strong, providing favorable dynamic conditions for the development of heavy rainfall.
In summary, this was a short-term heavy rainfall process at the edge of the subtropical high under the background of the northeast cold vortex. The rainstorm occurred in the divergent area at 200 hPa, the left front of the low-level jet stream, and the convergence of cold and warm air flows near the low-level shear line.

4. Analysis of Satellite and Radar Observation

4.1. Characteristics of Mesoscale Convective Cloud Clusters

Mesoscale convective cloud clusters are manifestations of mesoscale convective systems on satellite cloud images, and TBB data can better reflect the occurrence, development, and dissipation of strong convective systems. According to the evolution of TBB from the FY-2G infrared cloud images (Figure 3), at 05:00 on 15 June, there was a convective cloud cluster to the west of Nanjing, with TBB ≤ −62 °C in the center, and an eastward band-shaped mesoscale cloud cluster with TBB ≤ −32 °C. From 06:00 to 07:00, the mesoscale cloud cluster east of Nanjing intensively developed in place, while the convective cloud cluster to the west intensified and expanded eastward. The two cloud clusters gradually merged, forming an east-west oriented mesoscale convective system (MCS). The area with TBB ≤ −62 °C significantly increased and extended over Nanjing. Coinciding with this, precipitation in Nanjing gradually intensified, with hourly rainfall amounts starting to reach ≥20 mm. After 07:00, with the strengthening of the low-level southwest jet, the convective cloud cluster moved eastward and continued to intensify. By 10:00, most of the areas along the south of Jiangsu were covered by the area with TBB ≤ −62 °C, and a low-value center of TBB ≤ −72 °C appeared in the central and southern parts of Nanjing.
During the development of the MCS, it consistently maintained an eccentric structure, with the isotherms of the TBB line converging toward the north. The gradient of the brightness temperature in the northern part of the convective cloud cluster was significantly greater than that in the southern part. In conjunction with the distribution of hourly precipitation from 07:00 to 10:00, multiple stations in Nanjing recorded hourly rainfall exceeding 40 mm, all of which occurred near the region with large TBB gradient values or the center of low TBB values on the northern side of the convective cloud cluster. The areas of heavy rainfall showed characteristics of movement along with the low TBB value areas. It can be seen that the lower the TBB value and the longer its duration, the greater the precipitation intensity and the larger the accumulated rainfall.

4.2. Characteristics of Radar Echoes

Weather radar is one of the main tools for detecting precipitation systems. Compared to traditional weather radar and the new generation of weather radar, dual-polarization radar can further identify specific information such as the shape and size of precipitation particles, phase distribution, and types of precipitation through the analysis and inversion of parameters, showing obvious advantages in monitoring strong convective weather, such as short-term heavy rainfall. In this process, the evolution of the composite reflectivity factor from the S-band dual-polarization radar at Longwangshan in Nanjing (figure not shown) showed that convective cells in the northern part of Nanjing developed since 04:00 on 15 June. Then, the echoes continued to strengthen and expand, forming stratocumulus-mixed precipitation echoes dominated by cumulus clouds. From 07:00 to 10:00, as convective cloud clusters developed, strong echoes formed a train effect while continuously moving eastward, repeatedly passing over the central area of Nanjing. The maximum reflectivity reached over 60 dBz, resulting in persistent heavy precipitation. After 10:00, the strong echoes moved southward and affected the southern part of Nanjing, and after 12:00, the echoes weakened significantly, indicating the end of the heavy rainfall.
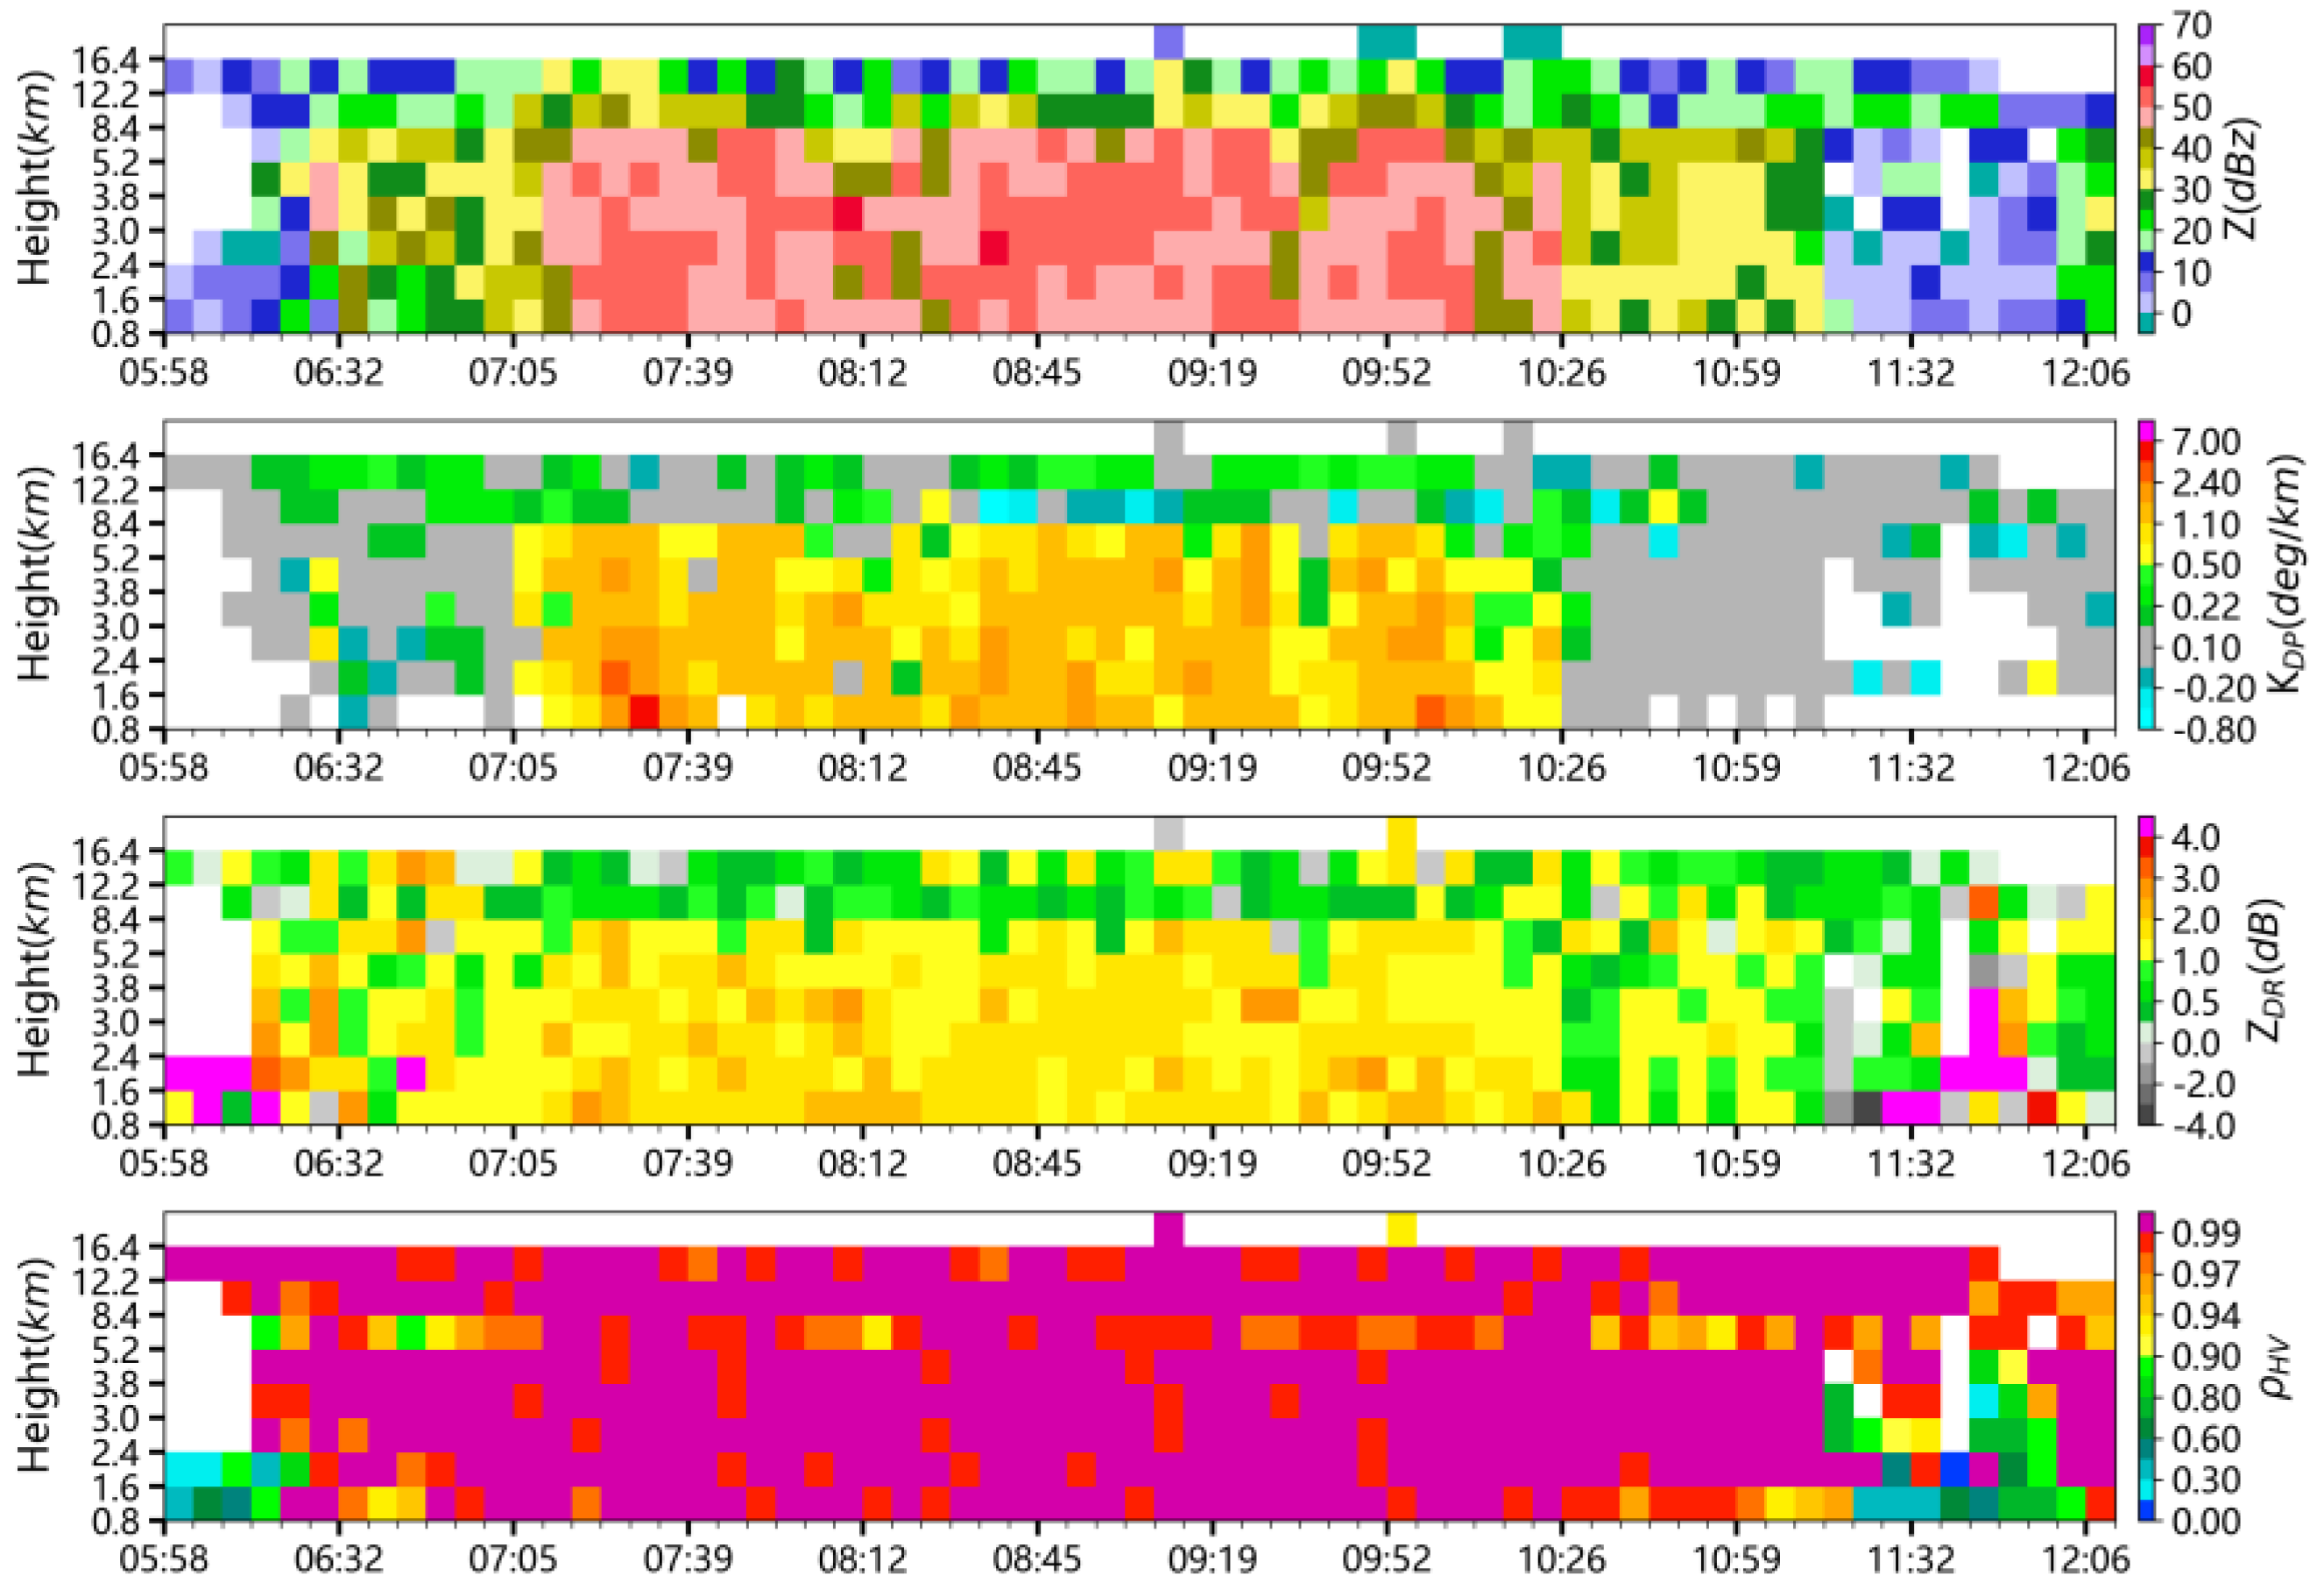
Figure 4 presents the time-height profile of reflectivity factor Z, differential phase shift rate KDP, differential reflectivity factor ZDR, and correlation coefficient ρHV from 06:00 to 12:00 on 15 June at Jiangning Lulang Station, which recorded the maximum rainfall during this event. It can be seen that before 07:11, the echo intensity in the 0–5 km altitude ranged from 20 to 45 dBz, with KDP values between 0–1 °/km and uneven distribution of ZDR and ρHV at high and low altitudes. As indicated above, the precipitation was mainly composed of small raindrops mixed with some large raindrops, which corresponded to light rainfall over Jiangning Lulang at that time. Subsequently, the echo intensity significantly increased. From 07:11 to 10:26, the echo top over Jiangning Lulang exceeded 12 km, with echo intensities in the 0–5 km altitude range reaching 45–55 dBz and strong echoes exceeding 50 dBz extending beyond 5 km, exhibiting clear convective precipitation characteristics. The high-intensity and low-centroid structures were maintained for approximately 3 h. Starting from 07:11, as the echoes developed and strengthened, KDP, ZDR, and ρHV over Jiangning Lulang significantly increased, with KDP reaching 1–5 °/km, ZDR reaching 1–3.5 dB and ρHV reaching above 0.97. This indicated that there was vigorous vertical upward motion during this phase, and the precipitation was dominated by dense and uniform large raindrops. The continuous maintenance of these high values resulted in 3 h of heavy rainfall at Jiangning Lu Lang. After 10:26, as all parameters decreased notably, the precipitation also weakened noticeably.

4.3. Characteristics of Upper and Lower Atmospheric Wind Fields

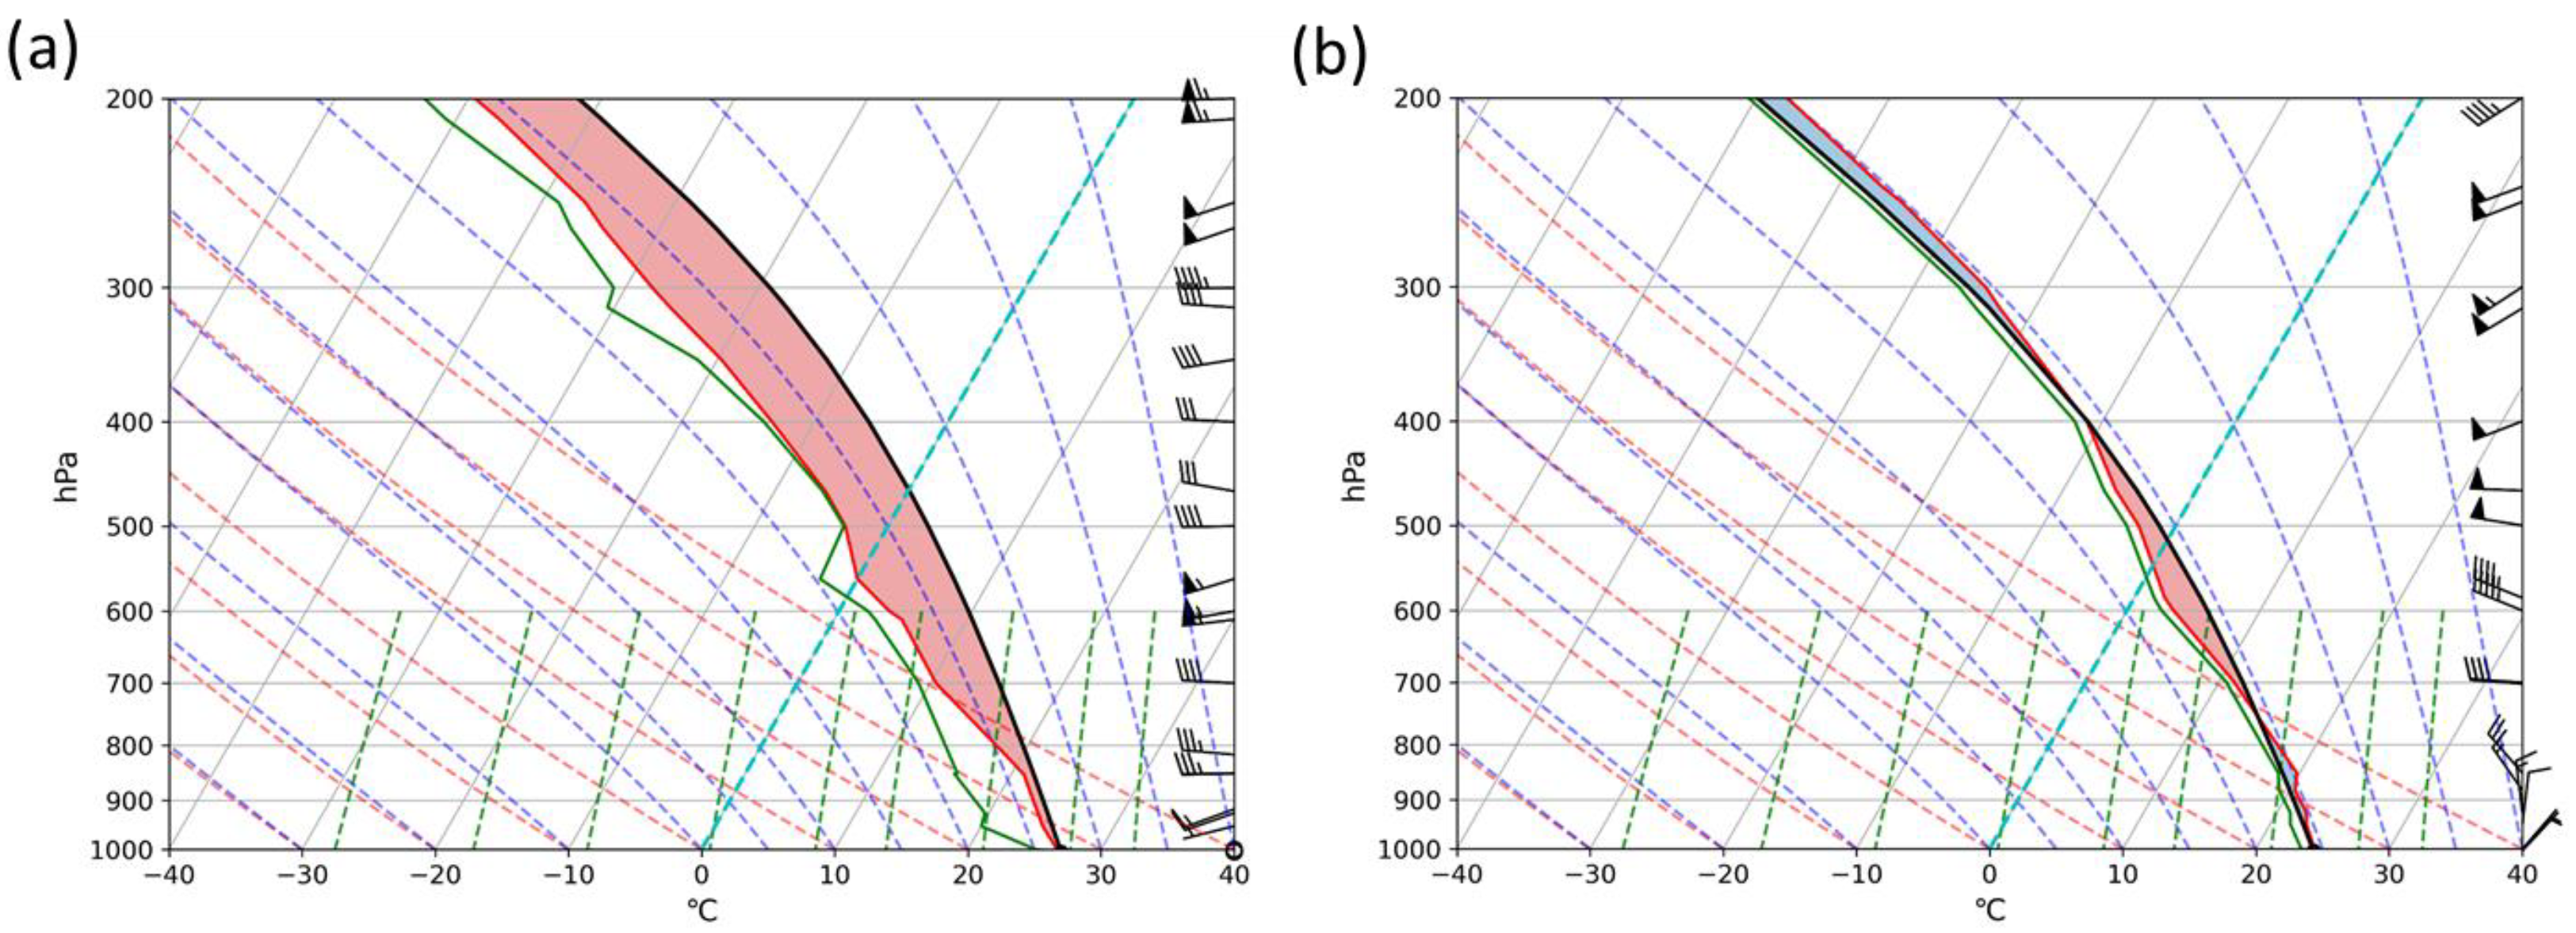
The upper air data possess very significant information for weather events like rainstorms. From the sounding data at Nanjing Station, at 20:00 on 14 June (Figure 5a), there were westerly to southwesterly winds below 700 hPa, and the wind throughout the layer turned with height, with warm advection transportation and continuous accumulation of unstable energy. The convective available potential energy (CAPE) reached 2807.7 J/kg. The relative humidity throughout the layer was not particularly high, and precipitation had not yet commenced. At 08:00 on 15 June (Figure 5b), the winds below 500 hPa turned northwesterly, and near the surface, they became northerlies, triggering the release of unstable energy. The CAPE decreased to 171.1 J/kg, and the relative humidity below 700 hPa increased significantly. Using the height between the lifting condensation level (LCL) and the melting layer height to estimate the warm cloud thickness shows that it was approximately 5.18 km, which was a relatively deep warm cloud layer and ensured the sufficient development of warm rain.
Wind profiler radars are capable of continuously remote sensing detection of atmospheric wind, temperature, and other meteorological parameters, providing a variety of data products primarily focused on wind fields. Liu et al. [38] assessed China’s wind profiler radar network and concluded that the observation data from most of the stations are recommended; the boundary layer wind profiles from China can provide useful input to numerical weather prediction systems at regional scales. In this study, we utilize the detailed wind field data from the wind profiler radar at Nanjing Station to further analyze the relationship between the variation in the vertical structure of the wind field above Nanjing and the intensity of the heavy precipitation event during this process.
Figure 6 shows the evolution of the wind field every 18 min from 03:00 to 15:00 on 15 June at Nanjing Station. It can be seen that before the onset of precipitation (03:00–04:00), the wind field below 500 m at Nanjing Station was relatively weak, predominantly easterly. Between 0.5–3 km, there was a consistent southwest airflow, and above 3 km, the wind was westerly. From 04:00 to 06:00, the near-surface wind speed gradually increased, and precipitation began half an hour later. However, due to the absence of the low-level jet in the middle and lower levels, the precipitation was primarily in the form of light rainfall. From 06:00 to 07:00, the southwesterly airflow at 2–3 km strengthened to 12 m/s, forming a jet stream, and the vertical wind shear at the middle and lower levels increased, leading to slight intensification of precipitation. Between 07:00 and 08:00, the wind below 1 km changed from east-south-easterly to northeasterly, and above 1 km, it changed from southwesterly to northwesterly, with both high and low-level wind speeds significantly increasing. At this time, the upper-level trough was passing, and the cold air from the rear of the cold vortex moved southward, triggering a notable intensification of convection. The hourly rainfall at Nanjing Station reached 40.1 mm. After 08:00, with the mid-upper levels being dominated by a consistent northwesterly wind and the atmospheric profile becoming more stable, the rainfall at the Nanjing Station weakened. In summary, during this rainstorm process, the increase in near-surface wind speed preceded the onset of precipitation by about half an hour. Precipitation intensified after the establishment of the southwesterly jet at the middle and lower levels. The period of the strongest precipitation corresponded well with the passage of the upper-level trough and the intrusion of cold air. The vertical structure of the wind field detected by the wind profiler radar provides a good indication of changes in precipitation intensity.

5. Analysis of Microwave Radiometer and Laser Disdrometer Observation

5.1. Characteristics of Local Water Vapor Variations

The occurrence of heavy rainfall requires sufficient water vapor conditions. In this paper, we utilize the water vapor density and liquid water content data from the microwave radiometer at Nanjing Station to analyze the characteristics of water vapor variation during this rainstorm process.
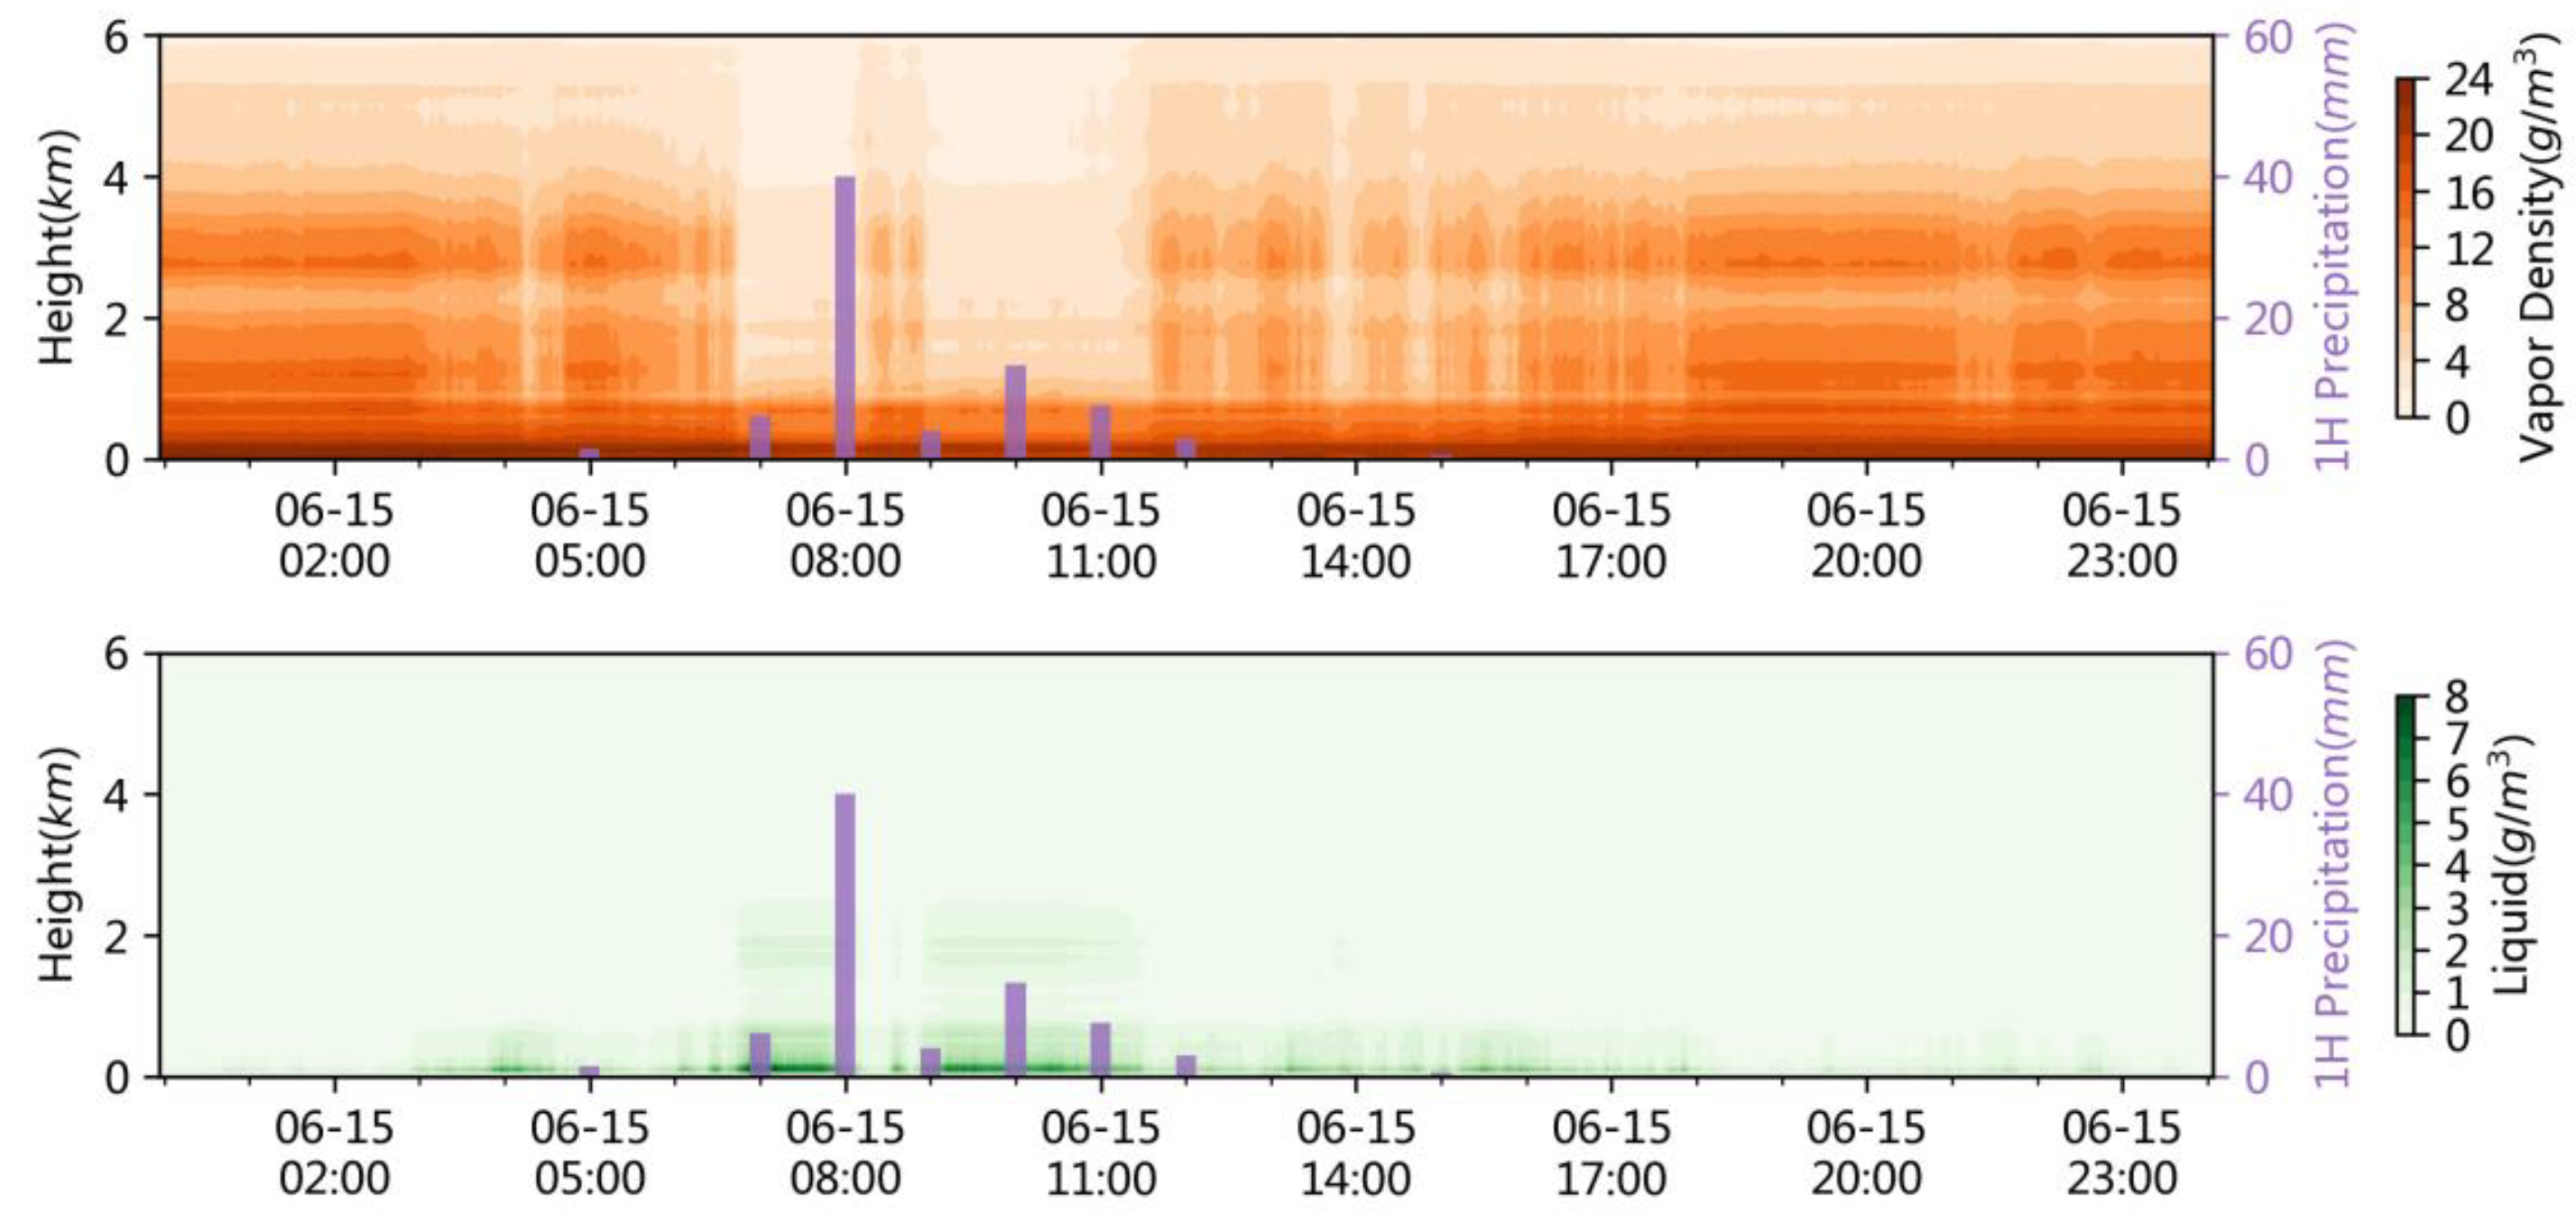
Figure 7 presents the profiles of water vapor density and liquid water content of the microwave radiometer and hourly rainfall at Nanjing Station from 00:00 on 15 June to 00:00 on 16 June. It can be observed that before the onset of precipitation (00:00–04:00), the water vapor density below 3.5 km was relatively high, exceeding 10 g·m−3. The maximum water vapor density was below 300 m near the ground, reaching 22–24 g·m−3. The liquid water content was larger below 500 m, reaching a maximum of 5.6 g·m−3, while above 800 m, the liquid water content was minimal. This indicates a significant accumulation of water vapor in the middle and lower layers before the rainstorm process. During the main precipitation period (06:00–12:00), the water vapor density below 800 m slightly decreased by 2–3 g·m−3, while the water vapor density above 800 m decreased significantly, with the maximum decrease occurring between 07:00–08:00, where the water vapor density at 3 km decreased by 11 g·m−3, corresponding to the maximum hourly rainfall during that period. Meanwhile, the liquid water content significantly increased below 1 km, which was consistent with the strong convergence center of the water vapor flux divergence at 925 hPa from the reanalysis data (figure not shown). The maximum value appeared at 100 m height during 07:00–08:00, reaching 8.7 g·m−3, also corresponding to the period of heaviest rainfall. When the hourly rainfall decreased to 4.1 mm between 08:00–09:00, there was a brief increase in the overall water vapor density and a slight decrease in the liquid water content. From 09:00–11:00, as the precipitation slightly intensified, the overall water vapor density decreased again, accompanied by an increase in the liquid water content.
The above analysis indicates that during this event, due to the convergence of water vapor in the lower layers, both water vapor density and liquid water content were maximum in the lower layers. During the precipitation period, the overall water vapor density decreased while the lower layer liquid water content increased, showing an inverse relationship. This was caused by water vapor condensing into raindrops that fell to the ground. Moreover, the intensity changes in both water vapor density and liquid water content demonstrate a good correspondence with the variations in hourly precipitation. This conclusion does not entirely align with the findings of Zhang et al. [31], who found that during a short-duration heavy rainfall event in Chengdu, the convergence of water vapor increased the atmospheric humidity, with an increase in water vapor density in the lower levels and a decrease in the upper levels. This discrepancy may be related to the influence of different weather systems.
Further calculations were performed for the hourly average total column-integrated water vapor content and total column-integrated liquid water content and their correlation with hourly rainfall at Nanjing Station from 00:00 on the 15th to 00:00 on the 16th. The correlation coefficient between the total column-integrated water vapor content and hourly rainfall was −0.64, and that between the total column-integrated liquid water content and hourly rainfall was 0.73, both passing the 95% confidence test. This indicates a negative correlation between hourly rainfall and the total column-integrated water vapor content and a positive correlation with the total column-integrated liquid water content. To discuss the variations in the total column-integrated water vapor and the total column-integrated liquid water corresponding to different intensities of precipitation, the rainfall intensity (R, unit: mm·h−1)at Nanjing Station during this event was categorized into five categories: R = 0, 0 < R ≤ 5, 5 < R ≤ 10, 10 < R ≤ 20, and R > 20. As shown in Table 2, as the rainfall intensity increased, the average total column-integrated water vapor content showed a slow downward trend. Except for a 16% decrease in water vapor content from 0 mm·h−1 < R ≤ 5 mm·h−1 to 5 mm·h−1 < R ≤ 10 mm·h−1, the decrease in water vapor content between the other two adjacent categories was less than 5%, and the water vapor content changed little after R > 10 mm·h−1. In contrast, the average value of the total column-integrated liquid water content increased significantly with increasing rainfall intensity. The liquid water content for 0 mm·h−1 < R ≤ 5 mm·h−1 was 2.5 times that of no precipitation. For 5 mm·h−1 < R ≤ 10 mm·h−1, it was 2.6 times that of 0 mm·h−1 < R ≤ 5 mm·h−1 and 6.5 times that of no precipitation. After R > 10 mm·h−1, the rate of increase in the total column integral liquid water content decreased significantly. Compared to the total column-integrated water vapor content, the total column-integrated liquid water content was more sensitive to changes in rainfall intensity, and its abrupt increase can serve as an important indicator for the onset of heavier rainfall.

5.2. Characteristics of Precipitation Particles during the Meiyu Season

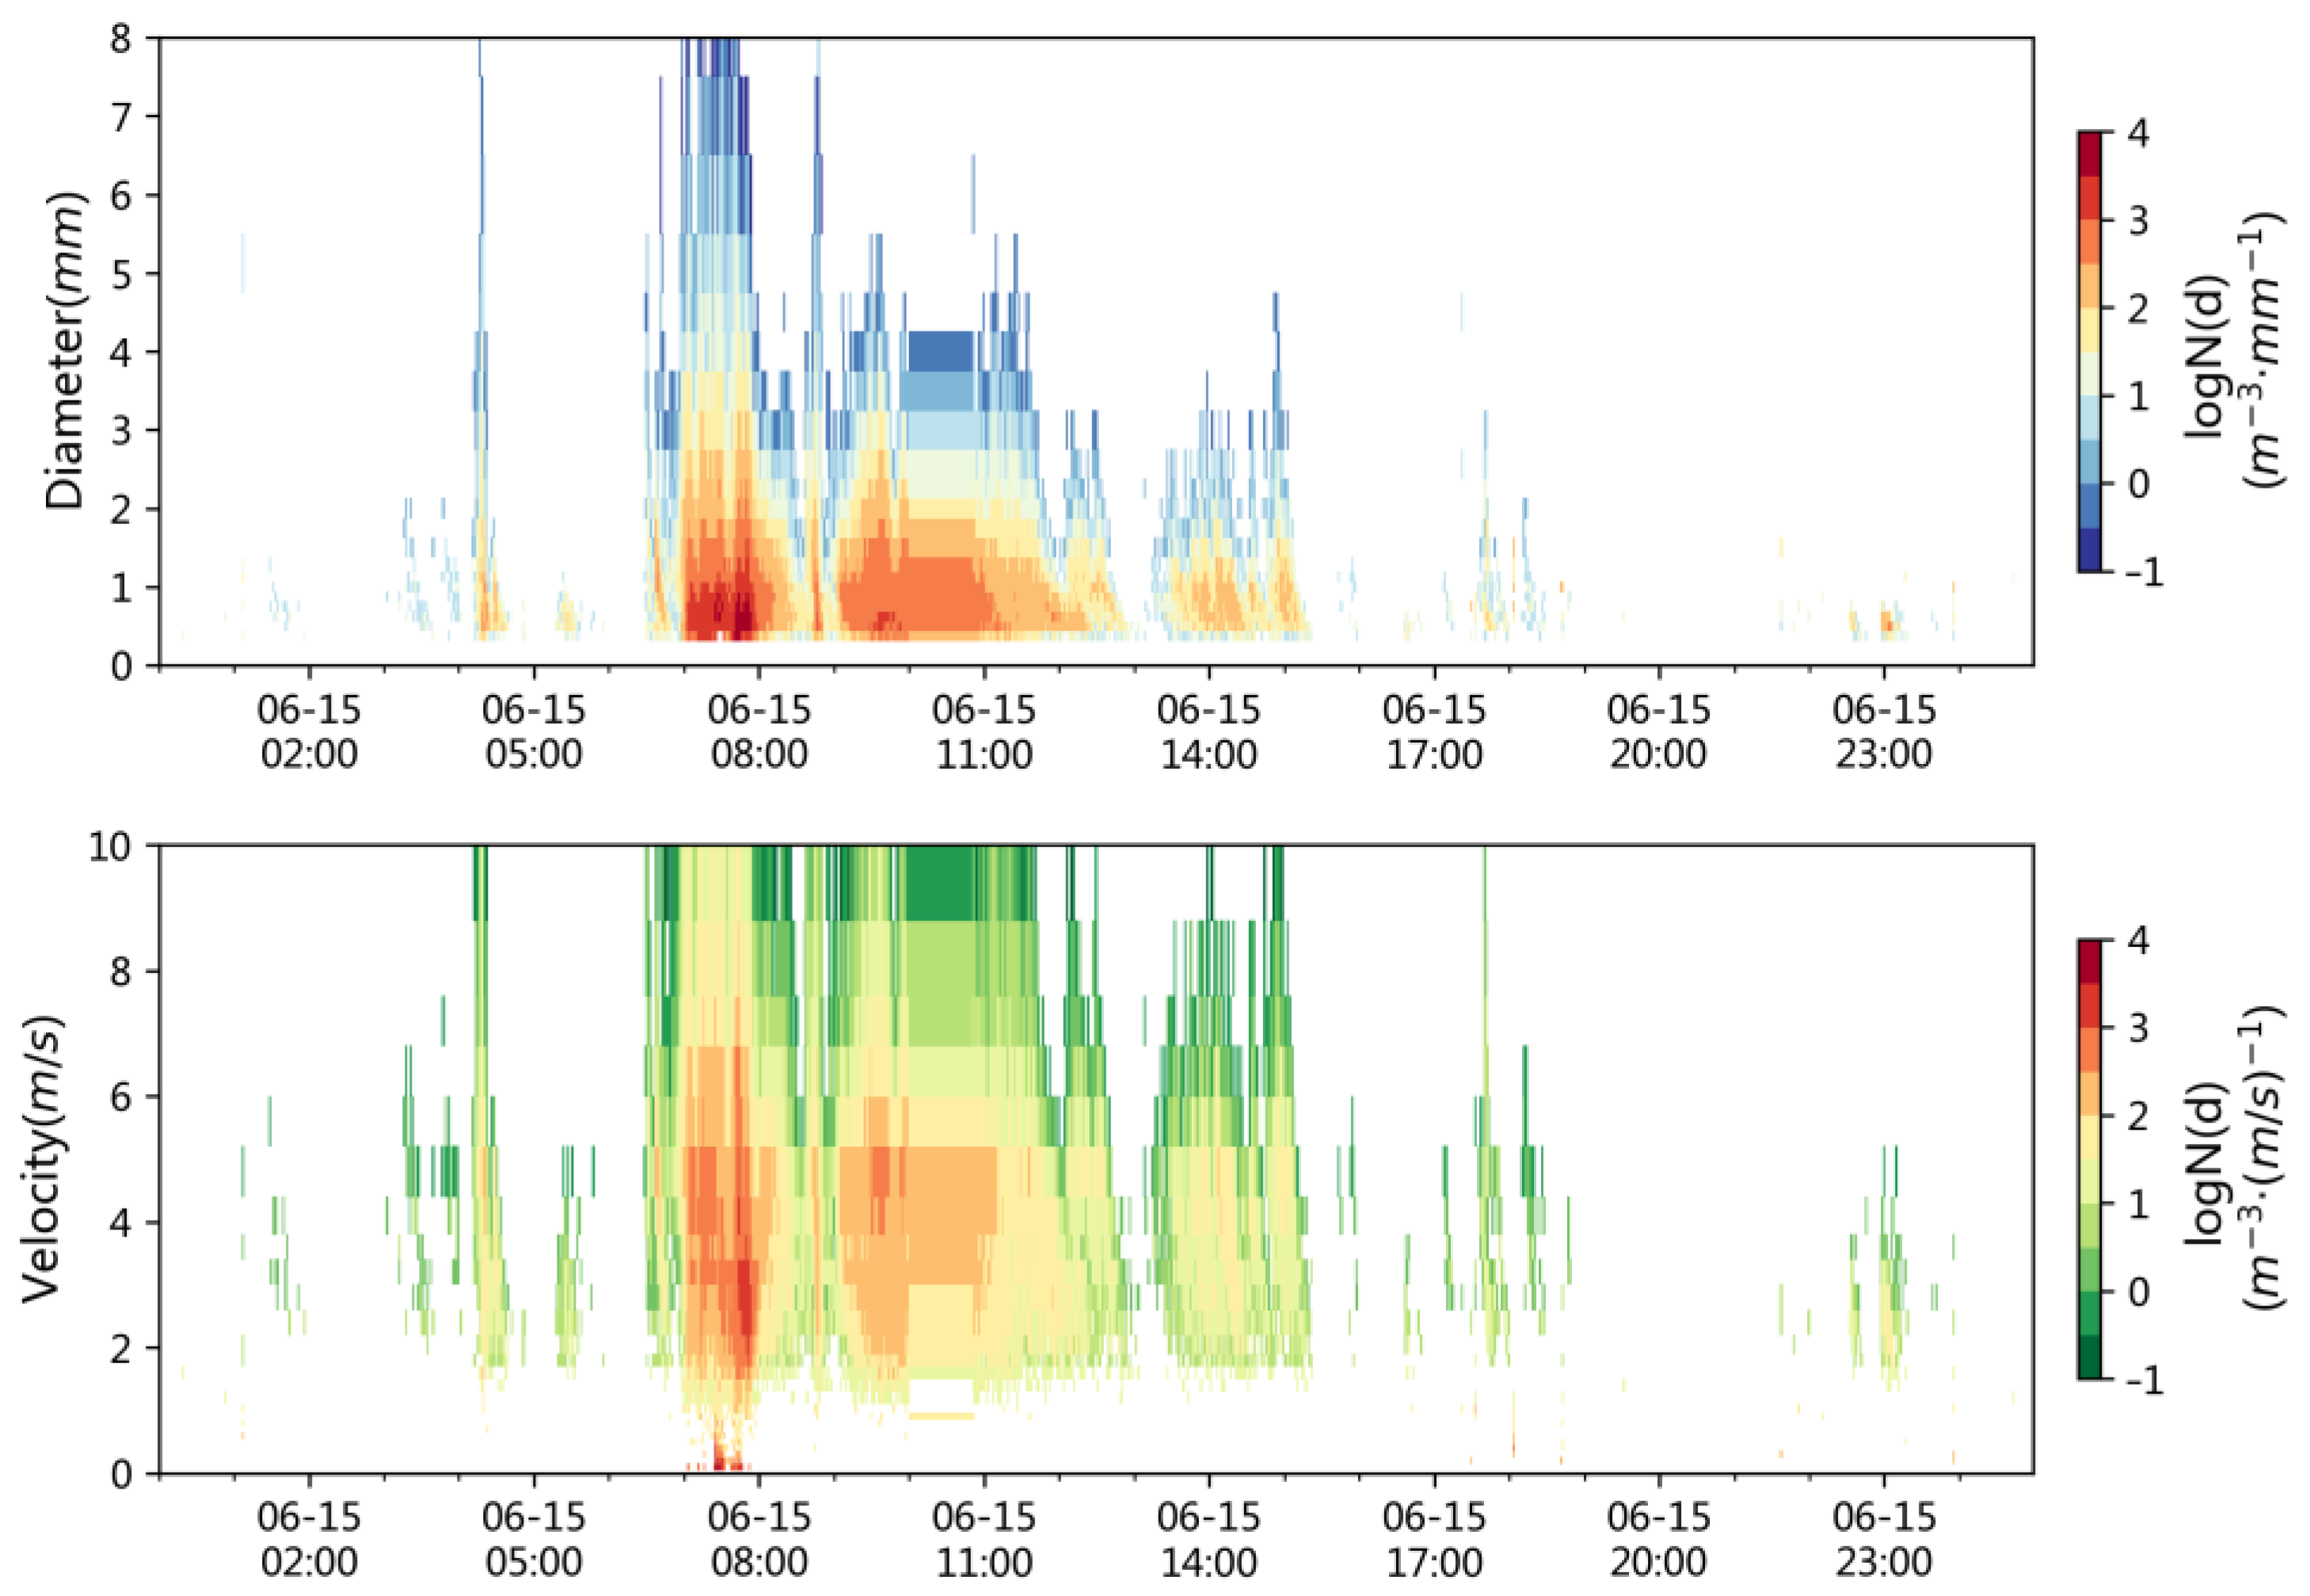
This section analyzes the microphysical characteristics of precipitation particles during this rainstorm process in the Meiyu season using laser disdrometer data from Nanjing Station. The variation over time of raindrop concentration, diameter, and falling velocity at Nanjing Station from 00:00 on the 15th to 00:00 on the 16th can be seen in Figure 8. It was observed that during the precipitation period, most raindrop diameters were below 3 mm, primarily consisting of small-to-medium-sized raindrops. The highest concentration of raindrops was observed in those with diameters below 1 mm, and the falling velocities of the precipitation particles were mostly in the range of 2–6 m·s−1. During the short-term heavy precipitation period from 07:00 to 08:00, there was a significant increase in raindrop concentration, diameter, and falling velocity, with the maximum lgN(D) reaching 3.9. There was a significant increase in the number of large raindrops with diameters exceeding 3 mm, with the largest raindrop diameters exceeding 6 mm, possibly due to the coalescence of raindrops during their descent. Additionally, a considerable number of precipitation particles reached falling velocities of 6–10 m·s−1, demonstrating the microphysical characteristics of convective precipitation from cumulonimbus clouds. This conclusion is consistent with the analysis by Wang Kun et al. [33], who found that during a typhoon-induced heavy rain event in Jiangsu, there was a noticeable increase in the number of raindrops with diameters greater than 4 mm during periods of intense precipitation.
Calculations during the short-term heavy precipitation period showed that the proportions of raindrop counts within the diameter ranges (D) of D < 1 mm, 1 mm < D < 3 mm, and D > 3 mm were 61.6%, 33.7%, and 4.8%, respectively. For the falling velocity ranges (V) of V < 2 m·s−1, 2 m·s−1 < V < 4 m·s−1, 4 m·s−1 < V < 6 m·s−1, 6 m·s−1 < V < 8 m·s−1, and V > 8 m·s−1, the proportions of raindrop counts were 4.4%, 40.4%, 39.0%, 8.5%, and 7.7%, respectively. This indicates that during the Meiyu season in Nanjing, convective precipitation was mainly composed of small to medium raindrops with diameters less than 3 mm, with most raindrops being less than 1 mm, and the falling velocities of raindrops mainly concentrated between 2 and 6 m·s−1.

6. Three-Dimensional Characteristics of Water Vapor Transport

To track the water vapor source of this rainstorm, the HYSPLIT model was used to conduct a backward trajectory analysis of precipitation in the Nanjing region. The initial positions for trajectory tracking were selected from five stations in the Nanjing area. The starting heights ranged from 250 to 6000 m above sea level, with each layer being 250 m, totaling 24 layers. The initial positions of the air masses were further divided into three parts according to height: below 2000 m was designated as the lower troposphere (lower layer), 2000–4000 m as the mid-lower troposphere (middle layer), and above 4000 m as the mid-upper troposphere (upper layer). The initial time for the trajectories was selected from 20:00 on 14 June to 20:00 on 15 June, with each air mass traced backward for five days. Then, the three-dimensional positions and physical characteristics such as temperature, pressure, wind, and humidity were output every 3 h to obtain the transport trajectory of each air mass.
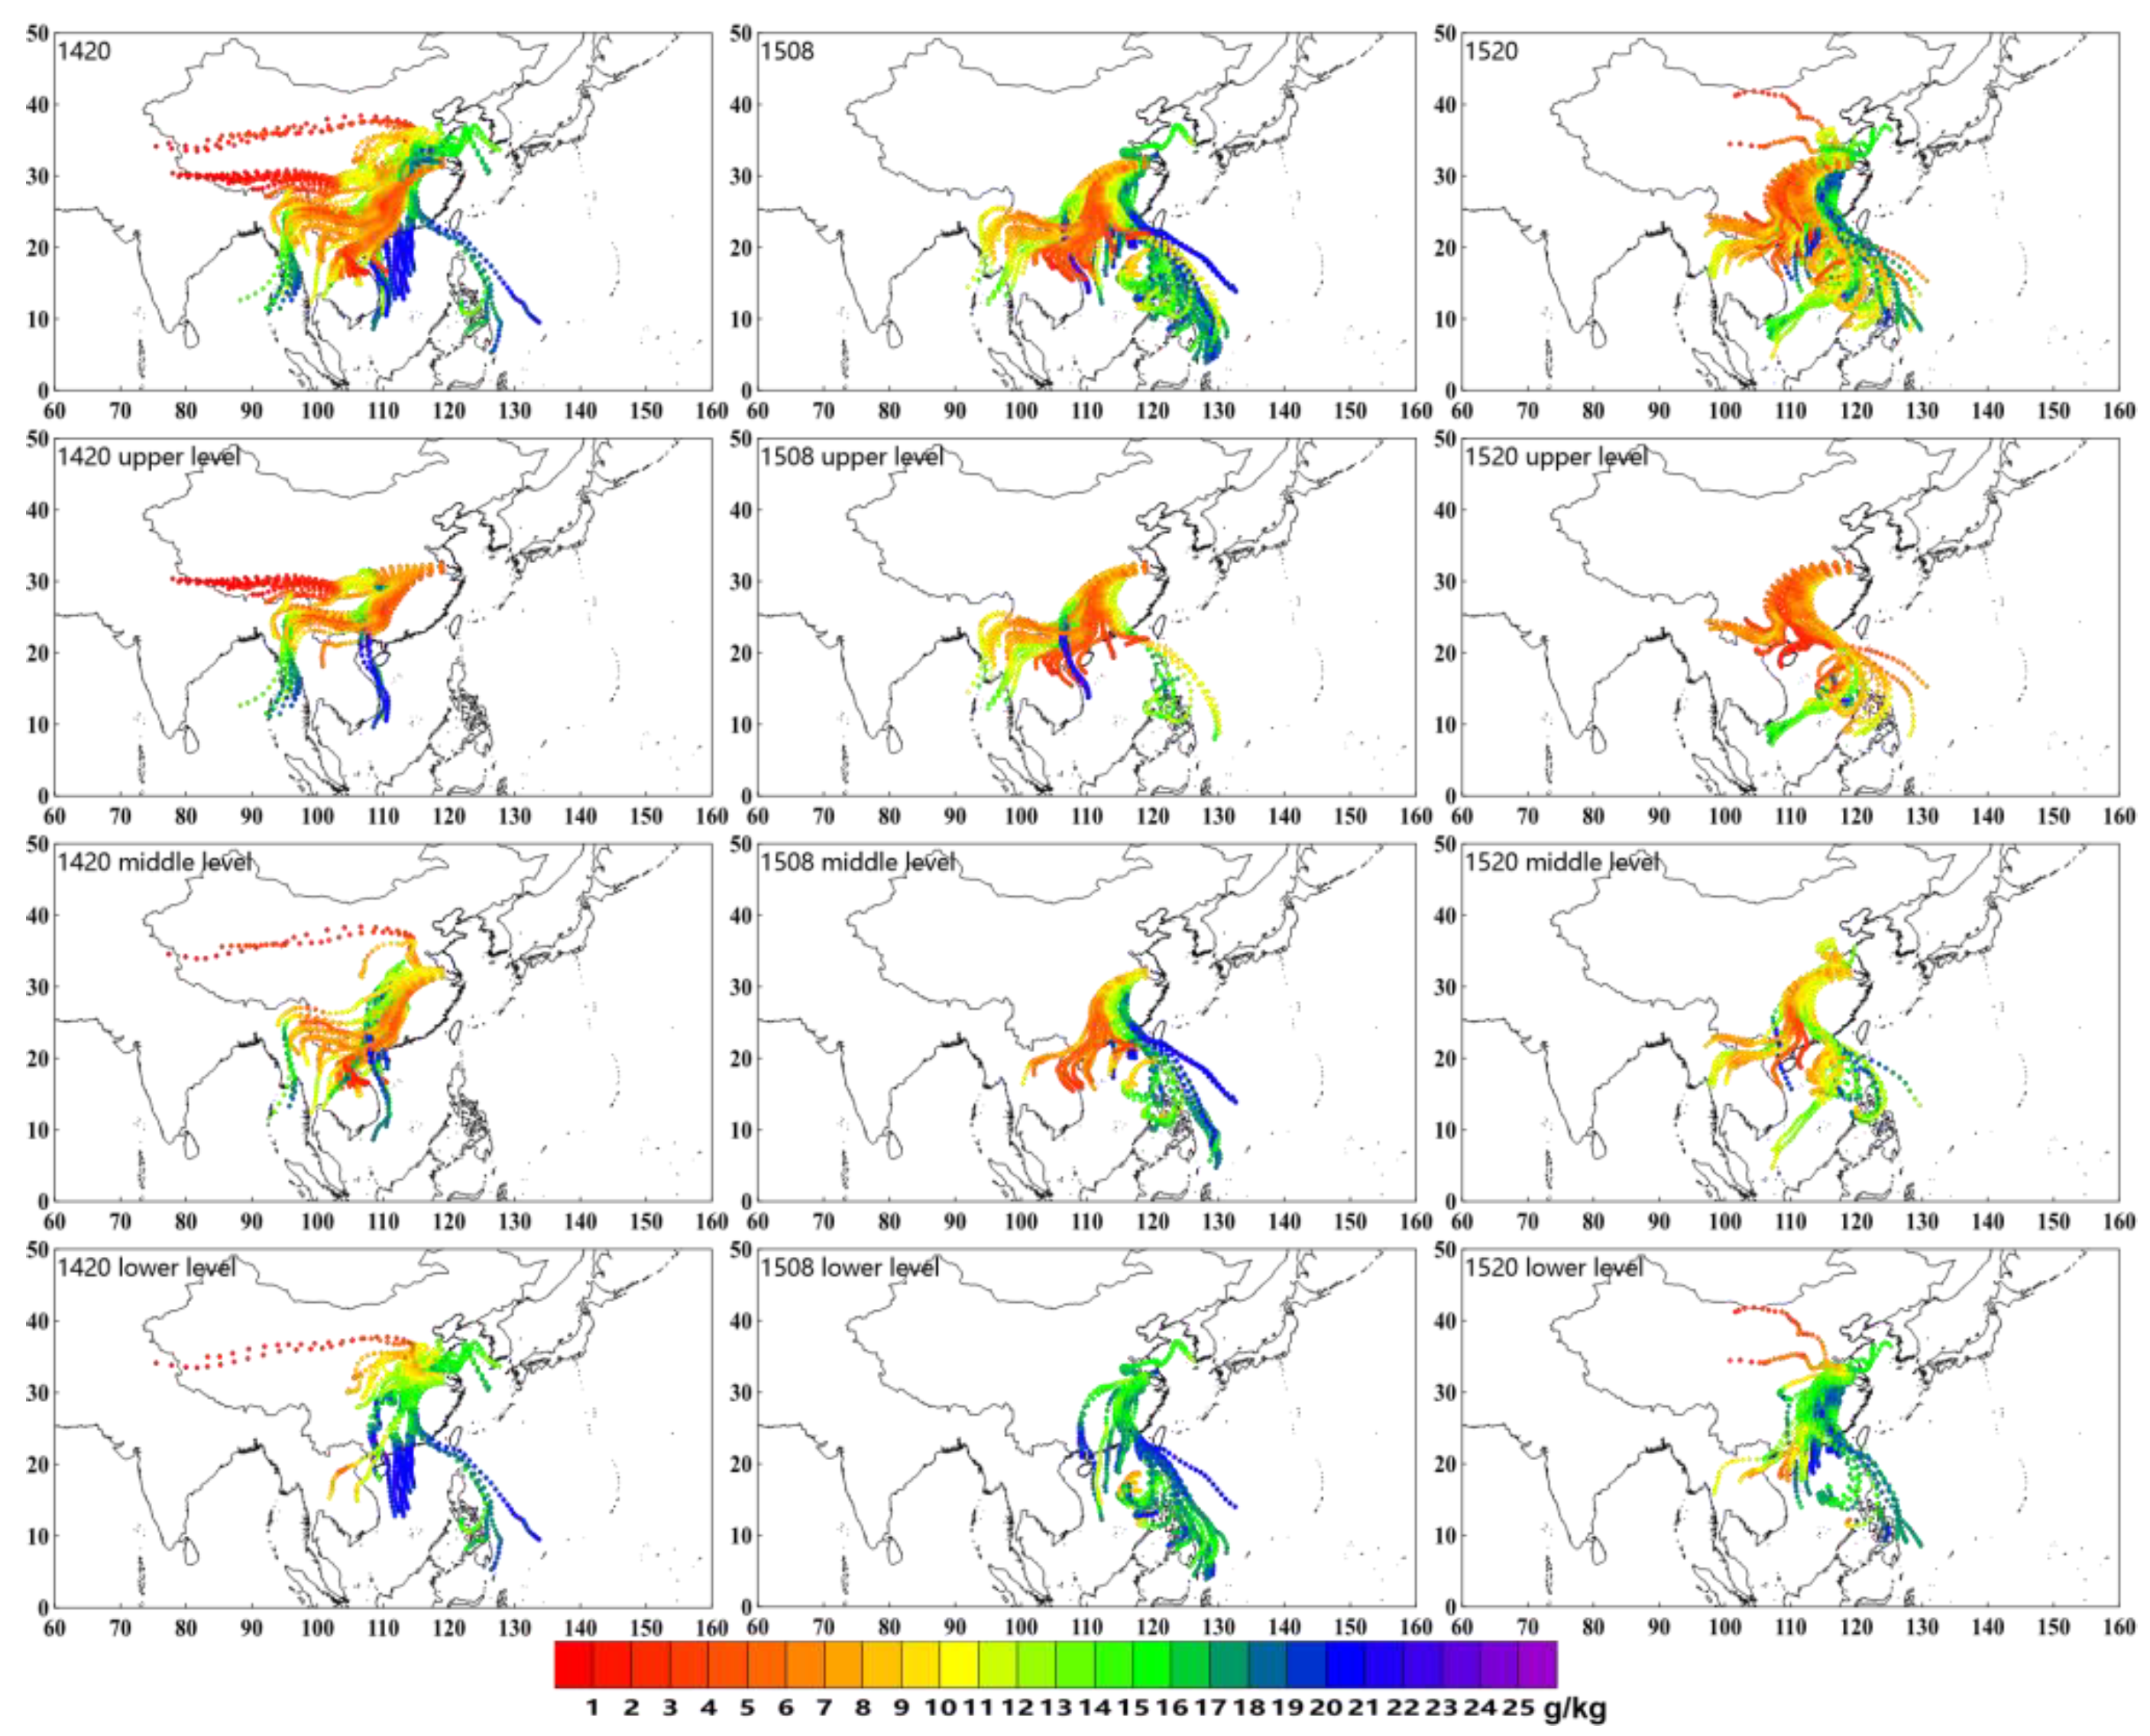
The first line is the whole layer track, the second line is the upper layer track (above 4000 m), the third line is the middle layer track (2000–4000 m), and the fourth line is the lower layer track (below 2000 m). The color of the track indicates the specific humidity (g·kg−1).
Figure 9 shows the backward trajectories of air masses at 20:00 on 14 June, 08:00 and 20:00 on 15 June, tracking the distribution of the whole layer and the upper, middle, and lower layers trajectories. It can be seen that prior to the heavy rainfall at 20:00 on 14 June, the lower layer trajectories were mainly southward, with water vapor being transported northward from the South China Sea, affecting Nanjing after passing through the South China and Jianghan regions. In the middle layer, the specific humidity of the air masses decreased significantly, and a large amount of water vapor affected Nanjing from the western South China Sea, Indochina Peninsula, and the eastern Bay of Bengal along the southwest airflow. In the upper layer, the trajectories shifted further westward, with some air masses being transported westward from the Qinghai-Tibet Plateau to Nanjing, also showing a decrease in specific humidity, and most air masses had a specific humidity of less than 5 g·kg−1, carrying relatively less water vapor. During the heavy rainfall period at 08:00 on 15 June, the trajectories moved eastward and southward overall. A large number of trajectories passed over the northwest Pacific Ocean, near the Philippines, to the southern part of Taiwan Island, entering China through the southeast airflow. They affected provinces such as Fujian, Jiangxi, and Anhui, and finally, they converged in Nanjing. When analyzed by layer, in the lower layer, the Southeast Pacific water vapor channel was significantly stronger with higher specific humidity, and some trajectories reached above 20 g·kg−1. In the middle layer, the Southeast Pacific water vapor channel remained relatively strong. Half of the trajectories entered China from the southeasterly airflow to affect precipitation in Nanjing, while the other half was influenced by the southwesterly airflow along the Indochina Peninsula, but with lower specific humidity and relatively less impact. In the upper layer, there were still a few southeastward trajectories, but most trajectories affecting Nanjing originated from the Bay of Bengal along the Indochina Peninsula. At 20:00 on 15 June, after the precipitation had ceased, the southeastward trajectories from the Pacific had weakened notably, with a clear reduction in both the number and specific humidity of the trajectories. When analyzed by layer, there were still a few southeastward trajectories in the lower layer, and the main trajectories had reverted to the southward trajectories from the South China Sea. In the middle layer, although there were still many trajectories transporting water vapor from the southeasterly channel to China, they had shifted westward compared to the heavier rainfall at 08:00, with a significant decrease in specific humidity. In the upper layer, there was a significant change in the trajectories, with a large number of trajectories entering China from the southeast and turning southwestward around the region from 25° N to 30° N and 105° E to 115° E. However, these upper layer trajectories had relatively low specific humidity and smaller impacts.
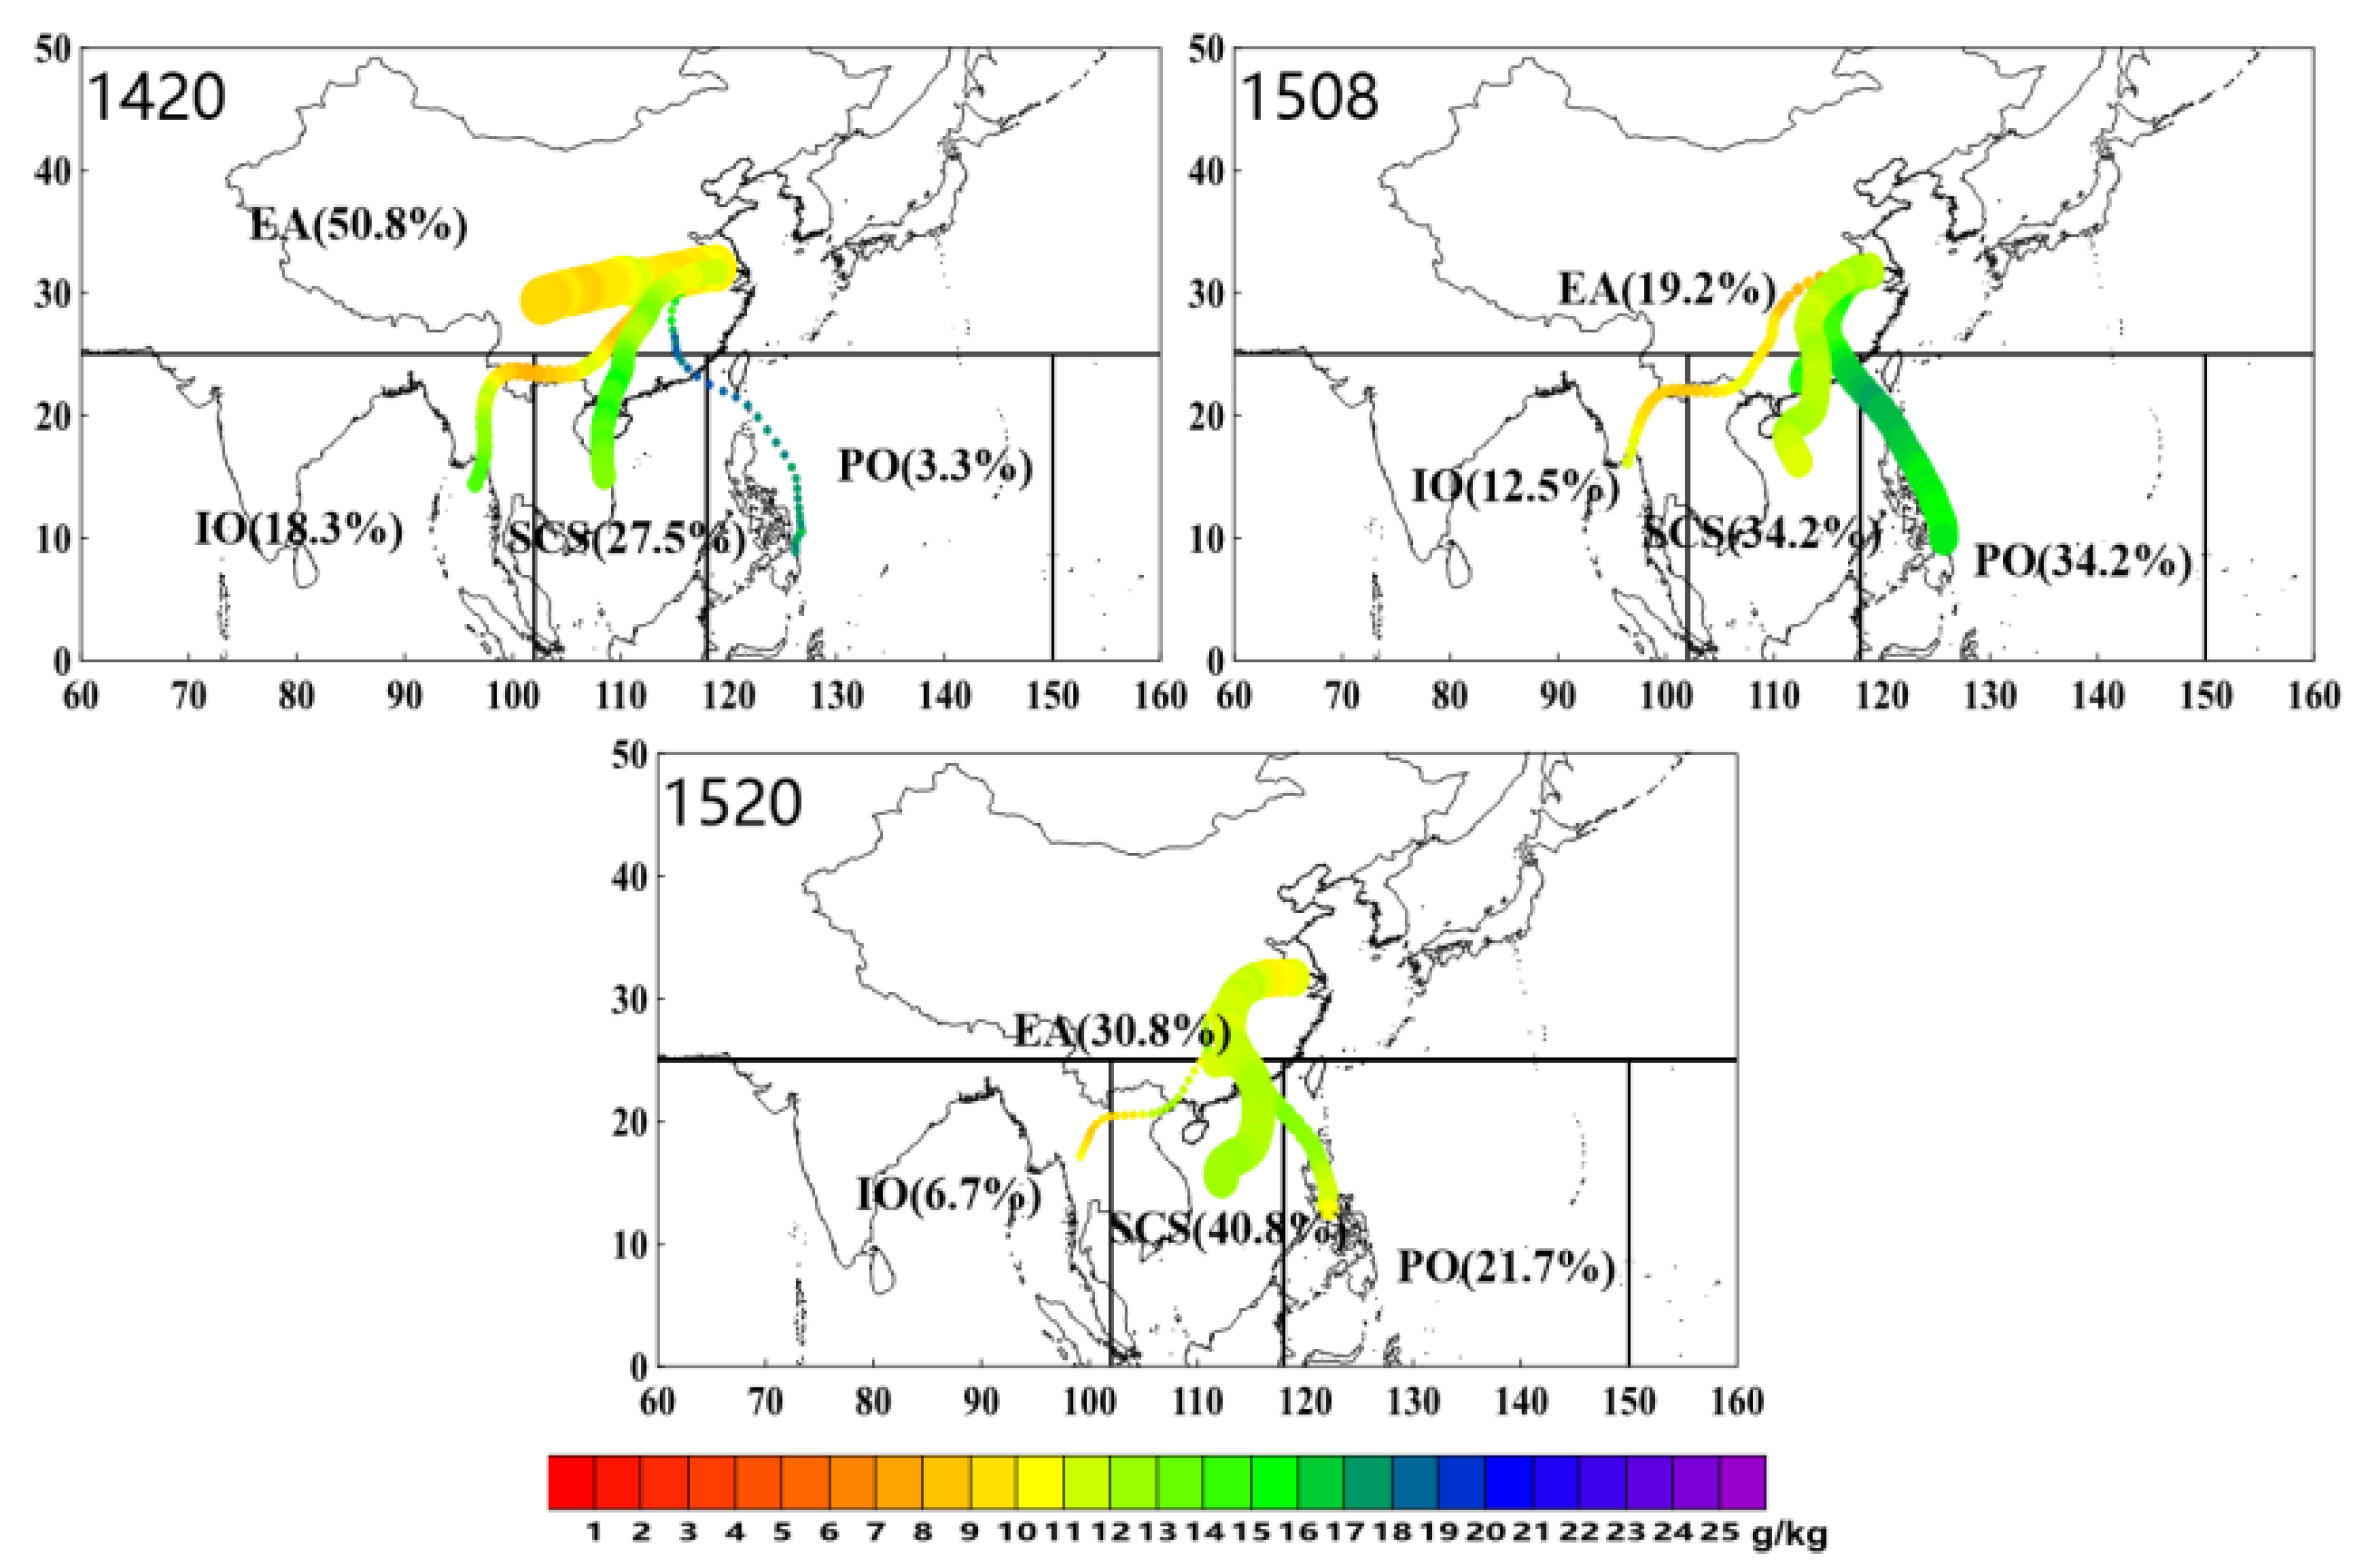
All trajectories were categorized into four channels. Those north of 25° N were attributed to the Eurasian mid-latitude westerly channel (EA), while south of 25° N were divided into three channels: the Indian Ocean channel (IO) west of 100° E, the South China Sea channel (SCS) between 100° E and 118° E, and the Pacific Ocean channel (PO) east of 118° E. Figure 10 shows the trajectories from the four moisture sources at 20:00 on 14 June, 08:00 on 15 June and 20:00 on 15 June. It can be observed that before the heavy rainfall event, the main channel was the mid-latitude westerly channel, accounting for 50.8% of the trajectories, while the Pacific Ocean channel accounted for a minimal proportion, only 3.3%. The trajectories of the South China Sea channel and the Indian Ocean channel accounted for 27.5% and 18.3%, respectively, providing a certain amount of water vapor. During the heavy rainfall event, the intensity of the Pacific Ocean channel increased rapidly, with trajectories reaching 34.2%, while the trajectories of the South China Sea channel reached 34.2%. Both of them were important water vapor channels, but the Pacific Ocean channel had a higher specific humidity. The trajectories from the Indian Ocean channel and the westerly channel in the west were both less than 20%. After the rainfall, the strength of the Pacific Ocean channel decreased to 21.7%, while the westerly channel strengthened again, reaching 30.8%. The South China Sea channel became the strongest channel, with trajectories accounting for 40.8%.
In summary, there were four water vapor channels during this rainstorm: the mid-latitude westerly channel, the Indian Ocean channel, the South China Sea channel, and the Pacific channel. Prior to the heavy rainfall, the water vapor transport channel was skewed to the west, with the upper layer dominated by the mid-latitude westerly channel and the middle to lower layers primarily influenced by the South China Sea channel and the Bay of Bengal channel. During heavy rainfall, the Pacific channel in the middle and lower layers strengthened as the most important water vapor channel, while the upper layer was primarily influenced by the South China Sea channel. After precipitation, the Pacific water vapor channel noticeably weakened, with the South China Sea channel and the westerly channel becoming the dominant channels.
Additionally, Nanjing is located in the lower reaches of the Yangtze River, with abundant water bodies (Figure 11), especially with the Yangtze River flowing from west to east through Nanjing. During summer, the monsoon brings moist air currents from the ocean, carrying a large amount of water vapor to Nanjing. Some of this water vapor directly originates from the evaporation of the Yangtze River and its surrounding water bodies, providing a source of water vapor for the occurrence of heavy rain. As can be seen from Figure 9 at 8:00 on 15 June, some water vapor was transported to Nanjing from the middle reaches of the Yangtze River. The contribution of local and regional water vapor sources will be further explored in our future research through numerical simulation experiments.

7. Conclusions

This study analyzed a rainstorm process in Nanjing on 15 June 2020 using multiple observational data sources such as automatic stations, radar, satellite, new detection equipment, and ERA-5 reanalysis data, as well as the Hybrid Single-Particle Lagrangian Integrated Trajectory (HYSPLIT) platform. The main conclusions are as follows:
  • The rainstorm process has characteristics of concentrated heavy rainfall, intense short-term precipitation, and large cumulative rainfall. It was a subtropical high-edge-type rainstorm under the background of the northeast cold vortex. The rainstorm area was located in the 200 hPa diversion region, the left front of the low-level jet, and the convergence of cold and warm air flows near the low-level shear line.
  • The development of the rainstorm was accompanied by the merging and strengthening of mesoscale convective cloud clusters. The TBB low-value area was expanded, and the intensity of TBB increased, with the lowest TBB ≤ −72 °C. Heavy precipitation occurred near the region of large TBB gradient values or the center of low TBB values on the northern side of the convective cloud cluster, and it moved with the low TBB value areas. The lower the TBB value and the longer the duration, the greater the precipitation intensity and the larger the accumulated rainfall.
  • The formation of the train effect during the eastward movement of strong echoes was an important reason for the continuous 3-h heavy rainfall in the central part of Nanjing. The S-band dual-polarization radar showed that KDP, ZDR, and ρHV all increased significantly during the period of heavy precipitation, with KDP reaching 1 to 5 °/km, ZDR reaching 1 to 3.5 dB and ρHV reaching above 0.97, indicating vigorous vertical upward motion during this phase and the precipitation being mainly dominated by dense and uniform large raindrops.
  • Wind profiler radar data show that the near-surface wind speed increased about half an hour before the onset of precipitation. The precipitation intensified after the establishment of the southwesterly jet in the middle and lower levels. The period of the strongest precipitation corresponded well with the passage of the upper-level trough and the intrusion of cold air. The vertical structure of the wind field detected by the wind profiler radar provides a good indication of the changes in precipitation intensity.
  • Analysis of microwave radiometer data indicates that both water vapor density and liquid water content were maximum in the lower layer during this rainstorm process. The overall water vapor density decreased while the lower layer liquid water content increased during the precipitation period, showing an inverse relationship. The hourly rainfall was negatively correlated with the total column-integrated water vapor content and positively correlated with the total column-integrated liquid water content. Compared to the total column-integrated water vapor content, the total column-integrated liquid water content was more sensitive to changes in rainfall intensity, and its abrupt increase can serve as an important indicator for the onset of heavier rainfall.
  • Laser disdrometer data show that during the Meiyu season in Nanjing, convective precipitation was mainly composed of small to medium raindrops with diameters less than 3 mm, with most raindrops being less than 1 mm, and the falling velocities of raindrops mainly concentrated between 2 and 6 m·s−1.
  • There were four water vapor channels in this rainstorm process: the mid-latitude westerly channel, the Indian Ocean channel, the South China Sea channel, and the Pacific channel. During the heavy rainfall, the Pacific Ocean water vapor channel was the main channel at the middle and lower levels, while the South China Sea water vapor channel was the main channel at the upper level, both accounting for a trajectory proportion of 34.2%.

Author Contributions

Y.M., Y.J. and C.L. contributed to the conception and design of the study. Y.S. carried out the Lagrangian trajectory tracking model. D.Q. analyzed the satellite data. Y.M. and C.L. revised this paper and polished the English. All authors have read and agreed to the published version of the manuscript.

Funding

This work was supported by the General Program of the Jiangsu Meteorological Bureau (KM202310 and KM202409) and Research Projects of the Nanjing Meteorology Bureau (NJ202310).

Institutional Review Board Statement

Not applicable.

Informed Consent Statement

Not applicable.

Data Availability Statement

The original contributions presented in the study are included in the article, and further inquiries can be directed to the corresponding author.

Conflicts of Interest

The authors declare no conflicts of interest.

References

  1. Liu, Y.L.; Zhang, H.X.; Chen, H.T.; Chen, C.Z. Flood impact on urban roads and commuting: A case study of Wuhan, China. Front. Environ. Sci. 2022, 10, 1056854. [Google Scholar] [CrossRef]
  2. Tabari, H. Climate change impact on flood and extreme precipitation increases with water availability. Sci. Rep. 2020, 10, 13768. [Google Scholar] [CrossRef]
  3. Pendergrass, A.G. What precipitation is extreme. Science 2018, 360, 1072–1073. [Google Scholar] [CrossRef] [PubMed]
  4. Trenberth, K.E.; Fasullo, J.T.; O’Dell, C.; Wong, T. Relationships between tropical sea surface temperature and top-of-atmosphere radiation. Geophys. Res. Lett. 2010, 37, L03702. [Google Scholar] [CrossRef]
  5. Liang, P.; Ding, Y.H. The long-term variation of extreme heavy precipitation and its link to urbanization effects in Shanghai during 1916–2014. Adv. Atmos. Sci. 2017, 34, 321–334. [Google Scholar] [CrossRef]
  6. Hsieh, Y.P. A preliminary survey of certain rain-bearing systems over China in spring and summer. Acta. Meteorol. Sin. 1956, 1, 1–23. [Google Scholar] [CrossRef]
  7. Caracena, F.; Fritsch, J.M. Focusing mechanisms in Texas Hill country flash floods of 1978. Mon. Weather. Rev. 1983, 111, 2319–2332. [Google Scholar] [CrossRef]
  8. Zhang, G.S.; Mao, J.Y.; Liu, Y.M.; Wu, G.X. PV perspective of impacts on downstream extreme rainfall event of a Tibetan Plateau vortex collaborating with a Southwest China Vortex. Adv. Atmos. Sci. 2021, 38, 1835–1851. [Google Scholar] [CrossRef]
  9. Ding, Y.H. Some aspects of rainstorm and meso-scale meteorology. Acta. Meteorol. Sin. 1994, 3, 274–284. [Google Scholar] [CrossRef]
  10. Peng, J.Y.; Wu, R.S.; Wang, Y. Initiation mechanism of meso-β scale convective systems. Adv. Atmos. Sci. 2004, 19, 870–884. [Google Scholar] [CrossRef]
  11. Luo, Y.H.; Du, Y. The roles of low-level jets in“21·7”Henan extremely persistent heavy rainfall event. Adv. Atmos. Sci. 2023, 40, 350–373. [Google Scholar] [CrossRef]
  12. Wei, P.; Xu, X.; Xue, M.; Zhang, C.; Wang, Y.; Zhao, K.; Zhou, A.; Zhang, S.; Zhu, K. On the key dynamical processes supporting the 21.7 Zhengzhou record-breaking hourly rainfall in China. Adv. Atmos. Sci. 2023, 40, 337–349. [Google Scholar] [CrossRef]
  13. Zhu, D.; Zhi, X.F.; Wang, N.; Chen, C.S.; Tian, X.; Yu, Y.M. Impacts of Changbai Mountain topography on the extreme precipitation from super typhoon Maysak. Front. Environ. Sci. 2022, 9, 818402. [Google Scholar] [CrossRef]
  14. Xia, R.; Zhang, D. An observational analysis of three extreme rainfall episodes of 19–20 July 2016 along the Taihang Mountains in North China. Mon. Weather. Rev. 2019, 147, 4199–4220. [Google Scholar] [CrossRef]
  15. Shen, D.D.; Ran, L.K.; Yang, S.A.; Yang, S.; Li, N.; Jiao, B.F. Frontogenetic analyses of the topographic frontal rainstorm in Xinjiang. Chin. J. Atmos. Sci. 2023, 47, 1843–1862. [Google Scholar] [CrossRef]
  16. Ralph, F.M.; Neiman, P.J.; Wick, G.A. Satellite and CALJet aircraft observations of atmospheric rivers over the eastern North Pacific Ocean during the winter of 1997/98. Mon. Weather. Rev. 2004, 132, 1725–1745. [Google Scholar] [CrossRef]
  17. Guan, B.; Waliser, D.E. Detection of atmospheric rivers: Evaluation and adaption of an algorithm for global studies. J. Geophys. Res. 2015, 120, 12514–12535. [Google Scholar] [CrossRef]
  18. Gimeno, L.; Nieto, R.; Vazquez, M.; Lavers, D.A. Atmospheric rivers: A mini−review. Front. Earth. Sci. 2014, 2, 1–6. [Google Scholar] [CrossRef]
  19. Hu, G.Q.; Ding, Y.H. A study on the energy and water cycles over Changjiang-Huaihe river basins during the 1991 heavy rain periods. Acta. Meteorol. Sin. 2003, 2, 146–163. [Google Scholar] [CrossRef]
  20. Ding, Y.H.; Liu, Y.J.; Song, Y.F. East Asian summer monsoon moisture transport belt and its impact on heavy rainfalls and floods in China. Adv. Water Sci. 2020, 31, 629–643. [Google Scholar] [CrossRef]
  21. Liao, J.; Tan, Z.M. Numerical simulation of a heavy rainfall event along the meiyu front: Influences of different scale weather systems. Acta. Meteorol. Sin. 2005, 5, 771–789. [Google Scholar] [CrossRef]
  22. Zhao, H.; Shu, Y.; Mao, Y.Q.; Liu, Y.; Yu, K. The assimilation effect of multi-new types observation data in the forecasts of meiyu-front rainstorm. Atmosphere 2023, 14, 693. [Google Scholar] [CrossRef]
  23. Stohl, A.; James, P. A Lagrangian analysis of the atmospheric branch of the global water cycle. Part Ⅰ: Method description, validation, and demonstration for the August 2002 flooding in central Europe. J. Hydrometeorol. 2004, 5, 656–678. [Google Scholar] [CrossRef]
  24. Stohl, A.; James, P. A Lagrangian analysis of the atmospheric branch of the global water cycle. Part Ⅱ: Moisture transports between earth’ s ocean basins and river catchments. J. Hydrometeorol. 2005, 6, 961–984. [Google Scholar] [CrossRef]
  25. Dirmeyer, P.A.; Schlosser, C.A.; Brubaker, K.L. Precipitation, recycling, and land memory: An integrated analysis. J. Hydrometeorol. 2009, 10, 278–288. [Google Scholar] [CrossRef]
  26. Dominguez, F.; Kumar, P.; Liang, X.; Ting, M. Impact of atmospheric moisture storage on precipitatipn recycling. J. Clim. 2006, 19, 1513–1530. [Google Scholar] [CrossRef]
  27. Guo, L.Y.; Shi, Y.; Jiang, H.R. Comparison of impact and water vaper characteristics between two types of floods in Eastern China. Environ. Res. Lett. 2022, 17, 024039. [Google Scholar] [CrossRef]
  28. Shi, Y.; Jiang, Z.H.; Li, Z.X. Vertical Characteristics of Water Vapor Transport during the Rainy Season in Eastern China Based on the Lagrangian Method. Chin. J. Atmos. Sci. 2022, 46, 380–392. [Google Scholar] [CrossRef]
  29. Van, L.N.; Le, X.-H.; Nguyen, G.V.; Yeon, M.; May, D.T.T.; Lee, G. Comprehensive relationships between kinetic energy and rainfall intensity based on precipitation measurements from an OTT Parsivel2 optical disdrometer. Front. Environ. Sci. 2022, 10, 985516. [Google Scholar] [CrossRef]
  30. Zhou, L.; Dong, X.; Fu, Z.; Wang, B.; Leng, L.; Xi, B.; Cui, C. Vertical distributions of raindrops and Z-R relationships using Microrain Radar and 2-D-Video Distrometer measurements during the Integrative Monsoon Frontal Rainfall Experiment (IMFRE). J. Geophys. Res. 2020, 125, e2019JD031108. [Google Scholar] [CrossRef]
  31. Zhang, T.; Wei, W.; Wu, L.H. Analysis of the Water Vapor Characteristics of Short-Time Heavy Rainfall in July and August Based on Microwave Radiometer Data. Plateau. Mt. Meteor. Res. 2020, 40, 49–55. [Google Scholar] [CrossRef]
  32. Chen, J.; Yin, J.; He, W.; Chen, Y.H. Analysis and Application of Wind Profiler Radar Data in a Meiyu Front Rainstorm Weather Process in Jiangxi. Meteor. Disaster Reduct. Res. 2016, 39, 206–215. [Google Scholar] [CrossRef]
  33. Wang, K.; Xia, X.; Wang, X.H.; Li, M.; Gu, P.S.; Peng, X.Y. Multiscale Analysis of a Record-Breaking Predecessor Rain Event Ahead of Typhoon Danas (2019) in Jiangsu, China. Atmosphere 2023, 14, 1608. [Google Scholar] [CrossRef]
  34. Shen, F.; Song, L.; Li, H.; He, Z.; Xu, D. Effects of different momentum control variables in radar data assimilation on the analysis and forecast of strong convective systems under the background of northeast cold vortex. Atmos. Res. 2022, 280, 106415. [Google Scholar] [CrossRef]
  35. Shen, F.; Shu, A.; Liu, Z.; Li, H.; Jiang, L.; Zhang, T.; Xu, D. Assimilating FY-4A AGRI Radiances with a Channel Sensitive Cloud Detection Scheme for the Analysis and Forecast of Multiple Typhoons. Adv. Atmos. Sci. 2023, 41, 937–958. [Google Scholar] [CrossRef]
  36. Xu, D.; Zhang, X.; Liu, Z.; Shen, F. All-sky infrared radiance data assimilation of FY-4A AGRI with different physical parameterizations for the prediction of an extremely heavy rainfall event. Atmos. Res. 2023, 293, 106898. [Google Scholar] [CrossRef]
  37. Draxler, R.R.; Hess, G.D. An overview of the HYSPLIT4 modelling system for trajectories. Aust. Meteorol. Mag. 1998, 47, 295–308. [Google Scholar]
  38. Liu, B.; Guo, J.; Gong, W.; Shi, L.; Zhang, Y.; Ma, Y. Characteristics and performance of wind profiles as observed by the radar wind profiler network of China. Atmos. Meas. Tech. 2020, 13, 4589–4600. [Google Scholar] [CrossRef]
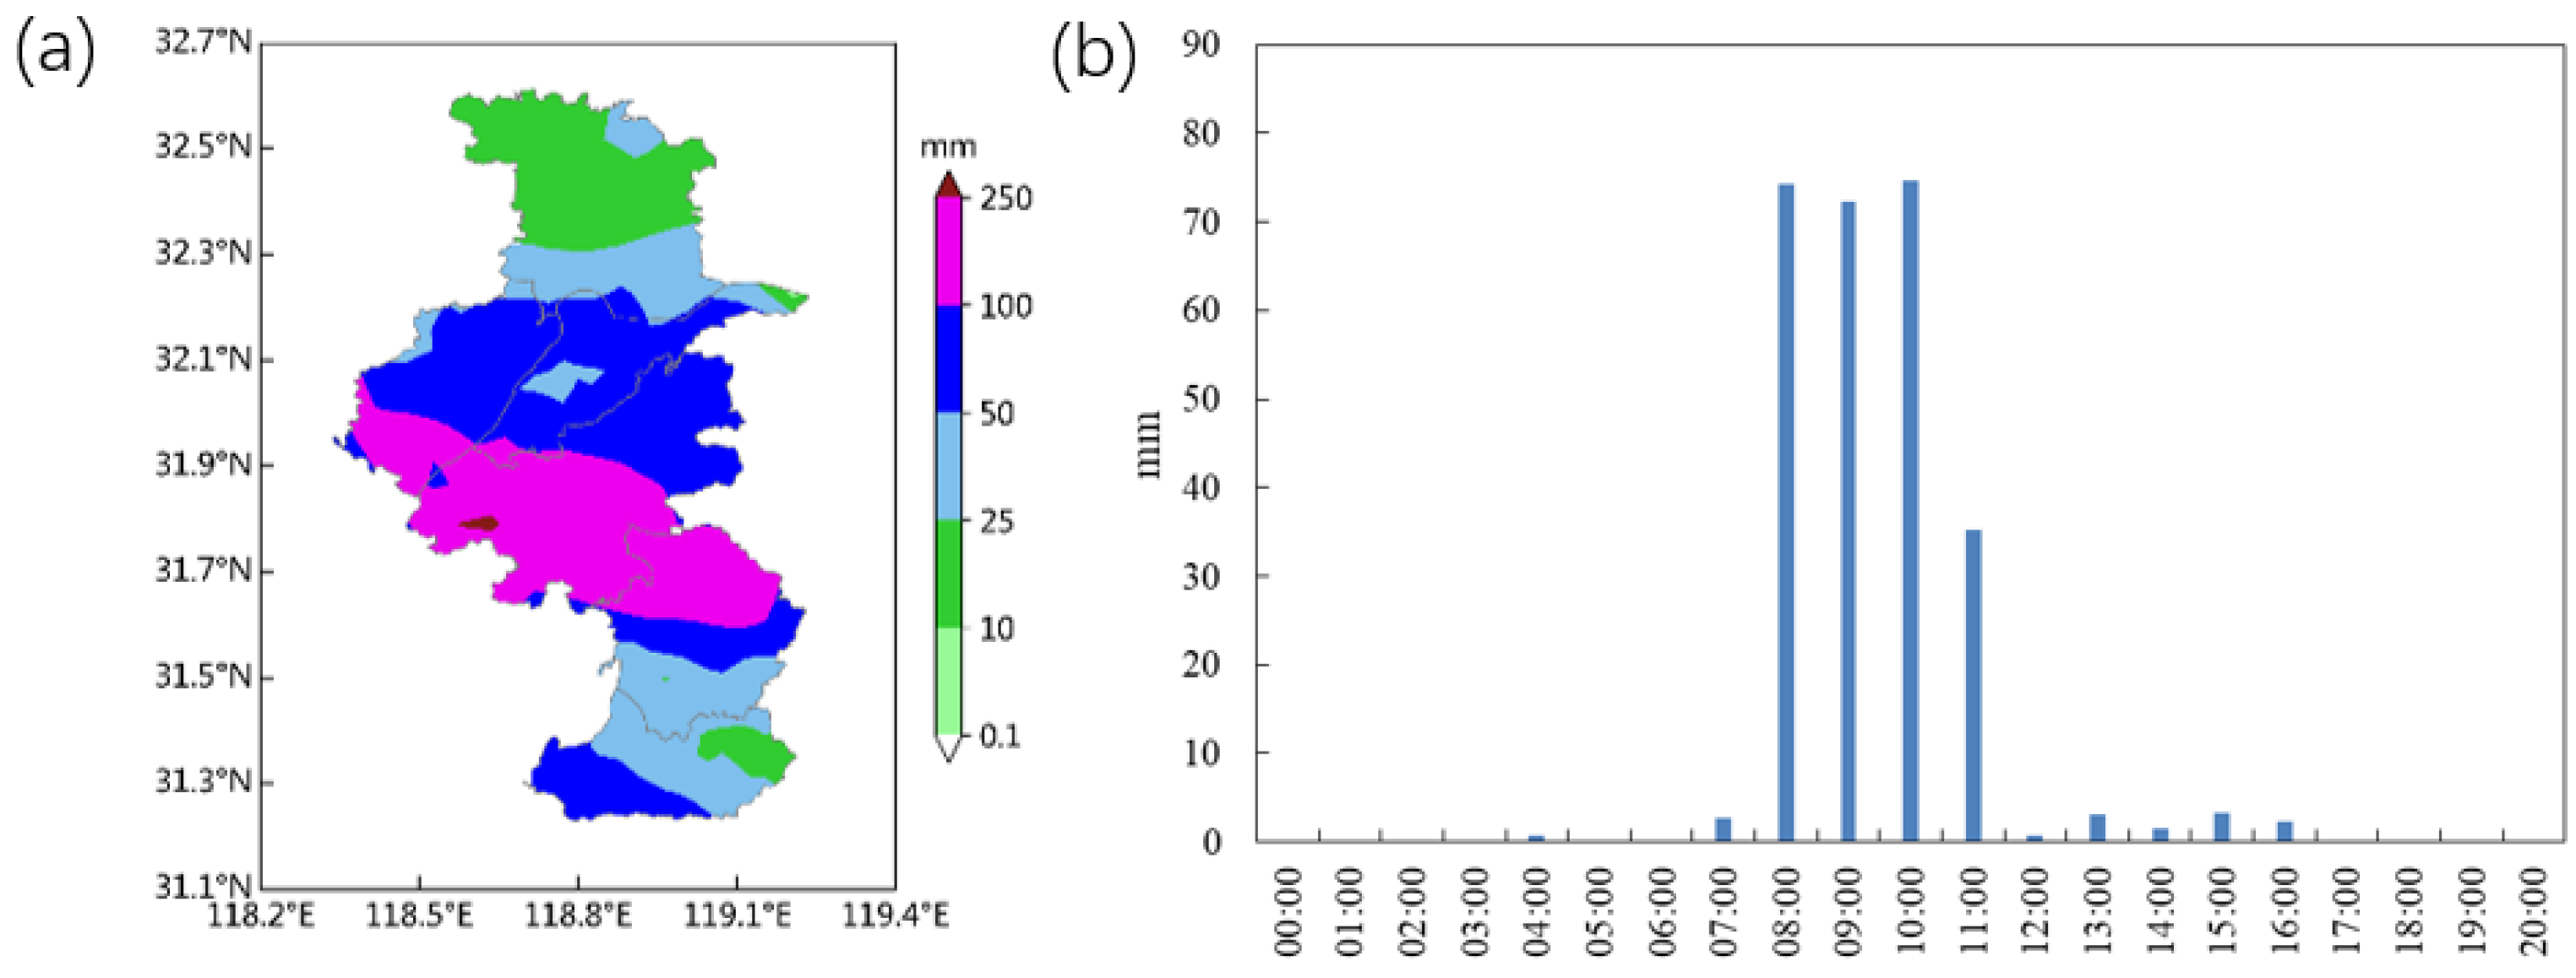
Figure 1. (a) Distribution of precipitation in Nanjing from 20:00 on 14 June to 20:00 on 15 June 2020. (b) Variation of hourly rainfall of Jiangning Lulang Station from 00:00 to 20:00 on June 15 2020.
Atmosphere 15 00904 g001
Figure 2. Height field (unit: dagpm) and wind field (unit: m·s−1) at 08:00 on 15 June 2020. (a) 200 hPa, (b) 500 hPa, (c) 850 hPa. (The red shadow is the wind speed area of >30 m·s−1, the blue shadow is the relative humidity area of >60%, and the black dot is the location of Nanjing).
Atmosphere 15 00904 g002
Figure 3. TBB feature lines and heavy precipitation areas at 05:00, 06:00, 07:00, and 10:00 on 15 June 2020 (yellow line: −32 °C, orange line: −52 °C, purple line: −62 °C, red line: −72 °C; Blue circle: hourly rainfall ≥20 mm, red circle: hourly rainfall ≥40 mm).
Atmosphere 15 00904 g003
Figure 4. The time-height profile of Z (unit: dBz), KDP (unit: °/km), ZDR (unit: dB), and ρ H V of Jiangning Lulang Station from 06:00 to 12:00 on 15 June 2020.
Atmosphere 15 00904 g004
Figure 5. The skew T–logp diagram and vertical wind profile of the Nanjing radiosonde at 20:00 14 June 2020 (a) and 08:00 15 June 2020 (b). The dark, black, solid lines indicate the state profiles. The red solid lines represent the temperature stratification profiles. The green solid lines are the dew point stratification profiles. The blue dashed lines represent the wet adiabatic profiles. The orange dashed lines represent the dry adiabatic profiles. The green dashed lines represent the iso-saturated specific humidity profiles. The gray-sloping solid lines represent the isothermal profiles. The cyan-blue dashed lines represent the 0 °C isotherm profiles. The red area represents CAPE.
Atmosphere 15 00904 g005
Figure 6. The evolution of the wind profile at Nanjing Station from 03:00 to 15:00 on 15 June 2020.
Atmosphere 15 00904 g006
Figure 7. The profiles of water vapor density (unit: g·m−3) and liquid water content (unit: g·m−3) of the microwave radiometer and hourly rainfall (unit: mm) at Nanjing Station from 00:00 on 15 June to 00:00 on 16 June 2020.
Atmosphere 15 00904 g007
Figure 8. The variation over time of raindrop concentration (lgN(D)), raindrop diameter (unit: mm), and falling velocity (unit: m·s−1) at Nanjing Station from 00:00 on 15 June to 00:00 on 16 June 2020.
Atmosphere 15 00904 g008
Figure 9. The trace distribution of the whole layer and the upper, middle and lower levels of the air masses on the 5th day of the backward tracking at 20:00 on 14 June, 08:00 and 20:00 on 15 June 2020.
Atmosphere 15 00904 g009
Figure 10. The trajectories from four water vapor sources at 20:00 on June 14, 08:00, and 20:00 on 15 June 2020. The color of the track indicates the specific humidity (g·kg−1), and the thickness of the track indicates the track intensity.
Atmosphere 15 00904 g010
Figure 11. Waterbody distribution in Nanjing.
Atmosphere 15 00904 g011
Table 1. Definitions of light and heavy rainfall.
Rainfall Intensity24-h Rainfall1-h Rainfall
light rainfall<10 mm<2 mm
heavy rainfall≥50 mm≥20 mm
Table 2. Changes in the total column-integrated water vapor content (unit: mm) and the total column-integrated liquid water content (unit: mm) correspond to different rainfall intensities.
Rainfall Intensity (Unit: mm·h−1)R = 00 < R ≤ 55 < R ≤ 1010 < R ≤ 20R > 20
the average total column-integrated water
vapor content (unit: mm)
6.376.075.114.974.98
the average total column-integrated liquid
water content (unit: m)
0.972.456.386.977.42
Disclaimer/Publisher’s Note: The statements, opinions and data contained in all publications are solely those of the individual author(s) and contributor(s) and not of MDPI and/or the editor(s). MDPI and/or the editor(s) disclaim responsibility for any injury to people or property resulting from any ideas, methods, instructions or products referred to in the content.