Abstract
The summer Asian westerly jet (AWJ)’s shifting in latitudes is one important characteristic of its variability and has great impact on the East Asian summer climate. Based on the observed and reanalyzed datasets from the Hadley Center Sea Ice and Sea Surface Temperature dataset (HadISST), the Japanese 55-year reanalysis (JRA-55), and the fifth generation of the European Centre for Medium-Range Weather Forecasts atmospheric reanalysis (ERA5), this study investigates the relationship between the spring tripole North Atlantic SST (TNAT) anomalies and the summer meridional shift of the AWJ (MSJ) for the period of 1958–2020. Through the method of correlation analysis and regression analysis, we show that the ‘+ - +’ TNAT anomalies in spring could induce a northward shift of the AWJ in the following summer. However, such a climatic effect of the spring TNAT anomalies on the MSJ is unstable, exhibiting an evident interdecadal strengthening since the early 1990s. Further analysis reveals that this is related to a strengthened intensity of the spring TNAT anomalies in the most recent three decades. Compared to the early epoch (1958–1993), the stronger spring TNAT anomalies in the post epoch (1994–2020) could cause a stronger pan-tropical climate response until the following summer through a series of ocean–atmosphere interactions. Through Gill responses, the resultant more prominent cooling in the central Pacific in response to the ‘+ - +’ TNAT anomalies induces a pan-tropical cooling in the upper troposphere, which weakens the poleward gradient of the tropospheric temperature over subtropical Asia. As a result, the AWJ shifts northward via a thermal wind effect. By contrast, in the early epoch, the spring TNAT anomalies are relatively weaker, inducing weaker pan-tropical ocean–atmosphere interactions and thus less change in the meridional shit of the summer AWJ. Our results highlight a strengthened lagged effect of the spring TNAT anomalies on the following summer MSJ and have important implications for the seasonal climate predictability over Asia.
1. Introduction
The Asian westerly jet (AWJ) is an upper-level circulation system that prevails in the mid to high latitudes of the Asia–Pacific region [1,2,3,4,5]. It is one important component of the East Asian summer monsoon system [6,7] and has great impacts on the weather and climate of East Asia [8,9]. Bouts of weather extremes are linked to an abnormal AWJ; for example, the extremely hot summer in 2010 in Japan [10] or the record-breaking meiyu event in 2020 over the Yangtze River basin [11,12], seriously threatening the peoples’ living conditions in these regions and causing large economic losses. Thus, a better understanding of the variations in the summer AWJ is of great social–economic significance for the densely populated East Asia.
The summer AWJ’s shifting in latitudes is one important characteristic of its variability [13,14] and has great impact on the seasonal migration of the East Asian summer monsoon rainband [15,16,17,18]. As the AWJ advances northward from May to August, the East Asian summer monsoon rainband undergoes two abrupt northward transitions and three quasi-stationary stages, corresponding to the pre-meiyu stage over South China from early May to early–mid June, the meiyu stage over the Yangtze-Huai river from early–mid June to early–mid July, and the mid-summer rainfall over North China in early–mid July and August [19,20,21]. During the northward migration of the East Asian summer monsoon rainband, the AWJ interacting with the Tibetan Plateau also plays a crucial role in maintaining the frontal rainband [22,23]. Especially during the meiyu stage, the AWJ locates at about 40° N, which is above the Tibetan Plateau. The AWJ impinging on the Tibetan Plateau generates topographical Rossby waves in the downstream and induces low-level northeasterly wind anomalies over East Asia [22,23,24,25]. Such anomalous northeasterlies can transport cold dry air to the south and favor increased precipitation as a result of frontal activities. Additionally, through the deflection effect of the Tibetan Plateau [26,27], the AWJ can steer the warm advection/upstream wave trains from the south/north of the Tibetan Plateau to East Asia [28,29,30,31], which is also conducive to maintain the meiyu front through adiabatic updrafts/convective instability [32,33,34,35]. Here, the meridional shift of the AWJ (MSJ) relative to the Tibetan Plateau largely controls the duration/termination of the East Asian summer monsoon rainband.
The leading empirical orthogonal function (EOF) mode of the summer upper-level westerlies over Asia reflects the pattern of the AWJ shifting in latitudes [16,36,37,38]. Previous studies have revealed that the leading mode of the AWJ is closely associated with the developing El Niño–Southern Oscillation (ENSO) mode [16,36]. They suggest that the abnormal sea surface temperature (SST) warming in the tropical central and eastern Pacific during the El Niño developing in summer can cause the tropical troposphere to warm in Gill responses, which can then enhance the meridional temperature gradient in the subtropics of Asia and thus cause the AWJ to shift southward through the thermal wind effect [36]. Recently, our studies [39] have suggested that the spring tripole North Atlantic SST (TNAT) pattern, which is the dominant mode of the EOF analysis of the spring North Atlantic SST anomalies (also see Figure S1 in the Supplementary Materials), can trigger a developing ENSO mode in the following summer via a series of ocean–atmosphere interactions. Specifically, the spring ‘+ - +’ North Atlantic SST anomalies, especially those in the tropical North Atlantic [40,41], can emanate a Gill-type response with easterly wind anomalies over the Indo-western Pacific as Kelvin waves and an anomalous cyclone over the subtropical eastern Pacific as Rossby waves [42,43,44]. Through the wind-evaporation-SST (WES) and WES footprinting feedbacks [40,43], easterly wind anomalies as well as anomalous cyclones can cause the Indo-western Pacific to warm and the central and eastern Pacific to cool until the following summer [45,46,47,48]. Together with the persistent warming in the tropical North Atlantic, this accelerates the Walker circulation and further contributes to the La Niña-type responses in the central and eastern Pacific [43], forming a positive feedback. Considering the possible influence of the La Niña state on the MSJ, we guess that there might also be a close relationship between the spring North Atlantic SST anomalies and the summer MSJ through pan-tropical ocean–atmosphere interactions.
Especially since the early and middle 1990s, it has been reported that there is a warmer Atlantic [43,45] likely due to global warming and/or the switch of the Atlantic Multidecadal Oscillation (AMO) phase [46,49]. Under such a warmer Atlantic state, the positive feedback between the spring NAO and TNAT anomalies (i.e., the TNAT anomalies induced by the NAO can feed back on the NAO through eddy–mean flow interaction) gets enhanced [49]. As a result, the intensities of both the spring NAO and TNAT anomalies are also significantly strengthened [49,50]. However, it remains unclear whether such an increased intensity of the spring TNAT anomalies would have a strengthened impact on the summer MSJ since the early 1990s.
The present study aims to reveal the interdecadal change in the relationship between the spring TNAT anomalies and the following summer MSJ during 1958–2020 and explore the possible mechanisms. Indeed, we find that there has been a strengthened influence of spring TNAT anomalies on the following summer MSJ since the early 1990s. Further analyses reveal that such an interdecadal change originates from the strengthened intensity of spring TNAT anomalies, which induces stronger pan-tropical ocean–atmosphere interactions and thus a stronger MSJ response in the following summer. Our results are important for the seasonal climate prediction over the densely populated Asia.
The rest of this work is organized as follows (see also Figure S2 in the Supplementary Materials). Section 2 describes the datasets and methods used in this study. Section 3 presents the interannual variability of the summer AWJ and its relationship with the preceding spring TNAT anomalies. In Section 4, we investigate the interdecadal change in the relationship between the spring TNAT anomalies and the following summer MSJ. In Section 5, the mechanisms are explored. Finally, the results are concluded and discussed in Section 6.
2. Datasets and Methods
Multiple observed and reanalyzed datasets for the period of 1958–2020 are used in this study. The monthly SST data are taken from the Hadley Center Sea Ice and SST dataset (HadISST; 1° × 1°) [51]. The monthly precipitation data are obtained from the fifth generation of the European Centre for Medium-Range Weather Forecasts atmospheric reanalysis (ERA5; 0.25° × 0.25°) [52]. The monthly atmospheric reanalysis data are taken from both the ERA5 and the Japanese 55-year reanalysis (JRA-55; 1.25° × 1.25°) [53]. Note that the atmospheric variables in the two reanalysis datasets show similar results and only the JRA-55 atmospheric reanalysis data are shown in the present study.
To explore the TNAT-MSJ relationship, the TNAT index is defined as the first principal component (PC1) of the EOF analysis on the SST anomalies over North Atlantic (0° N–60° N, 100° W–10° E), and the MSJ index is denoted as the PC1 of the EOF analysis on the 200 hPa zonal wind anomalies over the region of 15° N–65° N, 30° E–180° E. Note that there is a spring TNAT-induced pan-tropical SST pattern in the following summer, exhibiting prominent cooling in the central Pacific and warming in the Indo-western Pacific and Atlantic. To quantitatively describe such summer pan-tropical SST anomalies, we define the summer pan-tropical SST index as the difference between the sum of the regional mean SST anomalies in the Indo-western Pacific (10° S–10° N, 95–135° E) and the tropical North Atlantic (0–20° N, 83–22° W) and the regional mean SST anomalies in the central Pacific (5° S–5° N, 170–120° W). As the MSJ is closely associated with the gradient of the upper-tropospheric temperature over the subtropical Asian region, we also define a summer upper-tropospheric temperature gradient index, which is the difference in the 200 hPa troposphere temperature between the tropics (5° S–5° N, 40–140° E) and subtropics (45–55° N, 40–140° E). Since we mainly focus on the interannual relationship of the spring TNAT anomalies with the following summer MSJ and investigate the interdecadal change in this interannual relationship, the linear trends and decadal variations are removed before carrying out the statistical analysis. Here, the methods of correlation and regression analysis are adopted using the tools of Matlab R2016a in this work and we examine the significance level by two-tailed Student’s t test.
Since spring TNAT anomalies may be related to the remote ENSO forcing [39,40], the preceding winter (December–January–February) Niño3.4 (5° S–5° N, 170° W–120° W) SST-related signals are removed to isolate the ENSO effect. The related equation is expressed as follows [54]:
Here, is a given variable, are the preceding winter Niño3.4 SST anomalies, is the covariance between the variable and the preceding winter Niño3.4 SST anomalies, is the variance of the preceding winter Niño3.4 SST anomalies, and is the variable after removing the preceding winter ENSO signals.
3. Interannual Variability of the Summer AWJ and Its Relationship with the Preceding Spring TNAT Anomalies
The AWJ is a crucial upper-tropospheric circulation system of the East Asian climate during boreal summers prevailing in the mid to high latitudes of the Asia–Pacific region [1]. Figure 1 shows the climatology and standard deviation of the summer 200 hPa zonal winds. The upper-level zonal winds, indeed, exhibit a jet stream over the mid to high latitudes of the Asian region with the jet axis approximately along 40° N (Figure 1a). Additionally, the standard deviation of the summer 200 hPa zonal winds suggest that large interannual variabilities exists in the summer AWJ. Especially, the strongest variations tend to appear over the south and north of the jet axis (Figure 1b), suggesting that the summer AWJ is prone to shift meridionally.
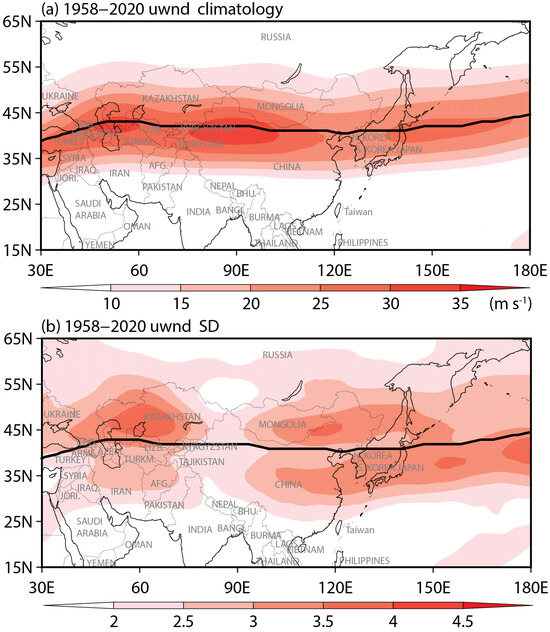
Figure 1.
(a) Climatology and (b) standard deviations of the 200 hPa zonal winds (m s−1) during boreal summer (June–July–August) for the period of 1958–2020. The solid black lines in (a,b) denote the axis of the Asian westerly jet (AWJ).
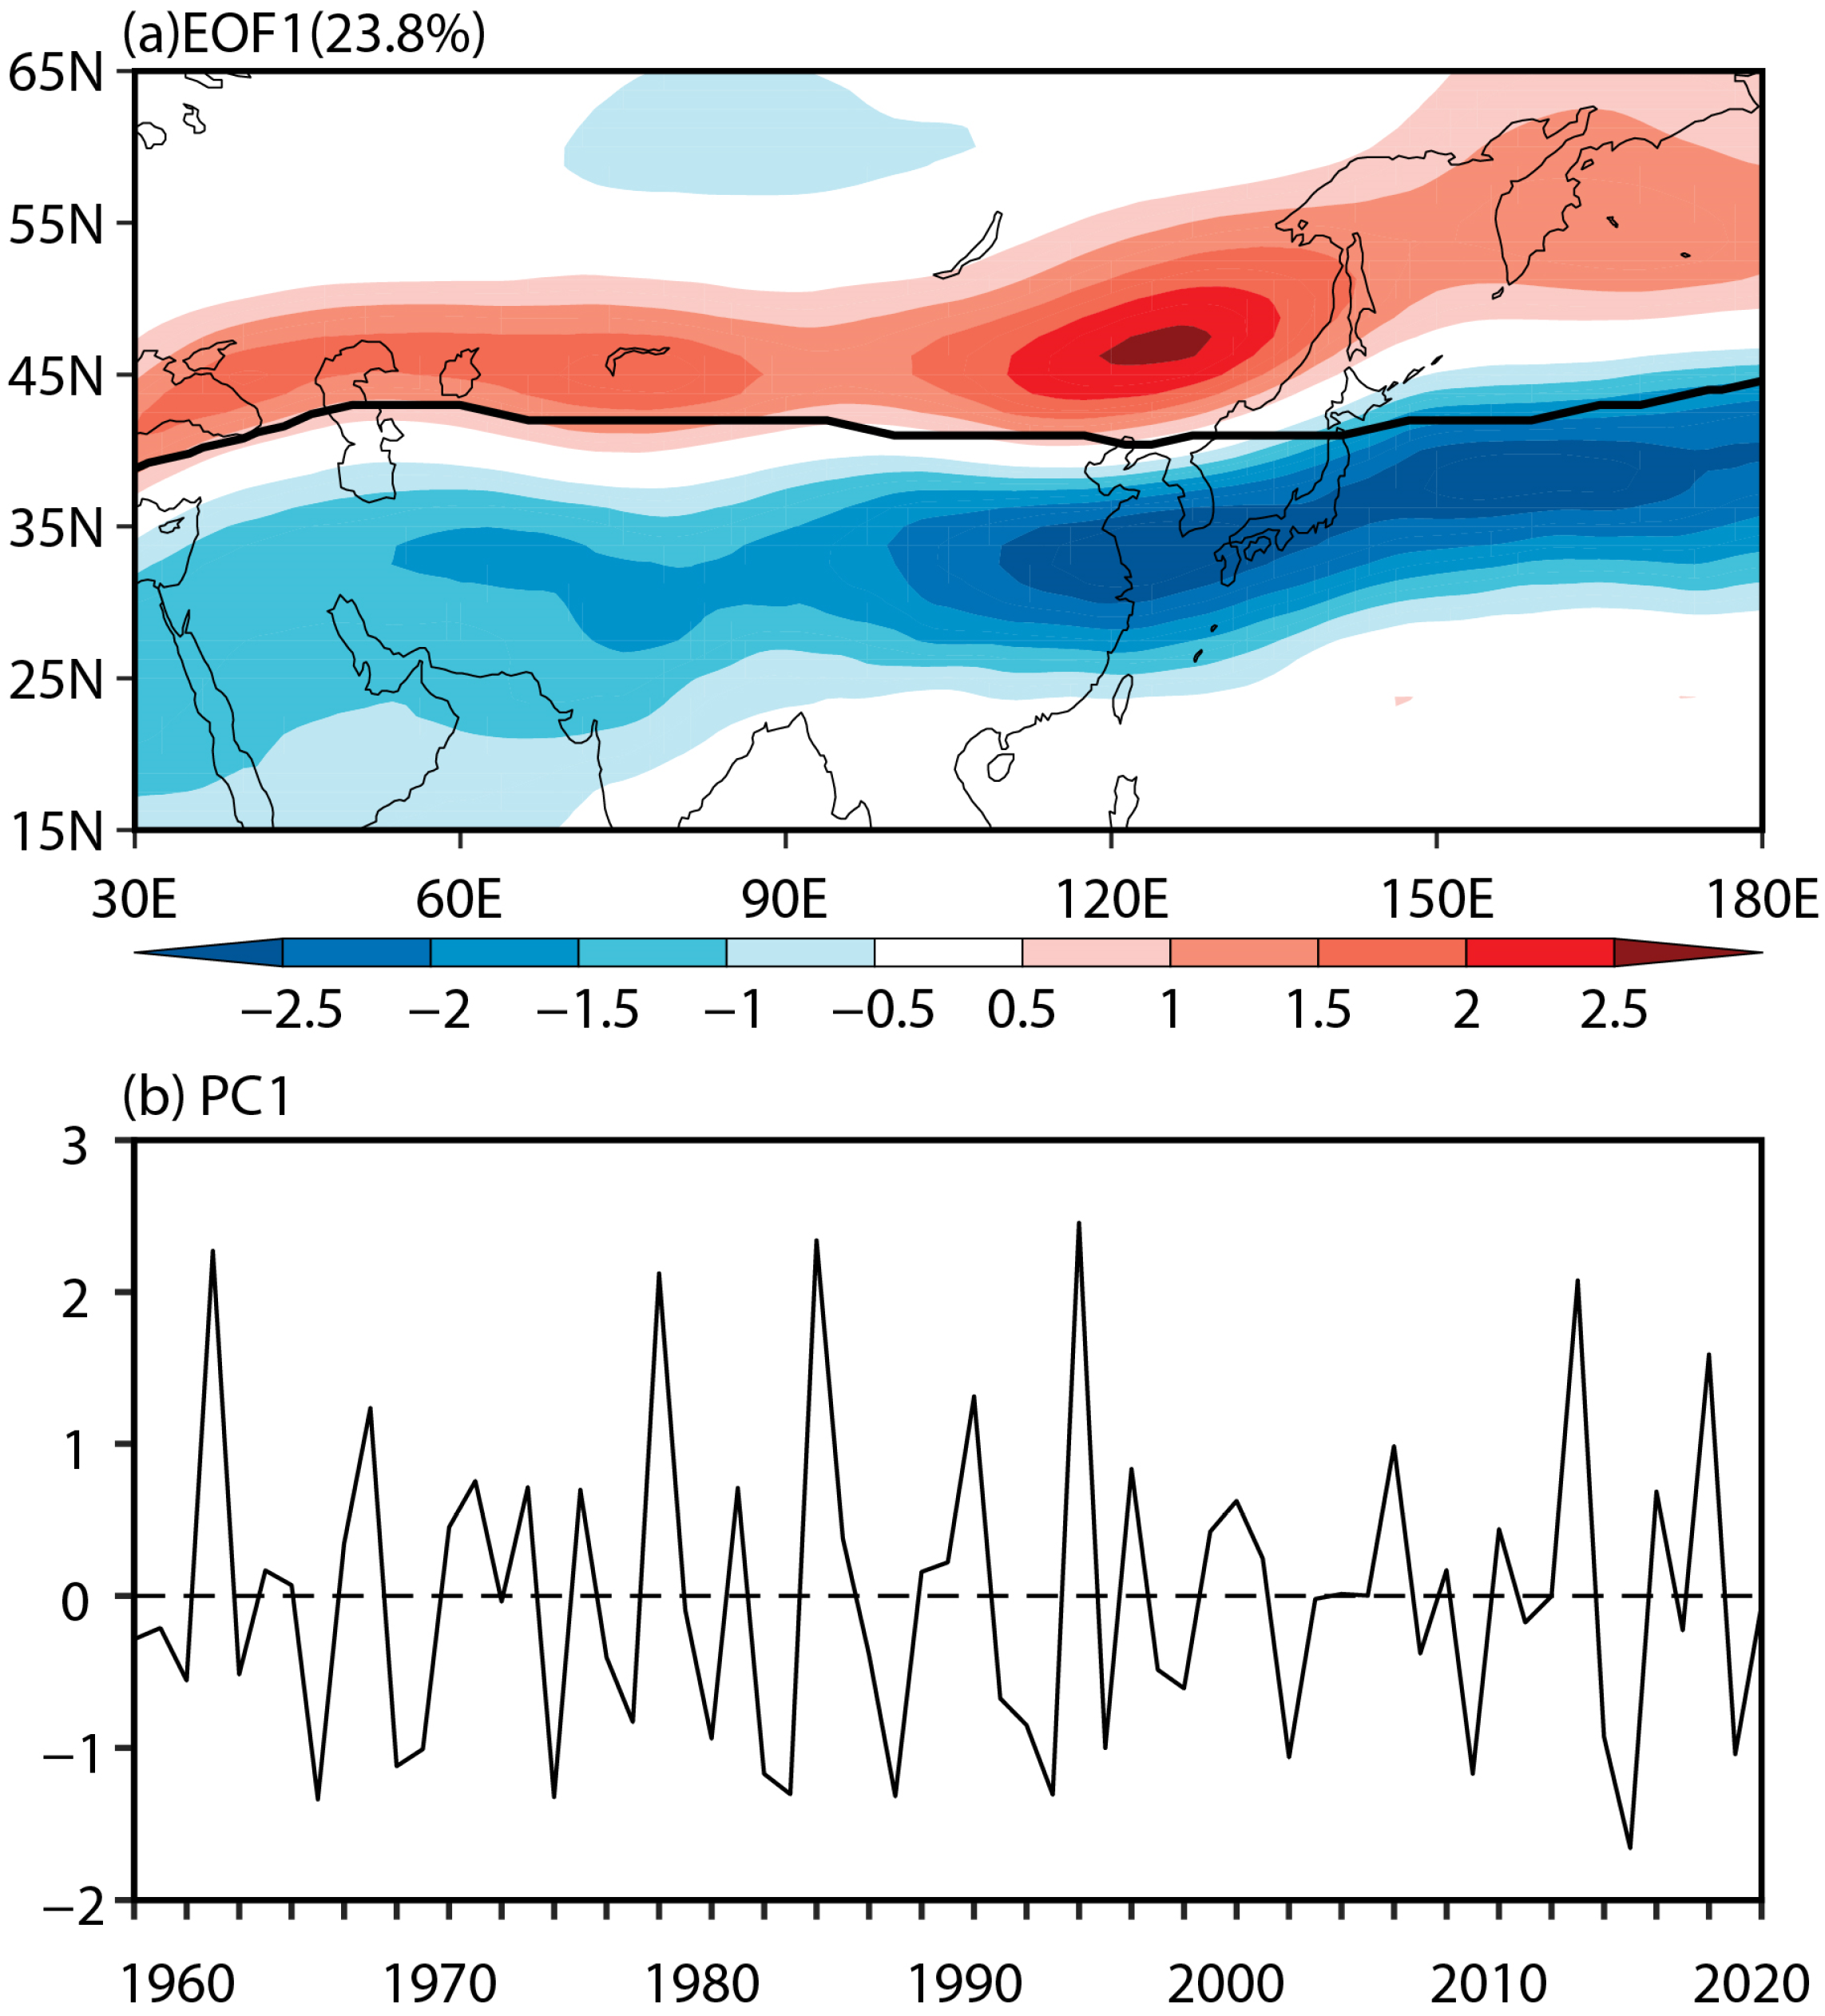
To further depict the characteristics of the summer AWJ, we apply the EOF analysis on the 200 hPa zonal wind anomalies over the region of 15° N–65° N, 30° E–180° E. Figure 2 shows the leading EOF mode of the 200 hPa zonal wind anomalies and its corresponding principal component. Here, the leading EOF explains about 24% of the total variance of interannual variability of the summer 200 hPa zonal wind anomalies over the region of 15° N–65° N, 30° E–180° E and shows a meridional shifting pattern of the AWJ with the positive phase exhibiting positive (negative) zonal wind anomalies to the north (south) of the jet axis (Figure 2a). Such a positive phase of the leading EOF mode of the 200 hPa zonal wind anomalies reflects that the summer AWJ shifts northward. We also use the jet meridional displacement index (JMDI) that was defined by Hong and Lu [16], to quantify the MSJ. The JMDI is denoted as the difference in the 200 hPa zonal wind anomalies between the region of 40° N–55° N, 40° E–150° E and 25° N–40° N, 40° E–150° E, whereby the correlation coefficient of it with the first principal component (PC1) is 0.92 at significance levels of p < 0.001 (Figure 2b). This further suggests that the main variability of the summer AWJ is its shifting in latitudes.

Figure 2.
(a) The leading mode of the empirical orthogonal function (EOF) analysis of the 200 hPa zonal wind anomalies over the region of 15° N–65° N, 30° E–180° E for the period of 1958–2020. (b) Time series of the first principal component (PC1) of the EOF analysis on the 200 hPa zonal wind anomalies over the region of 15° N–65° N, 30° E–180° E.
Previous studies have suggested that the leading mode of the summer AWJ is closely associated with the developing ENSO mode, with a developing La Nina state usually causing the AWJ to shit northward through Gill responses [16,36]. Recently, our studies [39] have suggested that the spring TNAT pattern can serve as a trigger for the ENSO events. This implies that there might also be a close relationship between the spring North Atlantic SST anomalies and the MSJ. To test this hypothesis, we present the correlations of the summer MSJ index with the spring SST anomalies in Figure 3. Here, the preceding winter Nino3.4 SST-related signals are removed since the spring North Atlantic SST anomalies are closely related to the preceding winter ENSO forcing [40]. Indeed, the leading EOF mode of the 200 hPa zonal wind anomalies is closely associated with the SST conditions over the equatorial central and eastern Pacific, with the northward shift of the summer AWJ related to a La Niña state during the preceding spring. However, in addition to the equatorial Pacific, we notice that there are also remarkable correlations in the North Atlantic, which feature a “+ - +” distribution pattern from the tropics to the high latitudes. This suggests that the leading mode of the summer AWJ is also closely associated with the preceding spring TNAT anomalies. We also adopted the singular value decomposition (SVD) analysis on the spring SST anomalies over the North Atlantic and the following summer 200 hPa zonal wind anomalies over the region of 15° N–65° N, 30° E–180° E (Figure S3 in the Supplementary Materials). The first SVD mode explains about 41% of the total variance between the two fields and captures a ‘+ - +’ tripole SST pattern over North Atlantic and a northward shift of the AWJ over the Asia–Pacific region. Additionally, the correlation coefficient between the associated time series also reaches 0.55 at a significance level of p < 0.001. All these further confirm that the MSJ is closely associated with the preceding spring TNAT anomalies.
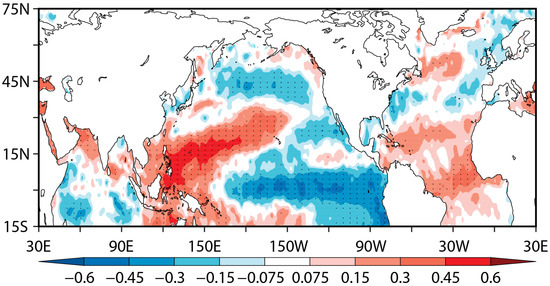
Figure 3.
Correlations of the summer meridional shift of the AWJ (MSJ) index with the spring sea surface temperature (SST) anomalies for the period of 1958–2020. The dots indicate the correlations at a significance level of p < 0.1.
4. Interdecadal Change in the Relationship between the Spring TNAT Anomalies and the Following Summer MSJ
There is a close TNAT-MSJ relationship, with the “+ - +” spring TNAT anomalies conducive to causing the AWJ to shift northward in the following summer. However, such a relationship between them is unstable for the present study period. According to the 21-year sliding correlations between the spring TNAT index and the MSJ index, we identify that there has been a strengthening in the TNAT-MSJ relationship since the early 1990s (Figure 4). Specifically, the 21-year sliding correlations become statistically significant in the year of 2004, suggesting that the TNAT-MSJ relationship becomes significant for the period of 1994–2014. Before 1994, it can be sure that the relationship between them is weak and insignificant. The 15-year window is also used to examine the decadal change. It is similar to that using the 21-year window, exhibiting a remarkably strengthened relationship in recent decades (Figure 4). Thus, we choose the year 1994 as the turning point and suggest that the TNAT-MSJ relationship is weak and insignificant for the period of 1958–1993 (the early epoch), but significantly strengthened for the period of 1994–2020 (the post epoch).

Figure 4.
Normalized time series of the spring tripole North Atlantic SST (TNAT) index (black solid line) and the summer MSJ index (black dashed line) for the period of 1958–2020. The solid blue line denotes their 21-year sliding correlation coefficients, with the dashed blue line denoting a significance level of p < 0.05. The solid red line denotes the 15-year sliding correlation coefficients, with the dashed red line denoting a significance level of p < 0.05.
To further depict the difference in the TNAT-MSJ relationship between the prior and post epochs, we compare the correlations of the meridional shift of the summer MSJ index with the spring SST anomalies during these two epochs (Figure 5). In both epochs, the northward shift of the summer AWJ is closely associated with the SST anomalies in the equatorial central and eastern Pacific. However, in the North Atlantic, the correlation coefficients exhibit large differences between the prior and post epochs. Remarkably, during the early epoch, the correlation coefficients over the North Atlantic are chaotic and do not exhibit a tripole pattern. By contrast, during the post epoch, there is a significant “+ - +” correlation pattern in the North Atlantic. We also calculate the correlation coefficient between the spring TNAT index and the MSJ index for the early and post epochs, which is only 0.02 (very weak and insignificant) for the early epoch but 0.38 (p < 0.05) for the post epoch. All these further suggest that there has been a closer TNAT-MSJ relationship since the early 1990s.
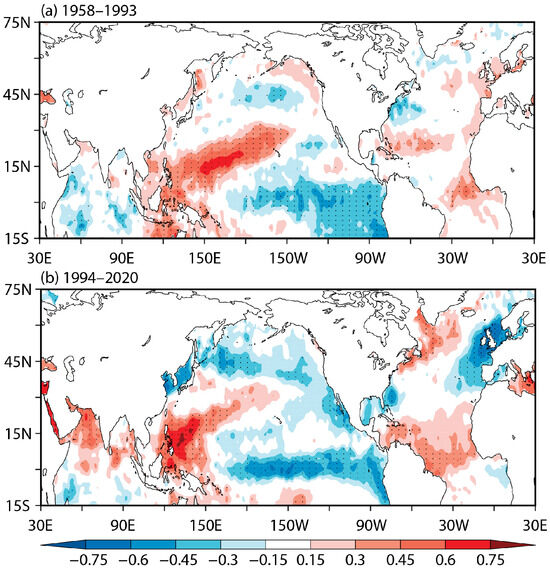
Figure 5.
(a) Correlations of the summer MSJ index with the spring SST anomalies for the period of 1958–1993. (b) Same as (a), but for the period of 1994–2020. The dots indicate the correlations at a significance level of p < 0.1.
5. Mechanisms for the Strengthened Relationship between the Spring TNAT Anomalies and the Following Summer MSJ
5.1. Interdecadal Change in the Intensity of the Spring TNAT Anomalies
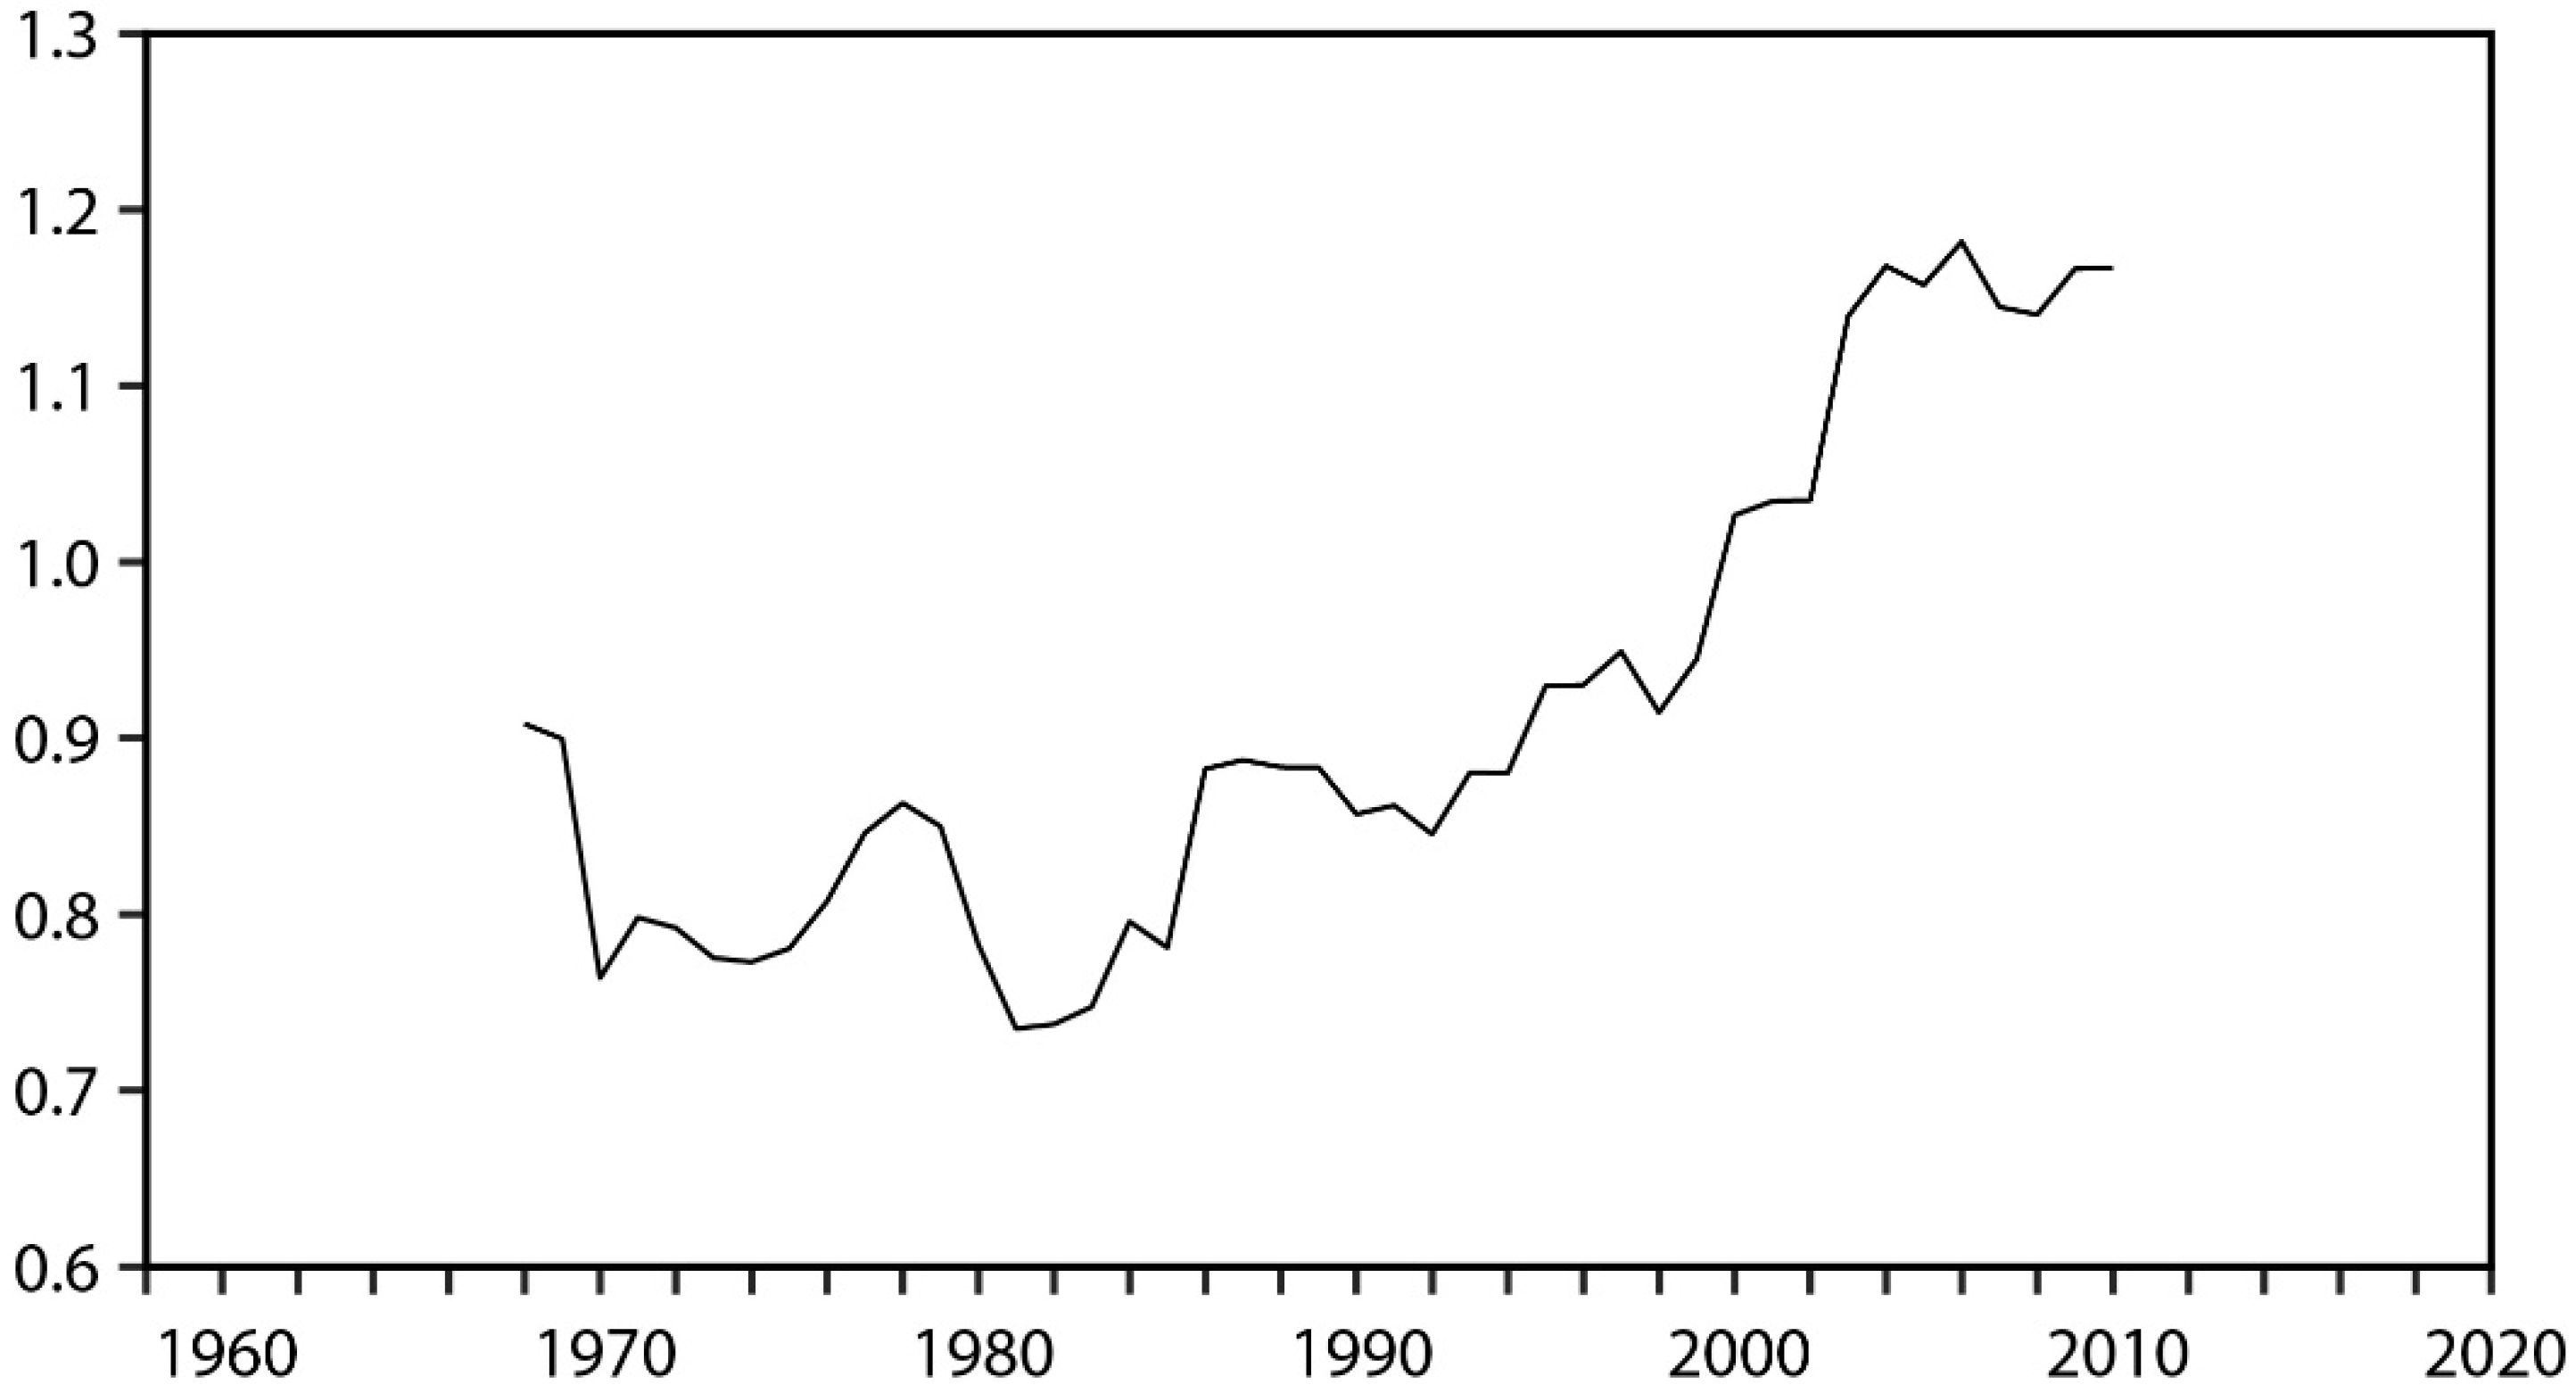
It is reported that the spring TNTA anomalies also undergo an interdecadal change around the early 1990s [50]. In Figure 6, we present the 21-year sliding standard deviation of the spring TNAT index, which can reflect the changes in the intensity of the spring TNAT anomalies. Results, indeed, show a strengthened intensity of the spring TNAT anomalies in recent decades, which is consistent with previous studies [50]. Additionally, we notice that variations in the 21-year sliding standard deviation of the spring TNAT index are somewhat similar to the variations in the 21-year sliding correlations in Figure 4. Especially in the most recent three decades, as the variance of the spring TNAT index increases, the 21-year sliding correlation coefficient also increases and becomes significant. By contrast, before 1994, corresponding to the relatively weak intensity of the spring TNAT anomalies, the 21-year sliding correlation coefficient is also weak and chaotic. This implies that only when the intensity of the spring TNAT anomalies is sufficiently large, there is a close linkage between the spring TNAT anomalies and the summer MSJ.

Figure 6.
The 21-year sliding standard deviation of the spring TNAT index.
5.2. Interdecadal Change in the TNAT-Induced Pan-Tropical Ocean–Atmospheric Interactions
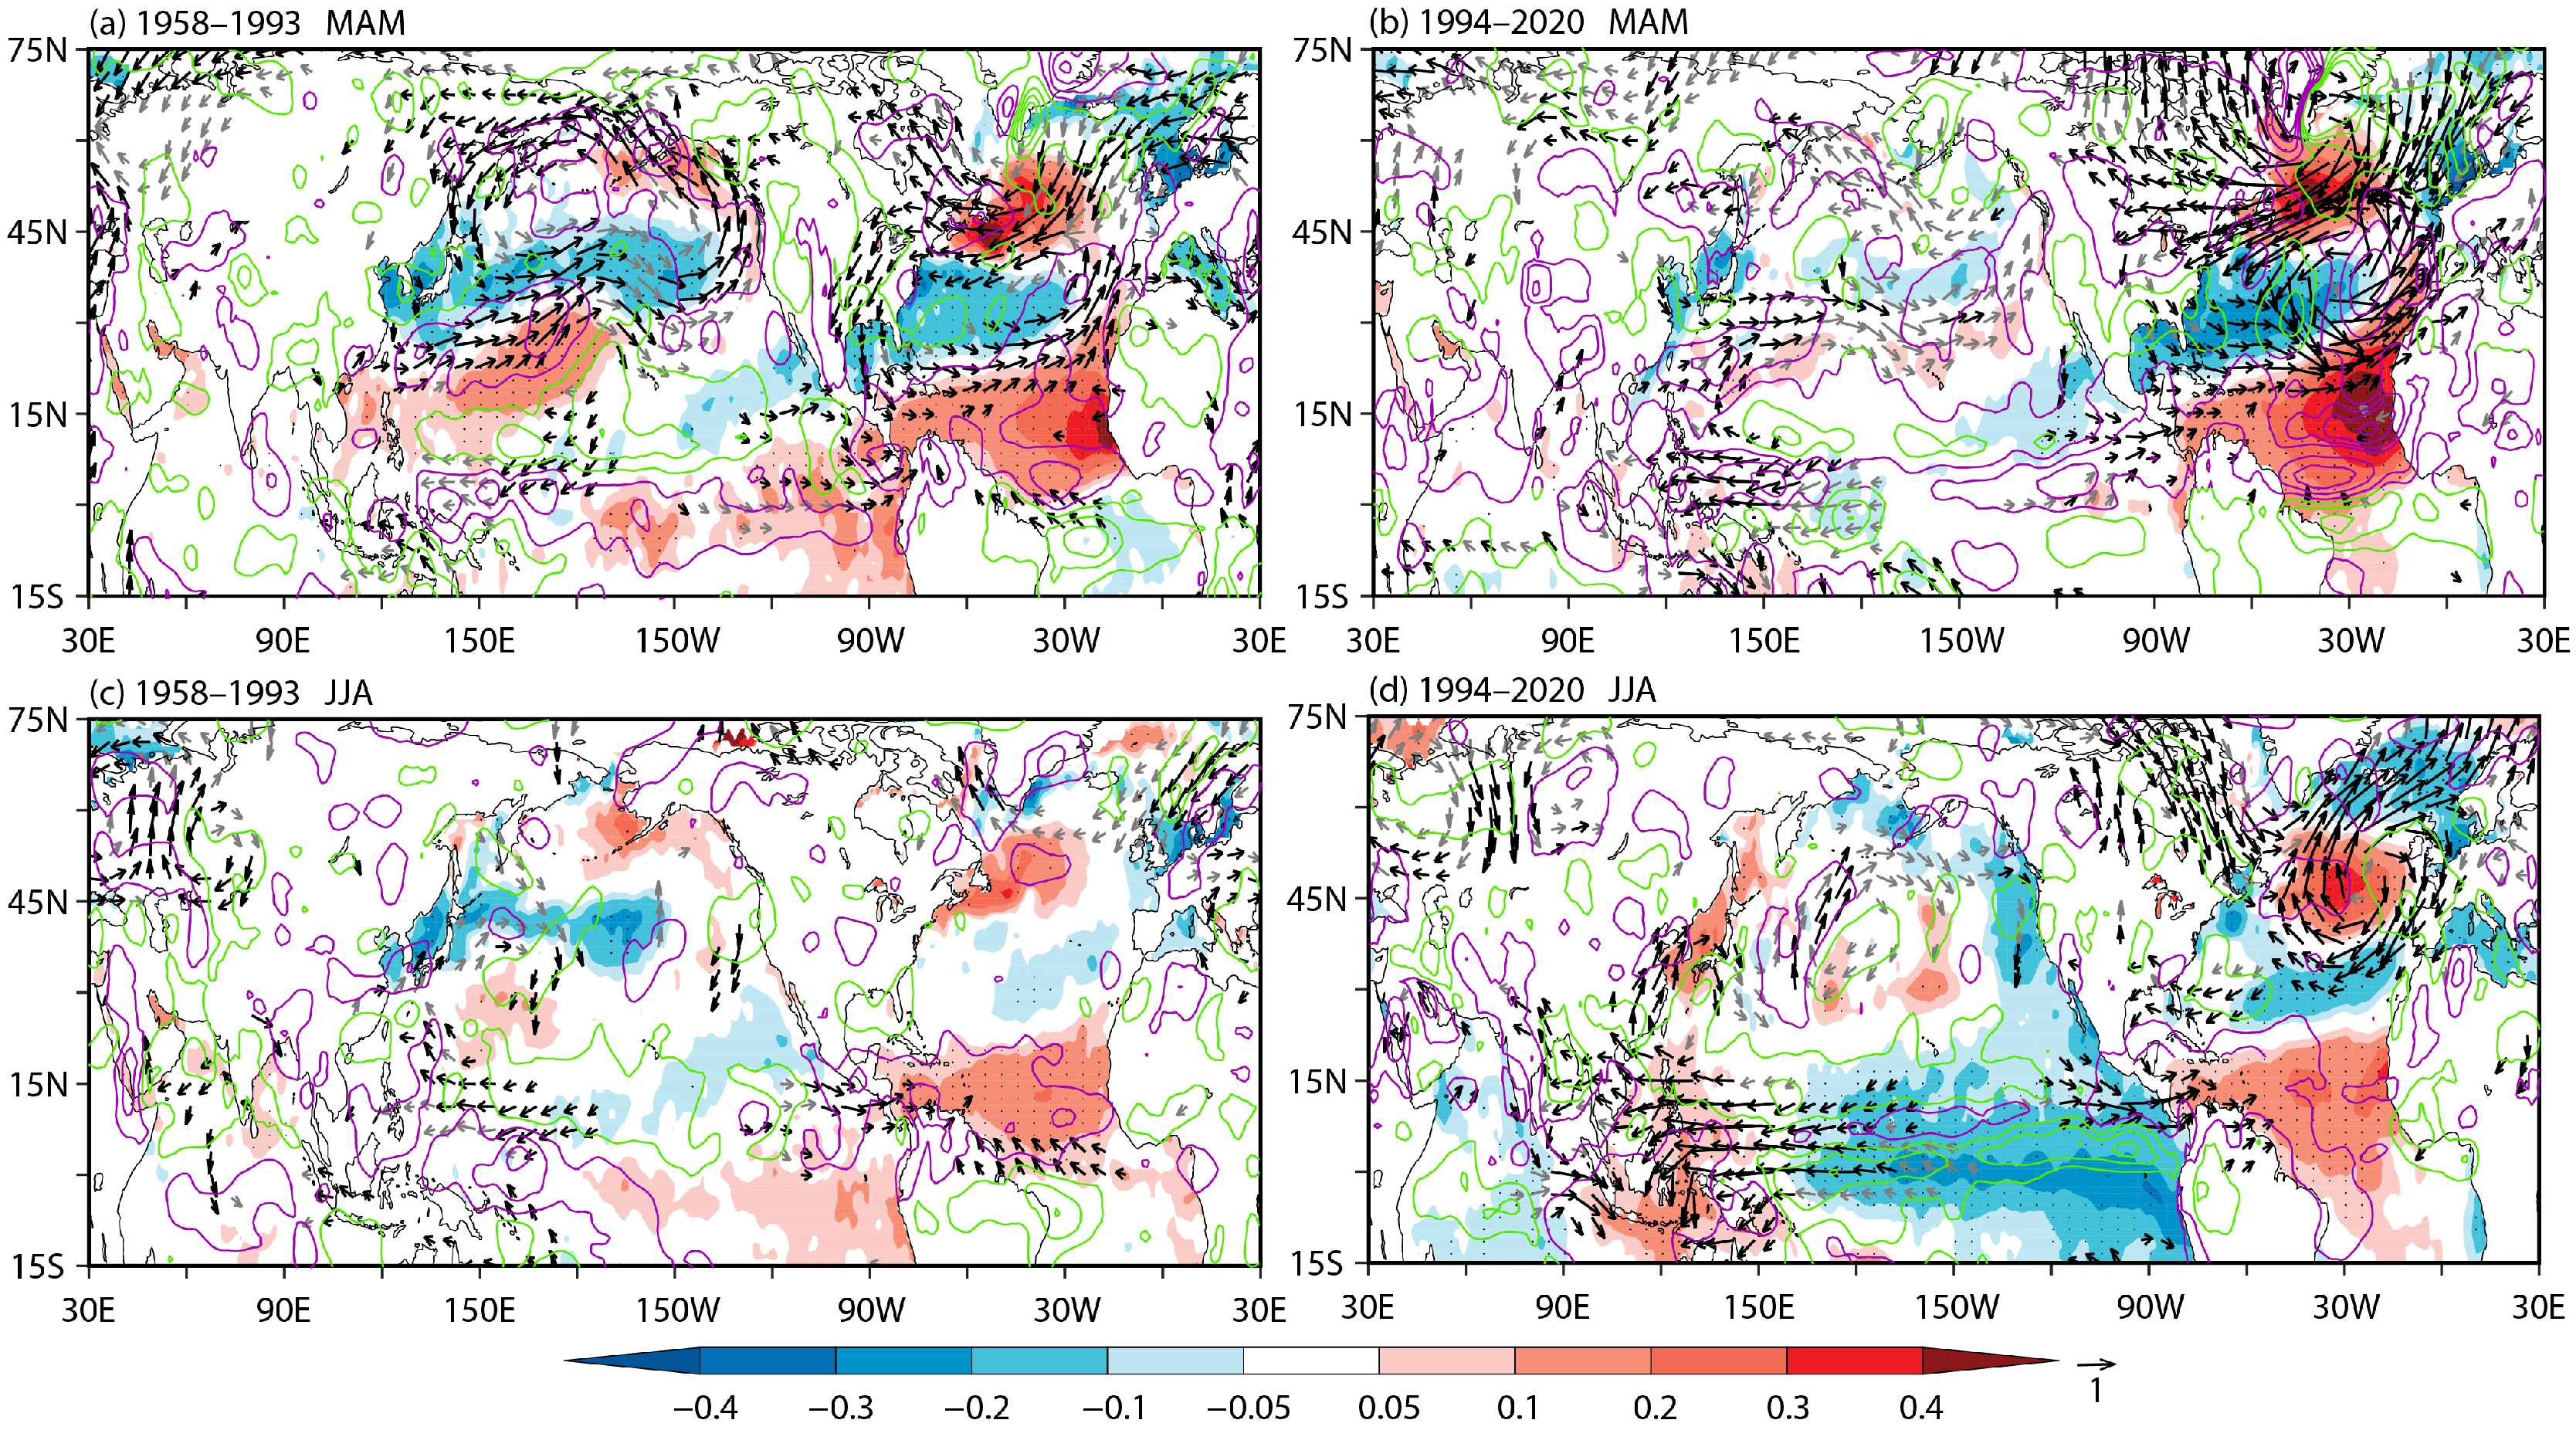
To further explore how this changed intensity of the spring TNAT anomalies causes a change in the response of the summer AWJ, the TNAT-induced pan-tropical ocean–atmospheric interactions in the prior and post epochs are analyzed. Figure 7 compares the spring to summer SST and low-level wind anomalies regressed onto the spring TNAT index between the prior and post epochs. Indeed, the spring TNAT-induced pan-tropical ocean–atmospheric interactions in the post epoch are much stronger than those in the prior epoch. Specifically, in response to the stronger “+ - +” North Atlantic SST anomalies in the post epoch, there is a stronger convective activity over the tropical North Atlantic. The associated diabatic heating gives rise to a stronger Gill-type response, exhibiting stronger easterly wind anomalies over the Indo-western Pacific in a Kelvin wave response and stronger cyclonic circulation anomalies over the eastern Pacific in a Rossby wave response (Figure 7a,b) [39,40,43,45]. As suggested by Li et al. [43], easterly wind anomalies over the equatorial western Pacific can cause the Indo-western Pacific to warm and the central Pacific to cool through wind–evaporation–SST (WES) feedbacks and the northeasterly wind anomalies in the western flank of the cyclone over the subtropical eastern Pacific superimposing on the northeast trade winds can cause the equatorial eastern Pacific to cool through the WES footprinting mechanism. In contrast to the prior epoch, the stronger easterly wind anomalies and cyclonic circulation anomalies in the post epoch, indeed, contribute to a stronger warming in the Indo-western Pacific and cooling in the central and eastern Pacific (Figure 7c,d).
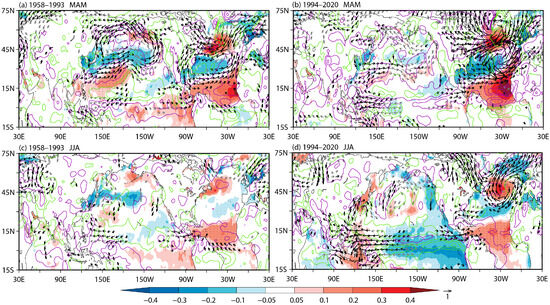
Figure 7.
Regressions of (a) spring and (c) summer SST (shaded; °C), 500 hPa omega (contours; pa s−1; positive upward; the interval is 3 × 10⁻⁴ pa s−1 with the green/purple contours denoting negative/positive values) and 850 hPa wind anomalies (arrows; m s−1) onto the spring TNAT index for the period of 1958–1993. (b,d) Same as (a,c), but for the period of 1994–2020. The dots indicate the regressed SST anomalies at a significance level of p < 0.1. The black arrows indicate the zonal or meridional components of the wind anomalies at a significance level of p < 0.1. Wind speeds less than 0.25 m s−1 are not shown. The absolute values of the omega anomalies less than 1.5 × 10⁻⁴ pa s−1 are not shown.
Figure 8 compares the summer 200 hPa velocity potential, divergent wind, and precipitation anomalies regressed onto the spring TNAT index between the prior and post epochs. It is worth noting that, corresponding to the intensified warming in the Indo-western Pacific and cooling in central and eastern Pacific in the post epoch (Figure 7d), there are stronger positive precipitation anomalies in the Indo-western Pacific and negative precipitation anomalies in the central and eastern Pacific (Figure 8b). The positive SST–precipitation relationship over the Indo-western Pacific and the central Pacific indicates that the Indo-western Pacific SST anomalies caused by the Atlantic further force the atmospheric circulation anomalies, resulting in deep convection in the Indo-western Pacific and suppressed convection in the central and eastern Pacific [43]. The negative upper-level velocity potential accompanied by the divergent wind in the Indo-western Pacific and the positive velocity potential accompanied by the convergent wind in the central and eastern Pacific also suggests that there are enhanced ascending motions in the Indo-western Pacific and descending motions in the central and eastern Pacific. All of these correspond to the enhanced Indo-Pacific Walker circulation, where the related low-level easterly anomalies over the Pacific are further favorable for warming in the Indo-western Pacific region and cooling in the central Pacific through WES feedback [40,43]. Our results are consistent with previous studies [40,43], indicating a positive feedback between the SST and the atmospheric circulations (Figure 7d and Figure 8b). In contrast, in the prior epoch, the spring TNAT anomalies are weaker and the Walker circulation responses also get weakened, indicating weaker pan-tropical ocean–atmospheric interactions in this epoch.
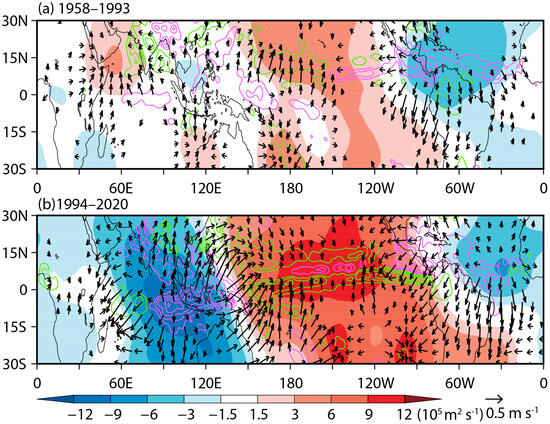
Figure 8.
Regressions of the summer 200 hPa velocity potential (shaded; 105 m2 s−1), divergent wind (arrows; m s−1), and precipitation (contours; mm month−1; the interval is 7.5 mm month−1 with the green/purple contours denoting negative/positive values) anomalies onto the spring TNAT index for the period of (a) 1958–1993 and (b) 1994–2020. Wind speeds less than 0.1 m s−1 are not shown.
5.3. Interdecadal Change in the Summer AWJ Responses
Figure 9 presents the summer 200 hPa air temperature and wind anomalies regressed onto the spring TNAT index in the prior and post epochs. Indeed, corresponding to the prominent cooling in the equatorial central and eastern Pacific in the post epoch, there is a cold Kelvin wave accompanied by easterly wind anomalies over the equatorial eastern Pacific, Atlantic, and Indian Ocean and a cold Rossby wave accompanied by an anomalous cyclone over the Northwest Pacific. Though such a cold Gill response excited by the central and eastern Pacific cooling is somewhat weakened by the warm Gill responses excited by the anomalous warming in the Indo-western Pacific and Atlantic, it still dominates in the tropics. As a result, there is a general upper-tropospheric cooling over the tropics (5° S–15° N) in the post epoch (Figure 9b). By contrast, in the prior epoch, there is only a very weak cooling in the central Pacific. Additionally, the tropics are dominated by a prominent warming in the tropical North Atlantic. As the cold Kelvin wave excited by the central Pacific cooling is offset by the warm Gill response excited by the tropical North Atlantic warming, there is only a weak cold Rossby wave response in the subtropical Northwest Pacific. In other tropical regions, the warm Gill response excited by the tropical North Atlantic warming dominates. As a result, there is a dipole mode of the upper-tropospheric temperature over the tropics in the prior epoch, with cooling in the west of the Pacific Ocean and warming in other tropical regions (Figure 9a).
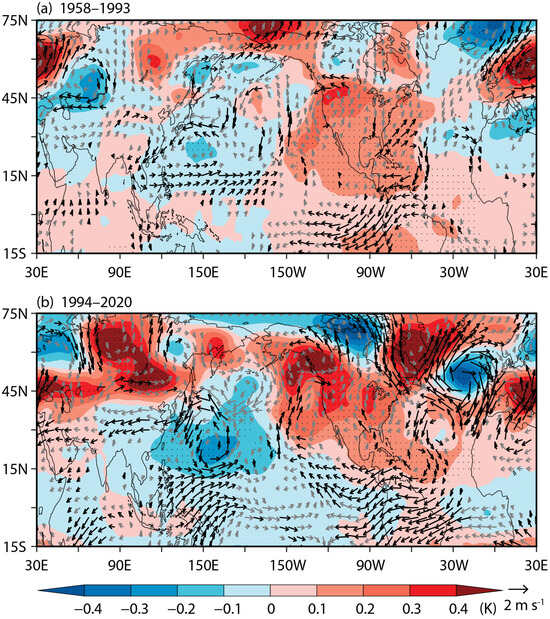
Figure 9.
(a) Regressions of the summer 200 hPa air temperature (shaded; K) and wind anomalies (arrows; m s−1) onto the spring TNAT index for the period of 1958–1993. (b) Same as (a), but for the period of 1994–2020. The dots indicate the regressed air temperature anomalies at a significance level of p < 0.1. The black arrows indicate the zonal or meridional components of the wind anomalies at a significance level of p < 0.1. Wind speeds less than 0.25 m s−1 are not shown.
When focusing on the Indo-western Pacific region, it can be clearly seen that there are large differences in the structure of the upper-tropospheric temperature between the prior and post epochs. While the Indo-Pacific region exhibits a coherent upper-tropospheric cooling in the post epoch (Figure 9b), it displays a dipole mode of the upper-tropospheric temperature in the prior epoch, exhibiting warming in the west but cooling in the east (Figure 9a). We also notice that, corresponding to the anomalous upper-tropospheric warming/cooling over the west part of the Indo-western Pacific in the prior/post epoch, there is a prominent upper-tropospheric cooling/warming in the extratropics (Figure 9). Such an extratropical response may be associated with the changes in the eddy-driven meridional circulation [55]. All this would contribute to a different gradient of the meridional temperature over the subtropical Asian region and thus a different response of the AWJ.
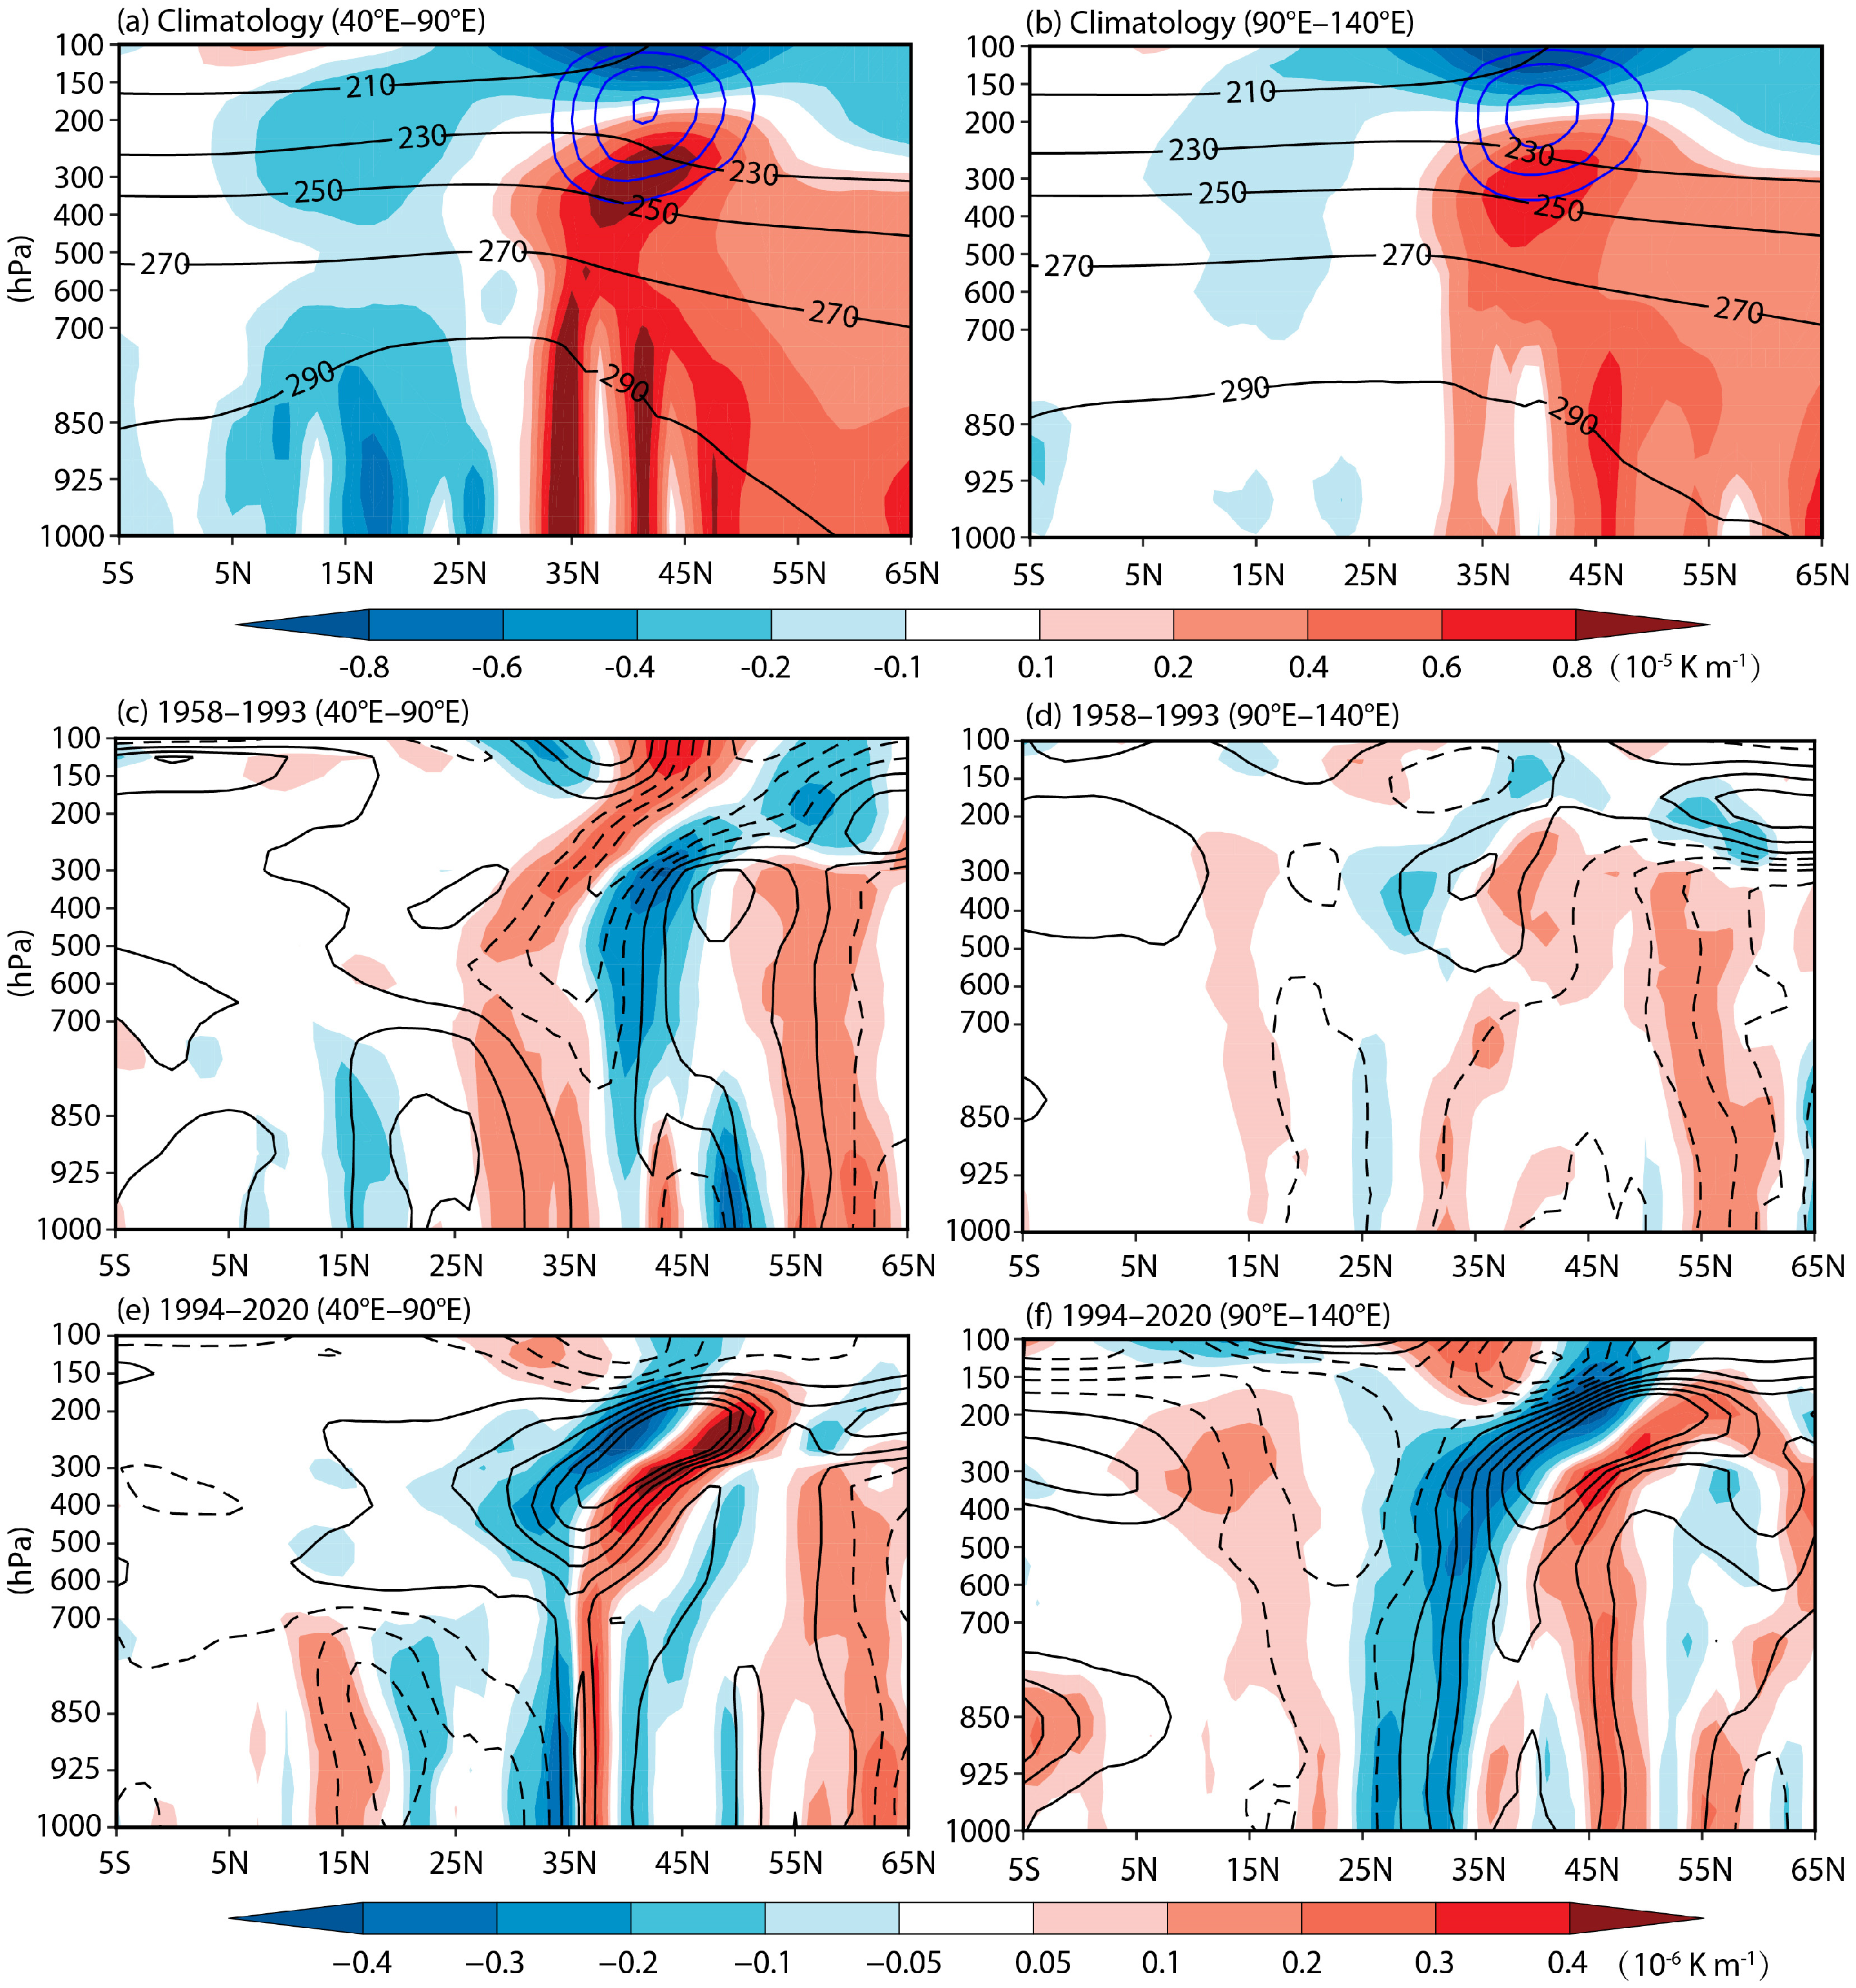
To further depict such differences in the structure of the upper-tropospheric temperature over the Indo-western Pacific region and the gradient of the meridional temperature over the subtropical Asian region between the prior and post epochs, we present the regressed height–latitude cross-section of the summer anomalous tropospheric temperature and its meridional gradient averaged in 40° E–90° E and 90° E–140° E for the prior and post epochs in Figure 10. As there is a general upper-tropospheric cooling over the Indo-western Pacific and a latitude belt of warming over the mid–high latitude of Asia (35° N–50° N) in the post epoch, the poleward gradient of the upper-tropospheric temperature over the subtropical West Asia and East Asia both weakens compared with the climatology (Figure 10a,b,e,f). By contrast, in the prior epoch, the warm upper-tropospheric temperature over the western part of the Indo-western Pacific contributes to an enhanced meridional gradient of the upper-tropospheric temperature, while the cold upper-tropospheric temperature over the eastern part of the Indo-western Pacific contributes to a weakened meridional gradient of the upper-tropospheric temperature (Figure 10a–d). There is an opposite structure of the poleward gradient of the upper-tropospheric temperature between the subtropical West Asia and East Asia (Figure 10c,d).

Figure 10.
The height–latitude cross-section of the summer climatological tropospheric temperature (contours; K) and its meridional gradient (shaded; 10−5 K m−1) averaged between (a) 40° E–90° E, (d) 90° E–140° E. (b,e) same as (a,d), but for the summer anomalous tropospheric temperature (contours; K; the interval is 0.05 K) and its meridional gradient (shaded; 10−6 K m−1) regressed onto the spring TNAT index for the period of 1958–1993. (c,f) same as (b,e), but for the period of 1994–2020. The absolute values of the tropospheric temperature anomalies less than 0.025 K are not shown.
Physically, the MSJ is closely associated with the meridional gradient of the upper-tropospheric temperature over the subtropical Asian region according to the thermal wind relation [36]. Figure 11 presents the height–latitude cross-section of the summer zonal wind averaged in 40° E–90° E and 90° E–140° E regressed onto the spring TNAT anomalies for the prior and post epochs. Indeed, in both epochs, variations in the zonal wind anomalies are highly consistent with the meridional gradient of the upper-tropospheric temperature from low level to high level. Corresponding to the weakened poleward gradient of the upper-tropospheric temperature over both the subtropical West and East Asian region in the post epoch, there are uniform negative/positive zonal wind anomalies south/north of the climatological westerly jet, indicating a northward migration of the summer AWJ (Figure 11b). By contrast, in the prior epoch, corresponding to the strengthened poleward gradient of the upper-tropospheric temperature over the subtropical West Asia but weakened poleward gradient of the upper-tropospheric temperature over the subtropical East Asia, there is a southward shift of the westerly jet over West Asia but a northward shift of the westerly jet over East Asia (Figure 11a).
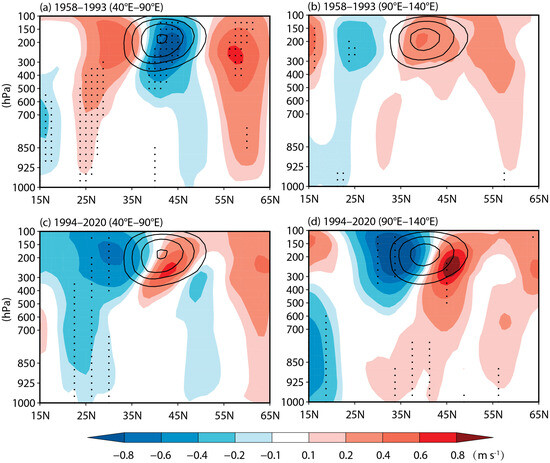
Figure 11.
Regressed height–latitude cross-section of the summer zonal wind anomalies (shaded; m s−1) averaged between 40° E and 90° E onto the spring TNAT index for the period of (a) 1958–1993, (b) 1994–2020. The dots indicate the regressed zonal wind anomalies at a significance level of p < 0.1. The black solid lines are the zonal averaged (40° E–90° E) climatological zonal winds equal to or larger than 15 m s−1 with the interval of 5 m s−1, denoting the westerly jet. (c,d) same as (a,b), but for those averaged between 90° E and 140° E.
We also present the summer 200 hPa zonal wind anomalies regressed onto the spring TNAT anomalies for the prior and post epochs to directly show the different responses of the summer upper-tropospheric AWJ in these two epochs (Figure 12). Results further show that there is a uniform northward shift of the AWJ over the upper troposphere in response to the spring “+ - +” TNAT anomalies in the post epoch (Figure 12b), which is highly similar to the leading mode of the summer upper-tropospheric AWJ (Figure 2). However, in the prior epoch, the AWJ displays an opposite mode, exhibiting a southward shift over West Asia but a northward shift over East Asia (Figure 12a). This is somewhat similar to the second EOF mode of the summer 200 hPa zonal wind anomalies over Asia [36].

Figure 12.
(a) Regressions of the summer 200 hPa zonal wind anomalies (m s−1) onto the spring TNAT index for the period of 1958–1993. (b) Same as (a), but for the period of 1994–2020. The dots indicate the regressed zonal wind anomalies at a significance level of p < 0.1. The black line denotes the AWJ axis.
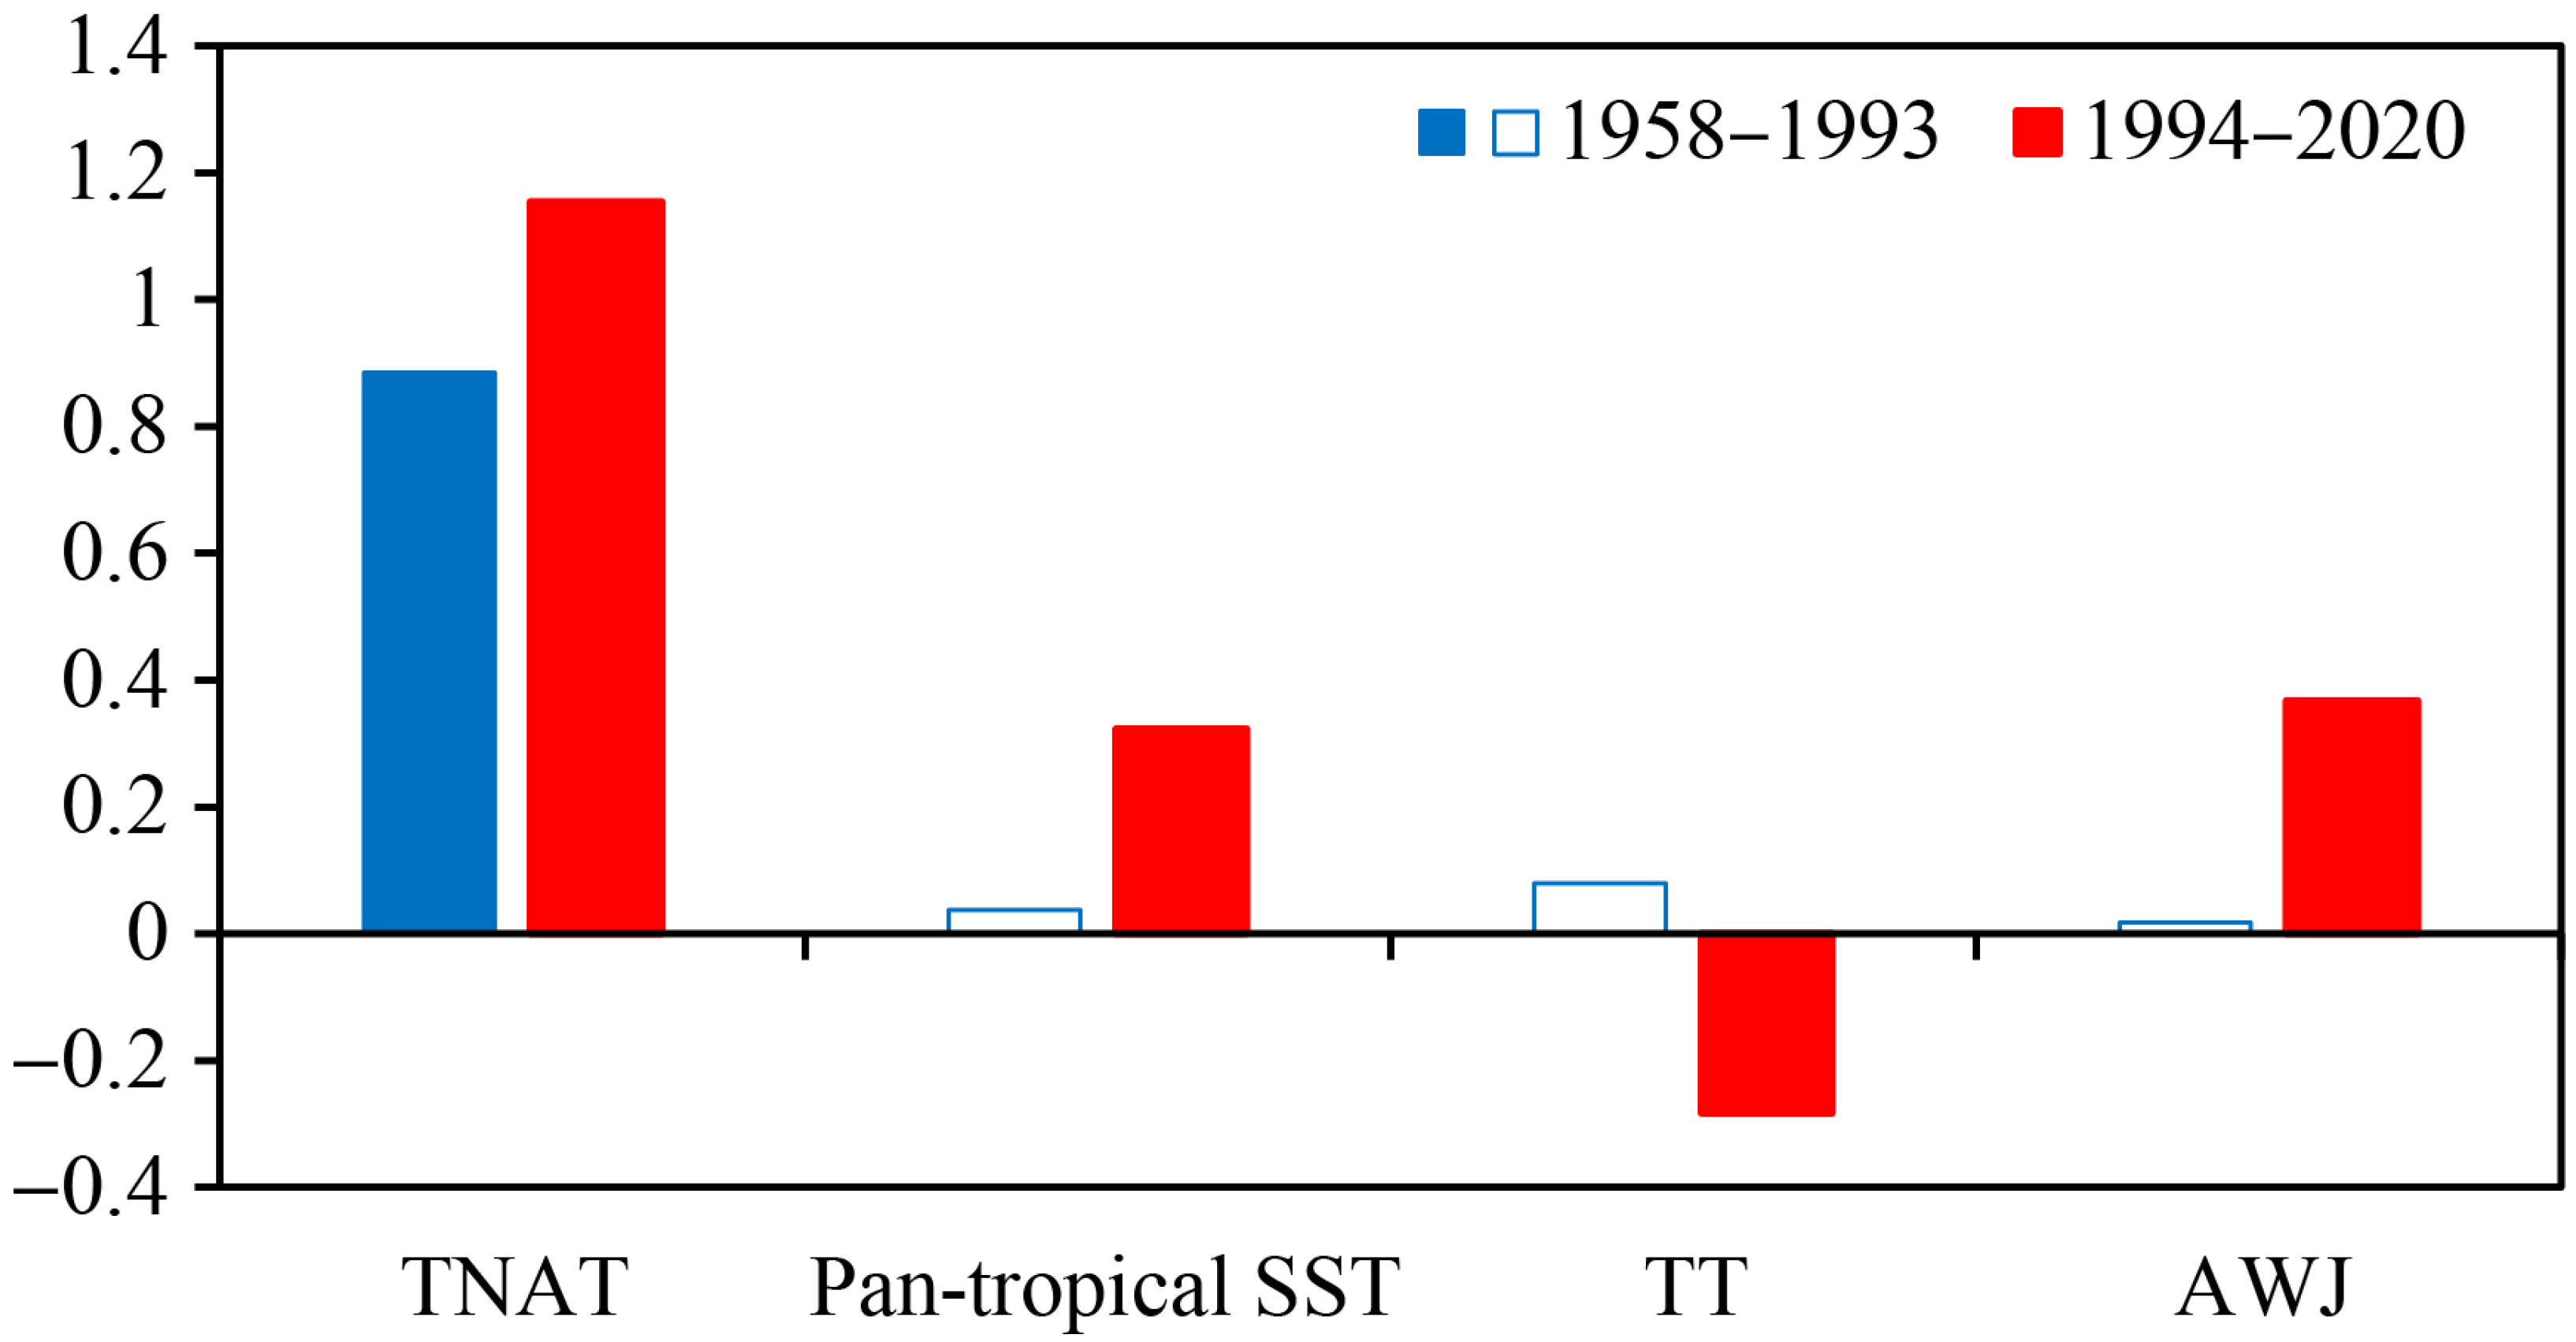
In general, this study reveals that there is a changed intensity of spring TNAT anomalies in the most recent three decades, which induces changes in the responses of the summer AWJ via a series of ocean–atmospheric interactions. In Figure 13, we further show the processes of such changed effects of the spring TNAT anomalies on the following summer AWJ. Remarkably, compared to the early epoch, there are stronger spring TNAT anomalies in the post epoch. Via a series of ocean–atmospheric interactions, such stronger spring TNAT anomalies contribute to a stronger pan-tropical SST response, with the regressed pan-tropical SST index onto the spring TNAT index in the post epoch much stronger and almost eight times larger than that of the prior epoch. Such stronger summer pan-tropical SST anomalies in the post epoch, especially the prominent cooling in the central and eastern Pacific exerts a uniform cooling over the whole tropics through Gill responses. This weakens the poleward gradient of the upper-tropospheric temperature over the subtropical Asia and leads to a northward shift of the AWJ via thermal wind relation. The regressed summer meridional gradient of the upper-tropospheric temperature index and the summer MSJ index onto the spring TNAT index, which are largely changed in the post epoch, further support this stronger response of the summer AWJ shifting in latitudes since the early 1990s. All these explain why there is a strengthened TNAT-MSJ relationship in the most recent three decades.

Figure 13.
Spring TNAT index, summer pan-tropical SST index, summer poleward gradient of the 200 hPa tropospheric temperature (TT) index, and the summer MSJ index regressed onto the spring TNAT index for the periods of 1958–1993 (blue bars) and 1994–2020 (red bars). The solid bars indicate the regressed indices at a significance level of p < 0.1. All data are standardized.
6. Conclusions and Discussions
6.1. Conclusions
The AWJ is a crucial upper-tropospheric circulation system of the East Asian climate during boreal summers prevailing in the mid to high latitudes of the Asia–Pacific region. Its shifting in latitudes is one important characteristic of its variability and has great impact on the seasonal migration of the East Asian summer monsoon rainband [16,18]. This study finds that spring TNAT anomalies induced by spring NAO can exert a significant impact on the summer MSJ, with the “+ - +” spring TNAT anomalies usually causing a northward shift of the AWJ in the following summer. However, such a climatic effect of spring TNAT anomalies on the summer MSJ is unstable, showing an obvious strengthening since the early 1990s.
Further analyses reveal that such an interdecadal strengthening in the TNAT-MSJ relationship originates from a strengthened intensity of spring TNAT anomalies in recent decades. Compared to the prior epoch, the stronger intensity of interannual variability of the spring “+ - +” TNAT anomalies in the post epoch causes a stronger pan-tropical climate response with more prominent cooling in the central Pacific and warming in the Indo-Pacific until the following summer via a series of ocean–atmosphere interactions. Through Gill responses, such stronger summer pan-tropical SST anomalies, especially, the prominent cooling in the central and eastern Pacific, exert a uniform cooling over the whole tropics. This weakens the poleward gradient of the upper-tropospheric temperature over the subtropical Asia and leads to a northward shift of the AWJ via thermal wind relation. By contrast, in the prior epoch, in association with the negative phase of the AMO, the relatively weaker intensity of the spring “+ - +” TNAT anomalies induces a weaker central Pacific cooling in the following summer and the tropics are dominated by the persistent SST warming in the tropical North Atlantic. Through Gill responses, these contribute to a dipole mode of the upper-tropospheric temperature over the Indo-western Pacific region and thus an opposite structure of the poleward gradient of the upper-tropospheric temperature between the subtropical West and East Asia. As a result, there is a southward shift of the westerly jet over West Asia but a northward shift of the westerly jet over East Asia in the prior epoch. Our results of the strengthened TNAT-MSJ relationship suggest that the summer AWJ was prone to shift meridionally in recent decades which has important implications for the seasonal climate prediction over the densely populated East Asia.
6.2. Discussions
Firstly, we highlight the important role of the strengthened intensity of spring TNAT anomalies during recent decades in mediating the summer MSJ. Previous studies have suggested that such a strengthened intensity of the spring TNAT anomalies may originate from a warmer Atlantic due to global warming and/or the shifting of the AMO to the positive phase [43,45,46,49]. This hints that the spring TANT anomalies are prone to cause the summer AWJ shifting in latitudes under a warmer climate. Considering the possible climate extremes that might be brought by the MSJ [18,56,57,58,59], more studies on the variations in the spring TNAT anomalies and their climate effects on the East Asian summer climate under global warming may be needed in the future.
Secondly, in this work, we mainly highlight the summer pan-tropical tropospheric temperature anomalies induced by the spring TNAT anomalies in contributing to the summer MSJ. Note that the upper-tropospheric temperature anomalies over the extratropical Asia can also contribute to the MSJ through thermal wind relation. Changes in the eddy-driven meridional circulation [55] may contribute to such extratropical responses. However, it should be noted that the extratropical upper-tropospheric temperature anomalies are much stronger than those over the tropics. This means that there may be other ways the spring TNAT anomalies contribute to the anomalous upper-tropospheric temperature over the extratropical Asia. The extratropical zonal wave train excited by the TNAT anomalies as mentioned in previous studies [60,61,62,63] might explain this. But it is still unclear how or to what extent this extratropical pathway contributes to the different responses of the summer AWJ before and after 1994. More specific and in-depth work may need to be done in the future.
Supplementary Materials
The following supporting information can be downloaded at: https://www.mdpi.com/article/10.3390/atmos15080922/s1, Figure S1: The EOF analysis of spring SST anomalies over North Atlantic during 1958-2020; Figure S2: A flow chart of this study; Figure S3: The SVD analysis between the spring North Atlantic SST anomalies and the Asian zonal wind anomalies.
Author Contributions
Conceptualization, G.L.; Methodology, L.C.; Software, L.C.; Validation, L.C.; Formal analysis, L.C.; Investigation, L.C.; Resources, L.C.; Data curation, L.C. and J.D.; Writing—original draft preparation, L.C.; Visualization, L.C. and J.D.; Supervision, G.L.; Project administration, L.C.; Funding acquisition, L.C. All authors have read and agreed to the published version of the manuscript.
Funding
This work is supported by the Postgraduate Research & Practice Innovation Program of Jiangsu Province (422003164) and the Fundamental Research Funds for the Central Universities (B220203002).
Institutional Review Board Statement
Not applicable.
Informed Consent Statement
Not applicable.
Data Availability Statement
The SST data were provided by the Hadley Centre of the U.K. Met Office (https://www.metoffice.gov.uk/hadobs/hadisst/data/download.html, accessed on 5 June 2023). The precipitation data are taken from the fifth generation of the European Centre for Medium-Range Weather Forecasts atmospheric reanalysis (https://www.ecmwf.int/en/forecasts/dataset/ecmwf-reanalysis-v5, accessed on 6 June 2023). The atmospheric reanalysis datasets were obtained from the Japan Meteorological Agency (https://jra.kishou.go.jp/JRA-55/index_en.html, accessed on 12 January 2023).
Conflicts of Interest
The authors declare no conflicts of interest.
References
- Ye, D.; Tao, S.; Li, M. The catastrophe of general circulation in June and October. Acta Meteorol. Sin. 1958, 29, 250–263. (In Chinese) [Google Scholar]
- Zhang, Q.; Tao, S. Influence of Asian mid-high latitude circulation on East Asian summer rainfall. Acta Meteorol. Sin. 1998, 56, 199–211. (In Chinese) [Google Scholar]
- Du, Y.; Zhang, Y.; Xie, Z. Location variation of the East Asian subtropical westerly jet and its effect on the summer precipitation anomaly over eastern China. Chin. J. Atmos. Sci. 2009, 33, 581–592. (In Chinese) [Google Scholar]
- Zhang, Q.; Xuan, S.; Sun, S. Anomalous circulation characteristics of intraseasonal variation of East Asian subtropical westerly jet in summer and precursory signals. Chin. J. Atmos. Sci. 2018, 42, 935–950. (In Chinese) [Google Scholar]
- Yang, N.; Jin, R.; Xiao, T.; Sun, X. Propagation of Rossby wave along Asian subtropical westerly jet in summer and its impact on anomaly of precipitation in China. Meteorol. Mon. 2020, 46, 1–14. (In Chinese) [Google Scholar]
- Lin, Z.; Lu, R. Interannual meridional displacement of the East Asian upper-tropospheric jet stream in summer. Adv. Atmos. Sci. 2005, 22, 199–211. [Google Scholar]
- Lu, R.; Hong, Y.; Jhun, J.-G. Weakening of interannual variability in the summer East Asian upper-tropospheric westerly jet since the mid-1990s. Adv. Atmos. Sci. 2011, 28, 1246–1258. [Google Scholar] [CrossRef]
- Yan, Y.; Li, C.; Lu, R. Meridional displacement of the East Asian upper-tropospheric westerly jet and its relationship with the East Asian summer rainfall in CMIP5 simulations. Adv. Atmos. Sci. 2019, 36, 1203–1216. [Google Scholar] [CrossRef]
- Li, S.; Sato, T.; Nakamura, T.; Guo, W. Asian summer rainfall stimulated by subseasonal Indian monsoonal heating. Nat. Commun. 2023, 14, 5932. [Google Scholar] [CrossRef]
- Kosaka, Y.; Chowdary, J.S.; Xie, S.-P.; Min, Y.-M.; Lee, J.-Y. Limitations of seasonal predictability for summer climate over East Asia and the northwestern Pacific. J. Clim. 2012, 25, 7574–7589. [Google Scholar] [CrossRef]
- Ding, Y.; Liu, Y.; Hu, Z.-Z. The record-breaking Meiyuin 2020 and associated atmospheric circulation and tropical SST anomalies. Adv. Atmos. Sci. 2021, 38, 1980–1993. [Google Scholar] [CrossRef]
- Zhou, Z.-Q.; Xie, S.-P.; Zhang, R. Historic Yangtze flooding of 2020 tied to extreme Indian Ocean conditions. Proc. Natl. Acad. Sci. USA 2021, 118, e2022255118. [Google Scholar] [CrossRef]
- Lu, R. Associations among the components of the East Asian summer monsoon system in the meridional direction. J. Meteor. Soc. Jpn. Ser. II 2004, 82, 155–165. [Google Scholar] [CrossRef]
- Lu, R.; Lin, Z. Role of subtropical precipitation anomalies in maintaining the summertime meridional teleconnection over the western North Pacific and East Asia. J. Clim. 2009, 22, 2058–2072. [Google Scholar] [CrossRef]
- Liao, Q.; Gao, S.; Wang, H.; Tao, S. Anomalies of the extratropical westerly jet in the North hemisphere and their impacts on East Asian summer monsoon climate anomalies. Chin. J. Geophys. 2004, 47, 11–18. (In Chinese) [Google Scholar]
- Hong, X.; Lu, R. The meridional displacement of the summer Asian jet, silk road pattern, and tropical SST anomalies. J. Clim. 2016, 29, 3753–3766. [Google Scholar] [CrossRef]
- Li, X.; Lu, R. Extratropical factors affecting the variability in summer precipitation over the Yangtze river basin, China. J. Clim. 2017, 30, 8357–8374. [Google Scholar] [CrossRef]
- Lin, L.; Hu, C.; Wang, B. Atlantic origin of the increasing Asian westerly jet interannual variability. Nat. Commun. 2024, 15, 2155. [Google Scholar] [CrossRef]
- Ding, Y.; Chan, J.C.L. The East Asian summer monsoon: An overview. Meteorol. Atmos. Phys. 2005, 89, 117–142. [Google Scholar]
- Ding, Y. The variability of the Asian summer monsoon. J. Meteor. Soc. Jpn. Ser. II 2007, 85B, 21–54. [Google Scholar] [CrossRef]
- Molnar, P.; Boos, W.R.; Battisti, D.S. Orographic controls on climate and paleoclimate of Asia: The thermal and mechanical roles for the Tibetan Plateau. Annu. Rev. Earth Planet. Sci. 2010, 38, 77–102. [Google Scholar] [CrossRef]
- Chiang, J.C.H.; Swenson, L.M.; Kong, W. Role of seasonal transitions and the westerlies in the interannual variability of the East Asian summer monsoon precipitation. Geophys. Res. Lett. 2017, 44, 3788–3795. [Google Scholar] [CrossRef]
- Chiang, J.C.H.; Kong, W.; Wu, C.H. Origins of East Asian summer monsoon seasonality. J. Clim. 2020, 33, 7945–7965. [Google Scholar] [CrossRef]
- Kong, W.; Chiang, J.C.H. Interaction of the westerlies with the Tibetan Plateau in determining the Mei-yu termination. J. Clim. 2020, 33, 339–363. [Google Scholar] [CrossRef]
- Kong, W.; Chiang, J.C.H. Southward shift of westerlies intensifies the East Asian early summer rainband following El Niño. Geophys. Res. Lett. 2020, 47, e2020GL088631. [Google Scholar] [CrossRef]
- Wu, G.; Liu, Y.; Wang, T. The influence of mechanical and thermal forcing by the Tibetan Plateau on Asian climate. J. Hydrometeorol. 2007, 8, 770–789. [Google Scholar] [CrossRef]
- Liu, Y.; Wu, G.; Dong, B.; Liang, X.; Duan, A.; Bao, Q.; Yu, J. Revisiting Asian monsoon formation and change associated with Tibetan Plateau forcing: Ι. Formation. Clim. Dyn. 2012, 39, 1169–1181. [Google Scholar] [CrossRef]
- Son, J.H.; Seo, K.H.; Wang, B. Dynamical control of the Tibetan Plateau on the East Asian summer monsoon. Geophys. Res. Lett. 2019, 46, 7672–7679. [Google Scholar] [CrossRef]
- Son, J.H.; Seo, K.H.; Wang, B. How does the Tibetan Plateau dynamically affect downstream monsoon precipitation? Geophys. Res. Lett. 2020, 47, e2020GL090543. [Google Scholar] [CrossRef]
- Son, J.H.; Kwon, J.I.; Heo, K.Y. Weak upstream westerly wind attracts western North Pacific typhoon tracks to west? Environ. Res. Lett. 2021, 16, 124041. [Google Scholar] [CrossRef]
- Son, J.H.; Seo, K.H. East Asian summer monsoon precipitation response to variations in upstream westerly wind? Clim. Dyn. 2022, 59, 77–84. [Google Scholar] [CrossRef]
- Sampe, T.; Xie, S.-P. Large-scale dynamics of the Meiyu-Baiu rainband: Environmental forcing by the westerly jet. J. Clim. 2010, 23, 113–134. [Google Scholar] [CrossRef]
- Chen, J.; Bordoni, S. Orographic effects of the Tibetan Plateau on the East Asian summer monsoon: An energetic perspective. J. Clim. 2014, 27, 3052–3072. [Google Scholar] [CrossRef]
- Hu, K.; Xie, S.-P.; Huang, G. Orographically anchored El Niño effect on summer rainfall in central China. J. Clim. 2017, 30, 10037–10045. [Google Scholar] [CrossRef]
- Wang, S.; Zuo, H.; Zhao, S.; Zhang, J.; Lu, S. How East Asian westerly jet’s meridional position affects the summer rainfall in Yangtze-Huaihe river valley? Clim. Dyn. 2018, 51, 4109–4121. [Google Scholar] [CrossRef]
- Du, Y.; Li, T.; Xie, Z.; Zhu, Z. Interannual variability of the Asian subtropical westerly jet in boreal summer and associated with circulation and SST anomalies. Clim. Dyn. 2016, 46, 2673–2688. [Google Scholar] [CrossRef]
- Hong, X.; Lu, R.; Li, S. Asymmetric relationship between the meridional displacement of the Asian westerly jet and the silk road pattern. Adv. Atmos. Sci. 2018, 35, 389–396. [Google Scholar] [CrossRef]
- Wei, W.; Zhang, R.; Wen, M.; Yang, S. Relationship between the Asian westerly jet stream and summer rainfall over central Asia and North China: Roles of the Indian monsoon and the South Asian high. J. Clim. 2017, 30, 537–552. [Google Scholar] [CrossRef]
- Chen, L.; Li, G.; Lu, B.; Li, Y.; Gao, C.; Long, S.-M.; Li, X.; Wang, Z. Two approaches of the spring North Atlantic sea surface temperature affecting the following July precipitation over central China: The tropical and extratropical pathways. J. Clim. 2022, 35, 2969–2986. [Google Scholar] [CrossRef]
- Ham, Y.-G.; Kug, J.-S.; Park, J.-Y.; Jin, F.-F. Sea surface temperature in the north tropical Atlantic as a trigger for El Niño/Southern Oscillation events. Nat. Geosci. 2013, 6, 112–116. [Google Scholar] [CrossRef]
- Hong, C.-C.; Chang, T.-C.; Hsu, H.-H. Enhanced relationship between the tropical Atlantic SST and the summertime western North Pacific subtropical high after the early 1980s. J. Geophys. Res. Atmos. 2014, 119, 3715–3722. [Google Scholar] [CrossRef]
- Chang, T.-C.; Hsu, H.-H.; Hong, C.-C. Enhanced influences of tropical Atlantic SST on WNP-NIO atmosphere-ocean coupling since the early 1980s. J. Clim. 2016, 29, 6509–6525. [Google Scholar] [CrossRef]
- Li, X.; Xie, S.-P.; Gille, S.T.; Yoo, C. Atlantic-induced pan-tropical climate change over the past three decades. Nat. Clim. Chang. 2016, 6, 275–279. [Google Scholar] [CrossRef]
- Li, W.; Ren, H.-C.; Zuo, J.; Ren, H.-L. Early summer southern China rainfall variability and its ocean drivers. Clim. Dyn. 2018, 50, 4691–4705. [Google Scholar] [CrossRef]
- Wang, L.; Yu, J.-Y.; Paek, H. Enhanced biennial variability in the Pacific due to Atlantic capacitor effect. Nat. Commun. 2017, 8, 14887. [Google Scholar] [CrossRef]
- Cai, W.; Wu, L.; Lengaigne, M.; Li, T.; McGregor, S.; Kug, J.-S.; Yu, J.-Y.; Stuecker, M.F.; Santoso, A.; Li, X.; et al. Pantropical climate interactions. Science 2019, 363, eaav4236. [Google Scholar] [CrossRef]
- Zuo, J.; Li, W.; Sun, C.; Ren, H.-C. Remote forcing of the northern tropical Atlantic SST anomalies on the western North Pacific anomalous anticyclone. Clim. Dyn. 2019, 52, 2837–2853. [Google Scholar] [CrossRef]
- Vimont, D.J.; Battisti, D.S.; Hirst, A.C. Footprinting: A seasonal connection between the tropics and mid-latitudes. Geophys. Res. Lett. 2001, 28, 3923–3926. [Google Scholar] [CrossRef]
- Wu, R.; Dai, P.; Chen, S. Persistence or transition of the North Atlantic Oscillation across boreal winter: Role of the North Atlantic air-sea coupling. J. Geophys. Res. Atmos. 2022, 127, e2022JD037270. [Google Scholar] [CrossRef]
- Chen, S.; Wu, R.; Chen, W. Strengthened connection between springtime North Atlantic Oscillation and North Atlantic tripole SST pattern since the late 1980s. J. Clim. 2020, 33, 2007–2022. [Google Scholar] [CrossRef]
- Rayner, N.A.; Parker, D.E.; Horton, E.B.; Folland, C.K.; Alexander, L.V.; Rowell, D.P.; Kent, E.C.; Kaplan, A. Global analyses of sea surface temperature, sea ice, and night marine air temperature since the late nineteenth century. J. Geophys. Res. Atmos. 2003, 108, D144407. [Google Scholar] [CrossRef]
- Hersbach, H.; Bell, B.; Hirahara, S.; Thépaut, J. The ERA5 global reanalysis. Q. J. R. Meteorol. Soc. 2020, 146, 1999–2049. [Google Scholar] [CrossRef]
- Kobayashi, S.; Ota, Y.; Harada, Y.; Ebita, A.; Moriya, M.; Onoda, H.; Onogi, K.; Kamahori, H.; Kobayashi, C.; Endo, H.; et al. The JRA-55 reanalysis: General specifications and basic characteristics. J. Meteor. Soc. Jpn. Ser. II 2015, 93, 5–48. [Google Scholar] [CrossRef]
- Gao, C.; Li, G.; Xu, B. Weakening influence of spring soil moisture over the Indo-China Peninsula on the following summer Mei-yu front and precipitation extremes over the Yangtze river basin. J. Clim. 2020, 33, 10055–10072. [Google Scholar] [CrossRef]
- Seager, R.; Harnik, N.; Kushnir, Y.; Robinson, W.; Miller, J. Mechanisms of hemispherically symmetric climate variability. J. Clim. 2003, 16, 2960–2978. [Google Scholar] [CrossRef]
- Coumou, D.; Rahmstorf, S. A decade of weather extremes. Nat. Clim. Chang. 2012, 2, 491–496. [Google Scholar] [CrossRef]
- Trouet, V.; Babst, F.; Meko, M. Recent enhanced high-summer North Atlantic jet variability emerges from three-century context. Nat. Commun. 2018, 9, 180. [Google Scholar] [CrossRef] [PubMed]
- Screen, J.A.; Simmonds, I. Amplified mid-latitude planetary waves favour particular regional weather extremes. Nat. Clim. Chang. 2014, 4, 704–709. [Google Scholar] [CrossRef]
- Scholten, R.C.; Coumou, D.; Luo, F.; Veraverbeke, S. Early snowmelt and polar jet dynamics co-influence recent extreme siberian fire seasons. Science 2022, 378, 1005–1009. [Google Scholar] [CrossRef]
- Wu, Z.; Wang, B.; Li, J.; Jin, F.F. An empirical seasonal prediction model of the East Asian summer monsoon using ENSO and NAO. J. Geophys. Res. Atmos. 2009, 114, D18120. [Google Scholar] [CrossRef]
- Wu, Z.; Li, J.; Jiang, Z.; He, J.; Zhu, X. Possible effects of the North Atlantic Oscillation on the strengthening relationship between the East Asian Summer monsoon and ENSO. Int. J. Climatol. 2012, 32, 794–800. [Google Scholar] [CrossRef]
- Zuo, J.; Li, W.; Sun, C.; Xu, L.; Ren, H.L. Impact of the North Atlantic sea surface temperature tripole on the East Asian summer monsoon. Adv. Atmos. Sci. 2013, 30, 1173–1186. [Google Scholar] [CrossRef]
- Yim, S.Y.; Wang, B.; Kwon, M.H. Interdecadal change of the controlling mechanisms for East Asian early summer rainfall variation around the mid-1990s. Clim. Dyn. 2014, 42, 1325–1333. [Google Scholar] [CrossRef]


Disclaimer/Publisher’s Note: The statements, opinions and data contained in all publications are solely those of the individual author(s) and contributor(s) and not of MDPI and/or the editor(s). MDPI and/or the editor(s) disclaim responsibility for any injury to people or property resulting from any ideas, methods, instructions or products referred to in the content. |
© 2024 by the authors. Licensee MDPI, Basel, Switzerland. This article is an open access article distributed under the terms and conditions of the Creative Commons Attribution (CC BY) license (https://creativecommons.org/licenses/by/4.0/).