Abstract
The objective of this study was to evaluate the extent of radon contamination in twenty-six drinking water samples from natural springs were collected from Dhirkot Azad Kashmir, along with four bottled mineral water samples. Radon gas escapes from the earth’s crust due to uranium ores and diffuses into the atmosphere. This study assessed the levels of radon concentration, the yearly effective radiation dose, and carcinogenic risk from radon exposure in drinking water samples. The radon concentration varied from 0.28 to 30.25 Bq/L. The mean radon concentration of all samples was found to be 7.86 ± 2.3 Bq/L. The radon concentrations in bottled drinking water were found to be lower than those in natural springs. The statistical and GIS analyses included the use of interpolation and Pearson’s correlation matrix. Seven samples had radon concentration that surpassed the standard limit established by the US-EPA, which is 11 Bq/L. The average annual effective dose from inhalation and ingestion was found to be lower than the value (0.1 mSv/y) provided by the WHO, but for some natural spring water samples, it exceeded the risk limit. The cancer risk revealed that 40% of the samples had an elevated lifetime cancer risk from radon exposure. Overall, the majority of the results obtained aligned with the worldwide guidelines established by the US-EPA. However, there were a few instances where the limits were exceeded, and constant monitoring is recommended. This study establishes a baseline for radon concentration in the area and provides a basis for future studies.
1. Introduction
The quality of water is crucial as it is consumed by humans and animals and plays a significant role in the ecosystem of an area. Inadequate water quality can result in significant health complications for both humans and animals, including the contraction of diseases [1,2,3]. Moreover, polluted water has the potential to inflict damage onto ecosystems and disturb the equilibrium of a region’s natural environment. The scientific community has identified a number of contaminants as dangerous for water bodies in recent years, including heavy metals, pesticides, medicines, and radionuclides [4,5,6,7]. These pollutants can have enduring impacts on both human well-being and the ecosystem. Several consequences include carcinogenesis, neurological impairment, and developmental abnormalities [8,9]. Small quantities of radioactive elements are present in rocks and soils in the uppermost layer of the earth [10]. These elements naturally decay to produce radon, an odorless and tasteless gas [1]. Colorless radon gas is a gaseous progeny of naturally occurring radionuclides in the uranium and thorium series. Its weight is roughly 7.5 times that of air [6]. Among other isotopes such as thoron Rn-220 and actinon Rn-219, Rn-222 is regarded as the most stable, abundant, dominant, and harmful radionuclide because of its comparatively long half-life of 3.8 days [11]. Radon is a radioactive gas that emits alpha particles during its decay process. It is a major source of ionizing radiation that humans are exposed to [12]. Ionizing radiation can produce ions when it interacts with human cells, which can cause mutations or harm to the DNA, ultimately leading to the formation of cancer [13,14].
Ionizing radiation also induces the production of reactive oxygen species (ROS) in the human body, impacting various physiological processes. ROS, including superoxide anions, are generated in response to ionizing radiation, leading to oxidative damage and potential long-term effects like genomic instability and secondary cancer development [15].
Radon is a progeny of uranium decay series and is, therefore, present in the earth’s crust, soil, and water. It possesses the ability to dissolve in water and can cause damage if ingested or inhaled. Radon can permeate the soil and air before decomposing into a series of short-lived radioactive progenies (polonium-218 and polonium-214) by the emission of an α particle. Radon itself is typically expelled right away if inhaled. However, its solid, short-lived progenies often settle on the bronchial epithelium, exposing cells to the ionizing radiation [16]. There is evidence linking the inhalation of radon’s short-lived decay products to an increased risk of lung cancer [17]. Radon is responsible for around 11% of lung cancer deaths among smokers and 23% of lung cancer deaths among non-smokers [18]. It has been established that radon is the primary cause of cancer in non-smokers and is the second biggest risk factor for lung cancer, after smoking [18,19]. As a crucial instrument in the management of the radon issue, the WHO International Radon Project has suggested the establishment of a reference level [20]. In 1991, the EPA set out nationwide main drinking water standards regarding radionuclides. According to the USEPA (Environmental Protection Agency in the United States, Washington, DC, USA), a radon concentration of 11 kBq m−3 or 11 Bq/L is suggested as the maximum contamination level (MCL) [9,21,22]. The WHO advise that the overall annual effective dosage limit is 0.1 mSv/y for ionizing radiation exposure [20,23].
Azad Jammu and Kashmir (AJK) is a semi-autonomous region under the administration of the Government of Pakistan. Most people in AJK use natural spring water for drinking and other domestic purposes; the demand for bottled water is also rising in the region, particularly among older people. The available literature indicates that there is insufficient data on radioactivity in the spring water of AJK. The majority of developed countries set national reference levels for radon in water in order to ensure radiological safety for public health. But there is no reference like that in AJK. This study establishes a baseline for radon in the natural spring waters of Bagh, one of the districts of AJK, and also measures the radon level in bottled drinking water used locally. In this study, the concentration of radon was measured in drinking water samples by using an active method (RAD7) [24].
2. Materials and Methods
2.1. Study Area
Bagh is a district of the AJK and covers an approximate area of around 1368 square kilometers. Because of the excellent exposure and conjunction of igneous, sedimentary, and metamorphic rocks, the geology and stratigraphy of the Bagh areas are generally of geological significance. This system is a component of the Kashmiri and Hazara syntax. Blocks of nappe and imbricate formation are the result of considerable folding and faulting of the rocks surrounding the syntaxial bend. The Bagh district is entirely mountainous topographically, with a general sloping northeast to southwest orientation. This region is in the lower Himalayan zone. Pir Panjal is the district’s principal range. The elevation of the Haji Pir Pass is 3421 m above sea level. The elevation is often 1500–2500 m above sea level. Coniferous forests typically cover mountains. The two main streams are Mahl Nala in the Bagh sub-division and Betar Nala in the Haveli sub-division. Nevertheless, the district is also home to a great number of additional rivulets. The district’s climate changes with altitude. In general, the temperature stays between 2 °C and 40 °C. The district’s primary eastern region experiences mild summer temperatures and bitterly frigid winters. However, the places that border Bagh at Kohala and its surrounding districts—Mongbajri and Arja-Bagh—remain frigid in the winter and scorching in the summer in the lower valleys. The warmest months are May, June, and July. In June, the highest and lowest recorded temperatures are roughly 40 °C and 22 °C, respectively. The coldest months are January, February, and December. January has a maximum temperature of roughly 16 °C and a minimum temperature of 0 °C, the annual precipitation is about 1500 mm [25].
2.2. Water Sampling
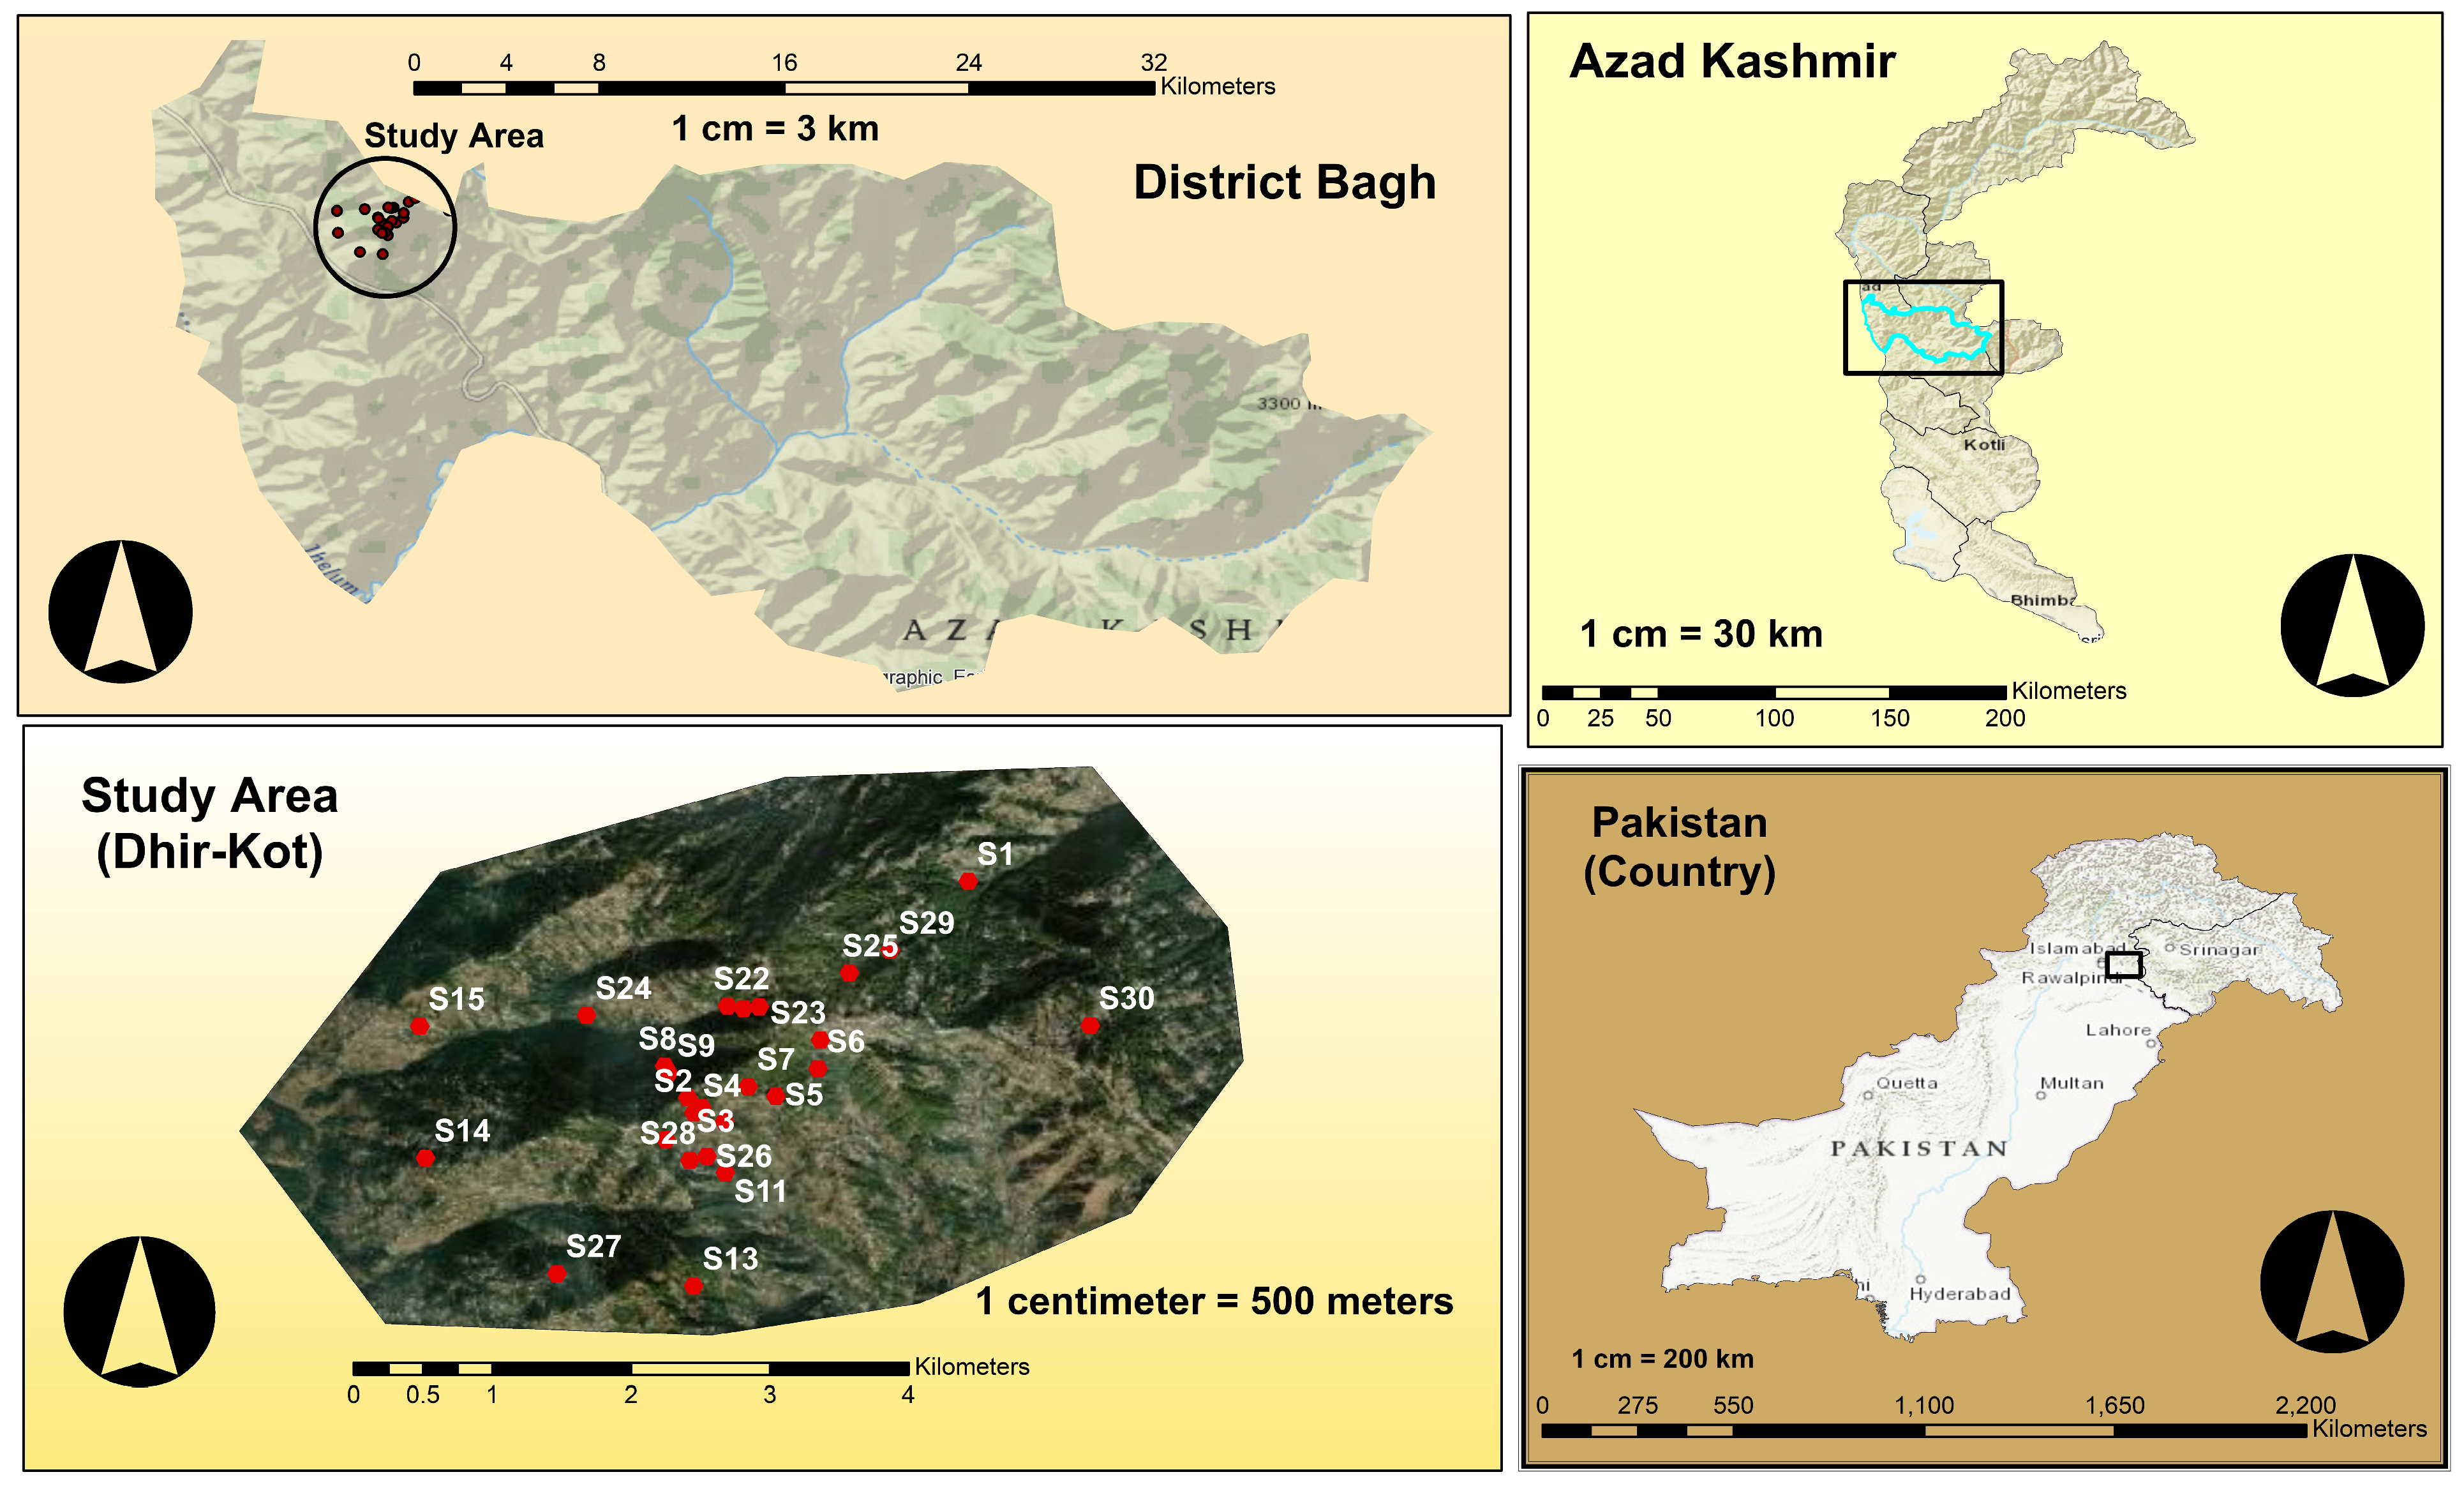
A total of twenty-six water samples were collected from the natural spring systems in District Bagh, as shown in Table 1. The samples were gathered in plastic bottles, which were rinsed with 10% nitric acid and, subsequently, washed with distilled water to prevent any potential contamination. Each sample had a volume of 1 L, and 3 units of samples were taken from each site [26]. The samples were sealed in airtight plastic bottles and brought to the lab within 3 days of sampling. The samples were gathered in the summer of 2023. The locations where the samples were collected are shown in Figure 1. Four samples were collected from bottled drinking water, which were purchased and preserved using the same method described above. The RAD7 measurements were taken within 2 days of sample collection.

Table 1.
Sampling sites with their altitudes.

Figure 1.
Map of samples location.
2.3. Radon Monitoring Method
We used an active technique for measuring radon in water via alpha spectroscopy by using RAD7.
2.4. RAD-7 Detector
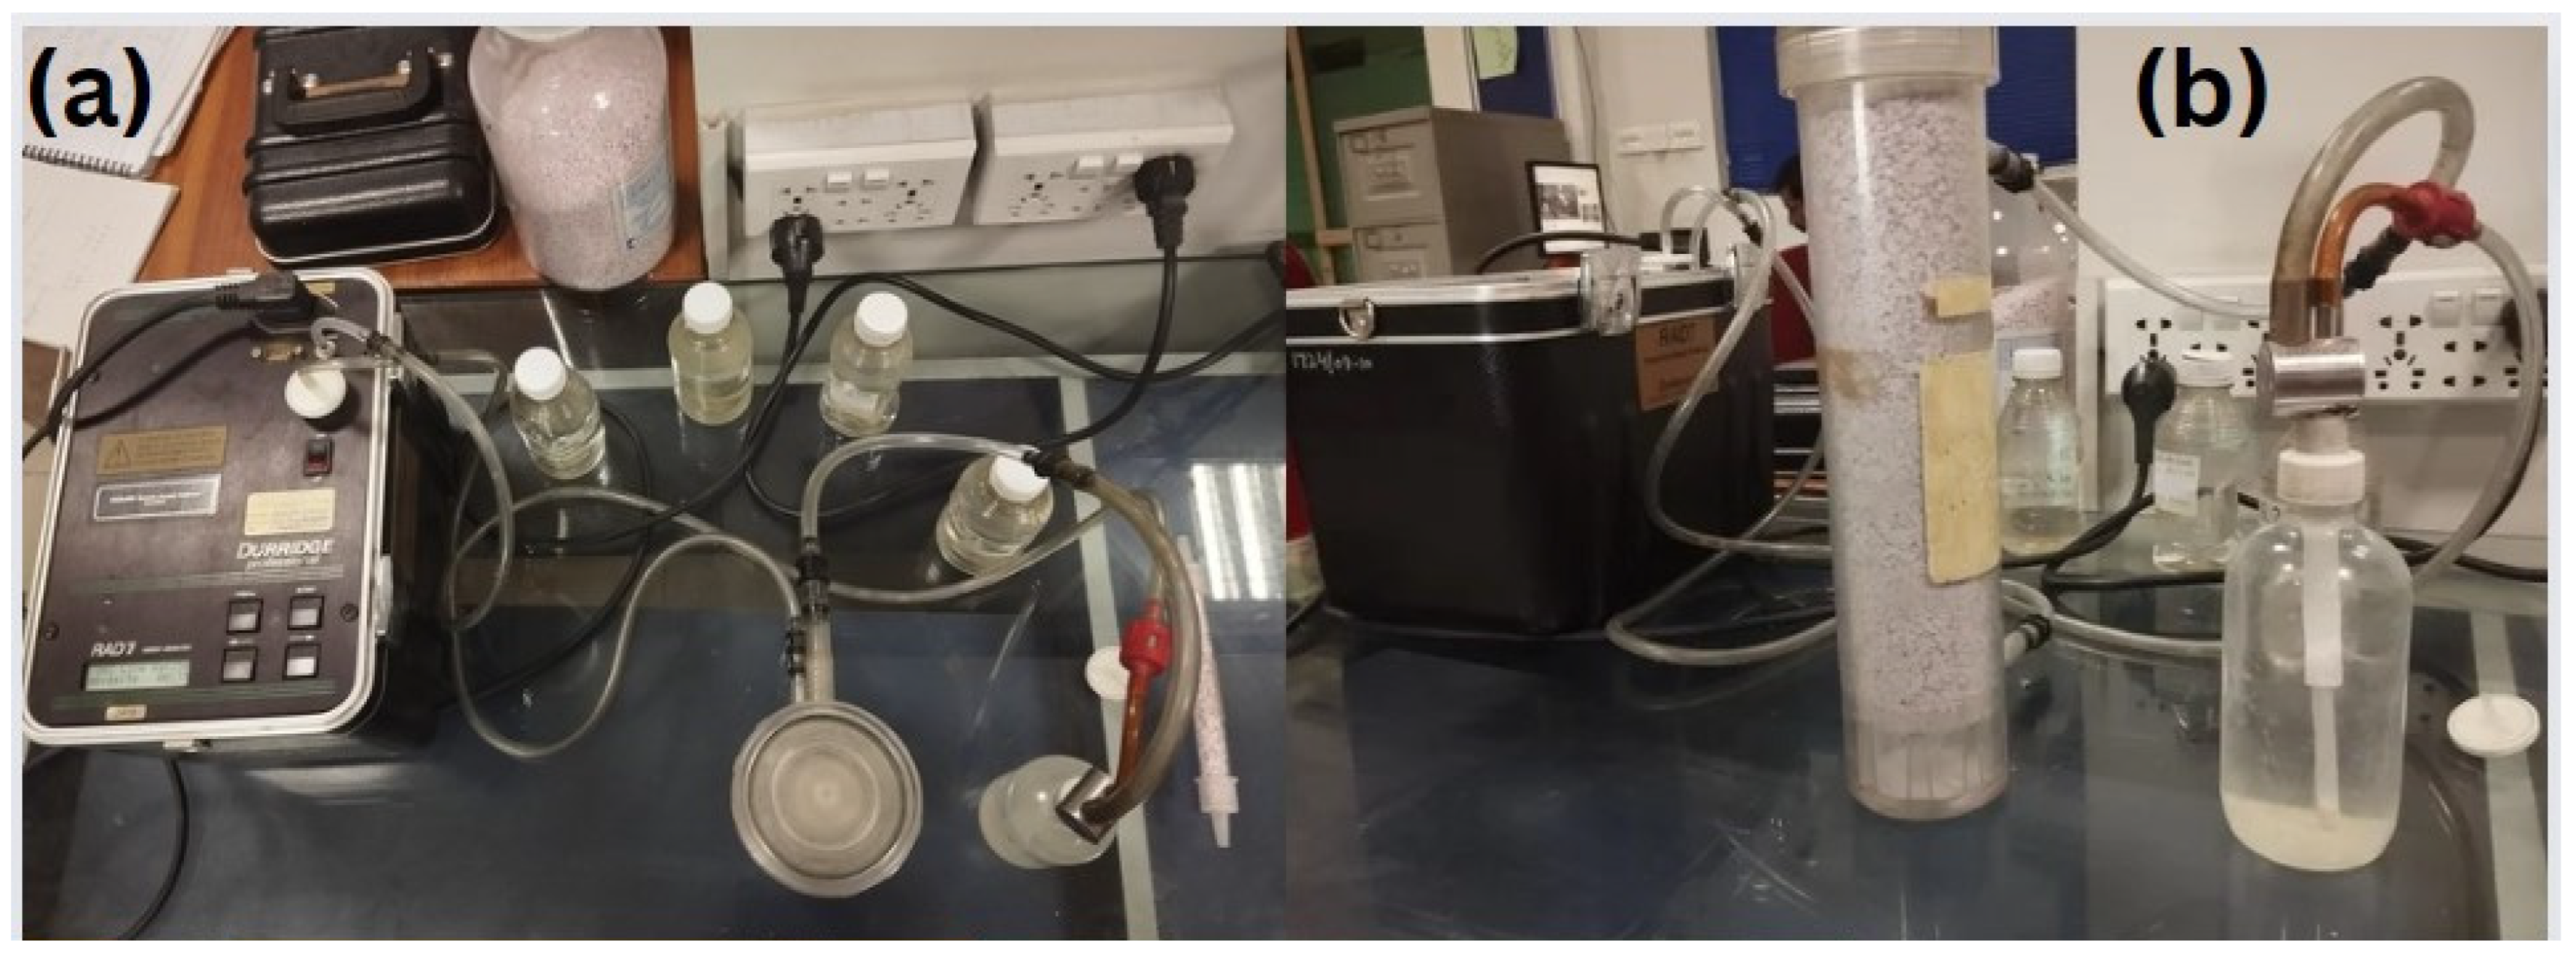
The RAD7 active detector utilizes an electronic radon detector to effectively and efficiently measure radon levels in various media, including water. RAD7 utilizes alpha spectrometry to quantify the concentration of radon by measuring the alpha particles emitted by radon and their decay products. Typically, the procedure involves collecting a water sample, removing any trapped radon gas through degassing, and, subsequently, analyzing the liberated gas using the RAD7 detector for measurement. The RAD7 technique is commonly employed for water radon assessment because of its exceptional sensitivity and precision, enabling the detection of radon even at low concentrations. Durridge RAD7 was used in this study with a power of 240 V; AC was used in this work. The operating temperature and humidity of RAD7 were 0–50°C operating and 5–99% RH non-condensing, respectively. The dimensions of RAD7 used in this study were 241 mm × 190 mm × 266 mm. The RAD7 setup used in this study is given in Figure 2. The RAD7 H2O equipment underwent pre-calibration by Durridge Company, Billerica, MA, USA, according to established protocols [27]. The analysis of Rn was carried out in accordance with the manufacturer’s instructions. The RAD7 machine had a digital screen to document the mean, maximum, and minimum measurements. Regular adjustments were made to ensure the precision of the results. The alterations were performed utilizing radon-free deionized water to minimize any possible background impact caused by traces of Rn in the earlier samples. Prior to each test, the instrument was purged to guarantee that the relative humidity remained below 6% for the entirety of the testing procedure.

Figure 2.
Rad7 setup at Radiation Physics Lab (a,b) for radon measurement in water samples.
2.5. Annual Effective Dose
The two components of the received dose from the current radon in drinking water are the (1) received dose from inhalation of radon and (2) received dose from the ingestion of radon. Utilizing Equation (3), average annual effective dosage from radon ingestion and inhalation were computed.
: The annual effective dose from the inhalation of radon released from water into air mSvY−1.
: Radon concentration in water BqL−1.
: ratio of radon released into air from water (10−4).
T: The average residence time of individuals in the interior (7000 hy−1).
F: Equilibrium factor between radon and its products (0.4).
Df: The conversion dose factor 9nSv (Bqhm−3) −1.
: The annual effective dose from drinking water containing radon (SvY−1).
: The radon concentration in water BqL−1.
WC: Represents the yearly consumption of water for varying ages (e.g., 230 L/year for infants under 1 year old, 330 L/year for children aged 2–17, and 730 L/year for adults over 17 years old) [23,28].
DF: The ingestion dose conversion factor for infants, children, and adults used in this study was 23, 5.9, and 3.5 nSv/Bq, respectively, and ‘T’ is the time (1 year) [29].
The World Health Organization (WHO) have established that the annual effective dose level in drinking water may be as low as 0.1 mSv/y (100 μSv/y) [19,29,30].
2.6. Cancer Risk
In order to calculate the cancer risk due to exposure to ionizing radiation from radon, the equation given by ICRP was used [31].
The formula used to determine the risk of cancer that leads to mortality per unit of radiation exposure (Sievert) is dependent on three key factors: the mean effective dose (E), the standard lifespan (LS) of seventy years, and the likelihood of having a fatal cancer (CF) at a rate of 5.5 × 10⁻² per Sv [32].
3. Results and Discussion
This study aimed to measure the levels of radon in the natural spring water of the Bagh district. An active (RAD7) technique was employed to assess the radon concentrations.
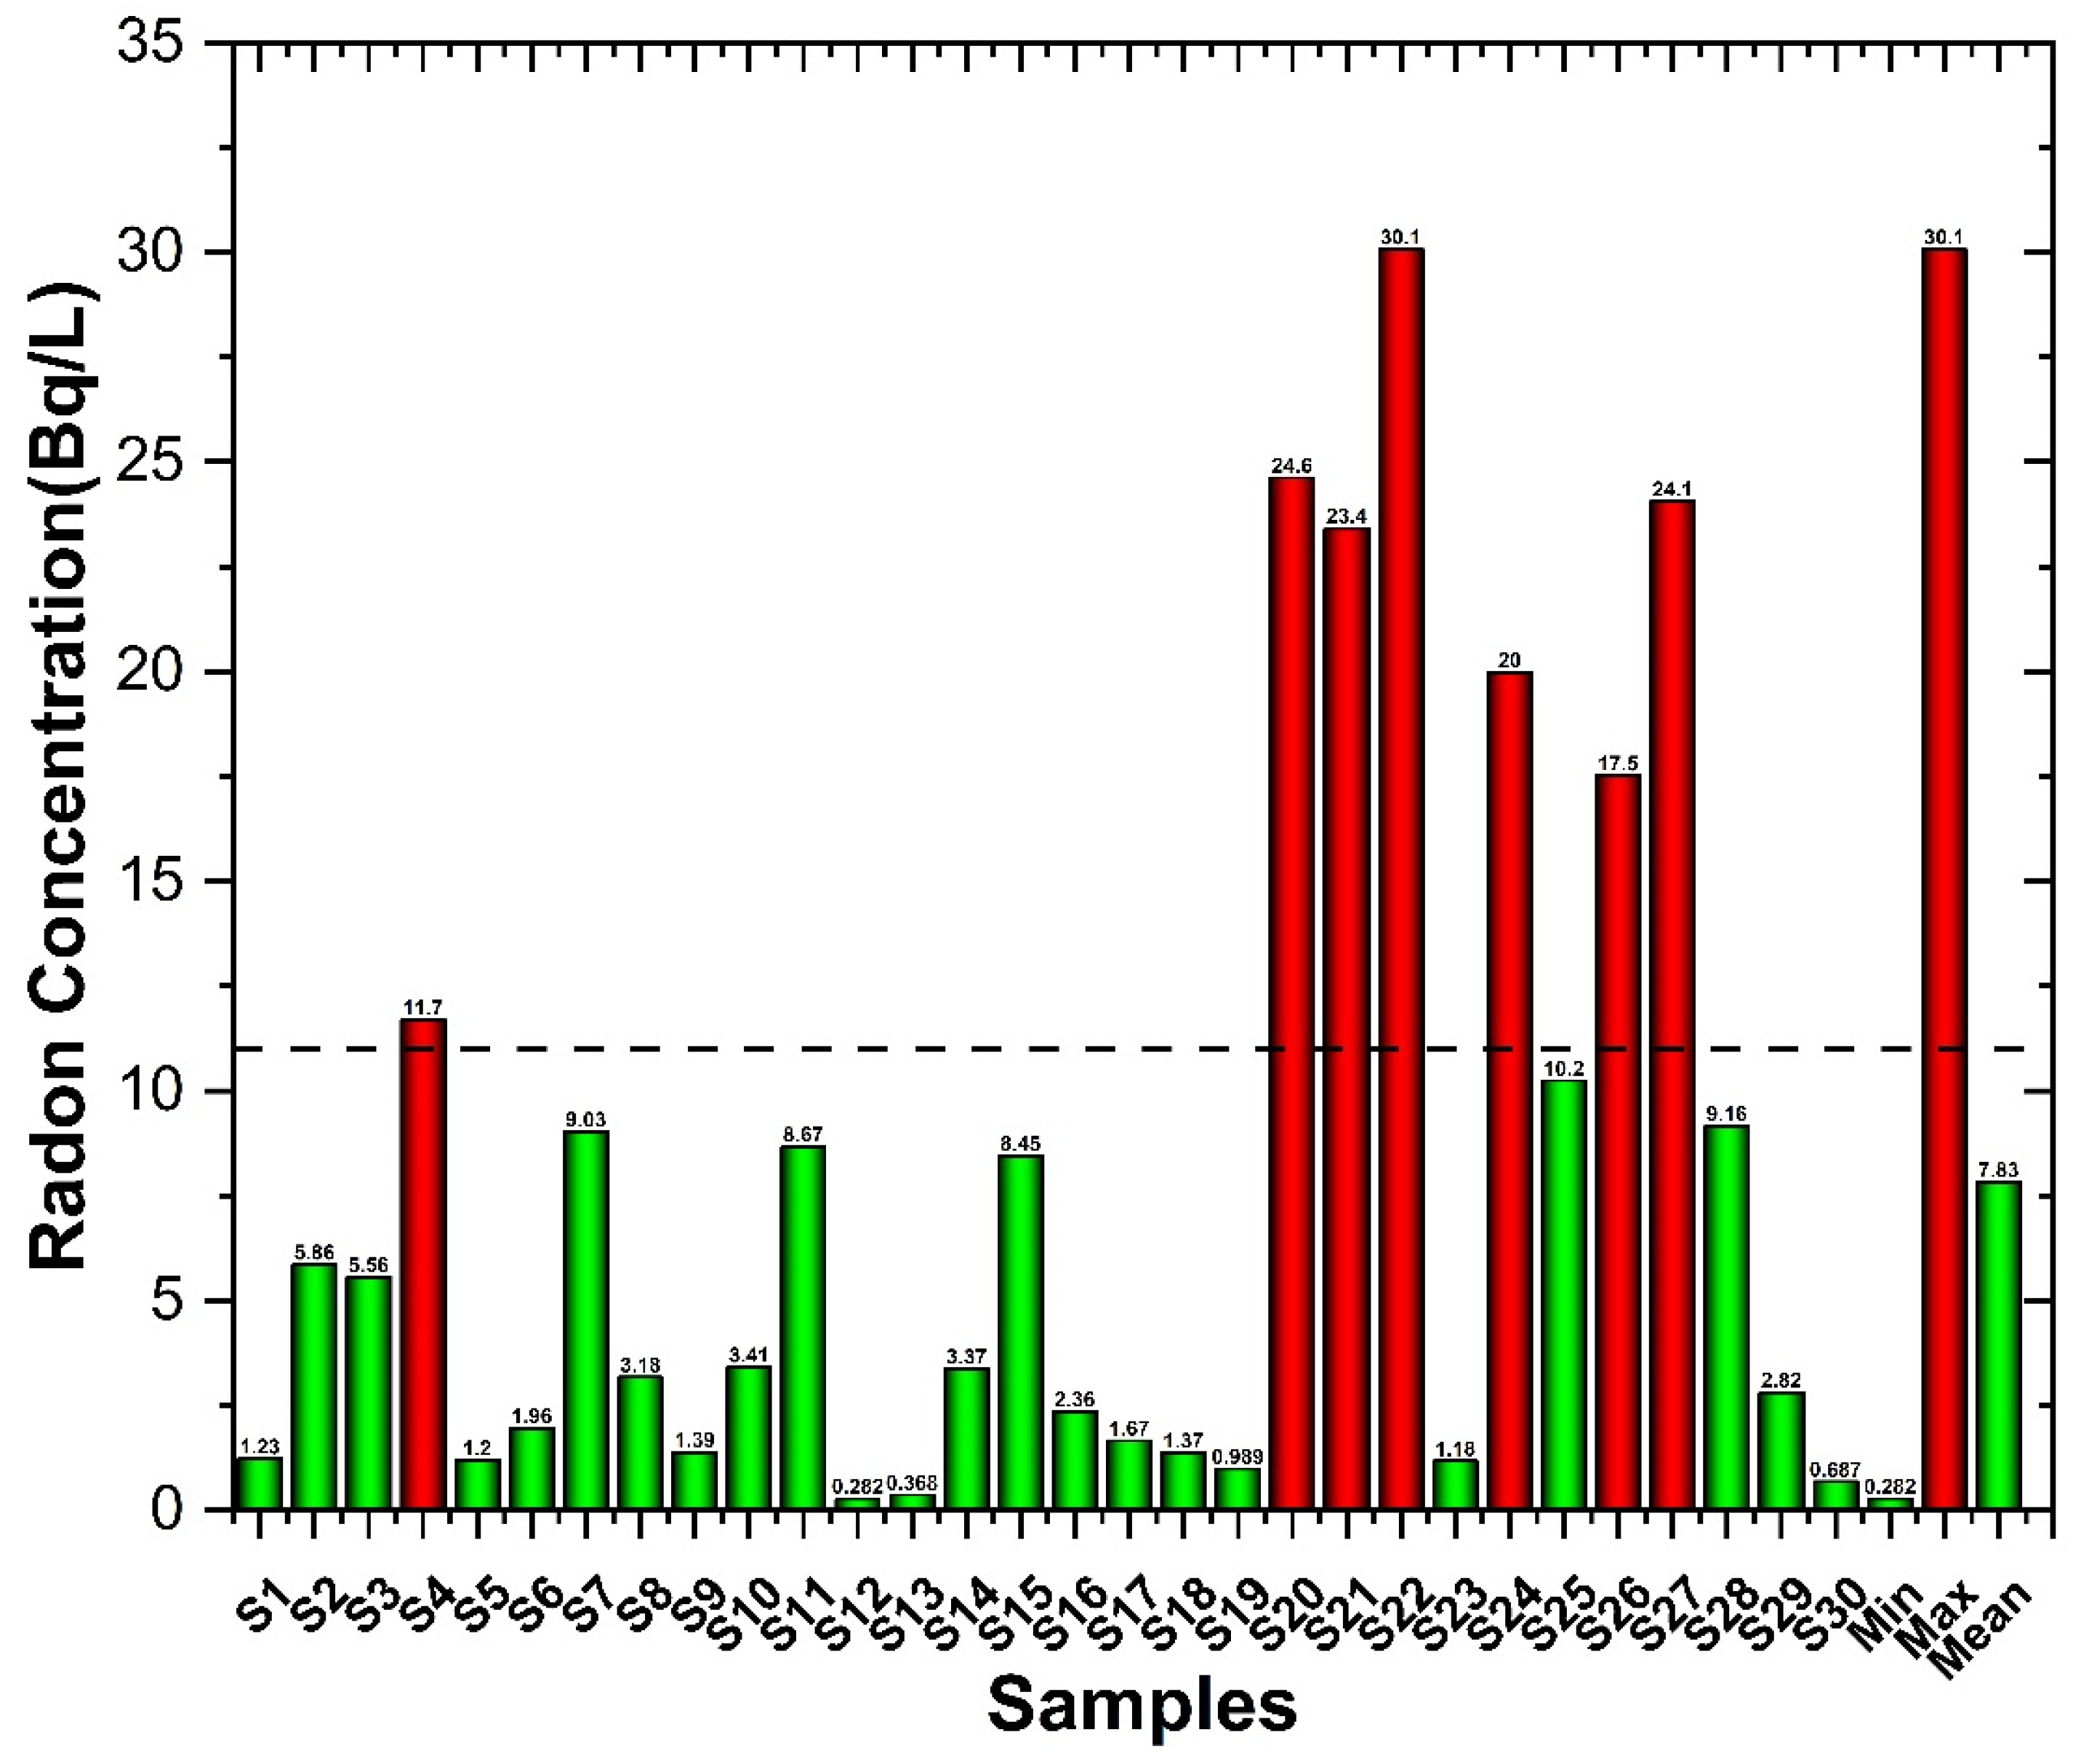
The results of Rn measurements for the drinking waters of Bagh are presented in Table 2 and Figure 3. Our results in this study showed that the highest radon concentration measured was in S22, which was 30.06 Bq/L, and the lowest radon concentration was 0.28 Bq/L in S12. The average concentration was 7.86 Bq/L for the radon concentration in drinking water of the Bagh district. The variations in Rn levels in drinking water can be attributed to several geographical and temporal factors, such as active plate tectonics, underlying geology, mineral composition, soil texture, and climate.
Table 2.
Radon concentration and effective doses.

Figure 3.
Radon activity plotted values.
The average radon concentration in S4, S20, S21, S22, S24, S26, and S27 samples exceeded the threshold of 11 Bq/L set by the US-EPA, confirmed by the spatial distribution of radon (Figure 4) [21,22]. The elevated concentrations may be attributed to the seismic activity in the region or the underlying geology. Several studies have shown a clear connection between the levels of Rn and seismic activity, which validates the use of radon measurements for fault detection and monitoring purposes. The transition or rotary landslides, which have clear weak zones that separate the shifting rock from stable underpinning material, can cause increased levels of Rn. The presence of excessive amounts of Rn can be attributed to the open and permeable channels formed by the flow of these landslides, allowing it to migrate into the water table and atmosphere from deeper sources. In the study area, multiple significant landslides have been identified, which could potentially result in elevated levels of radon in the vicinity [33]. The variations in Rn concentrations may also be influenced by the aquifer’s underlying geology and geological structure. Various rock formations exhibit different radon levels, which, in turn, affect the amount of radon in groundwater [30]. It is important to continue monitoring these areas to assess the potential risks associated with radon exposure. Additionally, implementing mitigation strategies in regions with high radon levels can help reduce health risks for nearby residents.
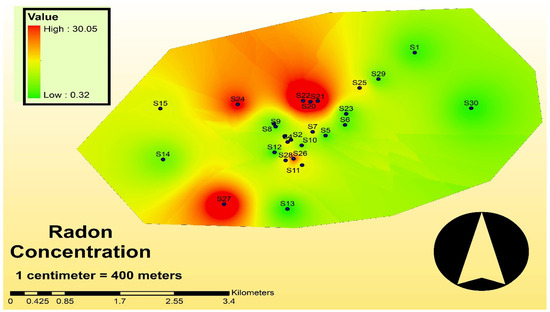
Figure 4.
Spatial distribution of Radon calculated using inverse distance weighting interpolation.
3.1. Health Hazards
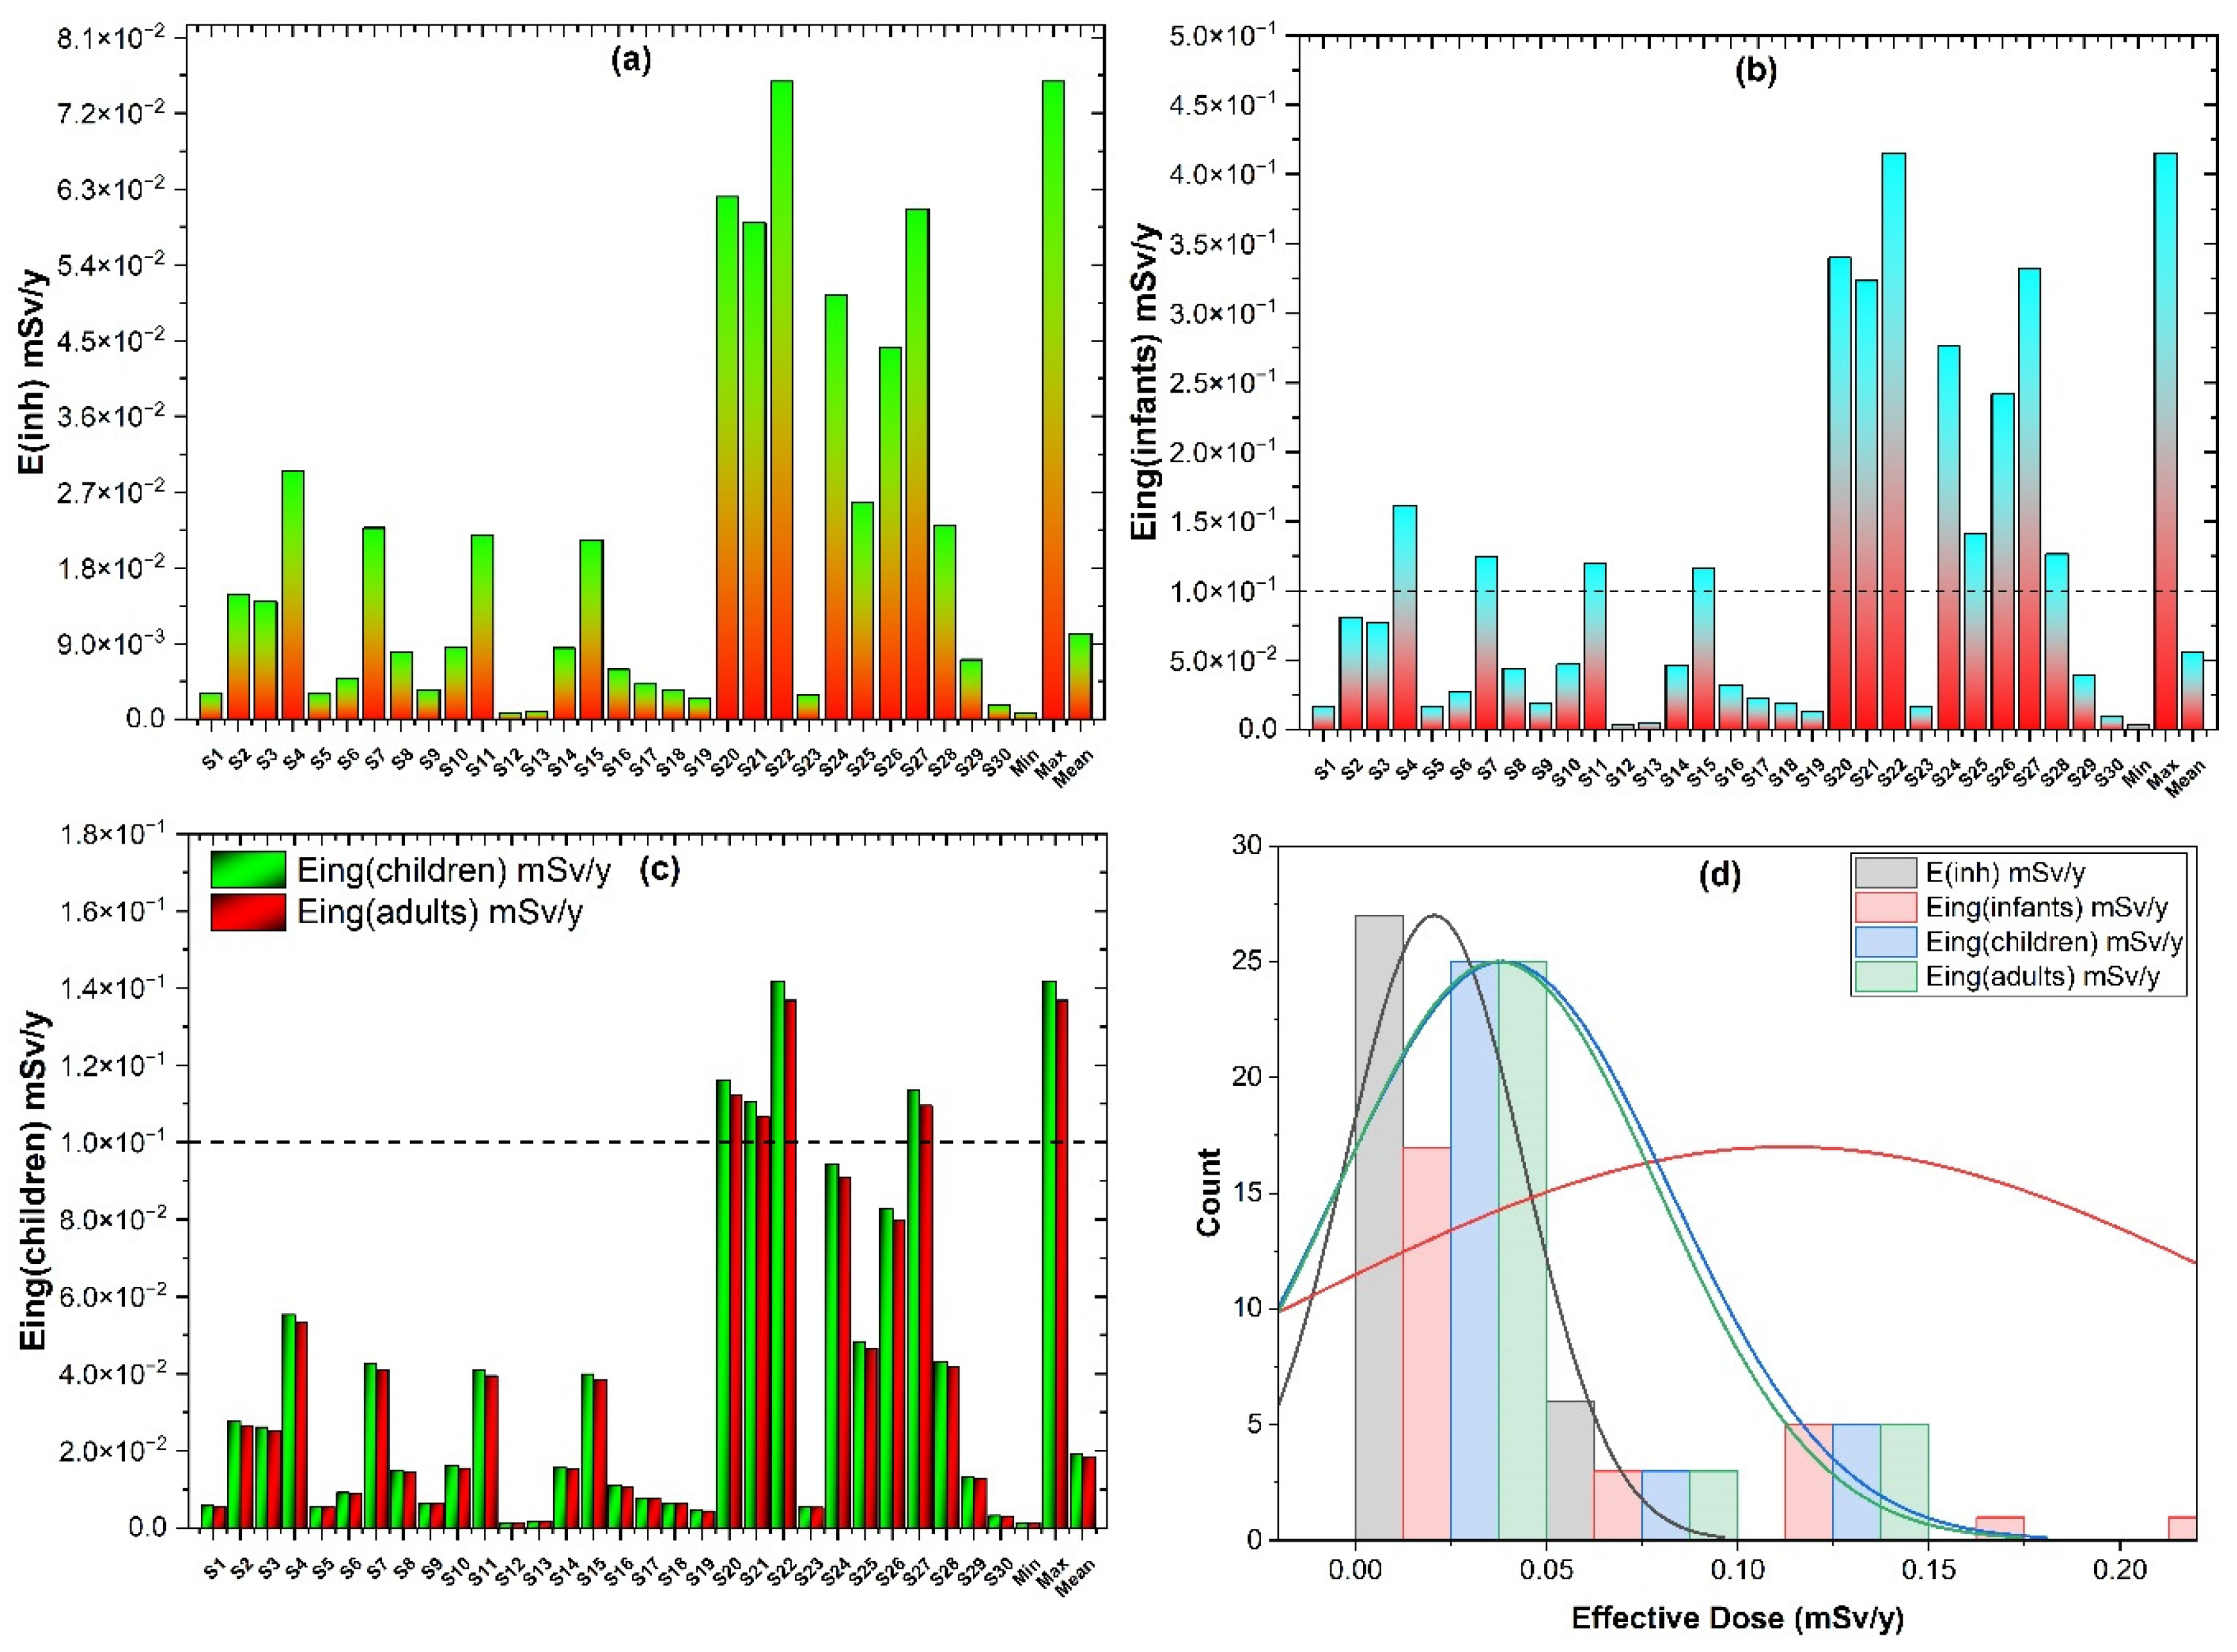
Radon enters the human body by ingestion and inhalation. We calculated the effective doses for ingestion inhalation as well as ingestion for infants, children, and adults, and the values are given in Table 2. The values for effectives doses are plotted in Figure 5: (a) inhalation, (b) ingestion for infants, (c) ingestion for children and adults, and (d) the frequency plot of the effective doses. According to Figure 5d, the effective dose for ingestion in infants was highest, followed by the effective dose for children, and then adults, and finally, the inhalation effective dose. The average value of effective dose for inhalation was 0.010 mSv/y. The average effective dose for ingestion for infants was 0.108 mSv/y, for children it was 0.037 mSv/y, and for adults it was 0.035 mSv/y. According to the World Health Organization (WHO), the recommended limit for annual effective dose from radiation in drinking water is 0.10 mSv/y. Several natural spring water samples exceeded this limit for ingestion, posing potential health risks to infants, children, and adults. The highest ingestion dose was for infants, followed by children, and then adults. The ingestion dose for infants exceeded the threshold limit for samples S4, S7, S11, S15, S20, S21, S22, S24, S25, S26, S27, and S28. In the case of the radon dose from ingestion for children and adults, the WHO dose was exceeded for samples S20, S21, S22, and S27. The inhalation doses for all the samples were below the limit. In comparison, none of the bottled drinking water samples exceeded the limit.
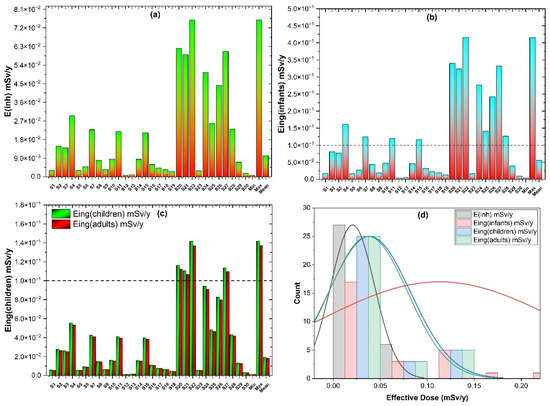
Figure 5.
Annual effective doses. (a) Inhalation, (b) Ingestion for infants, (c) Ingestion for children and adults, and (d) frequency distribution of effective doses.
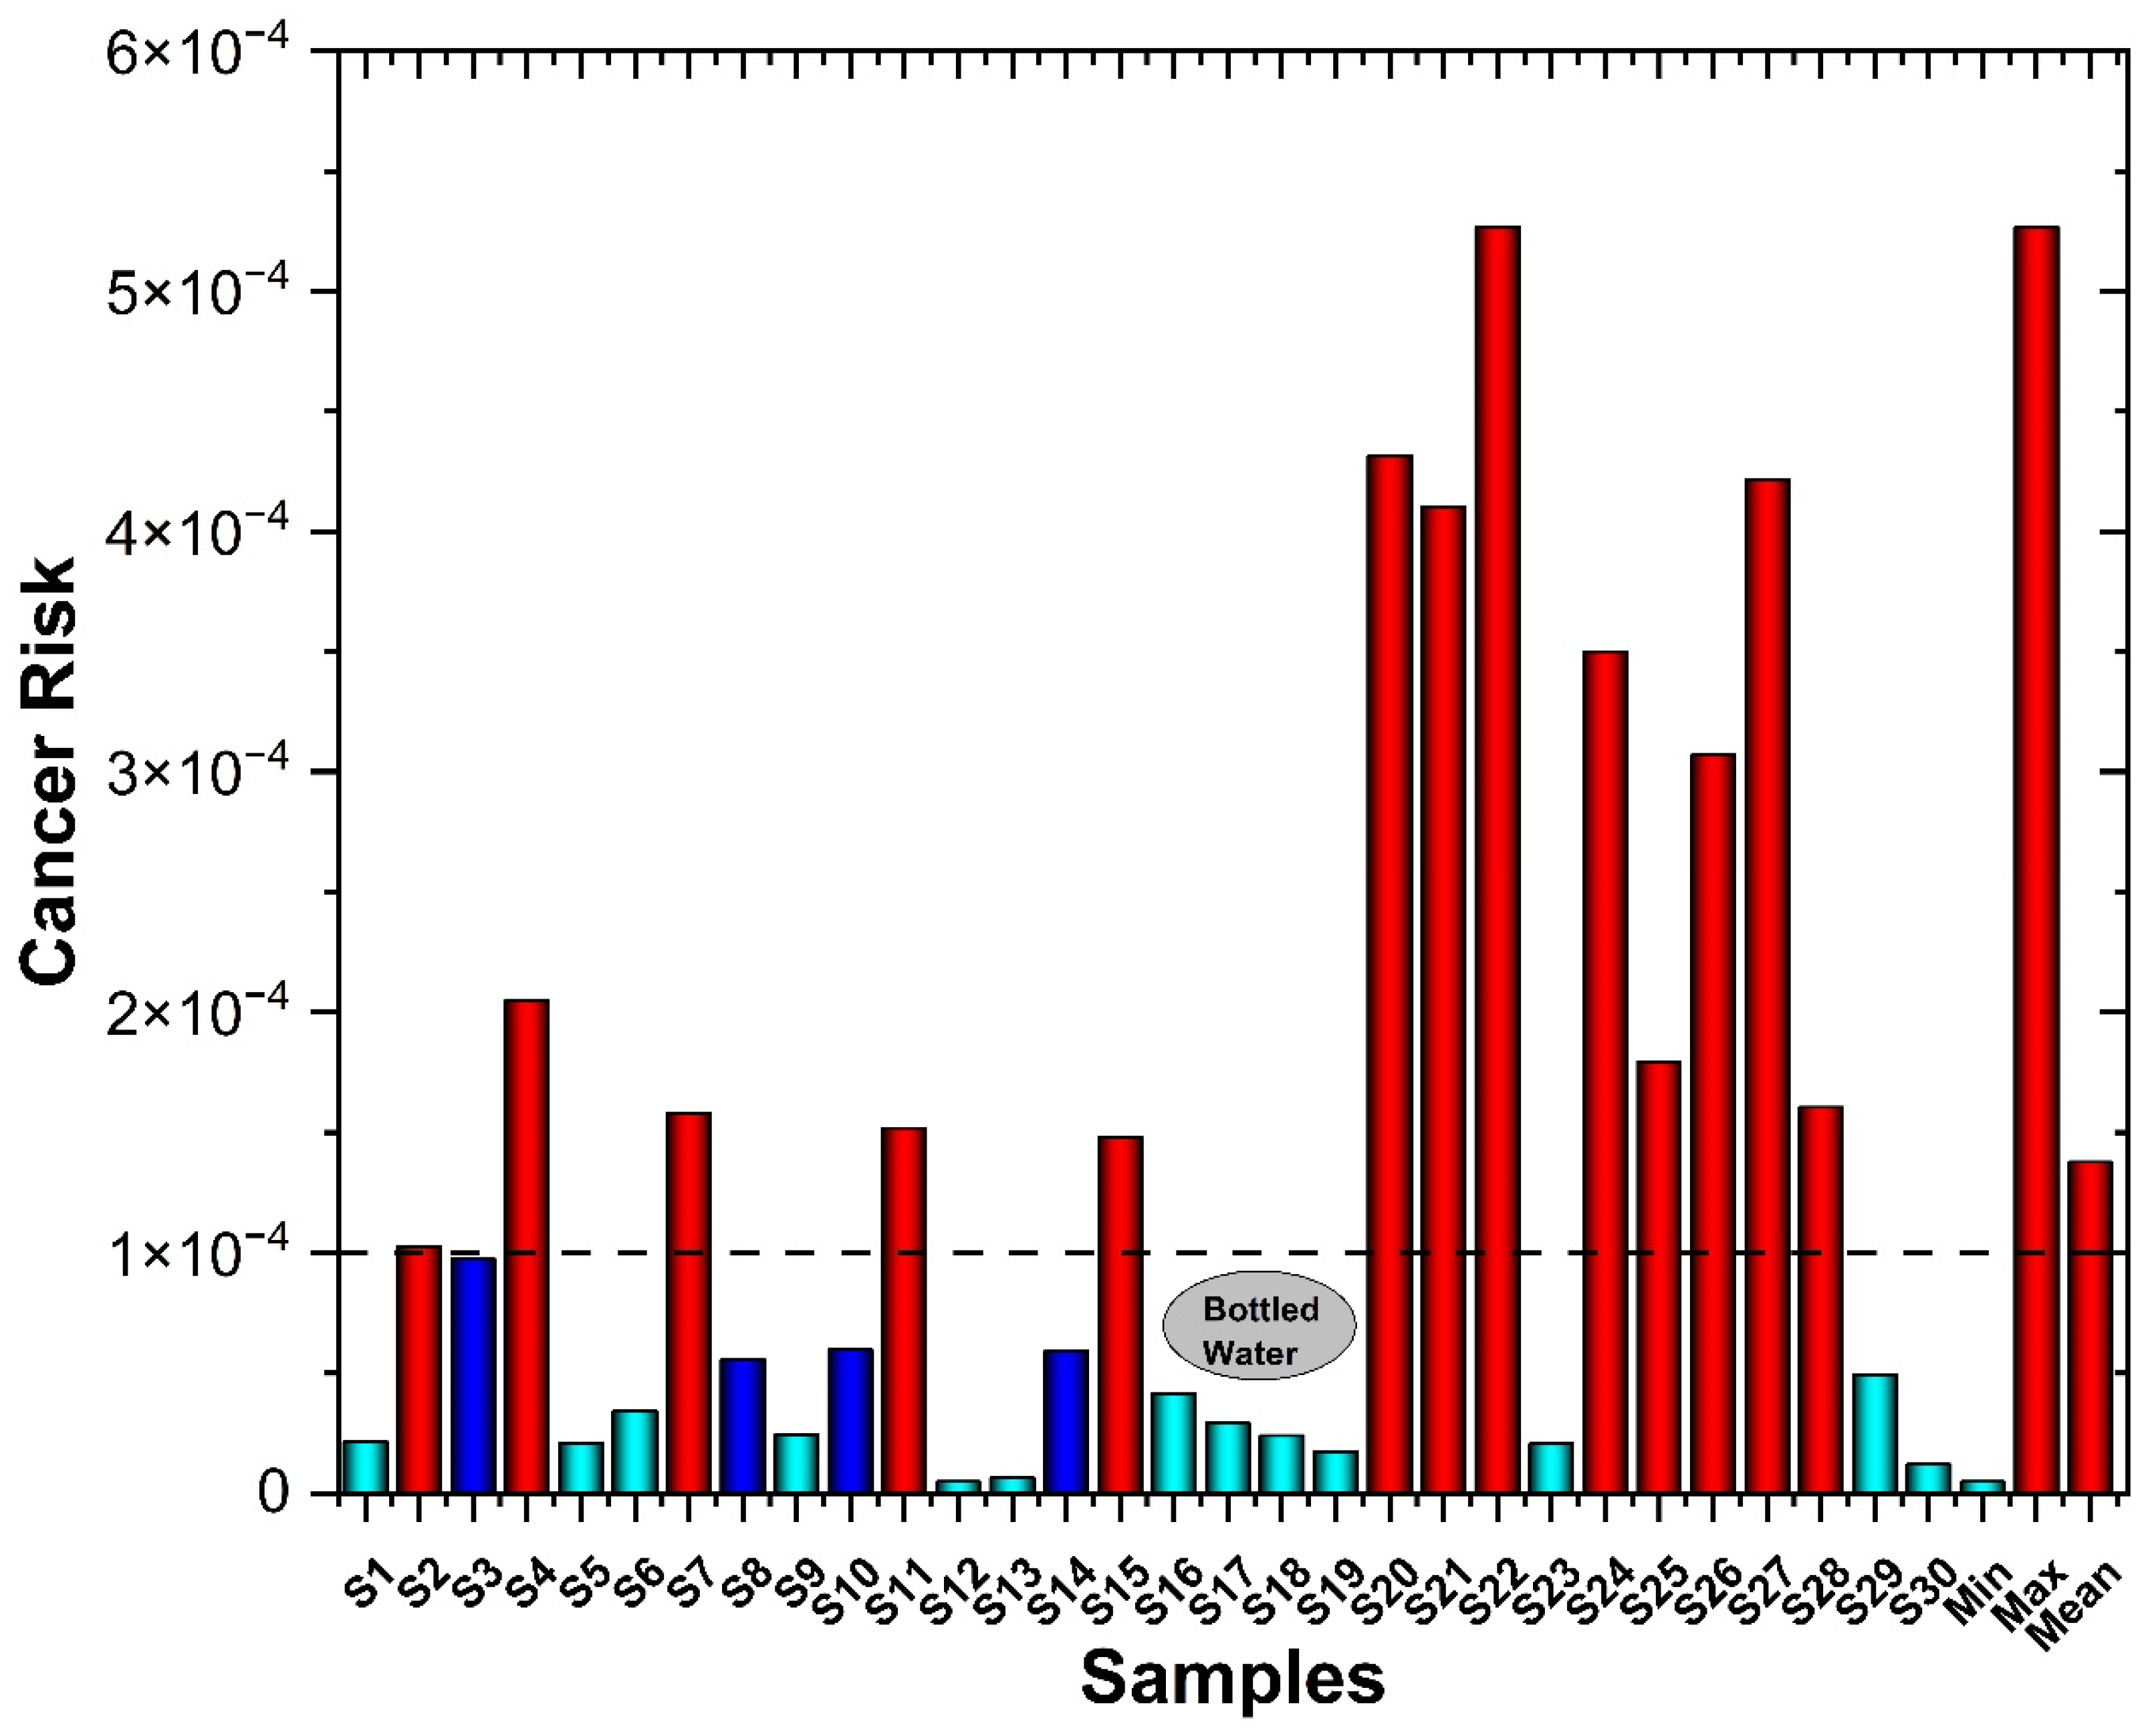
To assess the carcinogenic effects of radon for prolonged exposure, cancer risk was calculated, and the results are given in Figure 6. The cancer risk for S1, S4, S7, S11, S15, S20, S21, S22, S24, S25, S26, S27, and S28 exceeded the limit set by the US-EPA, which is 1 × 10⁻⁴ [1]. In 43 percent of the samples, the cancer risk was higher than the threshold established by the United States Environmental Protection Agency. It is likely that those who are exposed to contaminated water in the future could be at risk for developing cancer, as a result of this. Further research is needed to determine the specific types of cancer that may result from exposure to these contaminants. Additionally, regulatory agencies should consider implementing stricter guidelines to protect public health.
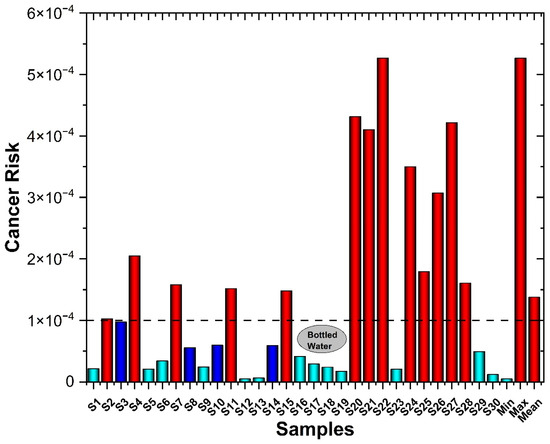
Figure 6.
Plotted values of cancer risk from exposure to radon.
Various factors, such as fluctuations in groundwater concentrations, pre-sampling exploratory operations, and distribution of drinking water, can significantly impact the actual levels of Rn exposure experienced by individuals in the research area. Disregarding these specific local factors may result in inadequate evaluations and probable misinterpretations of Rn exposure levels, hence reducing the accuracy of estimations of the health hazards for both adults and children. Further research should incorporate these important elements in the process of gathering and analyzing data to offer a comprehensive depiction of Rn exposure in the study vicinity. A comprehensive plan will enhance the visibility of potential health consequences resulting from radon exposure. Geology and soil composition are two variables that can be used to more accurately assess the levels of Rn exposure in a certain region. Implementing this will enable the application of targeted and effective mitigation strategies, hence decreasing the likelihood of adverse health effects resulting from exposure to radon. We also recommend conducting a study to evaluate the cancer mortality rate in this area in order to gain insight into the effects of radon exposure through water in the Bagh district.
3.2. Correlation
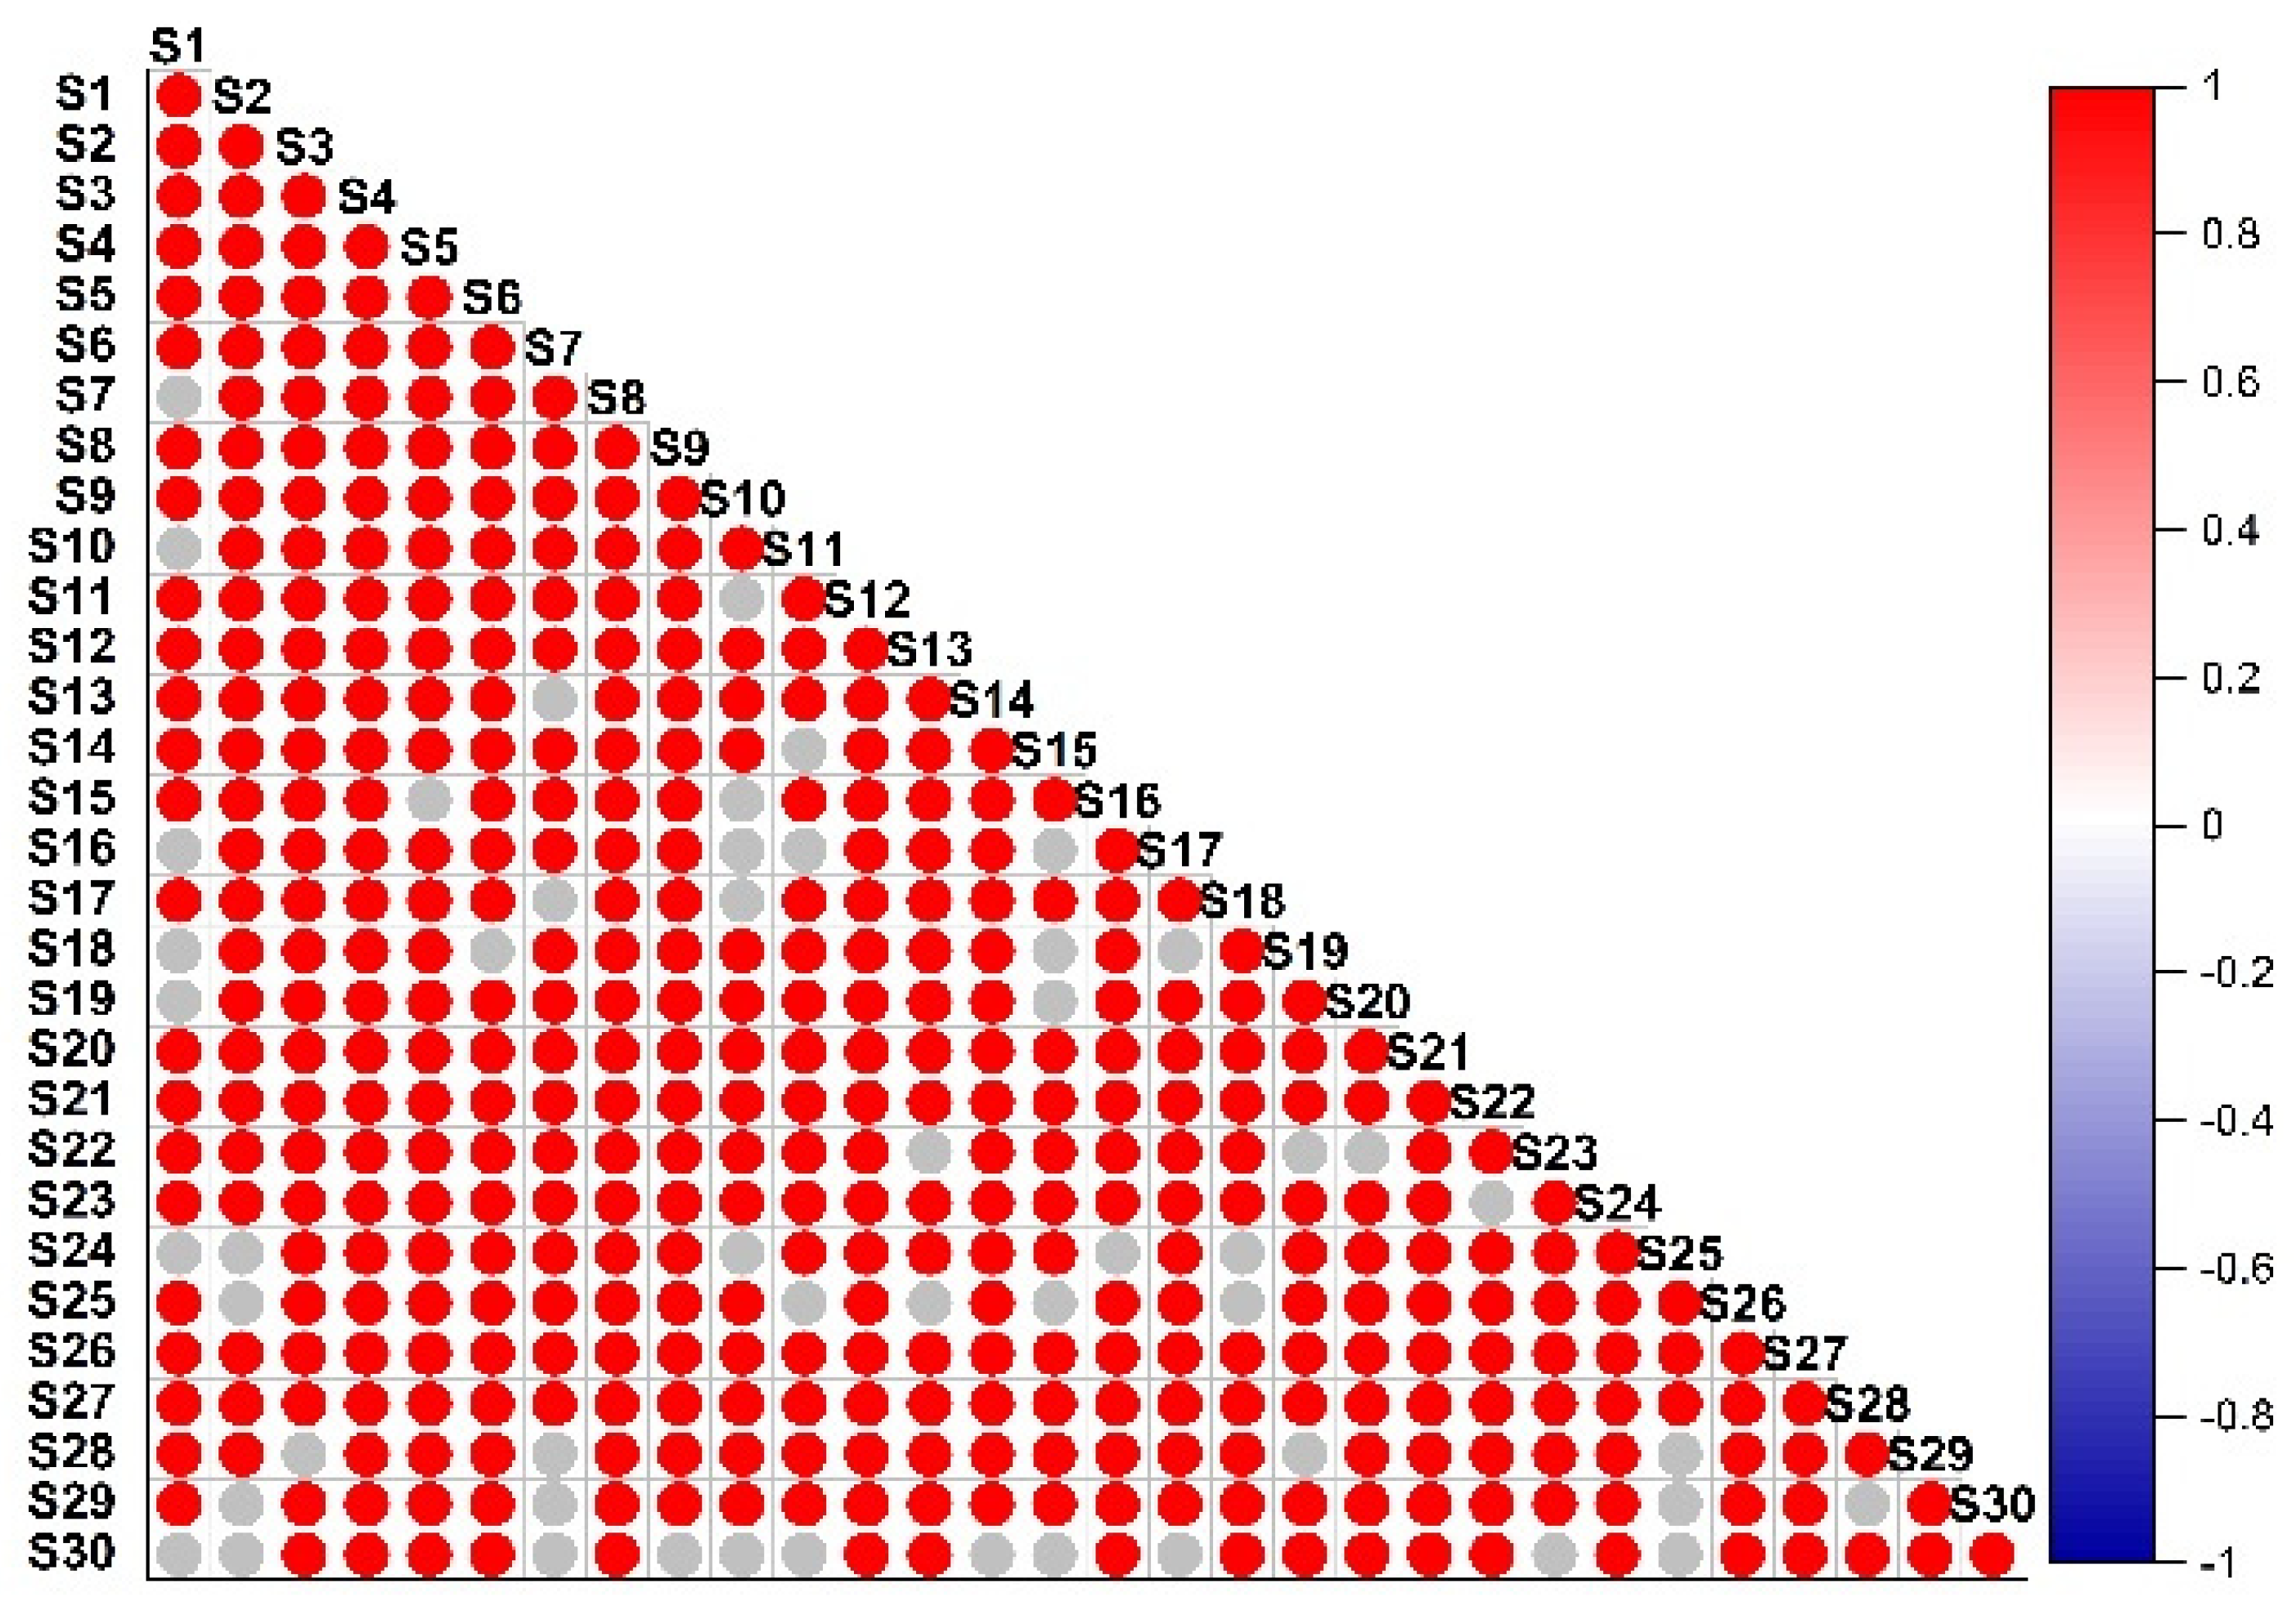
The Pearson’s correlation matrix was computed using Origin Pro 2024 (10.1) software to identify potential correlations among the data (Figure 7). The majority of the samples exhibited a highly significant association, indicating a consistent geological influence on the radon content in the natural spring waters of the study area. Certain samples exhibited a low association with others, particularly the bottled drinking water samples S16–S19 and spring water samples such as S10 and S30. The correlation matrix verified that the primary source of radon in most of the samples is the geological composition of the region. The strong correlation of Radon concentration for most of the samples indicates a similar geological source. The observed correlation between the sites may be attributed to the diffusion of radon into groundwater supply systems, particularly in areas with elevated quantities of uranium in the soil [34]. The porosity of the soil and the permeability of rocks significantly impact the process of radon diffusion, as they play a vital role in enabling the movement of this gas. Upon emergence, groundwater carries varying concentrations of radon. These findings indicate that the geological features of the region significantly influence the levels of radon in the natural spring waters.
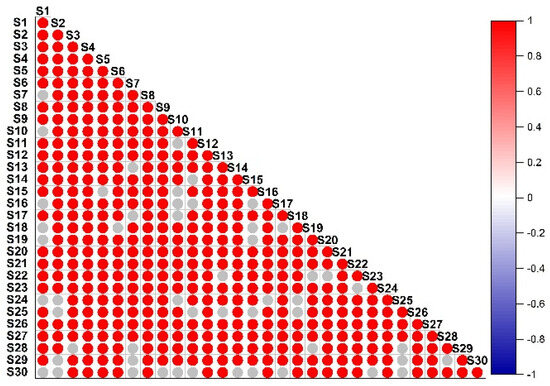
Figure 7.
Pearson’s correlation matrix calculated based on radon concentration.
3.3. Comparison of Spring and Bottled Water
A comparison was made between the radon concentrations in the natural spring water of Bagh and the bottled drinking water consumed in the area, given in Figure 8. The radon content and effective annual dose were greater in natural spring water compared to bottled drinking water. The results indicate that the bottled drinking water samples (S16–S19) generally showed lower effective doses compared to natural spring water samples. Specifically, the inhalation doses for these bottled water samples ranged from 0.002 mSv/y (S19) to 0.005 mSv/y (S16), while the ingestion doses for infants ranged from 0.0137 mSv/y (S19) to 0.0326 mSv/y (S16). The ingestion doses for children ranged from 0.0047 mSv/y (S19) to 0.011 mSv/y (S16), and for adults, the doses ranged from 0.0045 mSv/y (S19) to 0.0107 mSv/y (S16).
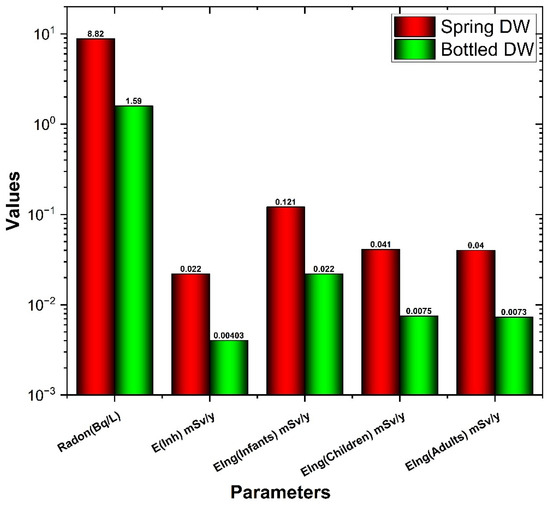
Figure 8.
Comparison between bottled and natural spring water.
In comparison, natural spring water samples exhibited a wider range of effective doses. For instance, sample S22 showed the highest values for inhalation (0.075 mSv/y) and ingestion for infants (0.414 mSv/y), children (0.141 mSv/y), and adults (0.136 mSv/y). Conversely, the lowest values for inhalation and ingestion doses in natural spring water were observed in sample S12, with 0.0007 mSv/y for inhalation and 0.0039 mSv/y, 0.0013 mSv/y, and 0.00128 mSv/y for ingestion by infants, children, and adults, respectively.
The water from natural springs originates from an underground aquifer, and the likelihood of it coming into contact with radioactive material is significantly increased due to the geological characteristics of that area [35]. Bottled drinking water, as a result of its processing and extended shelf life, has a reduced level of radon activity, leading to a lesser annual effective dose for the population. The cancer risk is also very low for bottled drinking water as compared to the water from natural springs.
3.4. Comparison with Other Studies
The comparison of the radon concentration in the present study with worldwide values was carried out (Table 3). In Bagh, Kashmir, a radon concentration of 7.86 Bq/L was found in the present study. This value is somewhat higher than what has been reported in certain countries, but it is still lower than in other areas. The levels of radon concentration in the present study are higher compared to those in Saudi Arabia, Iraq, Croatia, and Canada. On the other hand, Romania, Brazil, India, and Nigeria have reported higher radon concentrations compared to this work. In Romania, Brazil, and India, the radon levels were found to be considerably higher, whereas Nigeria had a slightly elevated radon concentration. Interestingly, Gilgit, another region in Pakistan, showed a significantly higher radon concentration, emphasizing the variations that exist within the same country. This analysis highlights the importance of conducting radon assessments specific to each location, as there are notable variations in radon levels across different regions.
Table 3.
Comparison of radon concentration with worldwide studies.
3.5. Strengths and Limitations
The strengths of this study include the evaluation of radon levels in natural spring water and bottled water, and the health hazards and carcinogenic effects associated with radon gas. Additionally, this research establishes a baseline for the radon levels in the study area. A deeper understanding of the factors affecting Rn levels requires us to examine measured concentrations against additional geological parameters, such as geology, soil type, and radionuclide parameters in water, which is considered as a limitation of this study and will be investigated in future analyses.
4. Conclusions
The aim of this study was to assess radon level in natural spring water in the Bagh district using an active (RAD7) method. The average radon concentration was used to determine spatial distribution and health hazards. The results showed that the maximum radon concentration was 30.06 ± 3.7 Bq/L in S22 and the lowest was 0.28 ± 0.1 Bq/L in Sample 12, with an average of 7.86 ± 2.3 Bq/L. Radon levels in drinking water can vary depending on geography and time, including active plate tectonics, underlying geology, mineral composition, soil texture, and climate. The average radon concentration in S4, S20, S21, S22, S24, S26, and S27 samples is above the US-EPA’s 11 Bq/L standard, which could be attributed to seismic activity, landslides, or the underlying geology. The investigation found that natural spring water had a higher radon level and effective annual dose than bottled drinking water because water from subterranean aquifers increases the risk of contact with radioactive substances. The bottled drinking water posed no carcinogenic risk while more than 50% of the natural spring water samples exceeded the risk limit. This paper provides a baseline for radon levels in drinking water of Bagh district and concludes that prolonged radon exposure may affect the health of some individuals in the Bagh area consuming the water from natural springs. To better understand the dynamics of radon concentrations, we recommend constant radon monitoring in the area.
Author Contributions
Conceptualization, H.Y. and M.A.; Methodology, M.S. and A.H.I.; Software, A.S., M.A. and H.Y.; Validation, M.A.; Formal analysis, A.S., M.S., K.M. and A.H.I.; Investigation, A.S. and K.M.; Resources, M.A. and H.Y.; Data curation, A.S., K.M. and A.H.I.; Writing—original draft, M.A., H.Y. and M.S.; Writing—review & editing, M.A. and H.Y.; Visualization, A.H.I. and M.A. All authors have read and agreed to the published version of the manuscript.
Funding
This work acknowledges support from the King Faisal University, Al-Ahsaa, Saudi Arabia (Proposal Number: GrantA502), and the Ajman University, Internal Research Grant No DRGS Ref. 2023-IRG-HBS-13.
Institutional Review Board Statement
Not applicable.
Informed Consent Statement
Not applicable.
Data Availability Statement
The data presented in this study is available on request to the corresponding author.The data are not publicly available due to privacy.
Acknowledgments
This work acknowledges support from the King Faisal University, Al-Ahsaa, Saudi Arabia (Proposal Number: GrantA502), and the Ajman University, Internal Research Grant No DRGS Ref. 2023-IRG-HBS-13. The co-ordination of Usman Ali from Radiation Physics Lab, COMSATS University is also acknowledged.
Conflicts of Interest
The authors declare no conflict of interest.
References
- Shah, S.S.A.; Asif, A.R.; Ilahi, M.; Haroon, H.; Islam, I.; Qadir, A.; Nisar, I.; Sani, M.M.U.; Iqbal, R.; ur Rahman, M.H.; et al. Geographical distribution of radon and associated health risks in drinking water samples collected from the Mulazai area of Peshawar, Pakistan. Sci. Rep. 2024, 14, 6042. [Google Scholar] [CrossRef]
- Anjum, M.; Siddique, N.; Younis, H.; Faiz, Y.; Shafique, M.A.; Mahnoor, A.; Sajid, A.; Altaf, M. Heavy Metals and Radionuclides in Islamabad’s Industrial Area: A Comprehensive Analysis of Soil and Water Pollution, Source Apportionment and Health Effects Using Statistical and Geospatial Tools. J. Trace Elem. Miner. 2024, 8, 100127. [Google Scholar] [CrossRef]
- Schwarzenbach, R.P.; Egli, T.; Hofstetter, T.B.; Von Gunten, U.; Wehrli, B. Global Water Pollution and Human Health. Annu. Rev. Environ. Resour. 2010, 35, 109–136. [Google Scholar] [CrossRef]
- Ahmad, W.; Alharthy, R.D.; Zubair, M.; Ahmed, M.; Hameed, A.; Rafique, S. Toxic and heavy metals contamination assessment in soil and water to evaluate human health risk. Sci. Rep. 2021, 11, 17006. [Google Scholar] [CrossRef]
- Abd El-Mageed, A.I.; El-Kamel, A.E.-H.; Abbady, A.E.-B.; Harb, S.; Saleh, I.I. Natural radioactivity of ground and hot spring water in some areas in Yemen. Desalination 2013, 321, 28–31. [Google Scholar] [CrossRef]
- Pervin, S.; Yeasmin, S.; Khandaker, M.U.; Begum, A. Determination of radon concentration in bottled drinking water of Dhaka City. Int. J. Environ. Anal. Chem. 2024, 1–13. [Google Scholar] [CrossRef]
- Borrego-Alonso, D.; Quintana-Arnés, B.; Lozano, J.C. Natural radionuclides behaviour in drinking groundwaters from Castilla y León (Spain); radiological implications. Water Res. 2023, 245, 120616. [Google Scholar] [CrossRef]
- Rangaswamy, D.R.; Srinivasa, E.; Srilatha, M.C.; Sannappa, J. Measurement of radon concentration in drinking water of Shimoga district, Karnataka, India. J. Radioanal. Nucl. Chem. 2016, 307, 907–916. [Google Scholar] [CrossRef]
- Hopke, P.K.; Borak, T.B.; Doull, J.; Cleaver, J.E.; Eckerman, K.F.; Gundersen, L.C.S.; Harley, N.H.; Hess, C.T.; Kinner, N.E.; Kopecky, K.J.; et al. Health Risks Due to Radon in Drinking Water. Environ. Sci. Technol. 2000, 34, 921–926. [Google Scholar] [CrossRef]
- Taalab, S.A.; Mohamed, W.H.; Abdel-Rahman, A.M.; Alqahtani, M.S.; La Verde, G.; Pugliese, M.; Hanfi, M.Y.; Ambrosino, F. Distribution maps and hazard of radioelements from granitic rocks in an Egypt region. Eur. Phys. J. Plus 2023, 138, 828. [Google Scholar] [CrossRef]
- Abbas, S.Q.; Khan, J.; Riaz, M.T.; Rafique, M.; Zaman, A.; Khan, S. Radon concentration in spring water as an indicator of seismic activity: A case study of the Muzaffarabad Fault in Pakistan. Environ. Monit. Assess. 2023, 196, 41. [Google Scholar] [CrossRef]
- Lara, E.; Rocha, Z.; Palmieri, H.E.L.; Santos, T.O.; Rios, F.J.; Oliveira, A.H. Radon concentration in soil gas and its correlations with pedologies, permeabilities and 226Ra content in the soil of the Metropolitan Region of Belo Horizonte—RMBH, Brazil. Radiat. Phys. Chem. 2015, 116, 317–320. [Google Scholar] [CrossRef]
- Azeem, U.; Younis, H.; Mehboob, K.; Ajaz, M.; Ali, M.; Hidayat, A.; Muhammad, W. Radionuclide concentrations in agricultural soil and lifetime cancer risk due to gamma radioactivity in district Swabi, KPK, Pakistan. Nucl. Eng. Technol. 2023, 56, 207–215. [Google Scholar] [CrossRef]
- Anjum, M.; Siddique, N.; Younis, H.; Faiz, Y.; Shafique, M.A.; Mahnoor; Feroze, R.; Abbasi, N.U.H. Evaluating heavy metal contamination and radiological effects in soil samples from Murree, Pakistan. Environ. Earth Sci. 2024, 83, 361. [Google Scholar] [CrossRef]
- Dettmering, T.; Zahnreich, S.; Colindres-Rojas, M.; Durante, M.; Taucher-Scholz, G.; Fournier, C. Increased effectiveness of carbon ions in the production of reactive oxygen species in normal human fibroblasts. J. Radiat. Res. 2015, 56, 67–76. [Google Scholar] [CrossRef]
- Darby, S.; Hill, D.; Auvinen, A.; Barros-Dios, J.M.; Baysson, H.; Bochicchio, F.; Deo, H.; Falk, R.; Forastiere, F.; Hakama, M.; et al. Radon in homes and risk of lung cancer: Collaborative analysis of individual data from 13 European case-control studies. BMJ 2005, 330, 223. [Google Scholar] [CrossRef]
- Scheib, C.; Appleton, J.D.; Miles, J.C.H.; Hodgkinson, E. Geological controls on radon potential in England. Proc. Geol. Assoc. 2013, 124, 910–928. [Google Scholar] [CrossRef]
- Yarahmadi, M.; Shahsavani, A.; Mahmoudian, M.H.; Shamsedini, N.; Rastkari, N.; Kermani, M. Estimation of the residential radon levels and the annual effective dose in dwellings of Shiraz, Iran, in 2015. Electron. Physician 2016, 8, 2497–2505. [Google Scholar] [CrossRef]
- Khan, M.A.; Khattak, N.U.; Hanif, M.; Al-Ansari, N.; Khan, M.B.; Ehsan, M.; Elbeltagi, A. Health risks associated with radon concentrations in carbonate and evaporite sequences of the uranium-rich district Karak, Pakistan. Front. Environ. Sci. 2022, 10, 1020028. [Google Scholar] [CrossRef]
- Edition, F. Guidelines for drinking-water quality. WHO Chron. 2011, 38, 104–108. [Google Scholar]
- EPA. Radon in drinking water health risk reduction and cost analysis. Fed. Reg. 1999, 64, 9560–9599. [Google Scholar]
- USEPA. National Primary Drinking Water Regulations; Radionuclides; Proposed Rule. Fed. Regist. 1991, 56, 33050–33127. [Google Scholar]
- Binesh, A.; Mowlavi, A.A.; Mohammadi, S. Estimation of the Effective Dose from Radon Ingestion and Inhalation in Drinking Water Sources of Mashhad, Iran. Iran. J. Radiat. Res. 2012, 10, 37–41. [Google Scholar]
- Salih, N.F. Determine the Contaminations of Radon in the Drinking Water Using NTDs (CR-39) and RAD7 Detectors. Arab. J. Sci. Eng. 2021, 46, 6061–6074. [Google Scholar] [CrossRef]
- Azad Kashmir. Wikipedia. 2024. Available online: https://en.wikipedia.org/w/index.php?title=Azad_Kashmir&oldid=1220222895 (accessed on 27 April 2024).
- Jobbágy, V.; Stroh, H.; Marissens, G.; Hult, M. Comprehensive study on the technical aspects of sampling, transporting and measuring radon-in-water. J. Environ. Radioact. 2019, 197, 30–38. [Google Scholar] [CrossRef]
- Diab, H.M. Accuracy and precision of RAD7 and RAD H2O accessories radon detector in water measurement based on counting statistics for sniff and normal modes. Rom. J. Biophys. 2019, 29, 1–11. Available online: https://www.rjb.ro/wp-content/uploads/Diab_7_F_ACC.pdf (accessed on 16 July 2024).
- Charles, M. Effects of Ionizing Radiation: United Nations Scientific Committee on the Effects of Atomic Radiation: UNSCEAR 2006 Report, Volume 1—Report to the General Assembly, with Scientific Annexes A and B 2010; Oxford University Press: Oxford, UK, 2010; Available online: https://academic.oup.com/rpd/article-abstract/138/2/187/1647001 (accessed on 22 June 2024).
- Pourshabanian, M.; Nasseri, S.; Nodehi, R.N.; Hosseini, S.S.; Mahvi, A.H. Radon measurement and age-independent effective dose attributed to ingestion of bottled water in Iran: Sensitivity analysis. Sci. Rep. 2023, 13, 12717. [Google Scholar] [CrossRef]
- Ajibola, T.B.; Orosun, M.M.; Lawal, W.A.; Akinyose, F.C.; Salawu, N.B. Assessment of Annual Effective Dose Associated with Radon in Drinking Water from Gold and Bismuth Mining area of Edu, Kwara, North-central Nigeria. Pollution 2021, 7, 231–240. [Google Scholar] [CrossRef]
- Cousins, C.; Miller, D.L.; Bernardi, G.; Rehani, M.M.; Schofield, P.; Vañó, E.; Einstein, A.J.; Geiger, B.; Heintz, P.; Padovani, R. International commission on radiological protection. ICRP Publ. 2011, 120, 1–125. [Google Scholar]
- Eckerman, K.; Harrison, J.; Menzel, H.G.; Clement, C.H. ICRP publication 119: Compendium of dose coefficients based on ICRP publication 60. Ann. ICRP 2012, 41, 1–130. [Google Scholar] [CrossRef]
- Javed, S. Landslide hazard mapping of Bagh district in Azad Kashmir. Int. J. Econ. Environ. Geol. 2019, 8, 47–50. [Google Scholar]
- Nunes, L.J.R.; Curado, A.; Lopes, S.I. The Relationship between Radon and Geology: Sources, Transport and Indoor Accumulation. Appl. Sci. 2023, 13, 7460. [Google Scholar] [CrossRef]
- Khattak, N.; Khan, M.; Shah, M.; Javed, M. Radon concentration in drinking water sources of the Main Campus of the University of Peshawar and surrounding areas, Khyber Pakhtunkhwa, Pakistan. J. Radioanal. Nucl. Chem. 2011, 290, 493–505. [Google Scholar] [CrossRef]
- Nita, D.C.; Moldovan, M.; Sferle, T.; Ona, V.D.; Burghele, B.D. Radon concentrations in water and indoor air in north-west regions of Romania. Cancer 2013, 2, 196–201. Available online: https://www.researchgate.net/profile/Burghele-Bety-Denissa/publication/264047155_Radon_concentrations_in_water_and_indoor_air_in_North_-_West_regions_of_Romania/links/5583e68d08ae4738295bb281/Radon-concentrations-in-water-and-indoor-air-in-North-West-regions-of-Romania.pdf (accessed on 10 May 2024).
- Bonotto, D.M. 222Rn, 220Rn and other dissolved gases in mineral waters of southeast Brazil. J. Environ. Radioact. 2014, 132, 21–30. [Google Scholar] [CrossRef] [PubMed]
- Mamun, A.; Alazmi, A.S. Investigation of Radon in Groundwater and the Corresponding Human-Health Risk Assessment in Northeastern Saudi Arabia. Sustainability 2022, 14, 14515. [Google Scholar] [CrossRef]
- Singh, K.P.; Chandra, S.; Prasad, M.; Joshi, A.; Prasad, G.; Ramola, R.C. Estimation of radiation dose due to ingestion of radon in water samples of Garhwal Himalaya, India. J. Radioanal. Nucl. Chem. 2023, 333, 2867–2879. [Google Scholar] [CrossRef]
- Abdullah, G.M.; Azeez, H.H.; Mustafa, H.T.; Ismaeel, A.O. A study of radon concentration and physicochemical parameters in spring water of Erbil city, Iraqi Kurdistan Region. J. Radioanal. Nucl. Chem. 2023, 332, 775–784. [Google Scholar] [CrossRef]
- Poje Sovilj, M.; Miklavčić, I.; Šmit, G.; Stanić, D.; Radolić, V. Estimation of the annual effective dose from exposure to radon in drinking water in Croatia. Appl. Radiat. Isot. 2023, 200, 110950. [Google Scholar] [CrossRef]
- Virk, J.; Virk, H.S. Radon estimation in water of surrey region of British Columbia, Canada using LR-115 type II nuclear track detector. Earth 2021, 12, 50. [Google Scholar]
- Farai, I.P.; Muritala, A.A.; Oni, O.M.; Samuel, T.D.; Abraham, A. Radiological indices estimation from radon concentration in selected groundwater supplies in Abeokuta, south western Nigeria. Appl. Radiat. Isot. 2023, 191, 110534. [Google Scholar] [CrossRef] [PubMed]
- Ullah, F.; Muhammad, S.; Ali, W. Radon concentration and potential risks assessment through hot springs water consumption in the Gilgit and Chitral, Northern Pakistan. Chemosphere 2022, 287, 132323. [Google Scholar] [CrossRef] [PubMed]


Disclaimer/Publisher’s Note: The statements, opinions and data contained in all publications are solely those of the individual author(s) and contributor(s) and not of MDPI and/or the editor(s). MDPI and/or the editor(s) disclaim responsibility for any injury to people or property resulting from any ideas, methods, instructions or products referred to in the content. |
© 2024 by the authors. Licensee MDPI, Basel, Switzerland. This article is an open access article distributed under the terms and conditions of the Creative Commons Attribution (CC BY) license (https://creativecommons.org/licenses/by/4.0/).