Abstract
Diesel pallet trucks, a type of heavy-duty diesel trucks (HDDTs), have historically been a vital component in logistics and transport due to their high payload capacity. However, they also present significant challenges, particularly in terms of emissions which contribute substantially to urban air pollution. Traditional HDDTs emission measurement methods, such as engine bench tests and those used in laboratory settings, often fail to capture real-world emission behaviors accurately. This study specifically examines the real-world emission characteristics of diesel pallet trucks exceeding 30 t under varying loads (unloaded, half loaded, and fully loaded) and different road conditions (urban, suburban, and high-speed). Considering that data quality is the key to the accuracy of the scheme, this research utilized a portable emission measurement system (PEMS) to capture real-time emissions data of carbon dioxide (CO2), carbon monoxide (CO), nitrogen oxides (NOX), and total hydrocarbons (THC). Key findings demonstrate a direct correlation between vehicle load and emission factors, with the emission factors for CO2, CO, and NOX increasing by 39.5%, 105.4%, and 22.7%, respectively, from unloaded to fully loaded states under comprehensive operating conditions. Regression analyses further provide an emission factor prediction model for HDDPTs, underscoring the continuous relationship between speed, load, and emission rates. These findings provide a scientific basis for pollution control strategies for diesel trucks.
1. Introduction
Urban environmental pollution and global warming have become major challenges for society today [1,2]. Transportation is a significant contributor to urban pollution and carbon dioxide (CO2) emissions [3,4]. Despite heavy-duty diesel trucks (HDDTs) representing only a small fraction of China’s vehicle fleet, the pollutants they produce should not be underestimated. In China, the emissions of carbon monoxide (CO), total hydrocarbons (THC), nitrogen oxides (NOX) and particulate matter (PM) of HDDTs were 704,000 t, 84,000 t, 4,001,000 t and 33,000 t, respectively, in the year of 2021, accounting for 10.6%, 17.7%, 76.1%, and 51.6% of the total automotive emissions, respectively [5]. NOX and CO, among other harmful substances, not only have significant environmental impacts but also pose serious threats to human health [6].
Research indicates that vehicle emissions are influenced by several factors, including vehicle load [7], road gradient [8], environmental conditions (temperature, humidity, etc.) [9], and driving modes (acceleration, deceleration, idle speed, etc.) [10]. Among these factors, extensive studies have been conducted on the impact of driving modes on vehicle emission characteristics. Chen et al. [11] calculated the proportion of time of the test vehicle in the running process and analyzed the influence of speed and acceleration on vehicle exhaust emission in detail. They pointed out that the vehicle emission rate varies greatly due to factors such as speed and acceleration. Dhital et al. [12] quantitatively defined aggressive driving and normal driving behavior as relative positive acceleration to study the influence of driving behavior on the emissions of old diesel trucks. Their results show that the emissions of PM, CO2 and THC are significantly different under different driving modes. However, little research has been done on the real-time emission test of pallet trucks over 30 t and the emission model under coupled different load conditions. Thomas et al. [13] measured the emissions of light heavy-duty pickup trucks under a combination of unloaded, half-loaded, and fully loaded and different driving cycles using a dynamometer. The weight of the diesel vehicles tested was between 8510 and 9200 lb. It was found that the effect of increasing payload on diesel vehicle emissions varied with vehicles and pollutants. Hausberger et al. [14] measured heavy-duty test vehicles using engine bench tests and chassis dynamometers to analyze the effect of vehicle load and road gradient on NOX under different driving cycles for vehicles with different emission standards. Chen et al. [15] tested a heavy-duty diesel bus using a chassis dynamometer and explored the THC, CO, PM, NOX emissions and fuel consumption of the vehicle under unloaded, half-loaded and fully loaded states. Although all the above papers show that the load condition is closely related to the vehicle emission characteristics, the data source is not the actual driving environment. In this paper, real-time emission tests are carried out under different scenarios for heavy-duty diesel panel trucks (HDDPTs) over 30 t, to address the shortcomings of the emission characteristics of HDDPTs in the real environment and the total amount assessment. Our methods include: (1) Testing under different loads. (2) Test under various driving conditions (urban, suburban and high-speed). (3) Comprehensively consider the influence of various factors on emissions and recreate the real driving scene. By integrating these factors, we hope to provide a comprehensive understanding of HDDTs emissions.
Because the load of heavy trucks is usually large, it is very important to evaluate the impact of these loads on emissions. Most of the studies on vehicle loading are outdated and mostly use laboratory measurements. The laboratory measurement methods cannot fully reflect the real road driving conditions. With the deepening of emission research and the improvement of environmental awareness, the requirements for vehicle measurement are increasing. At present, automobile exhaust measurement is usually carried out using a chassis dynamometer [16], the engine bench test method [17], the tunnel method [18], remote sensing [19] and portable emission measurement systems (PEMS) [20]. However, the first four methods have shortcomings that cannot be ignored [21,22]. The chassis dynamometer cannot reproduce real road conditions, such as road friction, air resistance, etc. The engine bench test method can only test the emission performance of the engine, without considering the actual emission of the whole vehicle under different loads and driving conditions. The tunnel method needs special infrastructure and the test process is complex and time-consuming. Remote sensing can usually only obtain the emission data of a single pass and cannot continuously detect the emission changes of the same vehicle under different conditions. However, PEMS can provide more comprehensive and diversified emission data and truly reflect the emission level under actual road conditions. Many countries have adopted the PEMS test as a standardized method for heavy vehicle emission measurement [23,24].
Some studies on the influence of vehicle load on emissions have been performed using PEMS. Frey et al. [22] used PEMS to study the emission difference of HDDTs under loaded and unloaded conditions and calculated the emission rate ratio of loaded and unloaded cycles. Wang et al. [21] studied the emission difference of diesel semi-trailer towing trucks under different load states using on-board diagnostic (OBD) and PEMS, specifically comparing the STP distribution, emission rate distribution and emission factor characteristics. Su et al. [25] analyzed the characteristics of NOX emission factor and emission concentration of HDDTs under the comprehensive influence of different road types (urban, suburbs and motorways), different vehicle loads (0%, 50% and 75%) and different SCR system statuses (operation and failure) based on PEMS. Liu et al. [26] explored the NOX emission changes of urban heavy vehicles under various payload conditions. The paper mentions that increasing the payload is beneficial for reducing NOX emissions. However, research in this field is still limited, with most of them focusing on the difference of vehicle emission factors and Vehicle Specific Power (VSP) distribution.
The VSP value has been used to reflect the engine power required by a vehicle to overcome aerodynamic force, rolling drag force, and rotational force to move the vehicle forward on actual roads [27]. It has intuitive physical significance and well represents the actual workload of vehicles. Therefore, a large number of scholars have expressed concerns about the relationship between VSP and vehicle emissions. For example, Chong et al. [28] determined the road load coefficient of VSP and the regression coefficient between fuel utilization rate and VSP in order to study the exhaust emission characteristics. Wang et al. [29] analyzed the emission of urban freight vehicles based on the VSP method and affirmed the important role of VSP in emission analysis.
For this purpose, the emissions of CO2, CO, NOX and THC are mainly studied using 31 t HDDPTs as the research object. The PEMS test is used to collect emission data under actual road conditions when the vehicle is unloaded, half loaded and fully loaded. The effects of driving conditions and vehicle load ratio on emission factors were comprehensively considered. The characteristics of instantaneous emission corresponding to vehicle speed and acceleration are analyzed. In addition, the distribution of VSP at different loads of the vehicle was further analyzed.
The organization of the research work is as follows: Section 2 covers experimental design, including the design of testing equipment, vehicles, and routes, as well as data processing requirements. Section 3 analyzes the effects of different operating conditions on emission factors, the influence of vehicle motion states on emission rates, and the VSP characteristics under various loads. Section 4 presents the conclusions.
2. Materials and Methods
In order to accurately measure and analyze the emissions of diesel pallet vehicles exceeding 30 t under different load conditions and real environment, a robust data collection system is combined with comprehensive data analysis. First of all, experimental design should be carried out, including the design of test equipment, test route and test vehicle. A complete experimental design can obtain high-quality vehicle emission data. Then, the collected data are processed, including the calculations of the emission factor and emission rate, VSP calculation and division. Finally, numerical values, such as emission factor, emission rate, VSP and other influencing factors, such as operating conditions, load status and driving mode are combined for data mining.
2.1. Emission Measurement Systems
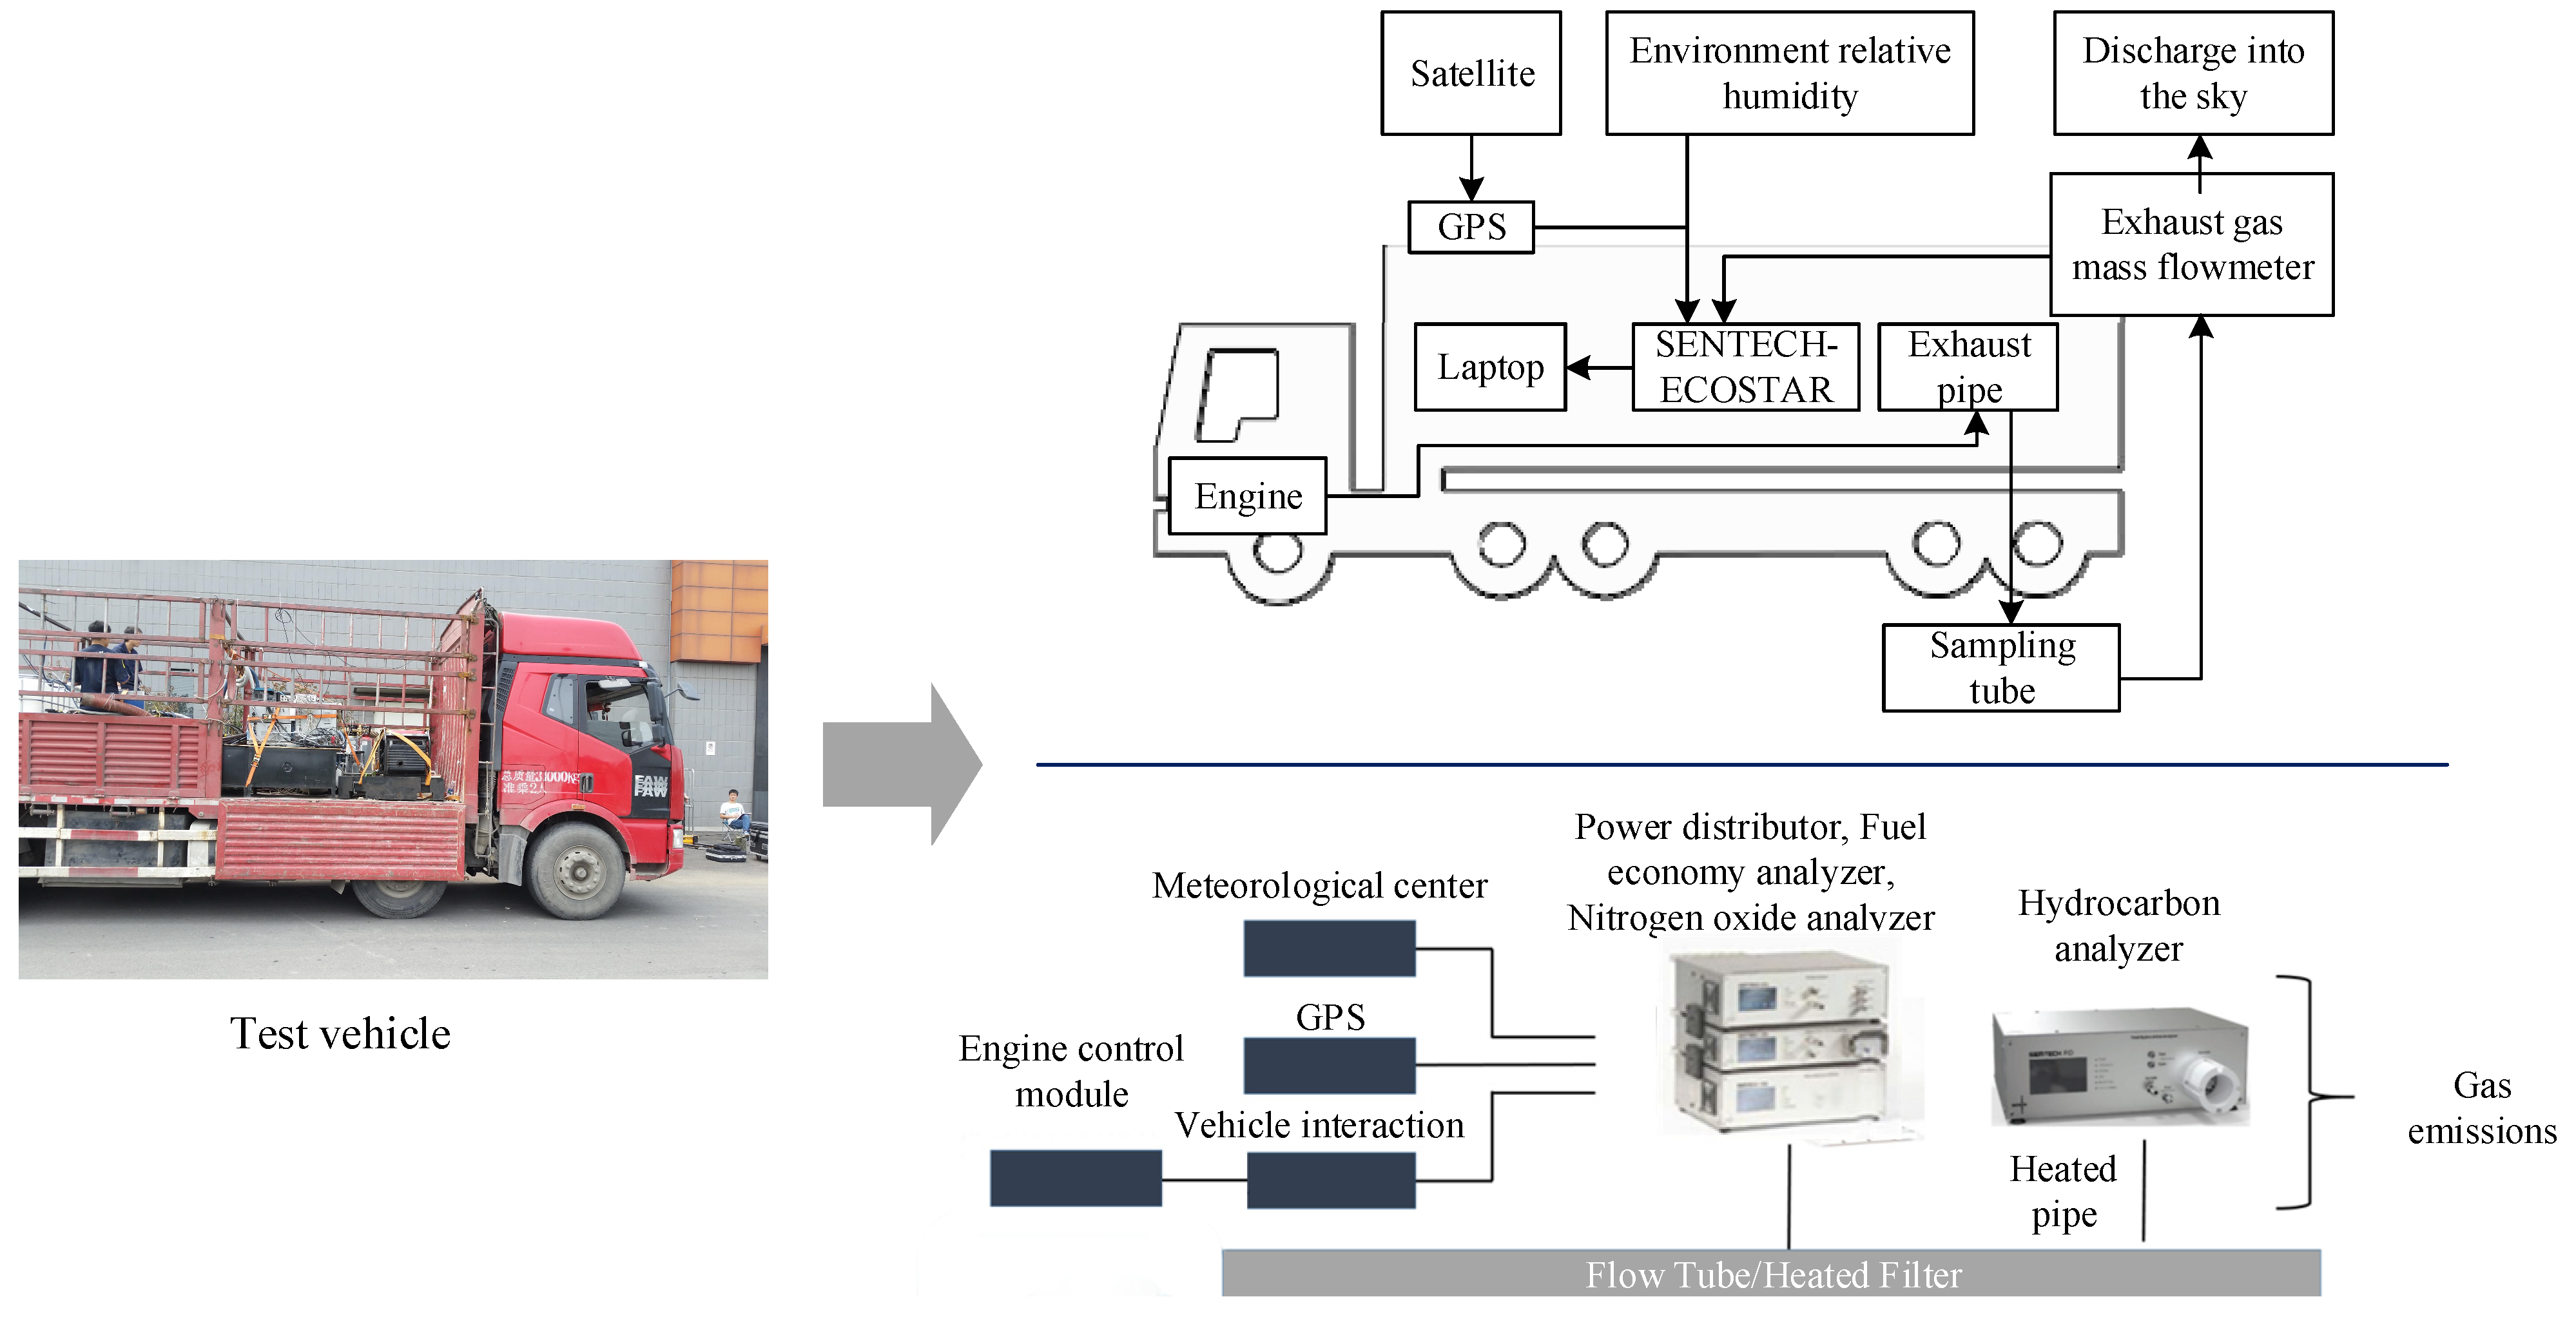
A PEMS of ECOSTAR developed by SENSORS Company was used for the emission test. It meets the measurement requirements of CFR40 part 1065, UE-ECE R49 and EU582/2011. The equipment mainly includes three core components: a flowmeter, a gas analyzer and a particle analyzer. In this study, the flowmeter was assembled with an averaging Pitot tube sensor to monitor the instantaneous exhaust flow rate. Using the gas analyzer, CO2 and CO were measured by non-dispersive infrared (NDIR), NOX was measured using ultraviolet absorption technology, and THC was measured using a heated flame ionization detector. The device is powered by two external high-energy density lithium batteries connected in parallel. PEMS is equipped with a global positioning system (GPS) and a meteorological center to obtain spatial coordinates, road height, vehicle speed and environmental parameters. The GPS receiver was placed on the roof of the vehicle, and the meteorological center was fitted with a rain cover and fixed squarely in the open space. All test results were transmitted to the computer via data lines. The vehicle exhaust gas collection process is shown in Figure 1. To ensure that the test equipment is in normal operating condition, preheat the test equipment for at least 1 h, and use N2 for zero calibration and standard gas for calibration. The sampling frequency of each instrument is 1 Hz. Each test is carried out in accordance with the operation manual for equipment installation and debugging. Ultimately, instantaneous emissions of CO2, CO, NOX, and THC per second can be obtained for the test vehicle. Obtaining data under real driving conditions using PEMS provides an accurate assessment of vehicle emissions.
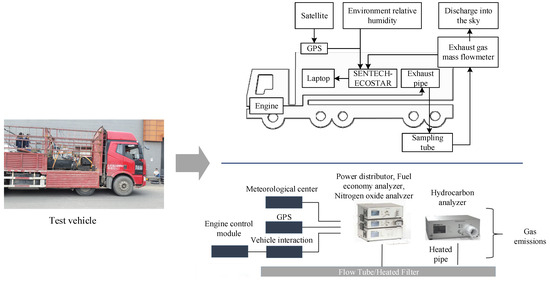
Figure 1.
Vehicle exhaust gas collection process.
2.2. Vehicle Information and Test Route
Since 2014, a two-year road emission test for motor vehicles has been conducted in Beijing and Tianjin, China. A total of 73 representative motor vehicles of different vehicle types were used. The vehicle types include light-duty passenger vehicles, heavy-duty passenger vehicles, light-duty trucks, medium-duty trucks, and heavy-duty trucks of different fuel power. Four emission standards, ranging from China II to China V, were covered. From China II to China V, the emission standards have been gradually improved, the types of pollutants controlled have increased, and the limits have become stricter. A series of investigations on vehicle emissions were carried out from different perspectives. The actual on-road emission tests of heavy-duty vehicles conducted in this study were completed in Tianjin, China. Six heavy-duty trucks with an approved load mass of 18.9 t were obtained from a logistics company. The detailed parameters of the vehicles are listed in Table 1. This test does not involve the cold start stage of the vehicles. The air conditioner was turned off during the test, and the diesel fuel used was obtained from a local gas station. Carry out a condition check before the test to ensure that the vehicle is in proper working order. Before each test, PEMS system status confirmation, sensor inspection, instrument calibration and zero calibration were completed.

Table 1.
Basic information of test vehicles.
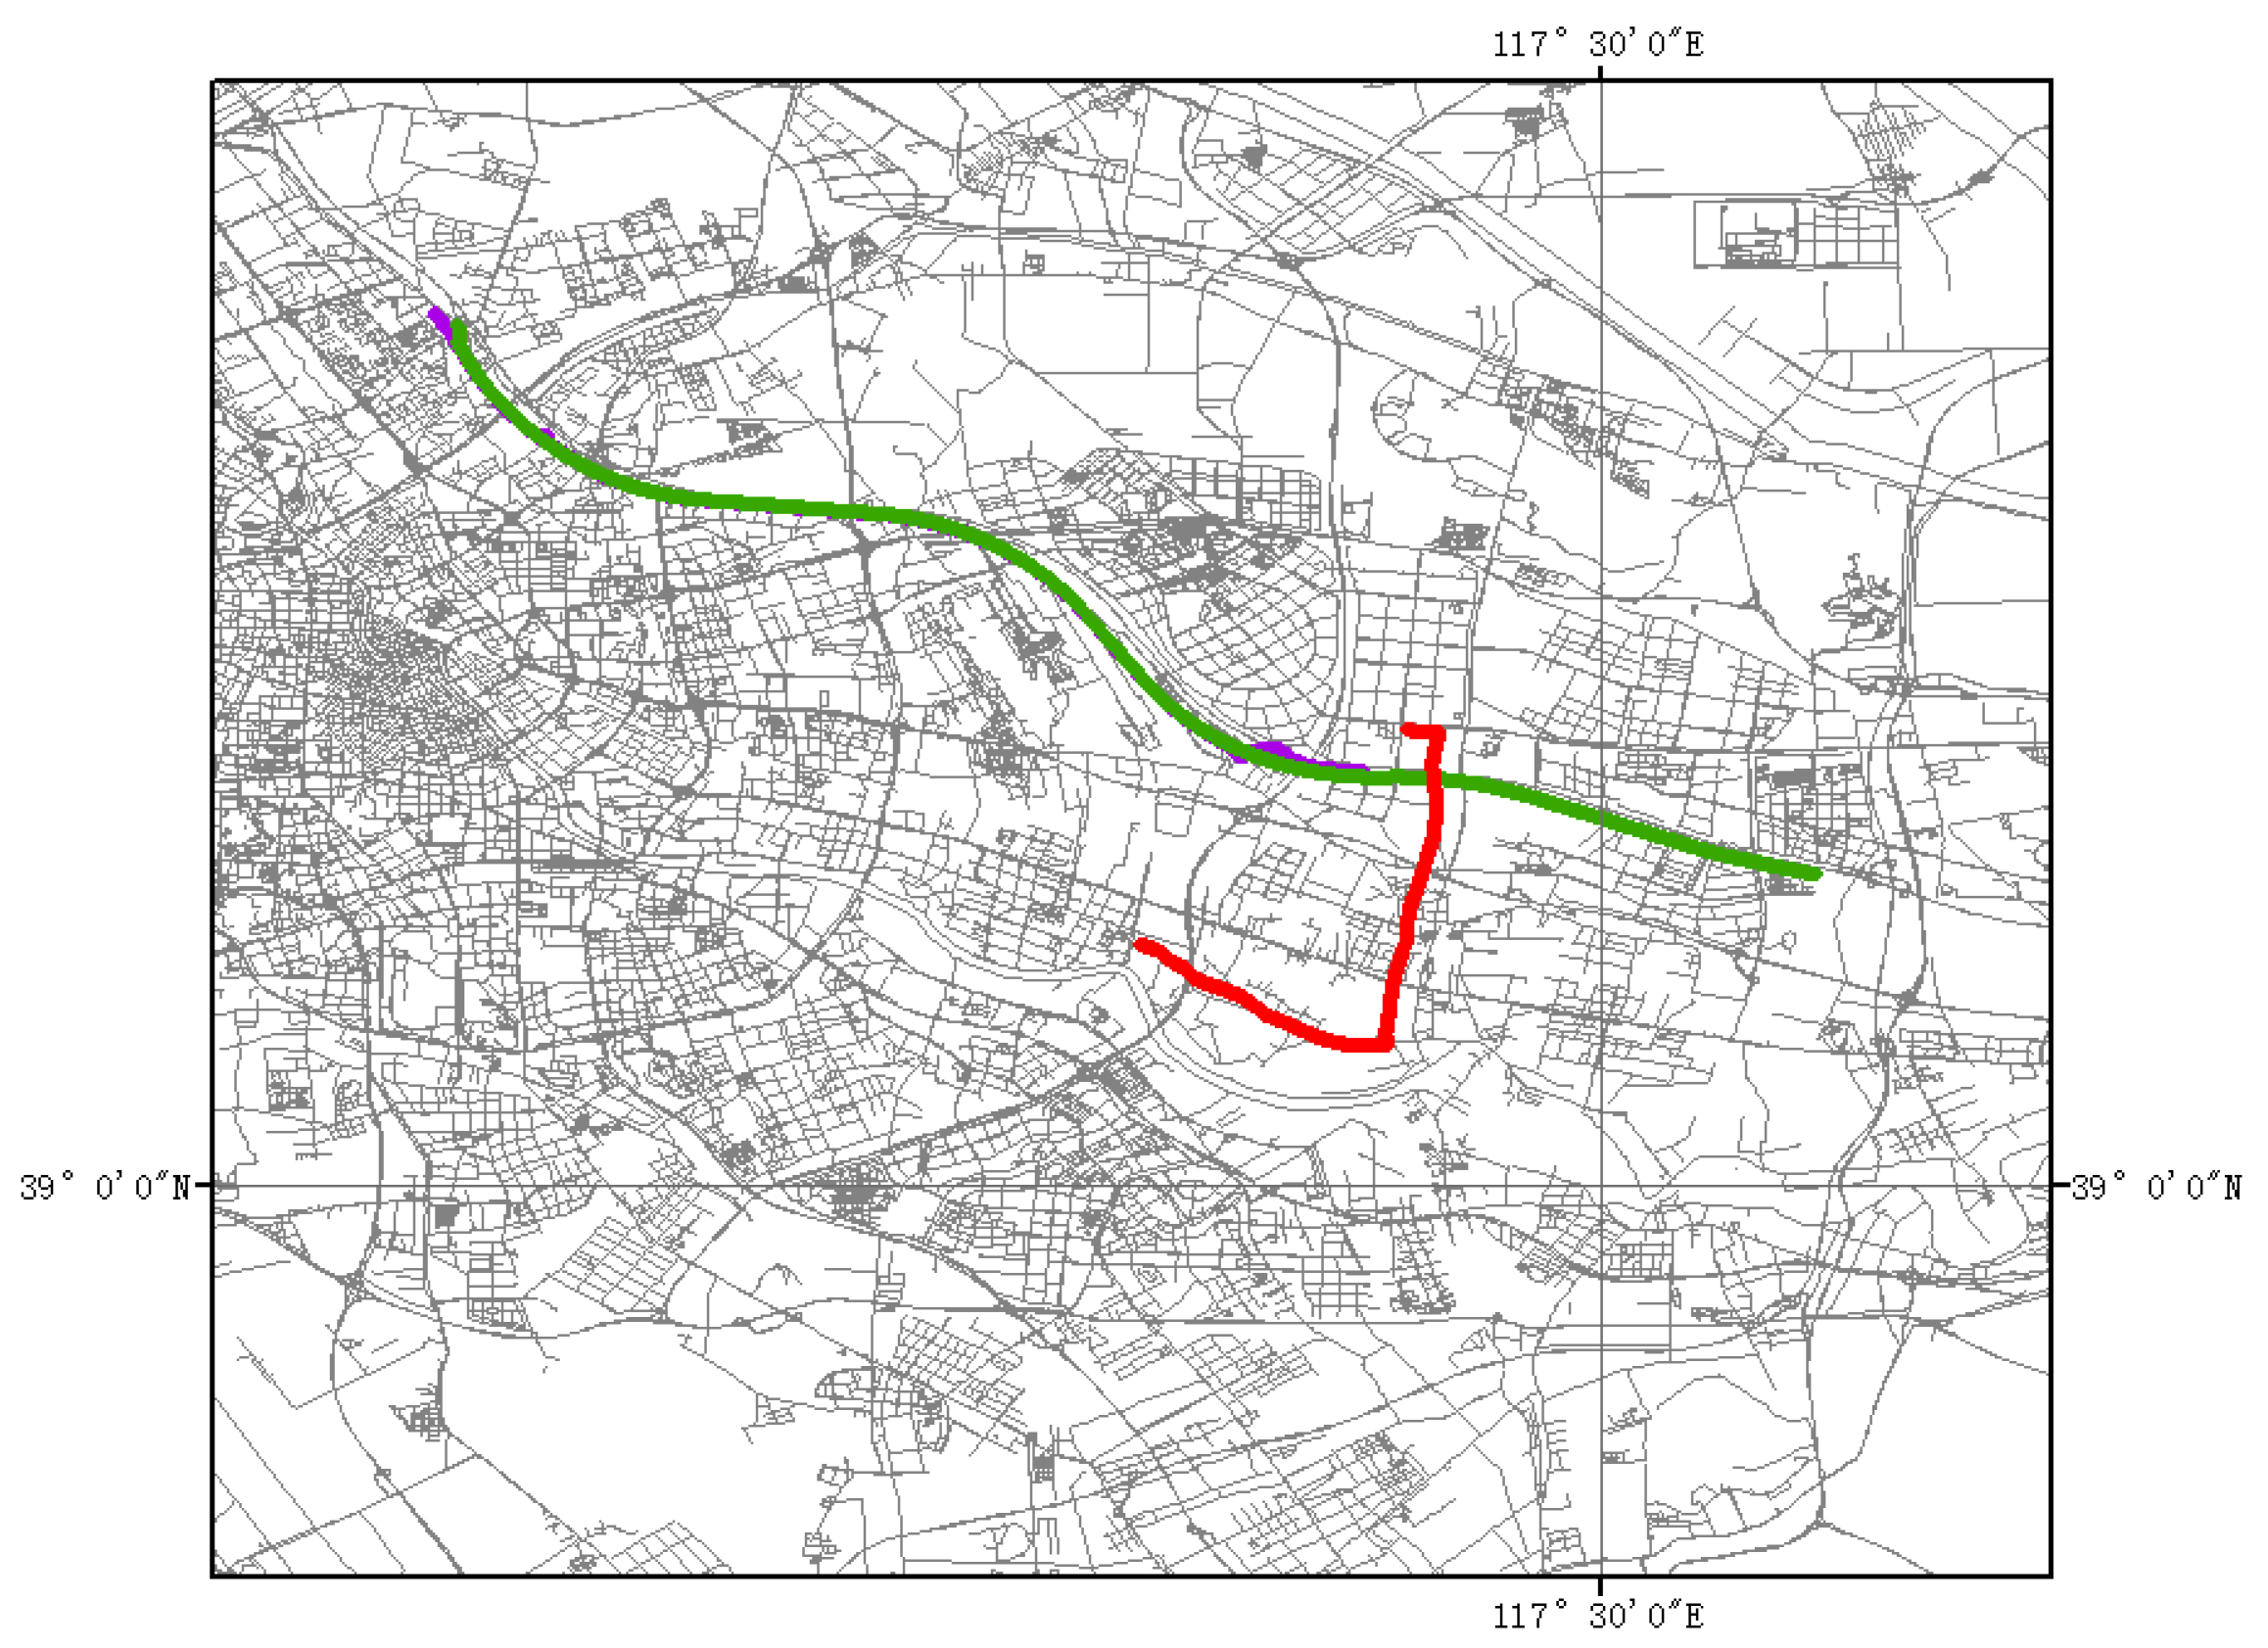
The load states of the test vehicles are set to 0%, 50% and 100% corresponding to the full load. Because the test vehicles have the approved load mass of 18.9 t, it is difficult to reach the full load state under the test conditions. We chose to use lead weights and buckets of water as loads to facilitate loading and control the load. The payload information of the test vehicles is determined by measuring the total weight of the loaded goods before each test. With reference to the regulations on truck traffic restrictions in Tianjin, test plans and back-up plans are formulated to avoid the restricted hours and road sections. When the established routes are too congested or other unforeseen circumstances occur, adjustments are made in accordance with the back-up plan. Choose sunny working days and conduct emission tests under different load states in urban, suburbs and high-speed sections. In order to ensure the analyzability of the impact of vehicle load on emissions, the test routes under the same road operating conditions at different load states were the same. The total test routes are shown in Figure 2. The testing duration for each road type was about 30 min, and the length of the test route varies from 12 km to 35 km. In order to minimize the impact of the driver’s personal driving behavior on emissions, experienced truck drivers were recruited to drive the test vehicle.
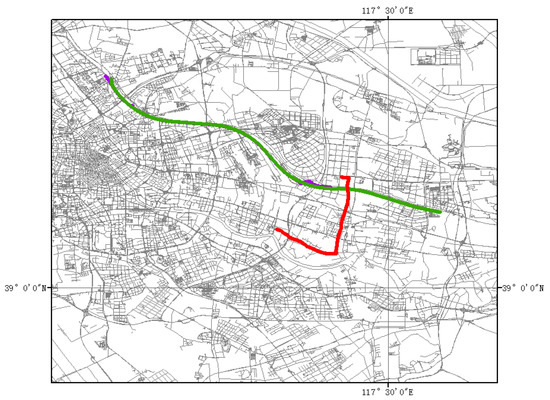
Figure 2.
Total test route for urban, suburban, and high-speed sections. Red represents the urban route; purple represents the suburban route; green represents the high-speed route. The high-speed and suburban routes have some overlapping lines.
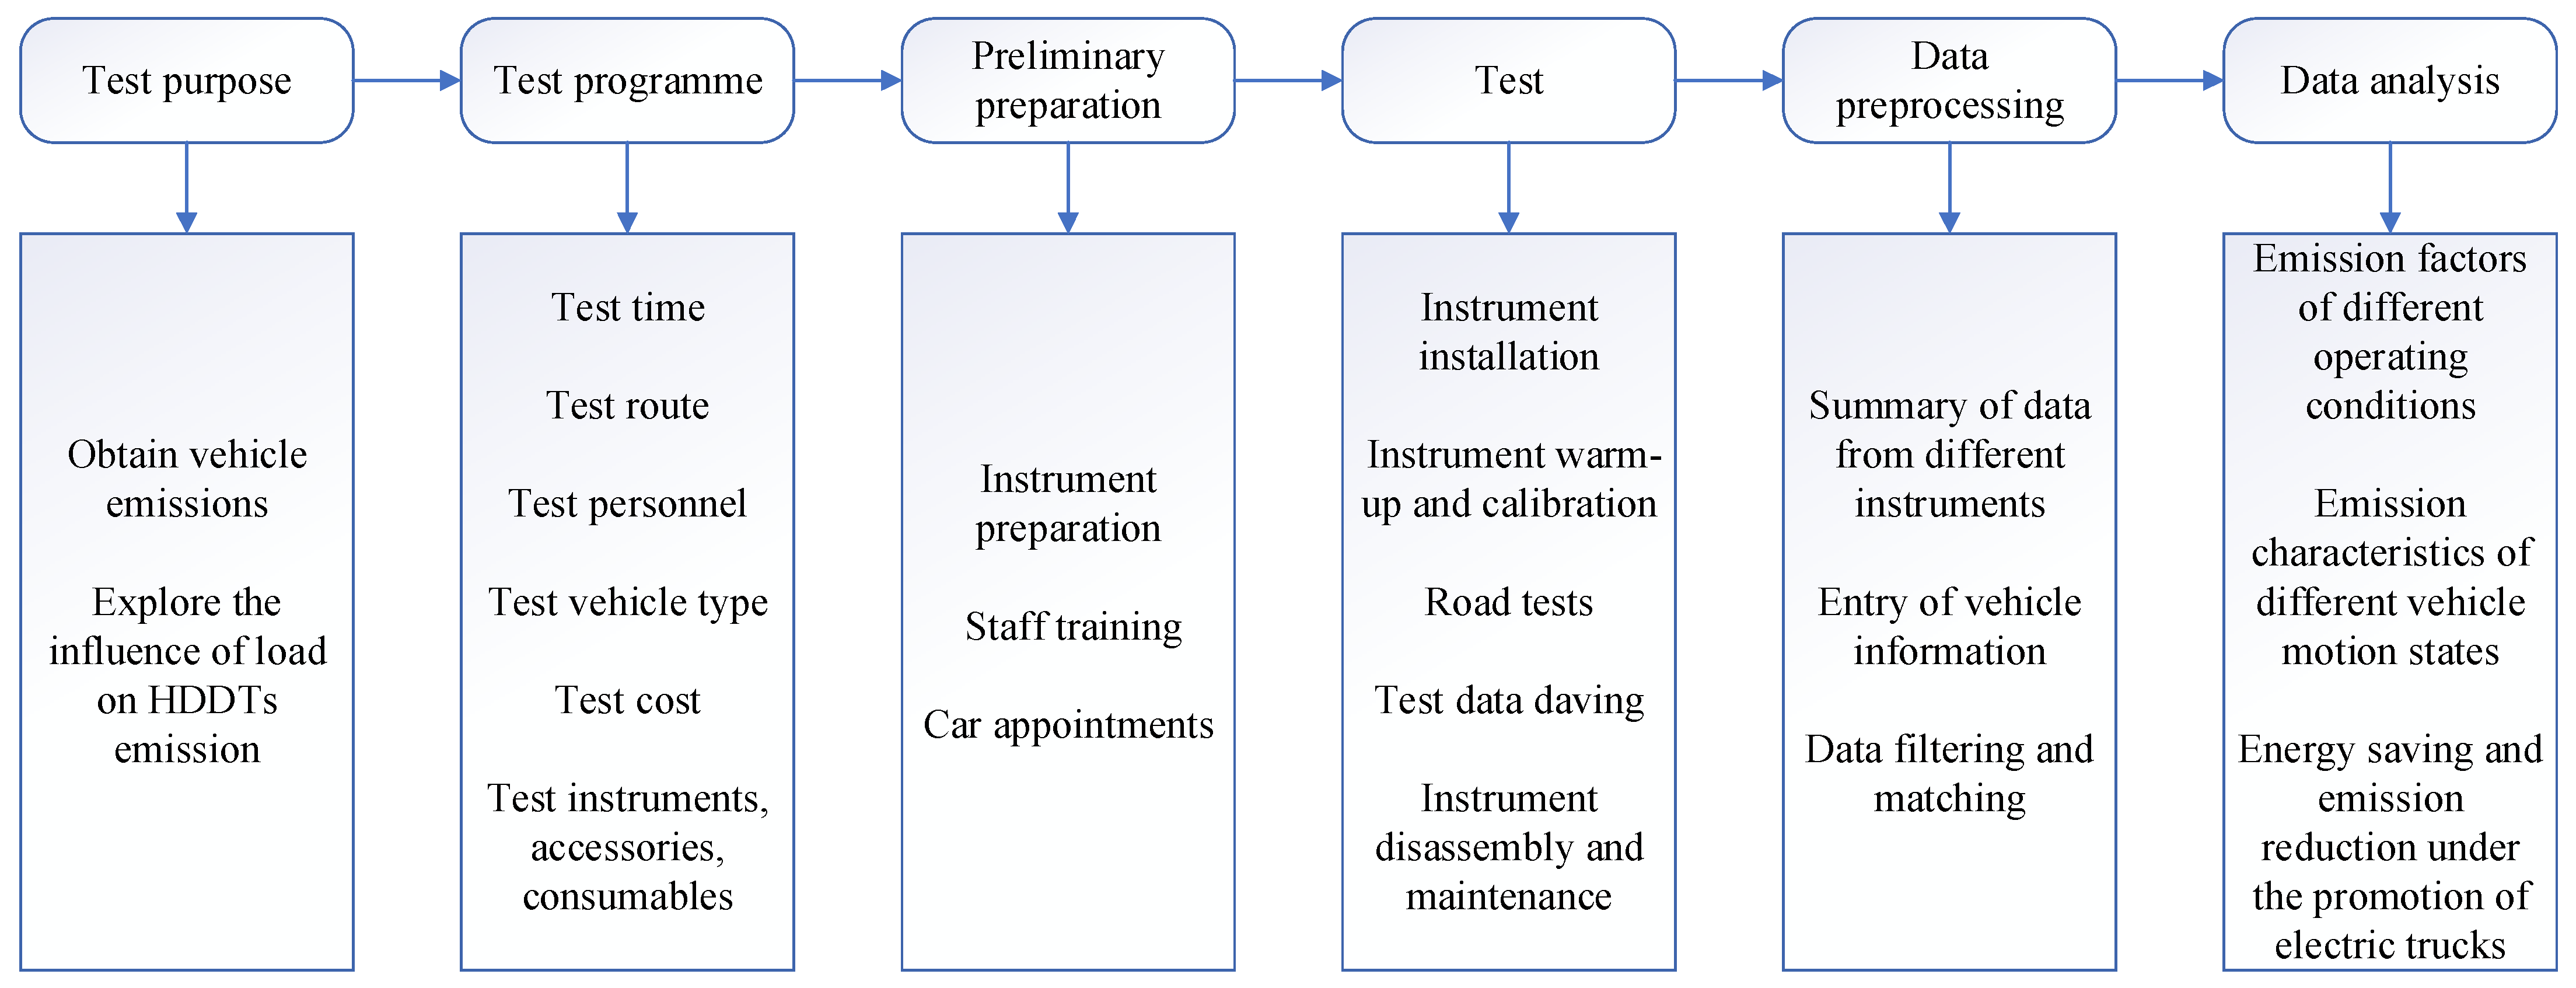
This study lasted for two months and the emission test was completed in six vehicles. Each test used a fixed vehicle load, while driving in urban, suburbs and high-speed sections. The testing day includes working days and weekends, involving various road conditions. The duration of each test ranges from 90 min to 120 min. Each truck has 72,000 pieces of data to ensure the authenticity and reliability of the collected data. Figure 3 shows a simplified test flow.
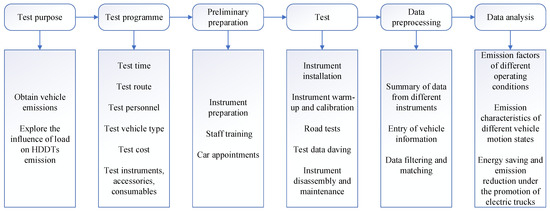
Figure 3.
Test flow.
2.3. Data Processing
Table 2 lists the parameters used in this study.
Table 2.
Summary of research parameters.
The formula for calculating the emission factor of HDDPTs is as follows:
VSP can represent the driving conditions in an integrated manner and correlates better with pollutant emission rates than other operating parameters [30]. In this study, the equations in the MOVES model were used to calculate VSP as shown in the following equation:
According to the test vehicle type, A/m, B/m, and C/m are 0.0875, 0, and 0.000331, respectively [31,32]. θ is taken as 0 in this study due to the flat terrain in the area where the test route is located.
The operating mode binning method was used to cluster the VSP data. Based on domestic and international research on the classification of operating modes, and considering that the speed of the test vehicles in this study does not exceed 80 km/h, 18 bins were established, including one brake bin, one idle bin and 16 normal acceleration or uniform speed bins, as shown in Table 3.
Table 3.
Classification of operating mode bin.
Based on the above operating mode binning, the average pollutant emission rate for different operating mode bins is shown in Equation (3):
3. Results and Discussion
3.1. Emission Factors of Different Operating Conditions
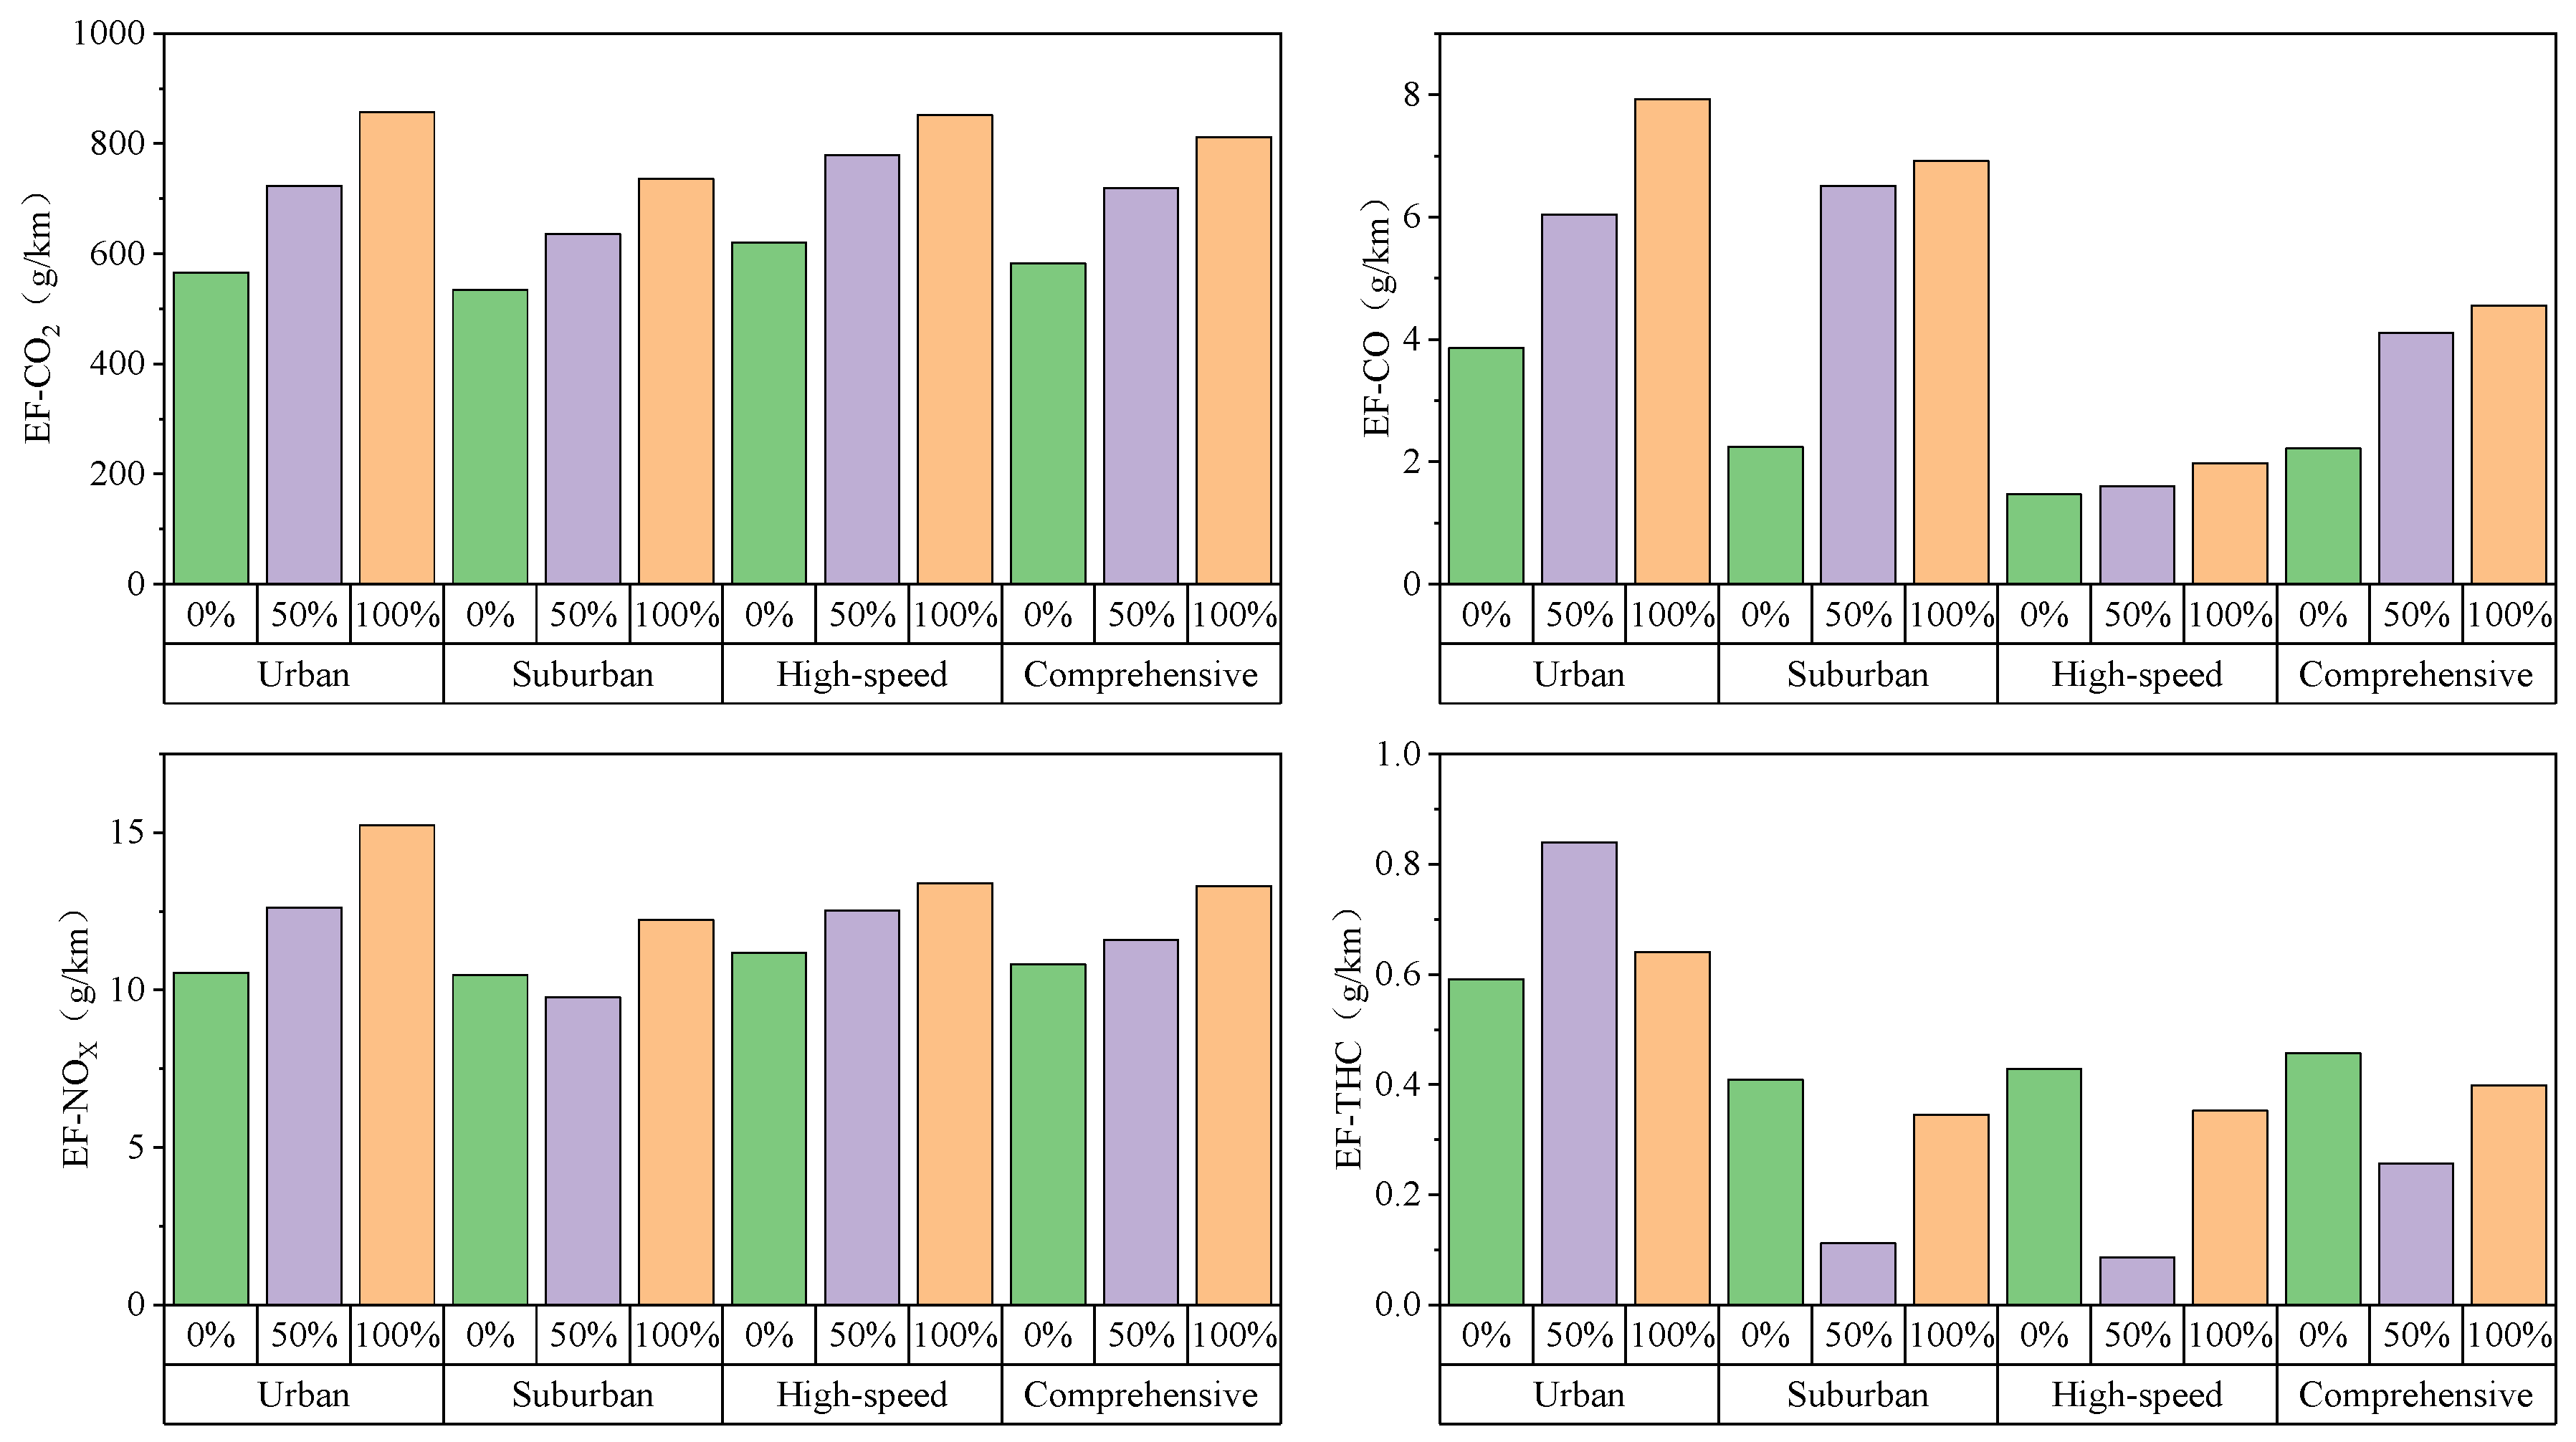
Studying the emissions under different loads and driving conditions can help to formulate strategies to optimize vehicle loads and routes. The emission factors of CO2, CO, NOX and THC under different road operating conditions and load states are shown in Figure 4, and the detailed values are shown in Table 4. The emission data of comprehensive operating conditions are obtained by collecting test data of urban, suburban and high-speed conditions. It can be clearly seen that the emission factors of CO2 and NOX change slightly under different operating conditions. The standard deviation of CO2 emission factor is 35.9, 59.2 and 55.8, and the standard deviation of NOX is 0.3, 1.3 and 1.2 for the corresponding unloaded, half-loaded, and fully loaded conditions. The emission factors of CO and THC vary greatly under three road operating conditions. Among them, the emission factor of CO in high-speed operating condition is obviously lower than that in urban and suburban areas. This may be due to the fact that in the urban and suburban sections, vehicles are affected by traffic lights, other vehicles, pedestrians, etc., and the road conditions are complex, resulting in unstable engine operation, which further leads to incomplete combustion of fuel, generating a large amount of CO; in the high-speed sections, the traffic conditions are better and fuel is fully burned, which reduces CO emissions [33].
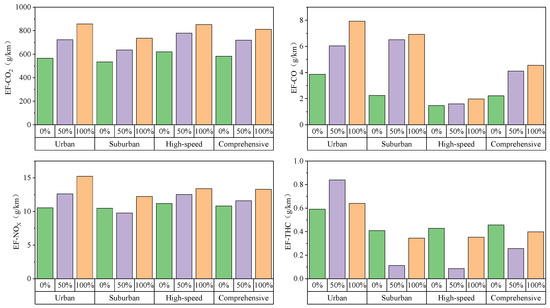
Figure 4.
Emission factors of CO2, CO, NOX and THC.
Table 4.
Emission factors of CO2, CO, NOX and THC under urban, suburban, high-speed and comprehensive operating conditions.
Except for THC, the emission factors of the other three gases showed an overall trend of increasing with the increase in load. The growth trend is different under different road operating conditions. According to the comprehensive operating conditions, CO2, CO and NOX increased by 39.5%, 105.4% and 22.7%, respectively. The growth rates of CO2 and CO are 23.7% and 85.0% when the vehicle load increases from unloaded to half loaded, which is greater than the growth rates of 12.7% and 11.0% when the vehicle load increases from half loaded to fully loaded. On the contrary, the growth rate of NOX emission factor is 7.1% and 14.6%, respectively. It can be seen that when the vehicle load exceeds half, the increase in CO2 and CO emissions slows down, and the growth of NOX emissions accelerates.
3.2. Emission Characteristics of Different Vehicle Motion States
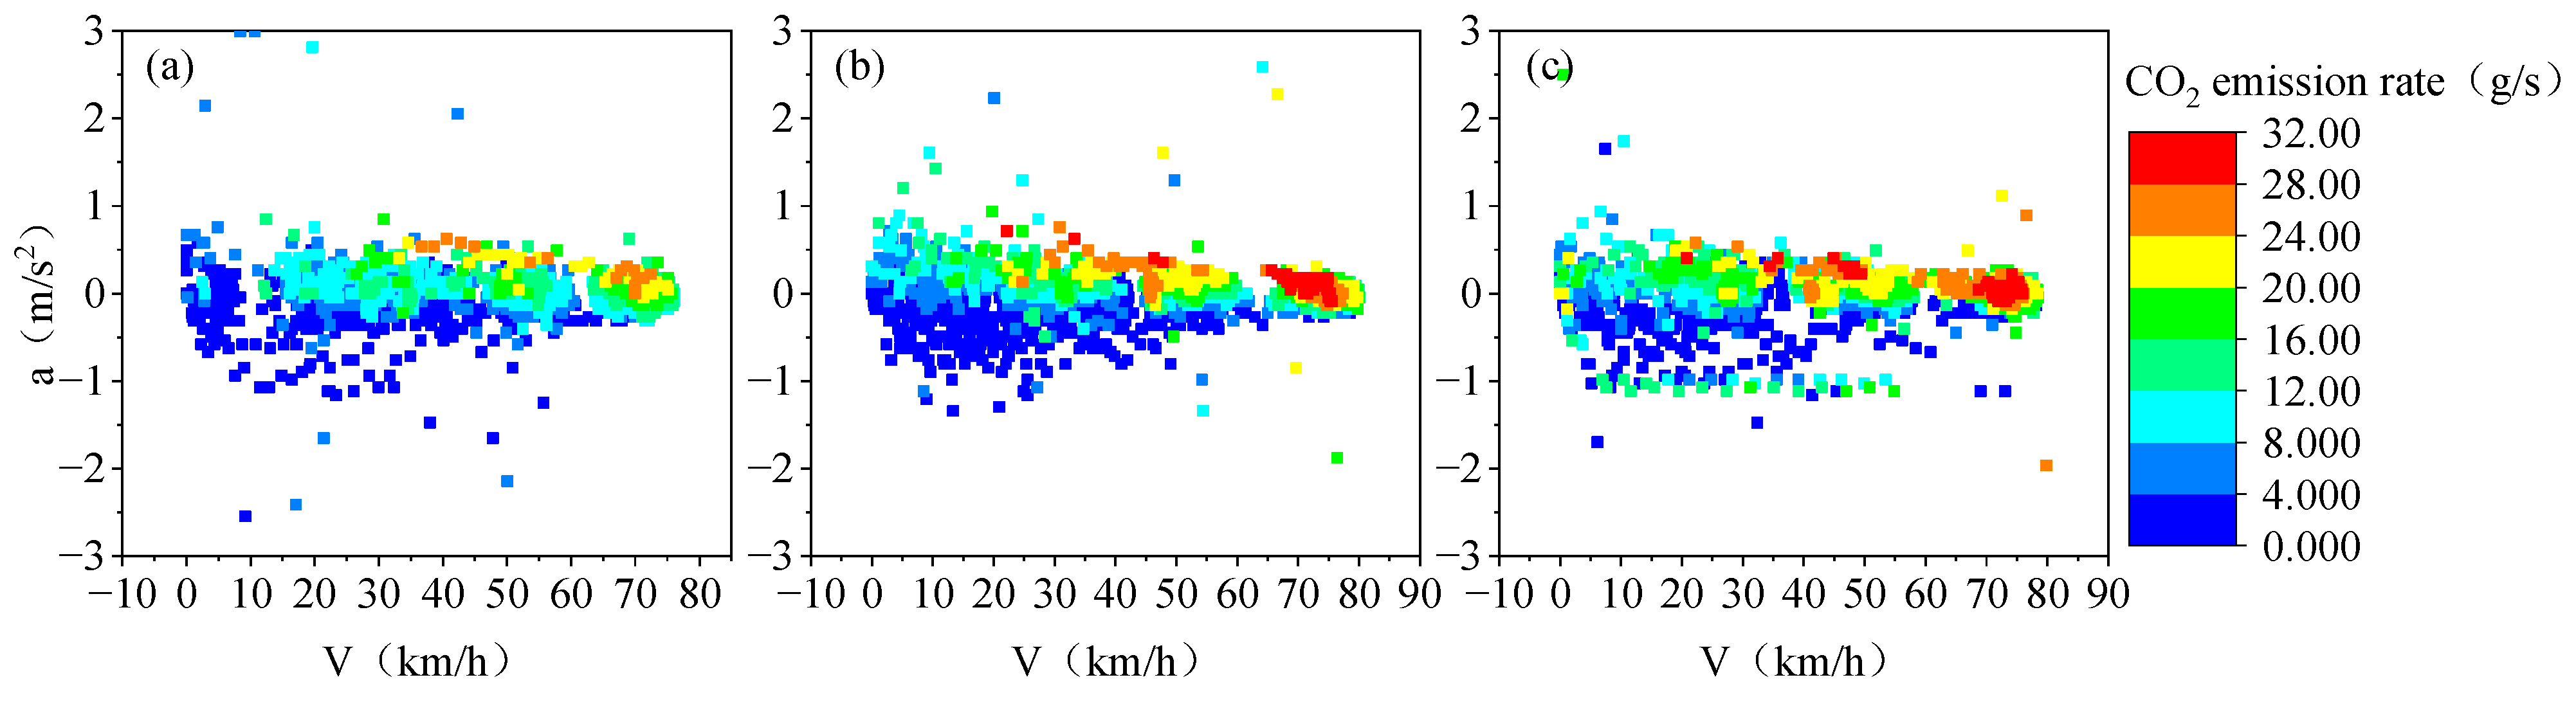
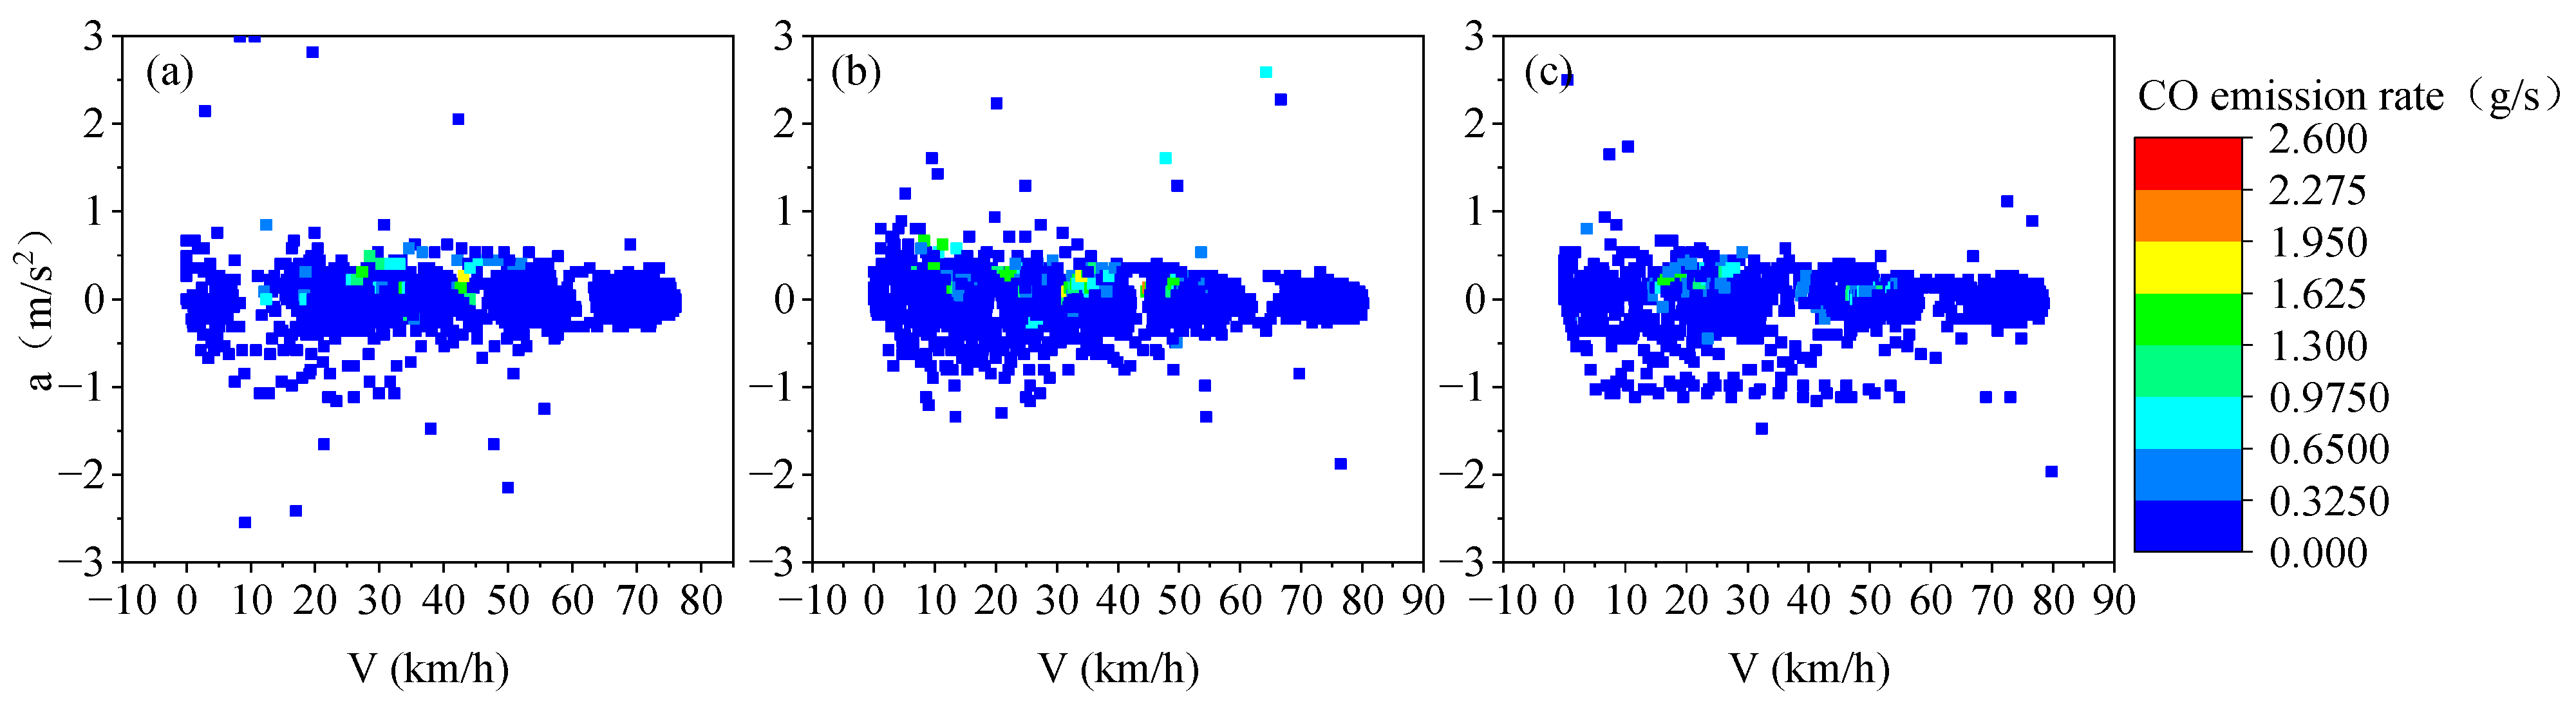
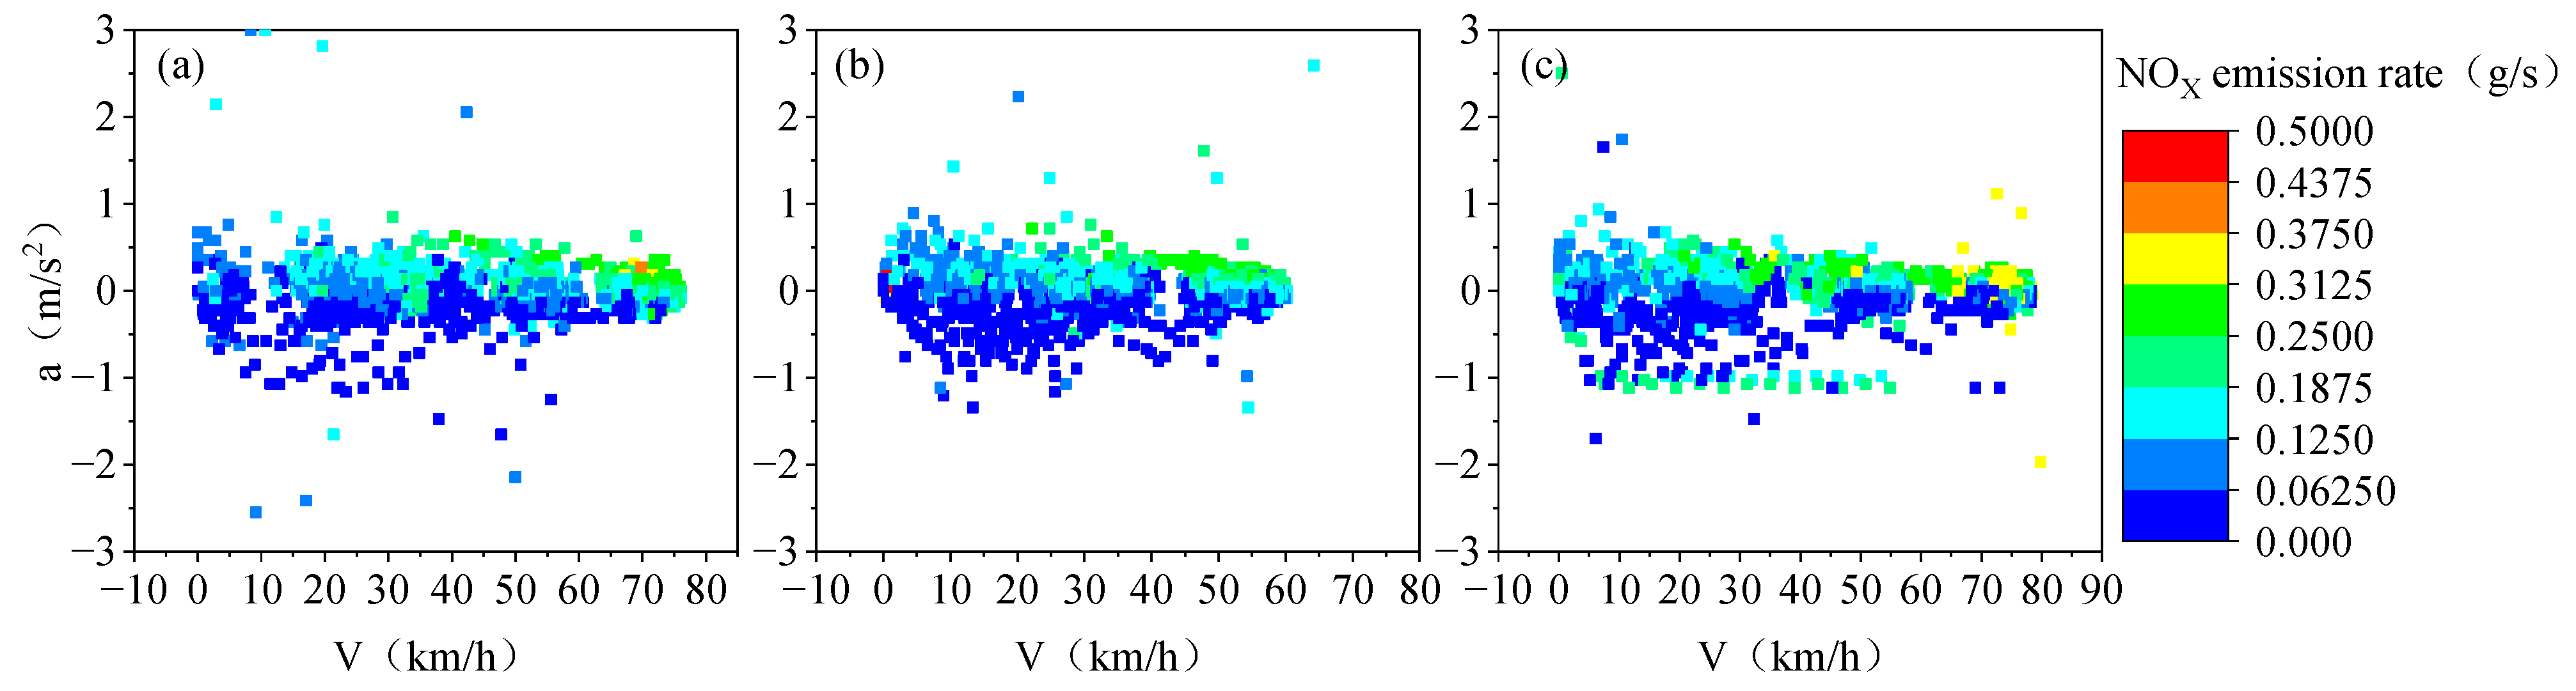
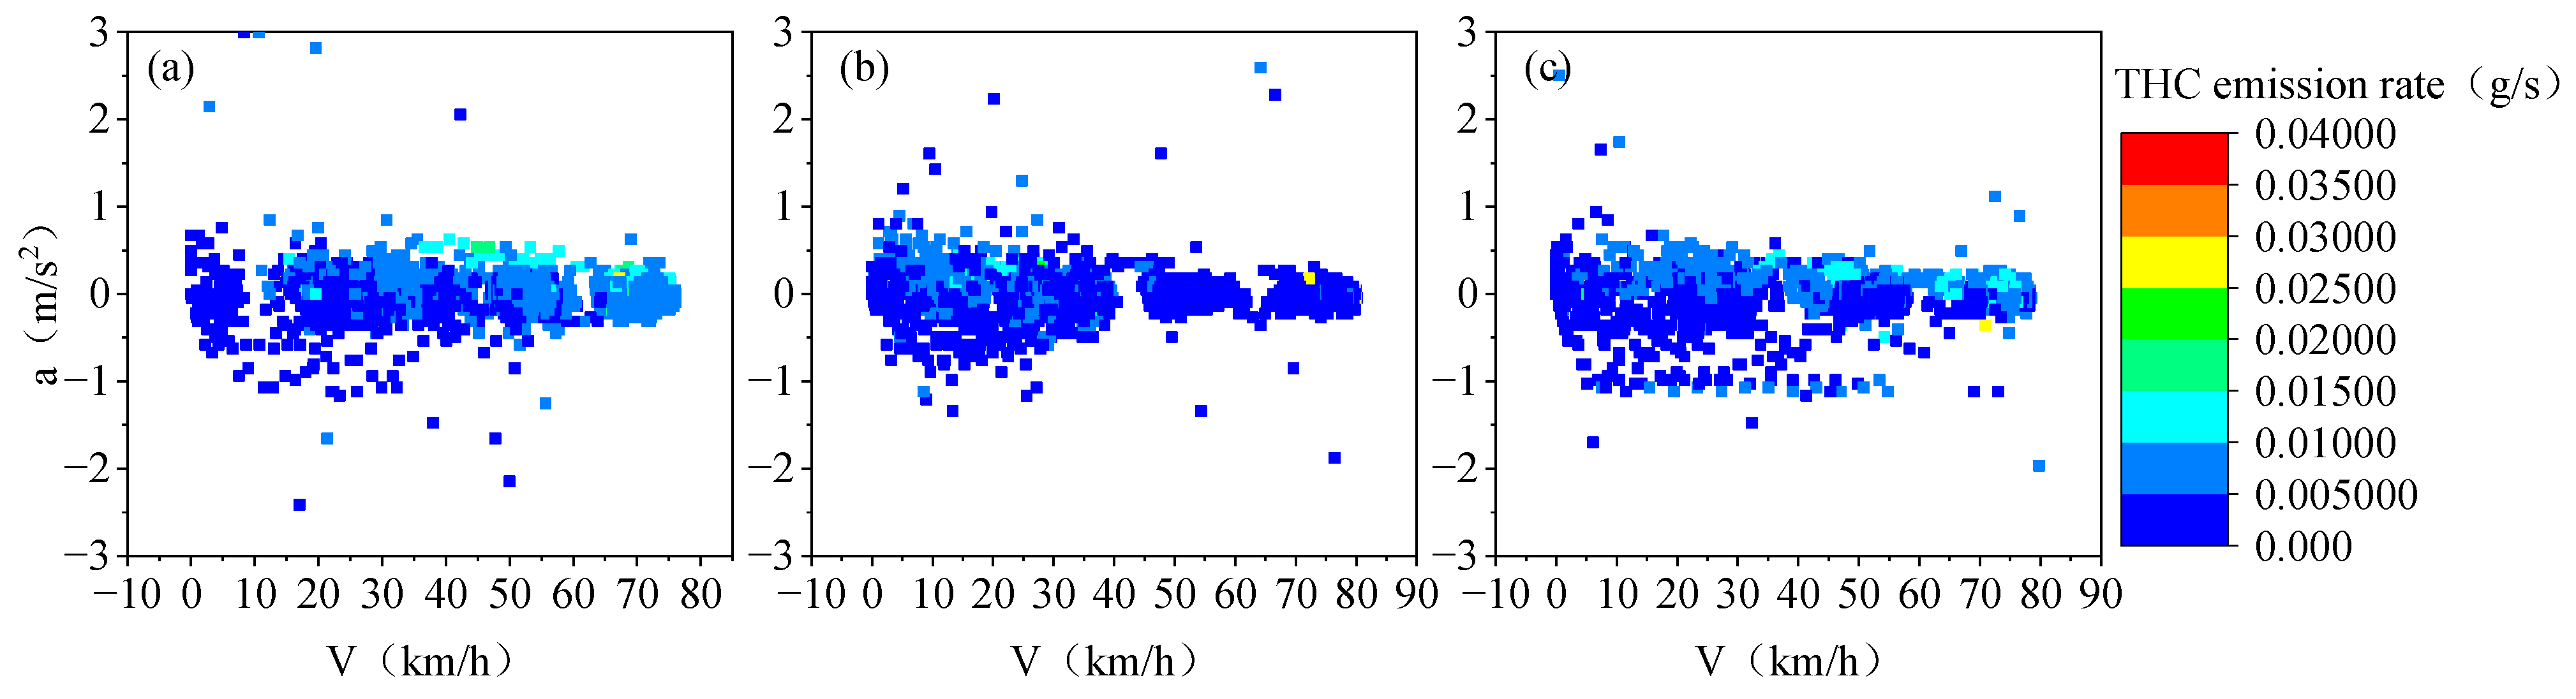
Emissions are closely related to speed and acceleration [34]. Figure 5, Figure 6, Figure 7 and Figure 8 bring together the test data of three operating conditions to analyze the emission characteristics under different loads. The speed and acceleration are used to reflect the traveling state of the vehicle per second during the test, and the instantaneous emission rate at that state. Since 99% of the test data have an acceleration between −3 m/s2 and 3 m/s2, only the data in this interval are analyzed. It can be seen from Figure 5, Figure 6, Figure 7 and Figure 8 that the emission rate of the test vehicles is mainly concentrated in the acceleration range of −1 m/s2 to 1 m/s2. The emission rates of CO2, CO, NOX and THC mainly vary from 0–32 g/s, 0–2.6 g/s, 0–0.5 g/s and 0–0.04 g/s. The high emissions of the four emission gases are mainly distributed in the middle-high speed (30 km/h–80 km/h) stage with an acceleration greater than zero, while the emission rates of the four emission gases are lower when the acceleration is less than zero. Among them, the emission rates of CO and THC are relatively concentrated, and the proportion of higher emission is very small. On the contrary, the emission rates of CO2 and NOX are dispersed, and the high emission accounts for a certain proportion. Therefore, consciously reducing the frequency of sudden acceleration during driving is beneficial for reducing diesel vehicle exhaust emissions [35].
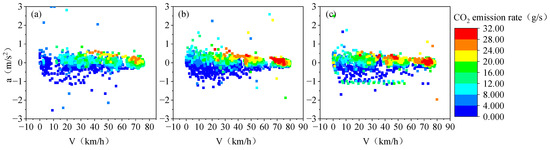
Figure 5.
Emission rate distribution of CO2 based on speed and acceleration. (a) Emission rate distribution at unloaded state; (b) emission rate distribution at half-loaded state; (c) emission rate distribution at fully loaded state.

Figure 6.
Emission rate distribution of CO based on speed and acceleration. (a) Emission rate distribution at unloaded state; (b) emission rate distribution at half-loaded state; (c) emission rate distribution at fully loaded state.
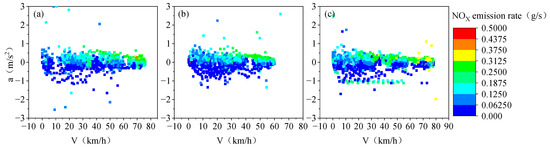
Figure 7.
Emission rate distribution of NOX based on speed and acceleration. (a) Emission rate distribution at unloaded state; (b) emission rate distribution at half-loaded state; (c) emission rate distribution at fully loaded state.
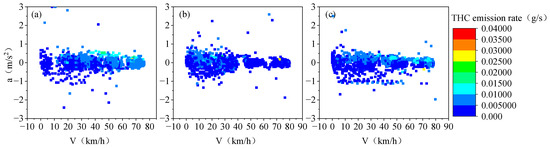
Figure 8.
Emission rate distribution of THC based on speed and acceleration. (a) Emission rate distribution at unloaded state; (b) emission rate distribution at half-loaded state; (c) emission rate distribution at fully loaded state.
With the increase in vehicle load, the proportion of high emission rates of CO2, CO and NOX gradually increases. Taking CO2 as an example, the percentage of transients with emission rate greater than 24 g/s is 0.3% at unloaded, 2.4% at half-loaded and 4.5% at fully loaded states. The influence of vehicle load increase on THC emission is not obvious. In the full-load test, there are a series of instantaneous states with an acceleration of about −1 m/s2, and compared with CO and THC, CO2 and NOX, emissions are higher in this transient state. The reason may be that in this state the engine fuel supply is reduced, and the air–fuel ratio is increased, resulting in higher CO2 emissions, while the temperature of the combustion chamber remains high, which is conducive to the generation of NOX [36].
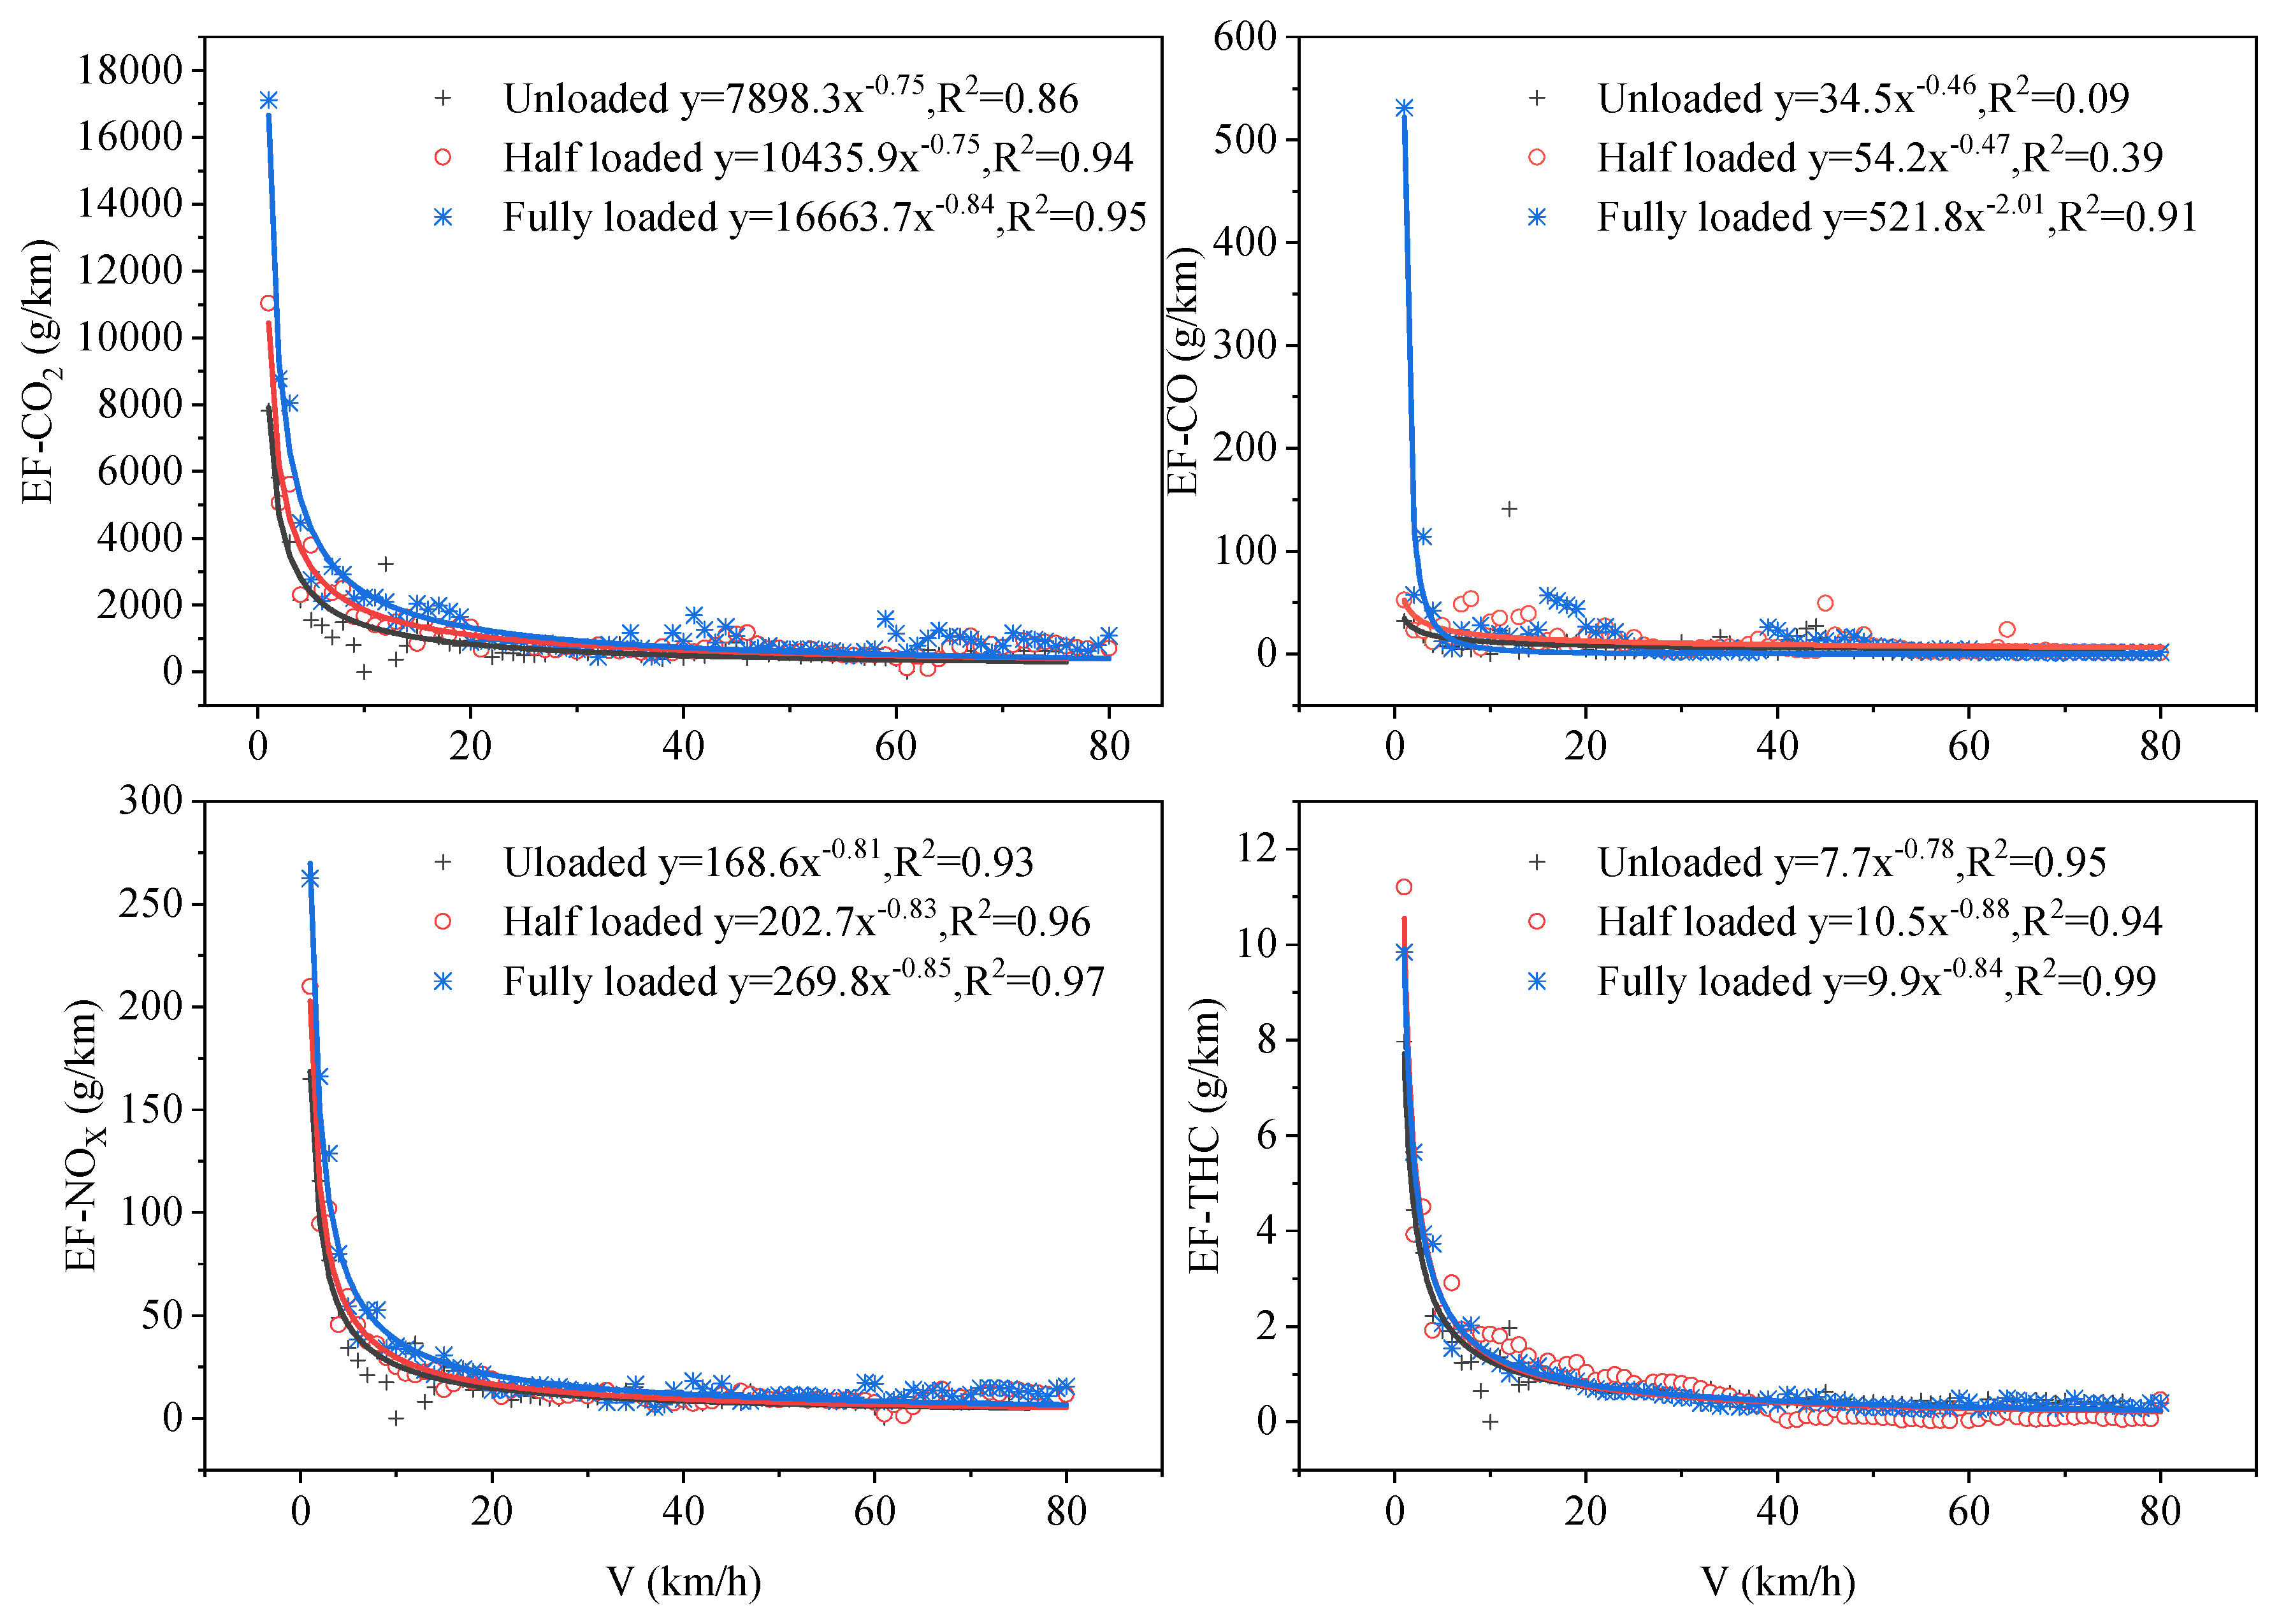
The vehicle speed is rounded to obtain the emission factor at each integer speed. Figure 9 shows the scatter plot of emission factors corresponding to each integer speed under different vehicle loads and shows the regression analysis to explore the rule of vehicle emission factors under continuous speed. The research on the correlation between continuous speed and emission factors was carried out under comprehensive operating conditions. As shown in the figure, the emission factors of all gases under three load states decreased with the increase in speed. Specifically, the emission factors of CO2, CO, NOX, and THC increased significantly when the speed was lower than 10 km/h, and the maximum emission factors reached 14.2, 41.4, 13.3, and 13.4 times of the average values. The results are similar to Liu et al.’s study on the characteristics of pollutant emission factors at the equivalent interval speed [37]. However, in the interval where the speed changes significantly, the emission factor under fully load state is generally higher than that under other loads. With the increase in driving speed, the emission factors under the three load states are gradually close, and the influence of vehicle load on emission is weakened. Therefore, avoiding low-speed driving (v ≤ 20 km/h) can effectively reduce the emissions of CO2, CO, NOX and THC [38].
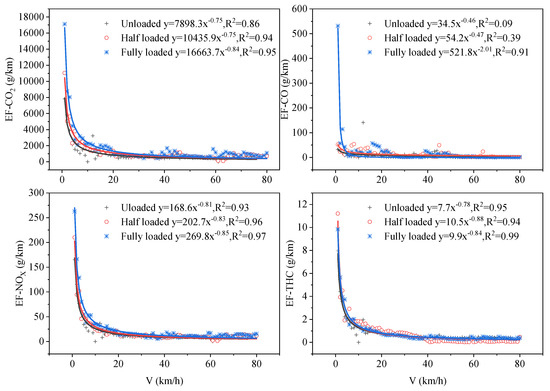
Figure 9.
Correlation between speed and emission factors of CO2, CO, NOX and THC.
The emission factors of CO2, NOX and THC have a strong correlation with the continuous integer speed, while the correlation of CO is weak. All four emission gases can be fitted by exponential function, and the formula and R2 are listed in Figure 9. Among them, the R2 of CO2, NOX and THC under three load states are all above 0.85, while the R2 of CO fluctuates greatly under different loads. When the vehicle is unloaded, the fit of CO is only 0.09, while when the vehicle is fully loaded, the fit reaches 0.91. The fitting curve is a representation of the relationship between speed and emission factors. When R2 is high, the fitting curve can achieve the prediction of the emission factors at any speed for the same type of HDDTs.
3.3. Characteristics of VSP for Different Vehicle Loads
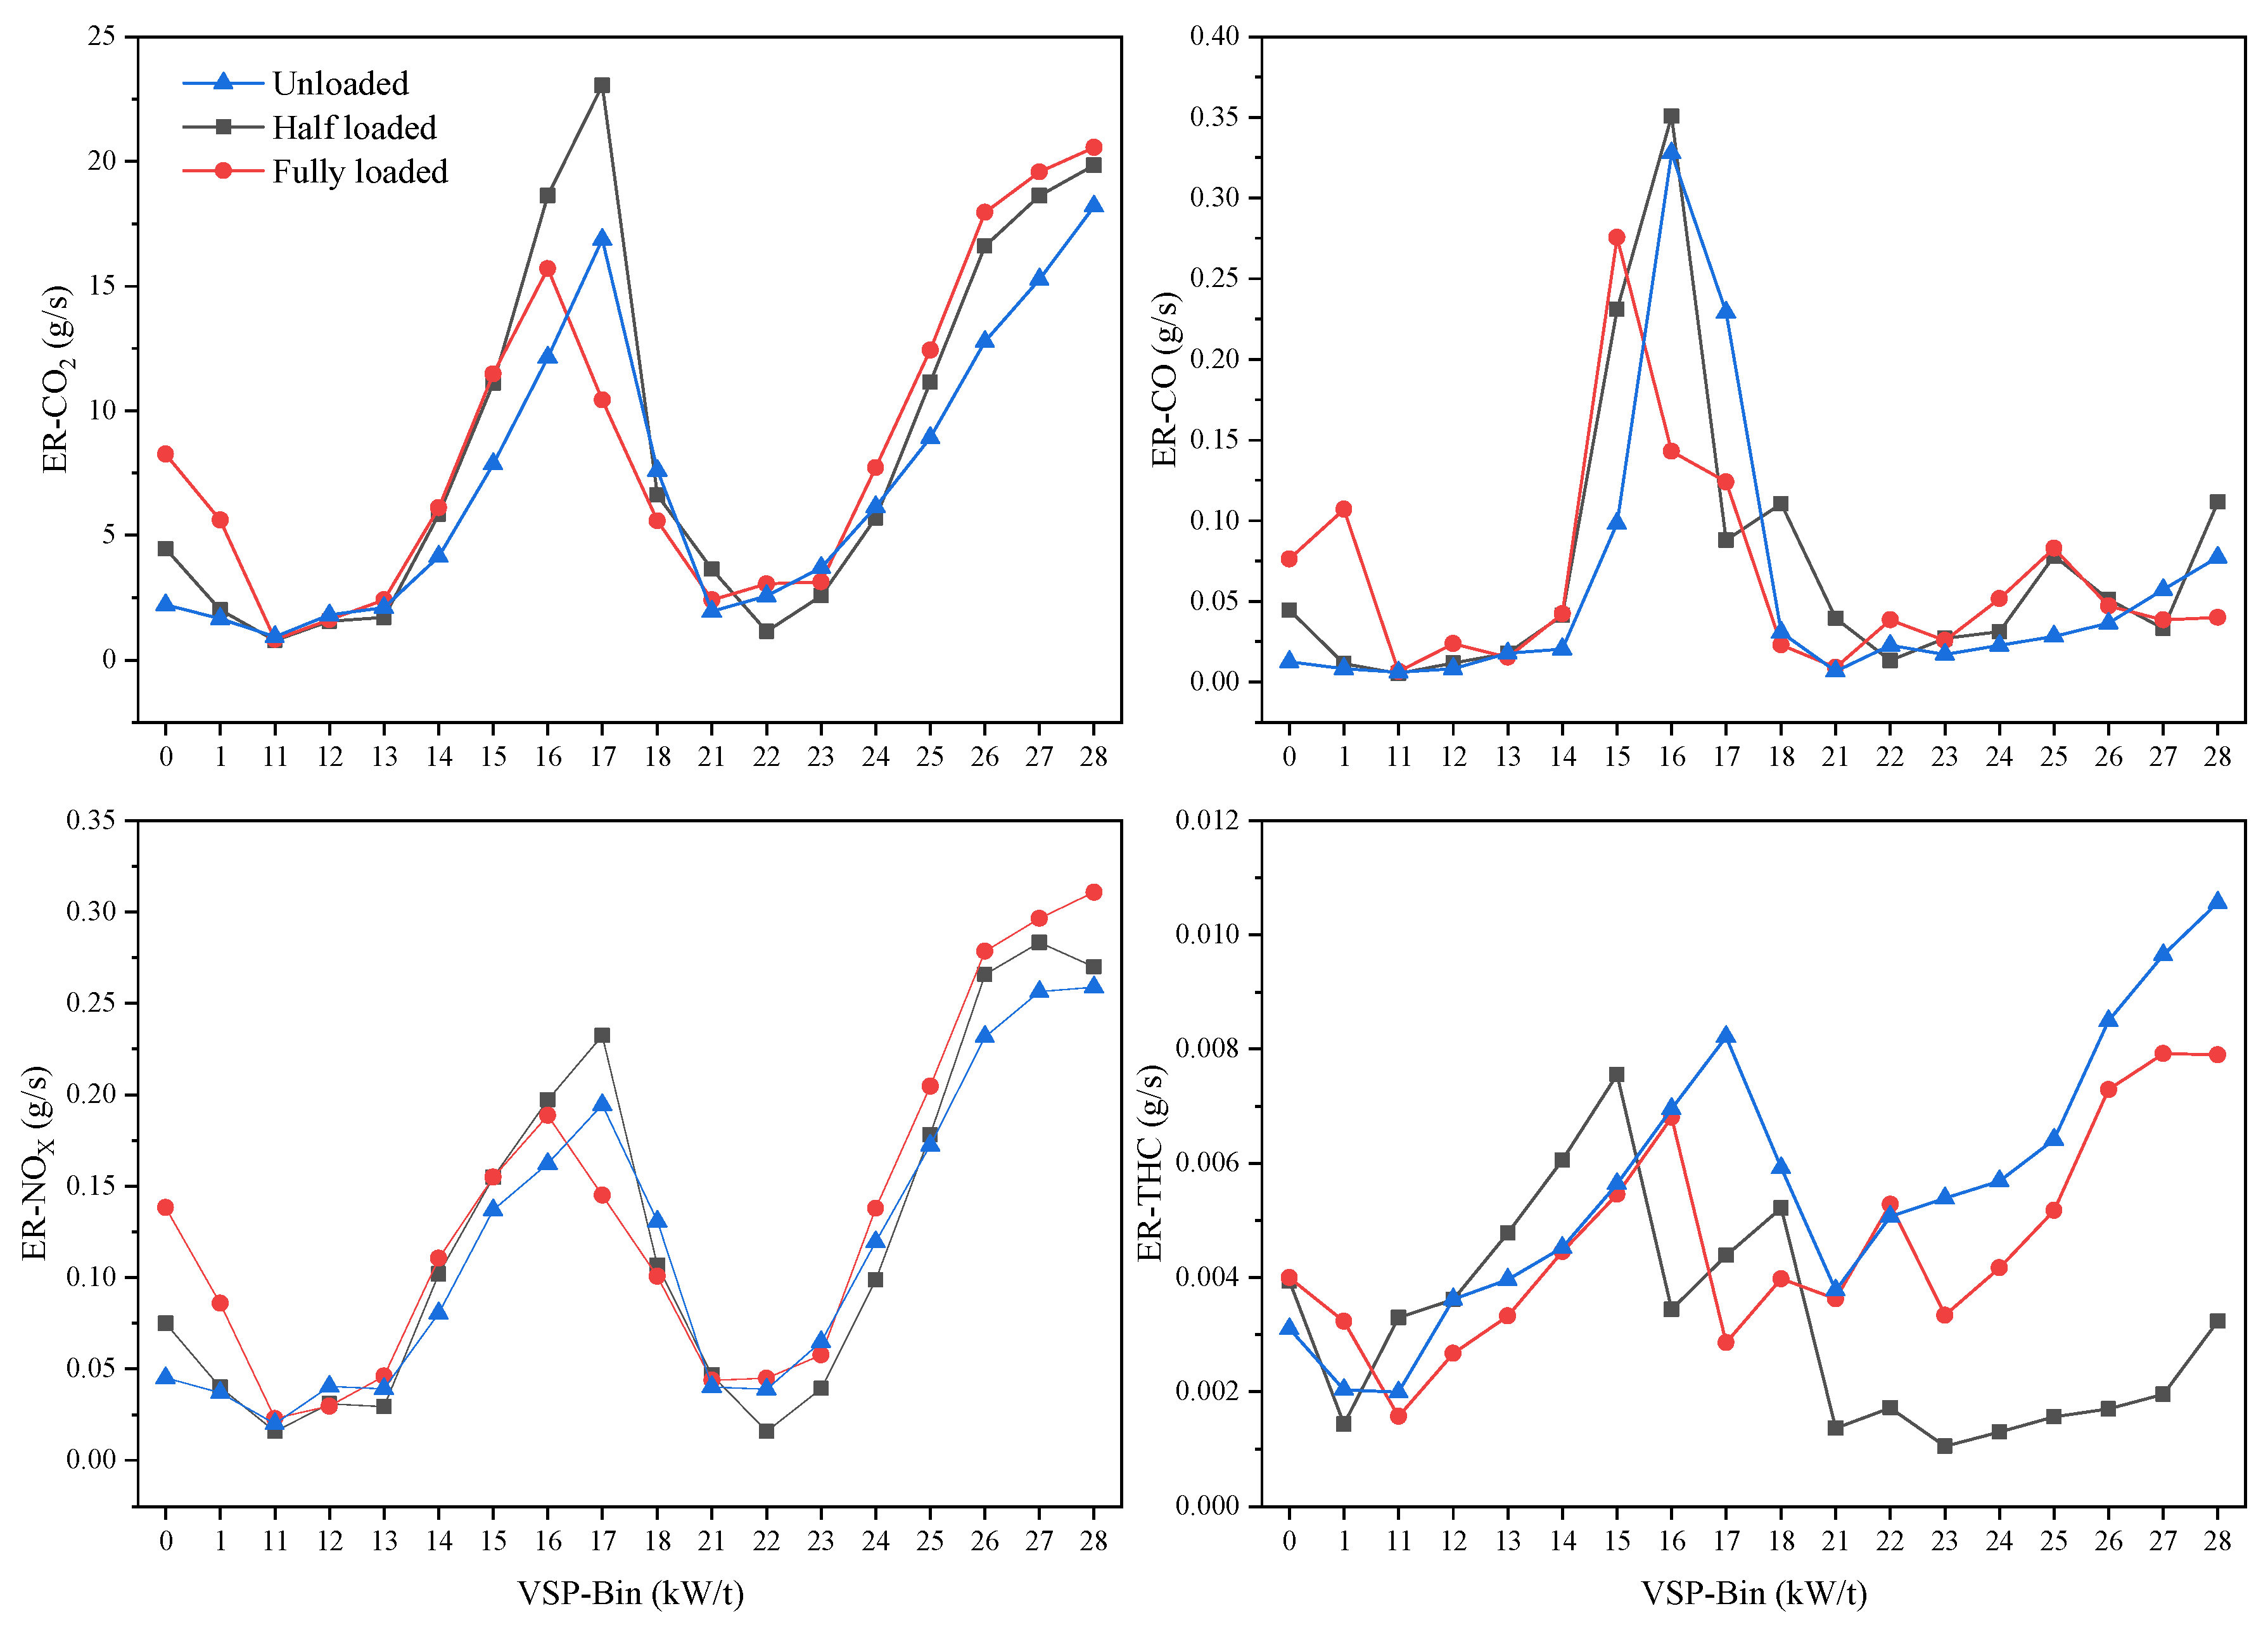
Based on the comprehensive urban, suburban and high-speed data, Figure 10 shows the average emission rate changes of the four emissions under different bins, and shows that the change rule of the four emissions with the increase in bin under different load status is basically the same in HDDTs. In the low-speed range (1.6 km/h ≤ v < 40 km/h), the emission rate increases first and then decreases, and in the middle- and high-speed ranges (40 km/h ≤ v < 80 km/h), the emission rate shows an increasing trend. The average emission rate values produced by the three vehicle loads in deceleration and idling bin are not considered high. The emission rates of the four emissions in the deceleration and idling intervals for fully loaded vehicles are significantly higher than those for unloaded and half-loaded vehicles. However, for different loaded vehicles, the location of the peak emission rate and the magnitude of the change in emission rate are different.
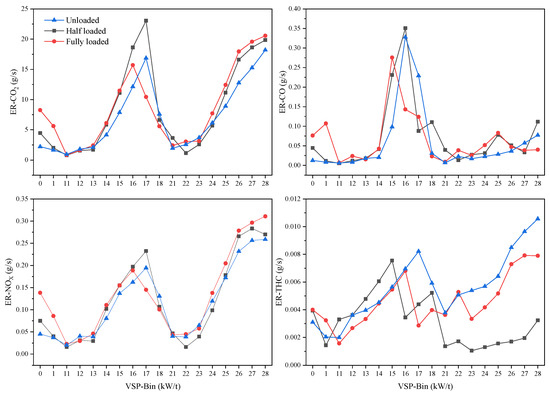
Figure 10.
Average vehicle emission rate for each micro-operational mode.
Specifically, the emission rates of CO2, NOX, and THC in the low-speed and medium-high-speed intervals are more variable, for example, the CO2 produced by the unloaded vehicle has a variation of 17.1% in the low-speed interval, and the variation in the medium-high-speed interval has a variation of 8.3%. The emission rates of CO2, CO, and NOX in bin14 to bin18 show a trend of rapid increase followed by rapid decrease. Taking half load CO2 as an example, the emission rate increased by 17.2 g/s from bin14 to bin17 and decreased by 16.4 g/s from bin17 to bin18. THC emission rate varied greatly in the low-speed interval, and the variation of emission rate in the middle- and high-speed intervals was small, and the variation of the vehicle was only 1.8% when it was unloaded. The emission rate of THC under different bins is greatly affected by the vehicle load, and the distribution of the three-fold lines of THC is more dispersed than that of the other three emissions. The average relative differences of the emission rates of CO2, CO, NOX, and THC between the fully loaded and unloaded vehicles are 13.7%, 11.2%, 10.6%, and −25.5%, respectively. In the low-speed interval, CO2, CO, NOX, and THC generally achieved the maximum values at bin15, bin16, and bin17 in the three load states. Meanwhile, comparing the CO2, CO, NOX, and THC at three load conditions in the low-speed range, the maximum emission rate of the fully loaded vehicle is lower than that of the unloaded and half-loaded vehicles. However, when the bin is 23 kW/t or higher, the emission rates of CO2 and NOX under fully loaded are greater than those of unloaded and half-loaded vehicles.
4. Conclusions
This study employed PEMS to measure emissions from diesel pallet trucks over 30 t under different vehicle loads. The findings reveal that while CO2 and NOX emission factors are minimally influenced by road conditions, CO and THC are significantly affected. Under combined operating conditions, emission factors for CO2, CO, and NOX increased by 39.5%, 105.4%, and 22.7% from unloaded to fully loaded states, respectively. The emission rates for CO2, CO, NOX, and THC varied within the ranges of 0–32 g/s, 0–2.6 g/s, 0–0.5 g/s, and 0–0.04 g/s, respectively. Considering the continuity of speed, the emission factors of four gases with continuous integer speed can be fitted by an exponential function, and the relationship between speed and emission factors is further predicted. Higher vehicle loads correlate with increased emissions, particularly for CO2, CO, and NOX, with speed and acceleration also playing crucial roles. Meanwhile, the VSP characteristics of HDDPTs were revealed. In bins 11–18, the emission rates of CO2, CO, NOX, and THC show a trend of first increasing and then decreasing; in bins 21–28, the emission rate shows a gradually increasing trend. Reducing vehicle load and maintaining optimal driving conditions are vital for minimizing emissions from diesel pallet trucks.
Author Contributions
Conceptualization, Y.Z. and Y.S.; methodology, Y.Z. and Y.S.; software, Y.S. and T.F.; validation, T.F.; formal analysis, Y.Z.; resources, Y.Z.; data curation, T.F.; writing—original draft preparation, Y.Z. and Y.S.; writing—review and editing, Y.S. and T.F.; supervision, Y.Z.; project administration, Y.Z.; funding acquisition, Y.Z. All authors have read and agreed to the published version of the manuscript.
Funding
This research was funded by the National Key Research and Development Program of China, grant number 2022YFB4301204; the Beijing Natural Science Foundation, grant number L201020; and the State Key Laboratory of Rail Traffic Control and Safety, grant number RCS2022ZT007.
Institutional Review Board Statement
Not applicable.
Informed Consent Statement
Not applicable.
Data Availability Statement
The original contributions presented in the study are included in the article, further inquiries can be directed to the corresponding author.
Acknowledgments
The authors would like to acknowledge the National Key Research and Development Program of China, the Beijing Natural Science Foundation and the State Key Laboratory of Rail Traffic Control and Safety.
Conflicts of Interest
The authors declare no conflicts of interest.
References
- Si, F.; Du, E.; Zhang, N.; Wang, Y.; Han, Y. China’s urban energy system transition towards carbon neutrality: Challenges and experience of Beijing and Suzhou. Renew. Sustain. Energy Rev. 2023, 183, 113468. [Google Scholar] [CrossRef]
- Javan, K.; Altaee, A.; BaniHashemi, S.; Darestani, M.; Zhou, J.; Pignatta, G. A review of interconnected challenges in the water–energy–food nexus: Urban pollution perspective towards sustainable development. Sci. Total Environ. 2024, 912, 169319. [Google Scholar] [CrossRef] [PubMed]
- Wang, P.; Zhang, R.; Sun, S.; Gao, M.; Zheng, B.; Zhang, D.; Zhang, Y.; Carmichael, G.R.; Zhang, H. Aggravated air pollution and health burden due to traffic congestion in urban China. Atmos. Chem. Phys. 2023, 23, 2983–2996. [Google Scholar] [CrossRef]
- Pradhan, R.P.; Nair, M.S.; Hall, J.H.; Bennett, S.E. Planetary health issues in the developing world: Dynamics between transportation systems, sustainable economic development, and CO2 emissions. J. Clean. Prod. 2024, 449, 140842. [Google Scholar] [CrossRef]
- Ministry of Ecology and Environment (MEE) of the People’s Republic of China. China Mobile Source Environmental Management Annual Report 2022. Available online: https://www.mee.gov.cn/hjzl/sthjzk/ydyhjgl/202212/W020221207387013521948.pdf (accessed on 15 October 2023).
- World Health Organization.WHO (2023) Air pollution. Available online: https://www.who.int/health-topics/air-pollution (accessed on 27 July 2024).
- Zhang, S.; Yu, L.; Song, G. Emissions Characteristics for Heavy-Duty Diesel Trucks Under Different Loads Based on Vehicle-Specific Power. Transp. Res. Rec. J. Transp. Res. Board 2017, 2627, 77–85. [Google Scholar] [CrossRef]
- Zhang, R.; Wang, Y.; Pang, Y.; Zhang, B.; Wei, Y.; Wang, M.; Zhu, R. A Deep Learning Micro-Scale Model to Estimate the CO2 Emissions from Light-Duty Diesel Trucks Based on Real-World Driving. Atmosphere 2022, 13, 1466. [Google Scholar] [CrossRef]
- Zhu, R.; Wei, Y.; He, L.; Wang, M.; Hu, J.; Li, Z.; Lai, Y.; Su, S. Particulate matter emissions from light-duty gasoline vehicles under different ambient temperatures: Physical properties and chemical compositions. Sci. Total Environ. 2024, 926, 171791. [Google Scholar] [CrossRef] [PubMed]
- Unal, A.; Rouphail, N.M.; Frey, H.C. Effect of Arterial Signalization and Level of Service on Measured Vehicle Emissions. Transp. Res. Rec. J. Transp. Res. Board 2003, 1842, 47–56. [Google Scholar] [CrossRef]
- Chen, C.; Huang, C.; Jing, Q.; Wang, H.; Pan, H.; Li, L.; Zhao, J.; Dai, Y.; Huang, H.; Schipper, L.; et al. On-road emission characteristics of heavy-duty diesel vehicles in Shanghai. Atmos. Environ. 2007, 41, 5334–5344. [Google Scholar] [CrossRef]
- Dhital, N.B.; Wang, S.-X.; Lee, C.-H.; Su, J.; Tsai, M.-Y.; Jhou, Y.-J.; Yang, H.-H. Effects of driving behavior on real-world emissions of particulate matter, gaseous pollutants and particle-bound PAHs for diesel trucks. Environ. Pollut. 2021, 286, 117292. [Google Scholar] [CrossRef]
- Durbin, T.D.; Norbeck, J.M.; Wilson, R.D.; Galdamez, H.A. Effect of Payload on Exhaust Emissions from Light Heavy-Duty Diesel and Gasoline Trucks. Environ. Sci. Technol. 2000, 34, 4708–4713. [Google Scholar] [CrossRef]
- Hausberger, S.; Rexeis, M. Emission behaviour of modern heavy duty vehicles in real world driving. Int. J. Environ. Pollut. 2004, 22, 275. [Google Scholar] [CrossRef]
- Chen, L.; Wang, Z.; Liu, S.; Qu, L. Using a chassis dynamometer to determine the influencing factors for the emissions of Euro VI vehicles. Transp. Res. Part D Transp. Environ. 2018, 65, 564–573. [Google Scholar] [CrossRef]
- Zhang, Y.; Yang, X.; Fu, M. Emission Characteristics of Particle Number from Conventional Gasoline and Hybrid Vehicles. Sustainability 2023, 16, 12. [Google Scholar] [CrossRef]
- Luján, J.M.; Bermudez, V.; Pla, B.; Redondo, F. Engine test bench feasibility for the study and research of real driving cycles: Pollutant emissions uncertainty characterization. Int. J. Engine Res. 2022, 23, 1103–1115. [Google Scholar] [CrossRef]
- Zhao, D.; Chen, H.; Shao, H.; Sun, X. Vehicle Emission Factors for Particulate and Gaseous Pollutants in an Urban Tunnel in Xi’an, China. J. Chem. 2018, 2018, 1–11. [Google Scholar] [CrossRef]
- Hao, L.; Yin, H.; Wang, J.; Tian, M.; Wang, X.; Ge, Y.; Bernard, Y.; Sjödin, Å. Research on Analysis Method of Remote Sensing Results of NO Emission from Diesel Vehicles. Atmosphere 2022, 13, 1100. [Google Scholar] [CrossRef]
- Zhang, Y.; Zhou, R.; Peng, S.; Mao, H.; Yang, Z.; Andre, M.; Zhang, X. Development of Vehicle Emission Model Based on Real-Road Test and Driving Conditions in Tianjin, China. Atmosphere 2022, 13, 595. [Google Scholar] [CrossRef]
- Wang, X.; Song, G.; Zhai, Z.; Wu, Y.; Yin, H.; Yu, L. Effects of Vehicle Load on Emissions of Heavy-Duty Diesel Trucks: A Study Based on Real-World Data. Int. J. Environ. Res. Public Health 2021, 18, 3877. [Google Scholar] [CrossRef]
- Frey, H.C.; Rouphail, N.M.; Zhai, H. Link-Based Emission Factors for Heavy-Duty Diesel Trucks Based on Real-World Data. Transp. Res. Rec. J. Transp. Res. Board 2008, 2058, 23–32. [Google Scholar] [CrossRef]
- GB 17691-2018; Limits and Measurement Methods for Emissions from Diesel Fuelled Heavy-Duty Vehicles (CHINA VI). China Environmental Press: Beijing, China, 2018.
- European Parliament; Council of the European Union. Regulation (EC) No 595/2009 of the European Parliament and of the Council of 18 June 2009 on type-approval of motor vehicles and engines with respect to emissions from heavy duty vehicles (Euro VI) and on access to vehicle repair and maintenance information and amending Regulation (EC) No 715/2007 and Directive 2007/46/EC and repealing Directives 80/1269/EEC, 2005/55/EC and 2005/78/EC (Text with EEA relevance). Available online: https://eur-lex.europa.eu/legal-content/EN/TXT/?uri=CELEX%3A32009R0595 (accessed on 10 December 2023).
- Su, S.; Ge, Y.; Zhang, Y. NOX Emission from Diesel Vehicle with SCR System Failure Characterized Using Portable Emissions Measurement Systems. Energies 2021, 14, 3989. [Google Scholar] [CrossRef]
- Liu, C.; Pei, Y.; Wu, C.; Zhang, F.; Qin, J. Novel insights into the NOX emissions characteristics in PEMS tests of a heavy-duty vehicle under different payloads. J. Environ. Manag. 2023, 348, 119400. [Google Scholar] [CrossRef]
- Jiménez-Palacios, J.L. Understanding and Quantifying Motor Vehicle Emissions with Vehicle Specific Power and TILDAS Remote Sensing; Massachusetts Institute of Technology: Ambridge, MA, USA, 1998. [Google Scholar]
- Chong, H.S.; Park, Y.; Kwon, S.; Hong, Y. Analysis of real driving gaseous emissions from light-duty diesel vehicles. Transp. Res. Part D Transp. Environ. 2018, 65, 485–499. [Google Scholar] [CrossRef]
- Wang, H.; Ge, Y.; Tan, J.; Wu, L.; Wu, P.; Hao, L.; Peng, Z.; Zhang, C.; Wang, X.; Han, Y.; et al. The Real-world Emissions from Urban Freight Trucks in Beijing. Aerosol Air Qual. Res. 2018, 18, 1448–1456. [Google Scholar] [CrossRef]
- Wang, Z.; Wu, Y.; Zhou, Y.; Li, Z.; Wang, Y.; Zhang, S.; Hao, J. Real-world emissions of gasoline passenger cars in Macao and their correlation with driving conditions. Int. J. Environ. Sci. Technol. 2014, 11, 1135–1146. [Google Scholar] [CrossRef]
- Wu, Y.; Zhang, S.J.; Li, M.L.; Ge, Y.S.; Shu, J.W.; Zhou, Y.; Xu, Y.Y.; Hu, J.N.; Liu, H.; Fu, L.X.; et al. The challenge to NOX emission control for heavy-duty diesel vehicles in China. Atmos. Chem. Phys. 2012, 12, 9365–9379. [Google Scholar] [CrossRef]
- He, L.; Zhang, S.; Hu, J.; Li, Z.; Zheng, X.; Cao, Y.; Xu, G.; Yan, M.; Wu, Y. On-road emission measurements of reactive nitrogen compounds from heavy-duty diesel trucks in China. Environ. Pollut. 2020, 262, 114280. [Google Scholar] [CrossRef] [PubMed]
- Shang, R.; Zhang, Y.; Shen, Z.-J.M. Analyzing the Effects of Road Type and Rainy Weather on Fuel Consumption and Emissions: A Mesoscopic Model Based on Big Traffic Data. IEEE Access 2021, 9, 62298–62315. [Google Scholar] [CrossRef]
- Carrese, S.; Gemma, A.; La Spada, S. Impacts of Driving Behaviours, Slope and Vehicle Load Factor on Bus Fuel Consumption and Emissions: A Real Case Study in the City of Rome. Procedia Soc. Behav. Sci. 2013, 87, 211–221. [Google Scholar] [CrossRef]
- Zhang, Q.; Wu, L.; Yang, Z.; Zou, C.; Liu, X.; Zhang, K.; Mao, H. Characteristics of gaseous and particulate pollutants exhaust from logistics transportation vehicle on real-world conditions. Transp. Res. Part D Transp. Environ. 2016, 43, 40–48. [Google Scholar] [CrossRef]
- Mera, Z.; Fonseca, N.; Casanova, J.; López, J.-M. Influence of exhaust gas temperature and air-fuel ratio on NOX aftertreatment performance of five large passenger cars. Atmos. Environ. 2021, 244, 117878. [Google Scholar] [CrossRef]
- Liu, Y.; Tan, J. Green Traffic-Oriented Heavy-Duty Vehicle Emission Characteristics of China VI Based on Portable Emission Measurement Systems. IEEE Access 2020, 8, 106639–106647. [Google Scholar] [CrossRef]
- Zhang, Y.; Song, Y.; Feng, T.; Chen, Y. Comparative Analysis of Emission Characteristics of In-Use China II–V Gasoline, Hybrid, Diesel-Fueled Vehicles. Atmosphere 2023, 14, 272. [Google Scholar] [CrossRef]
Disclaimer/Publisher’s Note: The statements, opinions and data contained in all publications are solely those of the individual author(s) and contributor(s) and not of MDPI and/or the editor(s). MDPI and/or the editor(s) disclaim responsibility for any injury to people or property resulting from any ideas, methods, instructions or products referred to in the content. |
© 2024 by the authors. Licensee MDPI, Basel, Switzerland. This article is an open access article distributed under the terms and conditions of the Creative Commons Attribution (CC BY) license (https://creativecommons.org/licenses/by/4.0/).