Article

Estimation of Particulate Matter Levels in City Center Pedestrian Routes with the Aid of Low-Cost Sensors

by
Dimos Dimitrios Plakotaris
,
Theodosios Kassandros
,
Evangelos Bagkis
and
Kostas Karatzas
*
Environmental Informatics Research Group, School of Mechanical Engineering, Aristotle University of Thessaloniki, 54124 Thessaloniki, Greece
*
Author to whom correspondence should be addressed.
Atmosphere 2024, 15(8), 965; https://doi.org/10.3390/atmos15080965
Submission received: 5 July 2024 / Revised: 2 August 2024 / Accepted: 7 August 2024 / Published: 13 August 2024

Abstract

:
Particulate matter is one of the most dangerous air pollutants, especially in urban areas, due to its significant adverse health effects. Traditionally, air quality monitoring relies on fixed reference stations, which often have a low temporal and spatial resolution. To address this limitation, a low-cost, portable air quality monitoring device with a rapid measurement response was used to assess particulate matter concentration levels in the afternoon hours in central Thessaloniki, Greece. This approach enabled the identification of local hotspots directly related to human activities. Statistical analysis and spatial mapping were employed, and data collected were categorized using k-means clustering. The findings of the study suggest that data acquired via portable low-cost sensors can describe the local variability of PM2.5 concentrations. The results indicate that local activities, such as increased human accumulation, traffic congestion at traffic lights, market working hours, together with meteorological parameters, can significantly impact air quality in specific urban locations. They also highlight the differences between data recorded in colder and warmer periods, with the concentrations of PM2.5 in the first period being 3.7 μg/m3 greater on average than in the second. These differences are also identified via the k-means clustering method, which suggest that higher concentrations appear mostly during the colder period of the study.

1. Introduction

1.1. Background

Air quality (AQ) remains a major environmental concern especially in urban areas. In Europe alone, poor AQ contributes to over 350,000 premature deaths annually, with the most vulnerable members of society (children, people with chronic health conditions, etc.) being the most susceptible. This air pollution also burdens healthcare systems and economies due to increased rates of heart disease, stroke, and respiratory problems [1]. The culprit behind these health effects is mostly particulate matter (PM), which consist of tiny particles with a varying size, commonly expressed as a mean aerodynamic diameter in μg/m3. While the composition of PM can differ, common components include metals, organic compounds, biological material, ions, gaseous pollutants, and even carbon. Importantly, there is strong evidence that ultrafine (PM0.1) and fine (PM2.5) particles pose a greater threat than coarse ones (PM10), contributing significantly to mortality and cardiovascular and respiratory issues [2].
While official fixed AQ monitoring stations remain the cornerstone of air pollution monitoring, recent research indicates that they may not fully capture the spatial variations in concentrations across urban areas [3]. This is due to the inherent heterogeneity of urban environments, as well as the local nature of some of the air pollution emission sources, as they are directly associated with human presence and activity. To address these limitations, low-cost sensors are emerging as a promising supplementary tool to existing particulate matter measurement networks [4]. Advancements in sensor technology have led to the development of relatively inexpensive and compact devices for air quality monitoring, offering a more practical, compact, and cost-effective approach [5].
Human activities in cities are inevitably concentrated in a relatively small area. Most economic activities involving the use and conversion of energy are associated with the emission of atmospheric pollutants, thus degrading the environment, especially within the urban web [6]. The factors contributing to the production of air pollutants vary and range from traffic, where economic development combined with a lack of effective transport and land-use planning leads to an increase in vehicle ownership, to traffic congestion factors that lead to hotspots of high air pollution near major roads [7]. Additional factors also include the domestic burning of wood and biomass, which is a widespread method of heating and a significant source of particulate matter in many European countries [8], industry (power stations, foundries, incinerators and other industrial activities) and the transboundary transfer of air pollution, with transboundary particle pollution being a characteristic example [9]. Finally, weather conditions have a major impact on air quality, as air pollution depends on meteorological factors such as temperature, wind speed, relative humidity and the height of the atmospheric boundary layer [10].
Current standard AQ monitoring equipment is expensive and bulky, limiting its widespread use for personal exposure monitoring. As a result, high accuracy air quality monitoring stations are fixed in order to represent air pollution in an area surrounding them and limited to official or to research use. However, the advent of low-cost, portable sensors presents a transformative opportunity for personal exposure monitoring [11]. For this reason, mobile AQ monitoring is attracting increasing interest, with several devices being developed to access the spatial and temporal variability of air quality in real time using different instruments, technologies, and platforms. This advancement could revolutionize exposure estimations in epidemiological studies and may allow individuals to monitor their own AQ more affordably and conveniently. Such a shift underscores the potential of mobile, low-cost systems to democratize air quality monitoring by addressing the current limitations of accessibility and coverage of traditional monitoring approaches [12]. On the other hand, recognizing the complexity of air pollutant production and dispersion, efforts are underway to develop models capable of mapping, clustering, and predicting AQ levels to inform exposed populations in urban areas. Achieving highly accurate prediction of air pollution is still a difficult and challenging task. First, the direct factors affecting AQ have different spatial and temporal distributions and modes, while some indirect factors such as weather also affect AQ. The relationships and interactions between air pollution and these factors are very complicated and difficult to determine [13].
In the present study, AQ mobile measurements were conducted at pedestrian routes in the center of Thessaloniki, Greece, using a low-cost sensor system, as described in the materials and methods chapter. The collected data were compared with measurements from a calibrated fixed low-cost sensor network operating in the city [14], and were later used for the visualization of pollution levels in maps. Moreover, the collected data were clustered with the aid of the k-means algorithm, aiming at identifying similarities and patterns, reflected in areas of the city as well as in time intervals within the studied period, that characterize the air pollution in the area and may reveal local pollution hotspots.

1.2. Related Work

There are few studies to directly address air quality monitoring in pedestrian routes or in commuting in general, making use of low-cost sensors. Zhu et al. [15] accessed the health risk related to PM2.5 concentrations in walking trips and identified its significance, while Fameli et al. [16] investigated the use of low-cost sensors for estimating concentration levels of PM2.5 in various commuting modes, including walking, and found out that exposure was higher when passing-by a high traffic area. They also suggested ways of measurement collection and analysis. Aix et al. [17] also used low-cost sensors for analyzing AQ levels related to various commuting modes, including walking, and suggested data collection and analysis methods. In a very relevant work by Ramel-Delobel et al. [18], the aim was to use low-cost portable sensors during commuting (bicycle, bus, car, walking) in the metropolis of Lyon, France. To ensure intermodal comparisons, measurements were taken under similar exposure conditions (routes, weather conditions and road traffic) every weekday morning and evening for a period of six weeks. In this way, it was possible to determine and compare exposure to harmful air pollutants caused by commuting. In another study, Kassandros et al. [19] used the same device that was employed in the current study to estimate the PM2.5 levels associated with various commuting modes, including walking in the city, and identified that proximity to pollution sources is associated with higher concentration readings. In addition, in works like the one of Pope et al. [20], it was also suggested to investigate the concentration levels of particulate matter at urban roadside sites with low-cost devices. In the same study, it was made evident that despite the insufficient cross-calibration with reference-grade equipment, low-cost sensors could reliably map diurnal PM behavior.
A few studies focus on how low-cost sensors can be integrated with advanced analytical methods, such as the predictive k-means clustering used in our study. White et al. [21] found that by utilizing low-cost sensors, it was possible to collect extensive data across diverse regions, enabling a detailed analysis of pollutant mixtures and their health impacts. On this basis, the predictive k-means clustering effectively differentiated between regional pollution profiles. This approach demonstrates the potential of low-cost sensors combined with sophisticated clustering techniques to advance environmental health research, particularly in understanding exposures and their health outcomes. Additionally, Ahn et al. [22] used a mixture of hierarchical clustering to determine an appropriate number of clusters for each of the PM2.5 and PM10 concentrations using the Ward algorithm and k-means.
Other, but few, studies mainly investigate AQ in the Greater Thessaloniki area with the aid of low-cost devices. Varius research has been conducted on air quality indexing in Thessaloniki [23] using mainly stationary AQ sensor nodes. Although almost everyone acknowledges the poor air quality in the city center over the years, the measurements used, being from stationary nodes, fail to capture the complexity and variance in pollutants at the street level and generalizing their results based on one location node.

2. Materials and Methods

2.1. Low-Cost Air Quality Sensor System

For the monitoring of air quality levels in the urban fabric of the center of Thessaloniki, the low-cost portable sensor system of the openSenseMap group (Institute of Geoinformatics, University of Münster, Münster, Germany) was used. The device includes three environmental sensors: (i) a digital humidity sensor with integrated temperature sensor (HDC1080DMBT, Texas Instruments Inc., Dalas, TX, USA), a piezoresistive sensor for atmospheric pressure (BMP280, Bosch Sensortec GmbH, Reutlingen, Germany) and a sensor for PM2.5 and PM10 particulate matter using optometry (SDS011, Nova Fitness Co., Ltd., Jinan, China). These three sensors are connected to the Re:edu GmbH circuit board, which is programmed and configured using the Arduino IDE platform (https://docs.arduino.cc, accessed on 2 July 2024). Finally, the system is connected via Wi-Fi to the user’s portable smartphone. All sensor elements and electronics are placed within a relevant PCB (Printed Circuit Board) enclosure. It should be noted that no additional calibration has been applied to the sensors, apart from the one carried out by their manufacturer, in an effort to use “of the shelf” low-cost devices focusing on depicting PM2.5 concentration variations rather that accurate concentration levels.
To collect air quality information, the system first gathers the data recorded by the sensor at the beginning of a ten-second time interval and stores it in the board’s memory. Then, at the end of this interval, the data are sent via Wi-Fi to the openSenseMaps server (https://archive.opensensemap.org, accessed on 2 July 2024) and stored there in csv format with a timestamp of the time it arrived at the server, while at the same time, GPS geographical data collected using the Geo Tracker application (https://geo-tracker.org/, accessed on 2 July 2024) are stored in a GPS exchange format file.
The device has a low power consumption and was powered by a power bank. The transport parts of the array (visualized in Appendix A) were mounted in a perforated bag, carried by a walking person, placed at a height approx. 1.5 m above ground, therefore representing the breathing height of a common adult. The total cost of the portable sensor device comes to around 130 euros. Figure 1 visualizes the system configuration, as well as the PM concentration data collection.

2.2. Study Area

The Greater Thessaloniki Area (GTA) is situated in the northern part of Greece and has a Mediterranean climate with hot summers and cold winters. Due to the proximity to the sea, the city has relatively high humidity. With more than one million inhabitants (approximately 10% of the Greek population) and approximately 20% of the country’s industrial activity, it is the second largest urban agglomeration in Greece and one of the largest in the Balkans. Vehicle and industrial emissions are the two main sources of air pollutants in the GTA. The city is characterized by high air pollution levels, and compliance with AQ standards must be achieved within the deadlines defined by the relevant EU legislation [6].
The area that was chosen to carry out the experiment and the collection of the relevant AQ data is the city center of Thessaloniki. In order to facilitate data processing, the area was divided into two subareas, namely that of the western part of the center, and that of the eastern part of the center, using Agias Sofias street as their separator (Figure 2). The two sub-areas included 3 routes each, in an effort to capture the impact of human activities on local air pollution levels as well as possible. The selection of these routes was based on the existence of specific human actions of everyday relevance such as walking, shopping and commuting.
In terms of the western part of the city center, the selection of all three route variants was based on the existence of two busy bus stops along the way, as well as on the operation of three fixed location AQ sensor nodes (KASTOM project, http://app.air4me.eu/, accessed on 2 July 2024) in the area. In addition, all routes in this section pass through the pedestrian zone of Agias Sofias street, which incorporates many shops and refreshment facilities and therefore attracting more people.
The eastern part of the city center is also particularly interesting. Routes here were also designed to pass near the KASTOM AQ sensor nodes, while this particular area hosts the pedestrian street of Dimitriou Gounari, which is a busy shopping street with shops and especially many fast-food outlets, and Navarino Square, which attracts people of all ages, either passers-by or children in the playground, in addition to many bars and cafés.
All pedestrian routes were materialized in the evening hours between 18:30 and 21:00 local time, covering all days of the week. The experiment lasted from 21 March 2023 to 1 May 2023, with a gap between 9 and 24 April (Orthodox Easter break). During the period and time when the experiment was conducted, there was medium to heavy traffic flow and the weather was mostly clear, with a few exceptions of windy or light drizzle.
In summary, the data collected in each time period were as follows: 20 days (6630 data points) before the Easter break and 20 days (5953 data points) after the Easter break. Most of the data collected before the break were acquired in the western part of the city routes (apart from one day), and almost all data collected in the eastern part of the city routes were acquired after the break (again with the exception of one day). The first data set also coincides with the colder period of the experiment, while the second part with the warmer period, considering their proximity to early and late Spring respectively. The routes where the experiment was conducted in both the eastern and western part of the city are shown in Figure 2.
All the data collection routes were designed to highlight the extent to which different local factors affect the air quality breathed by people living in the city center. These factors are the level of people concentration in an area, the presence of restaurants and the proliferation of heating in food outlets, traffic congestion and other local activities. The day of the week or even the time of year when the particulate matter concentration is measured can also be an important factor.

2.3. K-Means Clustering

Relative research in the topic of clustering AQ sensor data uses k-means clustering. Therefore, we decided to use this method as well, because it can best identify patterns within our data that are not associated with any specific continuity (different days, periods, weather conditions, etc.).
K-means is a popular unsupervised machine learning algorithm designed to categorize a dataset into k different clusters, where each data point belongs to the cluster with the closest centroid. The algorithm works through an iterative process. Initially, k centroids are selected (either randomly or through a more sophisticated method). Then, the data points are assigned to the cluster of which the centroid is the closest, usually measured in terms of the Euclidean distance. The centroids are recalculated based on the average of the data points in their respective clusters. This process of assigning and updating centroids is repeated iteratively until convergence, which is defined by constant assignments and minimum centroid adjustments. The algorithm aims to minimize the sum of the squared distances between the data points and the assigned centroids of their clusters, leading to coherent and well-defined clusters [24].
To identify the correct number of centroids needed, the elbow method is applied. This is a method that inspects the percentage of variance explained in accordance with the number of clusters. More specifically, the percentage of variance explained is plotted against the number of clusters. The first clusters will add a lot of information, but at some point, the gain will drop dramatically, this being reflected with a change of slope (angle) in the graph. In this way, the “k” number of cluster is at the point where not much information is added, hence an elbow appears in the plot [25].
To ensure the quality of the data, the system was purged with air streams to avoid some false readings during system start-up. We opted to perform clustering analysis to investigate the patterns in the collected data. The algorithm was introduced with both concentrations and latitude, longitude to achieve clusters informed by the location, since this is a mobile setting and excluded the meteorological variables to see if the clusters have any meaning. Finally, all the air quality data collected by the system was considered potentially critical due to the variability of the data due to the height at which it was collected and the mobility of the system.

3. Results

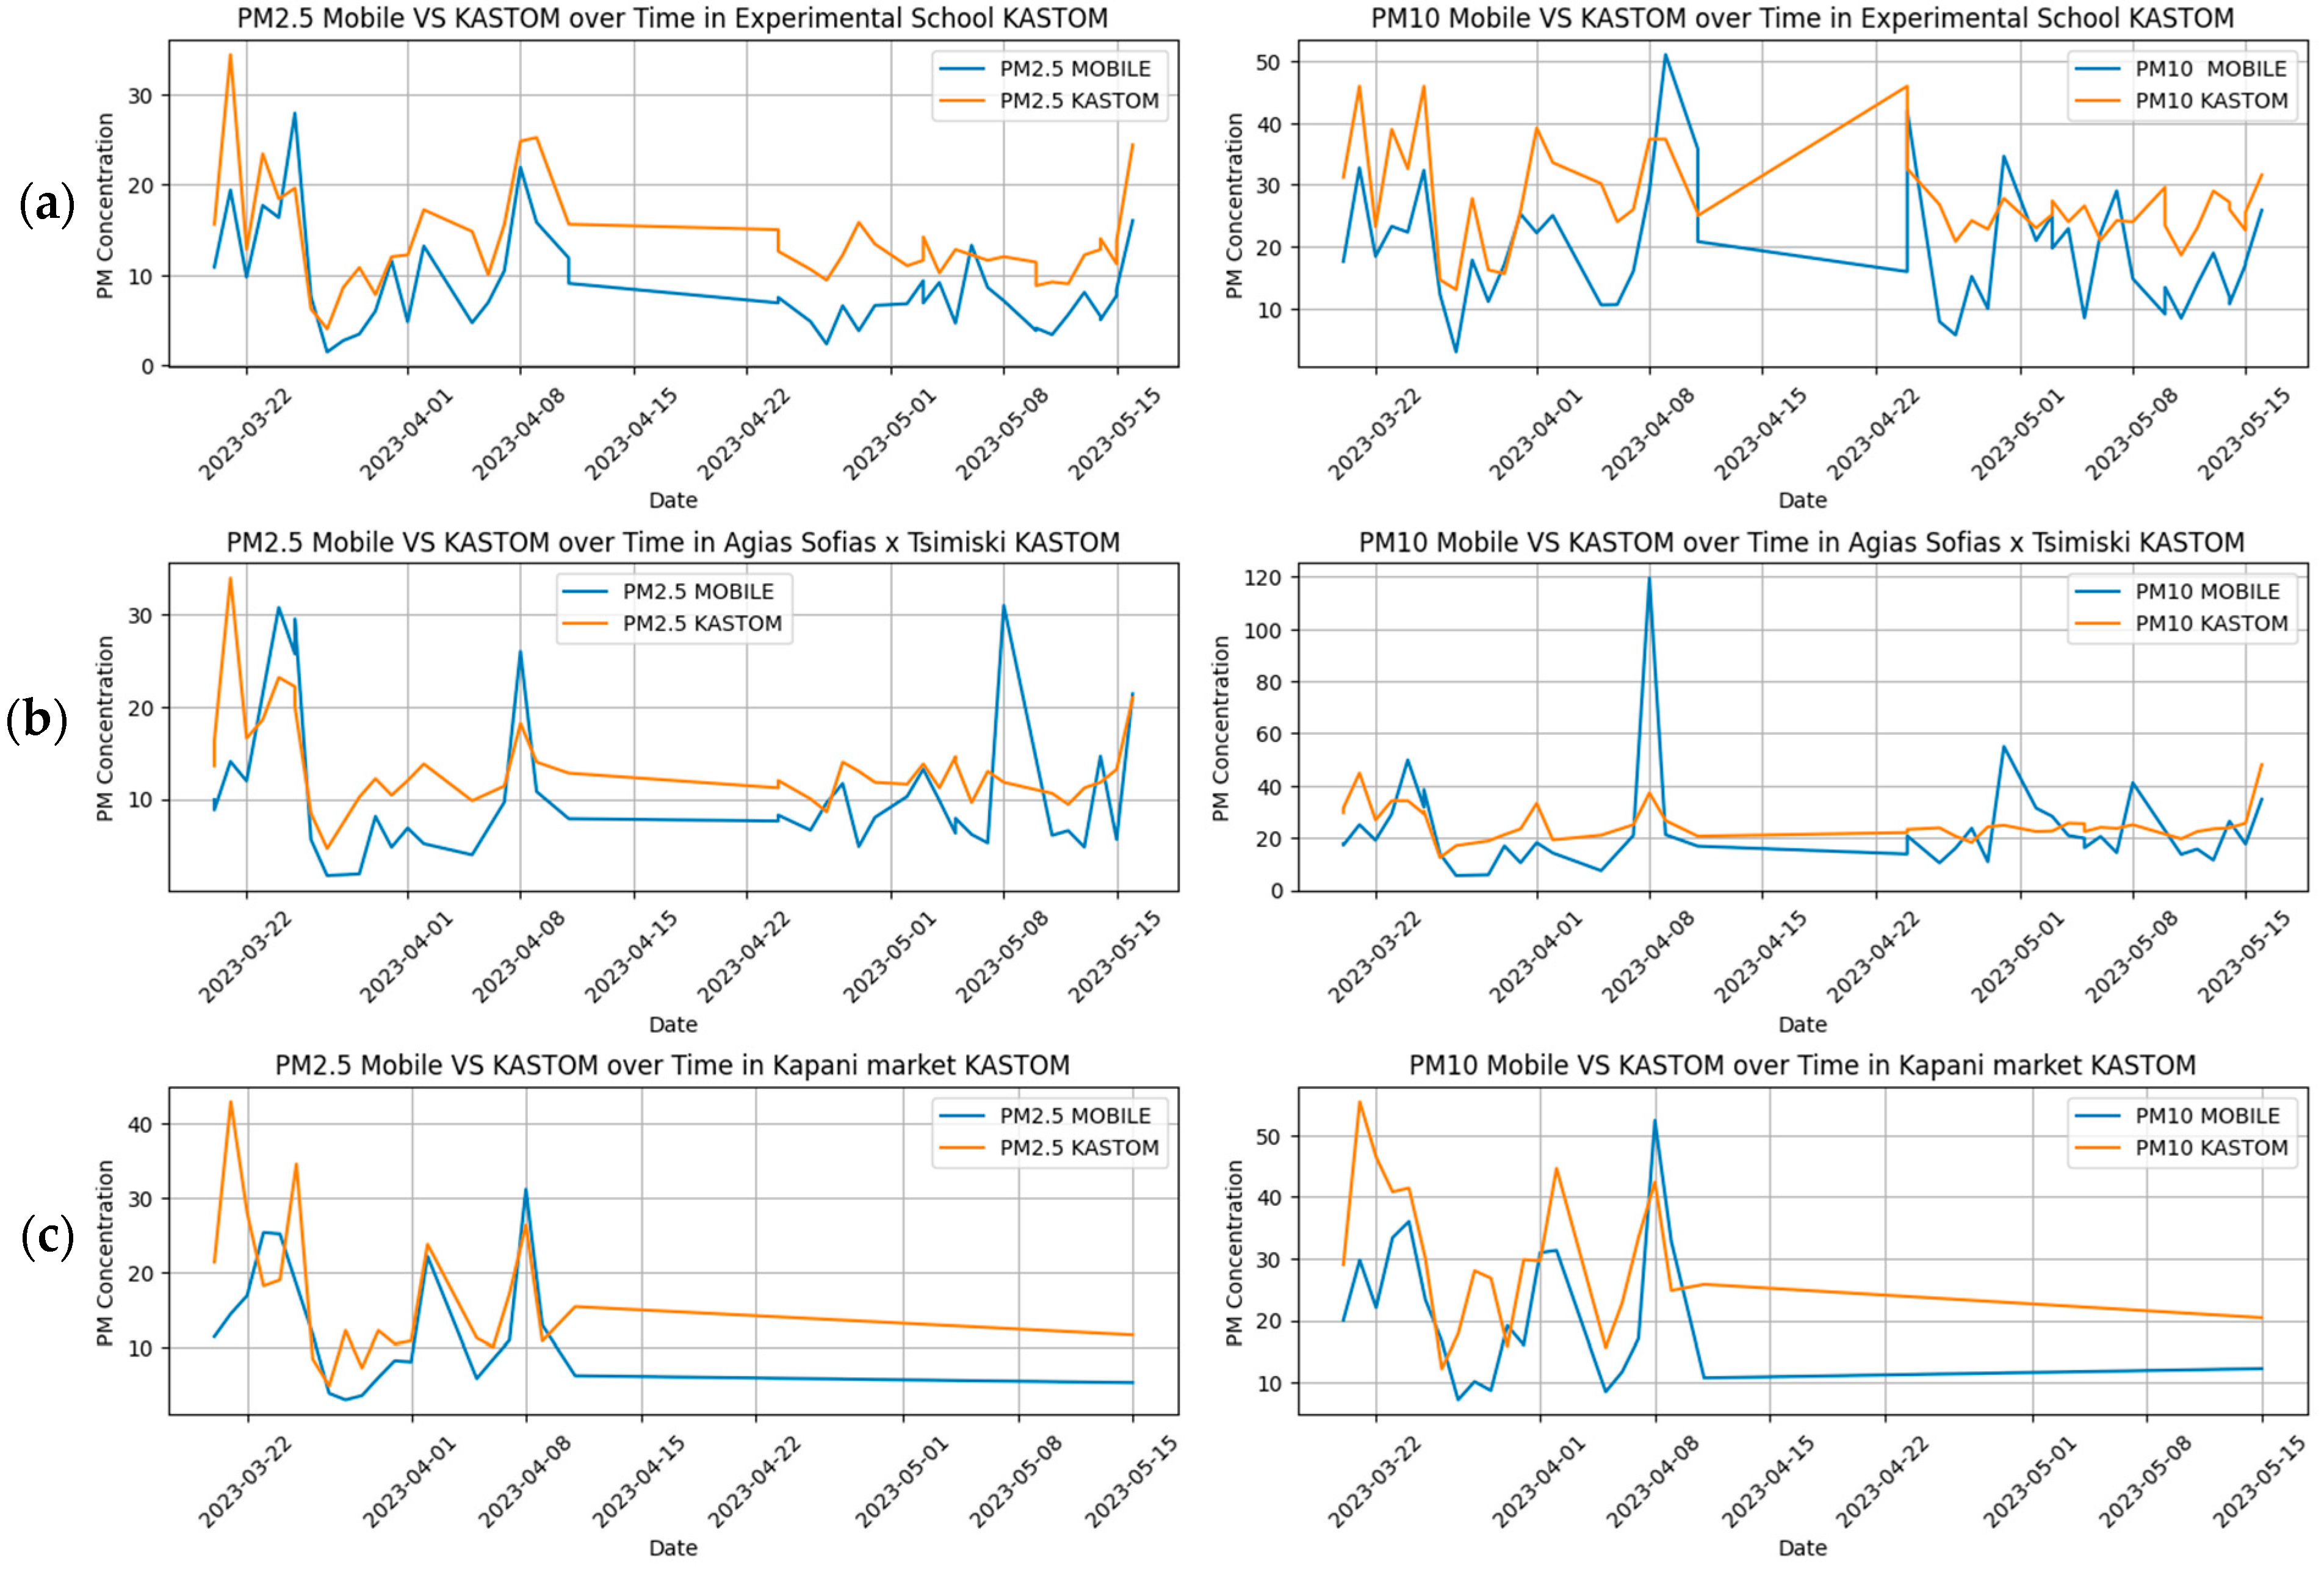
3.1. Mobile and Fixed Measurement Comparison

Data from the KASTOM air pollution monitoring network were compared to the data collected by the low-cost portable device in order to check the reliability of the latter. The KASTOM network operates monitoring nodes (for PM2.5 and PM10 concentrations levels) installed in three locations within the city center: the crossroad of Agia Sofia and Tsimiski streets, at the Kapani market and at the Experimental School on Agia Sofia Street. All these locations were visited every day during the experiment and a short stop of a few minutes was made in order to collect a sufficient number of measurements. On this basis a mean concentration was estimated, which was compared to the mean hourly concentration values reported by the KASTOM nodes. The root mean squared error (RMSE) for the measurements at the three fixed KASTOM nodes of Tsimiski, Kapani, and Experimental School, for PM2.5, were found to be 6.2, 9.2, and 6.7 respectively, while for PM10 they were 11.0, 13.0, and 16.6 respectively, all measured in μg/m3. These results indicate that the measurements collected by the portable low-cost sensor system describe the trend of the PM concentration values as it can also be seen in Figure 3, while the KASTOM node measurements are generally higher than those of the mobile sensor in most of the cases.

3.2. Statistical Analysis of Measurements

The typical profiles were calculated for the pollutants of interest and for all the available time segments. The result presented in Table 1 consist of the averaged time slot on all campaign dates, not taking into account the location of the measurement but only the time recorded. The mean value within every time slot is presented, as well as the standard deviation, the latter as a measure of the fluctuation of the actual concentration readings within every time slot. Outcomes suggest that generally there is an upward trend in PM concentrations as time progresses toward late at night. Interestingly, this period coincides with the closing time of the market in the city center, therefore leading to increased pedestrian and car use activity which is expected to boost relevant emissions.
Moreover, measurements were analyzed by day of record (Monday, Tuesday, etc., Table 2). It should be noted here that Tuesday, Thursday, Friday and Saturday are days when shops are open in the evening.
Results show the maximum average value occurring on Saturday, accompanied by a large standard deviation. For the other days, results are as expected, with Monday and Wednesday being the days with the lowest concentration of PM, an outcome consistent with the low overall mobility on those days due to the closed shops in the area.
Finally, the data can also be divided into two broader time periods, one before the Easter holidays, and one after, as these two periods correspond to a lower mean temperature (for the period before the break, early Spring) in comparison to the higher mean temperature (for the period after the break, late Spring), as presented in Table 3. It should be noted that these two time periods correspond to measurements conducted, in their majority, to the western part of the city center (for the colder period) and to the eastern part of the city center (for the warmer period). Nevertheless, both parts are similar in terms of land use, characterized by dense population and local small-scale commercial activities (shops, restaurants and cafés); therefore, they can be considered homogeneous in terms of overall emission potential. The results show that the concentration of particulate matter is higher in the colder period in comparison to the warmer period, which could be attributed to different mechanisms of pollutant production. Such mechanisms could be domestic heating in the colder period (biomass combustion), as well as the increased use of private vehicles due to weather conditions (more rainy and cold days during early Spring).
In a next step, data collected by the portable low-cost sensor system were used for creating spatial maps of the mean as well as of the standard deviation of PM2.5 concentrations (Figure 4). It is evident that most of the high air pollution concentration values are accumulated in specific points in the city center, which are also characterized by large standard deviations. These points populate the western part of the covered area, corresponding to the colder period of the conducted measurements.
From Figure 4b, it is shown that there are locations on the map with high standard deviation (STD) and relatively lower mean values recorded. A high mean value can be calculated from very few transient sources that are rather random but should be acknowledged. Otherwise, if the STD is low but the mean value in the same location is high, then we can infer that indeed this spot is a hot spot on many days.
For a better understanding of the city’s center air pollution, the five highest recorded PM2.5 concentration values (>25 μg/m3) were identified and the locations that were recorded are depicted in Figure 5. The map reveals some interesting characteristics of the aforementioned locations: the existence of busy bus stops (2, 7, 8), traffic lights causing vehicle accumulation and congestion (1, 2, 3, 4, 10), restaurants and fast-food facilities (3, 5, 6, 9), road construction works (11). The last few extra points (12, 13, 14) are all streets with commercial shops and traffic higher than others. The reason they are highlighted is to show that despite their high activity, only a handful of times high particulate matter PM2.5 were recorded. In all other these cases, high density of human activities as well as local traffic, are the common features of the relevant locations, sketching a profile of local hot spots in terms of emissions.

3.3. Data Clustering with K-Means

The k-means clustering algorithm was applied to the initial data collected (latitude, longitude, PM2.5 and PM10 concentration values) from the low-cost sensor system in an effort to reveal the humidity and temperature characteristics of these clusters (aforementioned parameters did not participate in the clustering process). For identifying the required number of centroids, the elbow method was applied, leading to four clusters (Figure 6 and Figure 7), with the cluster characteristics reported in Table 4.
In Table 4, it is shown how the k-means algorithm rearranged the data into the four clusters based on similarities found in each data point.

4. Discussion

The use of a low-cost sensor system can contribute to the study of urban air pollution and may provide useful information on the dynamic behavior of particulate matter concentrations using appropriate statistical and computational models. The comparison of the measurements of the mobile sensor system used in this study with the measurements of the fixed air pollution monitoring nodes of the KASTOM project showed that the former describes quite well the trend of the monitored pollutants. Despite the individual exceptions/deviations in the measurements, they appear to be capturing the changes in concentrations uniformly, as supported by the corresponding low RMSE.
Basic patterns of air pollution emerge from the analysis of the measurements. The air quality in the center of Thessaloniki seems to be deteriorating during the late afternoon and early night hours (between 8:00 p.m. and 9:00 p.m.), a finding that can be attributed to the high mobility of people and vehicles in the area of study. In addition, similar trends in PM2.5 concentrations appear during the days with open shops in the afternoon and evening, (i.e., Saturday, Tuesday, Thursday and Friday) for similar reasons, as it has already been suggested by a previous study in the area [26].
Visualizing the collected data on maps of the city reveals many local hotspots with high levels of PM2.5. In particular, it becomes apparent that elevated levels of PM2.5 concentrations occur around traffic lights (like in the case of [1,2,3,4,10], Figure 5) and on busy streets (as reflected by [1,6,7,8,9], Figure 5) due to the sometimes stagnant or slow traffic on the road. In addition, local restaurants and shops attracting visitors in different areas can have a significant impact on air quality. This is particularly profound in the case of Navarinou Square (5), Ermou Street (8), and Pavlou Mela street (9).
On the other hand, in areas with lower accumulation of shops, restaurants, and traffic light related congestion (like Iasonidou street (12), Al. Svolou street (13), Gr. Palama and Pavlou Mela streets intersection (14), as shown in Figure 5), lower PM2.5 concentration values are observed.
Based on the clusters created (Table 4), the following outcomes may be underlined:
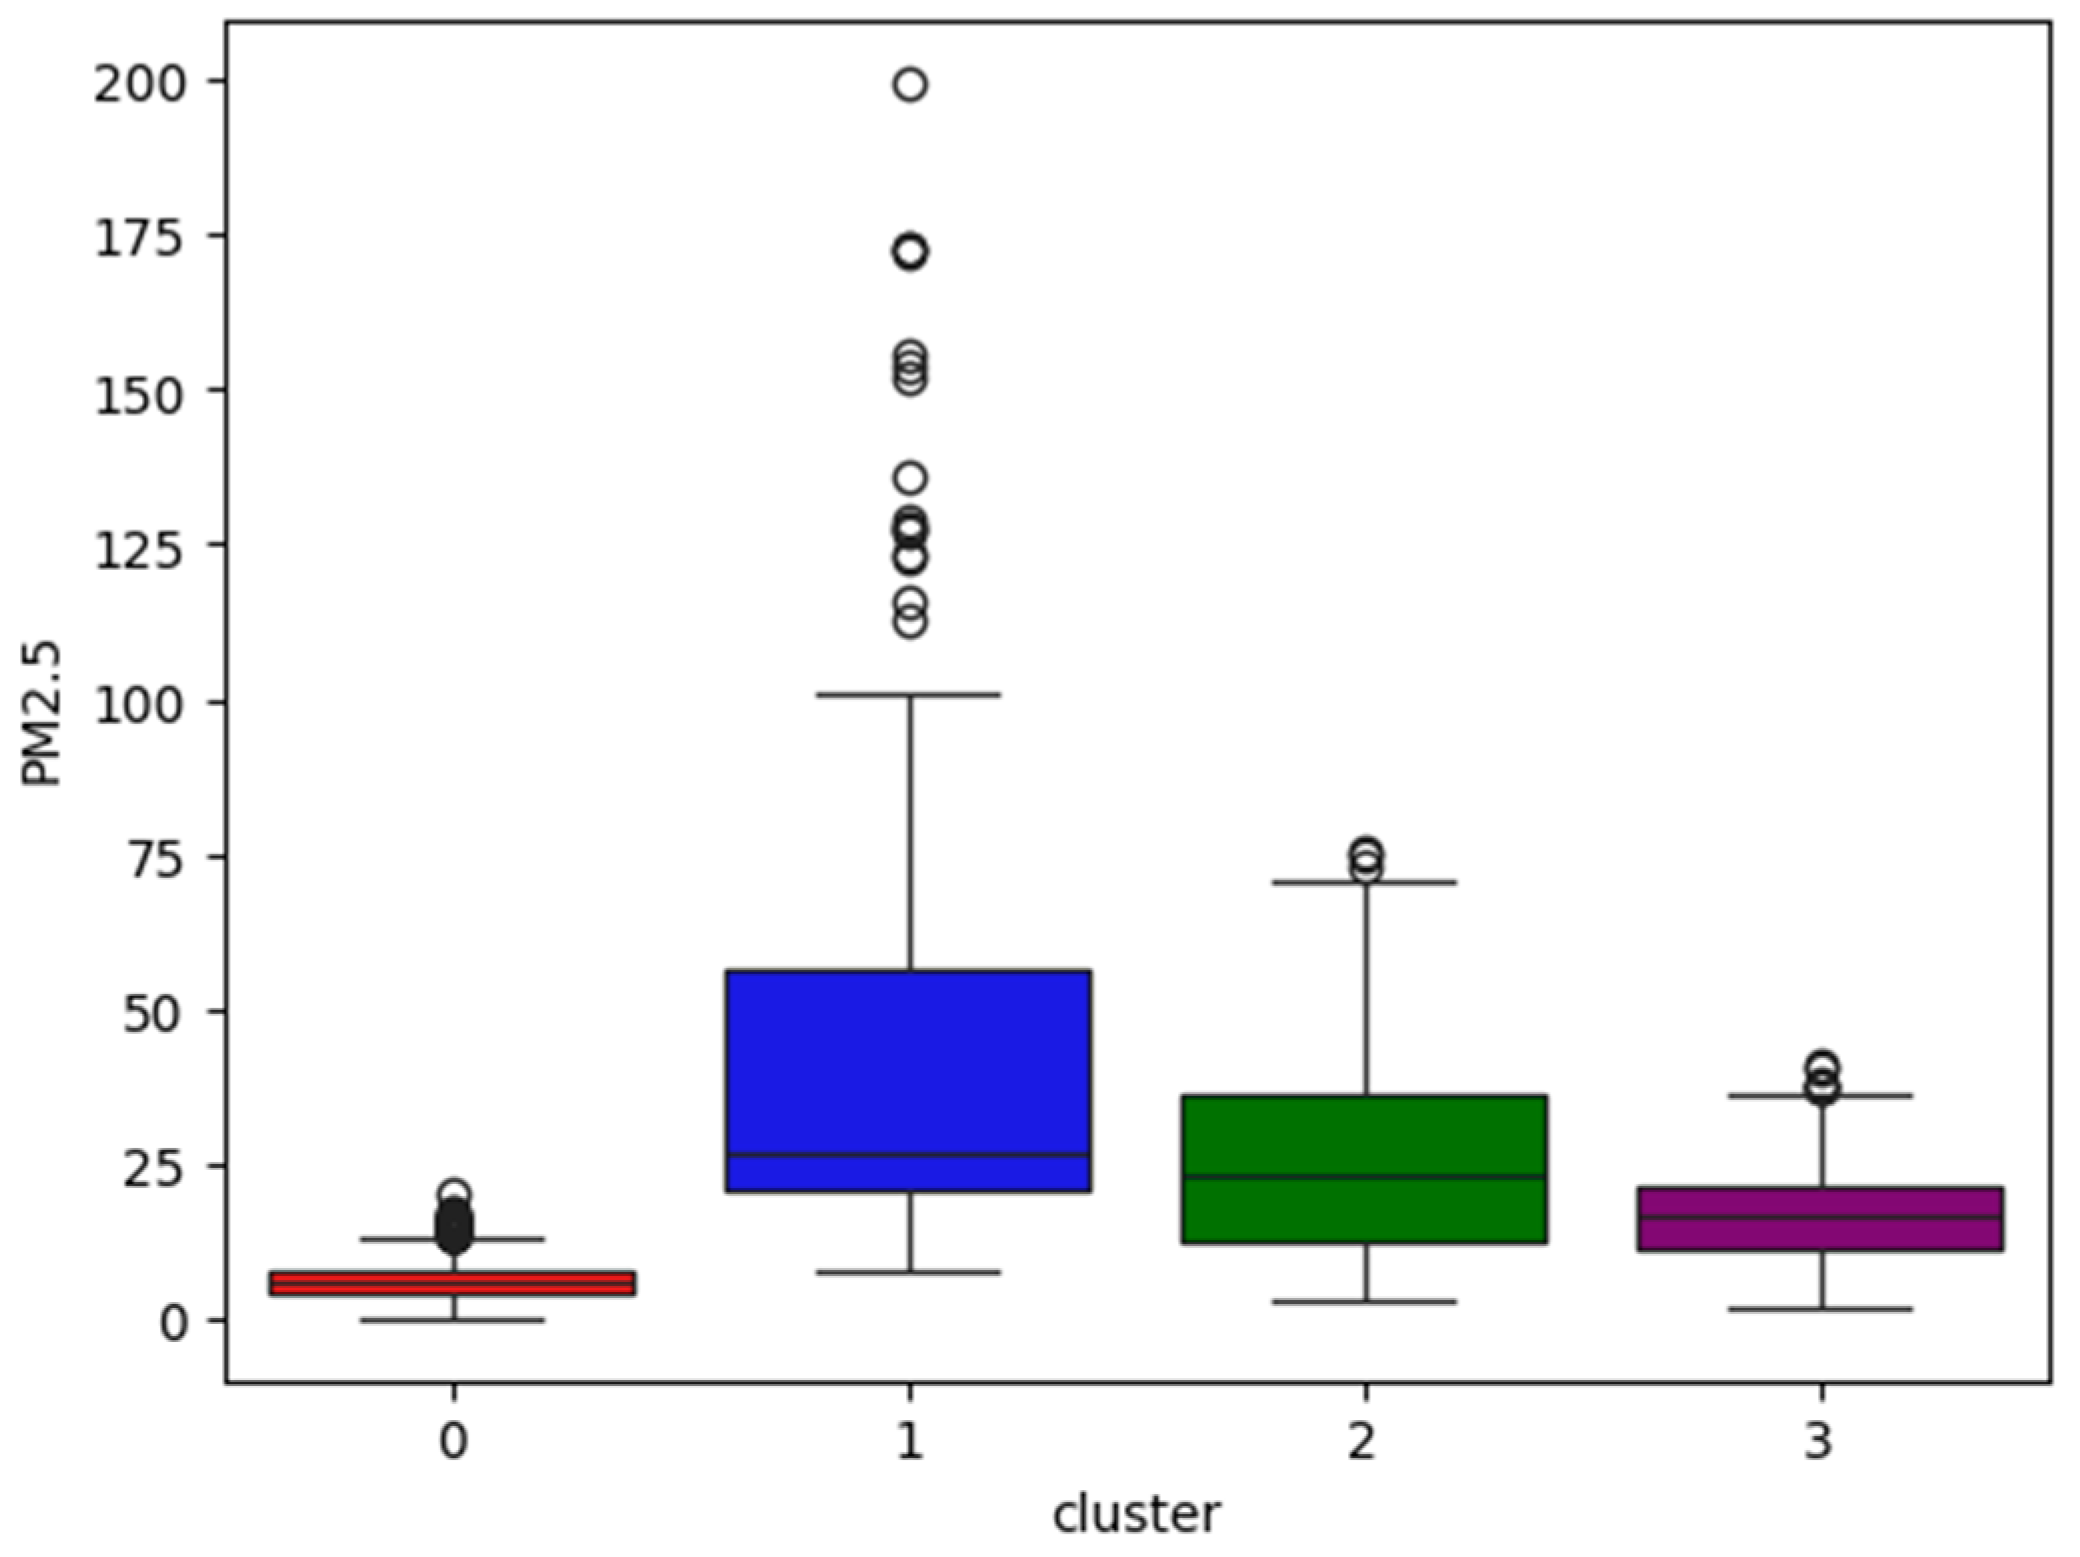
  • Cluster 0 encapsulates concentration values of PM2.5 and PM10 which are relatively the lowest (mean values of 6.3 μg/m3 and 13.4 μg/m3 respectively) accompanied by lower than the other clusters relative humidity values (59.3%) and the highest mean temperature (18.5 °C). The two measurement periods participate in a relatively balanced way in this cluster, which seems to represent the warmer and dryer measurement days of the experiment.
  • Cluster 1 contains PM2.5 and PM10 concentration values higher than the other clusters (mean values of 43.4 μg/m3 and 139.2 μg/m3 respectively). The mean relative humidity of the measurements belonging to this cluster reaches 70.2% while most of the data points belong to the colder period of the study, as reflected in the lowest mean temperature among all clusters (17 °C), and as visualized in Figure 6. Low temperatures are expected to correlate with higher emissions from household heating activities. Moreover, the high relative humidity may lead to an artificially increased concentration measurement by the optical particle counter sensor, due to the hygroscopicity of the PM.
  • Cluster 2 contains the second highest concentrations of PM2.5 and PM10 (mean values of 26 μg/m3 and 67.6 μg/m3, respectively). The relative humidity of this cluster is 67.5%, while data points of both measuring periods participate in this cluster.
  • Cluster 3 includes concentrations of PM2.5 and PM10 that are higher than those of cluster 0 (mean values of 16.5 μg/m3 and 31.1 μg/m3 respectively) and are accompanied by the highest recorded relative humidity (70.4%). Far greater participation of data points from the colder period may be found here, therefore mechanisms similar to the ones addressed for cluster 1 could also be associated with such values.
By employing clustering, four (4) regions with different characteristics were distinguished in the data set, within which common patterns in particulate matter concentrations and recorded relative humidity and temperature were identified. Each cluster can be characterized on the basis of low, median, high and extreme (or outliers cluster) values of PM, with those having their own unique temperature, humidity and especially data participation (Count) of each period. Clustering analysis indicates that the cluster with higher PM values is mostly populated by the data collected in the first period of the measurements, corresponding to the colder period of the study.
Based on the search, a limitation throughout the study was associated with the short-term duration, where sampling was about an hour each day. Additionally, various studies have demonstrated that weather conditions like wind speed, traffic speed and other environmental factors, can impact the output of low-cost PM sensors. Moreover, the size and composition of particles can also impact the accuracy of PM sensors at study sites where PM10 dominated (e.g., construction sites on the side of street).
Despite these limitations it is evident that our research differed from previous ones as it utilizes an of the shelf low-cost sensor system in a portable mode tracking and visualizing pedestrian paths coupled with PM2.5 concentration values at breathing height in the center of Thessaloniki. Furthermore, we were able to measure and compare our data with that of the fixed nodes placed around the city, and it is clearly shown that the recorded measurement can positively describe the topical variance of particulate matter within a busy city center. Finally, by using the k-means clustering method, we were able to verify the previous observations made by mapping/visualizing the data, and to explore conclusions about how particulate matter is constituted inside the urban fabric.
Future research can be the use of mobile low-cost sensors mounted on top of moving vehicles and monitoring the AQ levels in relation to the street stress on city streets. As such, we can identify how much the traffic affects the emission of particulate matter. Also, machine learning and deep learning models can be developed (for example, LSTM models), if sufficient data levels were to be achieved, that would be able to forecast the AQ data, with the less possible loss.

5. Conclusions

Air pollution shows hyper-local behavior, and mobile low-cost sensors can describe the variations in concentrations close to the sources of pollution, thanks to their high spatial and temporal resolution. This capability can provide additional information and help to better describe and understand the complex phenomenon of air pollution, leading to improved public health. The wider use of low-cost sensors can provide useful information reflecting emissions of various local sources and human activities that can affect air quality in an urban area. These can include traffic lights leading to traffic congestion, pedestrian areas with a high density of popular shops, restaurants and cafés, and many others that were not identified in the frame of the current study. Low-cost devices can overall support the creation of effective air quality monitoring and forecasting systems for city residents who are interested in better air quality.

Author Contributions

Conceptualization, K.K., E.B., T.K. and D.D.P.; methodology, all authors; software, D.D.P. and T.K.; data curation, D.D.P.; writing D.D.P.; original draft preparation, D.D.P.; writing—review and editing, D.D.P., K.K., E.B. and T.K.; visualization, D.D.P.; supervision, K.K. All authors have read and agreed to the published version of the manuscript.

Funding

This research received no external funding.

Institutional Review Board Statement

Not applicable.

Informed Consent Statement

Not applicable.

Data Availability Statement

The data are not publicly available due to privacy restrictions.

Conflicts of Interest

The authors declare no conflicts of interest.

Appendix A. Portable Low-Cost Air Quality Sensor System

Figure A1. A picture of the portable low-cost air quality sensor system used in the study.
Atmosphere 15 00965 g0a1

References

  1. Fenger, J. Urban air quality. Atmos. Environ. 1999, 33, 4877–4900. [Google Scholar] [CrossRef]
  2. WHO. WHO Releases Country Estimates on Air Pollution Exposure and Health Impact. 2016. Available online: https://www.who.int/news/item/27-09-2016-who-releases-country-estimates-on-air-pollution-exposure-and-health-impact (accessed on 2 July 2024).
  3. Wilson, J.G.; Kingham, S.; Pearce, J.; Sturman, A.P. A review of intraurban variations in particulate air pollution: Implications for epidemiological research. Atmos. Environ. 2005, 39, 6444–6462. [Google Scholar] [CrossRef]
  4. Karagulian, F.; Barbiere, M.; Kotsev, A.; Spinelle, L.; Gerboles, M.; Lagler, F.; Redon, N.; Crunaire, S.; Borowiak, A. Review of the Performance of Low-Cost Sensors for Air Quality Monitoring. Atmosphere 2019, 10, 506. [Google Scholar] [CrossRef]
  5. Castell, N.; Kobernus, M.; Liu, H.-Y.; Schneider, P.; Lahoz, W.; Berre, A.J.; Noll, J. Mobile technologies and services for environmental monitoring: The Citi-Sense-MOB approach. Urban Clim. 2015, 14, 370–382. [Google Scholar] [CrossRef]
  6. Moussiopoulos, Ν.; Vlachokostas, C.; Tsilingiridis, G.; Douros, I.; Hourdakis, E.; Naneris, C.; Sidiropoulos, C. Air quality status in Greater Thessaloniki Area and the emission reductions needed for attaining the EU air quality legislation. Sci. Total Environ. 2009, 407, 1268–1285. [Google Scholar] [CrossRef] [PubMed]
  7. Kinney, P.L.; Gichuru, M.G.; Volavka-Close, N.; Ngo, N.; Ndiba, P.K.; Law, A.; Gachanja, A.; Gaita, S.M.; Chillrud, S.N.; Sclar, E. Traffic impacts on PM2.5 air quality in Nairobi, Kenya. Environ. Sci. Policy 2011, 14, 369–378. [Google Scholar] [CrossRef] [PubMed]
  8. Kaur, S.; Nieuwenhuijsen, M.J.; Colvile, R.N. Fine particulate matter and carbon monoxide exposure concentrations in urban street transport microenvironments. Atmos. Environ. 2007, 41, 4781–4810. [Google Scholar] [CrossRef]
  9. Progiou, A.; Liora, N.; Sebos, I.; Chatzimichail, C.; Melas, D. Measures and Policies for Reducing PM Exceedances through the Use of Air Quality Modeling: The Case of Thessaloniki, Greece. Sustainability 2023, 15, 930. [Google Scholar] [CrossRef]
  10. Tiwari, S.; Srivastava, A.K.; Bisht, D.S.; Parmita, P.; Srivastava, M.K.; Attri, S.D. Diurnal and seasonal variations of black carbon and PM2.5 over New Delhi, India: Influence of meteorology. Atmos. Res. 2013, 125–126, 50–62. [Google Scholar] [CrossRef]
  11. Russell, H.S.; Kappelt, N.; Fessa, D.; Frederickson, L.B.; Bagkis, E.; Apostolidis, P.; Karatzas, K.; Schmidt, J.A.; Hertel, O.; Johnson, M.S. Particulate air pollution in the Copenhagen metro part 2: Low-cost sensors and micro-environment classification. Environ. Int. 2022, 170, 107645. [Google Scholar] [CrossRef]
  12. Gozzi, F.; Della Ventura, G.; Marcelli, A. Mobile monitoring of particulate matter: State of art and perspectives. Atmos. Pollut. Res. 2016, 7, 228–234. [Google Scholar] [CrossRef]
  13. Wang, A.; Paul, S.; deSouza, P.; Machida, Y.; Mora, S.; Duarte, F.; Ratti, C. Key Themes, Trends, and Drivers of Mobile Ambient Air Quality Monitoring: A Systematic Review and Meta-Analysis. Environ. Sci. Technol. 2023, 57, 9427–9444. [Google Scholar] [CrossRef] [PubMed]
  14. Bagkis, E.; Kassandros, T.; Karatzas, K. Learning calibration functions on the fly: Hybrid batch online stacking ensembles for the calibration of low-cost air quality sensor networks in the presence of concept drift. Atmosphere 2022, 13, 416. [Google Scholar] [CrossRef]
  15. Zhu, C.; Fu, Z.; Liu, L.; Shi, X.; Li, Y. Health risk assessment of PM2.5 on walking trips. Sci. Rep. 2021, 11, 19249. [Google Scholar] [CrossRef] [PubMed]
  16. Fameli, K.-M.; Moustris, K.; Spyropoulos, G.; Rodanas, D.-M. Exposure to PM2.5 on Public Transport: Guidance for Field Measurements with Low-Cost Sensors. Atmosphere 2024, 15, 330. [Google Scholar] [CrossRef]
  17. Aix, M.-L.; Claitte, M.; Bicout, D.J. A Low-Cost Sensors Study Measuring Exposure to Particulate Matter in Mobility Situations. In Proceedings of the 12th International Conference on Sensor Networks SENSORNETS 2023, Lisbon, Portugal, 23–24 February 2023; SCITEPRESS-Science and Technology Publications: Setúbal, Portugal, 2023. [Google Scholar]
  18. Ramel-Delobel, M.; Peruzzi, C.; Coudon, T.; De Vito, S.; Fattoruso, G.; Praud, D.; Fervers, B.; Salizzoni, P. Exposure to airborne particulate matter during commuting using portable sensors: Effects of transport modes in a French metropolis study case. J. Environ. Manag. 2024, 365, 121400. [Google Scholar] [CrossRef] [PubMed]
  19. Kassandros, T.; Gavros, A.; Bakousi, K.; Karatzas, K. Citizens in the loop for air quality monitoring in Thessaloniki, Greece. In Advances and New Trends in Environmental Informatics: Digital Twins for Sustainability; Springer: Berlin/Heidelberg, Germany, 2021. [Google Scholar]
  20. Pope, F.D.; Gatari, M.; Ng’ang’a, D.; Poynter, A.; Blake, R. Airborne particulate matter monitoring in Kenya using calibrated low-cost sensors. Atmos. Chem. Phys. 2018, 18, 15403–15418. [Google Scholar] [CrossRef]
  21. White, A.J.; Keller, J.P.; Zhao, S.; Carroll, R.; Kaufman, J.D.; Sandler, D.P. Air Pollution, Clustering of Particulate Matter Components, and Breast Cancer in the Sister Study: A U.S.-Wide Cohort. Environ. Health Perspect. 2019, 127, 107002. [Google Scholar] [CrossRef]
  22. Ahn, H.; Lee, J.; Hong, A. Urban form and air pollution: Clustering patterns of urban form factors related to particulate matter in Seoul, Korea. Sustain. Cities Soc. 2022, 81, 103859. [Google Scholar] [CrossRef]
  23. Symeonidis, P.; Mitropoulos, P.; Taskaris, S.; Vakkas, T.; Adamopoulou, E.; Karakirios, D.; Salamalikis, V.; Kosmopoulos, G.; Kazantzidis, A. ThermiAir: An innovative air quality monitoring system for airborne particulate matter in Thermi, Greece. In Proceedings of the 13th International Conference on Theory and Practice of Electronic Governance, Athens Greece, 23–25 September 2020; Association for Computing Machinery: Athens, Greece, 2020; pp. 775–778. [Google Scholar]
  24. Ahmed, M.; Seraj, R.; Islam, S.M.S. The k-means Algorithm: A Comprehensive Survey and Performance Evaluation. Electronics 2020, 9, 1295. [Google Scholar] [CrossRef]
  25. Bholowalia, P.; Kumar, A. EBK-means: A clustering technique based on elbow method and k-means in WSN. Int. J. Comput. Appl. 2014, 105, 17–24. [Google Scholar] [CrossRef]
  26. Athanasakis, E.; Kassandros, T.; Karatzas, K. Investigation of traffic and air pollution in Thessaloniki, Greece, under ordinary and COVID-19 pandemic conditions. In Environmental Informatics. New Perspectives in Environmental Information Systems: Transport, Sensors, Recycling. Adjunct Proceedings of the 34th Edition of the EnviroInfo Conference (Nicosia, Cyprus, 23–24 September 2020); Kamilaris, A., Wohlgemuth, V., Karatzas, K., Athanasiadis, I., Eds.; Shaker Verlang: Kassel, Germany, 2020; pp. 84–92. ISBN 978-3-8440-7628-8. [Google Scholar]
Figure 1. Configuration of the overall AQ sensor system.
Atmosphere 15 00965 g001
Figure 2. Routes carried out: (a) Western Section of the Center—Mitropoleos Front; (b) Western Section of the Center—Tsimiski Front; (c) Western Part of the Center—Coastal front; (d) Eastern Section of the Center—Tsimiski Front; (e) Eastern Section of the Center—Mitropoleos Front; (f) Eastern section of the Center—Coastal front. The thick dashed line indicates the Agias Sofias street axis, separating the western from the eastern section of the city center.
Atmosphere 15 00965 g002
Figure 3. Comparison of recorded PM2.5 and PM10 concentrations (in μg/m3) from the low-cost portable AQ sensor and from the KASTOM nodes at: (a) the experimental school; (b) Agia Sofia (close to Tsimiski street); (c) Kapani market. Date is indicated in numerical format as year-month-day.
Atmosphere 15 00965 g003
Figure 4. Map of the (a) mean values and (b) standard deviations (over the measurement period) of PM2.5 concentrations within the monitored area (in μg/m3).
Atmosphere 15 00965 g004
Figure 5. Map of the five highest concentrations of PM2.5 for each day of measurements. (1) Egnatia and Agias Sofia street intersection; (2) Egnatia and Aristotle Road intersection; (3) Dimitriou Gounari street; (4) Tsimiski and Agias Sofia street intersection; (5) Navarinou Square; (6) Nikis Avenue; (7) Eleftheriou Venizelou street; (8) Ermou street; (9) Pavlou Mela street; (10) Agiou Dimitriou and Agias Sofias street intersection; (11) Agias Sofias and Filippou street intersection; (12) Iasonidou street; (13) Al. Svolou street; (14) Gr. Palama and Pavlou Mela streets intersection. (Map data copyrighted OpenStreetMap contributors and available from https://www.openstreetmap.org, assessed on 2 July 2024).
Atmosphere 15 00965 g005
Figure 6. Box plot of clusters and the PM2.5 concentration values they contain (in μg/m3). The horizontal line in the box area corresponds to the median value, while the box height corresponds to the 50% concentration value range (25% up to 75%).
Atmosphere 15 00965 g006
Figure 7. Visualization of the measurement locations belonging to each cluster. (a): data collected during the warmer period; (b) data collected during the colder period.
Atmosphere 15 00965 g007
Table 1. Statistical analysis of the quarter-hourly concentrations of PM concentration values (in μg/m3). Count refers to the number of samples per period.
TimePM2.5 MeanPM2.5 StdPM10 MeanPM10 StdCount
18:15:006.22.213.23.778
18:30:007.86.414.78.6163
18:45:007.64.314.66.2169
19:00:009.09.322.623.0968
19:15:0010.78.124.121.72037
19:30:009.98.122.121.52754
19:45:0010.412.021.922.22798
20:00:0011.411.623.218.61846
20:15:0012.4 8.924.113.71053
20:30:0013.212.728.821.8352
20:45:0015.6 9.728.513.1208
21:00:0021.6 6.935.511.9153
Table 2. Statistical analysis of the concentrations of particulate matter values (in μg/m3) per day of the week during the measurement period.
Day of WeekPM2.5 MeanPM2.5 StdPM10 MeanPM10 Std
Monday8.09.316.812.9
Tuesday11.97.425.817.8
Wednesday7.87.016.413.1
Thursday10.78.821.114.6
Friday11.79.623.114.8
Saturday15.113.431.830.8
Sunday9.810.325.225.0
Table 3. Statistical analysis of particulate matter concentration (jn μg/m3) and temperature (in °C) by time period.
PM2.5PM10TEMP
Before 9 April 2023Mean12.525.116.8
STD10.623.22.4
After 24 April 2023Mean8.820.620.2
STD8.916.71.9
Table 4. Table of average measurement values for each cluster. Concentrations are expressed in μg/m3. Count a (b) includes the data points that were collected during the warmer (colder) period participated in each cluster.
ClusterPM10PM2.5TEMP (°C)HUM(%)CountCount aCount b
013.46.318.559.3812043683752
1139.243.417.070.217634142
267.626.018.167.5598238360
331.116.518.370.4368913132376
Disclaimer/Publisher’s Note: The statements, opinions and data contained in all publications are solely those of the individual author(s) and contributor(s) and not of MDPI and/or the editor(s). MDPI and/or the editor(s) disclaim responsibility for any injury to people or property resulting from any ideas, methods, instructions or products referred to in the content.

