Article

Projection of Extreme Summer Precipitation over Hubei Province in the 21st Century

1
Collaborative Innovation Center on Forecast and Evaluation of Meteorological Disasters, Key Laboratory for Aerosol-Cloud-Precipitation of the China Meteorological Administration, Nanjing University of Information Science and Technology, Nanjing 210044, China
2
School of Atmospheric Sciences, Nanjing University of Information Science and Technology, Nanjing 210044, China
3
Sudan Meteorological Authority (SMA), Khartoum P.O. Box 574, Sudan
4
School of Geographical Sciences, Nanjing University of Information Science and Technology, Nanjing 210044, China
5
Department of Astronomy and Meteorology, Faculty of Science and Technology, Omdurman Islamic University, Oumdurman 14415, Sudan
*
Author to whom correspondence should be addressed.
Atmosphere 2024, 15(8), 983; https://doi.org/10.3390/atmos15080983
Submission received: 7 July 2024 / Revised: 7 August 2024 / Accepted: 11 August 2024 / Published: 16 August 2024
(This article belongs to the Special Issue Extreme Weather Events in a Warming Climate)

Abstract

:
The link between the escalation of global warming and the increase in extreme precipitation events necessitates a deeper understanding of future trends. This study focused on the dynamics of extreme rainfall in Hubei Province throughout the 21st century, a region already sensitive to climatic shifts and extreme weather occurrences. Using the high-resolution global climate model RegCM4 driven by another high-resolution model, HadGEM2-ES, and based on the representative concentration pathway (RCP8.5) emissions scenario, this research predicted the changes in rainfall patterns in Hubei Province during the summer of the 21st century. The accuracy of the adjusted model was confirmed through the use of five extreme rainfall indices (EPIs), namely maximum 5-day amount of precipitation (RX5day), number of heavy rain days (R10), the simple daily intensity index (SDII), consecutive dry days (CDD), and consecutive wet days (CWD), that measured the intensity and frequency of such events. In particular, excluding the index for continuous dry days (CDD), there was an anticipated increase in extreme rainfall during the summer in the mid-21st century. The number of heavy rain days (R10mm) increased significantly (p < 0.05) in the southeastern parts, especially for Wuhan, Xiantao, Qianjiang, Jinzhou, and Ezhou. The EPI values were higher in southeastern Hubei. Consequently, areas such as Wuhan, Xiantao, and Qianjiang in Hubei Province are projected to face more frequent and severe extreme rainfall episodes as the century progresses.

1. Introduction

The environment and human life are now at risk due to climate change, which has caused widespread alarm in recent times. Climate change has become a threat to people’s lives and property and has been linked to increased disasters [1]. Extreme rainfall is considered a double-edged sword, as it can lead to the stagnation of dams and rivers and, on the other hand, causes numerous floods at global and regional levels. Given the impact of extreme climate events on society, it is crucial to conduct in-depth investigations to understand the long-term fluctuations and the factors that contribute to fluctuations in exceptional precipitation levels in historical and future periods [2,3].
Reports from the Intergovernmental Panel on Climate Change (IPCC) have indicated that severe impacts on ecosystems, people, settlements, and infrastructure have significantly increased with the frequency and intensity of extreme weather and climate events [4]. The rises in extreme rainfall rates and the occurrence of extreme precipitation are likely to increase in the future as the average global temperature continues to rise [5,6,7,8,9]. The precipitation trend tends to exhibit varying patterns across China, with increases observed in winter and summer in the majority of areas, while significant decreases are observed in autumn in many regions of central and eastern China [10]. Zhai et al. [8] found that precipitation extremes trends differed from one season to another in eastern China. The summer precipitation trend is very similar to that of annual totals. Spring precipitation has increased in southern northeast China and north China but decreased significantly in the mid-reaches of the Yangtze River. Autumn precipitation has generally decreased throughout eastern China. In winter, precipitation has significantly decreased over the northern part of eastern China but increased in the south. Chen et al. [9] suggested that annual rainfall in China will increase by the end of the 21st century compared with current levels.
Recent research has indicated that recurrent droughts are caused by climate variability, leading to changes in the intensity and frequency of precipitation at regional and local levels [11]. Models’ outputs can be used to investigate the changes in extreme precipitation in the future, such as simulations from the RegCM4 model. Previous studies indicated that RegCM4 can accurately replicate China’s spatial distribution of extreme climate events [12,13], and performs well in climate predictions, illustrating the interannual variability in China’s river basins and demonstrating improved summer performance [14].
The extreme precipitation indices may exhibit distinct variations across various regions [15]. Although many studies have investigated the spatial–temporal variations in extreme precipitation over different regions [16,17], few studies have focused on extreme precipitation and its impacts under future scenarios in Hubei Province, China [18,19]. Hubei Province is highly susceptible to changes in climate and has already experienced severe weather incidents, with extreme precipitation events mainly occurring in spring and summer [20]. Using extreme precipitation indices (EPIs), this study looked at how the characteristics of extreme precipitation in Hubei Province will change over time in the 21st century under the RCP8.5 scenario, due to its alignment with high greenhouse gas emissions scenarios and its representation of the upper limit of the representative concentration pathways (RCPs) [21].
This study’s objectives were (1) to evaluate the efficiency of the model in simulating precipitation over Hubei Province, (2) to analyze the spatial–temporal changes in the annual extreme precipitation indices in Hubei Province through the reference period (1979–2005), and (3) to analyze the spatial–temporal changes in the extreme precipitation indices in summer within Hubei Province through the mid-21st century and late 21st century.

2. Study Area

Hubei Province is located at the center of the Yangtze River in central China. The province is known for its plentiful natural resources, varied mountainous landscapes, and diverse terrain. The climate of the region is characterized by a subtropical monsoon zone, which experiences an average annual rainfall of 800–1600 mm. Most of this precipitation occurs during the rainy season, which lasts from mid-June to mid-July [22]. The landform of Hubei Province represents an incomplete watershed with three high sides, a middle depression opening to the south, and a gap to the north [23]. The Dabie and Wudang Mountains in north Hubei are also considered to be among the natural landscapes of the province [24]. Figure 1 shows the location of Hubei Province.

3. Data and Methods

3.1. Reanalysis of ERA5 Datasets

ERA5, the fifth-generation reanalysis data created by the European Center for Medium-Range Weather Forecasts (ECMWF) [25], were used in this study as reference data. The quality of the input data in ERA5 has been significantly enhanced compared with its earlier versions [26]. It has also effectively captured the annual and seasonal patterns of precipitation over several parts of China, with continuous updates to the present day. The spanning period has been covered since 1979, and some versions have been extended to 1950 [27]. Because of its good performance in representing actual rainfall observations in different climatic zones around the globe [28,29], we used ERA5 as reference data to evaluate the historical extremes in precipitation for a simulation of a climate model and adjusted future projections in this study. A daily precipitation dataset with a spatial resolution of 0.25° × 0.25° latitude/longitude covering the period from 1979 to 2005 was utilized to evaluate the model’s performance in simulating rainfall over Hubei Province in China. The grid dataset is freely available at https://cds.climate.copernicus.eu/cdsapp#!/dataset/reanalysis-era5-single-levels (Accessed on 15 October 2023).

3.2. The Reginal Climate Model (RegCM)

To assess future changes in extreme precipitation in Hubei, we relied on RegCM4, a model developed by the Abdus Salam International Centre for Theoretical Physics (ICTP) during the specified timeframe of 1979–2005. Established at the National Center for Atmospheric Research (NCAR), the regional climate model system is formally referred to as RegCM. Furthermore, it has been modified to accurately represent the specific weather patterns of Hubei Province, leading to the development of precise predictions regarding climate change at a local level. The regional model RegCM4, designed for specific areas, utilized the initial and lateral boundary conditions from HadGEM2-ES, the Earth system model used by the Met Office Hadley Centre for CMIP5 20th century simulations.
As mentioned in the study of Giorgi et al. [30], RegCM4 is the latest version compared with previous versions. Recently, a large research community has made significant enhancements to its structure, and additional modern physical parameters have been developed. It can be readily implemented in any geographical area worldwide, exhibiting varying levels of precision across a diverse array of research disciplines. The model was run using a grid spacing of 0.25° × 0.25° (latitude by longitude) throughout CORDEX-EA (East Asia), including continental China and centered at (35° N, 115° E). The study utilized the annual mean precipitation calculated for the simulated RegCMs using both the corrected and raw data from the historical period from 1979 to 2005 and a two-period bias correction for future precipitation. According to the IPCC Fifth Assessment Report (AR5), the analysis was performed for the mid-21st century (2046–2065) and the late 21st century (2078–2097) (i.e., the far future). To verify the performance of the model and to obtain high accuracy, a bias correction process was used for the simulated RegCMs using both the corrected and raw data from the historical period for reference data and two-period bias correction for future precipitation. the software used is ArcMap (version 10.4.1), which is a popular GIS software that enables users to generate, modify, and assess geospatial data.
The bias correction technique was carried out, utilizing the quantile mapping technique, which is particularly efficient in correcting outliers, applying this method to both observed and simulated data. This approach involves mapping the simulated data onto the observed data based on the cumulative probability distribution, as described in detail by Park et al. [31].

3.3. Climate Indices

EPIs were constructed using the Joint WMO Expert Group on Climate Change Detection and Indices (CCl/CLIVAR/JCOMM) (http://etccdi.pacificclimate.org/) (Accessed on 10 November 2023). This is a collection of indicators consisting mainly of data on rainfall extremes, as they allow for the assessment of various aspects related to the variations in the strength, occurrence rate, and length of severe occurrences and have been extensively used in different research investigations [32].
We determined the specific values of the absolute indices based on a fixed threshold for the recorded rainfall. We used five different EPIs in this study, including the maximum 5-day amount of precipitation (RX5day), the number of heavy rain days (R10), consecutive wet days (CWD), consecutive dry days (CDD), and a simple daily intensity index (SDII), to capture various aspects of the extreme precipitation events in Hubei Province. Table 1 provides a summary of each index. All meteorological indices evaluate either the severity or frequency of precipitation; however, the CDD index measures the duration of dry spells.

3.4. Methods of Analysis

In this study, the correlation coefficient was used to evaluate the reliability of the rainfall data. It was necessary to evaluate both the model’s outputs and the precipitation data from the ERA5 reanalysis. For this purpose, CC was used to evaluate the degree of linear correlation between the model’s outputs and reanalyzed data. When the CC is 1 or close to 1, it indicates a strong correlation between the model outputs and ERA5 data.
CC = n = 1 n G i G ¯ S i S ¯ n = 1 n G i G ¯ 2 n = 1 1 S i S ¯ 2 ,
Moreover, the root mean square error (RMSE) method was applied to assess the overall accuracy and error level of the rainfall products from the model’s outputs compared with the ERA5 reanalyzed data.
RMSE = 1 N n = 1 N S n S n 2
The Mann–Kendall (MK) test was used to analyze the significance of the trend in the time series of EPIs for the three periods: the reference period (1979–2005), the mid-21st century (2046–2065), and the late 21st century (2078–2097). The World Meteorological Organization has suggested this approach for analyzing trends in specific time series [33]. The purpose of the analysis was to demonstrate the statistical significance of upward and downward trends. The strength of this method depends on the amount, size, and variability of the data being analyzed, as well as the magnitude of the data.

4. Results

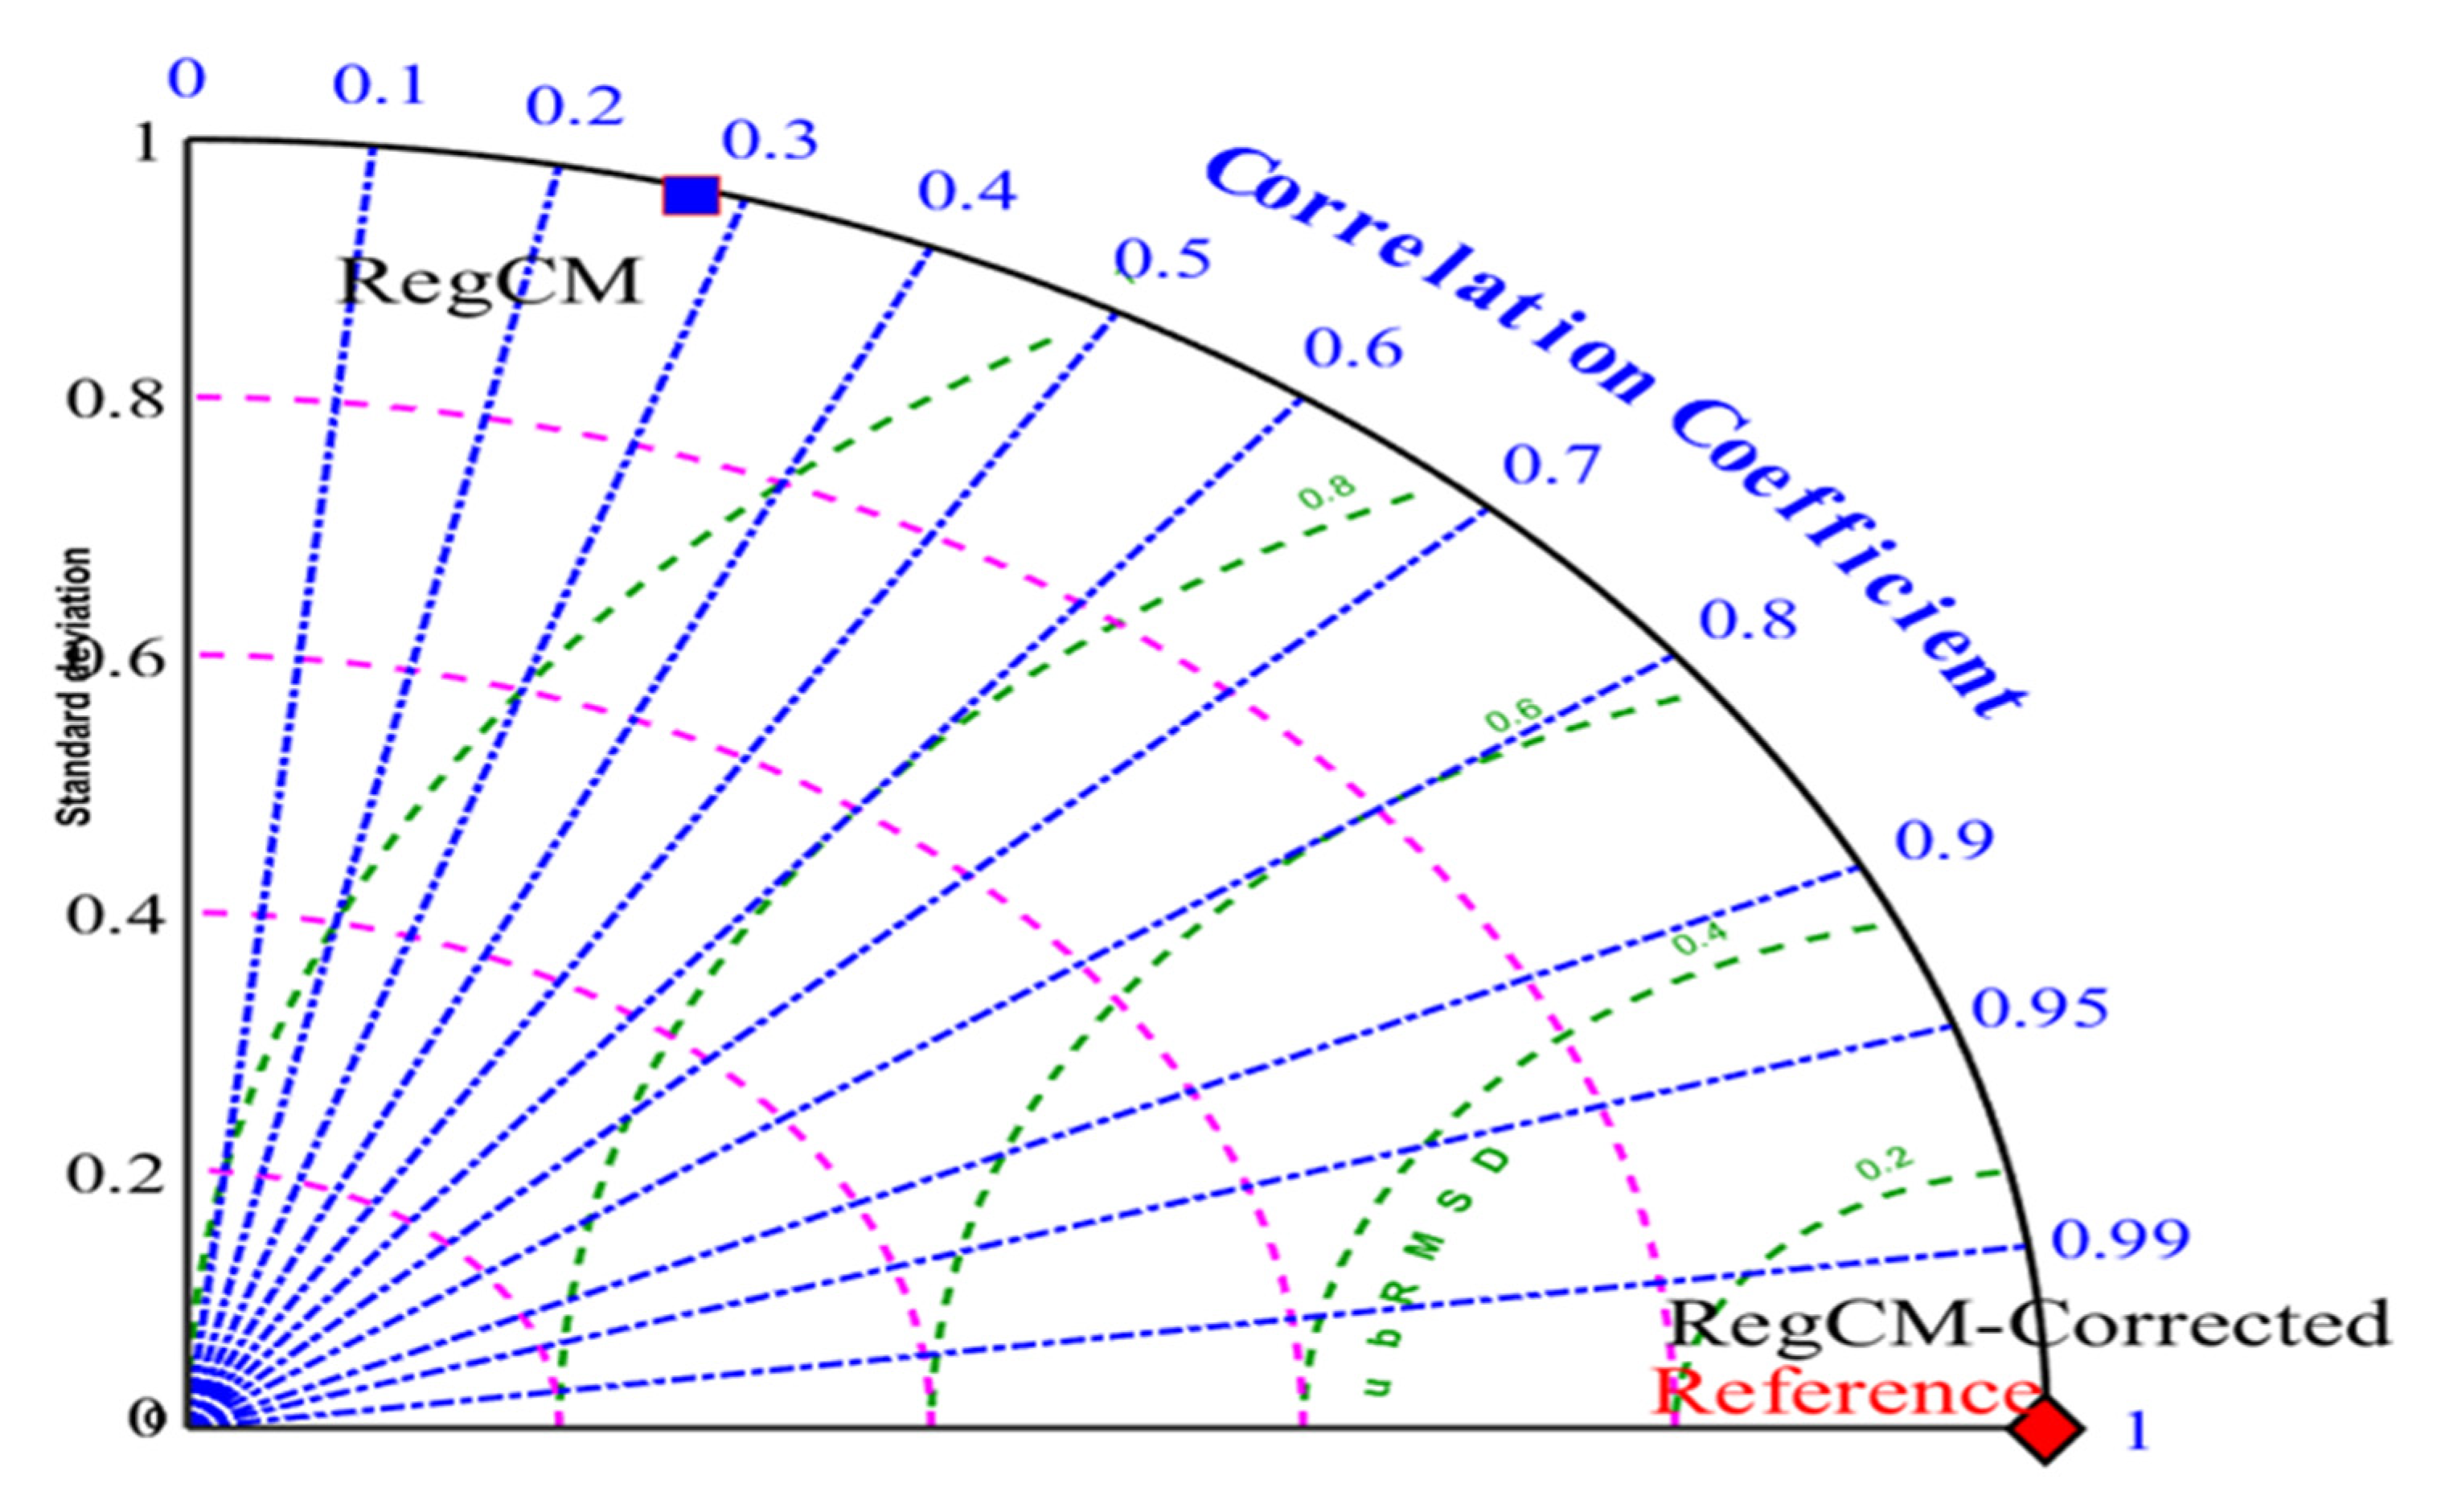
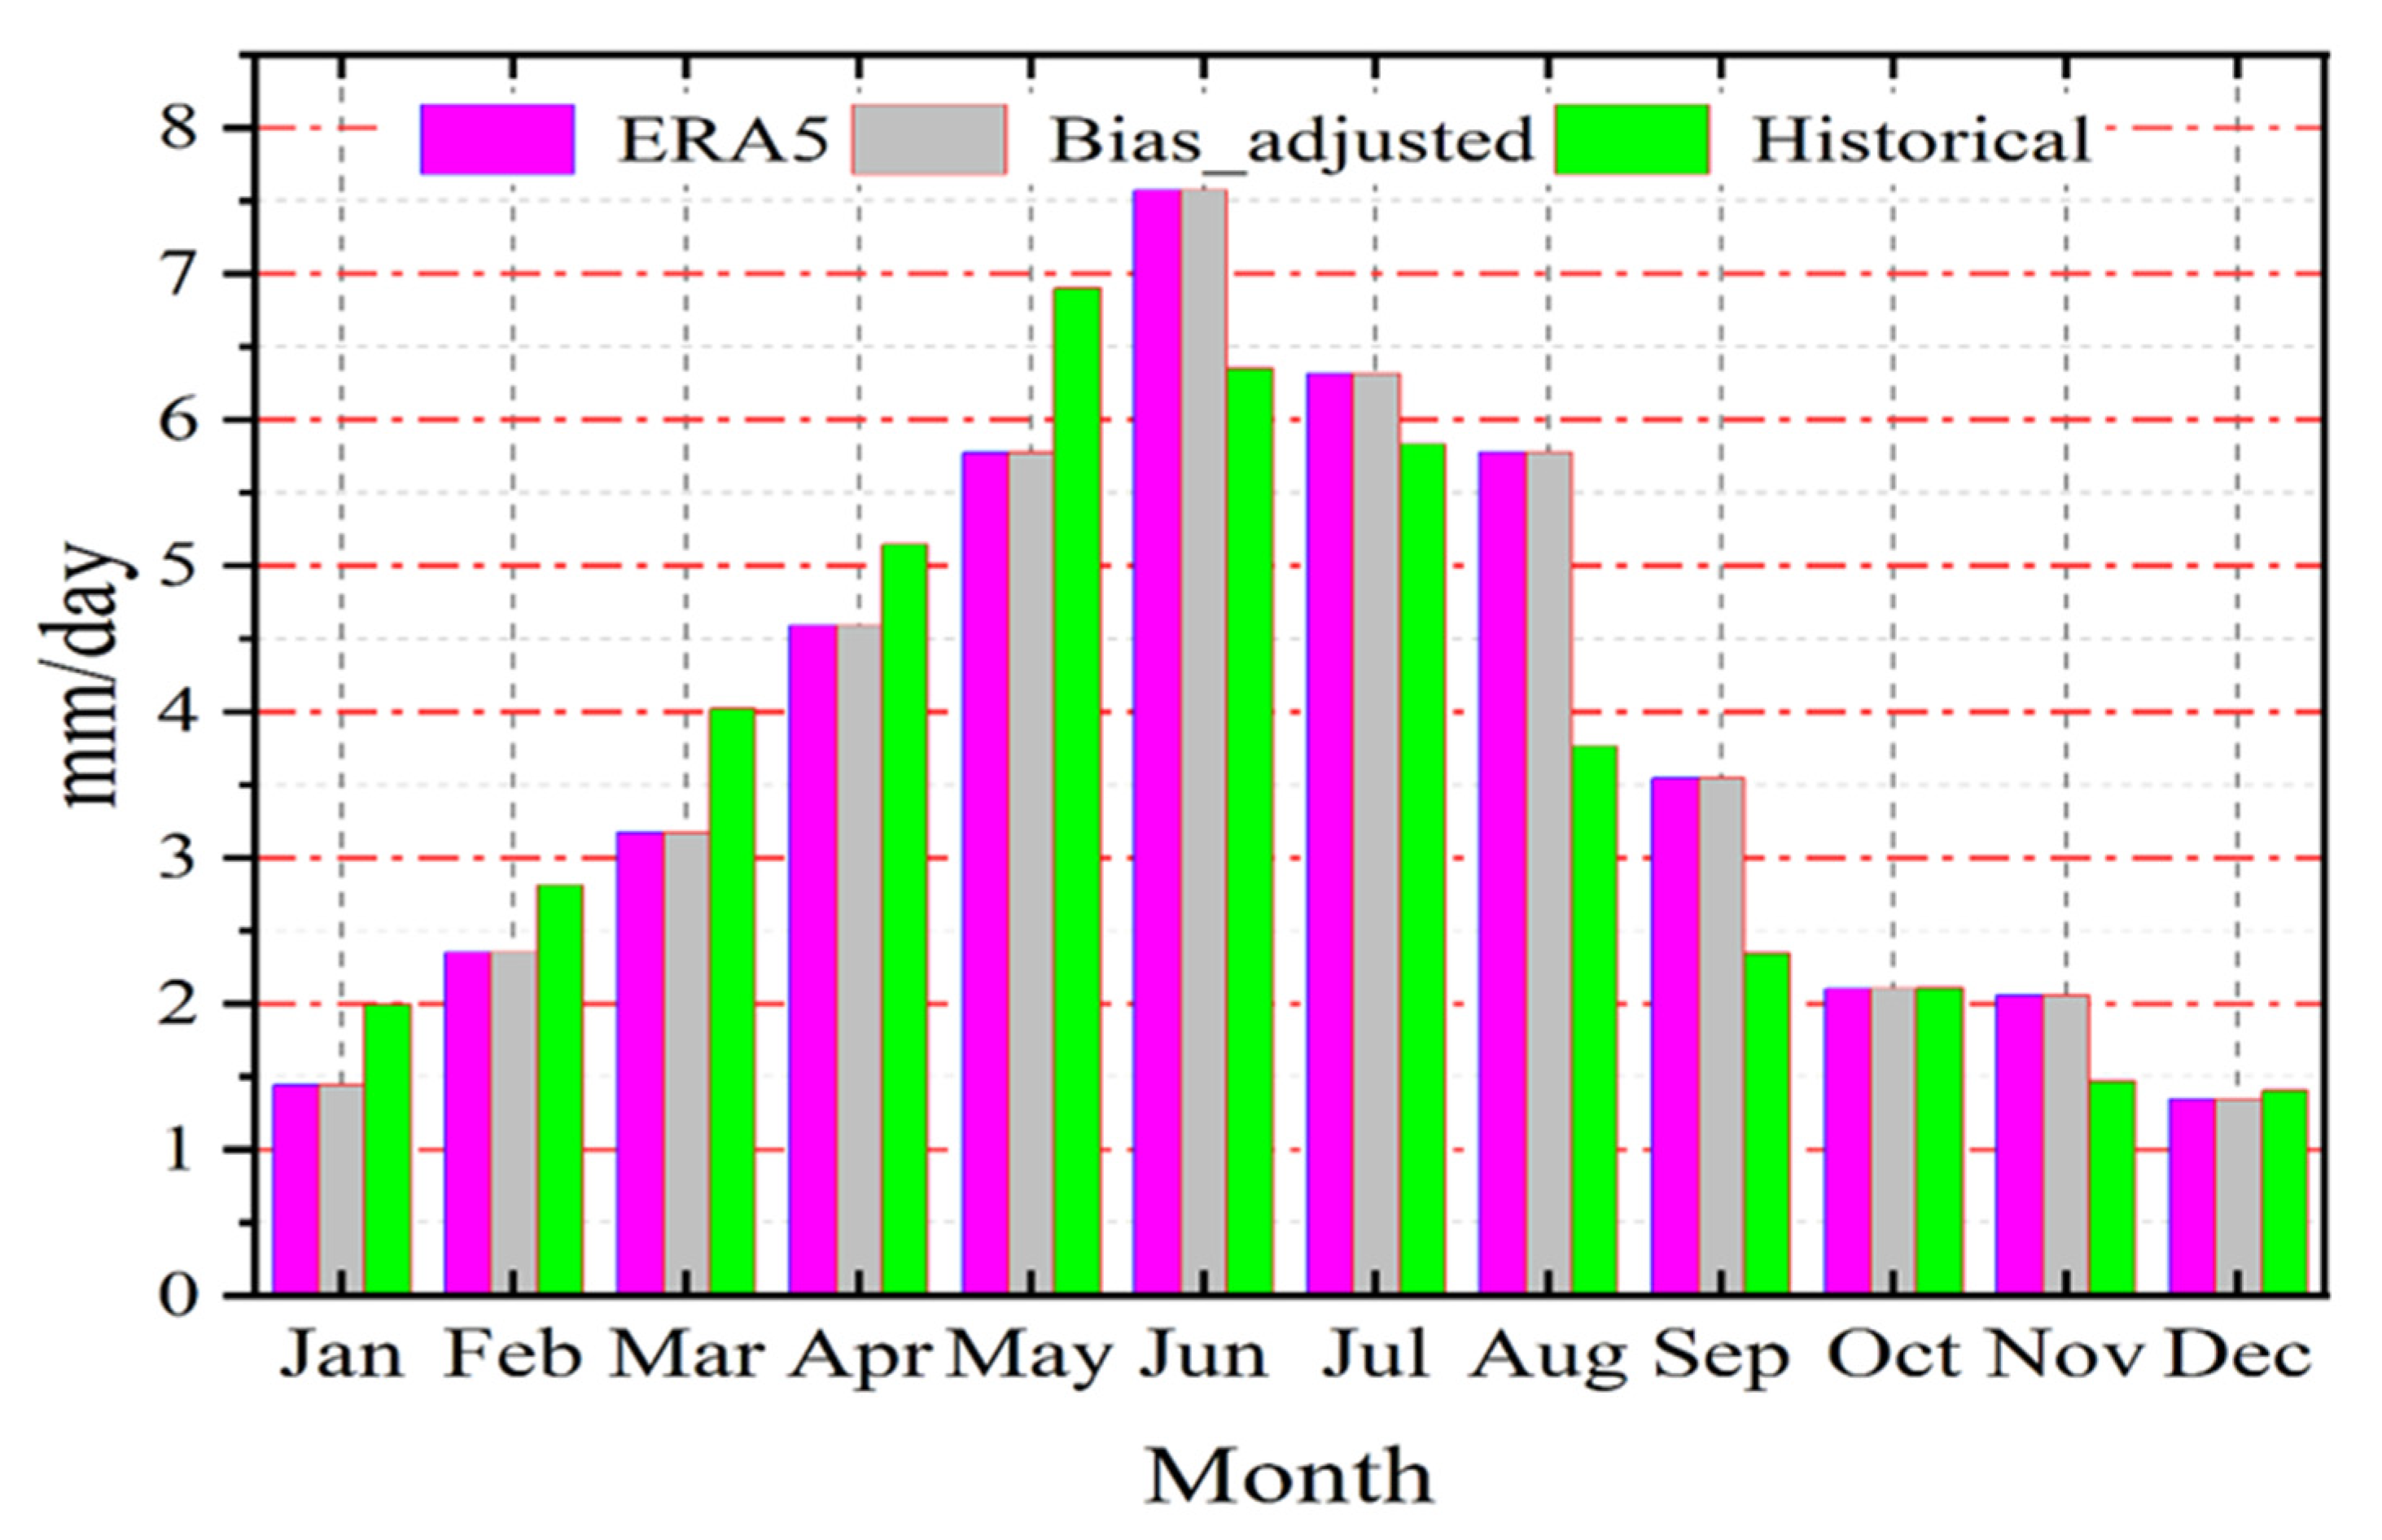
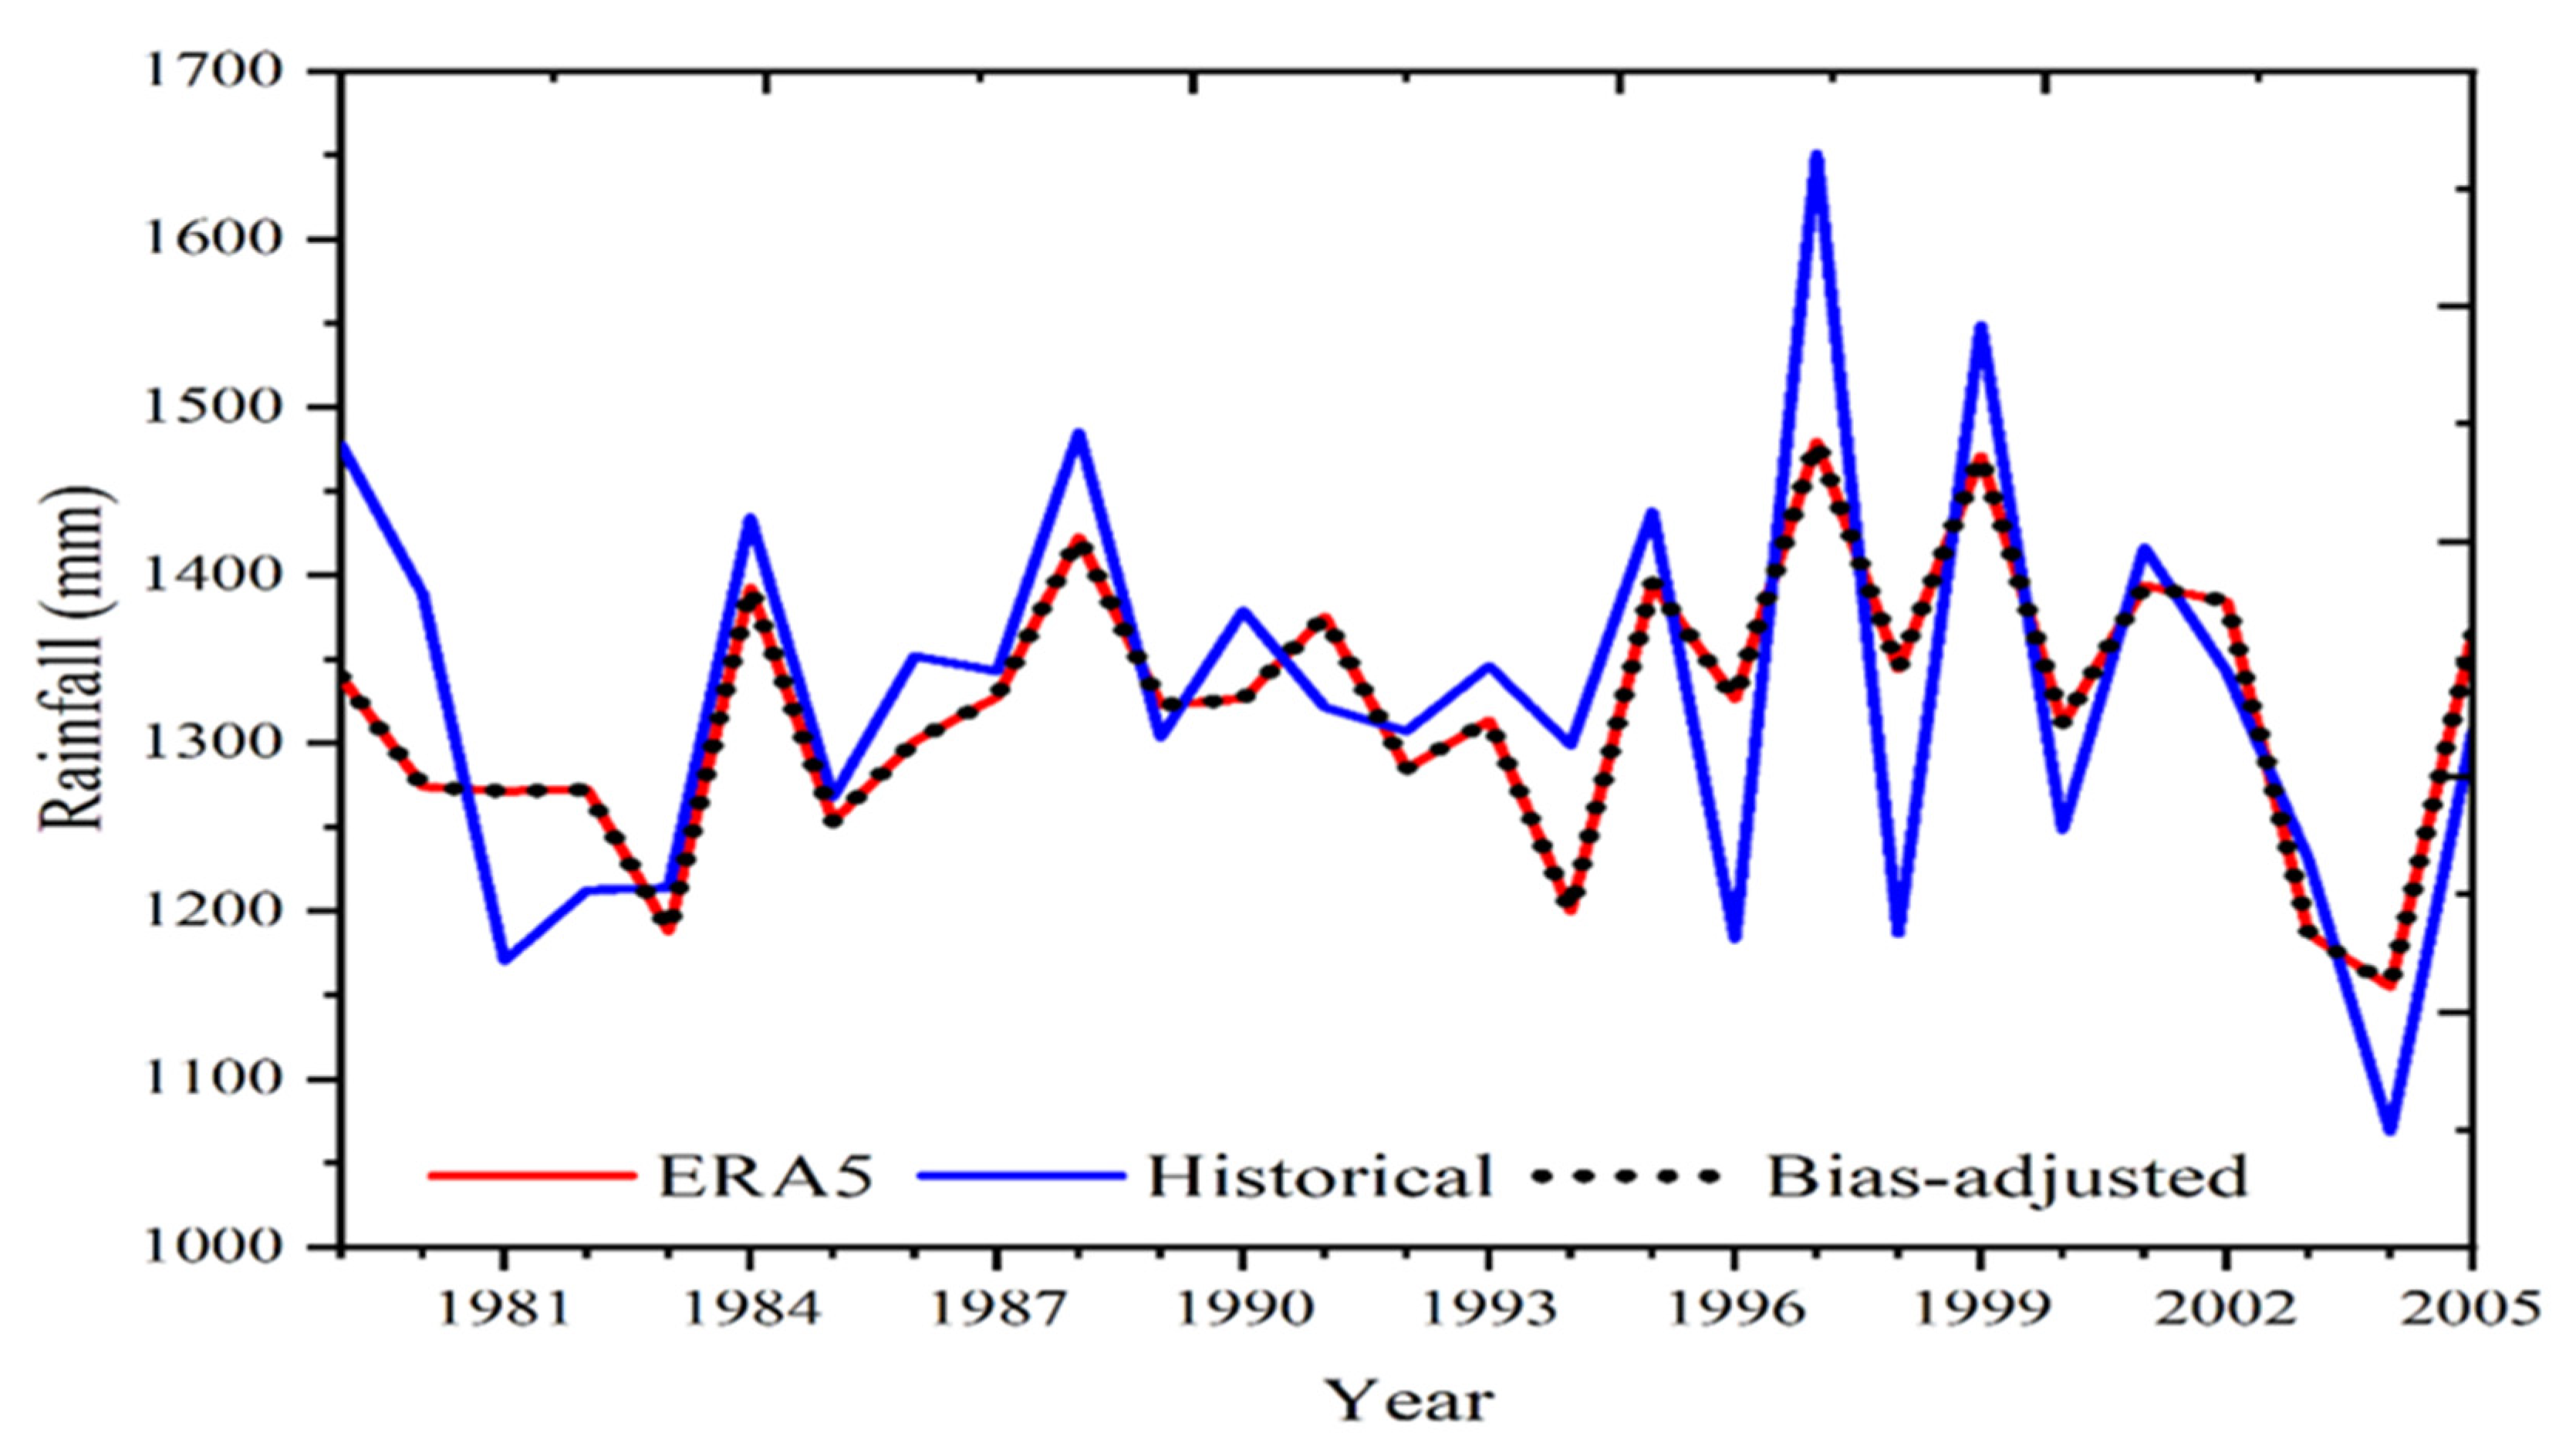
4.1. Validation of the Model Simulation and ERA5

Initially, we assessed the model’s accuracy in predicting precipitation patterns in Hubei Province by comparing the mean simulated annual precipitation with the corresponding observed data from 1979 to 2005. We used several statistical tests (Table 2) to determine how much the ERA5 reanalyzed rainfall product and the RegCM model output differed in accuracy. We also adopted the Taylor diagram, widely acknowledged as one of the most suitable techniques for the graphical representation of model-matched performance against observations. This diagram displays the centered RMSE, correlation coefficient (CC), and ratio of standard deviations. Figure 2 shows a Taylor diagram illustrating a comparison between the daily mean rainfall for the reanalysis of ERA5 and the output of RegCM.
Table 2 and Figure 2, which demonstrate the use of CC to assess the reliability of rainfall data for both the reanalyzed data and the model’s outputs, provided the relative statistical metrics. The ERA5 product showed a better correlation (CC = 1.0) and an increased standard deviation compared with the RegCM. We used the RMSE method to evaluate the overall accuracy and magnitude of error of the rainfall products derived from the model’s outputs against the ERA5 reanalyzed data. The model outputs exhibited a higher level of error compared with the ERA5 product.

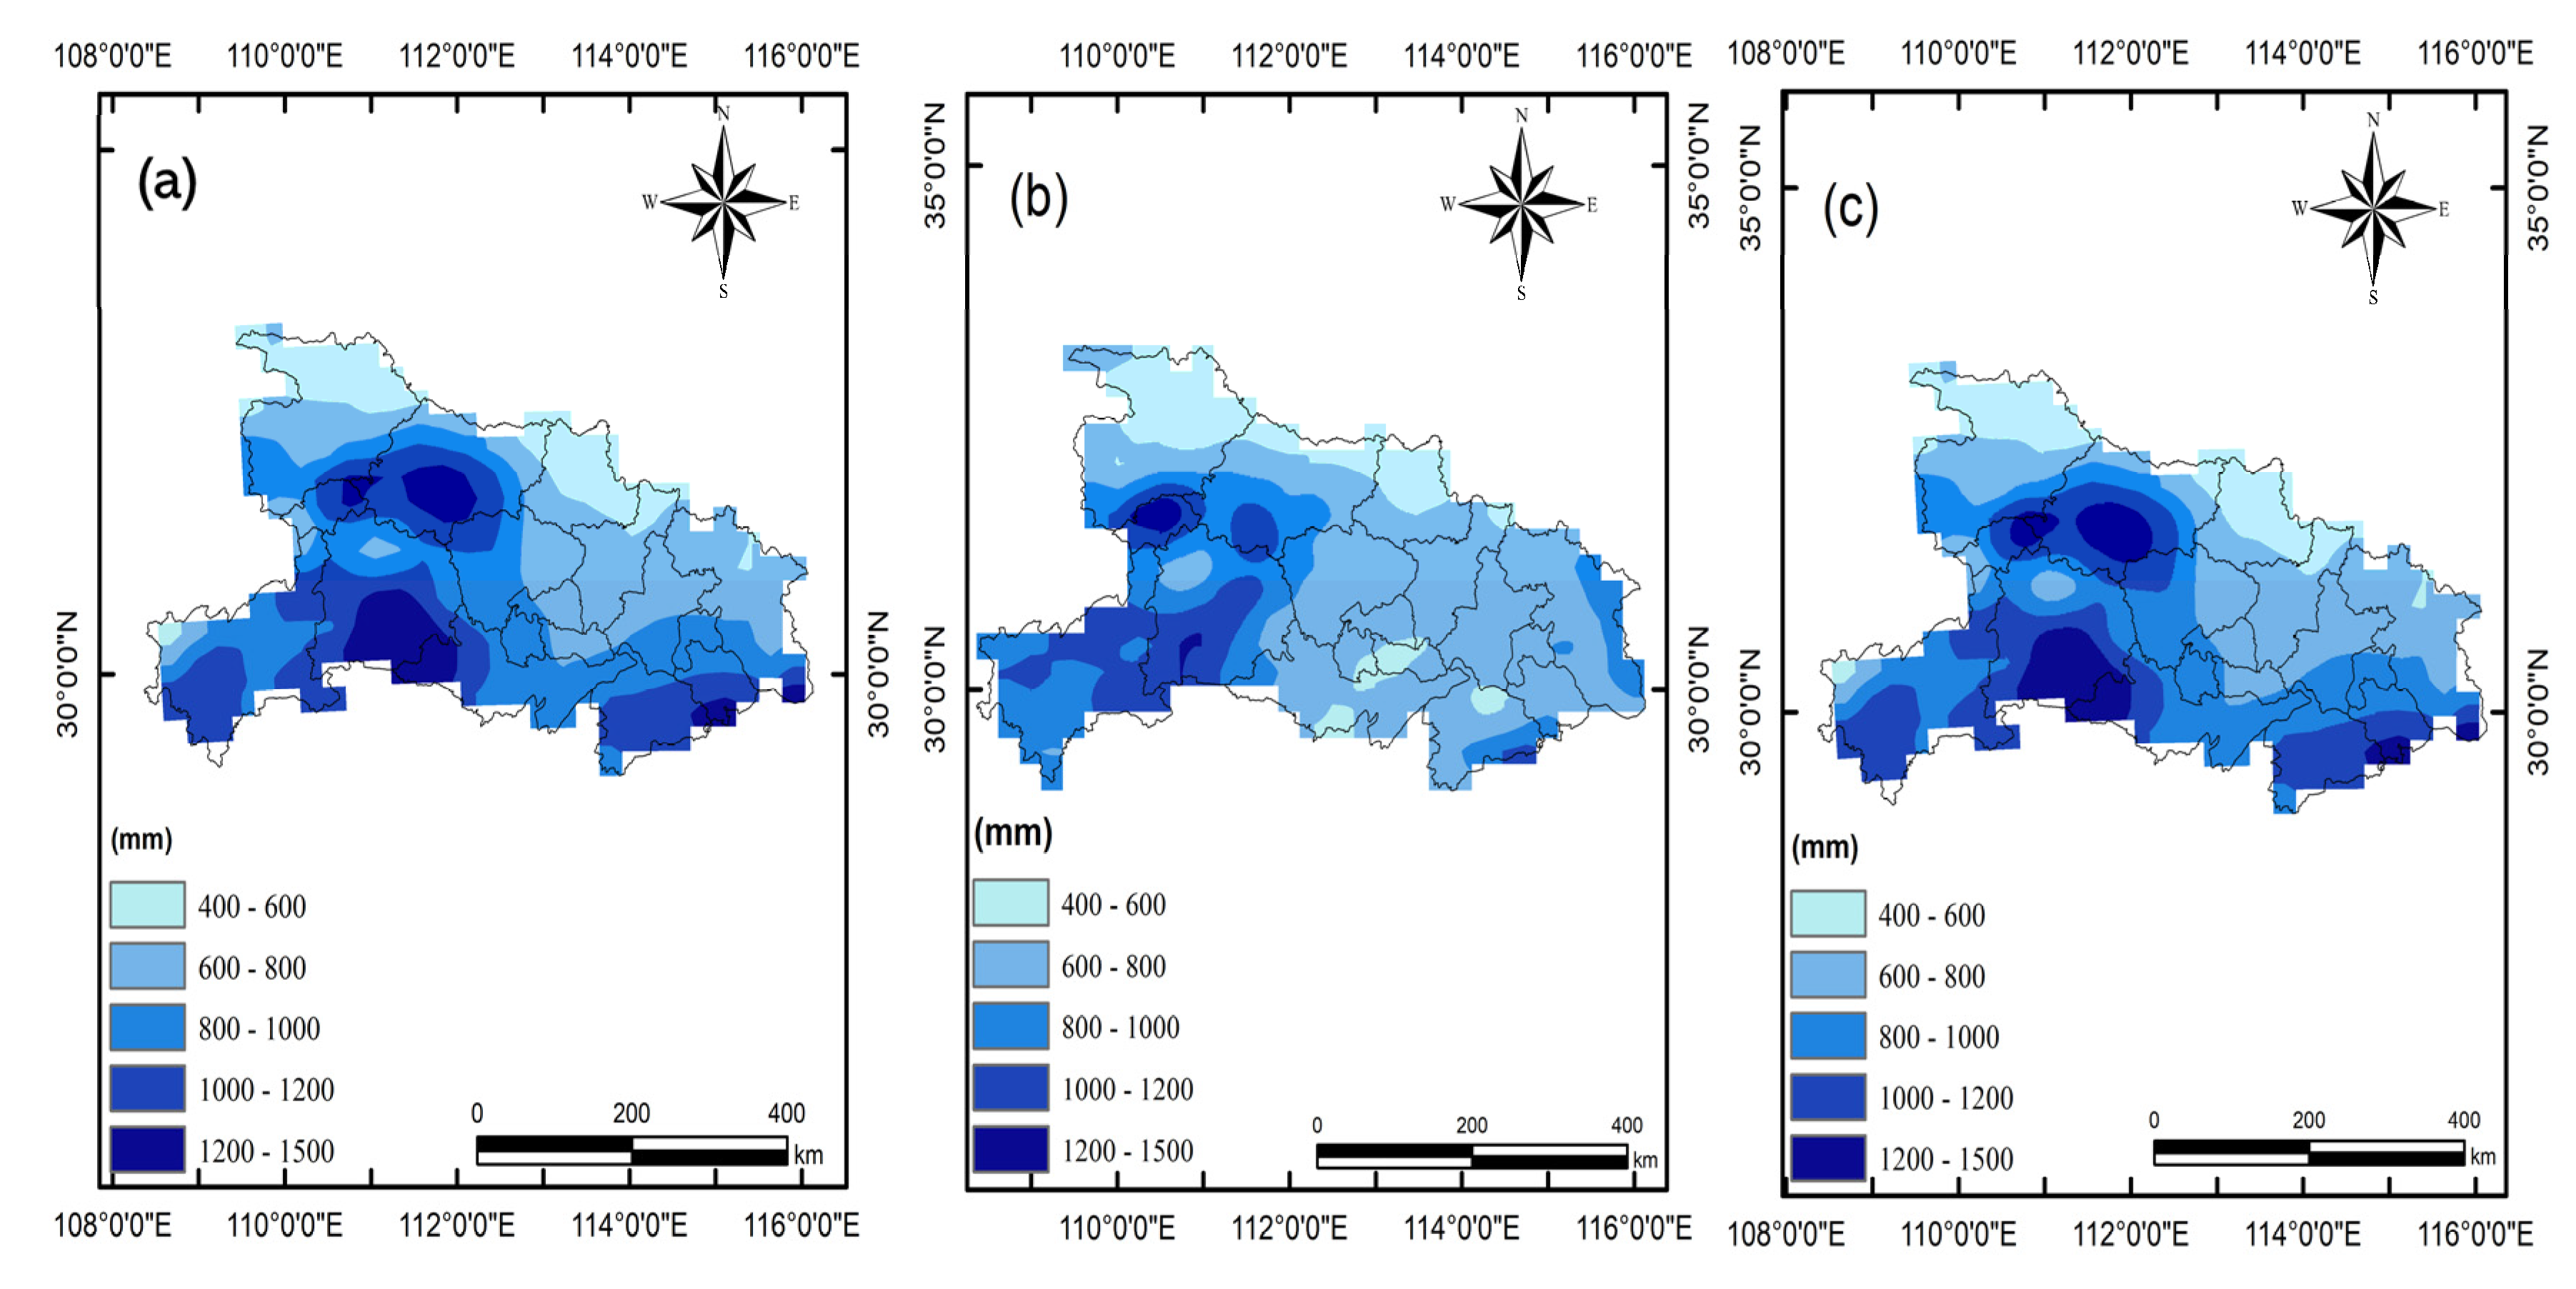
4.2. Climatology of Rainfall over Hubei

The study region was analyzed to investigate the temporal distribution of rainfall. The precipitation of Hubei Province shows annual cycles of variability in daily precipitation (see Figure 3). The daily precipitation in Hubei Province for both ERA5 and RegCM was analyzed before and after bias correction during the flood season, which lasts from May to August. In contrast, the winter months of January, November, and December are the driest times of the year, with average daily precipitation below 3 mm. The outcomes of the study suggested that RegCM was capable of accurately capturing the daily amount of rainfall for all regions, and tended to overestimate it during wet months and underestimate the rainfall during dry months.

4.3. Changes in Annual Mean Precipitation

The following section presents a comparison among the ERA5 reanalyzed data, the RegCM4 simulation data, and the bias-corrected simulated precipitation. It is important to note that there was spatial variation in both the ERA5 and bias-corrected simulated precipitation, indicating that RegCM4 responded effectively to the process of bias correction. With regards to the reanalyzed data, the average precipitation was primarily concentrated in the northwestern region. The intensity of precipitation increased in these areas and decreased towards the center and south. However, the annual mean of bias-corrected simulated precipitation also exhibited an increase in the northwestern parts and a decrease towards the center and some northern regions. ERA5 products accurately captured the spatial amount of rainfall, as shown in Figure 4a and as demonstrated in a report by Jiao et al. [34]. Figure 4 shows that most areas affected by extreme precipitation events were located in western and northern part, with the average annual rainfall reaching 1500 mm/year. The frequency of heavy rain decreased towards Shiyan and Suizhou, with values below 400 mm/year of rainfall. This variation in rainfall is attributed to the presence of hills and mountainous terrain that prevail in the western and eastern parts. In contrast, the central part of the province is dominated by low-level mountains and hills, with little difference in elevation, leading to minimal variation in the mean annual rainfall according to the topographic units.
The center and some of the northern parts of Hubei Province recorded less rainfall, with an annual average up to 1000 mm. These areas correspond to the driest areas of the province. Consequently, we expect a relative reduction in the frequency of extreme precipitation events in these areas.
Figure 4b shows the average historical annual rainfall from the model’s simulations. We found that there was not much difference from that in Figure 4a, indicating that the model has good potential for spatially representing rainfall over the region. Figure 4c illustrates the variations in the annual mean precipitation after bias correction. The spatial variation in average rainfall after the process of bias correction is depicted in this figure. The amount of annual rainfall was also concentrated in the western and northern parts, and decreased in the central and southern regions.
The outputs of RegCM4 coincided with ERA5 (see Figure 5), which means the correction method was effective in the past; for this reason, its application was adopted in future projections. The results showed obvious variations in the spatial patterns of the average annual precipitation for both the ERA5 products and the RegCM model’s outputs before and after bias correction, which indicated that the RegCM4 responded to the process of bias correction, so it was necessary to perform the process of bias correction to obtain more accurate and reliable results.

4.4. Spatial Changes in EPIs

Figure 6 shows the spatial changes in the five observed average annual EPIs over Hubei Province from 1979 to 2005. As depicted in the figure, the distributions of Rx5day and SDII ranged across 20–104 mm and 2.6–11.2 mm, respectively. The annual distribution of R10mm, CWD, and CDD ranged across 20–128 mm, 5–22.8 days, and 1.2–8.8 days, respectively. According to the observed extreme wet indicators (all indicators except for CDD), the highest values were found in the western and northern parts, while the lowest values were in the eastern and central parts. The distributions of Rx5day and SDII were similar to those of the average annual rainfall, which increased in Yichang, Shiyan, and Xiangyang, and were lower in the eastern to central part of Hubei.
The Rx5day values increased in the western and northern region, mainly in Yichang and Xiangyang (also known as Xiangfan) (see Figure 6a). The maximum value of R10mm was found in Yichang and Shennongjia, suggesting these areas experienced frequent and intense rainfall events during this period (see Figure 6b).
CWD decreased in the eastern and central parts, and increased in the western and northern parts and some southern areas (see Figure 6c). In contrast, CDD increased in the southern–central parts and decreased in the western part (see Figure 6c). CWD increased distinctly in western Hubei, while CDD decreased in western Hubei compared with other regions. This may be due to differences in the terrain. Generally, SDII corresponded to changes in total annual precipitation in China. Increases in SDII were observed in most parts of the region (see Figure 6e). The spatial distribution of these indices was very similar, indicating that the ERA5 reanalyzed data are effective in capturing spatial patterns. The ERA5 reanalyzed data indicated that almost all EPIs, except for CDD, showed higher values in the western and southern regions, while the most severe drought events occurred in the southern and central parts of Hubei between 1979 and 2005. Consequently, extreme precipitation events in the western and northern regions were the most hazardous, while drought events occurred in the southern and central parts of the province between 1979 and 2005.

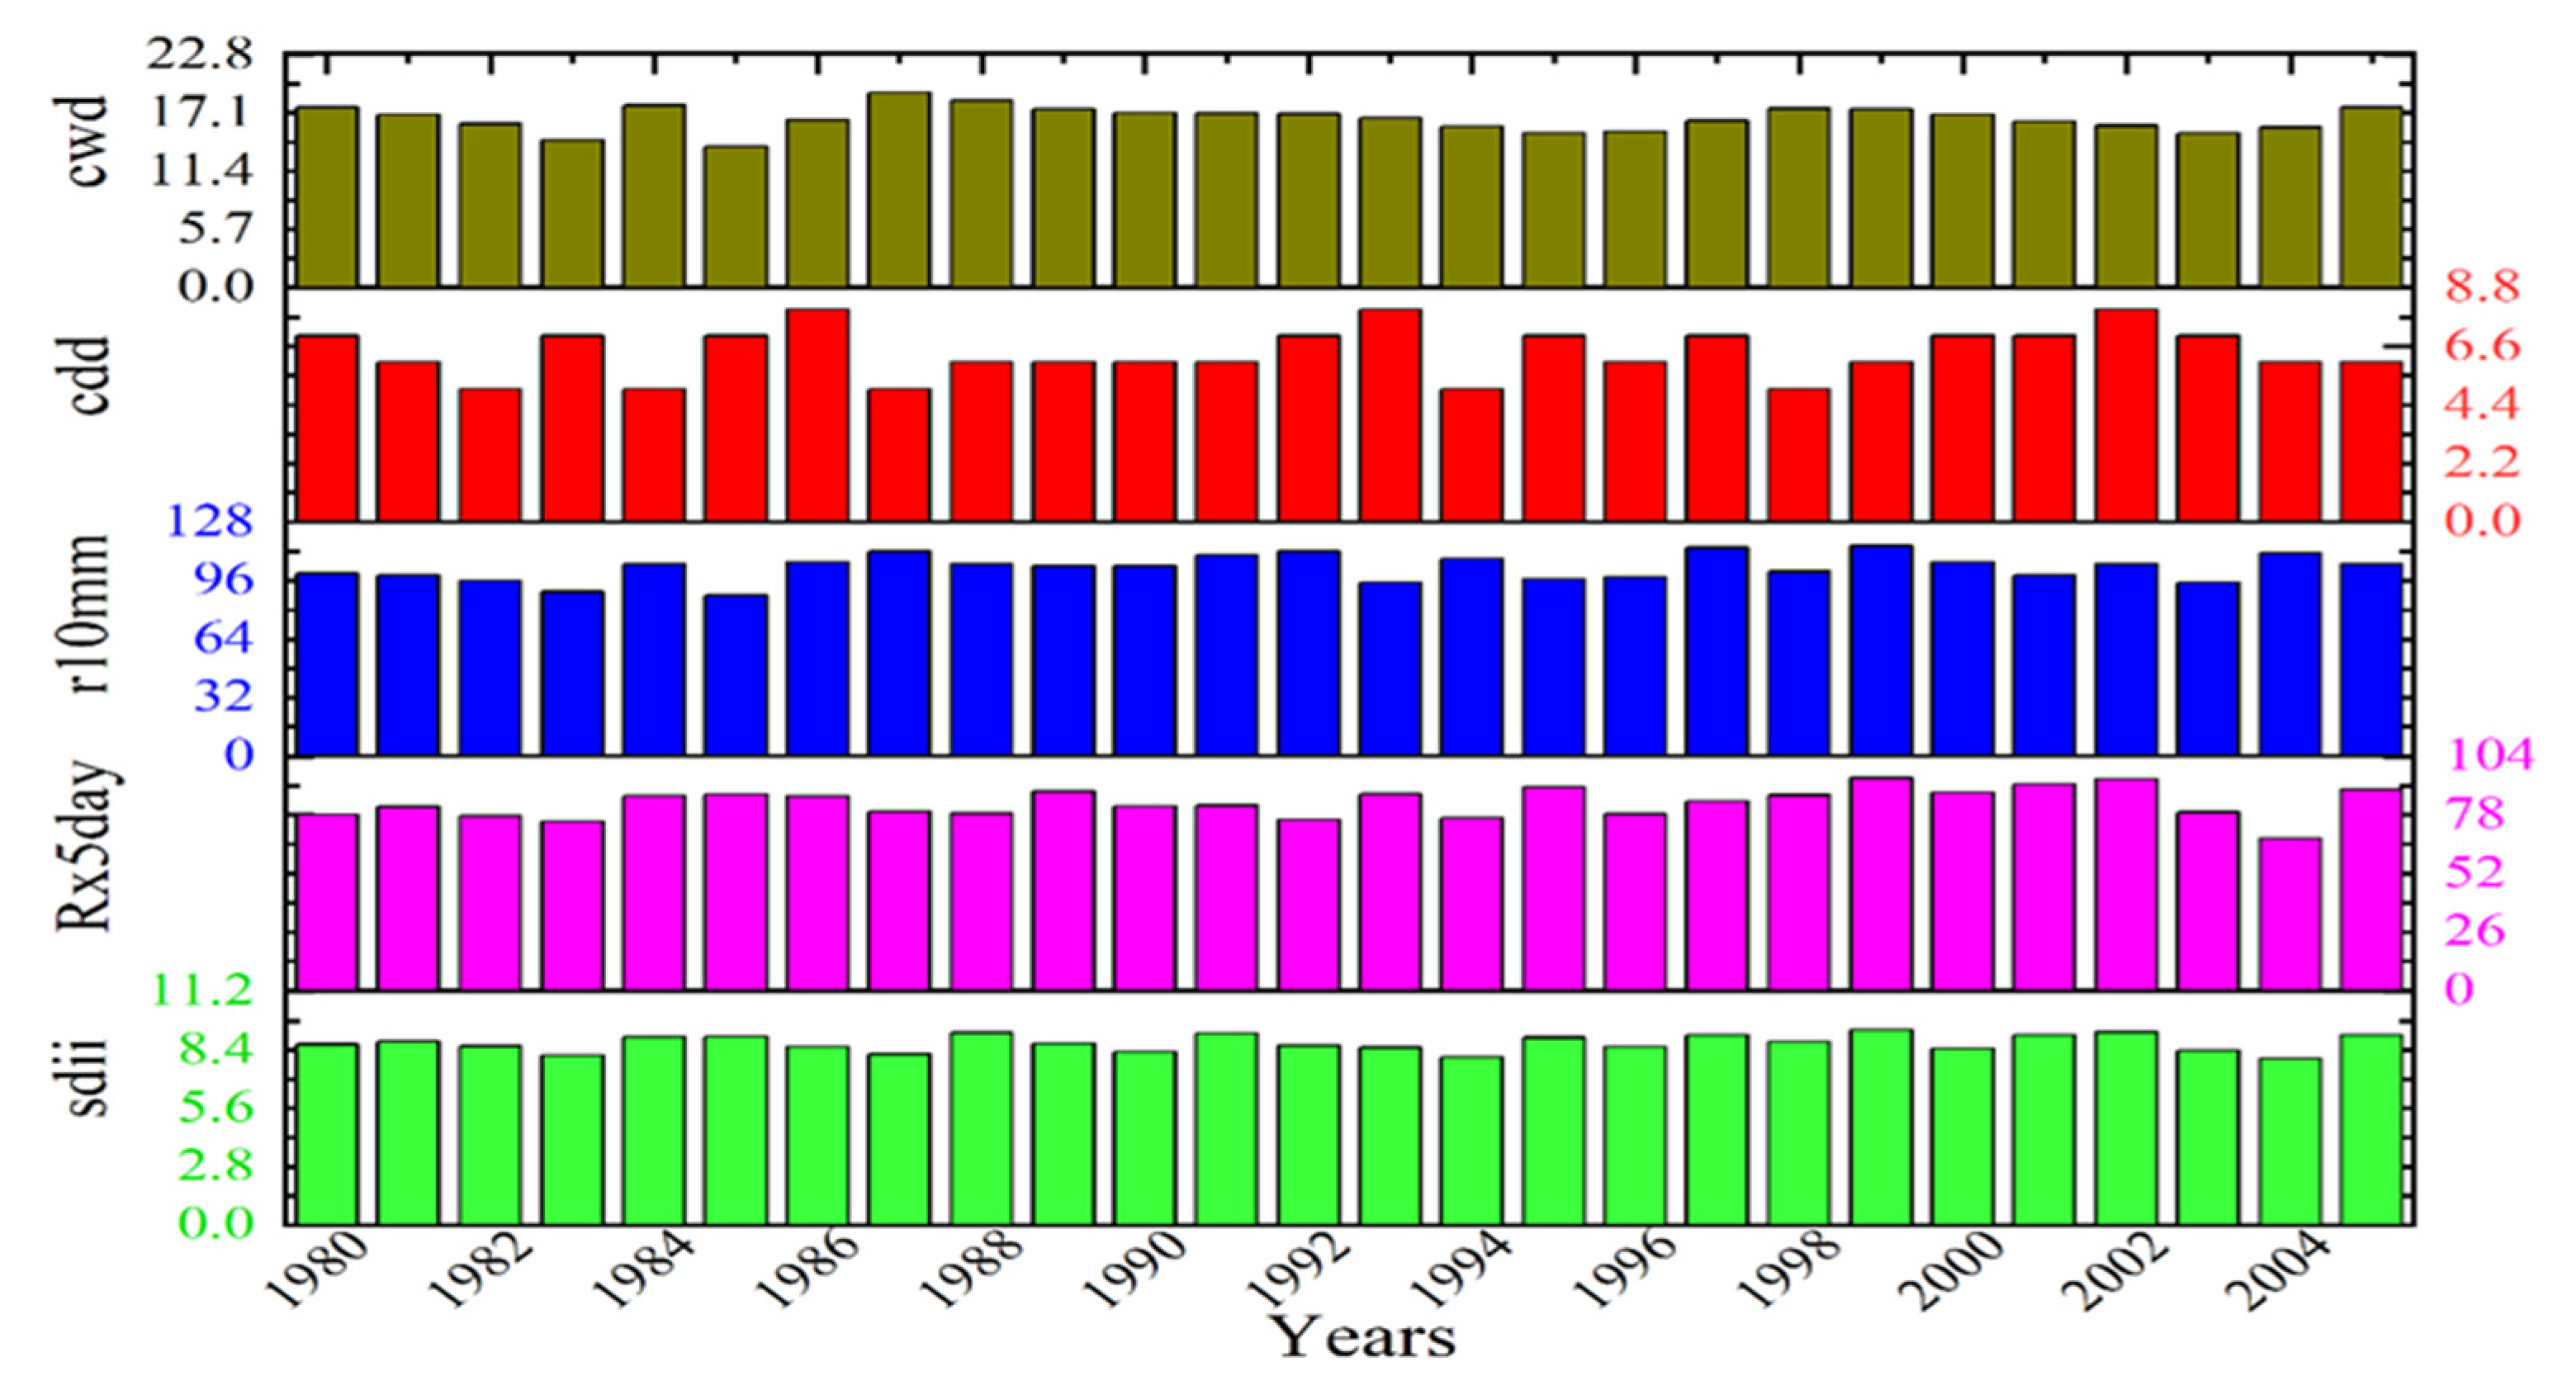
4.5. Temporal Changes in EPIs

Figure 7 and Table 3 depicts the temporal precipitation patterns of the EPIs from 1979 to 2005 in Hubei Province. Rx5day showed a positive trend during this period, indicating a non-significant increase in the 1980s in both Yichang and Xiangfan, with a value of 57 mm (see Table 2). Among the strength indicators, the frequency index R10mm increased non-significantly in the 1990s in both Yichang and Shennongjia, showing a positive trend of 30 days, which suggests that heavy precipitation was more intense and frequent during this period. As for the consecutive dry index (CDD), it was found to increase non-significantly, showing a positive trend of 41 days in Xiaogan, Jinmen, and Jinzhou, with a rise observed in the early 1980s. As shown in Table 3 there were no notable patterns in any of the five EPIs. However, there was a gradual decrease since the mid-1980s, followed by an increase in the 1990s, indicating an overall rise in the trend of drought in these areas.
The CWD showed a negative tendency of 35 days, indicating a decrease in heavy rainfall on wet days. Therefore, this index has decreased in the eastern and northern parts. The daily intensity (SDII) increased non-significantly by 19 mm/day in Yichang, Shennongjia, Xiangfan, and some of the southeastern parts.

4.6. Seasonal Analysis of Extreme Precipitation Indices in Summer for the Mid-21st Century (2046–2065)

This study discussed the EPIs’ characteristics in Hubei Province during the summer. The concentration of precipitation, including extreme events, during this time, is a noteworthy aspect.

4.6.1. Spatial Patterns

As shown in Figure 8, spatial changes occurred in the five EPIs in the mid-21st century (2046–2065) compared with the reference period. Rx5day increased in the central and northern part of Hubei, mainly in Wuhan, Qianjiang, Jingzhou, and Suizhou, with values larger than 65 mm, and it decreased in Yichang and Xianyang, with values below −30 mm (see Figure 8a). This indicated that this region will witness a rise in the intensity of rainfall through summer. A significant increase in R10mm was seen in the south of Hubei with values larger than 60, especially in Wuhan, Qianjiang, Jingzhou, and Suizhou, indicating that these areas are more at risk of extreme precipitation during summer. It decreased in Enshi and Yichang in west Hubei, with values below −15 days, indicating less rainfall in these areas (see Figure 8b). CWD also increased in Xiantao, Qianjiang, and Jingzhou, with a value exceeding 40 days (see Figure 8c). Summer CDD decreased in middle and southern Hubei, with values up to −15 days, and increased in most parts of Hubei, with values larger than 45 days, implying that the middle region will witness less drought during summer (see Figure 8d). The change in the SDII also increased in Shyian, Qianjiang, Jingzhou, and Suizhou in central and eastern Hubei, with values up to 45 mm/days, and decreased in Yichang and Xianyang. This indicated that these regions will experience a rise in the intensity of rainfall throughout summer (see Figure 8e). Generally, all the EPIs increased, except CDD during the summer in the 21st century. Therefore, the southern and central regions such as Wuhan, Qianjiang, Jingzhou, and Suizhou will be highly exposed to the risk of floods and extreme events.

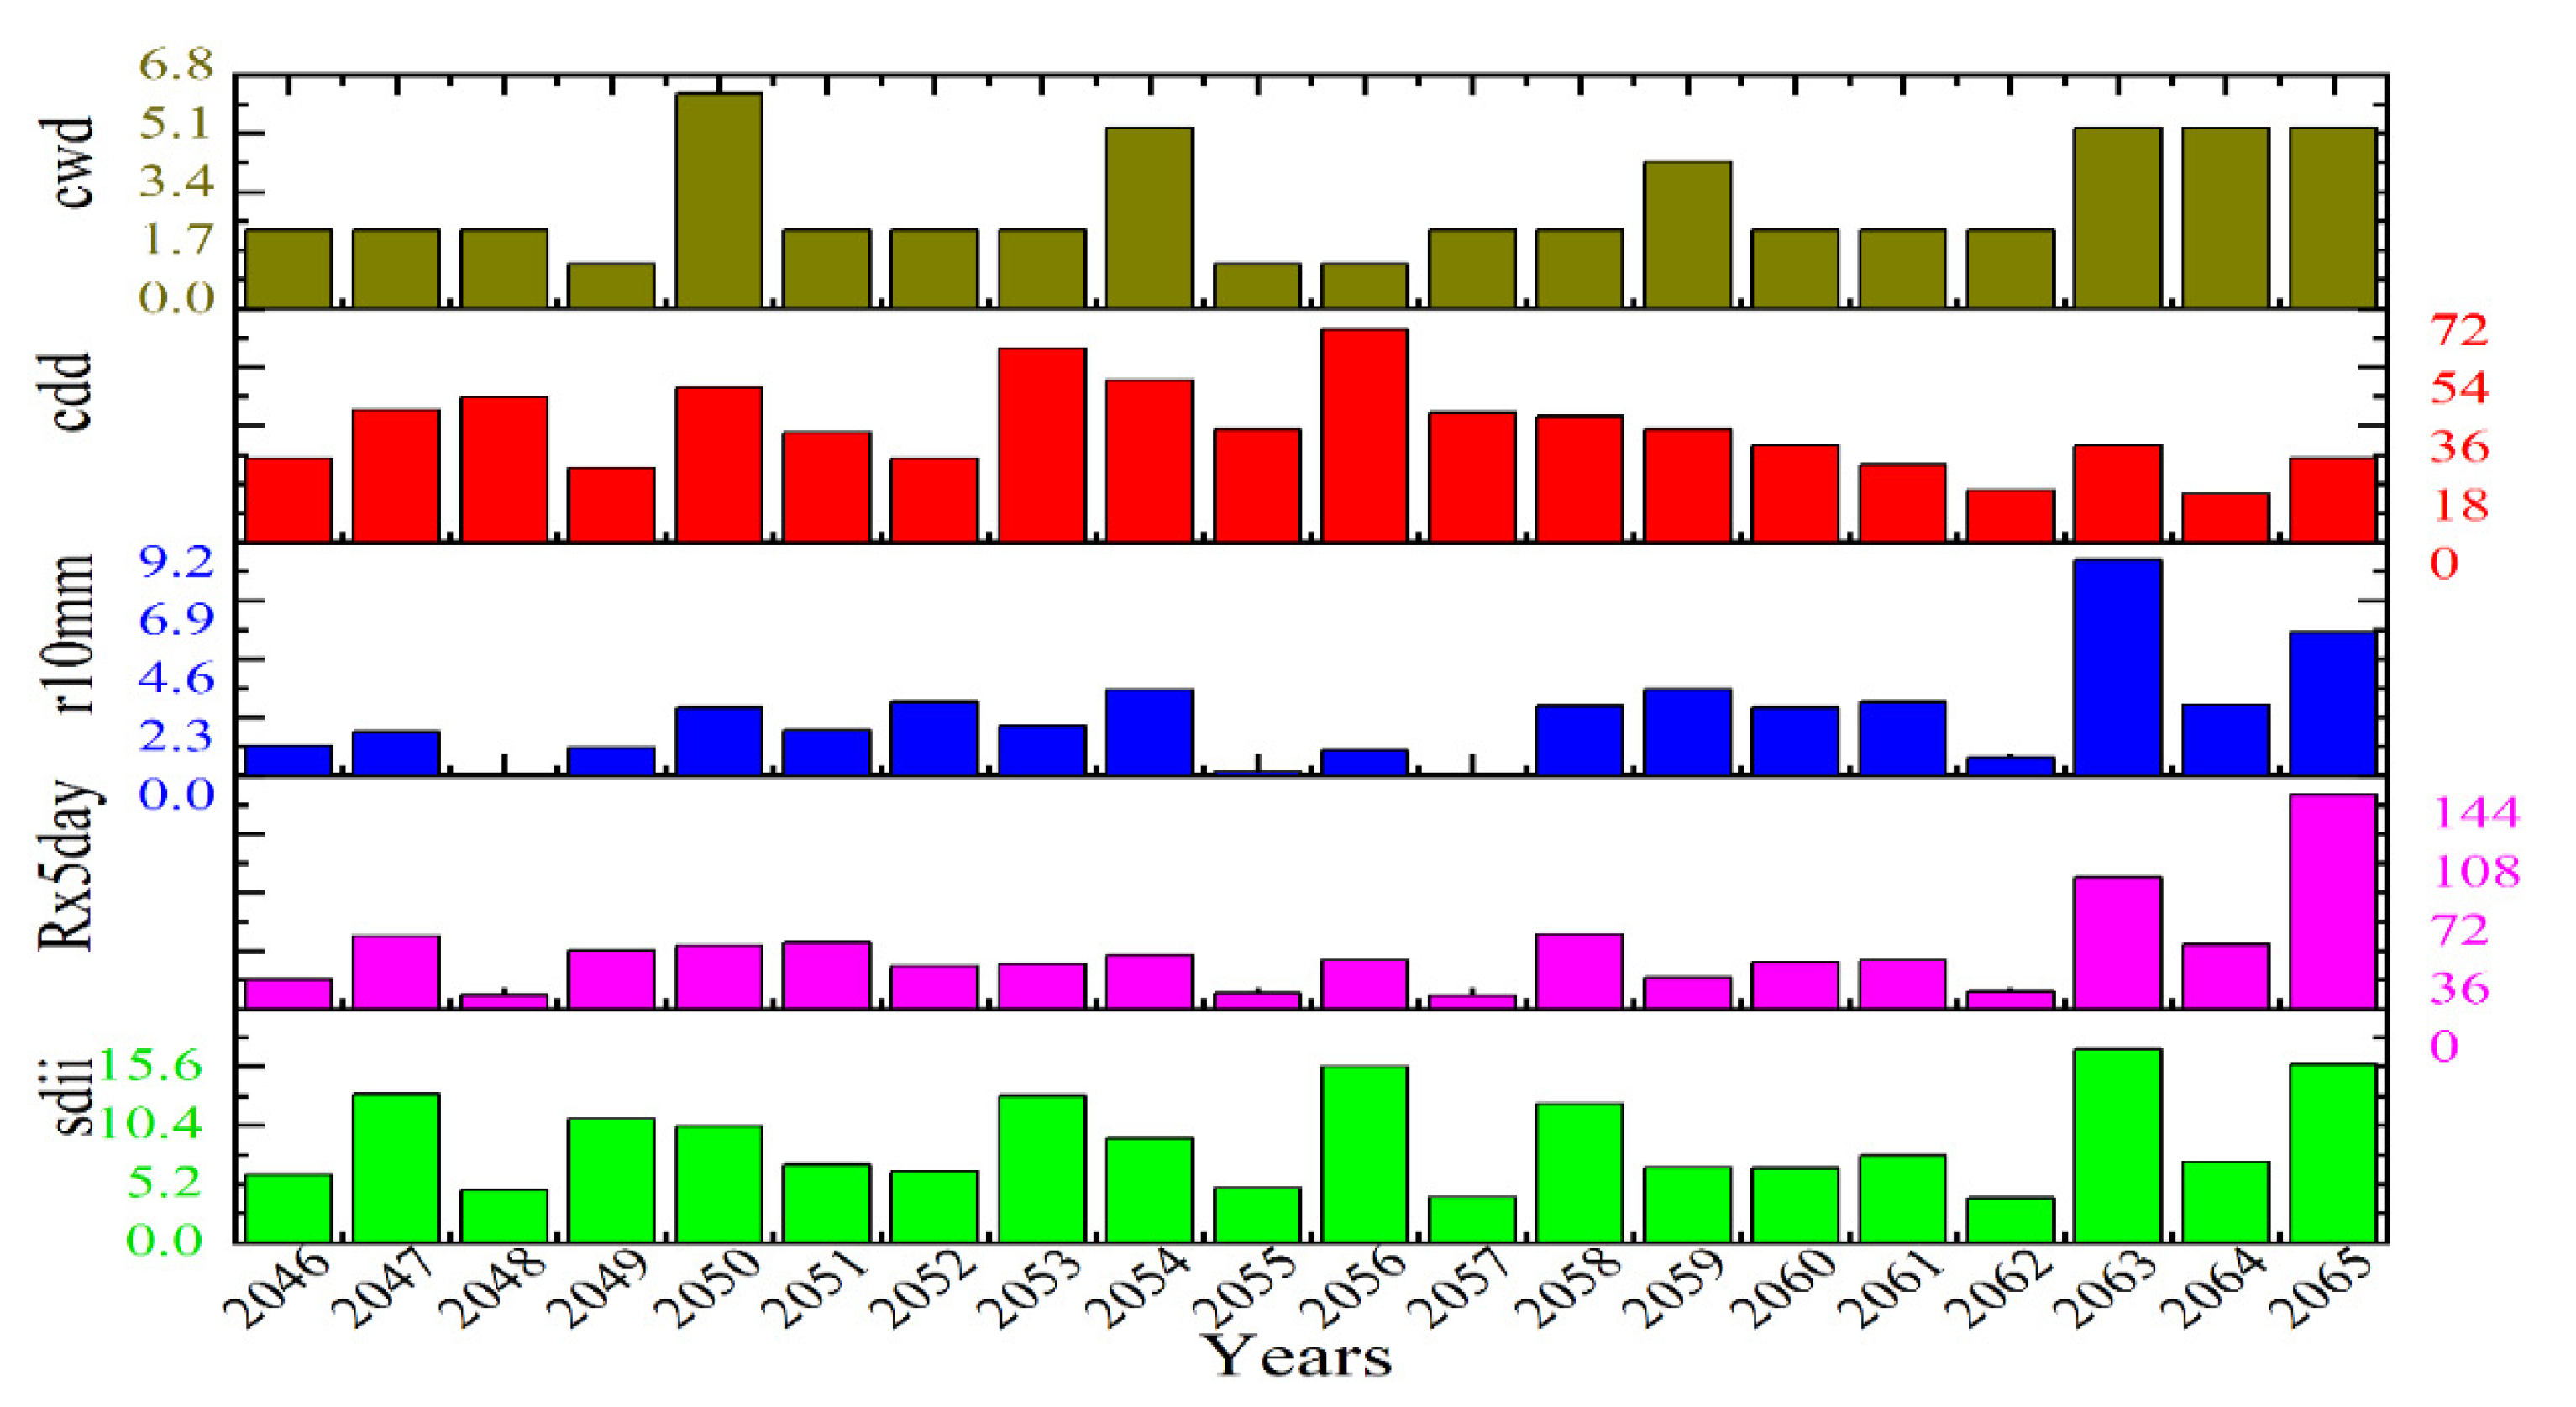
4.6.2. Temporal Patterns

In summer, as shown in Figure 9 and Table 4, Rx5day increased non-significantly at a rate of 28 mm in Wuhan, Ezhou, and Shyian, and decreased in western Hubei. R10mm increased significantly in Wuhan, Xiantao, Qianjiang, Tianmen, and Jingzhou at a rate of 64 days (p < 0.05) but decreased in Enshi, Yichang, and Xianyang (see Table 4). This indicated that these regions face a higher risk of extreme precipitation in the summer. Conversely, CDD showed a negative trend of 54 days, indicating less severe drought over the central parts and more heavy precipitation days in this area. CWD increased mainly in the northern and southern parts at a rate of 43 days, and decreased in Enshi and Yichang. That means those areas would be less to extreme events. In general, most of the EPIs examined (except CDD) rose during the summer of the mid-21st century. SDII increased mainly in the southern northern of Hubei at a rate of 12 days and decreased in the western parts. Precipitation increased in the southern and central parts, and decreased in the western parts. Therefore, the southern and central regions will face a higher risk of extreme events by the middle of the 21st century.

4.7. Spatial–Temporal Changes of EPIs in Summer for the Late 21st Century (2078–2097)

4.7.1. Spatial Changes

The spatial changes in five EPIs in the late 21st century (2078–2097) compared with the reference period are shown in Figure 10. the consecutive dry days CDD showed a reversed distribution, for wet extreme indices (all indices except CDD) increased in northern and southern Hubei.
Increases in Rx5day were found in the southern and northern parts for values of up to 55 mm, and a decrease in the western parts of Hubei around −15 mm (see Figure 10a). This may indicate increased Rx5day in those areas during the summer season. R10mm increased in the southern parts with values of up to 55 but decreased towards Enshi, Shennongjia, Shiyan, and Xiangyang (see Figure 10b). This suggests that these areas may be less at risk of heavy rainfall during the summer. Figure 10c displays an increase in CWD in the southern parts of Hubei, with values up to 45 days, indicating that these areas could be wetter. The CDD shows increases in most parts of Hubei of up to 55 days, except the middle parts, and it decreased in Wuhan, Xiagan, and Xianto, which indicated that these areas will be exposed to heavy rains and that more attention should be paid to these areas (see Figure 10d). According to Figure 10e, a decrease in SDII can be observed in the western parts, with values up to 45 mm/day, while Xiantao, Qianjiang, and Jingzhou will experience an increase in SDII.

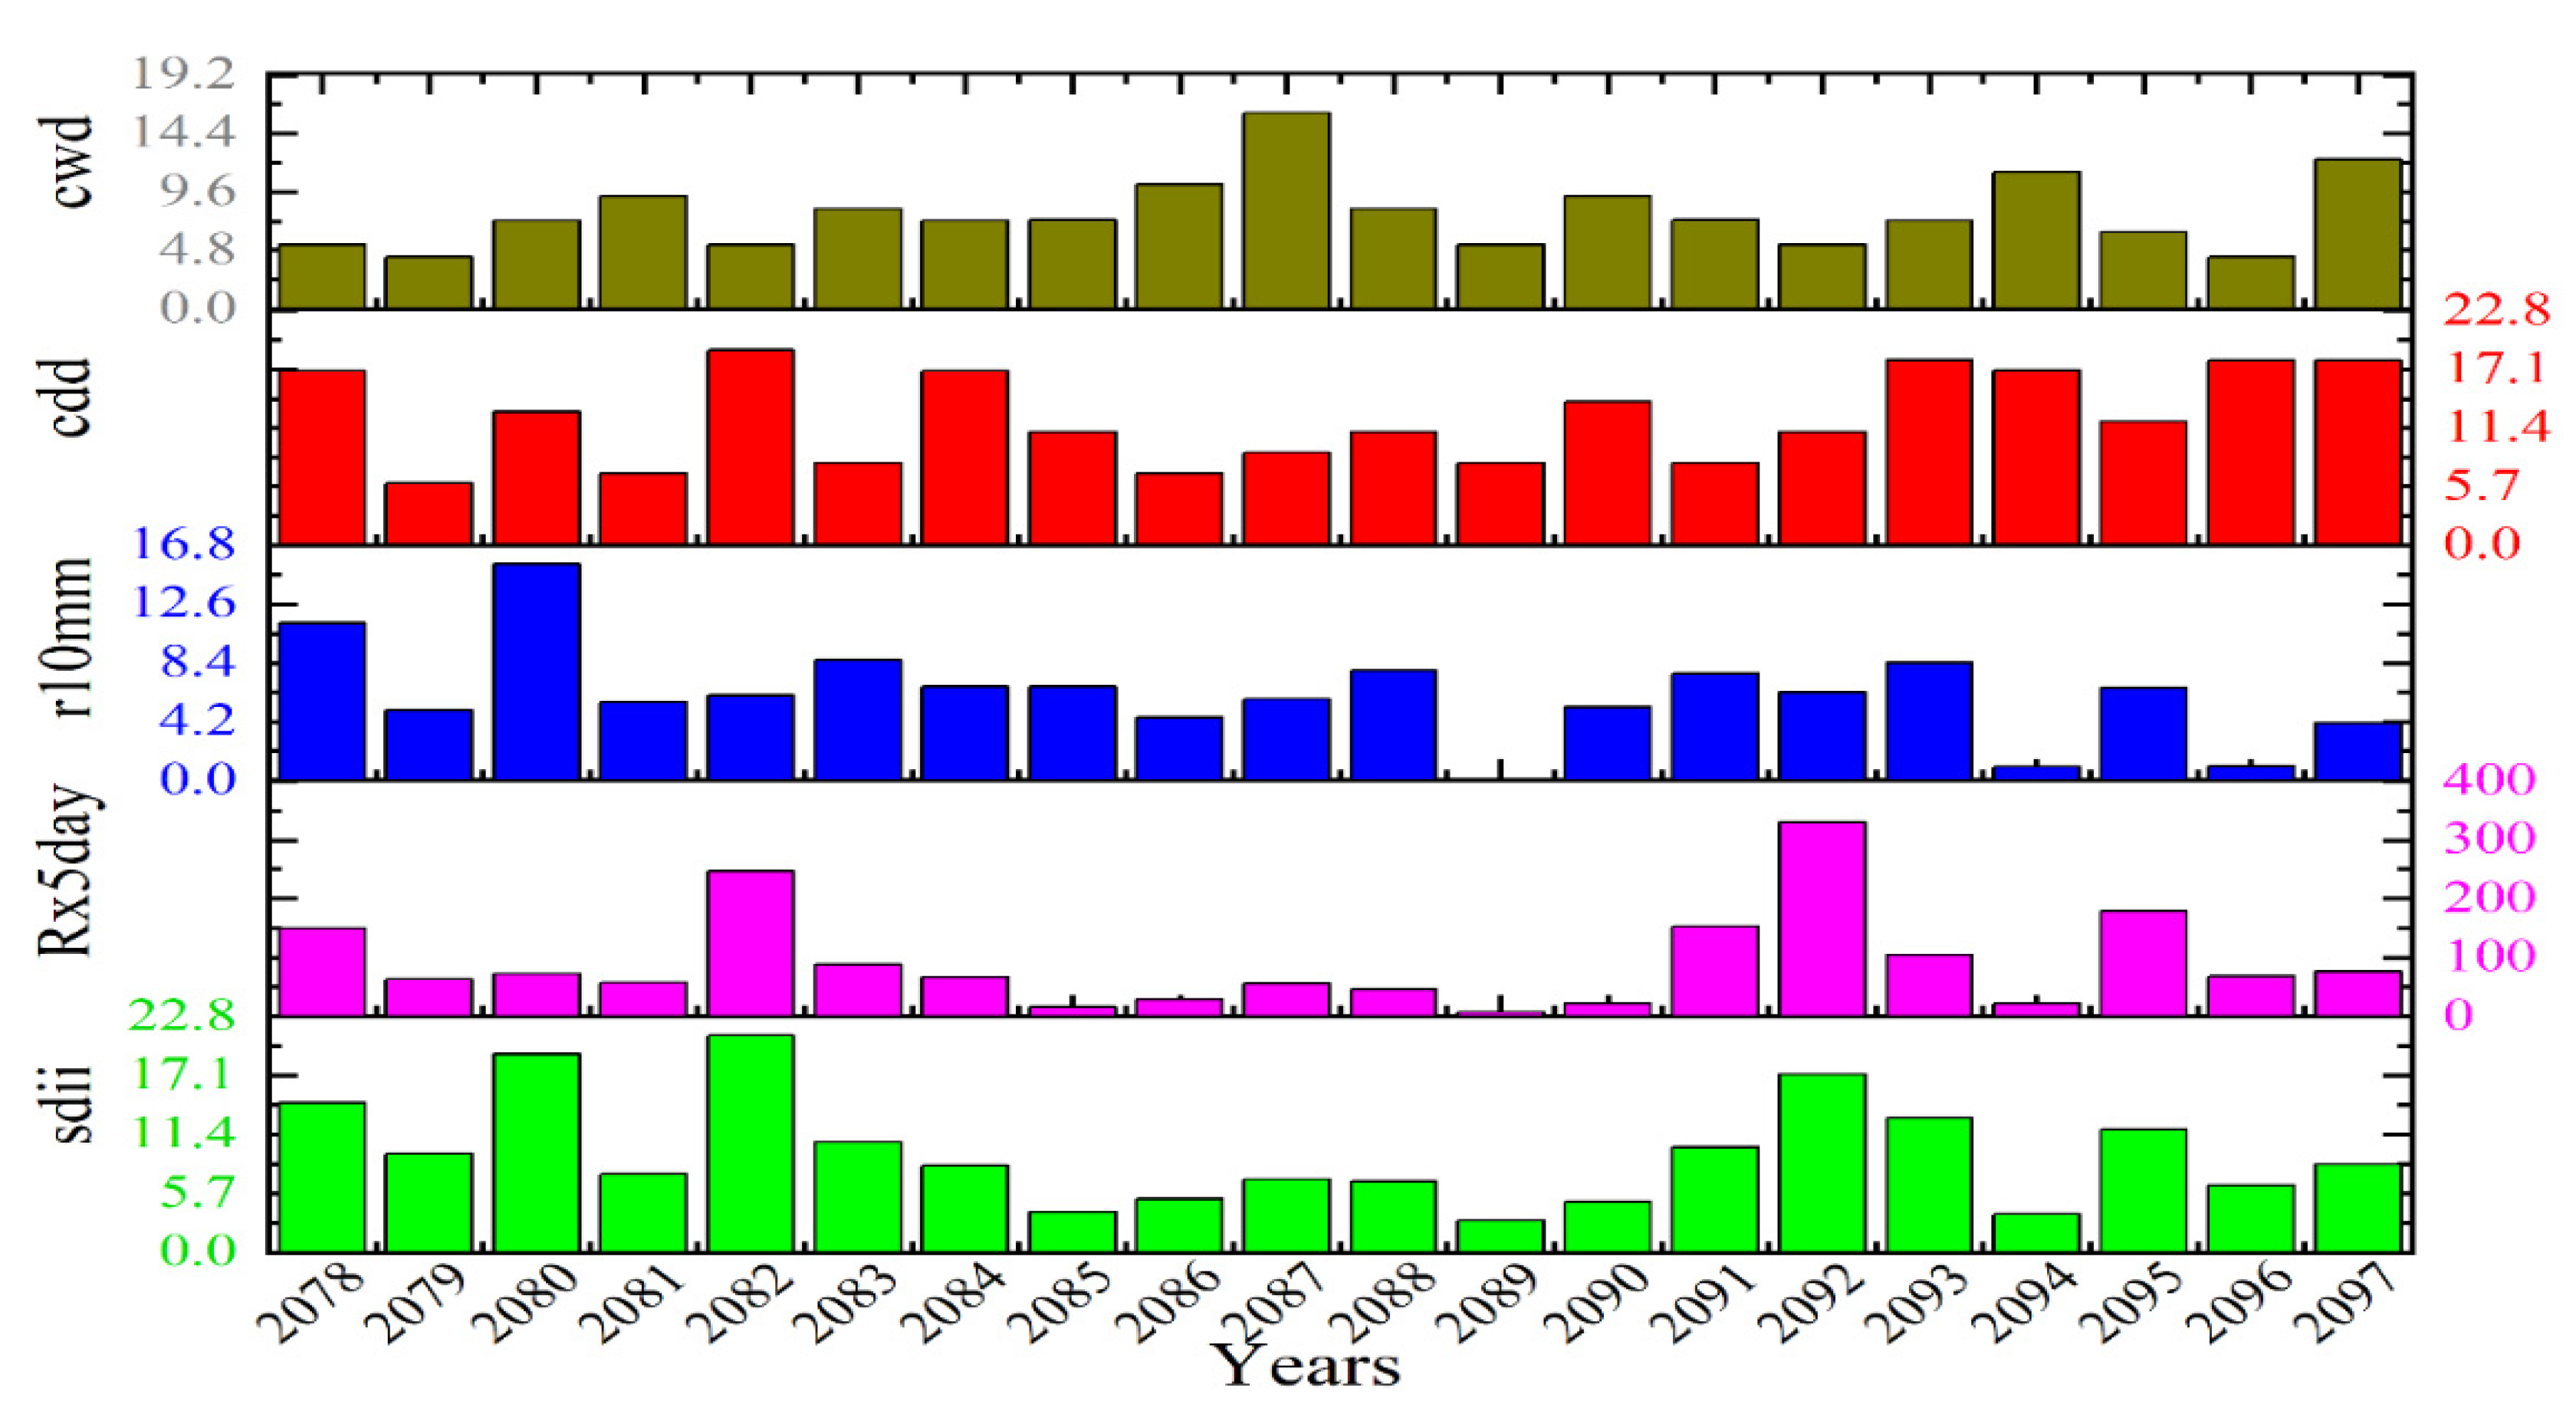
4.7.2. Temporal Changes

The temporal changes for the five EPIs over Hubei for the summer of the late 21st century are shown in Figure 11 and Table 5. Rx5day had a negative tendency of −2 mm in Yichang and Xiangyang. This may indicate a decrease in the intensity of rainfall on wet days in those areas during the summer in the late 21st century. Accordingly, R10mm also showed a negative tendency of −49 days, indicating a non-significant decrease in the north and west of Hubei. CWD had a positive non-significant increasing trend of 24 days in Xiantao, Tianmen, and Jinzhou, and decreased in the western and northern parts. The southern part will experience an increase in CWD during the summer, suggesting that these regions will be wetter. An increase in CDD is expected in most region of Hubei at a rate of 54 days, except the middle areas. This indicates that EPIs will increase in these areas. SDII also showed a negative tendency of −38 days in the west and north parts, and decreased in Yichang and Enshi. This means that these regions will suffer less from extreme precipitation.
Most EPIs over Hubei Province should decrease in the summer during the late 21st century, except for CDD and CWD, which are projected to increase. The projected seasonal analysis of precipitation differed between the summer of the late 21st century and the summer of the mid-21st century. Specifically, the EPIs, except for CDD, should increase in the summer of the mid-21st century and decrease in the summer of the late 21st century.

5. Discussions and Conclusions

Utilizing ERA5 reanalyzed data from ECMWF and the outcomes of high-resolution climate change projections for Hubei via RegCM4, this study investigated future extreme precipitation in Hubei Province. Based on RegCM4’s output, five EPIs (RX5day, R10mm, CWD, SDII, and CDD) were selected to analyze the spatial–temporal fluctuations of extreme precipitation during the summer season in Hubei. The period from 1979 to 2005 was used as a reference point for future changes, with the model’s efficacy assessed by comparing its outcomes with ERA5 data.
Generally, shifts in precipitation extremes can significantly affect overall yearly precipitation. A significant increase in R10mm was detected during the summer of the mid-21st century, particularly in the southern and northern parts of Hubei, indicating a higher risk of extreme events in regions such as Wuhan, Xiantao, Qianjiang, Jinzhuo, and Ezhou. These results are consistent with research conducted by Wang and Li [18]. It has been reported that the amount of heavy rainfall has increased compared with previous times, potentially worsening the strain on drainage systems in Wuhan City [35]. In the summer of the late 21st century, RX5day, R10mm, and SDII showed a slight decline towards the western parts of Hubei, indicating a decrease in extreme precipitation in these areas. In contrast, CDD increased in most parts of Hubei, suggesting a rise in drought rates during the summer of the late 21st century. There are factors other than rainfall that contribute to climate change and the presence of extreme precipitation indicators in the summer of the 21st century, such as prevailing winds and mountains. Menezes et al. [36] analyzed numerous years of surface wind data from the Quick Scatterometer (QuikSCAT) satellite to elucidate the spatial and temporal variability of westerly wind jets in the mountain gap of the northern Red Sea. He found that these jets were relatively cold and dry air from the Arabian Desert.
Based on these results, the general trend of variation in frequency indices in Hubei Province during the summer of the mid-21st century is increasing, indicating that precipitation and intensity will rise. Extreme precipitation events will occur more frequently in the southern and northern regions of Hubei, potentially leading to increased flood disasters in the southeastern part of the province. The primary goal of this research was to investigate the regional patterns of future changes as well as the temporal progression of extreme indices between 2046–2065 and 2078–2097, using the RCP8.5 scenario. The findings showed that the model can accurately replicate the spatial and temporal patterns of extreme climate events in Hubei Province. The major conclusions include the following.
  • The R10mm will increase significantly (p < 0.05) during the summer of the mid-21st century in the south northern parts, especially for Wuhan, Xiantao, Qianjiang, Jinzhuo, and Ezhou. The majority of EPIs, except CDD, are expected to rise. This indicates the need for more focus on disaster prevention during summer.
  • Rx5day, R10mm, and SDII will all gradually decrease in the summer of the late 21st century toward the western parts. However, they may climb throughout other parts of Hubei, indicating an increase in the rates of drought during the summer of the 21st century.
  • More focus needs to be placed on the rainstorms that are expected in Wuhan, Xiantao, Qianjiang, and Tianmen, particularly during the summer of the mid-21st century, where there may be a significant increase in the R10mm. This could lead to more floods and financial losses during the periods of intense rainfall.
In conclusion, this study enhances our understanding of severe precipitation incidents in Hubei Province during the 21st century in the context of the RCP8.5 scenario. However, analyzing the uncertainty involved in the simulation and the projection of extreme rainfall events is essential for further research, given the complexity of rainfall patterns. Although the good efficiency of the bias correction method is beneficial for the simulation of the observed precipitation, especially in the temporal scale, there is potential room for improvement spatially. Therefore, for future work, the study recommends more investigation on bias correction techniques, as well as using datasets of high-resolution observations.

Author Contributions

Conceptualization, A.M.; methodology, A.H.; software, M.A.; validation, Q.C. and A.M.; formal analysis, A.M.; investigation, A.M. and Q.C.; resources, A.M.; data curation, A.M.; writing—original draft preparation, A.M.; writing—review and editing, Q.C.; visualization, M.H.; supervision, Q.C.; project administration, A.M.; funding acquisition, Q.C. All authors have read and agreed to the published version of the manuscript.

Funding

This study was supported by the National Science Foundation of China (grant 42275078, 41775136).

Institutional Review Board Statement

Not applicable.

Informed Consent Statement

Not applicable.

Data Availability Statement

The data presented in this study are available on request from the corresponding author. The DEM data used in this study have been deposited in NASA Shuttle Radar Topography Mission (SRTM) (2013). Shuttle Radar Topography Mission (SRTM) Global. Distributed by Open Topography. https://doi.org/10.5069/G9445JDF Accessed: 10 August 2024.

Acknowledgments

The authors thank the National Key Scientific and Technological Infrastructure project “Earth System Science Numerical Simulator Facility” (EarthLab) for the support of this work. Finally, we are grateful for the comments from two anonymous reviewers who helped improved the quality of this manuscript.

Conflicts of Interest

The authors declare no conflict of interest.

References

  1. Chen, Y.J.; Lin, H.J.; Liou, J.J.; Cheng, C.T.; Chen, Y.M. Assessment of Flood Risk Map under Climate Change RCP8.5 Scenarios in Taiwan. Water 2022, 14, 207. [Google Scholar] [CrossRef]
  2. Alexander, L.V. Global Observed Long-Term Changes in Temperature and Precipitation Extremes: A Review of Progress and Limitations in IPCC Assessments and Beyond. Weather Clim. Extrem. 2016, 11, 4–16. [Google Scholar] [CrossRef]
  3. Alexander, L.V.; Fowler, H.J.; Bador, M.; Behrangi, A.; Donat, M.G.; Dunn, R.; Funk, C.; Goldie, J.; Lewis, E.; Rogé, M.; et al. On the Use of Indices to Study Extreme Precipitation on Sub-Daily and Daily Timescales. Environ. Res. Lett. 2019, 14, 125008. [Google Scholar] [CrossRef]
  4. Intergovernmental Panel on Climate Change. Climate Change 2014: Synthesis Report: Longer Report; Intergovernmental Panel on Climate Change: Geneva, Switzerland, 2014; ISBN 9789291691432. [Google Scholar]
  5. Boo, K.O.; Kwon, W.T.; Baek, H.J. Change of Extreme Events of Temperature and Precipitation over Korea Using Regional Projection of Future Climate Change. Geophys. Res. Lett. 2006, 33, L01701. [Google Scholar] [CrossRef]
  6. Khoi, D.N.; Quan, N.T.; Nhi, P.T.T.; Nguyen, V.T. Impact of Climate Change on Precipitation Extremes over Ho Chi Minh City, Vietnam. Water 2021, 13, 120. [Google Scholar] [CrossRef]
  7. Yang, X.-Y.; Zhang, S.-B.; Lyu, Y.-Q.; Zhao, Y.; Lyu, S.-H. Characteristics and Future Projections of Summer Extreme Precipitation in Sichuan Province, China. J. Mt. Sci. 2020, 17, 1696–1711. [Google Scholar] [CrossRef]
  8. Zhai, P.; Zhang, X.; Wan, H.; Pan, X. Trends in Total Precipitation and Frequency of Daily Precipitation Extremes over China. J. Clim. 2005, 18, 1096–1108. [Google Scholar] [CrossRef]
  9. Chen, H.P. Projected Change in Extreme Rainfall Events in China by the End of the 21st Century Using CMIP5 Models. Chin. Sci. Bull. 2013, 58, 1462–1472. [Google Scholar] [CrossRef]
  10. Zou, L.; Zhou, T. Near Future (2016-40) Summer Precipitation Changes over China as Projected by a Regional Climate Model (RCM) under the RCP8.5 Emissions Scenario: Comparison between RCM Downscaling and the Driving GCM. Adv. Atmos. Sci. 2013, 30, 806–818. [Google Scholar] [CrossRef]
  11. Alriah, M.A.A.; Bi, S.; Nkunzimana, A.; Elameen, A.M.; Sarfo, I.; Ayugi, B. Assessment of Observed Changes in Drought Characteristics and Recent Vegetation Dynamics over Arid and Semiarid Areas in Sudan. Theor. Appl. Clim. 2024, 155, 3541–3561. [Google Scholar] [CrossRef]
  12. Li, L.; Xiao, Z.; Luo, S.; Yang, A. Projected Changes in Precipitation Extremes over Shaanxi Province, China, in the 21st Century. Adv. Meteorol. 2020, 2020, 1808404. [Google Scholar] [CrossRef]
  13. Ji, Z.; Kang, S. Evaluation of Extreme Climate Events Using a Regional Climate Model for China. Int. J. Climatol. 2015, 35, 888–902. [Google Scholar] [CrossRef]
  14. Gao, X.; Shi, Y.; Han, Z.; Wang, M.; Wu, J.; Zhang, D.; Xu, Y.; Giorgi, F. Performance of RegCM4 over Major River Basins in China. Adv. Atmos. Sci. 2017, 34, 441–455. [Google Scholar] [CrossRef]
  15. Fu, G.; Yu, J.; Yu, X.; Ouyang, R.; Zhang, Y.; Wang, P.; Liu, W.; Min, L. Temporal Variation of Extreme Rainfall Events in China, 1961–2009. J. Hydrol. 2013, 487, 48–59. [Google Scholar] [CrossRef]
  16. Zhou, X.; Huang, G.; Wang, X.; Cheng, G. Future Changes in Precipitation Extremes Over Canada: Driving Factors and Inherent Mechanism. J. Geophys. Res. Atmos. 2018, 123, 5783–5803. [Google Scholar] [CrossRef]
  17. Grimm, A.M.; Tedeschi, R.G. ENSO and Extreme Rainfall Events in South America. J. Clim. 2009, 22, 1589–1609. [Google Scholar] [CrossRef]
  18. Wang, W.; Tang, H.; Li, J.; Hou, Y. Spatial-Temporal Variations of Extreme Precipitation Characteristics and Its Correlation with El Niño-Southern Oscillation during 1960–2019 in Hubei Province, China. Atmosphere 2022, 13, 1922. [Google Scholar] [CrossRef]
  19. Chen, W.; Huang, C.; Wang, L.; Li, D. Climate Extremes and Their Impacts on Interannual Vegetation Variabilities: A Case Study in Hubei Province of Central China. Remote Sens. 2018, 10, 477. [Google Scholar] [CrossRef]
  20. Wang, R.; Li, C. Spatiotemporal Analysis of Precipitation Trends during 1961–2010 in Hubei Province, Central China. Theor. Appl. Clim. 2016, 124, 385–399. [Google Scholar] [CrossRef]
  21. Riahi, K.; Rao, S.; Krey, V.; Cho, C.; Chirkov, V.; Fischer, G.; Kindermann, G.; Nakicenovic, N.; Rafaj, P. RCP 8.5-A Scenario of Comparatively High Greenhouse Gas Emissions. Clim. Change 2011, 109, 33–57. [Google Scholar] [CrossRef]
  22. Che, L.; Yin, S.; Guo, Y. Flood Risk Assessment Based on the Historical Disaster Statistics and the Index System Method: A Case Study of Hubei Province, China; PREPRINT (Version 1); Research Square Platform LLC: Durham, NC, USA, 2023. [Google Scholar] [CrossRef]
  23. Tu, Y.; Zhao, Y.; Dong, R.; Wang, H.; Ma, Q.; He, B.; Liu, C. Study on Risk Assessment of Flash Floods in Hubei Province. Water 2023, 15, 617. [Google Scholar] [CrossRef]
  24. Zhu, K.; Cheng, Y.; Zang, W.; Zhou, Q.; El Archi, Y.; Mousazadeh, H.; Kabil, M.; Csobán, K.; Dávid, L.D. Multiscenario Simulation of Land-Use Change in Hubei Province, China Based on the Markov-FLUS Model. Land 2023, 12, 744. [Google Scholar] [CrossRef]
  25. Wu, G.; Lv, P.; Mao, Y.; Wang, K. ERA5 Precipitation over China: Better Relative Hourly and Daily Distribution than Absolute Values. J. Clim. 2023, 37, 1581–1596. [Google Scholar] [CrossRef]
  26. Hoffmann, L.; Günther, G.; Li, D.; Stein, O.; Wu, X.; Griessbach, S.; Heng, Y.; Konopka, P.; Müller, R.; Vogel, B.; et al. From ERA-Interim to ERA5: The Considerable Impact of ECMWF’s next-Generation Reanalysis on Lagrangian Transport Simulations. Atmos. Chem. Phys. 2019, 19, 3097–3214. [Google Scholar] [CrossRef]
  27. Hersbach, H.; Bell, B.; Berrisford, P.; Hirahara, S.; Horányi, A.; Muñoz-Sabater, J.; Nicolas, J.; Peubey, C.; Radu, R.; Schepers, D.; et al. The ERA5 Global Reanalysis. Q. J. R. Meteorol. Soc. 2020, 146, 1999–2049. [Google Scholar] [CrossRef]
  28. Alriah, M.A.A.; Bi, S.; Nkunzimana, A.; Elameen, A.M.; Sarfo, I.; Ayugi, B. Multiple Gridded-Based Precipitation Products’ Performance in Sudan’s Different Topographical Features and the Influence of the Atlantic Multidecadal Oscillation on Rainfall Variability in Recent Decades. Int. J. Climatol. 2022, 42, 9539–9566. [Google Scholar] [CrossRef]
  29. Wu, G.; Qin, S.; Mao, Y.; Ma, Z.; Shi, C. Validation of Precipitation Events in ERA5 to Gauge Observations during Warm Seasons over Eastern China. J. Hydrometeorol. 2022, 23, 807–822. [Google Scholar] [CrossRef]
  30. Giorgi, F.; Pal, J.S.; Bi, X.; Sloan, L.; Elguindi, N.; Solmon, F. Introduction to the TAC Special Issue: The RegCNET Network. Theor. Appl. Clim. 2006, 86, 1–4. [Google Scholar] [CrossRef]
  31. Park, J.; Kang, M.S.; Song, I. Assessment of Flood Vulnerability Based on CMIP5 Climate Projections in South Korea. J. Am. Water Resour. Assoc. 2015, 51, 859–876. [Google Scholar] [CrossRef]
  32. Gong, X.; Wang, X.; Li, Y.; Ma, L.; Li, M.; Si, H. Observed Changes in Extreme Temperature and Precipitation Indices on the Qinghai-Tibet Plateau, 1960–2016. Front. Environ. Sci. 2022, 10, 888937. [Google Scholar] [CrossRef]
  33. Alriah, M.A.A.; Bi, S.; Shahid, S.; Nkunzimana, A.; Ayugi, B.; Ali, A.; Bilal, M.; Teshome, A.; Sarfo, I.; Elameen, A.M. Summer Monsoon Rainfall Variations and Its Association with Atmospheric Circulations over Sudan. J. Atmos. Sol. Terr. Phys. 2021, 225, 105751. [Google Scholar] [CrossRef]
  34. Jiao, D.; Xu, N.; Yang, F.; Xu, K. Evaluation of Spatial-Temporal Variation Performance of ERA5 Precipitation Data in China. Sci. Rep. 2021, 11, 17956. [Google Scholar] [CrossRef] [PubMed]
  35. Xiong, L.; Yan, L.; Du, T.; Yan, P.; Li, L.; Xu, W. Impacts of Climate Change on Urban Extreme Rainfall and Drainage Infrastructure Performance: A Case Study in Wuhan City, China. Irrig. Drain. 2019, 68, 152–164. [Google Scholar] [CrossRef]
  36. Menezes, V.V.; Farrar, J.T.; Bower, A.S. Westward Mountain-Gap Wind Jets of the Northern Red Sea as Seen by QuikSCAT. Remote Sens. Environ. 2018, 209, 677–699. [Google Scholar] [CrossRef]
Figure 1. Location of Hubei Province.
Atmosphere 15 00983 g001
Figure 2. Taylor diagram comparing daily ERA5 products with the output of RegCM.
Atmosphere 15 00983 g002
Figure 3. Annual cycle of daily mean precipitation over 1979–2005. The pink box represents the annual cycle for ERA5, the green box represents the annual cycle before bias correction (BC), and the gray box represents the annual cycle after BC.
Atmosphere 15 00983 g003
Figure 4. Spatial variations in annual mean precipitation over Hubei Province during 1979–2005: (a) precipitation from ERA5 products, (b) simulated precipitation before bias correction, and (c) simulated precipitation after bias correction.
Atmosphere 15 00983 g004
Figure 5. Time series of annual mean precipitation for the ERA5 product and RegCM4 before and after bias correction.
Atmosphere 15 00983 g005
Figure 6. Spatial distribution of five annual mean EPIs in Hubei Province for 1979–2005: (a) Rx5day, (b) R10 mm, (c) CWD, (d) SDD, and (e) SDII.
Atmosphere 15 00983 g006
Figure 7. Temporal patterns for five EPIs over Hubei Province from 1979 to 2005.
Atmosphere 15 00983 g007
Figure 8. Differences in the spatial patterns of the extreme precipitation and climatic indices during the summer between the mid-21st century (2046–2065) and the period of 1986–2005.
Atmosphere 15 00983 g008
Figure 9. Temporal patterns of extreme precipitation and climatic indices during the summer season in the mid-21st century (2046–2065).
Atmosphere 15 00983 g009
Figure 10. Differences in the spatial changes of extreme precipitation and climatic indices during the summer season between the late 21st century and the period of 1986–2005.
Atmosphere 15 00983 g010
Figure 11. Temporal patterns of extreme precipitation and climatic indices during summer in the late 21st century (2078–2097).
Atmosphere 15 00983 g011
Table 1. Definitions of five EPIs used in the study.
Indicator UnitsIndex NameDefinitionsUnits
Rx5dayMaximum 5-day precipitationAnnual maximum consecutive 5-day precipitationmm
R10mmNumber of heavy precipitation daysAnnual number of days when the daily precipitation is >l0 mmdays
CWDConsecutive wet daysAverage daily precipitation on wet days, mm/daydays
CDDConsecutive dry daysAverage daily precipitation on dry days, mm/daydays
SDIISimple daily intensity indexDaily precipitation (≥1 mm) in the yearmm/day
Table 2. Statistical summary of daily historical precipitation over Hubei in an evaluation of RegCM against ERA5.
MeanBiasRMSDRMSESTDR
ERA53.8500011
RegCM3.690.174.344.340.99027
Table 3. Mann–Kendall test for five extreme precipitation indices.
EPISZpTrend
Rx5day751.54270.12291
R10mm300.606360.54427Based on the available data, no statistically significant trend was observed
CWD−350.708790.47845
CDD410.880520.37858
SDII190.375240.70748
Table 4. The M-K test for summer over the mid-21st century.
EPIHighLowSZpTrend
Rx5day 65−30280.8760.38103Non-significant increasing
R10mm 15−5642.0440.040955Significant increasing
CWD40−25431.71950.16175Non-significant increasing
CDD45−15−541.71950.085515Non-significant decreasing
SDII45−15120.356890.77029Non-significant increasing
Table 5. The M-K test for summer over the late 21st century.
EPIHighLowSZpTrend
Rx5day70−55−20.0324440.97412There is no statistically significant trend
Rx10mm15−5−491.55810.1192
CWD20−10240.746220.45554
CDD25−15541.71950.085515
SDII20−10−381.20040.22997
Disclaimer/Publisher’s Note: The statements, opinions and data contained in all publications are solely those of the individual author(s) and contributor(s) and not of MDPI and/or the editor(s). MDPI and/or the editor(s) disclaim responsibility for any injury to people or property resulting from any ideas, methods, instructions or products referred to in the content.

