
Long-Term Wind and Air Temperature Patterns in the Southeastern Region of Iran through Model Simulation and Ground Observations

 , ,
, , 
Abstract
:1. Introduction
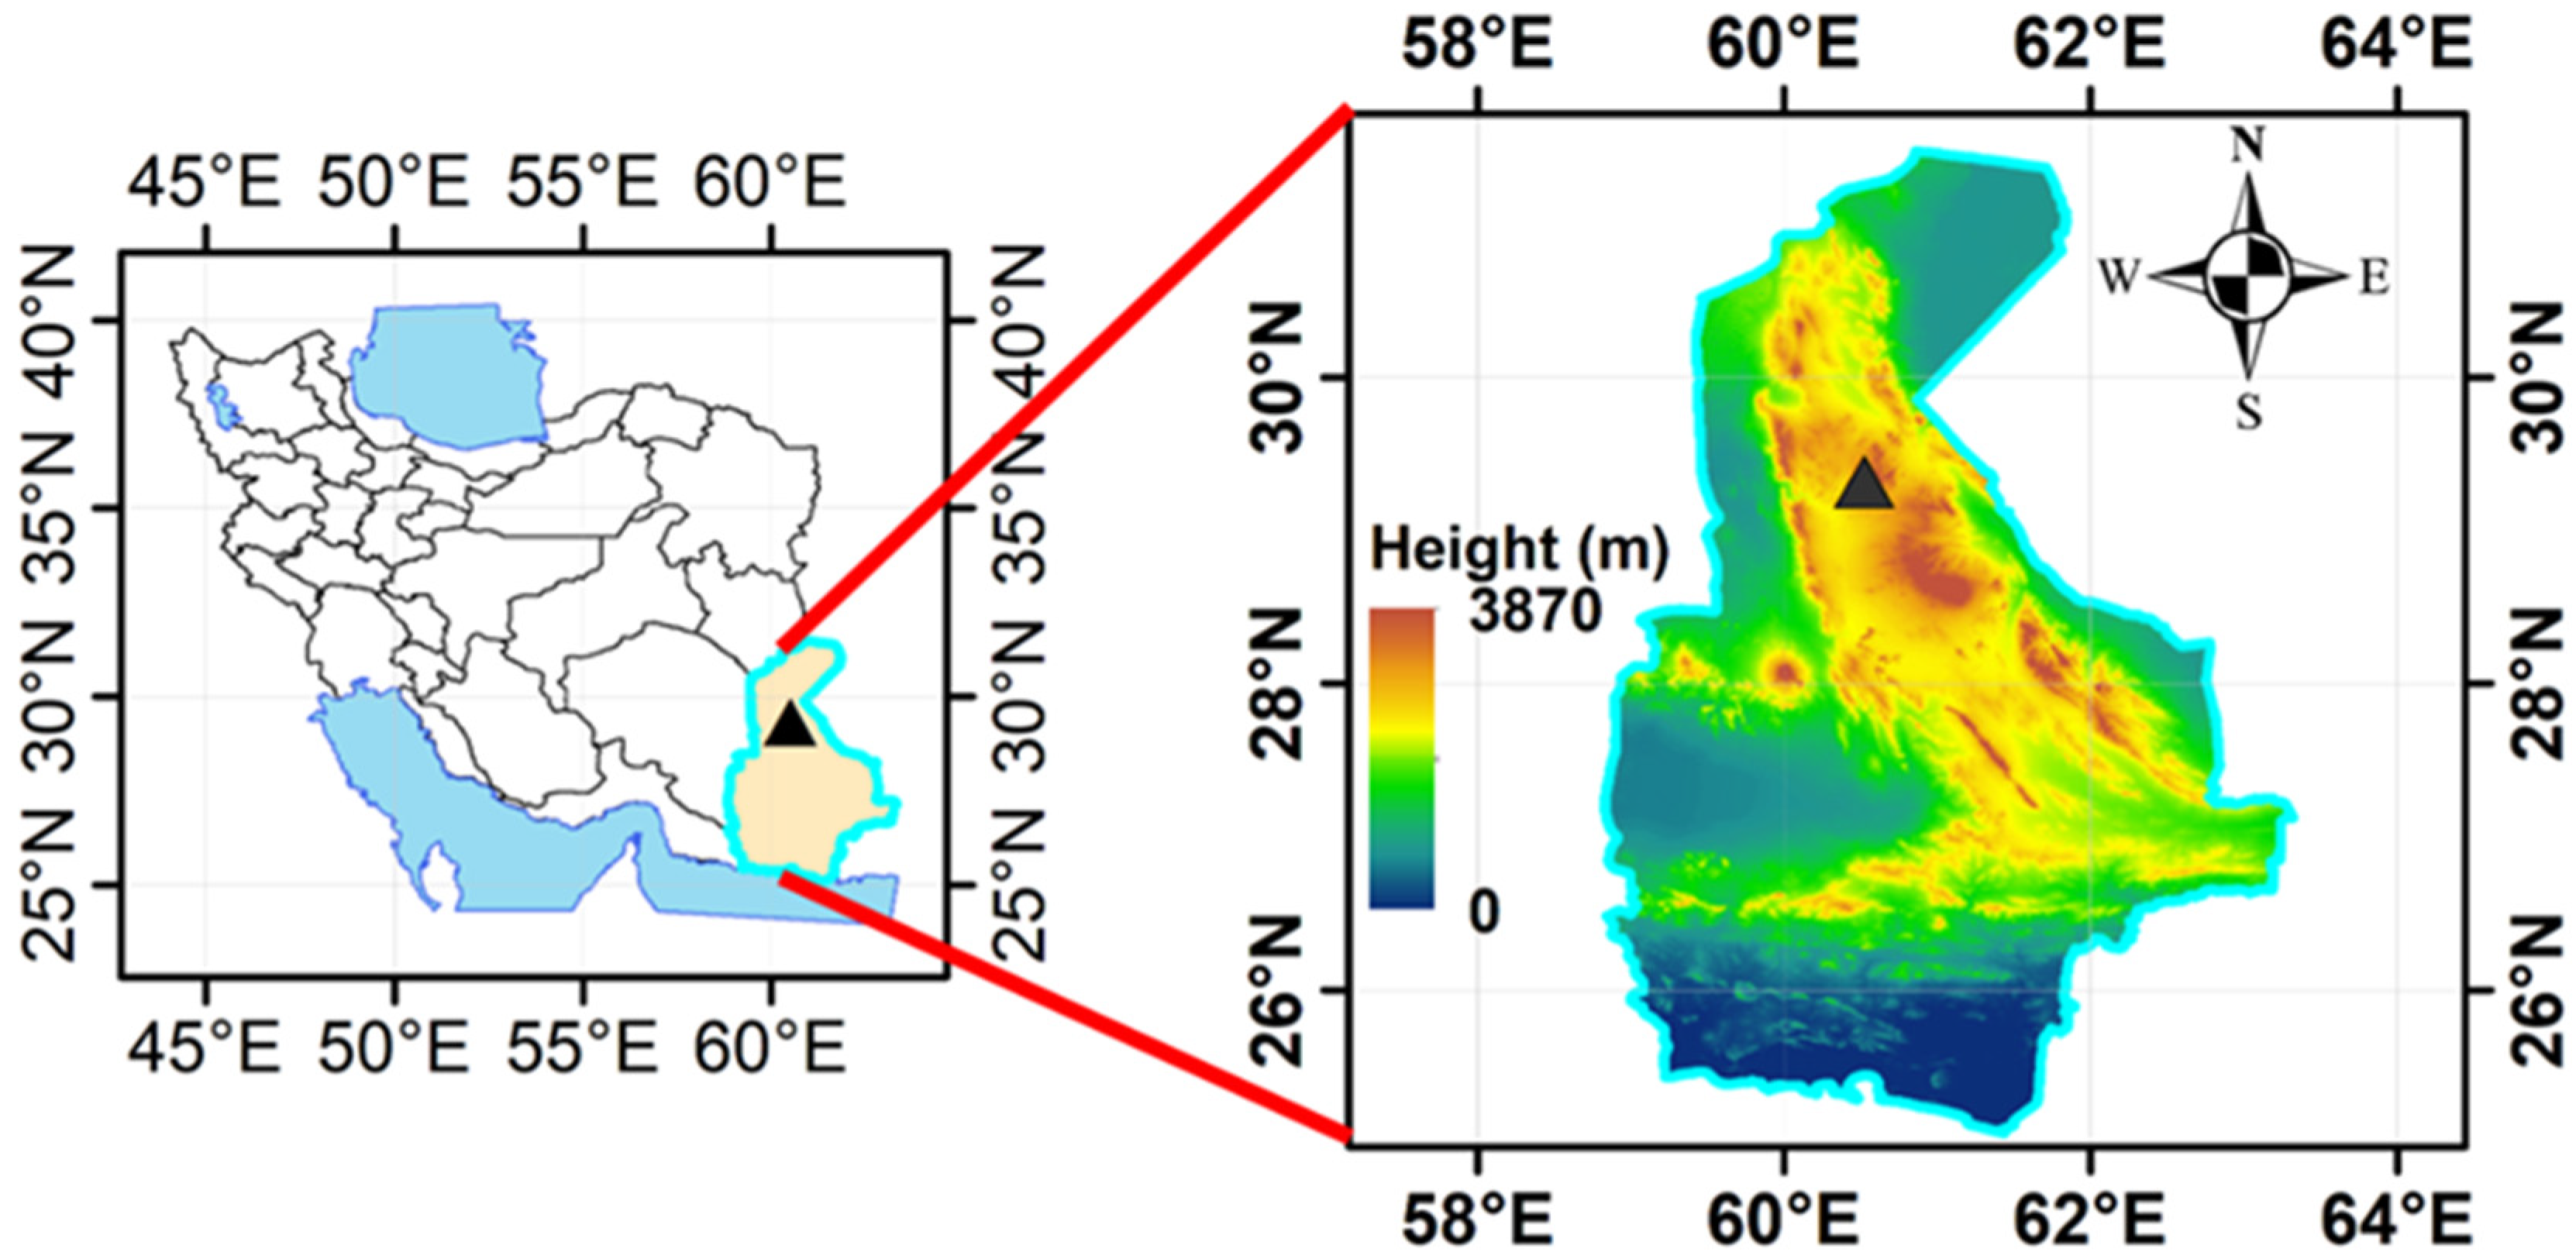
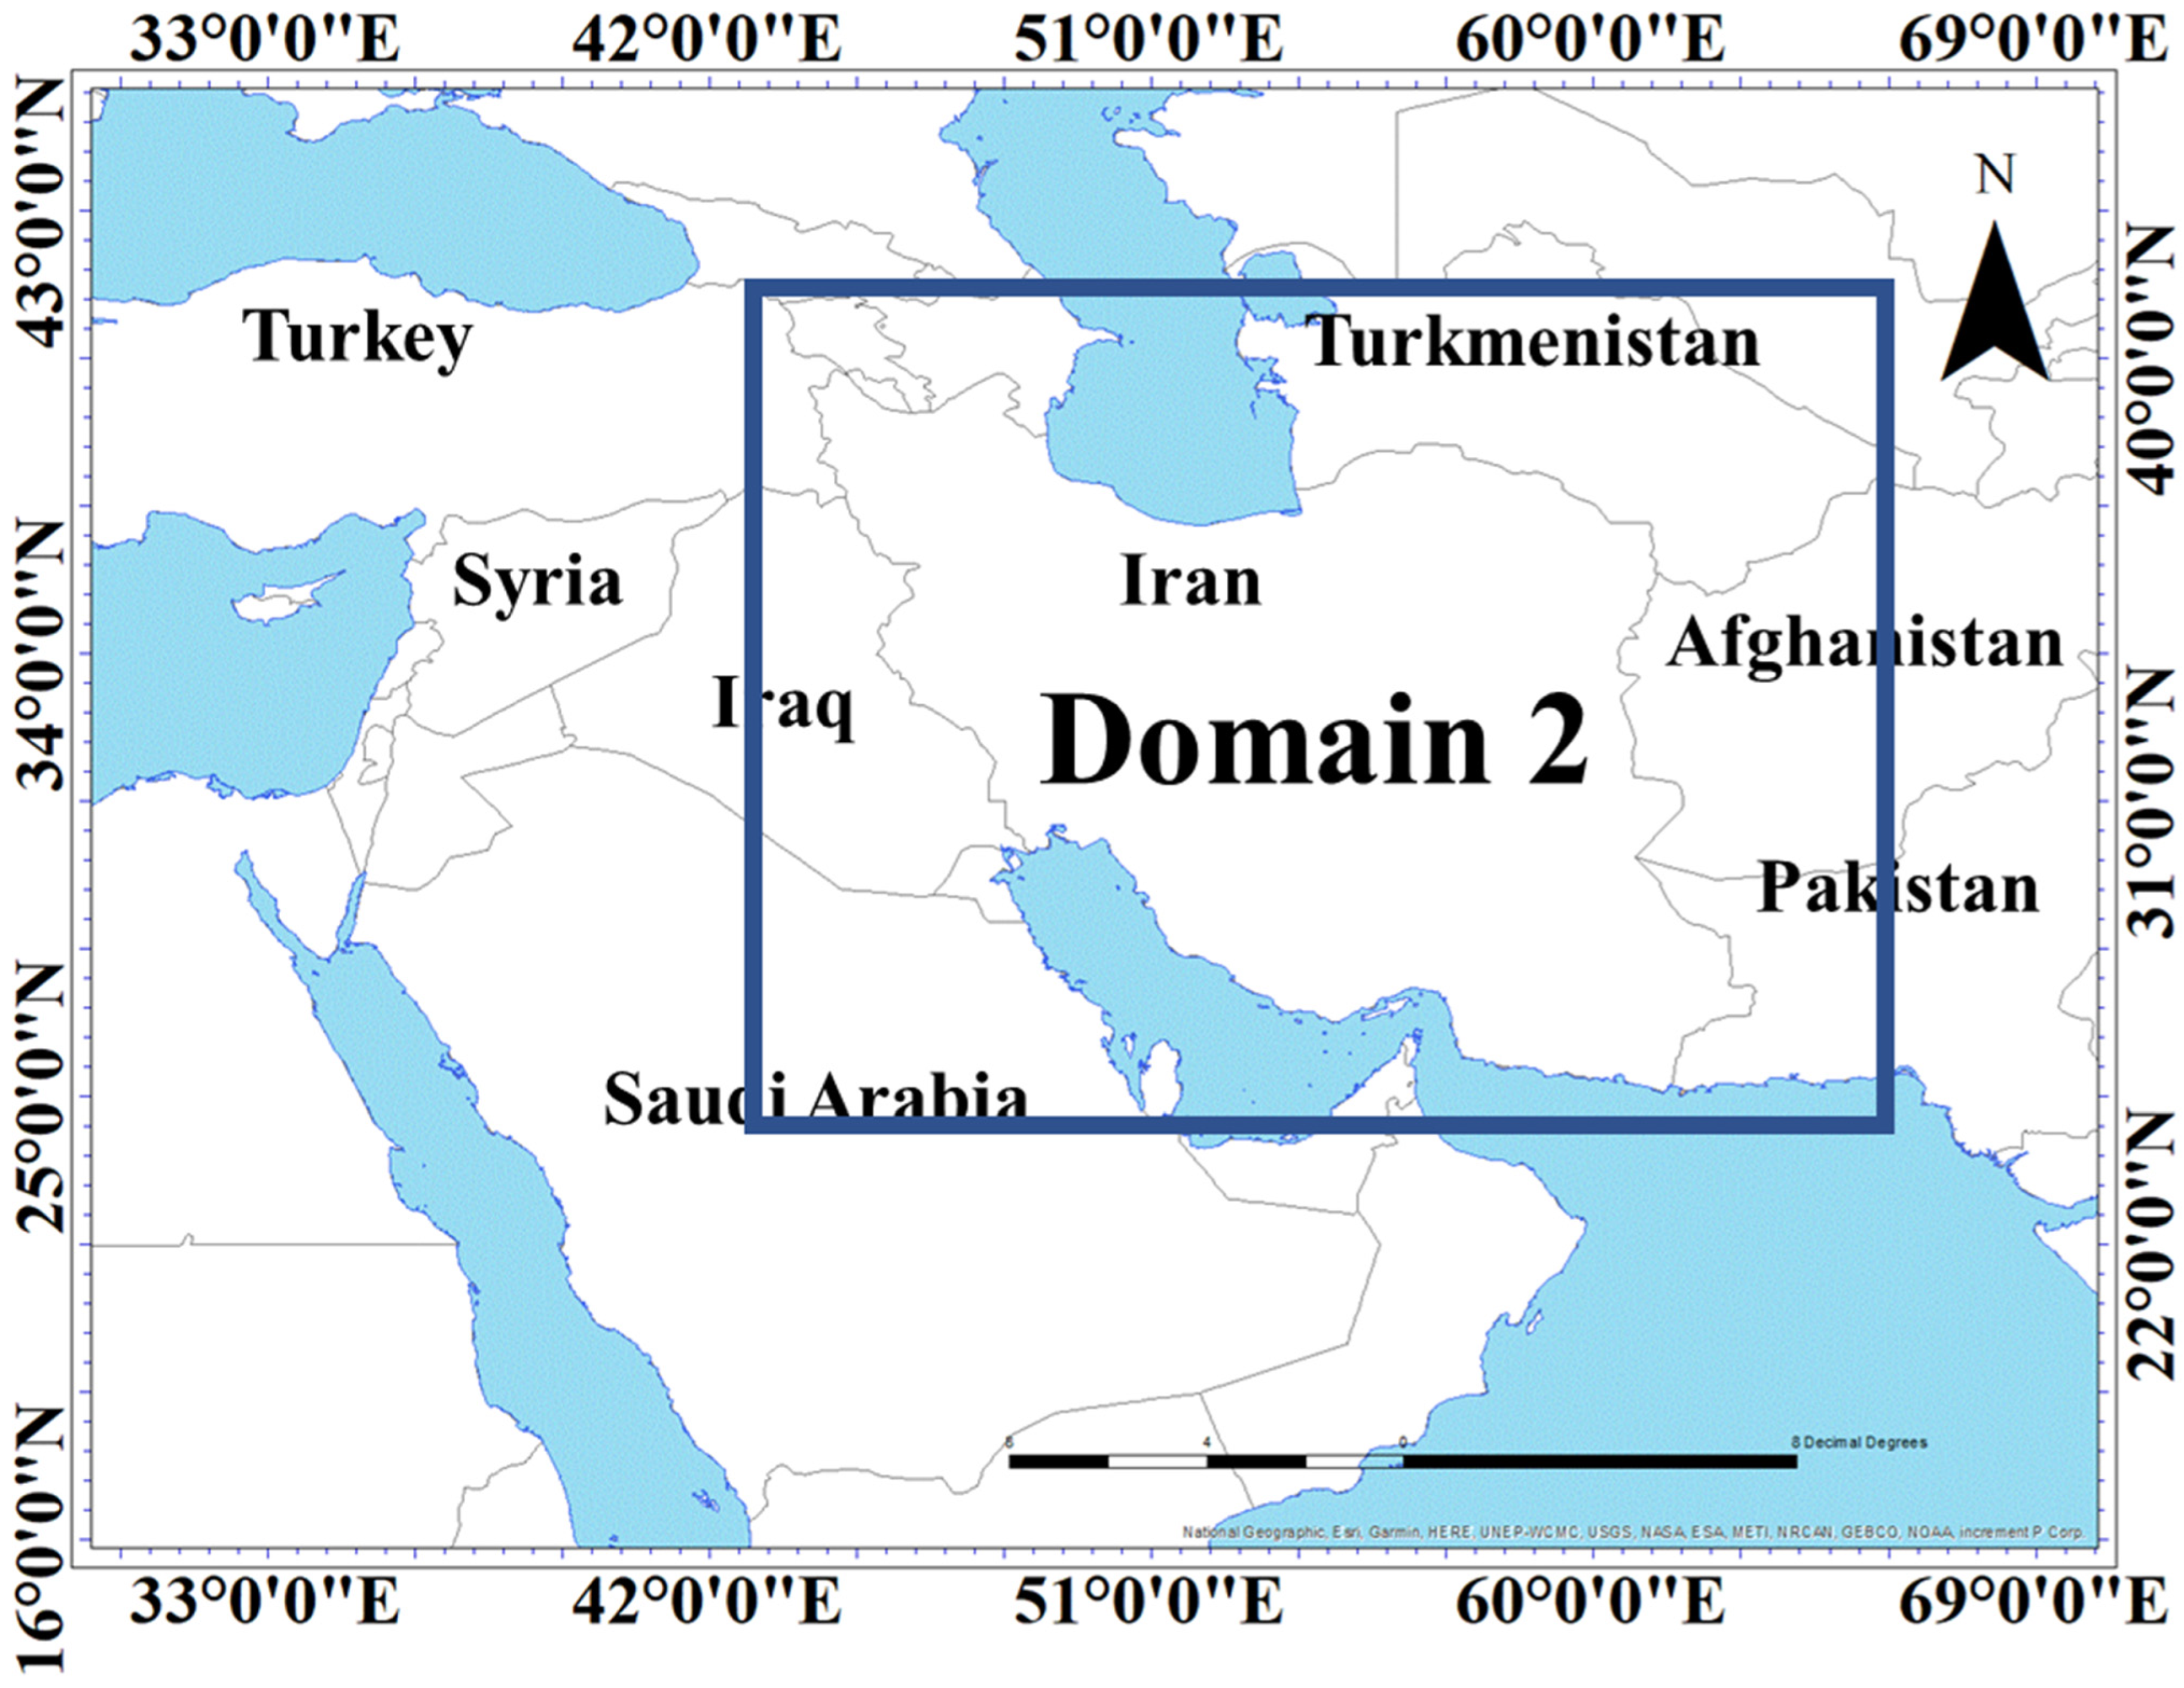
2. Study Area
3. Dataset and Methodology
3.1. Meteorology Dust-Related Data
3.2. Air Temperature, Wind Speed, and Wind Direction Data
3.3. WRF Model
4. Results and Discussion
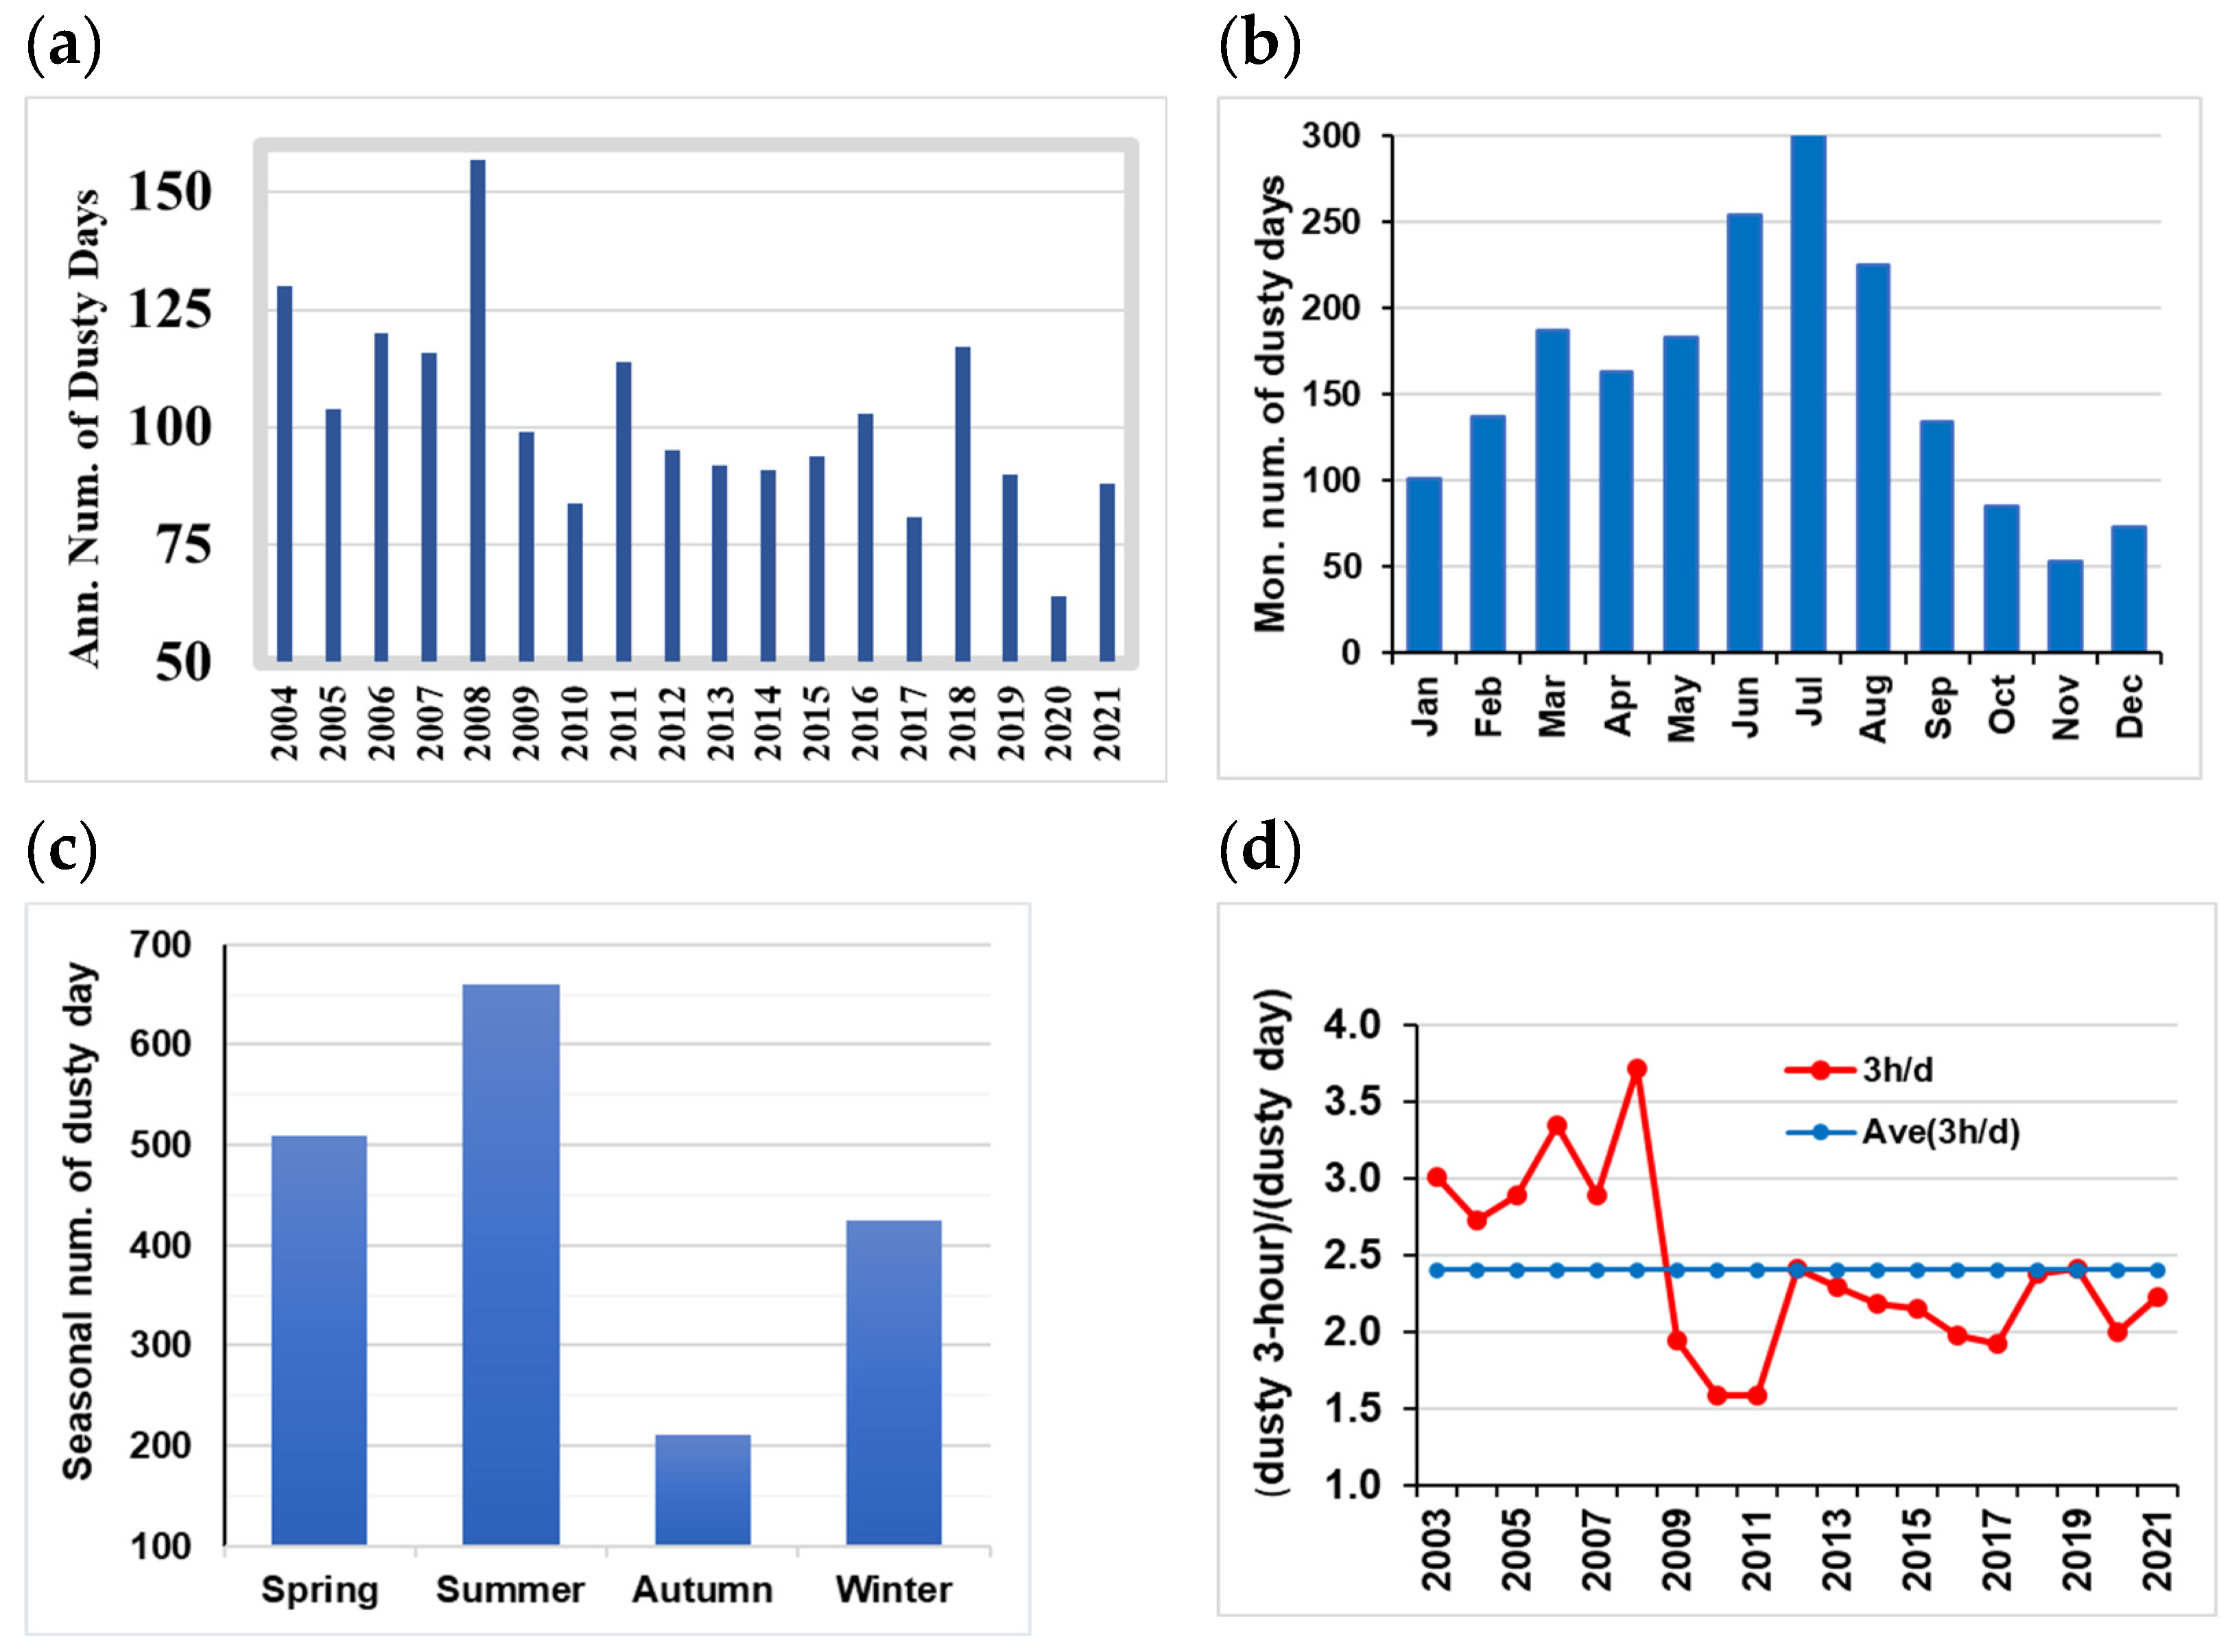
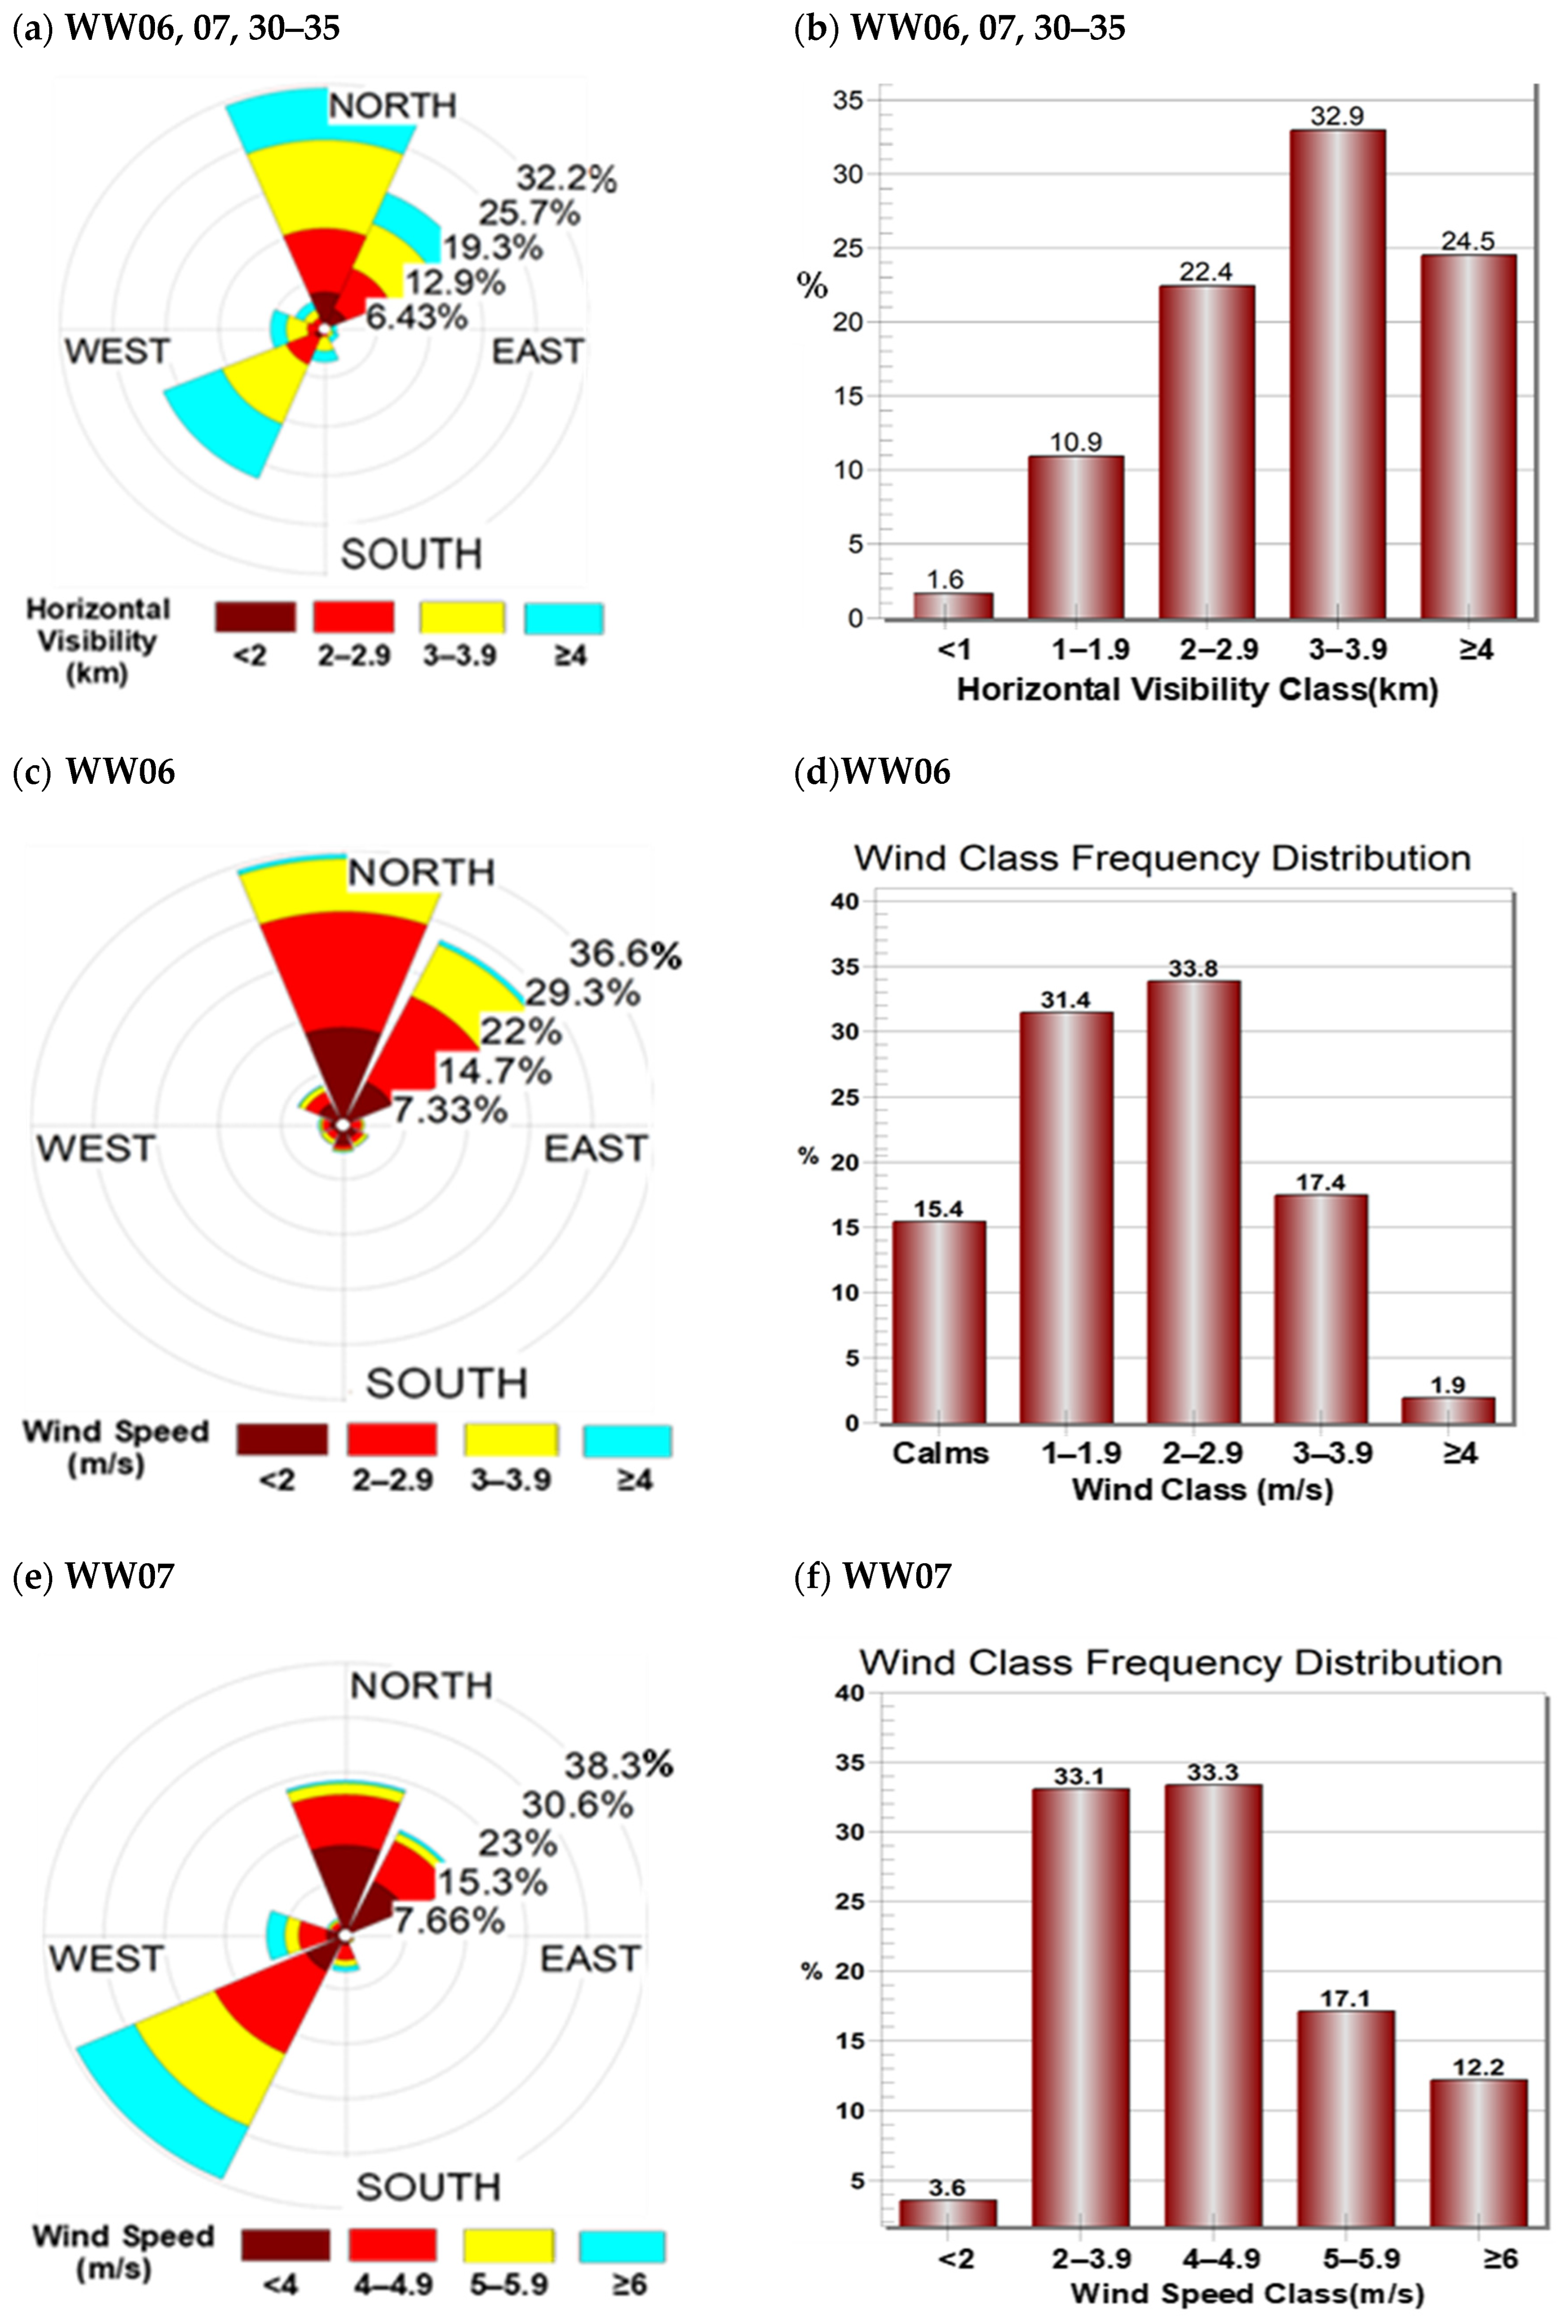
4.1. Investigation of Ground-Based Dust Reports
4.2. WRF Model Simulations
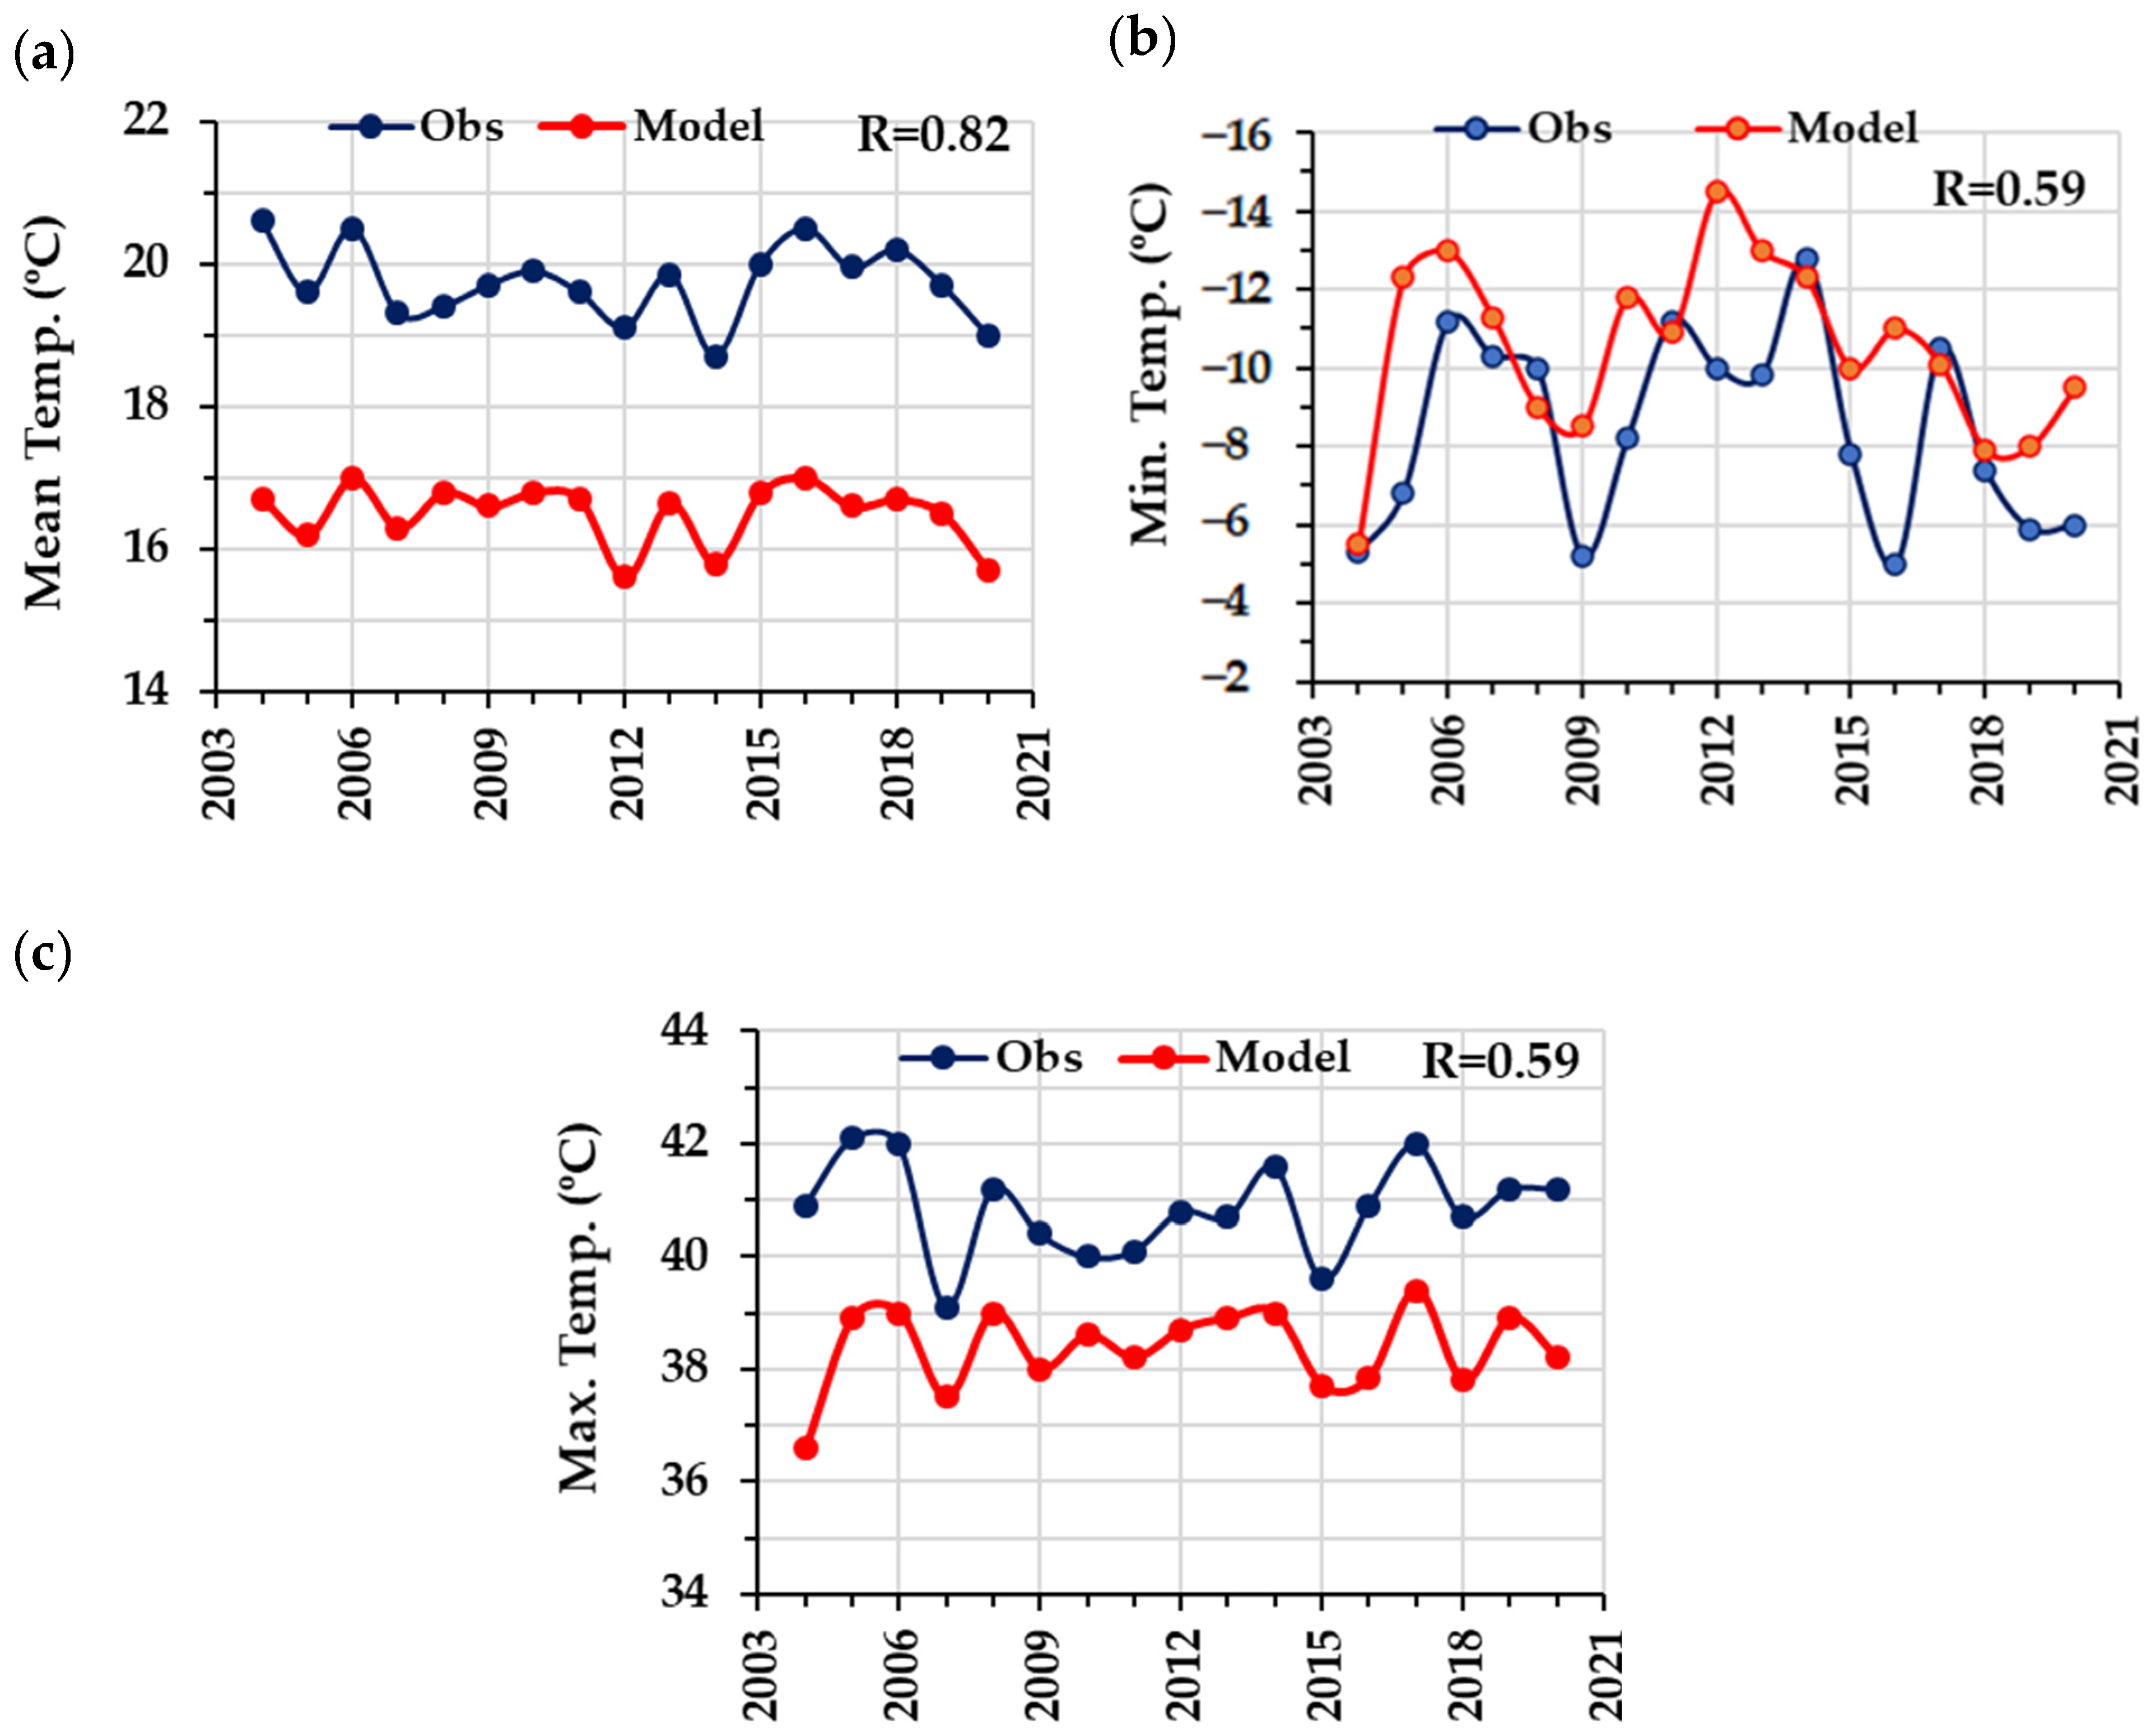
4.2.1. WRF Model Simulations of Air Temperature
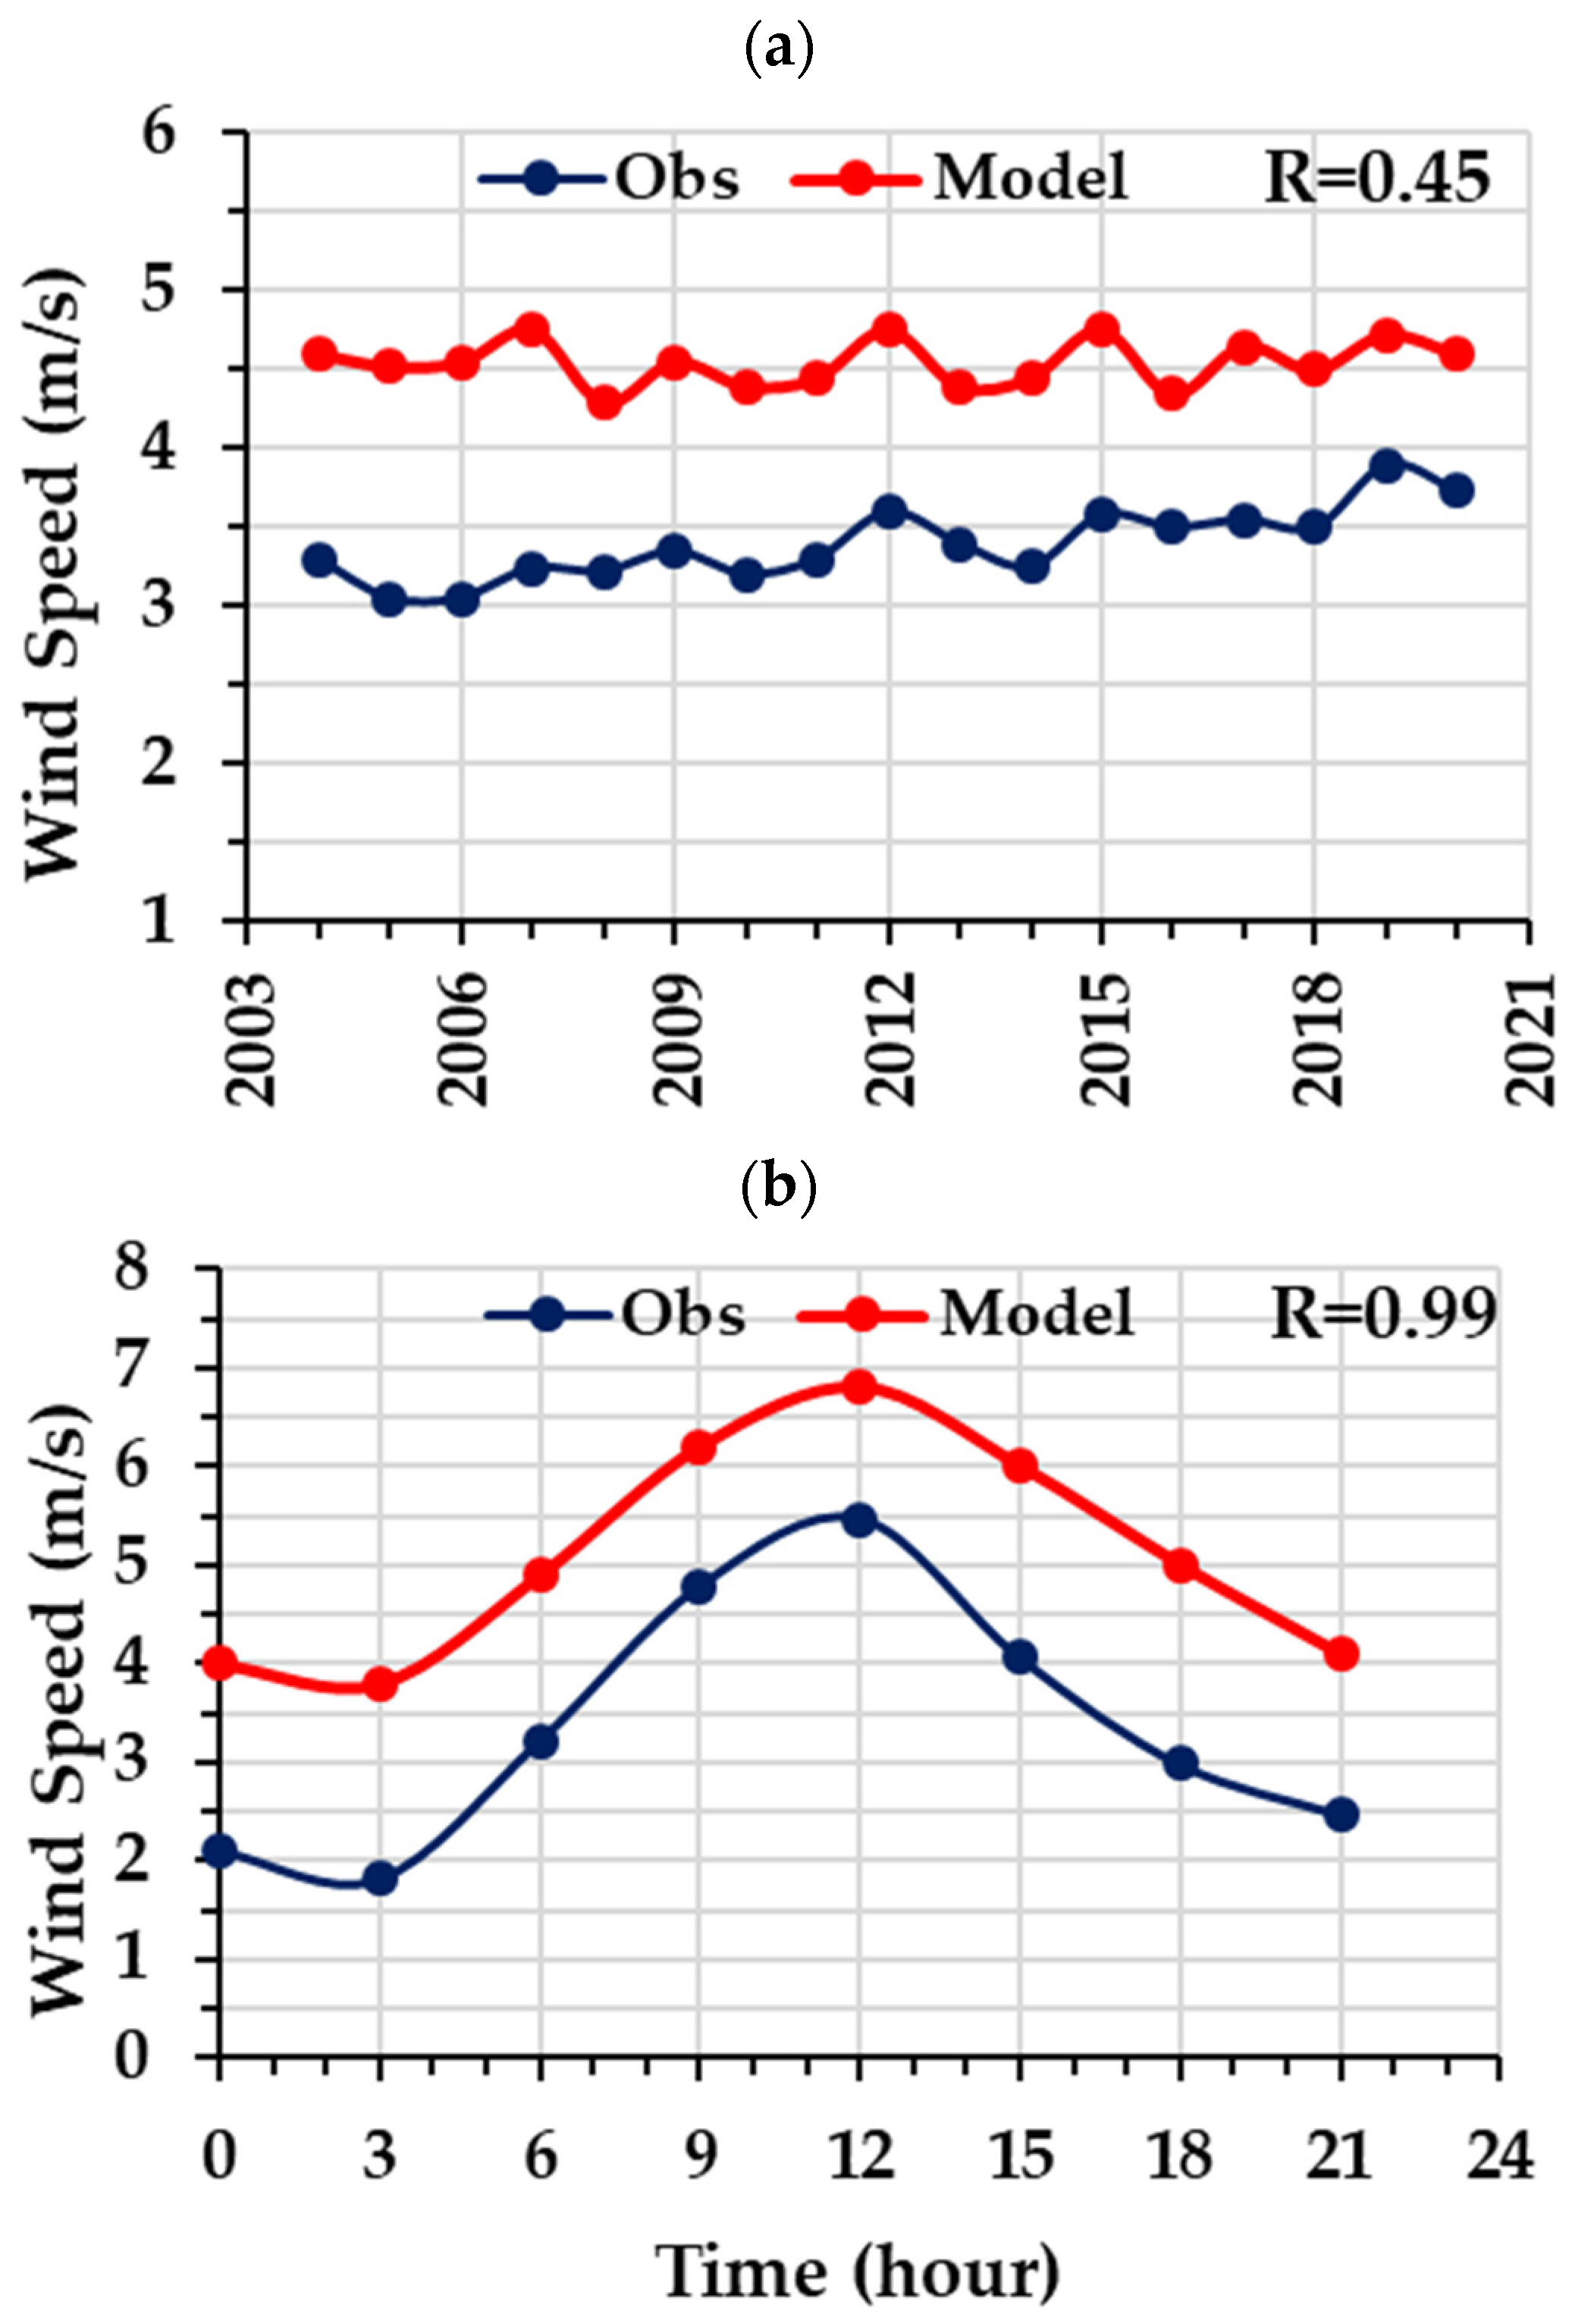
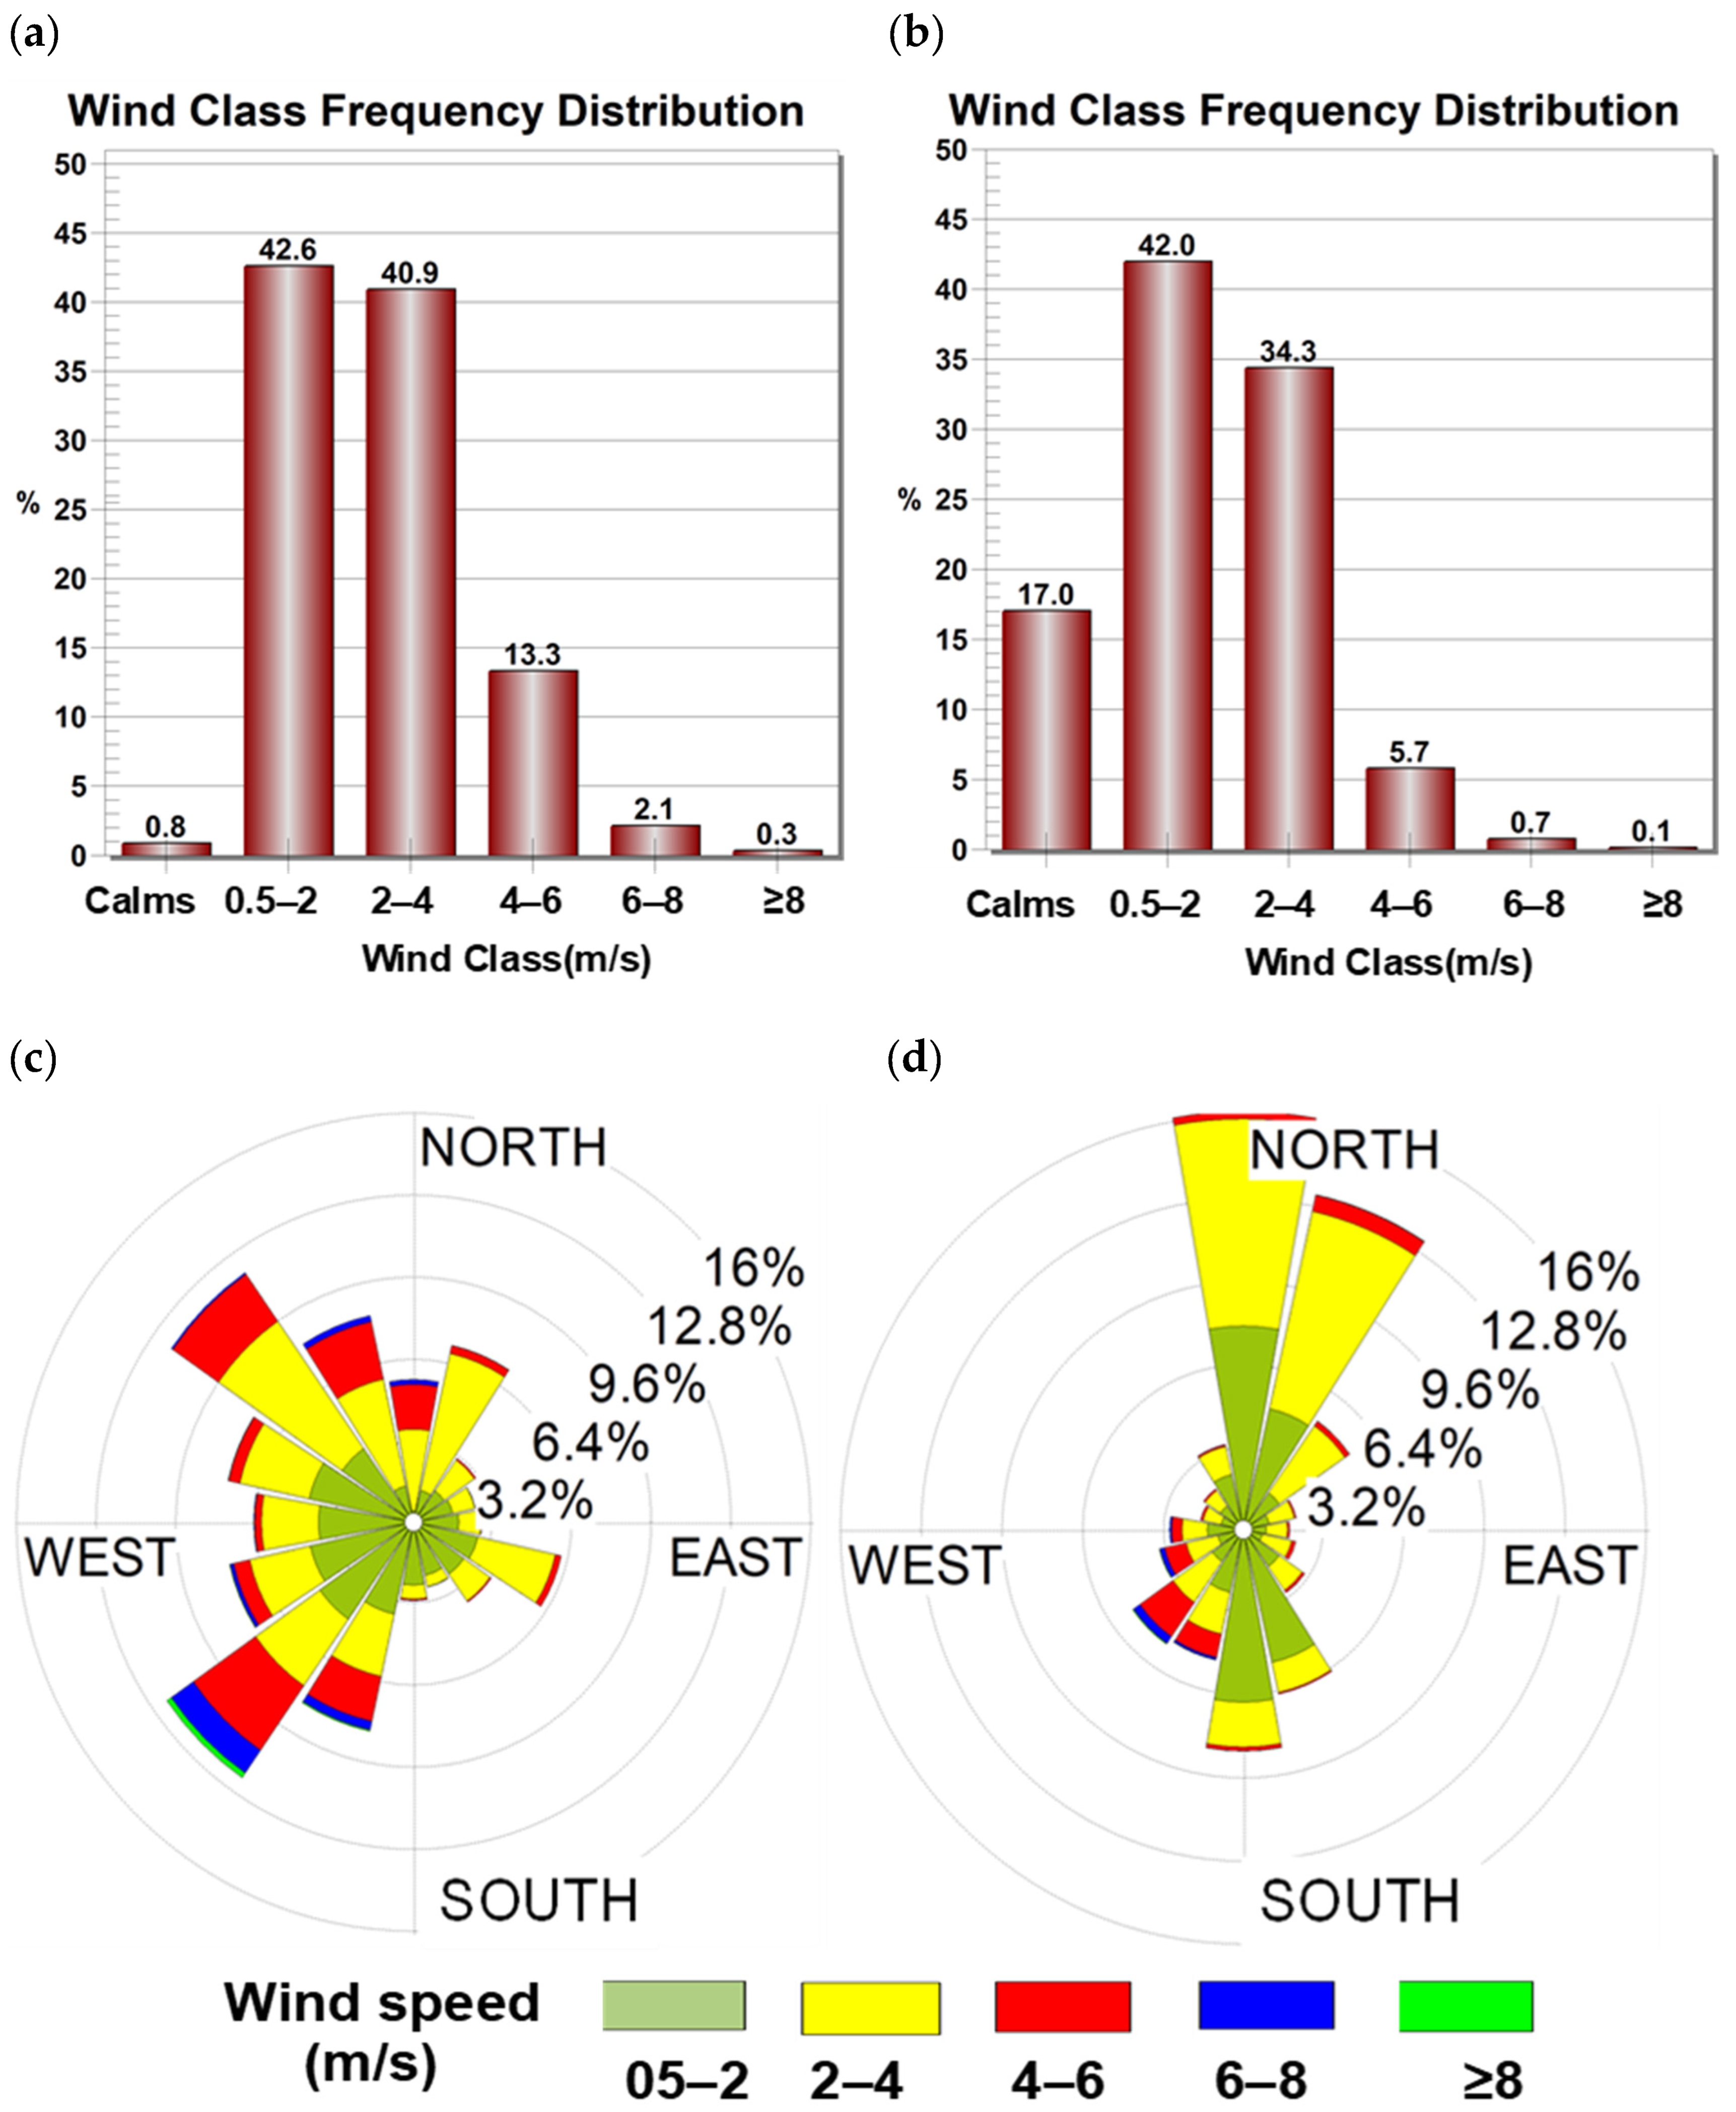
4.2.2. WRF Model Simulations of Wind Speed and Wind Direction
5. Conclusions
Author Contributions
Funding
Institutional Review Board Statement
Informed Consent Statement
Data Availability Statement
Acknowledgments
Conflicts of Interest
Abbreviations
| ACM2 | Asymmetric Convective Model Version 2 |
| DD | Dusty day |
| ECMWF | European Centre for Medium-Range Weather Forecasts |
| ERA5 | ECMWF Reanalysis v5 |
| MYJ | Mellor, Yamada, and Janjić |
| MYNN2.5 | Mellor–Yamada–Nakanishi–Niino |
| PBL | Planetary Boundary Layer |
| PM10 | Particulate matter with an aerodynamic diameter of less than 10 micrometers (µm) |
| RRTM | Rapid Radiative Transfer Model |
| SDS | sand and dust storm |
| QNSE | Quasi-Normal Scale Elimination |
| WW | present Weather |
| YSU | Yonsei University |
References
- Griffin, D.W.; Kellogg, C.A. Dust storms and their impact on ocean and human health: Dust in earth’s atmosphere. Ecohealth 2004, 1, 284–295. [Google Scholar] [CrossRef]
- Sissakian, V.K.; Al-Ansari, N.; Knutsson, S. Sand and dust storm events in Iraq. J. Nat. Sci. 2013, 5, 1084–1094. [Google Scholar] [CrossRef]
- Kok, J.F.; Adebiyi, A.A.; Albani, S.; Balkanski, Y.; Checa-Garcia, R.; Chin, M.; Colarco, P.R.; Hamilton, D.S.; Huang, Y.; Ito, A.; et al. Contribution of the world’s main dust source regions to the global cycle of desert dust. Atmos. Chem. Phys. 2021, 21, 8169–8193. [Google Scholar] [CrossRef]
- Darvishi Boloorani, A.; Papi, R.; Soleimani, M.; Karami, L.; Amiri, F.; Samany, N.N. Water bodies changes in Tigris and Euphrates basin has impacted dust storms phenomena. Aeolian Res. 2021, 50, 100698. [Google Scholar] [CrossRef]
- Hamzeh, N.H.; Shukurov, K.; Mohammadpour, K.; Kaskaoutis, D.G.; Abadi, A.R.S.; Shahabi, H. A comprehensive investigation of the causes of drying and increasing saline dust in the Urmia Lake, northwest Iran, via ground and satellite observations, synoptic analysis and machine learning models. Ecol. Inform. 2023, 78, 102355. [Google Scholar] [CrossRef]
- Hamzeh, N.H.; Abadi, A.R.S.; Shukurov, K.A.; Mhawish, A.; Alam, K.; Opp, C.; Meteorology, K.N.C.F.; Marburg, G.P.-U. Simulation and synoptic investigation of a severe dust storm originated from the Urmia Lake in the Middle East. Atmósfera 2024, 38, 531–555. [Google Scholar] [CrossRef]
- Abadi, A.R.S.; Hamzeh, N.H.; Shukurov, K.; Opp, C.; Dumka, U.C. Long-term investigation of aerosols in the Urmia Lake region in the Middle East by ground-based and satellite data in 2000–2021. Remote Sens. 2022, 14, 3827. [Google Scholar] [CrossRef]
- Hamzeh, N.H.; Abadi, A.R.S.; Kaskaoutis, D.G.; Mirzaei, E.; Shukurov, K.A.; Sotiropoulou, R.-E.P.; Tagaris, E. The Importance of Wind Simulations over Dried Lake Beds for Dust Emissions in the Middle East. Atmosphere 2023, 15, 24. [Google Scholar] [CrossRef]
- Hamzeh, N.H.; Kaskaoutis, D.G.; Rashki, A.; Mohammadpour, K. Long-term variability of dust events in southwestern Iran and its relationship with the drought. Atmosphere 2021, 12, 1350. [Google Scholar] [CrossRef]
- Rashki, A.; Middleton, N.J.; Goudie, A.S. Dust storms in Iran–Distribution, causes, frequencies and impacts. Aeolian Res. 2020, 48, 100655. [Google Scholar] [CrossRef]
- Maleki, S.; Miri, A.; Rahdari, V.; Dragovich, D. A method to select sites for sand and dust storm source mitigation: Case study in the Sistan region of southeast Iran. J. Environ. Plan. Manag. 2021, 64, 2192–2213. [Google Scholar] [CrossRef]
- Lababpour, A. The response of dust emission sources to climate change: Current and future simulation for southwest of Iran. Sci. Total. Environ. 2020, 714, 136821. [Google Scholar] [CrossRef] [PubMed]
- Cao, H.; Liu, J.; Wang, G.; Yang, G.; Luo, L. Identification of sand and dust storm source areas in Iran. J. Arid. Land 2015, 7, 567–578. [Google Scholar] [CrossRef]
- Adib, A.; Oulapour, M.; Chatroze, A. Effects of wind velocity and soil characteristics on dust storm generation in Hawr-al-Azim Wetland, Southwest Iran. Casp. J. Environ. Sci. 2018, 16, 333–347. [Google Scholar]
- Broomandi, P.; Dabir, B.; Bonakdarpour, B.; Rashidi, Y. Identification of dust storm origin in South–West of Iran. J. Environ. Health Sci. Eng. 2017, 15, 16. [Google Scholar] [CrossRef] [PubMed]
- Karami, S.; Hamzeh, N.H.; Kaskaoutis, D.G.; Rashki, A.; Alam, K.; Ranjbar, A. Numerical simulations of dust storms originated from dried lakes in central and southwest Asia: The case of Aral Sea and Sistan Basin. Aeolian Res. 2021, 50, 100679. [Google Scholar] [CrossRef]
- Rashki, A.; Kaskaoutis, D.G.; Rautenbach, C.J.D.; Eriksson, P.G.; Qiang, M.; Gupta, P. Dust storms and their horizontal dust loading in the Sistan region, Iran. Aeolian Res. 2012, 5, 51–62. [Google Scholar] [CrossRef]
- Zucca, C.; Middleton, N.; Kang, U.; Liniger, H. Shrinking water bodies as hotspots of sand and dust storms: The role of land degradation and sustainable soil and water management. Catena 2021, 207, 105669. [Google Scholar] [CrossRef]
- Beyranvand, A.; Azizi, G.; Alizadeh, O.; Boloorani, A.D. Dust in Western Iran: The emergence of new sources in response to shrinking water bodies. Sci. Rep. 2023, 13, 16158. [Google Scholar] [CrossRef]
- Rashki, A.; Kaskaoutis, D.; Goudie, A.; Kahn, R. Dryness of ephemeral lakes and consequences for dust activity: The case of the Hamoun drainage basin, southeastern Iran. Sci. Total Environ. 2013, 463–464, 552–564. [Google Scholar] [CrossRef]
- Rashki, A.; Kaskaoutis, D.; Francois, P.; Kosmopoulos, P.; Legrand, M. Dust-storm dynamics over Sistan region, Iran: Seasonality, transport characteristics and affected areas. Aeolian Res. 2015, 16, 35–48. [Google Scholar] [CrossRef]
- Hamidianpour, M.; Jahanshahi, S.M.A.; Kaskaoutis, D.G.; Rashki, A.; Nastos, P.G. Climatology of the Sistan Levar wind: Atmospheric dynamics driving its onset, duration and withdrawal. Atmos. Res. 2021, 260, 105711. [Google Scholar] [CrossRef]
- Alizadeh, O.; Abniki, M.; Babaei, M.; Irannejad, P. Climatology and the dynamic mechanism of the Levar wind and dust events in eastern Iran. Int. J. Clim. 2022, 42, 9288–9303. [Google Scholar] [CrossRef]
- An, L.; Che, H.; Xue, M.; Zhang, T.; Wang, H.; Wang, Y.; Zhou, C.; Zhao, H.; Gui, K.; Zheng, Y.; et al. Temporal and spatial variations in sand and dust storm events in East Asia from 2007 to 2016: Relationships with surface conditions and climate change. Sci. Total. Environ. 2018, 633, 452–462. [Google Scholar] [CrossRef] [PubMed]
- Alizadeh-Choobari, O.; Zawar-Reza, P.; Sturman, A. The “wind of 120 days” and dust storm activity over the Sistan Basin. Atmos. Res. 2014, 143, 328–341. [Google Scholar] [CrossRef]
- Csavina, J.; Field, J.; Félix, O.; Corral-Avitia, A.Y.; Sáez, A.E.; Betterton, E.A. Effect of wind speed and relative humidity on atmospheric dust concentrations in semi-arid climates. Sci. Total Environ. 2014, 487, 82–90. [Google Scholar] [CrossRef] [PubMed]
- Dar, M.A.; Ahmed, R.; Latif, M.; Azam, M. Climatology of dust storm frequency and its association with temperature and precipitation patterns over Pakistan. Nat. Hazards 2022, 110, 655–677. [Google Scholar] [CrossRef]
- Karami, S.; Hamzeh, N.H.; Abadi, A.R.S.; Madhavan, B.L. Investigation of a severe frontal dust storm over the Persian Gulf in February 2020 by CAMS model. Arab. J. Geosci. 2021, 14, 2041. [Google Scholar] [CrossRef]
- Karami, S.; Hamzeh, N.H.; Noori, F.; Ranjbar, A. Investigation of dust storms in Ilam and the performance analysis of simulation of 6 numerical prediction models at a severe dust storm in west of Iran. J. Air Pollut. Health 2019, 4, 133–146. [Google Scholar] [CrossRef]
- Liu, X.D.; Yin, Z.Y.; Zhang, X.-Y.; Yang, X.C. Analyses of the spring dust storm frequency of northern China in relation to antecedent and concurrent wind, precipitation, vegetation, and soil moisture conditions. J. Geophys. Res. Space Phys. 2004, 109, D16210. [Google Scholar] [CrossRef]
- Kim, D.; Chin, M.; Remer, L.A.; Diehl, T.; Bian, H.; Yu, H.; Brown, M.E.; Stockwell, W.R. Role of surface wind and vegetation cover in multi-decadal variations of dust emission in the Sahara and Sahel. Atmos. Environ. 2016, 148, 282–296. [Google Scholar] [CrossRef]
- Hamzeh, N.H.; Karami, S.; Kaskaoutis, D.G.; Tegen, I.; Moradi, M.; Opp, C. Atmospheric dynamics and numerical simulations of six frontal dust storms in the Middle East region. Atmosphere 2021, 12, 125. [Google Scholar] [CrossRef]
- Xu, J.; Hou, S.; Qin, D.; Kang, S.; Ren, J.; Ming, J. Dust storm activity over the Tibetan Plateau recorded by a shallow ice core from the north slope of Mt. Qomolangma (Everest), Tibet-Himal region. Geophys. Res. Lett. 2007, 34, L17504. [Google Scholar] [CrossRef]
- Zhai, L.; Sun, Z.; Li, Z.; Yin, X.; Xiong, Y.; Wu, J.; Li, E.; Kou, X. Dynamic effects of topography on dust particles in the Beijing region of China. Atmos. Environ. 2019, 213, 413–423. [Google Scholar] [CrossRef]
- Saadatabadi, A.R.; Hamzeh, N.H.; Kaskaoutis, D.G.; Ghasabi, Z.; Penchah, M.M.; Sotiropoulou, R.-E.P.; Habibi, M. Optimization and evaluation of the Weather Research and Forecasting (WRF) model for wind energy resource assessment and mapping in Iran. Appl. Sci. 2024, 14, 3304. [Google Scholar] [CrossRef]
- Yang, B.; Bräuning, A.; Zhang, Z.; Dong, Z.; Esper, J. Dust storm frequency and its relation to climate changes in Northern China during the past 1000 years. Atmos. Environ. 2007, 41, 9288–9299. [Google Scholar] [CrossRef]
- Goossens, D.; Offer, Z.Y. Wind tunnel and field calibration of six aeolian dust samplers. Atmos. Environ. 2000, 34, 1043–1057. [Google Scholar] [CrossRef]
- Preston, C.A.; Neuman, C.M.; Boulton, J.W. A wind tunnel and field evaluation of various dust suppressants. J. Air Waste Manag. Assoc. 2020, 70, 915–931. [Google Scholar] [CrossRef]
- Zhang, J.; Shao, Y.; Huang, N. Measurements of dust deposition velocity in a wind-tunnel experiment. Atmos. Meas. Technol. 2014, 14, 8869–8882. [Google Scholar] [CrossRef]
- Shannak, B.; Corsmeier, U.; Kottmeier, C.; Al-Azab, T. Wind tunnel study of twelve dust samples by large particle size. Atmos. Environ. 2014, 98, 442–453. [Google Scholar] [CrossRef]
- Draxler, R.R.; Hess, G.D. An overview of the HYSPLIT_4 modelling system for trajectories. Aust. Meteorol. Mag. 1998, 47, 295–308. [Google Scholar]
- Escudero, M.; Stein, A.; Draxler, R.R.; Querol, X.; Alastuey, A.; Castillo, S.; Avila, A. Determination of the contribution of northern Africa dust source areas to PM10 concentrations over the central Iberian Peninsula using the Hybrid Single-Particle Lagrangian Integrated Trajectory model (HYSPLIT) model. J. Geophys. Res. Atmos. 2006, 111, D06210. [Google Scholar] [CrossRef]
- McGowan, H.; Clark, A. Identification of dust transport pathways from Lake Eyre, Australia using Hysplit. Atmos. Environ. 2008, 42, 6915–6925. [Google Scholar] [CrossRef]
- Kurosaki, Y.; Mikami, M. Threshold wind speed for dust emission in east Asia and its seasonal variations. J. Geophys. Res. Atmos. 2007, 112, D17202. [Google Scholar] [CrossRef]
- Webb, N.P.; Strong, C.L. Soil erodibility dynamics and its representation for wind erosion and dust emission models. Aeolian Res. 2011, 3, 165–179. [Google Scholar] [CrossRef]
- Gillette, D.A.; Passi, R. Modeling dust emission caused by wind erosion. J. Geophys. Res. Atmos. 1988, 93, 14233–14242. [Google Scholar] [CrossRef]
- Tian, M.; Gao, J.; Zhang, L.; Zhang, H.; Feng, C.; Jia, X. Effects of dust emissions from wind erosion of soil on ambient air quality. Atmos. Pollut. Res. 2021, 12, 101108. [Google Scholar] [CrossRef]
- Liu, M.; Westphal, D.L.; Holt, T.R.; Xu, Q. Numerical Simulation of a Low-Level Jet over Complex Terrain in Southern Iran. Mon. Weather Rev. 2000, 128, 1309–1327. [Google Scholar] [CrossRef]
- Parno, R.; Meshkatee, A.-H.; Hassan, E.M.; Hamzeh, N.H.; Ooi, M.C.G.; Habibi, M. Investigating the Role of the Low-Level Jet in Two Winters Severe Dust Rising in Southwest Iran. Atmosphere 2024, 15, 400. [Google Scholar] [CrossRef]
- Abadi, A.R.S.; Hamzeh, N.H.; Ooi, M.C.G.; Kong, S.S.-K.; Opp, C. Investigation of two severe shamal dust storms and the highest dust Frequencies in the South and Southwest of Iran. Atmosphere 2022, 13, 1990. [Google Scholar] [CrossRef]
- Alizadeh-Choobari, O.; Ghafarian, P.; Owlad, E. Temporal variations in the frequency and concentration of dust events over Iran based on surface observations. Int. J. Climatol. 2016, 36, 2050–2062. [Google Scholar] [CrossRef]
- Asghari, M.; Meshkatee, A.; Abadi, A.R.S.; Moradi, M. Investigation of Atmospheric Pattern and Simulation of the Frontal Sandstorm Emission over Eastern and Southeastern Iran (case study 23 & 24 April 2019). Pollution 2021, 7, 73–85. [Google Scholar] [CrossRef]
- Rashki, A.; Kaskaoutis, D.G.; Sepehr, A. Statistical evaluation of the dust events at selected stations in Southwest Asia: From the Caspian Sea to the Arabian Sea. Catena 2018, 165, 590–603. [Google Scholar] [CrossRef]
- Behrooz, R.D.; Mohammadpour, K.; Broomandi, P.; Kosmopoulos, P.G.; Gholami, H.; Kaskaoutis, D.G. Long-term (2012–2020) PM10 concentrations and increasing trends in the Sistan Basin: The role of Levar wind and synoptic meteorology. Atmos. Pollut. Res. 2022, 13, 101460. [Google Scholar] [CrossRef]
- Rashki, A.; Kaskaoutis, D.G.; Mofidi, A.; Minvielle, F.; Chiapello, I.; Legrand, M.; Dumka, U.C.; Francois, P. Effects of Monsoon, Shamal and Levar winds on dust accumulation over the Arabian Sea during summer—The July 2016 case. Aeolian Res. 2018, 36, 27–44. [Google Scholar] [CrossRef]
- Choobari, O.A.; Zawar-Reza, P.; Sturman, A. The global distribution of mineral dust and its impacts on the climate system: A review. Atmos. Res. 2014, 138, 152–165. [Google Scholar] [CrossRef]
- Miri, A.; Ahmadi, H.; Ekhtesasi, M.R.; Panjehkeh, N.; Ghanbari, A. Environmental and socio-economic impacts of dust storms in Sistan Region, Iran. Int. J. Environ. Stud. 2009, 66, 343–355. [Google Scholar] [CrossRef]
- Rashki, A.; Rautenbach, C.J.D.; Eriksson, P.G.; Kaskaoutis, D.G.; Gupta, P. Temporal changes of particulate concentration in the ambient air over the city of Zahedan, Iran. Air Qual. Atmos. Health 2011, 6, 123–135. [Google Scholar] [CrossRef]
- Hersbach, H.; De Rosnay, P.; Bell, B.; Schepers, D.; Simmons, A.; Soci, C.; Abdalla, S.; Alonso-Balmaseda, M.; Balsamo, G.; Bechtold, P.; et al. Operational Global Reanalysis: Progress, Future Directions and Synergies with NWP; Elsevier: Amsterdam, The Netherlands, 2018. [Google Scholar]
- Hersbach, H. ERA5 reanalysis is in production. ECMWF Newsl. 2016, 147, 5. [Google Scholar]
- Sathe, Y.; Kulkarni, S.; Gupta, P.; Kaginalkar, A.; Islam, S.; Gargava, P. Application of Moderate Resolution Imaging Spec-troradiometer (MODIS) Aerosol Optical Depth (AOD) and Weather Research Forecasting (WRF) model meteorological data for assessment of fine particulate matter (PM2. 5) over India. Atmos. Pollut. Res. 2018, 10, 418–434. [Google Scholar] [CrossRef]
- Najafpour, N.; Afshin, H.; Firoozabadi, B. Sensitivity study and comparative evaluation of WRF-Chem over Iran: Available and embedded dust emission schemes. Atmos. Pollut. Res. 2023, 14, 101930. [Google Scholar] [CrossRef]
- Ali, G.; Bao, Y.; Asmerom, B.; Ullah, W.; Ullah, S.; Arshad, M. Assessment of the simulated aerosol optical properties and regional meteorology using WRF-Chem model. Arab. J. Geosci. 2021, 14, 1871. [Google Scholar] [CrossRef]
- Xi, X. Revisiting the recent dust trends and climate drivers using horizontal visibility and present weather observations. J. Geophys. Res. Atmos. 2021, 126, e2021JD034687. [Google Scholar] [CrossRef]
- Yu, Y.; Notaro, M.; Liu, Z.; Wang, F.; Alkolibi, F.; Fadda, E.; Bakhrjy, F. Climatic Controls on the Interannual to Decadal Variability in Saudi Arabian Dust Activity: Toward the Development of a Seasonal Dust Prediction Model: Saudi Arabian Dust Prediction. J. Geophys. Res. 2015, 120, 1739–1758. [Google Scholar] [CrossRef]
- Notaro, M.; Yu, Y.; Kalashnikova, O.V. Regime shift in Arabian dust activity, triggered by persistent Fertile Crescent drought. J. Geophys. Res. Atmos. 2015, 120, 110–229. [Google Scholar] [CrossRef]
- Klingmüller, K.; Pozzer, A.; Metzger, S.; Stenchikov, G.L.; Lelieveld, J. Aerosol optical depth trend over the Middle East. Atmos. Chem. Phys. Discuss. 2016, 16, 5063–5073. [Google Scholar] [CrossRef]
- Yousefi, R.; Wang, F.; Ge, Q.; Lelieveld, J.; Shaheen, A. Aerosol Trends during the Dusty Season over Iran. Remote Sens. 2021, 13, 1045. [Google Scholar] [CrossRef]
- Al-Dousari, A.M.; Al-Awadhi, J. Dust fallout in northern Kuwait, major sources and characteristics. Kuwait J. Sci. 2012, 39, 171–187. [Google Scholar]
- Penchah, M.M.; Malakooti, H.; Satkin, M. Evaluation of planetary boundary layer simulations for wind resource study in east of Iran. Renew. Energy 2017, 111, 1–10. [Google Scholar] [CrossRef]
- Al Ameri, I.D.S.; Briant, R.M.; Engels, S. Drought severity and increased dust storm frequency in the Middle East: A case study from the Tigris–Euphrates alluvial plain, central Iraq. Weather 2019, 74, 416–426. [Google Scholar] [CrossRef]
- Lin, Y.L.; Farley, R.D.; Orville, H.D. Bulk parameterization of the snow field in a cloud model. J. Appl. Meteorol. Climatol. 1983, 22, 1065–1092. [Google Scholar] [CrossRef]
- Mlawer, E.J.; Taubman, S.J.; Brown, P.D.; Iacono, M.J.; Clough, S.A. Radiative transfer for inhomogeneous atmospheres: RRTM, a validated correlated-k model for the longwave. J. Geophys. Res. Atmos. 1997, 102, 16663–16682. [Google Scholar] [CrossRef]
- Dudhia, J. Numerical study of convection observed during the winter monsoon experiment using a mesoscale two-dimensional. model. J. Atmos. Sci. 1989, 46, 3077–3107. [Google Scholar] [CrossRef]
- Niu, G.Y.; Yang, Z.L.; Mitchell, K.E.; Chen, F.; Ek, M.B.; Barlage, M.; Kumar, A.; Manning, K.; Niyogi, D.; Rosero, E.; et al. The community Noah land surface model with multiparameterization options (Noah-MP): 1. Model description and evaluation with local-scale measurements. J. Geophys. Res. Atmos. 2011, 116, D12109. [Google Scholar]
- Hu, X.M.; Nielsen-Gammon, J.W.; Zhang, F. Evaluation of three planetary boundary layer schemes in the WRF model. J. Appl. Meteorol. Climatol. 2010, 49, 1831–1844. [Google Scholar]
- Parolari, A.J.; Li, D.; Bou-Zeid, E.; Katul, G.G.; Assouline, S. Climate, not conflict, explains extreme Middle East dust storm. Environ. Res. Lett. 2016, 11, 114013. [Google Scholar] [CrossRef]
- Mousavi, H.; Panahi, D.M.; Kalantari, Z.; Mousavi, H.; Panahi, D.M.; Kalantari, Z. Dust and climate interactions in the Middle East: Spatio-temporal analysis of aerosol optical depth and climatic variables. Sci. Total Environ. 2024, 927, 172176. [Google Scholar] [CrossRef] [PubMed]
- Javadian, M.; Behrangi, A.; Sorooshian, A. Impact of drought on dust storms: Case study over Southwest Iran. Environ. Res. Lett. 2019, 14, 124029. [Google Scholar] [CrossRef]
- Middleton, N.J. Desert dust hazards: A global review. Aeolian Res. 2017, 24, 53–63. [Google Scholar] [CrossRef]
- Li, J.; Garshick, E.; Al-Hemoud, A.; Huang, S.; Koutrakis, P. Impacts of meteorology and vegetation on surface dust concentrations in Middle Eastern countries. Sci. Total Environ. 2020, 712, 136597. [Google Scholar] [CrossRef]
- Shukurov, K.A.; Simonenkov, D.V.; Nevzorov, A.V.; Rashki, A.; Hamzeh, N.H.; Abdullaev, S.F.; Shukurova, L.M.; Chkhetiani, O.G. CALIOP-Based Evaluation of Dust Emissions and Long-Range Transport of the Dust from the Aral−Caspian Arid Regionby 3D-Source Potential Impact (3D-SPI) Method. Remote Sens. 2023, 15, 2819. [Google Scholar] [CrossRef]
- Najafi, M.S.; Khoshakhllagh, F.; Zamanzadeh, S.M.; Shirazi, M.H.; Samadi, M.; Hajikhani, S. Characteristics of TSP Loads during the Middle East Springtime Dust Storm (MESDS) in Western Iran. Arab. J. Geosci. 2013, 7, 5367–5381. [Google Scholar] [CrossRef]
- Khoshakhlagh, F.; Najafi, M.S.; Samadi, M. An analysis on synoptic patterns of springtime dust occurrence in West of Iran. Phys. Geogr. Res. 2012, 44, 99–124. [Google Scholar]
- Baghbanan, P.; Ghavidel, Y.; Farajzadeh, M. Spatial analysis of spring dust storms hazard in Iran. Theor. Appl. Clim. 2020, 139, 1447–1457. [Google Scholar] [CrossRef]
- Kamal, A.; Lin, Z.; Wu, C. Decadal change of spring dust activity in western Iran and its mechanism. Front. Environ. Sci. 2022, 10, 983048. [Google Scholar] [CrossRef]
- Ghasem, A.; Shamsipour, A.; Miri, M.; Safarrad, T. Synoptic and remote sensing analysis of dust events in southwestern Iran. Nat. Hazards 2012, 64, 1625–1638. [Google Scholar] [CrossRef]
- Broomandi, P.; Karaca, F.; Guney, M.; Fathian, A.; Geng, X.; Kim, J.R. Destinations frequently impacted by dust storms originating from southwest Iran. Atmos. Res. 2021, 248, 105264. [Google Scholar] [CrossRef]

Disclaimer/Publisher’s Note: The statements, opinions and data contained in all publications are solely those of the individual author(s) and contributor(s) and not of MDPI and/or the editor(s). MDPI and/or the editor(s) disclaim responsibility for any injury to people or property resulting from any ideas, methods, instructions or products referred to in the content. |
© 2024 by the authors. Licensee MDPI, Basel, Switzerland. This article is an open access article distributed under the terms and conditions of the Creative Commons Attribution (CC BY) license (https://creativecommons.org/licenses/by/4.0/).
Share and Cite
Hamzeh, N.H.; Abadi, A.R.S.; Alam, K.; Shukurov, K.A.; Opp, C. Long-Term Wind and Air Temperature Patterns in the Southeastern Region of Iran through Model Simulation and Ground Observations. Atmosphere 2024, 15, 993. https://doi.org/10.3390/atmos15080993
Hamzeh NH, Abadi ARS, Alam K, Shukurov KA, Opp C. Long-Term Wind and Air Temperature Patterns in the Southeastern Region of Iran through Model Simulation and Ground Observations. Atmosphere. 2024; 15(8):993. https://doi.org/10.3390/atmos15080993
Chicago/Turabian StyleHamzeh, Nasim Hossein, Abbas Ranjbar Saadat Abadi, Khan Alam, Karim Abdukhakimovich Shukurov, and Christian Opp. 2024. "Long-Term Wind and Air Temperature Patterns in the Southeastern Region of Iran through Model Simulation and Ground Observations" Atmosphere 15, no. 8: 993. https://doi.org/10.3390/atmos15080993