Abstract
The Atmospheric Dynamics Mission ADM-Aeolus was successfully launched in August 2018 by the European Space Agency (ESA). The Aeolus mission carried a single instrument, the first-ever Doppler wind lidar (DWL) in space, called Atmospheric LAser Doppler INstrument (ALADIN). Aeolus circled the Earth, providing vertical profiles of horizontal line-of-sight (HLOS) winds on a global scale. The Aeolus satellite’s measurements filled critical gaps in existing wind observations, particularly in remote regions such as the Brazilian Amazon. This area, characterized by dense rainforests and rich biodiversity, is essential for global climate dynamics. The weather patterns of the Amazon are influenced by atmospheric circulation driven by Hadley cells and the Intertropical Convergence Zone (ITCZ), which are crucial for the distribution of moisture and heat from the equator to the subtropics. The data provided by Aeolus can significantly enhance our understanding of these complex atmospheric processes. In this long-term validation study, we used radiosonde data collected from three stations in the Brazilian Amazon (Cruzeiro do Sul, Porto Velho, and Rio Branco) as a reference to assess the accuracy of the Level 2B (L2B) Rayleigh-clear and Mie-cloudy wind products. Statistical validation was conducted by comparing Aeolus L2B wind products and radiosonde data covering the period from October 2018 to March 2023 for Cruzeiro do Sul and Porto Velho, and from October 2018 to December 2022 for Rio Branco. Considering all available collocated winds, including all stations, a Pearson’s coefficient of 0.73 was observed in Rayleigh-clear and 0.85 in Mie-cloudy wind products, revealing a strong correlation between Aeolus and radiosonde winds, suggesting that Aeolus wind products are reliable for capturing wind profiles in the studied region. The observed biases were −0.14 m/s for Rayleigh-clear and −0.40 m/s for Mie-cloudy, fulfilling the mission requirement of having absolute biases below 0.7 m/s. However, when analyzed annually, in 2022, the bias for Rayleigh-clear was −0.95 m/s, which did not meet the mission requirements.
1. Introduction
Numerical weather prediction (NWP) relies on highly complex physical models to describe the dynamics of the atmosphere from an initial state. For the execution of these models and success in terms of forecast quality, a robust computational infrastructure and datasets utilizing the most recent observations of the initial state of the atmosphere are of utmost importance [1]. The increase in the number of global wind profile observations holds significant potential to enhance numerical weather prediction (NWP) [2,3,4,5,6], resulting in more precise forecasts and mitigating the impacts of adverse weather phenomena.
Since 1998, the World Meteorological Organization (WMO) has considered the vertical wind profile measurement on a global scale as a high-priority factor for improving NWP [7]. In 1999, recognizing the inadequacy of the Global Observing System (GOS) in providing satisfactory observations of wind profiles over oceans, regions with sparse populations, and hard-to-reach areas, particularly in the Southern Hemisphere [3,8], the European Space Agency (ESA) approved the Atmospheric Dynamics Mission project. Approximately two decades later, the Aeolus satellite was launched on 22 August 2018, with an estimated lifetime of three years.
ALADIN, carried by Aeolus, operated in a sun-synchronous orbit at an altitude of 320 km and an inclination of 97 degrees. Traveling at approximately 7.7 km/s, it completed 1 orbit every 90 minutes, resulting in approximately 16 orbits per day and a global scan every 7 days, totaling 111 orbits. ALADIN, a direct detection Doppler wind lidar, operated at an ultraviolet (UV) wavelength of 355 nm at a repetition frequency of 50 Hz, emitting pulses along its line of sight (LOS) at an angle of 35° to the nadir direction [2,9,10]. It provided wind measurements from the ground up to an altitude of 25–30 km and a vertical resolution of 0.25 km to 2 km. At the end of April 2023, Aeolus initiated the assisted reentry process, and on 28 July 2023, it safely burned up upon re-entering the Earth’s atmosphere over Antarctica. The Aeolus mission contributed significantly by providing global wind profiles [11,12,13], filling critical gaps in existing global wind observation systems.
Calibration and validation (Cal/Val) activities for Aeolus Level 2B (L2B) wind products, utilizing airborne Doppler wind lidars, radiosondes, ground-based instruments, and numerical weather prediction (NWP) models, are well documented in research studies [14,15,16,17,18,19,20,21,22,23,24,25,26,27,28,29].
This paper presents the validation of Aeolus L2B winds using collocated radiosonde data from stations in the Brazilian Amazon, a region characterized by dense rainforests and rich biodiversity. The interplay between the Hadley cells, Intertropical Convergence Zone (ITCZ), and trade winds creates a dynamic and complex climate system vital for the Amazon rainforest [30]. The ITCZ is a low-pressure area characterized by intense precipitation near the equator, where the trade winds from the Northern and Southern Hemispheres converge. This convergence leads to the uplift of warm, moist air, which cools and precipitates, contributing significantly to the Amazon’s high rainfall. Hadley cells, which are large-scale atmospheric circulations, transport this moist air poleward at high altitudes. As the air cools, it sinks into subtropical regions as dry air, completing the circulation cycle and influencing global weather patterns.
Trade winds are pivotal in this dynamic system as they transport moisture from the Atlantic Ocean to the Amazon. These winds, blowing consistently from east to west, bring essential humidity that sustains the rainforest’s lush and diverse ecosystem. This humid equatorial climate supports a wide variety of flora and fauna, contributing to the Amazon’s status as one of the most biodiverse regions on Earth. Therefore, understanding these atmospheric processes is vital for grasping the climatic and ecological dynamics that sustain the Brazilian Amazon. The validation of Aeolus L2B wind products enables their use in studying the atmospheric dynamics of this region, which has significant local and global climatic importance.
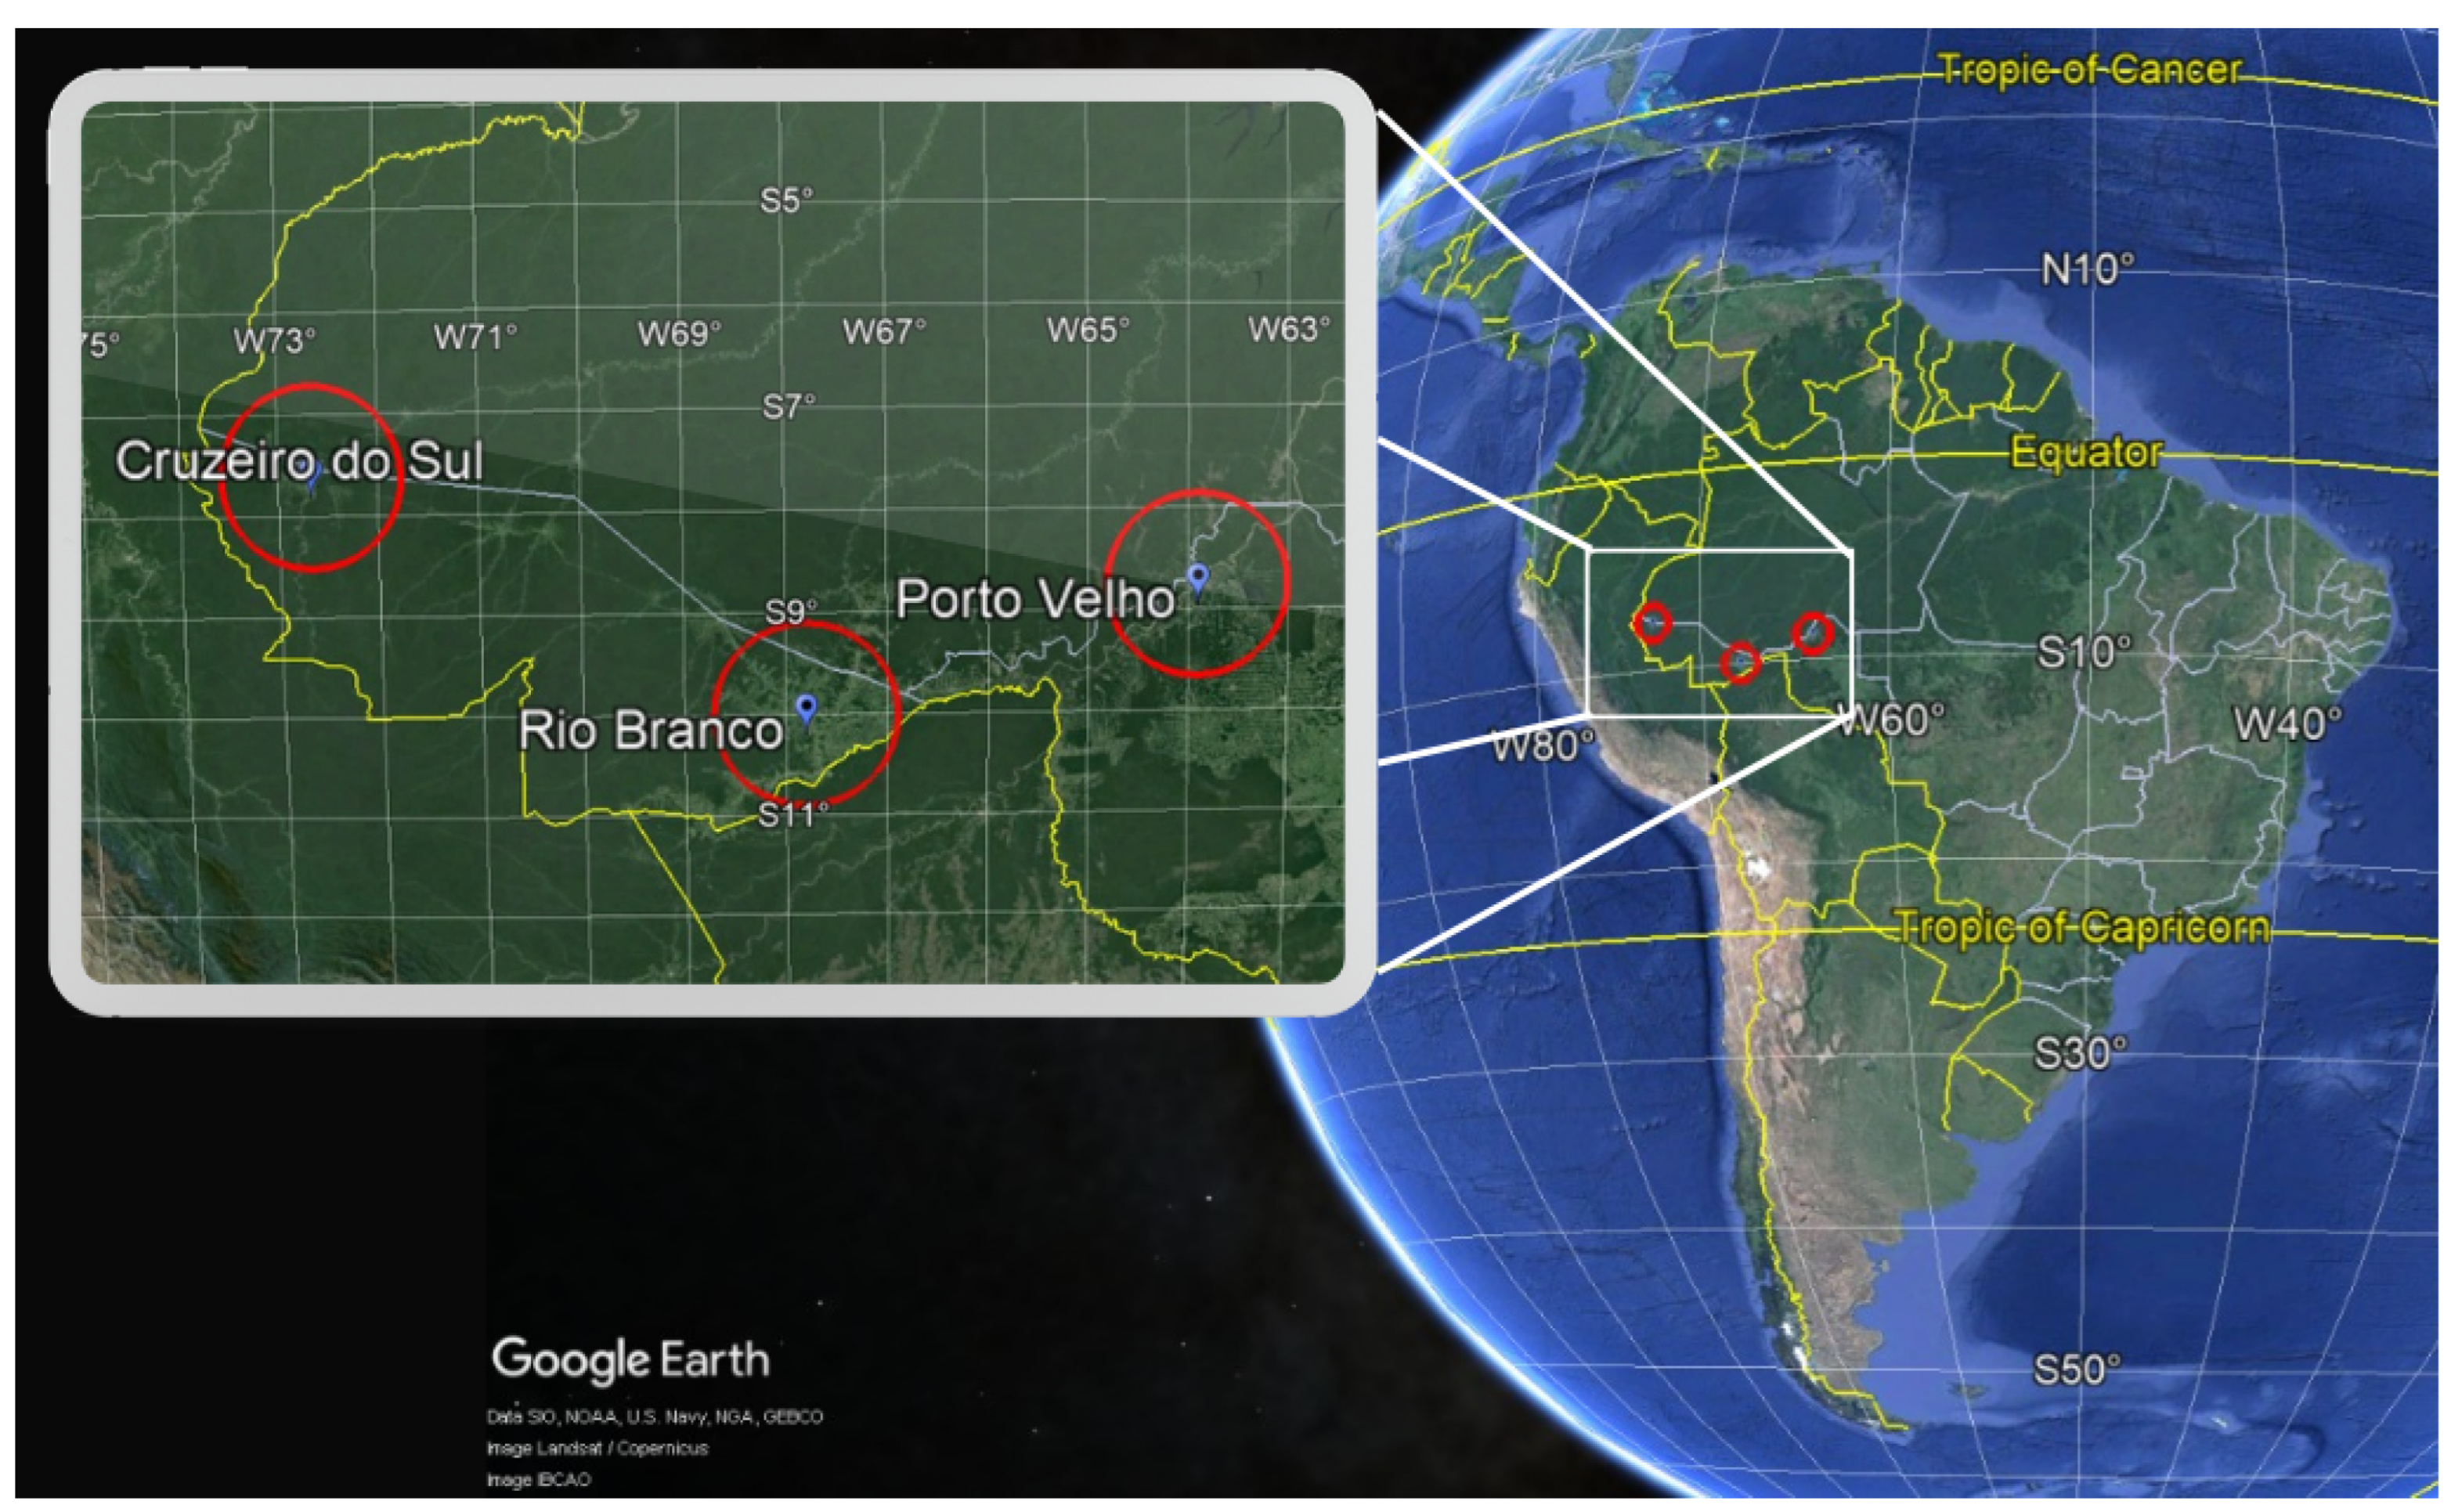
To achieve accurate validation, the collocation criteria between Aeolus and radiosonde winds included a maximum temporal difference of 2 h, a maximum horizontal distance of 100 km, and a maximum altitude difference of 300 m. Three stations in the Brazilian Amazon met these criteria—Cruzeiro do Sul (7.62° S, 72.67° W), Porto Velho (8.76° S, 63.91° W), and Rio Branco (10.00° S, 67.80° W)—and their locations are shown on the map in Figure 1. The correlation, biases, and random errors observed in the analyses demonstrate that ALADIN Doppler wind lidar technology effectively provided reliable wind measurements in the Brazilian Amazon, which lacks a sufficient number of wind observations.
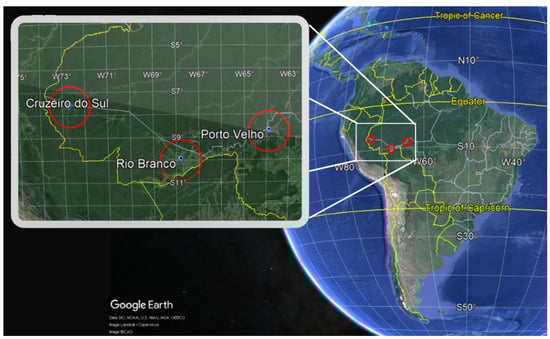
Figure 1.
Map showing the locations of radiosonde stations in the Brazilian Amazon used for the validation of Aeolus L2B winds. The red circles represent regions with a 100 km radius.
2. Dataset and Methods
This section describes the methodology for comparing the Aeolus L2B wind products, Rayleigh-clear and Mie-cloudy, with radiosonde wind measurements collected from three stations in the Brazilian Amazon, including the parameters analyzed for statistical validation. The validation covers the period from October 2018 to March 2023 for Cruzeiro do Sul and Porto Velho, and from October 2018 to December 2021 for Rio Branco.
2.1. Aeolus Data
Using a dual-channel optical receiver [9,31], ALADIN measured the wind velocity through molecular and particle (aerosol and cloud) backscatter. The Rayleigh channel received molecular backscatter, employing the double-edge technique [32], utilizing a sequential Fabry–Pérot interferometer. In contrast, the Mie channel focused on particle backscatter, relying on a fringe-imaging technique with Fizeau interferometers [33]. A single measurement, resulting from the accumulation of 20 laser pulses, corresponded to a horizontal resolution of approximately 2.9 km. One Rayleigh wind observation was obtained by averaging up to 30 individual measurements, resulting in a horizontal resolution of 87 km. For the Mie channel, the horizontal resolution decreased to approximately 10 km after 5 March 2019 [11,17]. The vertical resolution is defined by range bins within which HLOS wind measurements are accumulated. These bins vary in thickness from 0.25 km to 2 km, covering altitudes from the surface up to 25–30 km.
The atmospheric class is determined through a process known as “scene classification”, which categorizes conditions as “clear” or “cloudy”, based on atmospheric optical properties. Consequently, the Aeolus L2B processor provides four types of wind observations:
- Mie-cloudy: Winds derived from the Mie channel, classified as cloudy, with non-zero particle backscatter.
- Mie-clear: Winds derived from the Mie channel, mistakenly classified as clear despite the presence of particulates.
- Rayleigh-cloudy: Winds derived from the Rayleigh channel, classified as cloudy.
- Rayleigh-clear: Winds derived from the Rayleigh channel, classified as clear, with predominantly molecular backscatter.
A validity flag defines the quality control (QC) for the Aeolus L2B product. A valid wind measurement has the flag set to 1, while for invalid measurement, it has 0. In this study, only Rayleigh-clear and Mie-cloudy valid winds were considered.
The baselines of Aeolus products are related to the processor versions used to derive the products. In this study, the baselines used are
- 2B11 (from June 2019 to May 2021);
- 2B12 (from June 2021 to November 2021);
- 2B13 (from December 2021 to March 2022);
- 2B14 (from October 2018 to May 2019, and from April 2022 to August 2022);
- 2B15 (from September 2022 to March 2023).
2.2. Radiosonde Data
Radiosondes provide high accuracy and vertical resolution for wind speed and azimuth angle . The uncertainty for radiosonde wind products estimated by the Global Climate Observing System Reference Upper-Air Network (GRUAN) is less than 1 m/s for wind speed and for the wind direction [34]. In this context, radiosondes provide a solid reference wind dataset for validating Aeolus HLOS winds. Radiosonde data used in this work are available at http://weather.uwyo.edu/upperair/sounding.html (last access: 20 April 2023). The stations Cruzeiro do Sul ( S, W), Porto Velho ( S, W), and Rio Branco ( S, W) are part of the Global Basic Observing Network (GBON) within the WMO Integrated Global Observing System (WIGOS).
2.3. Comparison of Datasets
For the comparison with radiosonde data, an Aeolus observation must meet the following collocation criteria:
- Time: Aeolus and radiosonde wind measurements must have a maximum allowable temporal difference of 2 h;
- Location: must have a maximum allowable horizontal distance of 100 km;
- Height: must have a maximum allowable altitude difference of 300 m.
The time collocation criteria were extended, relative to those defined by the Working Group II in the 4th International Winds Workshop [35], to include the maximum number of stations. This extension was necessary since the radiosondes are launched at 12:00 UTC and as the Aeolus descending orbits passed over Cruzeiro do Sul on Tuesdays at 10:42 UTC, Porto Velho on Saturdays at 10:04 UTC, and Rio Branco on Sundays at 10:17 UTC. Ascending orbit overpasses were not considered for validation due to the lack of collocated radiosonde data.
Each pair of Aeolus-radiosonde winds that satisfies the collocation criteria is called a collocated pair.
For all collocated pairs, the radiosonde wind speed is projected onto Aeolus horizontal line of sight (HLOS). The radiosonde HLOS wind velocity is obtained using [16,19,24]:
where is the Aeolus azimuth angle, which depends on geolocation and altitude.
To quantify the comparison’s result, the difference between Aeolus HLOS and the corresponding radiosonde HLOS wind is defined as
where is Aeolus Rayleigh-clear or Mie-cloudy HLOS wind, and is radiosonde HLOS (1).
For the validation process, we apply quality control criteria that balance the quality of the dataset and the number of observations passing the control. The applied criteria consider the estimated errors in Rayleigh-clear and Mie-cloudy winds. Figure 2a presents the difference between Aeolus HLOS and radiosonde HLOS () versus Aeolus estimated errors for Rayleigh-clear winds. The difference remains constant until an estimated error of about 8 m/s, after which it gradually begins to increase. Figure 2b shows versus Aeolus estimated errors for Mie-cloudy winds, remaining constant until an estimated error of about 4 m/s. Based on Figure 2 analyses and following [14], the estimated error thresholds adopted as quality controls were set to 8 m/s for Rayleigh-clear and 4 m/s for Mie-cloudy winds, represented by the red dashed vertical lines in Figure 2. Each collocated pair that satisfies the quality control criteria is called a collocated wind.
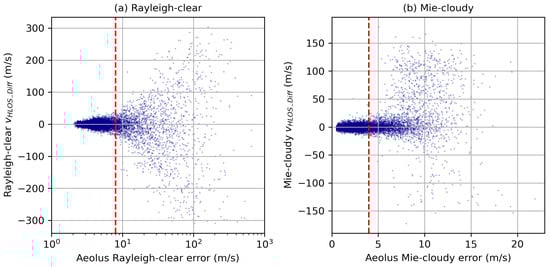
Figure 2.
Difference between Aeolus HLOS and corresponding radiosonde HLOS winds versus Aeolus estimated error for (a) Rayleigh-clear and (b) Mie-cloudy winds, considering all collocated pairs. The red dashed vertical lines are the threshold for estimated errors 8 m/s for Rayleigh-clear and 4 m/s for Mie-cloudy.
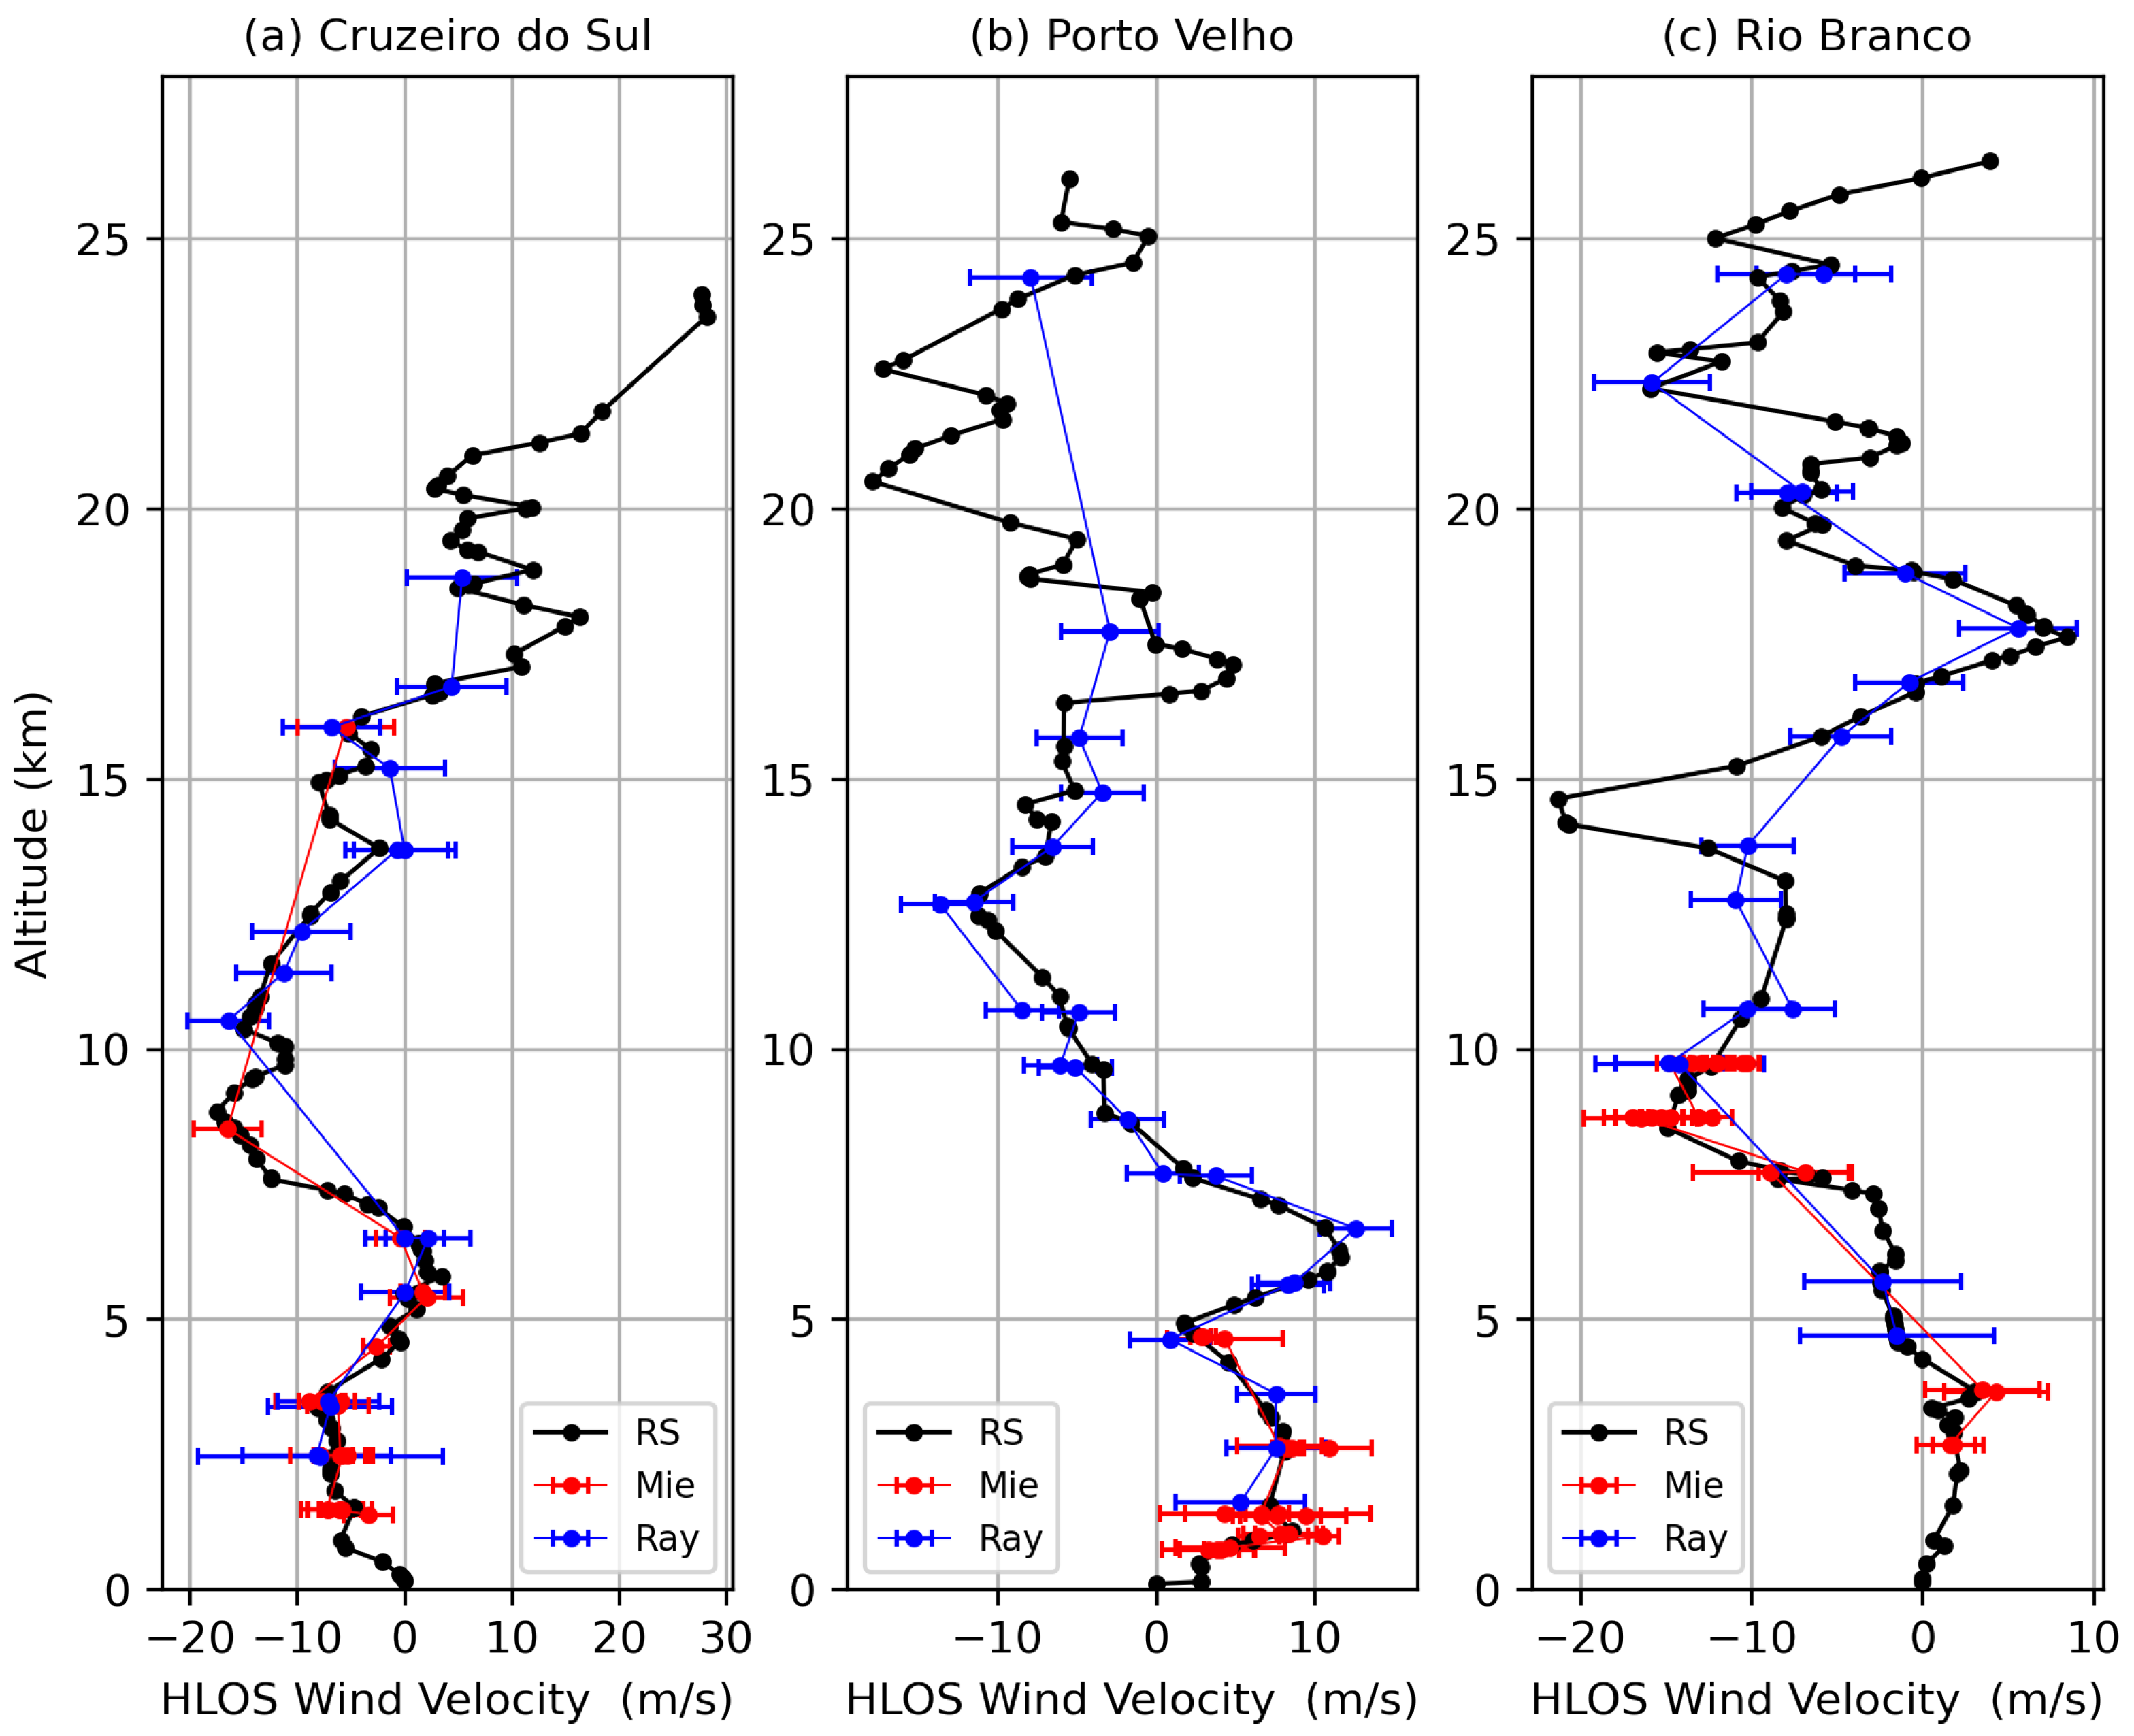
To illustrate the comparison process, Figure 3 presents HLOS wind velocity profiles for Aeolus Rayleigh-clear (blue), Aeolus Mie-cloudy (red), and radiosonde HLOS (black) (a) on 14 December 2021 in Cruzeiro do Sul, (b) on 6 July 2019 in Porto Velho, and (c) on 25 August 2019 in Rio Branco. Across all three locations, the overall agreement between the Aeolus Rayleigh-clear, Mie-cloudy, and radiosonde profiles is notable.
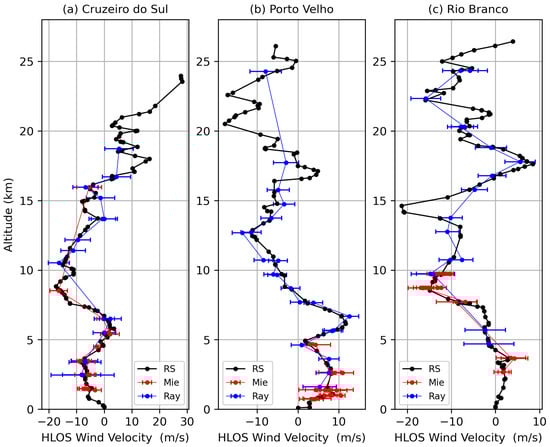
Figure 3.
HLOS wind velocity profiles for Aeolus Mie-cloudy (red), Aeolus Rayleigh-clear (blue), and radiosonde (black) (a) on 14 December 2021 in Cruzeiro do Sul, (b) on 6 July 2019 in Porto Velho, and (c) on 25 August 2019 in Rio Branco.
The bias and standard deviation (SD) are calculated, for a dataset with a sample of size N, using the following:
Pearson’s correlation coefficient between Aeolus HLOS winds and radiosonde HLOS winds is calculated using the following:
Pearson’s correlation assesses the relationship between Aeolus and radiosonde wind data. A strong correlation indicates that the Aeolus wind measurements are in good agreement with the reference data, suggesting high accuracy and reliability. Conversely, a weak correlation implies significant discrepancies between the datasets, potentially highlighting issues in the Aeolus measurements.
3. Results and Discussion
The initial analysis comprehensively uses all available data from three selected stations in the Brazilian Amazon (Cruzeiro do Sul, Porto Velho, and Rio Branco) from October 2018 to March 2023. By incorporating data from all overpasses, this analysis captures a wide range of wind conditions, providing a robust foundation for assessing the Aeolus’ performance and behavior over this period.
3.1. Overall Intercomparison
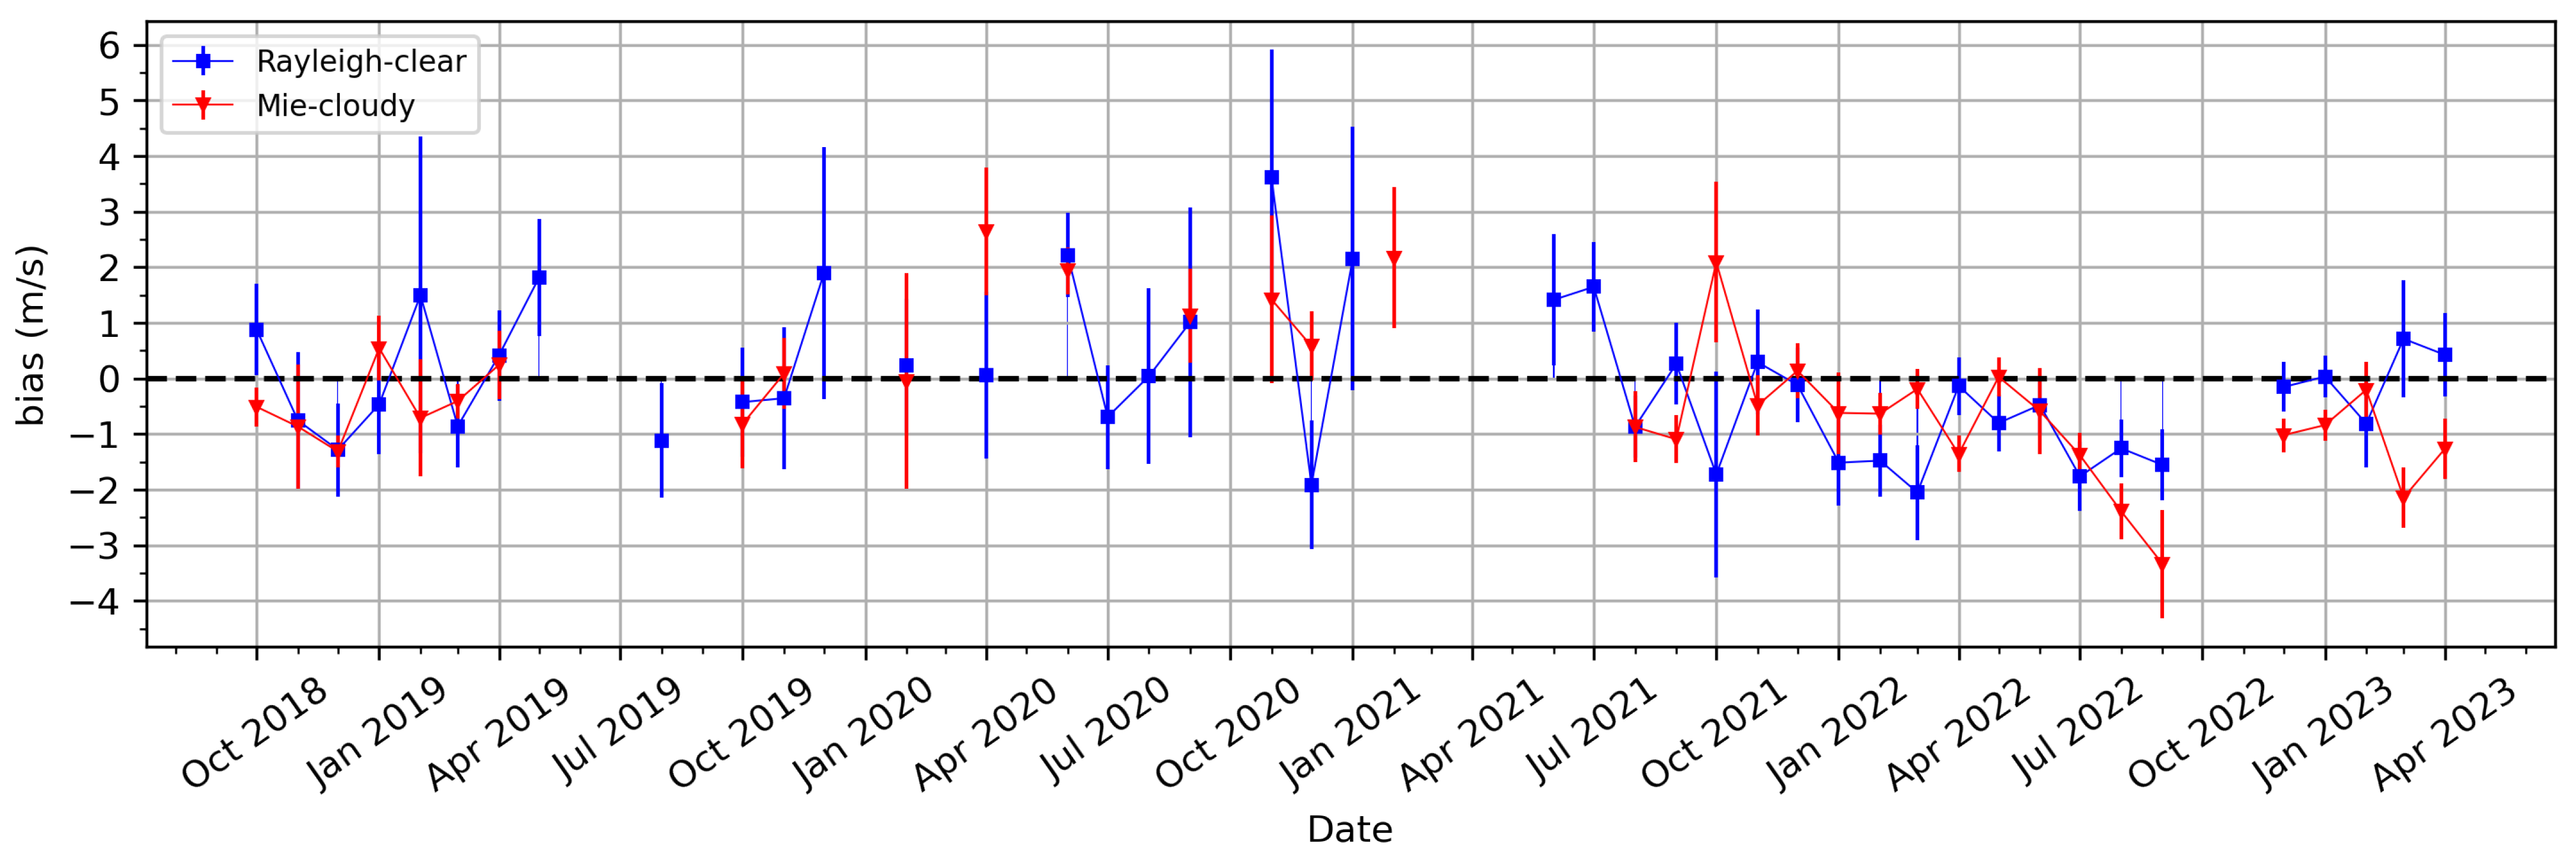
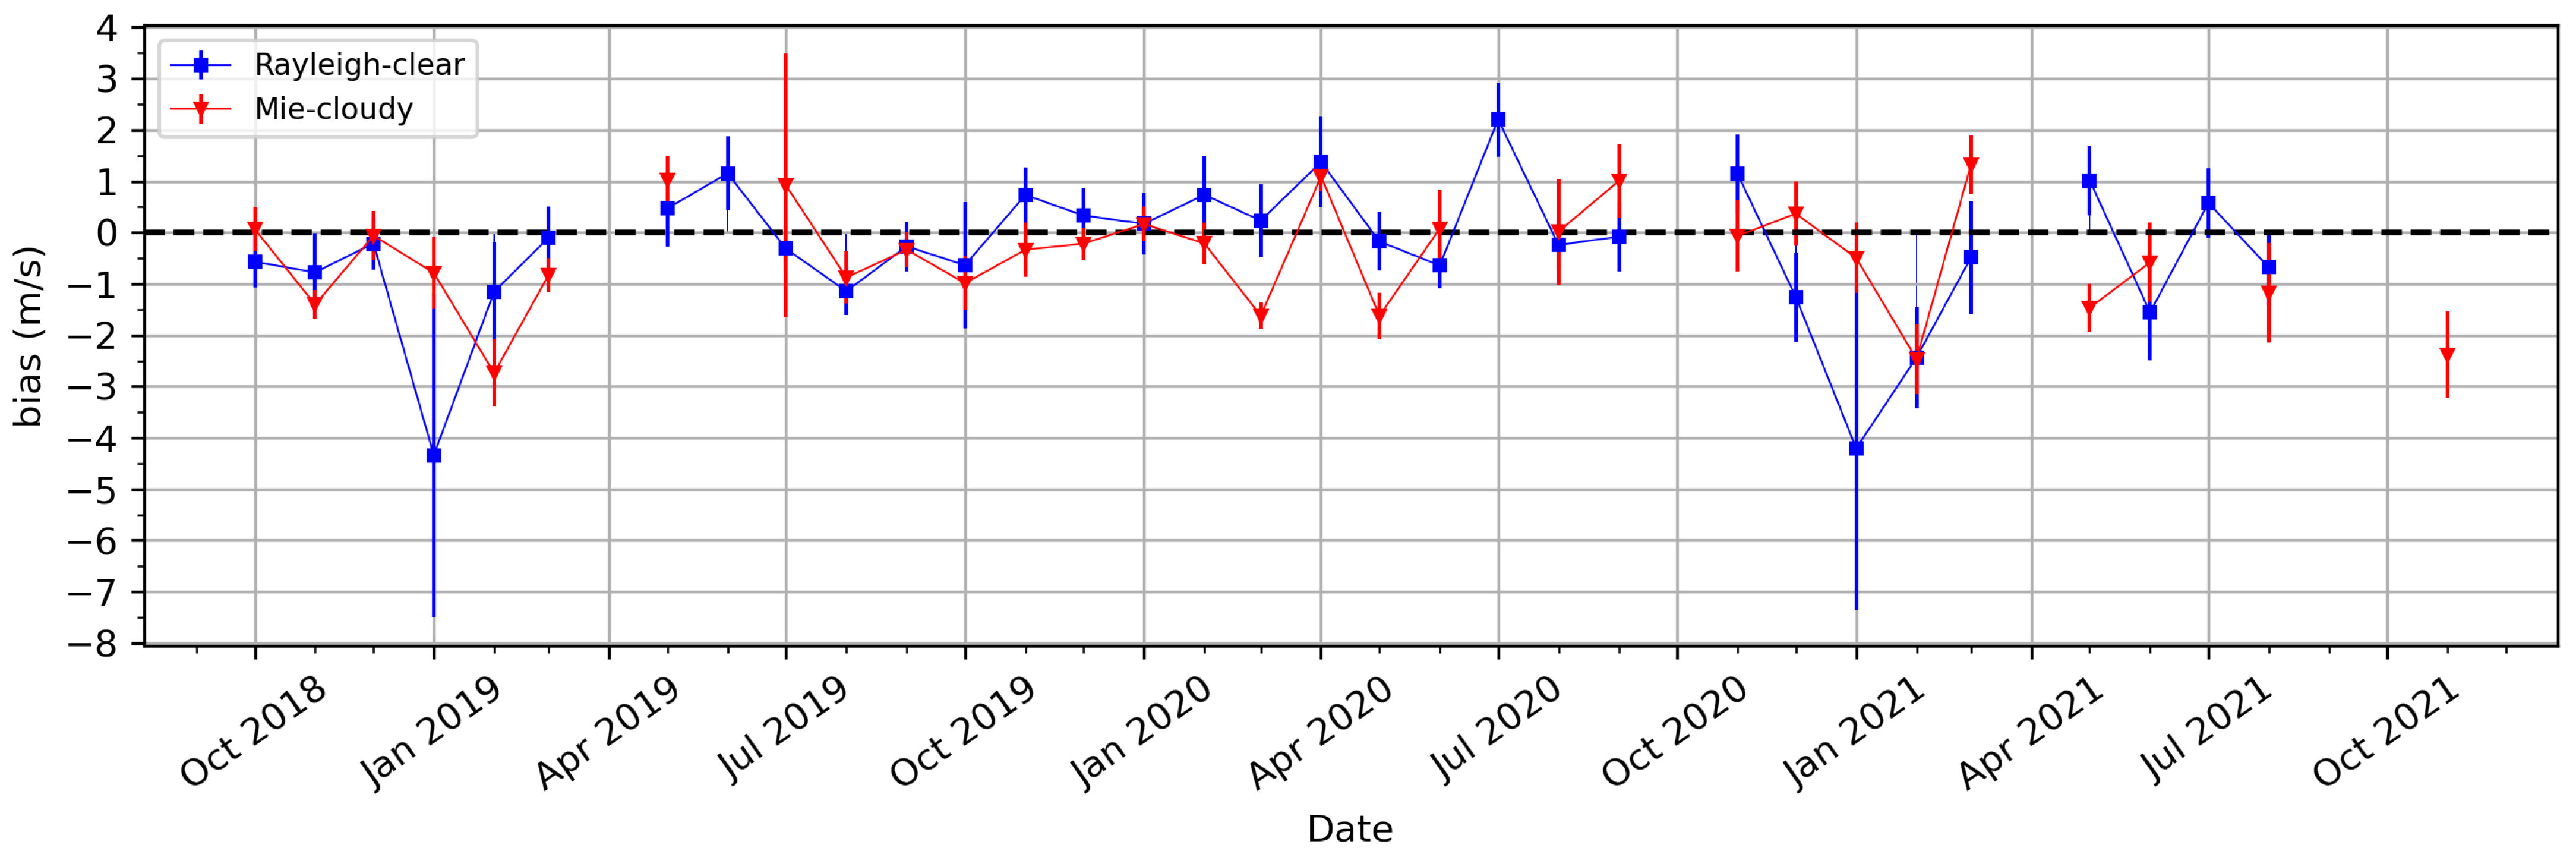
Figure 4 shows the time series of monthly bias, considering an all-analyzed period for Aeolus Rayleigh-clear (blue squares) and Mie-cloudy (red triangles), including data from all three stations. The time series data are derived from monthly mean values, which balance temporal sequence and sample size, thereby improving statistical robustness. The bias generally remains within an absolute value of 2 m/s, except for Rayleigh-clear in October 2020 and October 2022, where there is a significant overestimation. Additionally, for Mie-cloudy, there is a notable instance in September 2022 where there is considerable underestimation. Some discrepancies are also observed in April 2019, February 2021, and September 2021, with overestimation for Rayleigh-clear and underestimation for Mie-cloudy during these periods. The error bars for Rayleigh-clear are larger in some periods, pointing to higher uncertainty. In contrast, the Mie-cloudy winds have smaller error bars, indicating lower variability and higher confidence in these measurements.
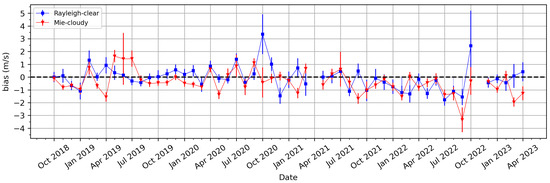
Figure 4.
Time series from October 2018 to March 2023 of bias observations in Aeolus Rayleigh-clear (blue squares) and Mie-cloudy (red triangles), considering all collocated wind.
Figure 5 presents a vertical analysis of the bias and standard deviation for Rayleigh-clear (blue) and Mie-cloudy (red) wind, including all available collocated winds. The bias plot (Figure 5a) shows that Rayleigh-clear and Mie-cloudy observations below 10 km underestimate wind speeds, with more pronounced underestimations around 5 km and slight overestimations between 15 km and 20 km. The standard deviation plot (Figure 5b) indicates that Rayleigh-clear observations have greater variability than Mie-cloudy for all altitudes.
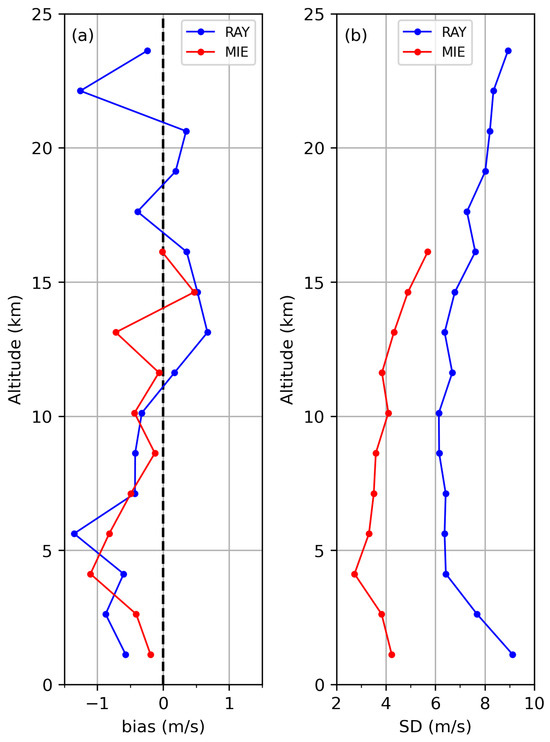
Figure 5.
Vertical analysis of Aeolus and radiosonde wind products for all collocated wind. (a) bias and (b) standard deviation, considering Rayleigh-clear (blue) and Mie-cloudy (red) winds.
Figure 6 presents scatter plots of Aeolus HLOS versus radiosonde HLOS winds for (a) Rayleigh-clear and (c) Mie-cloudy winds for all collocated observations, including all years and all stations. Figure 6b,d show the distribution of for Rayleigh-clear and Mie-cloudy winds, respectively. The analyzed winds, 10,837 (6717) for Rayleigh-clear (Mie-cloudy), resulted in a correlation of 0.73 (0.85) and bias of −0.17 m/s (−0.40 m/s). These strong correlations, particularly notable in the Mie-cloudy observations, suggest that Aeolus was capable of accurately capturing winds that were highly consistent with those obtained from radiosondes. Moreover, the negative bias values indicate a slight underestimation of wind speeds by Aeolus.
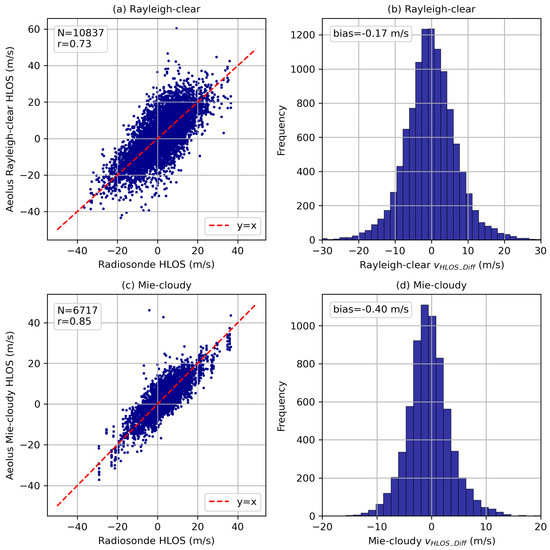
Figure 6.
Aeolus HLOS wind versus the radiosonde HLOS wind, for all available collocated winds, separated by (a) Rayleigh-clear and (c) Mie-cloudy winds. The is represented by the red dashed line. Frequency distribution of difference between Aeolus HLOS and corresponding radiosonde HLOS winds for all available collocated winds are separated by (b) Rayleigh-clear and (d) Mie-cloudy winds.
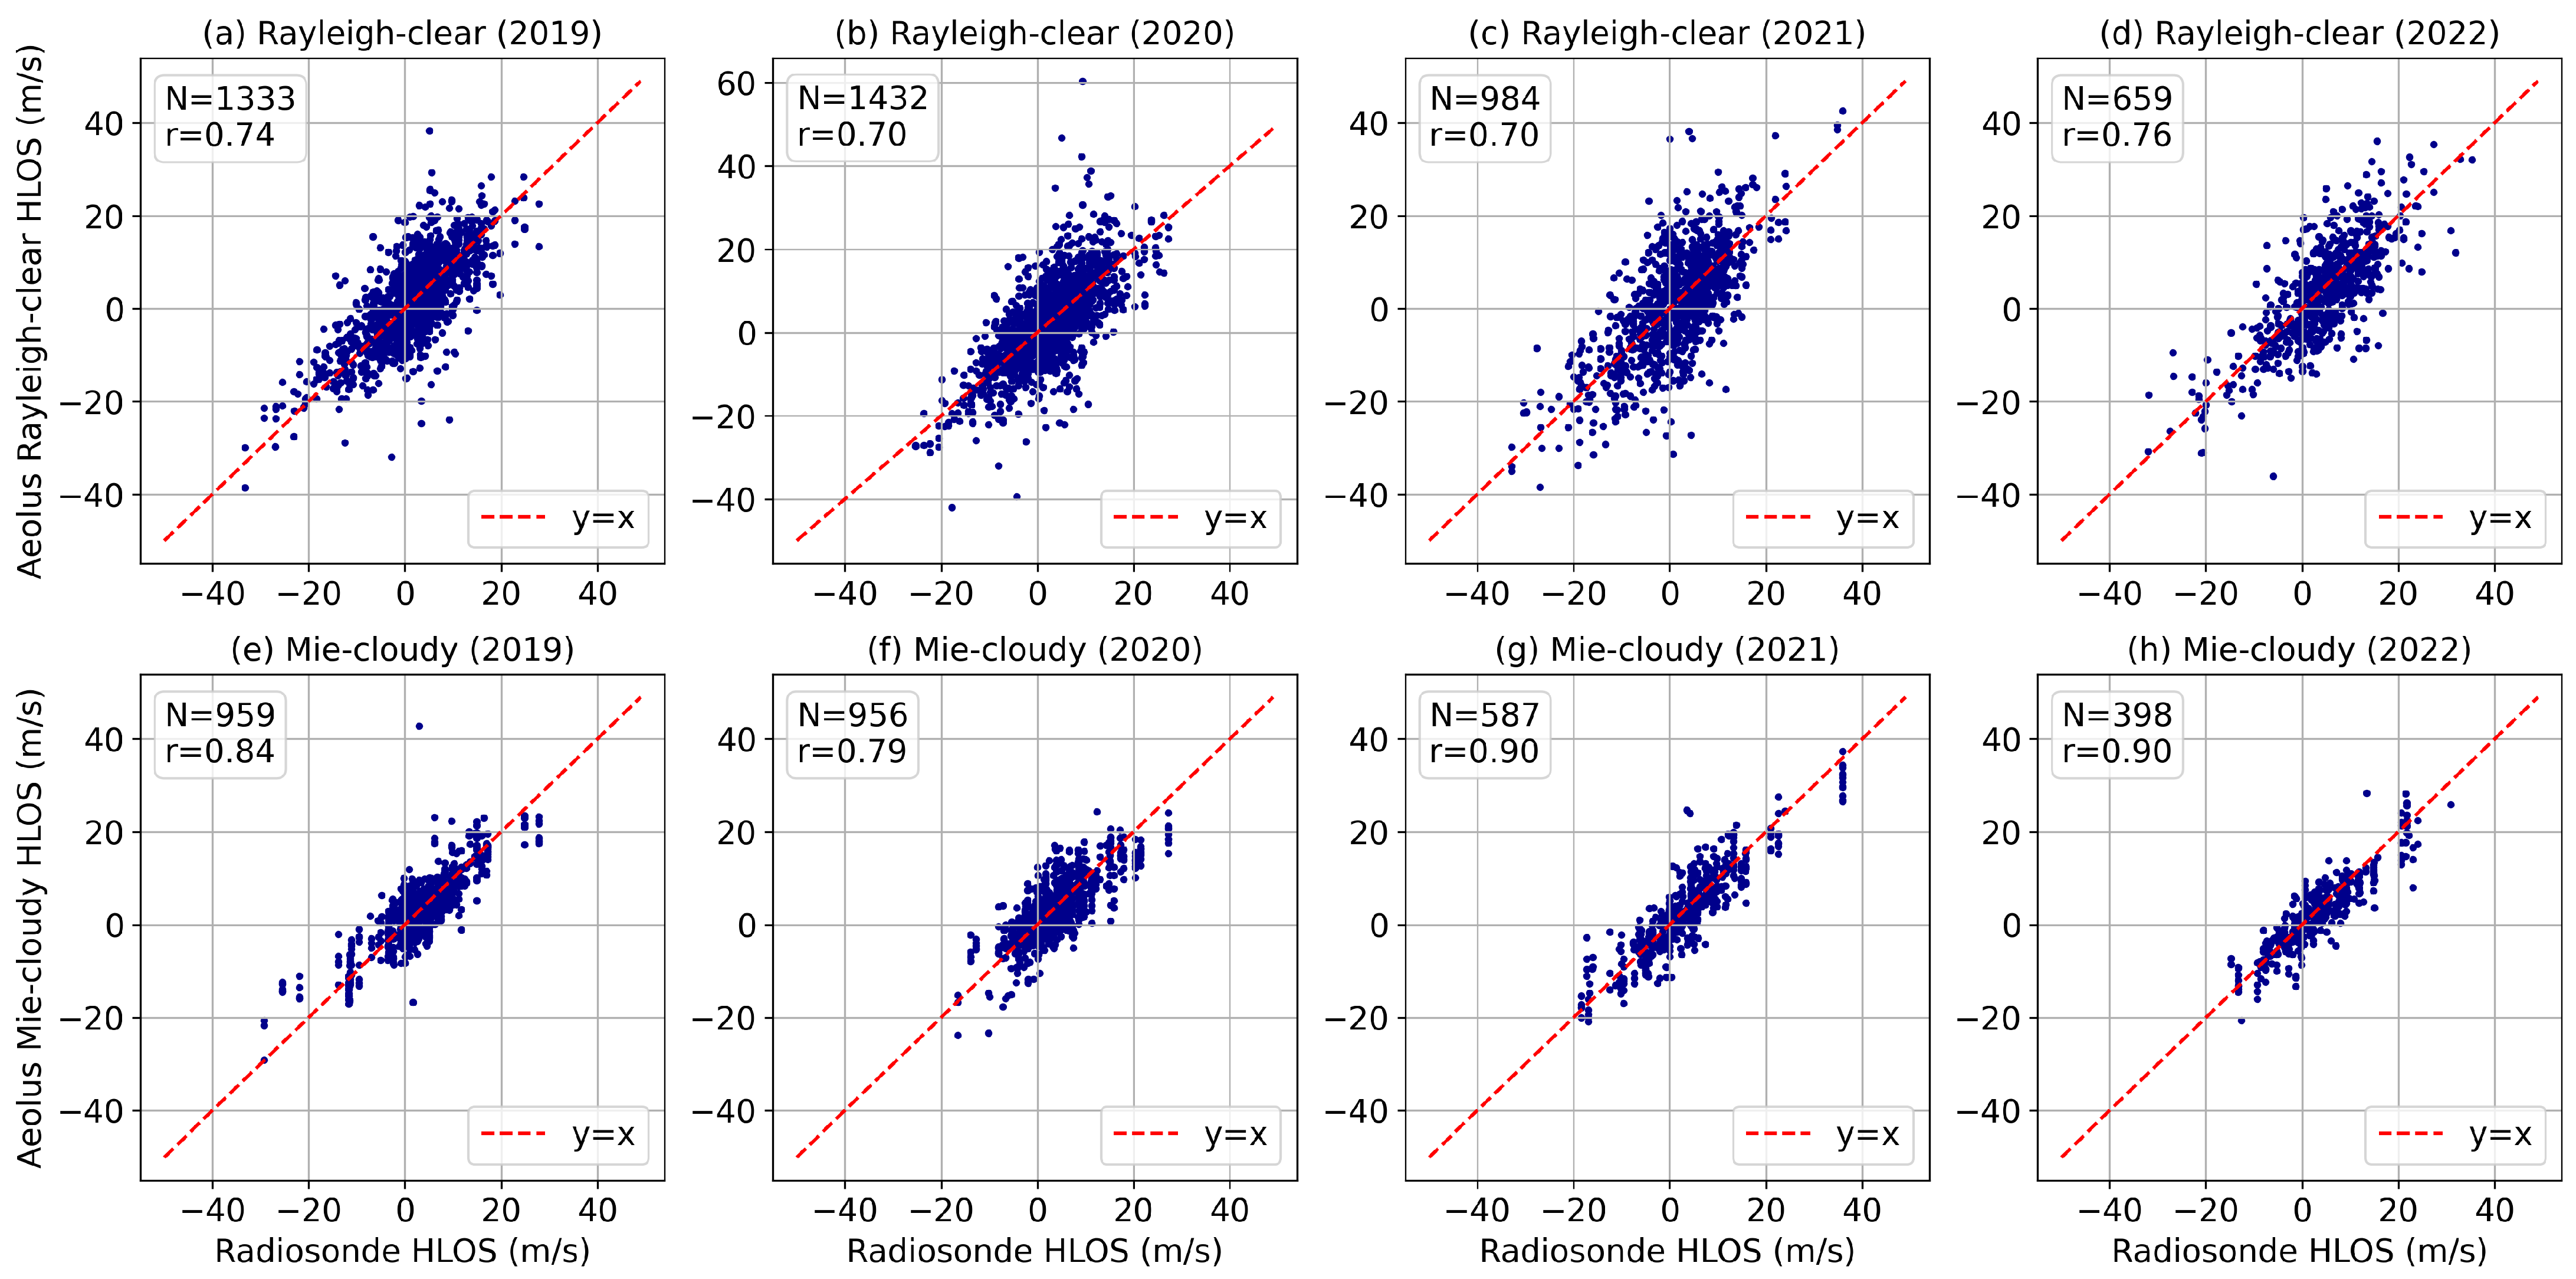
Figure 7 presents scatter plots of Aeolus HLOS versus radiosonde HLOS winds for (a–d) Rayleigh-clear and (e–f) Mie-cloudy winds, including all stations over the years 2019 to 2023. In 2019, the analysis of 2600 Rayleigh-clear and 1699 Mie-cloudy observations produced a correlation of 0.75 (0.83), bias of 0.06 m/s (−0.28 m/s), and a random error of 6.23 m/s (3.91 m/s). These strong correlations, particularly for Mie-cloudy observations, reflect excellent consistency with the reference winds, indicating Aeolus’s capability to provide reliable and accurate wind measurements. The Rayleigh-clear bias was minimal at 0.06 m/s, suggesting that Aeolus measurements closely matched the reference winds. For Mie-cloudy winds, the bias in this case was −0.28 m/s, indicating a slight underestimation of wind speeds by Aeolus. In 2020, the analysis of 3058 Rayleigh-clear and 1862 Mie-cloudy observations produced a correlation of 0.71 (0.85), bias of 0.18 m/s (−0.25 m/s), and a random error of 7.41 m/s (4.38 m/s). The strong correlation persists, underlining the reliability and accuracy of Aeolus’s wind measurements. The bias for Rayleigh-clear observations suggests a slight overestimation, while the bias for Mie-cloudy observations indicates a slight underestimation. For 2021, the analysis of 2202 Rayleigh-clear and 1116 Mie-cloudy observations yielded a correlation of 0.70 (0.88), bias of −0.22 m/s (−0.41 m/s), and a random error of 8.29 m/s (4.27 m/s). The correlation again confirms the reliability and accuracy of Aeolus’s wind measurements. The bias for both types of observations suggests an underestimation. In 2022, the analysis of 2046 Rayleigh-clear and 944 Mie-cloudy observations resulted in a correlation of 0.76 (0.90), bias of −0.95 m/s (−0.70 m/s), and a random error of 7.02 m/s (3.48 m/s). This year shows the highest correlation for Mie-cloudy observations, indicating exceptional consistency with the reference winds and demonstrating Aeolus’s strong capability in providing reliable wind measurements. However, the bias is slightly higher, suggesting a more significant underestimation of wind speeds, with Rayleigh-clear observations not meeting the mission requirements. The correlations for Rayleigh-clear observations remained relatively stable over the years, ranging from 0.70 to 0.76. This consistency, combined with the high correlations in Mie-cloudy results, indicates robust performance, suggesting that Aeolus wind products were reliable for capturing wind profiles in the studied region across different years. Table 1 summarizes the statistical results.
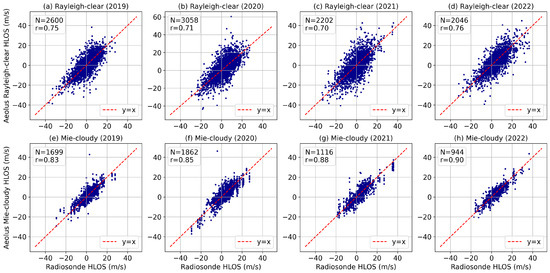
Figure 7.
Aeolus HLOS wind versus the radiosonde HLOS wind, for all available collocated winds over the years 2019, 2020, 2021, and 2022, separated by (a–d) Rayleigh-clear and (e–h) Mie-cloudy winds. The is represented by the red dashed line.

Table 1.
Statistical comparison between Aeolus HLOS winds and radiosonde HLOS winds. Aeolus Rayleigh-clear and Mie-cloudy observations across all stations from 2019 to 2022.
3.2. Cruzeiro do Sul
Figure 8 shows the time series of monthly bias at Cruzeiro do Sul from October 2018 to March 2023 for Aeolus Rayleigh-clear (blue squares) and Mie-cloudy (red triangles). The bias for Rayleigh-clear observations fluctuates around the zero line, showing general alignment with the reference winds. However, there are periods with significant deviations, suggesting instances of overestimation or underestimation of wind speeds. The Mie-cloudy bias values also fluctuate around the zero line but are smaller in magnitude throughout the study period. The smaller error bars suggest that Mie-cloudy observations have lower variability and higher confidence in their measurements compared to Rayleigh-clear observations.

Figure 8.
Time series from October 2018 to March 2023 of bias observations in Aeolus Rayleigh-clear (blue squares) and Mie-cloudy (red triangles) winds at Cruzeiro do Sul.
Figure 9 presents scatter plots of Aeolus HLOS versus radiosonde HLOS winds at Cruzeiro do Sul for (a–d) Rayleigh-clear and (e–f) Mie-cloudy winds, from 2019 to 2023. In 2019, the analysis of 302 Rayleigh-clear and 165 Mie-cloudy observations produced a correlation of 0.75 (0.82), bias of −0.10 m/s (−0.05 m/s), and a random error of 6.28 m/s (3.21 m/s). This high level of correlation indicates that Aeolus provided reliable wind measurements that closely matched the reference data. Moreover, the biases in Rayleigh-clear and Mie-cloudy observations indicate only minor underestimations in the measured winds, highlighting the effectiveness of Aeolus in capturing accurate and consistent wind profiles. In 2020, the analysis of 202 Rayleigh-clear and 102 Mie-cloudy observations produced a correlation of 0.75 (0.72), bias of 0.45 m/s (0.93 m/s), and a random error of 6.60 m/s (4.23 m/s). The correlation decreases in Mie-cloudy observations, and bias values considerably increase compared to the previous year. These correlations indicate that Aeolus maintained a reliable performance in capturing wind measurements. However, the bias values suggest a considerable underestimation in Mie-cloudy observations and overestimation in Rayleigh-clear observations. In 2021, the analysis of 725 Rayleigh-clear and 244 Mie-cloudy observations produced a correlation of 0.67 (0.77), bias of −0.10 m/s (−0.10 m/s), and a random error of 8.47 m/s (4.38 m/s). The first correlation above 0.70 was observed for Rayleigh-clear; in contrast, bias values remained low. Despite the decrease, these correlations still indicate a reasonably reliable performance in capturing wind measurements. The bias values highlight a slight underestimation of wind speeds in Rayleigh-clear and Mie-cloudy observations. In 2022, the analysis of 1384 Rayleigh-clear and 545 Mie-cloudy observations resulted in a correlation of 0.76 (0.90), bias of −1.06 m/s (−0.80 m/s), and a random error of 7.01 m/s (3.37 m/s). Despite the correlation values being the best compared to previous years, the bias for both products did not meet the mission requirements of absolute values below 0.7 m/s. These high correlation values indicate that Aeolus continued to provide reliable wind measurements closely aligned with the reference wind. However, the bias values revealed notable underestimations in Rayleigh-clear and Mie-cloudy winds measurements. Table 2 summarizes the statistical results.
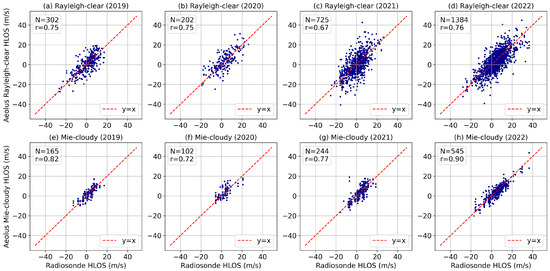
Figure 9.
Aeolus HLOS wind versus the radiosonde HLOS wind for Cruzeiro do Sul over the years 2019, 2020, 2021, and 2022, separated by (a–d) Rayleigh-clear and (e–h) Mie-cloudy winds. The is represented by the red dashed line.
Table 2.
Statistical comparison between Aeolus HLOS winds and radiosonde HLOS winds. Aeolus Rayleigh-clear and Mie-cloudy observations from 2019 to 2022 at Cruzeiro do Sul.
3.3. Porto Velho
Figure 10 shows the time series of monthly bias at Porto Velho from October 2018 to March 2023 for Aeolus Rayleigh-clear (blue squares) and Mie-cloudy (red triangles). The bias for Rayleigh-clear and Mie-cloudy observations fluctuates around the zero line, indicating periods of overestimation and underestimation of wind speeds from Aeolus. These fluctuations are accompanied by varying sizes of error bars; some larger error bars in Rayleigh-clear during certain periods indicate higher uncertainty and less reliable data, while smaller error bars present in Mie-cloudy suggest more consistent and reliable measurements. This pattern suggests that Mie-cloudy observations tend to provide more stable and reliable wind measurements compared to Rayleigh-clear winds, which show greater variability and associated uncertainty in the wind measurements over time.
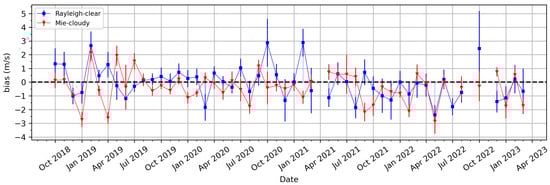
Figure 10.
Time series from October 2018 to March 2023 of bias observations in Aeolus Rayleigh-clear (blue squares) and Mie-cloudy (red triangles) winds at Porto Velho.
Figure 11 presents scatter plots of Aeolus HLOS wind versus radiosonde HLOS wind for Porto Velho from 2019 to 2022 for Rayleigh-clear (a–d) and Mie-cloudy (e–h) winds. In 2019, the analysis of 1333 Rayleigh-clear and 959 Mie-cloudy observations yielded a correlation of 0.74 (0.84), a bias of 0.28 m/s (−0.20 m/s), and a random error of 6.35 m/s (4.08 m/s). These high correlation values indicate that Aeolus provided reliable and consistent wind measurements. For Rayleigh-clear observations, the bias suggests a slight overestimation of wind speeds by Aeolus. In contrast, the bias for Mie-cloudy observations indicates an underestimation. In 2020, the analysis of 1432 Rayleigh-clear and 956 Mie-cloudy observations resulted in a correlation of 0.70 (0.79), a bias of 0.12 m/s (−0.35 m/s), and a random error of 7.50 m/s (4.31 m/s), suggesting a moderate correlation and slightly higher bias compared to the previous year. These results indicate that Aeolus maintained reliable performance in capturing wind measurements. For Rayleigh-clear observations, the bias suggests a small overestimation of wind speeds; for Mie-cloudy, the bias indicates an underestimation. In 2021, the analysis of 984 Rayleigh-clear and 587 Mie-cloudy observations resulted a correlation of 0.70 (0.90), a bias of −0.23 m/s (−0.30 m/s), and a random error of 8.40 m/s (4.08 m/s), indicating a maintained correlation level with slight fluctuations in bias. The correlation reflects Aeolus’ ability to provide reliable wind profiles, while the biases indicate that Aeolus underestimates the observed wind speed for both Rayleigh-clear and Mie-cloudy regimes. In 2022, the analysis of 659 Rayleigh-clear and 398 Mie-cloudy observations yielded a correlation of 0.76 (0.90), a bias of −0.74 m/s (−0.57 m/s), and a random error of 7.03 m/s (3.64 m/s). These strong correlations with the reference winds indicate that Aeolus continued to provide reliable and accurate wind measurements. However, the bias again indicates that Aeolus underestimates the wind for both Rayleigh-clear and Mie-cloudy regimes. Table 3 summarizes the statistical results.
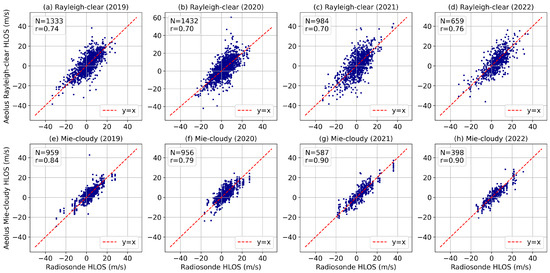
Figure 11.
Aeolus HLOS wind versus the radiosonde HLOS wind, for PORTO VELHO over the years 2019, 2020, 2021, and 2022, separated by (a–d) Rayleigh-clear and (e–h) Mie-cloudy winds. The is represented by the red dashed line.
Table 3.
Statistical comparison between Aeolus HLOS winds and radiosonde HLOS winds. Aeolus Rayleigh-clear and Mie-cloudy observations from 2019 to 2022 at Porto Velho.
3.4. Rio Branco
Figure 12 shows the time series of monthly bias at Rio Branco from October 2018 to December 2021 for Aeolus Rayleigh-clear (blue squares) and Mie-cloudy (red triangles) winds. The bias for Rayleigh-clear and Mie-cloudy observations fluctuates around the zero line, indicating periods of overestimation and underestimation of wind speeds compared to the reference winds. For Rayleigh-clear observations, the bias exhibits significant variability, with larger error bars in certain months, pointing to less reliable data. In contrast, the Mie-cloudy observations show generally smaller error bars, indicating lower variability and higher confidence in the measurements. Mie-cloudy observations tend to provide more stable and reliable bias estimates compared to the more variable and uncertain Rayleigh-clear observations.
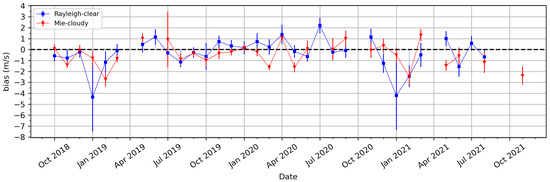
Figure 12.
Time series from October 2018 to December 2021 of bias observations in Aeolus Rayleigh-clear (blue squares) and Mie-cloudy (red triangles) winds at Rio Branco.
Figure 13 presents scatter plots of Aeolus HLOS wind versus radiosonde HLOS wind at Rio Branco from 2019 to 2021 for Rayleigh-clear (a–c) and Mie-cloudy (d–f) winds. In 2019, the analysis of 965 Rayleigh-clear and 575 Mie-cloudy observations produced the following results: correlation 0.74 (0.80), bias −0.19 m/s (−0.50 m/s), and random error 6.05 m/s (3.81 m/s). These results suggested a reasonably strong correlation despite variations in bias, indicating that Aeolus provided reliable but slightly underestimated winds for both regimes in Rayleigh-clear and Mie-cloudy winds. In 2020, the examination of 1424 Rayleigh-clear and 804 Mie-cloudy observations produced the following findings: correlation 0.71 (0.89), a bias of 0.20 m/s (−0.29 m/s), and random error 7.42 m/s (4.46 m/s). These high correlation values indicate that Aeolus maintained reliable in providing consistent wind profiles. The bias for Mie-cloudy observations indicates an underestimation; for Rayleigh-clear observations, the bias reveals an overestimation. In 2021, the analysis of 493 Rayleigh-clear and 285 Mie-cloudy observations unveiled a correlation of 0.74 (0.88), bias of −0.36 m/s (−0.90 m/s), and random error 7.79 m/s (4.54 m/s), suggesting a consistent correlation with significant variations in bias. These high correlation values suggest that Aeolus continued to provide reliable wind measurements. The increased underestimation highlighted by the bias values in Mie-cloudy observations and the moderate underestimation in Rayleigh-clear suggests the need for further bias calibration to enhance the accuracy. Table 4 summarizes these statistical results.
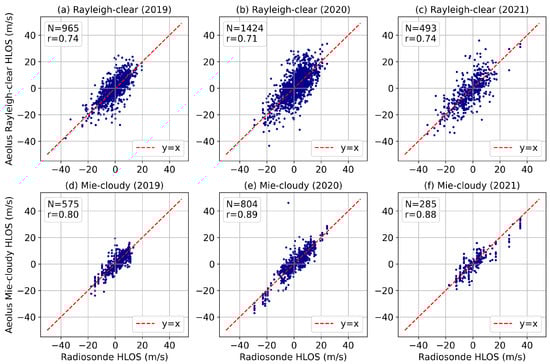
Figure 13.
Aeolus HLOS wind versus the radiosonde HLOS wind, for Rio Branco over the years 2019, 2020, and 2021, separated by (a–c) Rayleigh-clear and (d–f) Mie-cloudy winds. The is represented by the red dashed line.
Table 4.
Statistical comparison between Aeolus HLOS winds and radiosonde HLOS winds. Aeolus Rayleigh-clear and Mie-cloudy observations from 2019 to 2021 at Rio Branco.
4. Conclusions
This study validated the Aeolus Level 2B (L2B) Rayleigh-clear and Mie-cloudy wind products using radiosonde data from three stations in the Brazilian Amazon. The high correlation coefficients of 0.73 for Rayleigh-clear winds and 0.85 for Mie-cloudy winds, between the Aeolus and radiosonde measurements, suggest that Aeolus wind products are reliable for capturing wind profiles in the studied region, which can improve numerical weather prediction (NWP) models.
Observed biases for all collocated winds, including all years and stations, were −0.14 m/s for Rayleigh-clear winds and −0.40 m/s for Mie-cloudy winds, which met the mission requirements to have absolute values of bias below 0.7 m/s. Although the overall biases met these requirements, certain stations and years showed biases exceeding them for Rayleigh-clear or Mie-cloudy products, in line with the results obtained in previous Aeolus validation studies [16,17,19,24]. It is important to note that validation studies rely on data availability and local conditions. The strong agreement among datasets from three different validation stations further supports the robustness of the results.
The monthly bias time series, both aggregated and per station, reveal numerous instances where the Rayleigh-clear and Mie-cloudy biases closely coincide despite there being minor inconsistencies. This alignment strongly indicates consistent performance across both regimes during these periods.
The Aeolus wind products demonstrated solid performance in this validation study conducted in the Brazilian Amazon. These results highlight the importance of the Aeolus mission in providing accurate wind observations, particularly over regions that play important roles in global atmospheric circulation.
Author Contributions
Conceptualization, A.C.Y., P.C.V. and F.J.d.S.L.; methodology, A.C.Y. and P.C.V.; software, A.C.Y. and P.C.V.; validation, A.C.Y., P.C.V. and F.J.d.S.L.; formal analysis, A.C.Y. and E.L.; investigation, A.C.Y. and P.C.V.; resources, E.L.; data curation, A.C.Y. and P.C.V.; writing—original draft preparation, A.C.Y. and P.C.V.; writing—review and editing, A.C.Y., P.C.V., F.J.d.S.L. and E.L.; visualization, A.C.Y., P.C.V., F.J.d.S.L. and E.L.; supervision, E.L.; project administration, E.L.; funding acquisition, E.L. All authors have read and agreed to the published version of the manuscript.
Funding
This research was funded by the National Council for Scientific and Technological Development (CNPq) projects 432515/2018-6 and 406775/2023-0.
Institutional Review Board Statement
Not applicable.
Informed Consent Statement
Not applicable.
Data Availability Statement
Aeolus data: https://aeolus.services/ (accessed on 20 April 2023). Radiosonde data: http://weather.uwyo.edu/upperair/sounding.html (accessed on 20 April 2023).
Acknowledgments
The authors thank VirES for Aeolus.
Conflicts of Interest
The authors declare no conflicts of interest.
References
- Baker, W.E.; Atlas, R.; Cardinali, C.; Clement, A.; Emmitt, G.D.; Gentry, B.M.; Hardesty, R.M.; Källén, E.; Kavaya, M.J.; Langland, R.; et al. Lidar-Measured Wind Profiles: The Missing Link in the Global Observing System. Bull. Am. Meteorol. Soc. 2014, 95, 543–564. [Google Scholar] [CrossRef]
- Stoffelen, A.; Marseille, G.J.; Bouttier, F.; Vasiljevic, D.; De Haan, S.; Cardinali, C. ADM-Aeolus Doppler wind lidar Observing System Simulation Experiment. Q. J. R. Meteorol. Soc. 2006, 132, 1927–1947. [Google Scholar] [CrossRef]
- Haan, S.d.; Stoffelen, A. Assimilation of High-Resolution Mode-S Wind and Temperature Observations in a Regional NWP Model for Nowcasting Applications. Weather Forecast. 2012, 27, 918–937. [Google Scholar] [CrossRef]
- Bauer, P.; Thorpe, A.; Brunet, G. The quiet revolution of numerical weather prediction. Nature 2015, 525, 47–55. [Google Scholar] [CrossRef] [PubMed]
- Horányi, A.; Cardinali, C.; Rennie, M.; Isaksen, L. The assimilation of horizontal line-of-sight wind information into the ECMWF data assimilation and forecasting system. Part I: The assessment of wind impact. Q. J. R. Meteorol. Soc. 2015, 141, 1223–1232. [Google Scholar] [CrossRef]
- Illingworth, A.J.; Battaglia, A.; Bradford, J.; Forsythe, M.; Joe, P.; Kollias, P.; Lean, K.; Lori, M.; Mahfouf, J.F.; Melo, S.; et al. WIVERN: A New Satellite Concept to Provide Global In-Cloud Winds, Precipitation, and Cloud Properties. Bull. Am. Meteorol. Soc. 2018, 99, 1669–1687. [Google Scholar] [CrossRef]
- WMO. Preliminary Statement of Guidance Regarding How Well Satellite Capabilities Meet WMO User Requirements in Several Application Areas; Technical Report WMO/TD-No.913; World Meteorological Organization: Geneva, Switzerland, 1998. [Google Scholar]
- Weissmann, M.; Cardinali, C. Impact of airborne Doppler lidar observations on ECMWF forecasts. Q. J. R. Meteorol. Soc. 2007, 133, 107–116. [Google Scholar] [CrossRef]
- Reitebuch, O.; Lemmerz, C.; Nagel, E.; Paffrath, U.; Durand, Y.; Endemann, M.; Fabre, F.; Chaloupy, M. The Airborne Demonstrator for the Direct-Detection Doppler Wind Lidar ALADIN on ADM-Aeolus. Part I: Instrument Design and Comparison to Satellite Instrument. J. Atmos. Ocean. Technol. 2009, 26, 2501–2515. [Google Scholar] [CrossRef]
- Straume, A.G.; Rennie, M.; Isaksen, L.; Kloe, J.d.; Marseille, G.J.; Stoffelen, A.; Flament, T.; Stieglitz, H.; Dabas, A.; Huber, D.; et al. ESA’s Space-Based Doppler Wind Lidar Mission Aeolus—First Wind and Aerosol Product Assessment Results. EPJ Web Conf. 2020, 237, 01007. [Google Scholar] [CrossRef]
- Rennie, M.P.; Isaksen, L.; Weiler, F.; de Kloe, J.; Kanitz, T.; Reitebuch, O. The impact of Aeolus wind retrievals on ECMWF global weather forecasts. Q. J. R. Meteorol. Soc. 2021, 147, 3555–3586. [Google Scholar] [CrossRef]
- Garrett, K.; Liu, H.; Ide, K.; Hoffman, R.N.; Lukens, K.E. Optimization and impact assessment of Aeolus HLOS wind assimilation in NOAA’s global forecast system. Q. J. R. Meteorol. Soc. 2022, 148, 2703–2716. [Google Scholar] [CrossRef]
- Borne, M.; Knippertz, P.; Weissmann, M.; Martin, A.; Rennie, M.; Cress, A. Impact of Aeolus wind lidar observations on the representation of the West African monsoon circulation in the ECMWF and DWD forecasting systems. Q. J. R. Meteorol. Soc. 2023, 149, 933–958. [Google Scholar] [CrossRef]
- Witschas, B.; Lemmerz, C.; Geiß, A.; Lux, O.; Marksteiner, U.; Rahm, S.; Reitebuch, O.; Weiler, F. First validation of Aeolus wind observations by airborne Doppler wind lidar measurements. Atmos. Meas. Tech. 2020, 13, 2381–2396. [Google Scholar] [CrossRef]
- Lux, O.; Lemmerz, C.; Weiler, F.; Marksteiner, U.; Witschas, B.; Rahm, S.; Geiß, A.; Reitebuch, O. Intercomparison of wind observations from the European Space Agency’s Aeolus satellite mission and the ALADIN Airborne Demonstrator. Atmos. Meas. Tech. 2020, 13, 2075–2097. [Google Scholar] [CrossRef]
- Baars, H.; Herzog, A.; Heese, B.; Ohneiser, K.; Hanbuch, K.; Hofer, J.; Yin, Z.; Engelmann, R.; Wandinger, U. Validation of Aeolus wind products above the Atlantic Ocean. Atmos. Meas. Tech. 2020, 13, 6007–6024. [Google Scholar] [CrossRef]
- Martin, A.; Weissmann, M.; Reitebuch, O.; Rennie, M.; Geiß, A.; Cress, A. Validation of Aeolus winds using radiosonde observations and numerical weather prediction model equivalents. Atmos. Meas. Tech. 2021, 14, 2167–2183. [Google Scholar] [CrossRef]
- Belova, E.; Kirkwood, S.; Voelger, P.; Chatterjee, S.; Satheesan, K.; Hagelin, S.; Lindskog, M.; Körnich, H. Validation of Aeolus winds using ground-based radars in Antarctica and in northern Sweden. Atmos. Meas. Tech. 2021, 14, 5415–5428. [Google Scholar] [CrossRef]
- Iwai, H.; Aoki, M.; Oshiro, M.; Ishii, S. Validation of Aeolus Level 2B wind products using wind profilers, ground-based Doppler wind lidars, and radiosondes in Japan. Atmos. Meas. Tech. 2021, 14, 7255–7275. [Google Scholar] [CrossRef]
- Wu, S.; Sun, K.; Dai, G.; Wang, X.; Liu, X.; Liu, B.; Song, X.; Reitebuch, O.; Li, R.; Yin, J.; et al. Inter-comparison of wind measurements in the atmospheric boundary layer and the lower troposphere with Aeolus and a ground-based coherent Doppler lidar network over China. Atmos. Meas. Tech. 2022, 15, 131–148. [Google Scholar] [CrossRef]
- Bley, S.; Rennie, M.; Žagar, N.; Pinol Sole, M.; Straume, A.G.; Antifaev, J.; Candido, S.; Carver, R.; Fehr, T.; von Bismarck, J.; et al. Validation of the Aeolus L2B Rayleigh winds and ECMWF short-range forecasts in the upper troposphere and lower stratosphere using Loon super pressure balloon observations. Q. J. R. Meteorol. Soc. 2022, 148, 3852–3868. [Google Scholar] [CrossRef]
- Chou, C.C.; Kushner, P.J.; Laroche, S.; Mariani, Z.; Rodriguez, P.; Melo, S.; Fletcher, C.G. Validation of the Aeolus Level-2B wind product over Northern Canada and the Arctic. Atmos. Meas. Tech. 2022, 15, 4443–4461. [Google Scholar] [CrossRef]
- Witschas, B.; Lemmerz, C.; Geiß, A.; Lux, O.; Marksteiner, U.; Rahm, S.; Reitebuch, O.; Schäfler, A.; Weiler, F. Validation of the Aeolus L2B wind product with airborne wind lidar measurements in the polar North Atlantic region and in the tropics. Atmos. Meas. Tech. 2022, 15, 7049–7070. [Google Scholar] [CrossRef]
- Abril-Gago, J.; Ortiz-Amezcua, P.; Bermejo-Pantaleón, D.; Andújar-Maqueda, J.; Bravo-Aranda, J.A.; Granados-Muñoz, M.J.; Navas-Guzmán, F.; Alados-Arboledas, L.; Foyo-Moreno, I.; Guerrero-Rascado, J.L. Validation activities of Aeolus wind products on the southeastern Iberian Peninsula. Atmos. Chem. Phys. 2023, 23, 8453–8471. [Google Scholar] [CrossRef]
- Baars, H.; Walchester, J.; Basharova, E.; Gebauer, H.; Radenz, M.; Bühl, J.; Barja, B.; Wandinger, U.; Seifert, P. Long-term validation of Aeolus L2B wind products at Punta Arenas, Chile, and Leipzig, Germany. Atmos. Meas. Tech. 2023, 16, 3809–3834. [Google Scholar] [CrossRef]
- Kirkwood, S.; Belova, E.; Voelger, P.; Chatterjee, S.; Satheesan, K. Extended validation of Aeolus winds with wind-profiling radars in Antarctica and Arctic Sweden. Atmos. Meas. Tech. 2023, 16, 4215–4227. [Google Scholar] [CrossRef]
- Ratynski, M.; Khaykin, S.; Hauchecorne, A.; Wing, R.; Cammas, J.P.; Hello, Y.; Keckhut, P. Validation of Aeolus wind profiles using ground-based lidar and radiosonde observations at Réunion island and the Observatoire de Haute-Provence. Atmos. Meas. Tech. 2023, 16, 997–1016. [Google Scholar] [CrossRef]
- Borne, M.; Knippertz, P.; Weissmann, M.; Witschas, B.; Flamant, C.; Rios-Berrios, R.; Veals, P. Validation of Aeolus L2B products over the tropical Atlantic using radiosondes. Atmos. Meas. Tech. 2024, 17, 561–581. [Google Scholar] [CrossRef]
- Yoshida, A.C.; da Silva Lopes, F.J.; Venturini, P.C.; Cacheffo, A.; Guerrero-Rascado, J.L.; Landulfo, E. Validation of Aeolus Wind Product at Cruzeiro do Sul-Brazil. In Proceedings of the Space-Based Lidar Remote Sensing Techniques and Emerging Technologies, Milos Island, Greece, 18–23 June 2023; Singh, U.N., Tzeremes, G., Refaat, T.F., Ribes Pleguezuelo, P., Eds.; Springer: Cham, Switzerland, 2024; pp. 319–328. [Google Scholar] [CrossRef]
- Santos, C.A.G.; dos Santos, D.C.; Neto, R.M.B.; de Oliveira, G.; dos Santos, C.A.C.; da Silva, R.M. Analyzing the impact of ocean-atmosphere teleconnections on rainfall variability in the Brazilian Legal Amazon via the Rainfall Anomaly Index (RAI). Atmos. Res. 2024, 307, 107483. [Google Scholar] [CrossRef]
- Witschas, B.; Lemmerz, C.; Lux, O.; Marksteiner, U.; Reitebuch, O.; Weiler, F.; Fabre, F.; Dabas, A.; Flament, T.; Huber, D.; et al. Spectral performance analysis of the Aeolus Fabry–Pérot and Fizeau interferometers during the first years of operation. Atmos. Meas. Tech. 2022, 15, 1465–1489. [Google Scholar] [CrossRef]
- Flesia, C.; Korb, C.L. Theory of the double-edge molecular technique for Doppler lidar wind measurement. Appl. Opt. 1999, 38, 432–440. [Google Scholar] [CrossRef]
- McKay, J.A. Assessment of a multibeam Fizeau wedge interferometer for Doppler wind lidar. Appl. Opt. 2002, 41, 1760–1767. [Google Scholar] [CrossRef] [PubMed]
- Dirksen, R.J.; Sommer, M.; Immler, F.J.; Hurst, D.F.; Kivi, R.; Vömel, H. Reference quality upper-air measurements: GRUAN data processing for the Vaisala RS92 radiosonde. Atmos. Meas. Tech. 2014, 7, 4463–4490. [Google Scholar] [CrossRef]
- Velden, C.S.; Holmlund, K. Report from the working group on verification and quality indices (WG III). In Proceedings of the 4th International Winds Workshop, EUMETSAT, Saanenmöser, Switzerland, 20–23 October 1998. [Google Scholar]


Disclaimer/Publisher’s Note: The statements, opinions and data contained in all publications are solely those of the individual author(s) and contributor(s) and not of MDPI and/or the editor(s). MDPI and/or the editor(s) disclaim responsibility for any injury to people or property resulting from any ideas, methods, instructions or products referred to in the content. |
© 2024 by the authors. Licensee MDPI, Basel, Switzerland. This article is an open access article distributed under the terms and conditions of the Creative Commons Attribution (CC BY) license (https://creativecommons.org/licenses/by/4.0/).