Article

Comparative Study οf the Frequencies οf Atmospheric Circulation Types at Different Geopotential Levels and Their Relationship with Precipitation in Southern Romania

by
Konstantia Tolika
1,*,
Christina Anagnostopoulou
1,
Myriam Traboulsi
2,3,
Liliana Zaharia
4,
Dana Maria (Oprea) Constantin
4,
Ioannis Tegoulias
1,5 and
Panagiotis Maheras
1
1
Department of Meteorology and Climatology, School of Geology, Aristotle University of Thessaloniki, 54124 Thessaloniki, Greece
2
Faculté des Lettres, Université Libanaise, Corniche Mazraa, Beirut P.O. Box 6573/14, Lebanon
3
Archéorient—UMR 5133, Maison de l’Orient et de la Méditerranée, CNRS—Université Lyon 2. 7, rue Raulin, 69007 Lyon, France
4
Department of Meteorology and Hydrology, Faculty of Geography, University of Bucharest, 010041 Bucharest, Romania
5
ELGA—Meteorological Applications Center, International Airport Macedonia, 55103 Thessaloniki, Greece
*
Author to whom correspondence should be addressed.
Atmosphere 2024, 15(9), 1027; https://doi.org/10.3390/atmos15091027 (registering DOI)
Submission received: 9 July 2024 / Revised: 10 August 2024 / Accepted: 22 August 2024 / Published: 24 August 2024
(This article belongs to the Special Issue Advances in Rainfall-Induced Hazard Research)

Abstract

:
The primary aim of this study is to examine the characteristics of atmospheric circulation patterns at various geopotential levels and their relationship with precipitation in southern Romania during the period from 1961 to 2020. Daily geopotential heights (1000 hPa, 850 hPa, 700 hPa and 500 hPa) were utilized in an automatic updated atmospheric circulation scheme for the creation of daily calendars of 12 circulation types (5 anticyclonic and 7 cyclonic) as well as daily time series derived from five stations over the domain of interest. To assess the influence of the atmospheric circulation on precipitation, correlations and time trends were explored between the rainfall totals and the different circulation types. The findings reveal a rising trend in anticyclonic circulation types across the region, while cyclonic types exhibit a consisted decrease. Precipitation and number of rain days percentages associated with specific cyclonic types depend on the geopotential levels, while annual and seasonal precipitation linked to cyclonic types decreases progressively from higher to lower levels. The strongest correlations in circulation type frequencies are observed between adjacent circulation types. Taylor diagram analysis indicates that the relationships between circulation types and precipitation vary both seasonally and across different atmospheric levels. Notably, the two rainiest circulation types are more accurately simulated at higher atmospheric levels (700 hPa and 500 hPa).

1. Introduction

Precipitation has always been a vital climatic parameter for both society and the environment, as its variability can profoundly impact numerous socio-economic activities and the functioning of natural ecosystems. Understanding the mechanisms that control precipitation characteristics is therefore of great scientific and practical importance. This interest is heightened in the context of climate change, where society is increasingly confronted with extreme rainfall events [1], such as droughts and heavy rains, which cause significant damage on both global and regional scales.
One of the primary scientific concerns for climatology researchers is the analysis of the spatio-temporal variability of precipitation. The outcomes of such studies offer valuable insights for various socio-economic sectors that are closely linked to precipitation, including water resource management and agriculture [2,3,4]. However, to accurately understand and predict precipitation variability and future trends, it is crucial to identify and analyze the physical factors that influence the frequency and magnitude of precipitation in each region.
The atmospheric circulation is the key driver of the formation and variability of precipitation. Thus, to understand to what extent precipitation is influenced by atmospheric pressure systems (even in different levels), research focused on the relationships between the atmospheric circulation characteristics and precipitation-related indices is crucial. The determination of these connections allows for the estimation of possible precipitation alterations based on the identified changes in atmospheric circulation [5]. The relationship between the circulation types and precipitation, for different countries in Europe, was highlighted in studies carried out by several authors [6,7,8,9,10]. One of the highlights of Lopez-Moreno et al. [6] was the fact that winter NAO (North Atlantic Oscillation) has a substantial impact on the climate and especially the precipitation conditions in mountainous areas of the Mediterranean region, even though the influence is not that strong at the eastern parts of the domain of study. The findings of Balataci et al. [7] for the area of Turkey (Marmara Region) indicated that the response of precipitation to atmospheric circulation is both complex and spatially heterogeneous, reflecting the area’s intricate topography. Moreover, utilizing the 26-type Lamb scheme for Serbia, Putniković and Tošić [8] note that the observed positive trend of C circulation types and the corresponding decrease in A types align with the increasing trend in autumn precipitation in Serbia, suggesting that the C type plays a significant role in precipitation occurrence across the country. The investigation of the atmospheric circulation and extreme precipitation over Italy revealed that their relation was highly dependent on latitude, orographic exposure, and seasonal variation, and only a limited number of circulation types exhibited a significant relationship with the examined extreme precipitation index [9]. The author underlines that the index trend is more strongly affected by changes in the internal characteristics of the circulation types rather than by shifts in their frequencies. However, this influence exhibits considerable spatial heterogeneity across Italy. Finally, and especially for central Italy, Silvestri et al. [10] found that the decreasing annual precipitation trend could be attributed to alterations in both the frequency and internal characteristics of the predominant circulation weather types that influence precipitation. Nevertheless, the substantial impact of orography and air–sea interactions in this region adds complexity to the relationship between circulation weather types (CWT) and precipitation patterns [10].
In Romania, the variability of precipitation in relation to atmospheric circulation has been the subject of relatively few studies. The majority of research efforts have concentrated on analyzing precipitation variability at both national and regional scales, with a focus on identifying observed trends and projecting future changes. Since 1961, various authors have documented shifts in the variability of annual and seasonal rainfall, exhibiting spatially heterogeneous trends. While annual precipitation patterns have remained largely stable, significant positive trends have been observed during the autumn season at numerous stations, particularly in the central and western regions, as well as in the extreme southern areas along the Danube River. Conversely, negative trends have been detected at only a few isolated stations [11,12,13,14,15,16,17]. Some changes were also reported in the annual rainfall regime [18] Between 1961 and 2010, changes in rainfall extremes were also detected in Romania: significant positive trends were found in both the frequency of very wet days and maximum daily rainfall, during autumn, as well as in the maximum duration of dry spells, during summer [19]. Over the period 1961–2013, negative trends were noted in the annual number of rain days and dominant positive trends were noted in the number with heavy precipitation exceeding 10 mm/day [20]. In recent decades (1991–2020), the average number of days with more than 20 mm/day was higher compared to that in the period 1961–1990 for most stations in Romania [15]. At a regional scale, spatial and temporal precipitation variability and trends (annual, seasonal and extreme) have been analyzed by several authors [17,21,22,23,24,25,26].
While the variability of precipitation in Romania has been extensively studied, there are only a few studies that explore the connection between atmospheric circulation and precipitation. Most of these studies focus on the relationship between precipitation (and related parameters) and large-scale circulation patterns [19,27,28]. Some researchers focused on the role of the Mediterranean cyclones in the weather and climate in Romania [29,30], while very few studies addressed the connection between circulation types/synoptic conditions and precipitation. Such a study was conducted by Rimbu et al. [31], analyzing the links between blocking circulation and precipitation extremes over Romania in summer. Dobri et al. [32] explored the distribution of the monthly 24 h maximum amount of precipitation in relation to their synoptic cause. The authors showed that during the cold semester, the Atlantic and Mediterranean cyclones are the ones responsible for the high amount of precipitation in 24 h. During the warm semester, there is an atmospheric instability induced either by the movement of troughs from west to east towards the middle of the continent or by cut-off lows systems located over Romania. From a total of 312 extreme precipitation days in Romania, 42.6% are associated with the high atmospheric instability, about 40% are related to Mediterranean depressions and 17.1% are related to the Atlantic cyclonic activity [32].
Tolika et al. (2023) [33] examined the variability of precipitation (mean and extreme) and their links with the atmospheric circulation types (at the 500 hPa level) over southern Romania between 1961 and 2020. The study is based on an automatic objective classification scheme which provides a daily calendar of 12 atmospheric circulation types (five anticyclonic and seven cyclonic) and on the processing of daily precipitation time series from five weather stations in the study region. The results showed non-significant positive trends for the precipitation amounts related to very rainy circulation types annually, in winter, spring and autumn, while for summer, the trends were negative. The authors found that during extreme precipitation events, the dominant circulation types are most related to western circulation and Mediterranean- or Atlantic-originated depressions.
The present paper aims to extend the previous study [33] by investigating the relationship between the atmospheric circulation types and precipitation at four geopotential levels (1000 hPa, 850 hPa, 700 hPa and 500 hPa) over the period 1961–2020 to identify specific features of the atmospheric circulation types at different levels and possible connections with rainfall-related indices. It provides new and original results for better understanding the characteristics of the atmospheric mechanisms controlling precipitation in southern Romania. Following the introduction, the study area, data, and methods are described in Section 2. The results are presented in Section 3, where several issues are addressed: (i) frequencies of atmospheric circulation types (Section 3.1); (ii) correlation coefficients between the frequencies of anticyclonic and cyclonic circulation types at the selected geopotential levels (Section 3.2); and (iii) frequencies and trends in annual and seasonal precipitation depending on the relation with the circulation types (Section 3.3). Section 4 is devoted to discussions and conclusions.

2. Materials and Methods

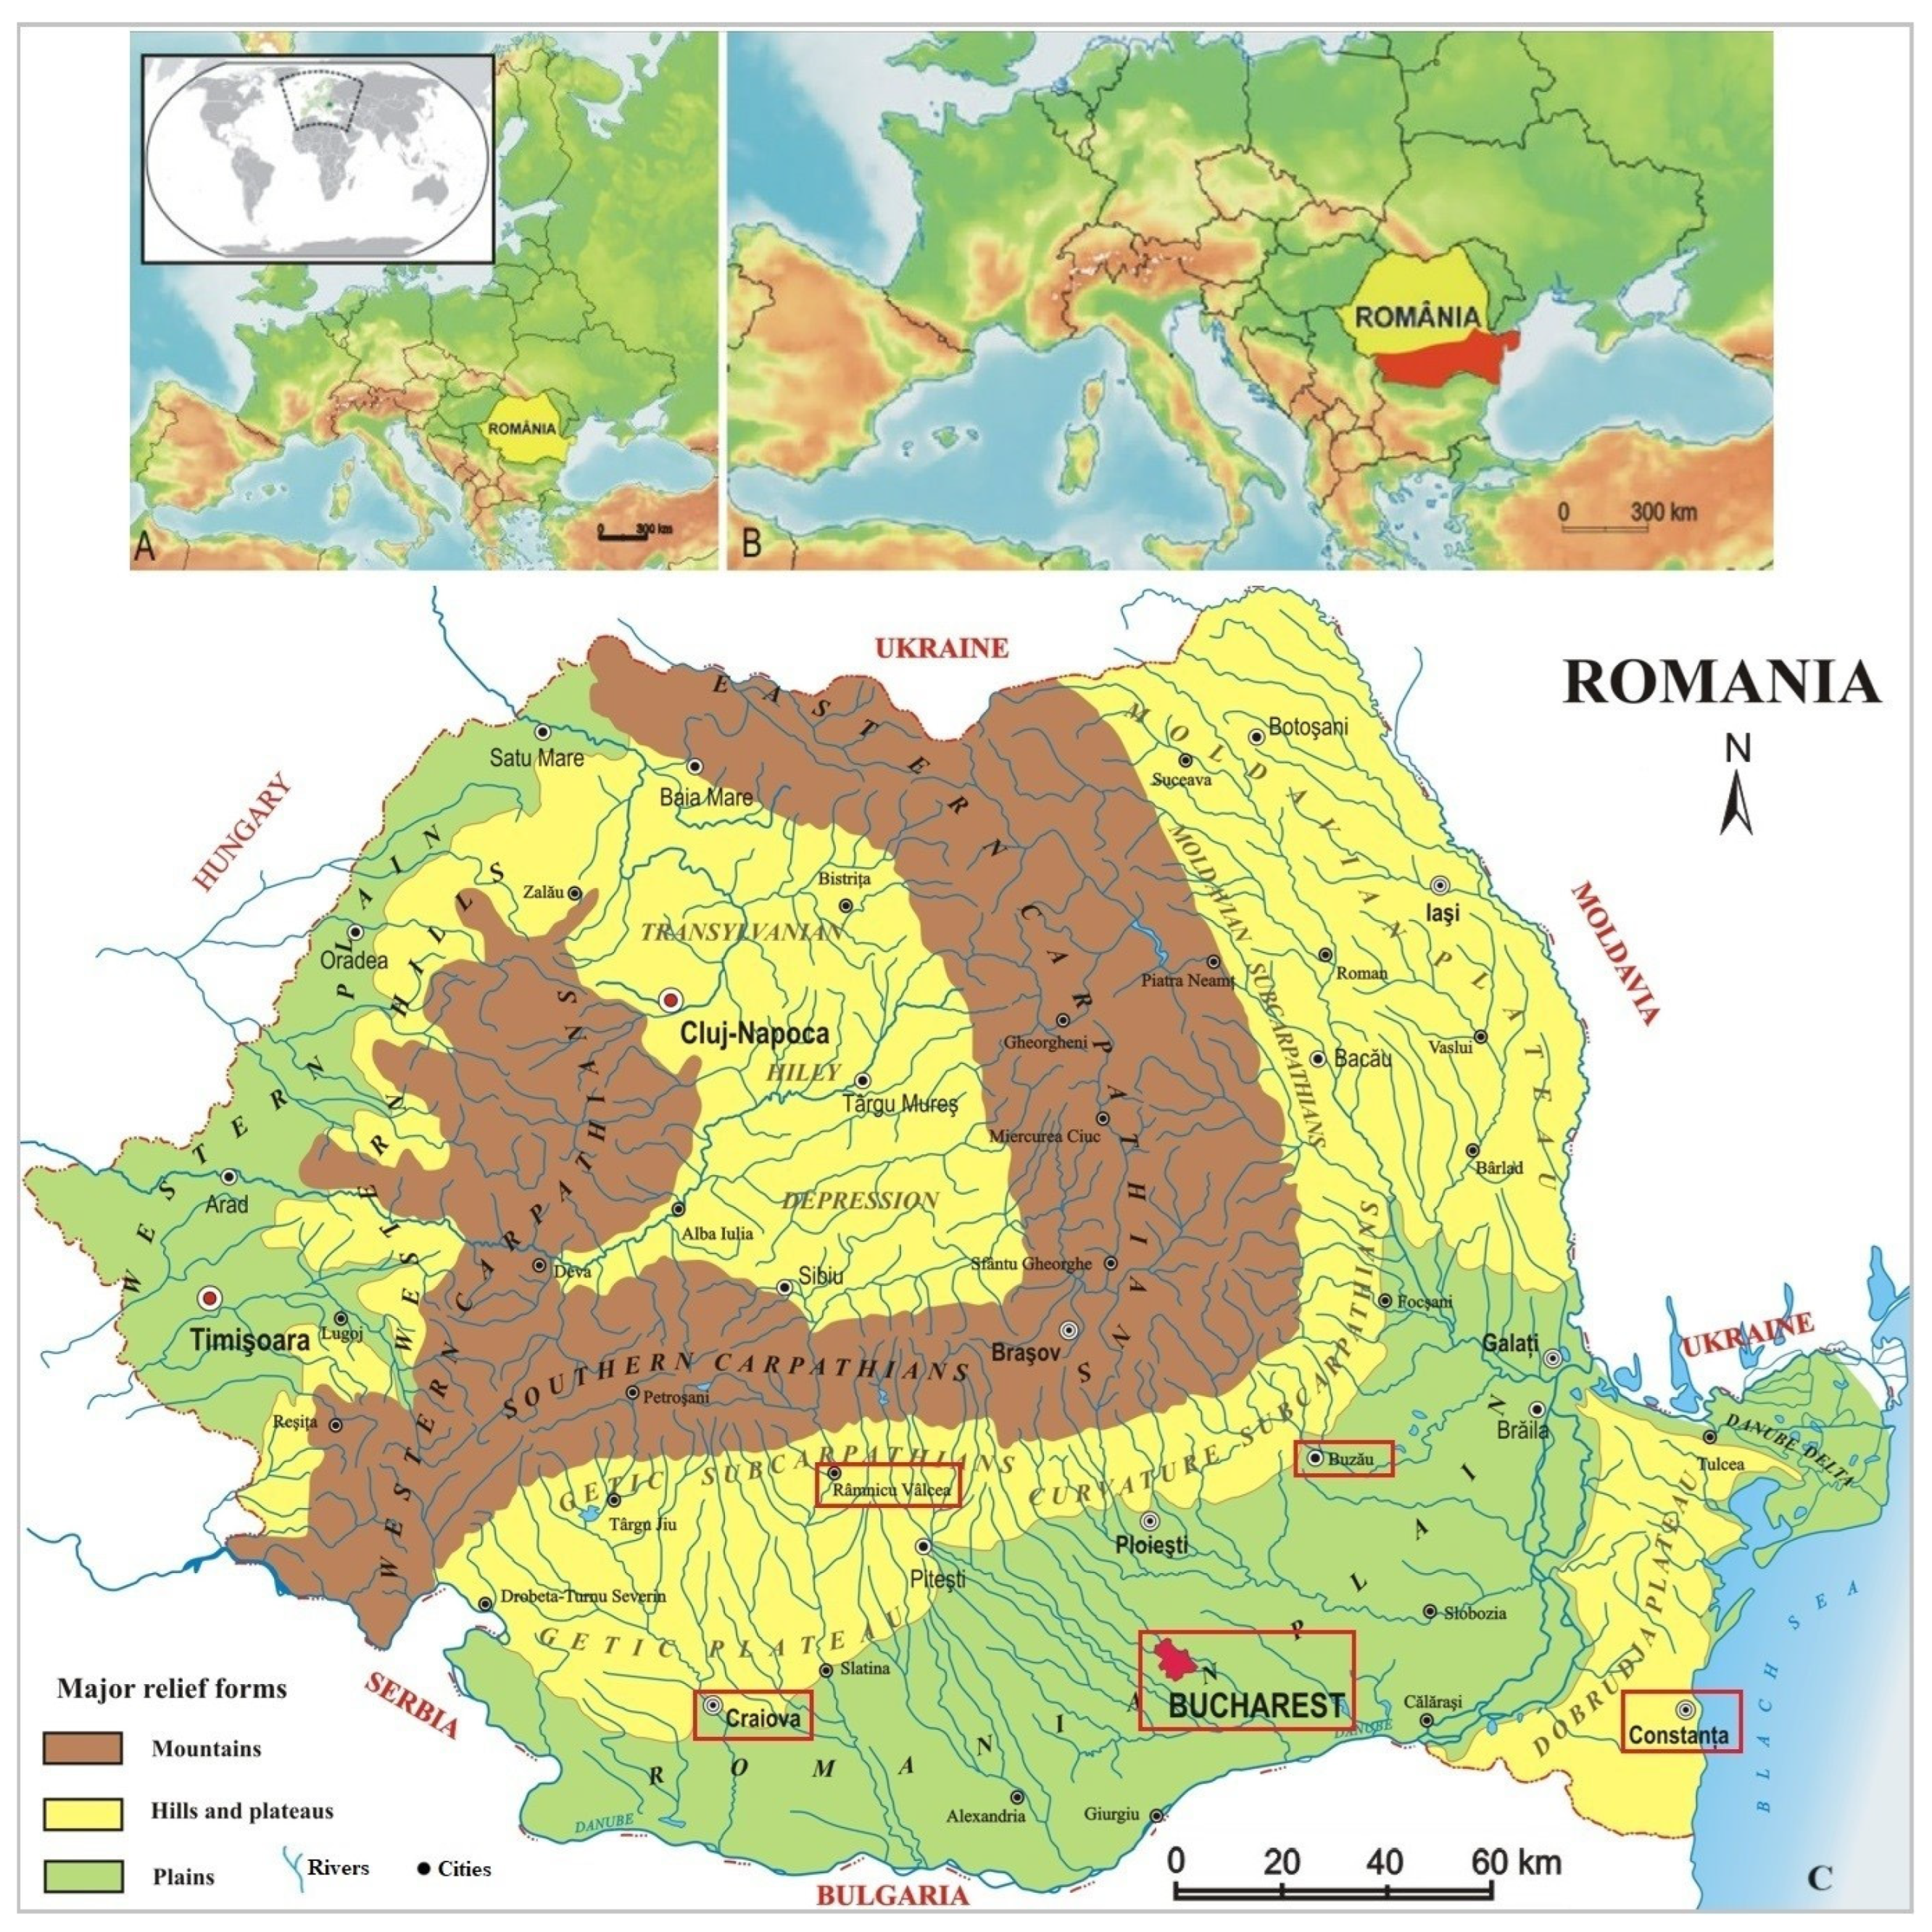
2.1. Study Area: General Geographic and Climatic Features

The study area is located in southern Romania, extending from the foothills of the Carpathians (in the north) to the Danube River (in the south and east). It also includes the Dobrogea region, located in southeast Romania, bordered by the Danube River (to the west and north) and the Black Sea (to the east) (Figure 1). Most of the study area overlaps the large Romanian plain with altitudes lower than 300 m. To the north and northwest, the altitudes increase to 400–700 m in the Getic Piedmont. Dobrogea region has a hilly landscape lower than 500 m in altitude (Table 1).
Overall, the study area has a temperate continental climate, controlled by four major types of air circulation that act on the European scale, namely, western (with the highest frequency), polar, tropical and blocking circulation. Several atmospheric pressure systems (cyclones and anticyclones) play a significant role in the climate in the Romanian region: the Azores and East-European anticyclones and the Mediterranean and Icelandic cyclones, while the Greenlandic, Scandinavian and North African anticyclones affect the Romanian climate characteristics, but at a lower level [16,34].
Due to its geographical location, the climate in the western part of Romania is influenced by both Mediterranean (southern) and Atlantic (western) air masses, while the eastern part is impacted by continental influences and the proximity to the Black Sea [14]. The Carpathian Mountains, which exceed 2000 m in elevation, with a maximum peak of 2544 m, play a significant role in shaping the region’s climate. They affect regional atmospheric dynamics, alter the paths of atmospheric fronts and cyclones and have a broad impact on the local climate and weather patterns [33]. The predominantly east–west orientation and curved shape of the Carpathians, particularly in the northern part of the study area, create an orographic barrier that influences air mass movement and facilitates the occurrence of the foehn effect, especially in the external areas of the curvature [35].
In the above-mentioned synoptic and topographical context, the climate in the study area is characterized by cold winters (except for the Dobrogea region, with milder winters, due to the influence of the Black Sea), quite hot and humid summers (with significant precipitation amounts, especially in June) and dry weather in early autumn [36]. Despite the relatively small altitude variations throughout the study region, there are spatial climatic differences caused by local or regional factors (as mentioned above).
The annual amount of precipitation over the study area varies spatially from less than 300 mm/year (in the eastern extremity) up to about 700 mm/year in the hilly region (Getic Piedmont). During the year, the rainiest period is, in general, late spring–early summer (April–July), while the driest period is the first part of autumn (September–October) and winter [36]. In the western and eastern parts, the winter is more humid than in the rest of the region due to of the influence of the wetter (maritime) air masses from the Mediterranean Sea and the Black Sea, respectively. The maximum rainfall in the spring–summer period is related to the more intense activity of the Atlantic cyclones that enter the continent up to the region of Romania, as well as to the intense cyclonic activity over the Mediterranean region. The dry weather in autumn is associated with the dominantly anticyclonic conditions, while the low precipitation in winter is associated with the dominance of the eastern (continental) atmospheric circulation [27].
No clear, statistically significant trends in precipitation (annual, seasonal and monthly) were noted in the study area in the last three to six decades [26,37]. Hence, precipitation variability can be considered as quasi-stationary. The trend analysis of the annual amount and extreme precipitation at five weather stations in the study area between 1961 and 2020 did not show statistically significant trends. However, some exceptions were noted: significant negative trends were found for annual precipitation at Constanța (on the Black Sea coast), for the daily precipitation totals greater than the 95th percentile at Craiova and for the number of days exceeding the 99th percentile at the Buzău and Râmnicu Vâlcea weather stations [33]. Croitoru et al. [20] analyzed several daily extreme precipitation indices over the period 1961–2013 over Romania and concluded that the weather became more extreme in terms of precipitation intensity and frequency. Also, it is worth noting that there was a higher frequency of significant changes detected for the indices SDII (Simple Daily Intensity Index) and R95p (number of very wet days), especially in the eastern part of the study area (in Dobrogea). In the case of other indices, the identified trends were mostly spatially heterogeneous, both increasing and decreasing, but statistically insignificant [20].
The model’s future simulations over the area of interest indicate significant differences between the cold and warm seasons. During summer, the EURO-CORDEX regional climate models showed in southern Romania, for the period 2071–2100, a decrease of precipitation up to 20% (RCP4.5) and 30% (RCP8.5), with the biggest decreases in Dobrogea region. In winter, the projections revealed a precipitation increase of up to 15% (RCP 4.5) and up to 25% (RCP 8.5), with the largest increases in the western part [20]. Both scenarios showed statistically significant increases in the annual number of very wet days (R20 index) and the annual total wet days (PRCPTOT index), mainly in the eastern part of the study area and more evident for RCP8.5 [38].
The favorable geographical conditions make Southern Romania a quite dense and highly socio-economically developed region, with large water demands for multiple needs (population, industry, agriculture, etc.). The Romanian Plain is the most important agricultural region of the country, highly dependent on precipitation, due to the rather small irrigated areas. The country’s capital, Bucharest, and other large cities with socio-economic and administrative functions (e.g., county residences, such as Craiova, Pitești, Ploiești, Buzău, Constanța, etc.), as well as many smaller settlements, are located in the study area. Since precipitation plays a crucial role in ensuring water resources for various uses, this area is highly vulnerable to water deficit and drought. In the context in which, in recent decades, aridization trends have been reported in Southern Romania [37,39] and the future projections show significant decreases in precipitation amounts in summer [15], it is likely that the risk induced by water deficit will increase. On the other hand, excess precipitation (i.e., heavy rains) can cause serious social-economic consequences because of the floods.
In such context, studies on atmospheric circulation in relation to precipitation could help in better understanding the characteristics of the atmospheric mechanisms controlling the precipitation formation and variability. Such studies could provide useful scientific-based information for regional sustainable development strategies, in accordance with identified and forecasted changes in atmospheric circulation and precipitation.

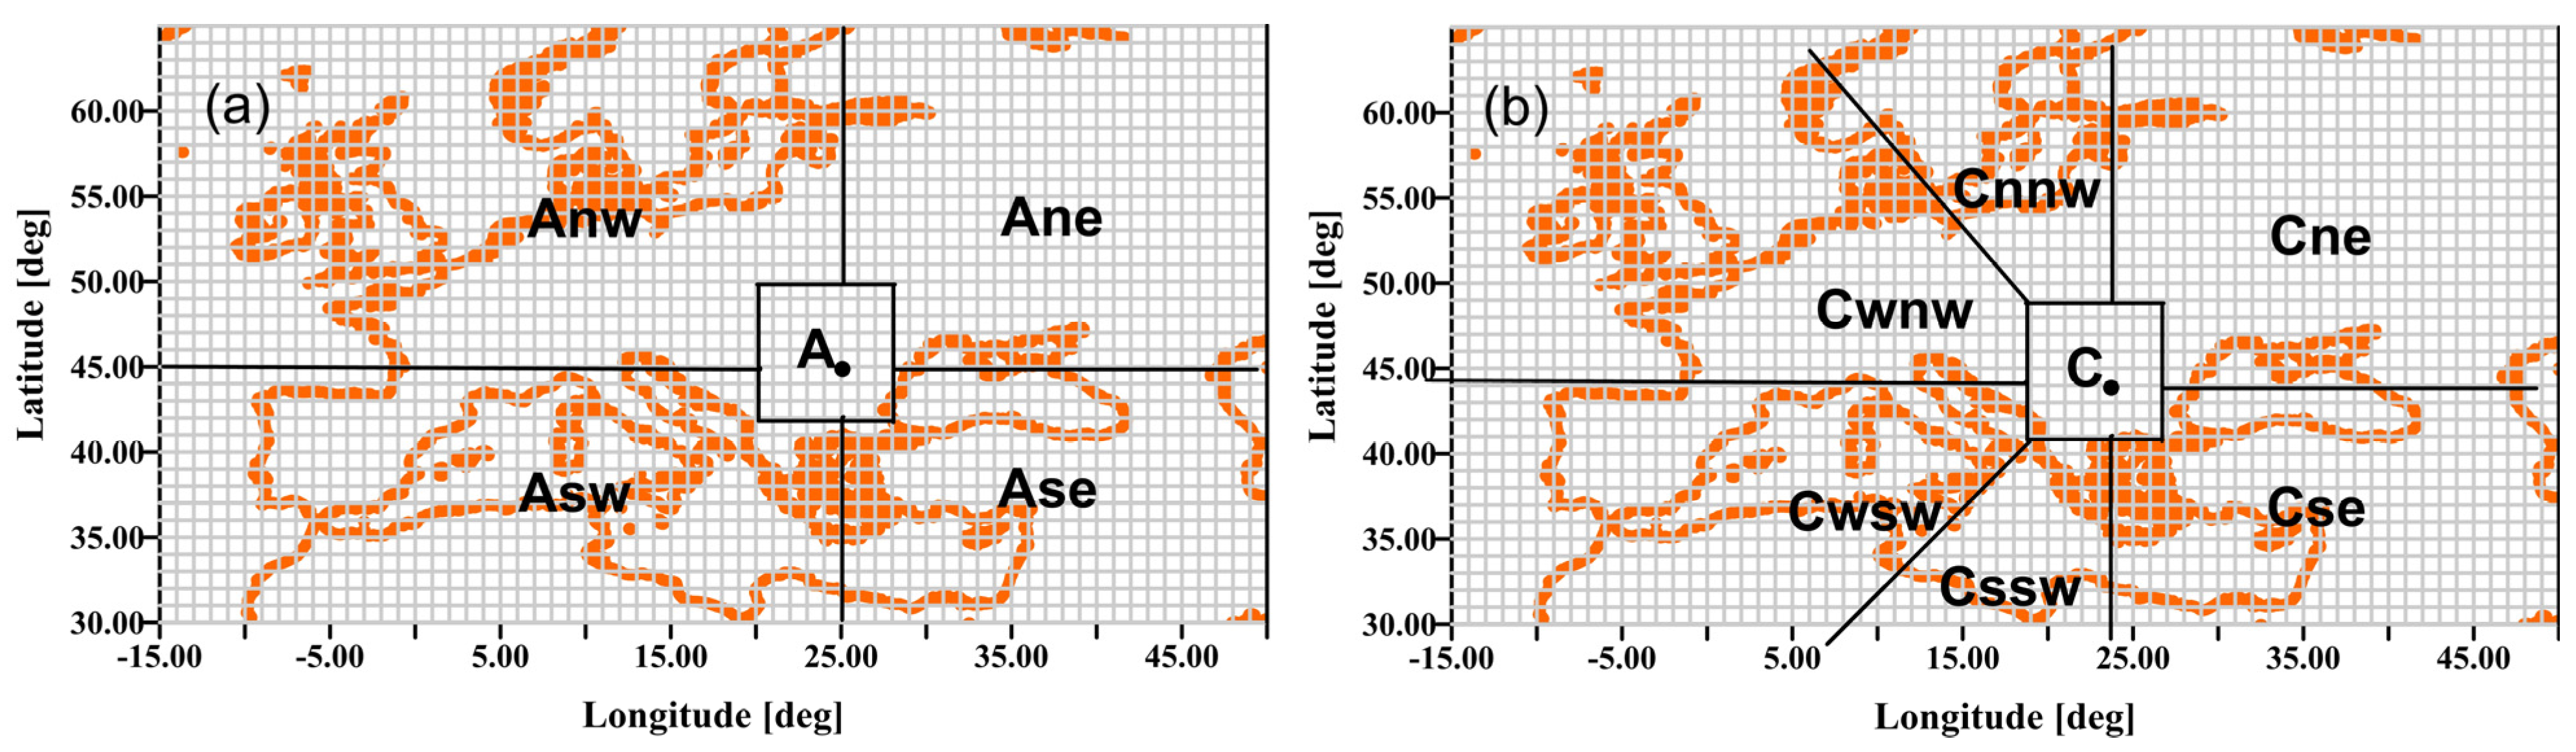
2.2. Data and Methodology

The classification of circulation types is developed using geopotential height anomalies. The time period of the analysis is from 1961 to 2020, as in [33]. The classification scheme used in this paper consists of five anticyclonic types and seven cyclonic types (Figure 2), which are classified primarily by their center location (positive center—anticyclonic type and negative center—cyclonic type). Based on the literature criteria [40], a classification scheme is effective if each type corresponds to a characteristic geopotential pattern which can easily be optically distinct from the other types, if it can reproduce the wind flows at the surface and at different heights and if it can reproduce the meteorological conditions over the domain of interest.
Two different datasets are used in the present study: (i) Daily geopotential heights at 1000 hPa, 850 hPa, 700 hPa and 500 hPa geopotential levels extracted from NCEP/NCAR reanalysis data [41]. The resolution of the reanalysis data is 2.5° × 2.5° within the area 20° N–75° N and 25° W–50° E. The coordinates of the main central grid point for the classification are the same as in Tolika et al. [33], 45° N and 25° E. (ii) Daily precipitation time series, covering a 60-year period (1961–2020) recorded at five selected weather stations located in regions with different geographical and climatic characteristics, at altitudes ranging between 13 m a.s.l. and 239 m a.s.l., as follows: Craiova (in the west, 192 m a.s.l.), Râmnicu (Rm.) Vâlcea (located in a hilly area at the foot of the Carpathians, in a valley corridor, at 239 m a.s.l.), București (Bucharest)–Băneasa (nearly in the central part of the Romanian Plain, at 90 m a.s.l.), Buzău (in the northeastern part of the study area, 97 m a.s.l.) and Constanța (in the eastern extremity, on the Black Sea coast, at 13 m a.s.l.) (Table 1, Figure 1). The precipitation data series were extracted from the ECA&D (European Climate Assessment & Dataset) database freely accessible at https://www.ecad.eu/, accessed on 22 April 2024.
Based on the automatic classification scheme, four different daily circulation type calendars were created for four geopotential levels (1000 hPa, 850 hPa, 700 hPa and 500 hPa) using the anomalies of the geopotential heights and the analysis of their frequencies and trends [40]. The use of anomalies of geopotential heights eliminates seasonality, and the main centers of action, anticyclones or depressions, are easily detectable. Second, an analysis of precipitation in the south of Romania in relation to the types of circulation at different geopotential heights for these same areas and their linear trends was also carried out. Figure 3 depicts the mean seasonal maps of the 12 circulation types for the winter season. The reader can easily note the perfect match of the centers of the circulation types (Figure 2 and Figure 3), the magnitude of the positive (negative) anomalies of the anticyclonic (cyclonic) types as well as the spatial distribution and morphology of each type of anomalies. We chose to present the winter mean anomaly composites since, in winter, the atmospheric circulation in mid-latitudes is more stable and organized in comparison to that of the rest of the seasons. Thus, the most optimal circulation type mean pattern is reproduced.
The trends and their statistical significance were explored and tested, on annual and seasonal time scales, using the Mann–Kendall test. Finally, we analyzed the linear correlations between the frequencies of the circulation types for the different altitude levels. These correlations were tested by Spearman’s Ro. The ultimate goal is to thoroughly analyze the advantages and disadvantages of different geopotential areas for the study of the relationships between precipitation and circulation patterns in the south of Romania.

3. Results

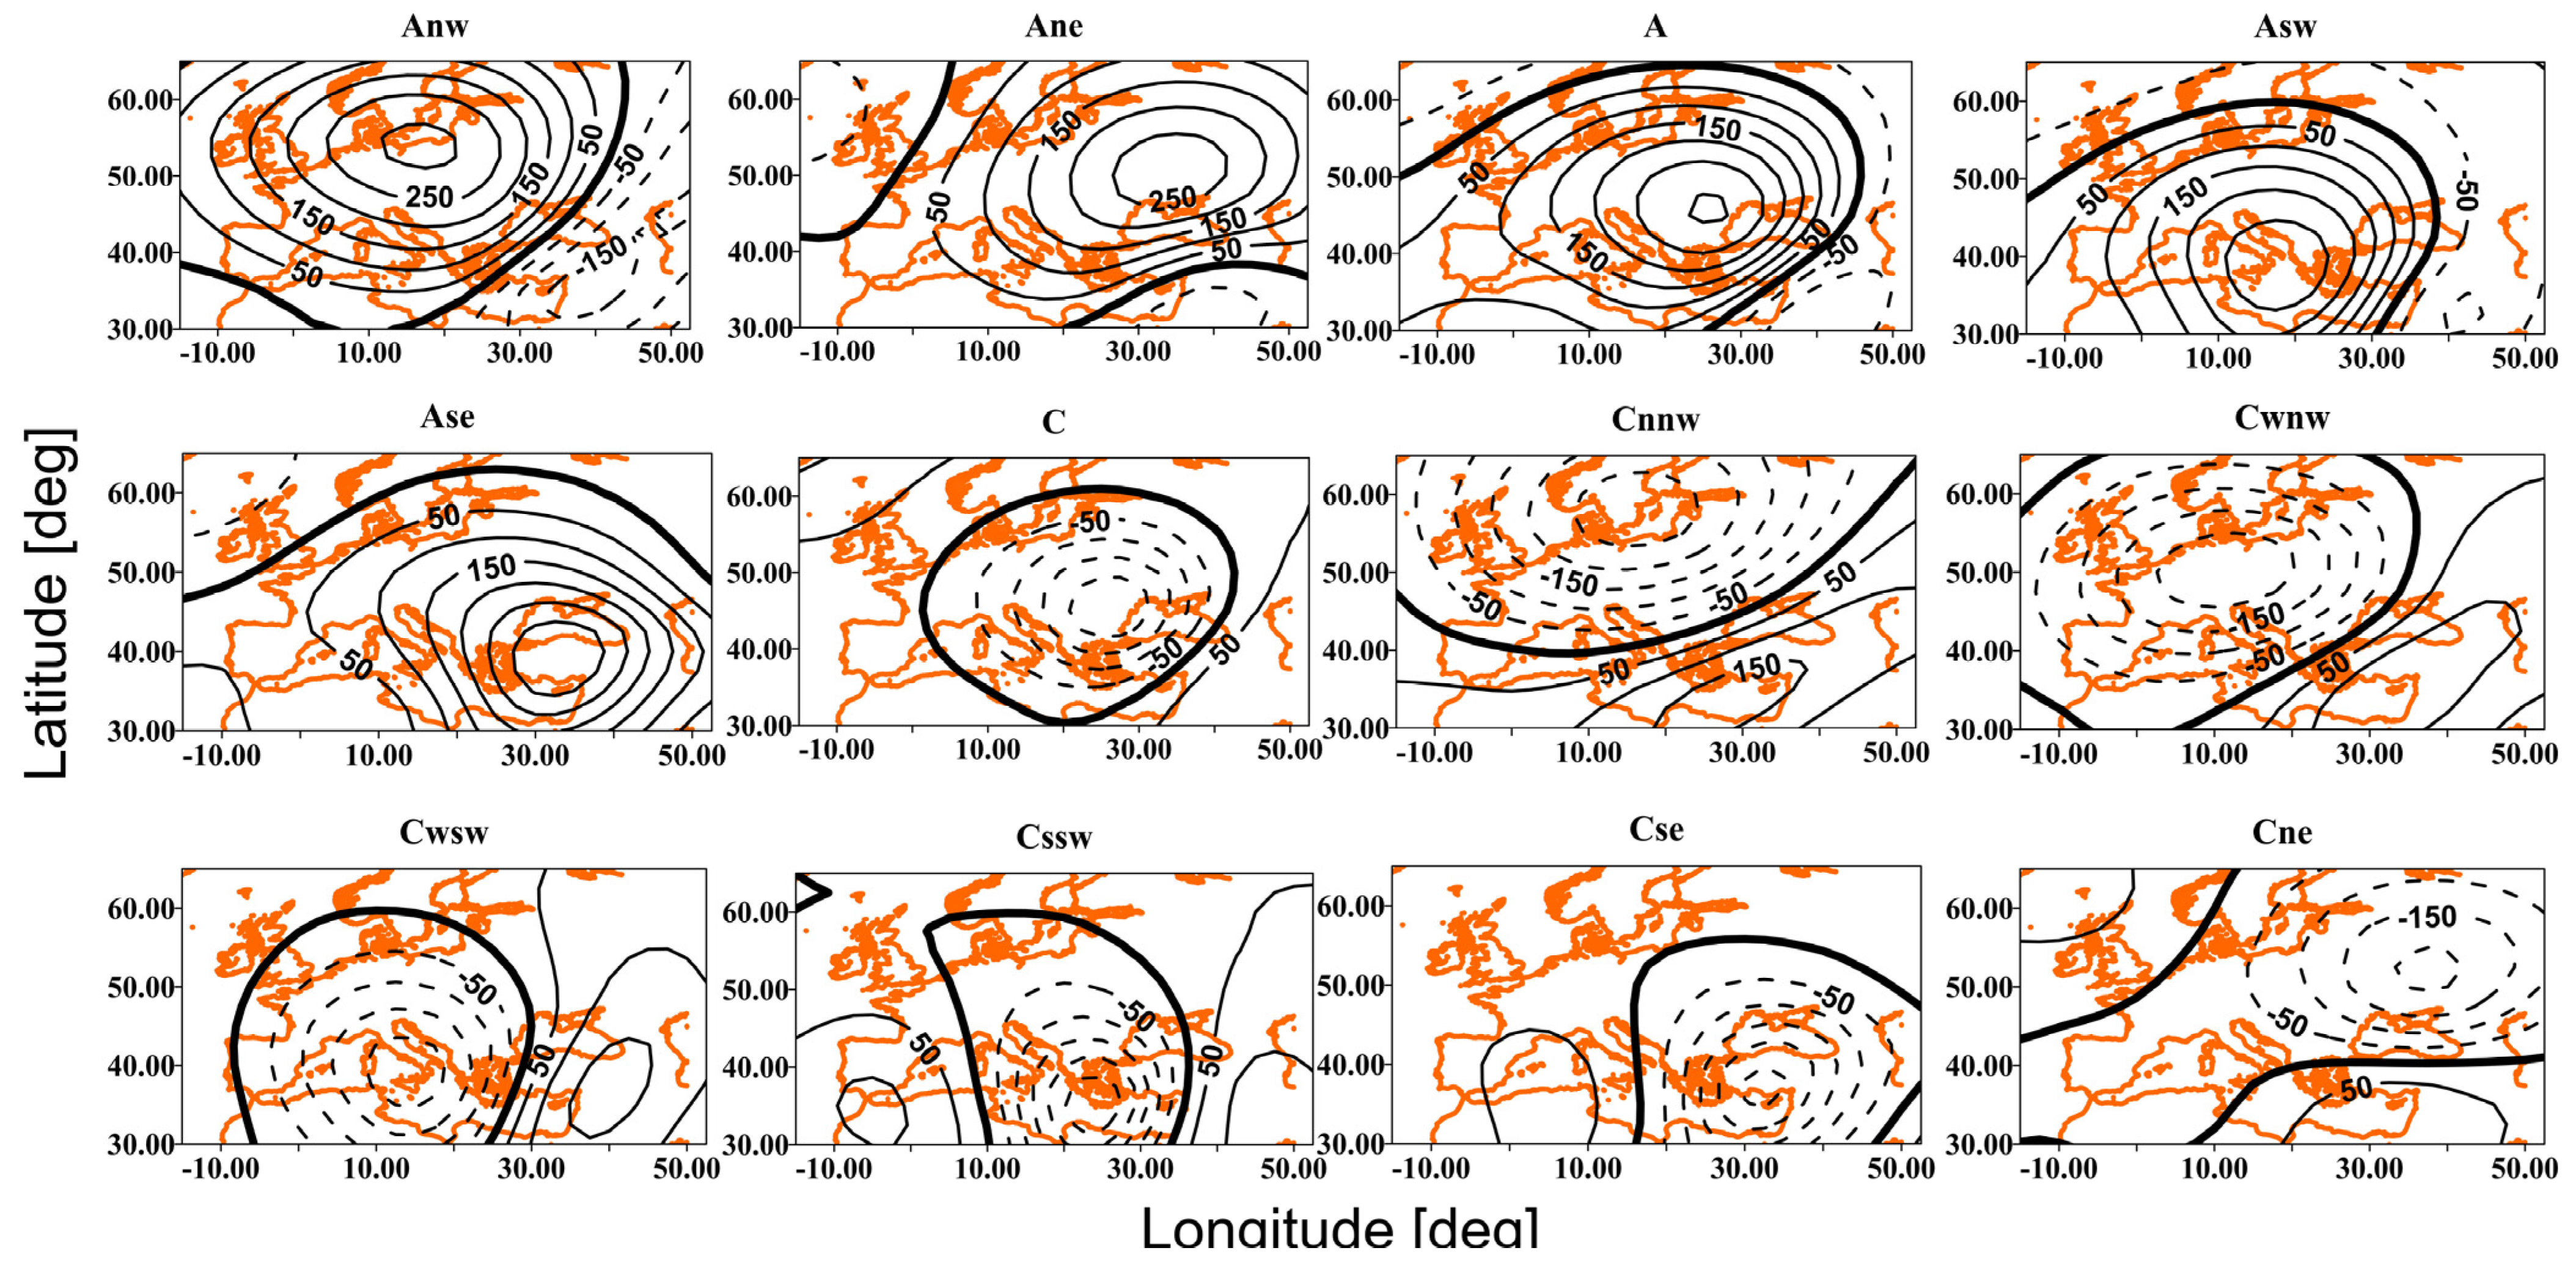
3.1. Frequencies of the Atmospheric Circulation Types

The relative frequencies of the 12 circulation types divided into anticyclonic and cyclonic groups at the four geopotential heights are depicted in Table 1. On the annual scale, the anticyclonic types have slightly higher frequencies than the cyclonic ones: the 500 hPa has the maximum of the anticyclonic frequencies (51.9%), while the 1000 hPa has the minimum frequencies (50.3%). In winter and spring, while these percentages are very similar for all geopotential levels, cyclonic types are more common; the 700 hPa area has the maximum frequencies in winter (63.8%) and in spring (58.7%). In summer, most of the anticyclonic types appear with the highest frequency (69.9%) at 850 hPa, while at 500 hPa the highest frequencies are found in autumn (56.9%).
Trends in circulation types appear to be significant at the threshold of 0.05 in the majority of the cases (Table 2): positive for anticyclonic and negative for cyclonic, except in autumn for anticyclonic types at 700 hPa, 850 hPa and 1000 hPa, for cyclonic types at 1000 hPa and for winter at 1000 hPa.
Finally, in general, regarding the individual frequencies of the types, there is a gradual decrease, from 500 hPa to 1000 hPa, of the frequencies of the cyclonic types, the center of which is located in the center (C) and in the south (Cwsw) of Romania, in favor of the types located in the north of the country (increase in the frequencies from 500 hPa to 1000 hPa) (Cne, Table 3).

3.2. Correlation Coefficients between the Frequencies of Anticyclonic and Cyclonic Circulation Types at the Four Selected Geopotential Levels

The temporal correlation coefficient (cc) for the period 1961–2020 was calculated for each season to assess the relationship between the average fields of circulation types (anticyclonic and cyclonic) across four geopotential height levels. The results of this correlation analysis are presented in Table 4 and Table 5. Correlations between the same circulation types (anticyclonic/anticyclonic or cyclonic/cyclonic) across all levels show positive values, while correlations between anticyclonic and cyclonic circulation types exhibit negative values.
In winter, the circulation patterns at 1000 hPa have correlation coefficients (cc) with other surface circulation patterns varying between 0.765 and 0.962 (Table 4). In spring, the correlation coefficients are lower (0.629 to 0.952). It should be noted that the highest cc values for both winter and spring occur between the closest surfaces (winter—0.962 between the cyclone types of 700 hPa and 500 hPa). The cc values for summer and autumn appear to be relatively lower than those for winter and spring. The quantification was made by comparing their maximum and minimum values. These values range from 0.915 to 0.470 for the summer and from 0.928 to 0.515 for autumn. Once again, the highest cc values appear between the closest surfaces (Table 5).
A comparison with the corresponding correlation coefficients in other regions shows that in Romania, in winter and spring, the cc is higher (in summer) and lower (in autumn) in comparison with the equivalent ones for Greece [42], while compared to Lebanon, they are higher during all seasons [43].

3.3. Frequencies and Trends in Annual and Seasonal Precipiation Depending on Their Relation with the Circulation Types

The annual and seasonal precipitation heights (in percentages) of cyclone types (Table 6) show a gradual decline from upper levels (500 hPa) to lower levels (1000 hPa), and, on the contrary, anticyclonic precipitation shows an increase in areas above the lower surfaces. Seasonally, as shown in Table 6, which summarizes the results for only the five rainiest cyclonic types, winter has the highest percentage of cyclone precipitation (92.8% at 700 hPa), followed by spring (83%, also at 700 hPa). On the contrary, the highest percentages of anticyclonic precipitation are found in summer; this percentage progressively increases from higher levels (43.0% at 500 hPa) to lower levels (55.8% at 1000 hPa). This latter percentage is higher than the cyclonic type one (44.2%) for the same season and the same area. Regarding the maximum rainfall heights per surface, there is a fairly large variation between the types of circulation (Table 7). The cyclonic type Cwsw shows the maximum percentage for the annual rainfall at 500 hPa (21.5%) and for the winter rainfall for all geopotential levels (500 hPa—30.5%, 700 hPa—26.8%, 850 hPa—21.8%), except those of the 1000 hPa where the maximum is shown in the circulation type Cse (23.3%). The cyclonic type C shows the maximum rainfall amount mainly in summer and autumn for the three highest surfaces. Finally, for 1000 hPa, the annual rainfall amount is found in the type Cne (17.3%), as well as the maximum amounts of spring (20.6%) and summer (16.8%).
Trends in annual and seasonal anticyclonic precipitation for all surfaces are positive and significant at the 5% signification level of the Mann–Kendall test, with some exceptions, especially at 1000 hPa (Table 6). On the contrary, the cyclonic annual precipitation heights show non-significant negative trends at the threshold of 5%. Winter and autumn show positive non-significant trends for all surfaces, spring shows negative trends significant only at the 500 hPa level and finally, summer shows negative trends significant for all surfaces except the level of 1000 hPa.
Finally, seasonal and annual trends in the number of rain days for all surfaces, generally, do not differ much. Thus, significant positive trends in anticyclonic rainy days are observed almost everywhere, while negative trends in cyclonic rainy days are found, with a few exceptions, particularly in autumn (not shown).
The evaluation of the results concerning the relationship between the cyclonic circulation types on the four different geopotential levels with precipitation was based on the use of Taylor diagrams. These mathematical diagrams are designed to show graphically which of the many approximate representations (or models) of a system, process or phenomenon is more realistic. Introduced by [44], they facilitate the comparative evaluation of different models quantifying the degree of correspondence between modeled and observed behavior in terms of the three statistical parameters: Pearson correlation coefficient, root-mean-square error (RMSE) and standard deviation. Although Taylor diagrams have mainly been used to assess climate models [45], they can also be used for other purposes unrelated to environmental problems.
Several criteria for evaluation purposes for the five-station mean precipitation time series of cyclonic circulation types were used for all geopotential levels (1000 hPa, 850 hPa, 700 hPa and 500 hPa). More specifically, standard deviations, root mean square errors and correlation coefficients between the seasonal rainfall amounts of each cyclonic type and the corresponding seasonal precipitation total were computed. The results are presented in seasonal diagrams (Figure 4).
For winter, it is obvious that Cse presents the best simulation for 850 hPa and Cwsw does so for 500 hPa, with high correlation coefficient values (0.78) and a low standard deviation and RMSE. The same circulation types also have high simulation skill in the other geopotential levels (1000 hPa, 700 hPa and 500 hPa for type Cse and 700 hPa and 1000 hPa for type Cwsw). It is worth mentioning that type C shows a relatively lower simulation, particularly for the surfaces of 850 hPa and 500 hPa. The results for spring are completely different. Type C showed the best simulation for 1000 hPa, 700 hPa 500 hPa and 850 hPa, followed by the Cwsw type (500 hPa). Type Cne shows a relatively good simulation for 1000 hPa, 700 hPa and 850 hPa, particularly due to the high correlation coefficient. On the contrary, the Cse for all surfaces shows a lower simulation compared to the other types. For summer, three different types present the best simulation skills: Cwsw for 500 hPa, Cne for 850 hPa and the Cssw for 1000 hPa and 850 hPa.
A relatively lower simulation skill is found for type C at 1000 hPa and 700 hPa and for type Cwsw at 700 hPa. In general, summer shows the smallest correlation coefficients of the rainfall associated with the cyclonic circulation types. Finally, type C presents the best simulation picture in autumn for 500 hPa, followed by Cse for 850 hPa. Relatively lower compared to the previous simulation is the skill of the type C for 700 hPa, as well as of the Cwsw type for 500 hPa and of Cse for 1000 hPa. The Cne simulation ability does not seem to have any advantages. Overall, the correlation coefficients of the circulation types with precipitation for all surfaces have the smallest differences in comparison to the rest of the seasons, ranging from 0.55 to 0.70.

4. Discussion and Conclusions

In this paper, a circulation type classification scheme was utilized in south Romania, following the study of Tolika et al. [33], and a comparative approach between different geopotential heights (1000 hPa, 850 hPa, 700 hPa and 500 hPa) in relation to precipitation was carried out. The following conclusions are based on the analysis of the results obtained above, while the discussion is mainly based on rational scientific assumptions because the subject of this study has been poorly studied by the international scientific community [42,43].
The annual frequency of the anticyclonic types is slightly higher than that of cyclonic ones. However, on a seasonal scale—specifically during summer and autumn—the occurrence of the anticyclonic types is significantly more frequent across all geopotential levels. Similar findings were observed in a comparable study conducted in Greece [42].
The significant positive anticyclonic trend and the significant negative trends of the cyclonic types at all studied geopotential levels confirm the hypothesis that in the south of the Balkan Peninsula and in the eastern Mediterranean, there is a progressive northward shift in the cyclonic trajectories [46], reflected in the negative non-significant trends in the number of rainy days in southern Romania and the significant negative trend in precipitation in Greece [47] and also in Beirut [43].
The highest correlation coefficients between cyclonic and anticyclonic circulation types occur between the closest geopotential surfaces, especially in winter and spring. These findings agree with the results for Greece [42] and for Lebanon [43] and they confirm that mid-latitude atmospheric circulation at all levels is better organized during the first two seasons of the year, i.e., winter and spring.
Moreover, the negative significant trend in cyclonic precipitation in summer appears to be responsible for the non-significant decrease in summer precipitation at the Bucharest, Buzău and Constanța stations [33], as the positive trend in anticyclonic precipitation cannot even partially compensate the decrease in cyclonic rainfall. Even though these findings are similar to the equivalent ones for Greece [42], they are significantly different than the ones found for Lebanon [43]. The gradual decrease in frequency from 1000 hPa to 500 hPa of specific cyclone types centered in southern Lebanon, in favor of cyclone types centered in the northern part of the country, aligns with the hypothesis proposed by [46] according to which the depressions originating from Cyprus exhibit significantly stronger baroclinic fields compared to other depressions in the Mediterranean region. The higher rainfall heights in Lebanon, in the lower (higher) surfaces of 1000 and 850 hPa (700 and 500 hPa), are associated with the prevalence of the Cse (Cne) type [43].
Finally, the use of Taylor diagrams to evaluate the results has shown that the relationships between the circulation types and the rainfall varies depending on the geopotential surface and the season. In general, the two rainiest circulation types Cwsw and C have a better simulation on the two upper surfaces (500 hPa and 700 hPa), the first during all four seasons and the second in winter, spring and autumn. Contrarily, the other two rainy cyclonic types (Cse and Cne) show better simulation on the two lower surfaces (850 hPa and 1000 hPa), the first in winter and autumn and the second in spring and autumn.
It should be underlined that the highest correlation coefficient between the circulation type rainfall and the corresponding total seasonal rainfall occurs in winter (the Cse type in 850 hPa and the Cwsw type in 500 hPa), while the lowest correlation coefficients for all circulation types were found in summer. Moreover, these two seasons show, in winter, the highest precipitation percentage of cyclonic types and, in summer, the lowest percentage of the same types. The latter finding agrees with the results from previous studies [47,48] indicating that winter rainfall is mainly associated with the atmospheric circulation, while summer rainfall is the result of both the atmospheric circulation as well as geographical factors. This study provides better insight into the understanding of the characteristics of the atmospheric mechanisms driving the formation and variability of precipitation in southern Romania. It also provides useful scientific information for the design or improvement of the regional development strategies so that they include appropriate or adaptation measures regarding the variability and changes in atmospheric circulation and precipitation. In these strategies in the study region, special attention should be given to the agricultural field to meet the water needs of crops in conditions of lower rainfall or drought through the development of irrigation systems that are currently insufficient. In future work, we aim to apply this methodology to simulated geopotential data from a General Circulation Model (GCM) to study regional climatological consequences of the future climate.

Author Contributions

Conceptualization, P.M. and K.T.; methodology, K.T., P.M. and C.A.; software, I.T.; validation, K.T., M.T., L.Z. and D.M.C.; writing—original draft preparation, K.T. and P.M.; writing—review and editing, K.T., M.T., L.Z., D.M.C. and P.M. All authors have read and agreed to the published version of the manuscript.

Funding

This research received no external funding.

Institutional Review Board Statement

Not applicable.

Informed Consent Statement

Not applicable.

Data Availability Statement

The datasets presented in this article are not readily available because the data are part of an ongoing study or due to technical/time limitations. Requests to access the datasets should be directed to Panagiotis Maheras.

Conflicts of Interest

The authors declare no conflict of interest.

References

  1. Brisson, E.; Demuzere, M.; Kwakernaak, B.; Van Lipzig, N.P.M. Relations between atmospheric circulation and precipitation in Belgium. Meteorol. Atmos. Phys. 2011, 111, 27–39. [Google Scholar] [CrossRef]
  2. Trigo, R.M.; DaCamara, C.C. Circulation weather types and their influence on the precipitation regime in Portugal. Int. J. Climatol. 2000, 20, 1559–1581. [Google Scholar] [CrossRef]
  3. Raziei, T.; Bordi, I.; Santos, J.A.; Mofidi, A. Atmospheric circulation types and winter daily precipitation in Iran. Int. J. Climatol. 2012, 33, 2232–2246. [Google Scholar] [CrossRef]
  4. Pendergrass, A.G.; Knutti, R.; Lehner, F.; Deser, C.; Benjamin MSanderson, B.M. Precipitation variability increases in a warmer climate. Sci. Rep. 2017, 7, 17966. [Google Scholar] [CrossRef] [PubMed]
  5. Jacobeit, J.; Homann, M.; Philipp, A.; Beck, C. Atmospheric circulation types and extreme areal precipitation in southern central Europe. Adv. Sci. Res. 2017, 14, 71–75. [Google Scholar] [CrossRef]
  6. López-Moreno, J.; Vicente-Serrano, S.; Morán-Tejeda, E.; Lorenzo-Lacruz, J.; Kenawy, A.; Beniston, M. Effects of the North Atlantic Oscillation (NAO) on combined temperature and precipitation winter modes in the Mediterranean mountains: Observed relationships and projections for the 21st century. Glob. Planet. Chang. 2011, 77, 62–76. [Google Scholar] [CrossRef]
  7. Baltacı, H.; Göktürk, O.M.; Kındap, T.; Ünal, A.; Karaca, M. Atmospheric circulation types in Marmara region (NW Turkey) and their influence on precipitation. Int. J. Climatol. 2015, 35, 1810–1820. [Google Scholar] [CrossRef]
  8. Putniković, S.; Tošić, I. Relationship between atmospheric circulation weather types and precipitation in Serbia. Meteorol. Atmos. Phys. 2018, 130, 393–403. [Google Scholar] [CrossRef]
  9. Iannuccilli, M.; Bartolini, G.; Betti, G.; Crisci, A.; Grifoni, D.; Gozzini, B.; Messeri, G. Extreme precipitation events and their relationships with circulation types in Italy. Int. J. Clim. 2021, 41, 4769–4793. [Google Scholar] [CrossRef]
  10. Silvestri, L.; Saraceni, M.; Bongioannini Cerlini, P. Links between precipitation, circulation weather types and orography in central Italy. Int. J. Climatol. 2022, 42, 5807–5825. [Google Scholar] [CrossRef]
  11. Busuioc, A.; Birsan, M.V.; Carbunaru, D.; Baciu, M.; Orzan, A. Changes in the large-scale thermodynamic instability and connection with rain shower frequency over Romania: Verification of the Clausius–Clapeyron scaling. Int. J. Climatol. 2016, 36, 2015–2034. [Google Scholar] [CrossRef]
  12. Marin, L.; Birsan, M.V.; Bojariu, R.; Dumitrescu, A.; Micu, D.M.; Manea, A. An Overview of Annual Climatic Changes in Romania: Trends in Air Temperature, Precipitation, Sunshine Hours, Cloud Cover, Relative Humidity and Wind Speed during the 1961–2013 Period. Carpathian J. Earth Environ. Sci. 2014, 9, 253–258. [Google Scholar]
  13. Dumitrescu, A.; Bojariu, R.; Birsan, M.V.; Marin, L.; Manea, A. Recent climatic changes in Romania from observational data (1961–2013). Theor. Appl. Clim. 2015, 122, 111–119. [Google Scholar] [CrossRef]
  14. Bîrsan, M.V.; Zaharia, L.; Chendeş, V.; Brănescu, E. Seasonal trends in Romanian streamflow. Hydrol. Process. 2014, 28, 4496–4505. [Google Scholar] [CrossRef]
  15. Bojariu, R.; Chițu, Z.; Dascălu, S.I.; Gothard, M.; Velea, L.F.; Burcea, R.; Dumitrescu, A.; Burcea, S.; Apostol, L.; Amihaesei, V.; et al. Schimbările Climatice—De la Bazele Fizice la Riscuri și Adaptare., Printech, 2021, 223 p. Available online: https://www.meteoromania.ro/clima/adaptarea-la-schimbarile-climatice/ (accessed on 22 April 2024).
  16. Zaharia, L.; Ioana-Toroimac, G.; Perju, E.R. Hydrological Impacts of Climate Changes in Romania. In Water Resources Management in Romania; Negm, A., Romanescu, G., Zeleňáková, M., Eds.; Springer Water: Cham, Switzerland, 2020; pp. 309–351. [Google Scholar] [CrossRef]
  17. Constantin, D.M.; Onțel, I.; Tișcovschi, A.A.; Irimescu, A.; Grigore, E.; Ilea, R.G.; Dîrloman, G. Observed Changes in the temperature and precipitation regime along the Lower Danube River. In The Lower Danube River. Earth and Environmental Sciences Library; Negm, A., Zaharia, L., Ioana-Toroimac, G., Eds.; Springer: Cham, Switzerland, 2022; pp. 273–297. [Google Scholar] [CrossRef]
  18. Constantin (Oprea), D.M.; Ionac, N.; Grigore, E.; Lüftner, G.D.; Ilea, R.G. The variability and influence of precipitation on the winter wheat in the Extra-Carpathian area of the Meridional and Curvature Carpathians (Romania). Sci. Pap. Ser. Manag. Econ. Eng. Agric. Rural. Dev. 2023, 23, 181–186. [Google Scholar]
  19. Busuioc, A.; Dobrinescu, A.; Bîrsan, M.V.; Dumitrescu, A.; Orzan, A. Spatial and temporal variability of climate extremes in Romania and associated large-scale mechanisms. Int. J. Clim. 2015, 35, 1278–1300. [Google Scholar] [CrossRef]
  20. Croitoru, A.E.; Piticar, A.; Burada, C.D. Changes in precipitation extremes in Romania. Quat. Int. 2016, 415, 325–335. [Google Scholar] [CrossRef]
  21. Croitoru, A.-E.; Chiotoroiu, B.-C.; Ivanova Todorova, V.; Torica, V. Changes in precipitation extremes on the Black Sea Western Coast. Glob. Planet. Chang. 2013, 102, 10–19. [Google Scholar] [CrossRef]
  22. Piticar, A.; Ristoiu, D. Spatial distribution and temporal variability of precipitation in northeastern Romania. Riscuri Și Catastr. 2013, 13, 35–46. [Google Scholar]
  23. Spinoni, J.; Szalai, S.; Szentimrey, T.; Lakatos, M.; Bihari, Z.; Nagy, A.; Németh, Á.; Kovács, T.; Mihic, D.; Dacic, M.; et al. Climate of the Carpathian Region in the period 1961–2010: Climatologies and trends of 10 variables. Int. J. Climatol. 2015, 35, 1322–1341. [Google Scholar] [CrossRef]
  24. Micu, D.M.; Dumitrescu Al Cheval, S.; Birsan, M.V. Climate of the Romanian Carpathians. Springer, Variability and Trends; Springer Atmospheric Sciences: Dordrecht, The Netherlands, 2015. [Google Scholar] [CrossRef]
  25. Micu, D.M.; Amihaesei, V.A.; Milian, N.; Cheval, S. Recent changes in temperature and precipitation indices in the Southern Carpathians, Romania (1961–2018). Theor. Appl. Clim. 2021, 144, 691–710. [Google Scholar] [CrossRef]
  26. Constantin (Oprea), D.M.; Lüftner, G.D.; Ilea, R.G.; Șandor, I.A.; Ioana-Toroimac, G. The observed changes in the precipitation regime in Romania—Constraints for river restoration. In Proceedings of the EGU General Assembly 2023, Vienna, Austria, 24–28 April 2023. [Google Scholar] [CrossRef]
  27. Busuioc, A.; von Storch, H. Changes in the winter precipitation in Romania and its relation to the large-scale circulation. Tellus 1996, 48A, 538–555. [Google Scholar] [CrossRef]
  28. Tomozeiu, R.; Stefan, S.; Busuioc, A. Winter precipitation variability and large-scale circulation patterns in Romania. Theor. Appl. Climatol. 2005, 81, 193–201. [Google Scholar] [CrossRef]
  29. Caian, M.; Georgescu, F.; Pietrisi, M.; Catrina, O. Recent Changes in Storm Track over the Southeast Europe: A Mechanism for Changes in Extreme Cyclone Variability. Atmosphere 2021, 12, 1362. [Google Scholar] [CrossRef]
  30. Apostol, L. The Mediterranean cyclones–the role in ensuring water resources and their potential of climatic risk, in the east of Romania. Present. Environ. Sustain. Dev. 2008, 2, 143–163. [Google Scholar]
  31. Rimbu, N.; Stefan, S.; Busuioc, A.; Georgescu, F. Links between Blocking Circulation and Precipitation Extremes over Romania in Summer. Int. J. Climatol. 2015, 36, 369–376. [Google Scholar] [CrossRef]
  32. Dobri, R.V.; Sfica, L.; Ichimi, P.; Harpa, G.V. The distribution of the monthly 24-hour maximum amount of precipitation in Romania according to their synoptic cause. Geogr. Tech. 2017, 12, 62–72. [Google Scholar] [CrossRef]
  33. Tolika, K.; Traboulsi, M.; Anagnostopoulou, C.; Zaharia, L.; Tegoulias, I.; Constantin, D.M.; Maheras, P. On the Examination of the Relationship between Mean and Extreme Precipitation and Circulation Types over Southern Romania. Atmosphere 2023, 14, 1345. [Google Scholar] [CrossRef]
  34. Cheval, S.; Bulai, A.; Croitoru, A.E.; Dorondel, S.; Micu, D.; Mihaila, D.; Sfica, L.; Tiscovschi, A. Climate change perception in Romania. Theor. Appl. Clim. 2022, 149, 253–272. [Google Scholar] [CrossRef]
  35. Ion-Bordei, E. Rolul Lanțului Alpino-Carpatic în Evoluția Ciclonilor Mediteraneeni; Printech, Ed.; Editura Academiei Republicii Socialiste România: Bucharest, Romania, 2009; 138p. [Google Scholar]
  36. NMA (National Meteorological Administration). Clima României; Editura Academiei Române: București, Romania, 2008; 365p. [Google Scholar]
  37. Chelu, A.; Zaharia, L.; Dubreuil, V. Estimation of climatic and anthropogenic contributions to streamflow change in southern Romania. Hydrol. Sci. J. 2022, 67, 1598–1608. [Google Scholar] [CrossRef]
  38. Harpa, G.-V.; Croitoru, A.-E.; Djurdjevic, V.; Horvath, C. Future changes in five extreme precipitation indices in the lowlands of Romania. Int. J. Climatol. 2019, 39, 5720–5740. [Google Scholar] [CrossRef]
  39. Prăvălie, R.; Piticar, A.; Roșca, B.; Sfîcă, L.; Bandoc, G.; Tiscovschi, A.; Patriche, C. Spatio-temporal changes of the climatic water balance in Romania as a response to precipitation and reference evapotranspiration trends during 1961–2013. Catena 2019, 172, 295–312. [Google Scholar] [CrossRef]
  40. Anagnostopoulou, C.; Tolika, K.; Maheras, P. Classification of circulation types: A new flexible automated approach applicable to NCEP and GCM datasets. Theor. Appl. Climatol. 2009, 96, 3–15. [Google Scholar] [CrossRef]
  41. Kalnay, E.; Kanamitsu, M.; Kistler, R.; Collins, W.; Deaven, D.; Gandin, L.; Iredell, M.; Saha, S.; White, G.; Woollen, J.; et al. The NCEP/NCAR 40-year reanalysis project. Bull. Am. Meteorol. Soc. 1996, 77, 437–471. [Google Scholar] [CrossRef]
  42. Anagnostopoulou, C.; Tolika, K.; Tegoulias, I.; Maheras, P. Links between the circulation types in different levels, a case study for Thessaloniki Greece. In Proceedings of the 14th COMECAP, Alexandroupoli, Greece, 15–17 October 2018. [Google Scholar]
  43. Traboulsi, M.; Tolika, K.; Anagnostopoulou Ch Tegoulias, I.; Maheras, P. Essai d’étude des types de circulation atmosphérique à différentes altitudes: l’exemple de Beyrouth. In Proceedings of the Actes du XXXVème colloque de l’Association Internationale de Climatologie, Toulouse, France, 6–9 July 2022; pp. 40–45. [Google Scholar]
  44. Taylor, K.E. Summarizing multiple aspects of model performance in a single diagram. J. Geophys. Res. 2001, 106, 7183–7192. [Google Scholar] [CrossRef]
  45. Terry, P.W.; Greenwald, M.; Leboeuf, J.-N.; McKee, G.R.; Mikkelsen, D.R.; Nevins, W.M.; Newman, D.E.; Stotler, D.P.; Task Group on Verification and Validation; U.S. Burning Plasma Organization; et al. Validation in fusion research: Towards guidelines and best practices. Phys. Plasmas 2008, 15, 062503. [Google Scholar] [CrossRef]
  46. Maheras, P.; Flocas, H.A.; Patrikas, I. On the vertical structure of composite surface cyclones in the Mediterranean. Theor. Appl. Climatol. 2002, 71, 199–217. [Google Scholar] [CrossRef]
  47. Maheras, P.; Tolika, K.; Anagnostopoulou, C.H.; Vafiadis, M.; Patrikas, I.; Flocas, H.A. On the relationships between circulation types and changes in rainfall variability in Greece. Int. J. Climatol. 2004, 24, 1695–1712. [Google Scholar] [CrossRef]
  48. Maheras, P.; Anagnostopoulou, C. Circulation types and their influence on the interannual variability and precipitation changes in Greece. In Mediterranean Climate; Springer: Berlin-Heidelberg, Germany, 2003; pp. 215–239. [Google Scholar]
Figure 1. The physical map of Romania and the location of the five analyzed weather stations (marked in red). In Bucharest (București in Romanian), the analyzed station is named București–Băneasa).
Atmosphere 15 01027 g001
Figure 2. The location of the anticyclonic (a) and cyclonic (b) circulation type centers (A: anticyclonic; C: cyclonic. n: north; s: south; e: east; w: west, e.g., Anw, anticyclonic North West).
Atmosphere 15 01027 g002
Figure 3. Mean 500 hPa anomaly maps (hPa) of the five anticyclone circulation types (Anw, Ane, A, Asw and Ase) and the seven cyclone circulation types (C, Cnnw, Cwnw, Cwsw, Cssw, Cse and Cne) for winter. Solid lines: positive anomalies; dashed lines: negative anomalies.
Atmosphere 15 01027 g003
Figure 4. Seasonal Taylor diagrams for the four geopotential levels and for the seven considered cyclonic circulation types.
Atmosphere 15 01027 g004
Table 1. Main geographical characteristics of the meteorological stations under study. * In degrees: minutes: seconds. Data on the latitude, longitude and elevation were extracted from the European Climate Assessment & Dataset (ECA&D) database. ** Based on the data extracted from the ECA&D database, over the period 1961–2020. *** Based on the data provided by the National Meteorological Administration, over the period 1961–2020.
Station NameLatitude * (North)Longitude * (East)Elevation (m above Sea Level, a.s.l. hereafter.)Average Annual
Precipitation ** (mm)
Average Annual
Temperature *** (°C)
Constanța44:13:1228:37:4813432.112.1
București–Băneasa44:31:0026:04:5990622.210.5
Buzău45:07:5926:51:0097527.411.2
Craiova44:13:4823:52:12192607.611.1
Râmnicu Vâlcea45:06:0024:22:12239710.710.8
Table 2. Seasonal and annual trends and frequencies of circulation types, anticyclonic (antic) and cyclonic (cyclo) (as a percentage), in southern Romania (1961–2020) for the levels of 500 hPa, 700 hPa, 850 hPa and 1000 hPa. Significant positive (+) and negative (−) trends (at the threshold of 5% according to the Mann–Kendall test) are marked with an asterisk (*).
Geopot. Level500 hPa700 hPa850 hPa1000 hPa
Time periodAnticCycloAnticCycloAnticCycloAnticCyclo
Winter+ **+ **+ **+
38.761.336.263.837.262.838.161.9
Spring+ **+ **+ **+ **
42.357.741.358.742.257.842.457.6
Summer+ **+ **+ **+ **
69.730.369.630.469.930.167.732.3
Autumn+ **+*+*+
56.943.155.144.955.144.952.747.3
Annual+ **+ **+ **+ **
51.948.150.649.451.248.850.349.7
Table 3. Annual and seasonal trends and frequencies (%) of the five rainiest cyclonic circulation types in southern Romania (1961–2020) for the four geopotential levels. Significant positive (+) and negative (−) trends (at the threshold of 5% according to the Mann–Kendall test) are marked with an asterisk (*).
Geopotential LevelTime PeriodCCwswCsswCseCne
500 hPaWinter− *− *− *
5.611.35.516.814.9
Spring− *− *− *− *
6.710.34.413.714.4
Summer− *− *− *− *− *
8.36.01.65.14.9
Autumn+− *− *− *− *
9.010.33.06.48.2
Annual− *− *− *− *
7.49.53.610.510.6
700 hPaWinter− *− *− *− *
4.511.55.817.415.8
Spring− *− *− *
7.29.74.511.416.8
Summer− *− *− *− *− *
7.76.62.43.17.2
Autumn− *− *− *
6.99.64.76.210.4
Annual− *− *− *− *
6.69.34.39.512.5
850 hPaWinter− *− *
4.811.55.414.516.3
Spring− *− *
7.39.34.310.317.4
Summer− *− *− *− *− *
5.76.42.92.78.9
Autumn− *
5.89.14.96.411.3
Annual− *− *
5.99.14.48.413.5
1000 hPaAnnual− *− *+− *+ *
6.78.03.88.515.4
Winter− *− *
7.010.04.412.916.8
Spring− *− *− *− *+
7.48.04.49.719.3
Summer− *− *− *− *
5.55.52.63.212.0
Autumn− *− *− *+
6.78.43.78.213.5
Table 4. Correlation coefficients between the frequencies of anticyclonic (antic) and cyclonic (cyclo) circulation types at the four selected geopotential heights for winter (red) and spring (blue).
Time
Period
Geopotential
Level
Spring
500 hPa700 hPa850 hPa1000 hPa
AnticCycloAnticCycloAnticCycloAnticCyclo
Winter500 hPaAntic1−10.952−0.9520.839−0.8390.629−0.629
Cyclo−0.9991−0.9520.952−0.8390.839−0.6290.629
700 hPaAntic0.961−0.9581−10.926−0.9260.750−0.750
Cyclo−0.9620.962−1.0001−0.9260.926−0.7500.750
850 hPaAntic0.905−0.9010.961−0.9601−10.897−0.897
Cyclo−0.9060.903−0.9620.961−1.0001−0.8970.897
1000 hPaAntic0.770−0.7650.859−0.8570.941−0.9401−1
Cyclo−0.7710.768−0.8590.857−0.9400.940−0.9991
Table 5. Correlation coefficients between the frequencies of anticyclonic (antic) and cyclonic (cyclo) circulation types at the four selected geopotential heights for summer (red) and autumn (blue).
Time
Period
Geopotential
Level
Autumn
500 hPa700 hPa850 hPa1000 hPa
AnticCycloAnticCycloAnticCycloAnticCyclo
Summer500 hPaAntic1−10.928−0.9280.740−0.7400.515−0.515
Cyclo−11−0.9280.928−0.7400.740−0.5150.515
700 hPaAntic0.899−0.8991−10.879−0.8790.703−0.703
Cyclo−0.8990.899−11−0.8790.879−0.7030.703
850 hPaAntic0.695−0.6950.880−0.8801−10.893−0.893
Cyclo−0.6950.695−0.8800.880−11−0.8930.893
1000 hPaAntic0.470−0.4700.706−0.7060.915−0.9151−1
Cyclo−0.4700.470−0.7060.706−0.9150.915−11
Table 6. Mean percentage (%) of annual and seasonal precipitation amount for all five of the studied weather stations attributed to anticyclonic (antic) and cyclonic types (cyclo) of circulation in southern Romania (1961–2020) for the geopotential levels of 500 hPa, 700 hPa, 850 hPa and 1000 hPa. Significant positive (+) and negative (−) trends (at the threshold of 5% according to the Mann–Kendall test) are marked with an asterisk (*).
Geopotential Level500 hPa700 hPa850 hPa1000 hPa
Time periodAnticCycloAnticCycloAnticCycloAnticCyclo
Winter7.1+92.9+7.2+92.8+9.3+90.7+12.9+87.1+
Spring16.2+ *83.3− *17.0+ *83.0−22.5+ *77.5−30.7+ *69.3−
Summer43.0+ *57.0− *43.8+ *56.2− *48.4+ *51.6− *55.8+44.2−
Autumn19.3+80.7+20.7+79.3+27.4+72.6+33.9+66.1 +
Annual24.1+ *75.9−24.8+ *75.2−29.6+*70.4−36.3+63.7
Table 7. Mean percentage (%) of annual and seasonal precipitation amount for all five of the studied stations attributed to the five rainiest cyclonic types in southern Romania (1961–2020) for the four examined geopotential levels. Significant positive (+) and negative (−) trends (at the threshold of 5% according to the Mann–Kendall test) are marked with an asterisk (*).
Geopotential LevelTime PeriodCCwswCsswCseCneCyclonic
500 hPaWinter++− *++
12.430.513.615.312.792.9
Spring+++
15.920.510.015.711.583.3
Summer− *− *− *− *
20.814.26.88.05.157.0
Autumn++− *+
26.226.411.15.96.180.7
Annual++− *
19.121.59.010.68.175.9
700 hPaWinter+++
13.726.816.219.211.092.8
Spring++− *+
20.814.911.214.214.783.0
Sumer− *− *
20.213.78.57.25.956.2
Autumn++++
23.219.416.16.69.479.3
Annual+++
19.417.711.610.69.975.2
850 hPaWinter− *+ *++
16.721.814.521.211.590.7
Spring++− *
19.910.710.513.317.277.5
Summer+− *− *
16.510.39.46.710.751.6
Autumn+++ *+
14.912.017.013.513.172.6
Annual+ *+− *+
16.513.011.711.613.170.4
1000 hPaWinter+ss++
19.114.412.623.313.687.1
Spring+− *+
14.57.48.513.920.669.3
Summer− *− *− *+ *
10.64.76.95.916.844.2
Autumn+ss+ *+
9.76.411.820.417.266.1
Annual− *+++ *ss
12.97.68.814.017.363.7
Disclaimer/Publisher’s Note: The statements, opinions and data contained in all publications are solely those of the individual author(s) and contributor(s) and not of MDPI and/or the editor(s). MDPI and/or the editor(s) disclaim responsibility for any injury to people or property resulting from any ideas, methods, instructions or products referred to in the content.

