Article

Spatial and Temporal Variability of Rainfall Erosivity in the Niyang River Basin

1
College of Water Conservancy and Civil Engineering, Xizang Agriculture and Animal Husbandry University, Linzhi 860000, China
2
Research Center of Civil, Hydraulic and Power Engineering of Xizang, Xizang Agriculture and Animal Husbandry University, Linzhi 860000, China
3
College of Water Resources, North China University of Water Resources and Electric Power, Zhengzhou 450046, China
*
Author to whom correspondence should be addressed.
Atmosphere 2024, 15(9), 1032; https://doi.org/10.3390/atmos15091032
Submission received: 16 July 2024 / Revised: 14 August 2024 / Accepted: 20 August 2024 / Published: 26 August 2024
(This article belongs to the Section Biosphere/Hydrosphere/Land–Atmosphere Interactions)

Abstract

:
Rainfall erosivity is a crucial factor in the evaluation of soil erosion, significantly influencing the complex relationships among water, soil, and the environment. Understanding its attributes and variations in space and time is essential for effective water resource management, erosion mitigation, and land-use planning. This paper utilizes daily precipitation data from 123 grid points in the Niyang River Basin, spanning from 2008 to 2016, to calculate rainfall erosivity using a straightforward algorithmic model. Ordinary Kriging was used to examine the spatial and temporal variations in rainfall erosivity, while Spearman’s correlation analysis was employed to examine the relationships between annual rainfall erosivity and various factors, including multi-year average precipitation, erosive rainfall, dry-season rainfall, wet-season rainfall, temperature, and elevation. The results indicate a year-by-year increase in rainfall erosivity in the basin, with a trend towards stabilization. The average annual rainfall erosivity over the years is 711 MJ · m m · h m 2 · h 1 , peaking at 1098 MJ · m m · h m 2 · h 1 in 2014. A significant 93.9% of rainfall erosivity is concentrated in the wet season, with a maximum of 191 MJ · m m · h m 2 · h 1 in July. The left bank of the mainstream, especially the central and lower sections of the main river and its tributaries, experiences the highest rainfall erosivity. Rainfall factors predominantly influence erosivity, with erosive rainfall showing the strongest correlation (rho = 0.93), while temperature and elevation have relatively minor effects. This study enhances the understanding of rainfall erosive forces in the plateau region and provides a scientific basis for predicting soil loss, developing effective erosion control measures, and ensuring sustainable land use.

1. Introduction

Soil erosion is a major global environmental issue [1] that poses serious threats to drinking water, agricultural production [2], ecosystem services (that is, land degradation) [3], and carbon storage [4]. Accelerated soil erosion is recognized as a significant threat worldwide. It is a natural process in which soil particles are detached and transported by agents such as water or wind [5], primarily influenced by wind erosion, water erosion, gravity erosion, and freeze–thaw erosion [6]. Among these, water erosion is the most prevalent [7]. Of all the types of erosion, soil loss due to water erosion is the most substantial [8]. For instance, in the UK, water erosion occurs more frequently and extensively than wind erosion [9], and in China’s Pearl River Basin, 98.25% of the eroded area is caused by water erosion [10]. Precipitation is the main driving force behind water erosion. It affects the distribution of vegetation on land and significantly impacts soil evolution, leading to water erosion. The severity of water erosion is primarily influenced by the amount and intensity of rainfall, as well as the action of wind.
In 1937, Cook identified precipitation as a potential erosive force and an independent variable influencing the soil erosion process [11]. In 1978, Wischmeier and Smith [12] quantified the rainfall erosivity factor (R) [10]. Rainfall erosivity refers to the kinetic energy produced by rainfall when raindrops strike the ground surface [13]. It serves as a crucial indicator of water erosion and a significant variable in characterizing soil erosion [14]. Globally, soil erosion models widely employ the Universal Soil Loss Equation (USLE) and its revision (RUSLE) [12], as well as new models derived from these equations [8]. Within these models, the rainfall erosivity stands as a fundamental climatic factor.
Researchers worldwide have extensively studied rainfall erosivity, addressing it from a global perspective [15,16,17,18], within individual countries [19,20,21,22], and across various river basins [14,23,24]. In China, this research is particularly comprehensive, covering multiple administrative regions [25,26] and major river basins such as the Yangtze [27,28], Yellow [29], and Pearl Rivers [10], as well as diverse terrains like the Qinghai–Tibet Plateau [30,31], Hengduan Mountains [13], Loess Plateau [32,33], and hilly areas [34]. The Qinghai–Tibet Plateau, known as the “Third Pole”, is unique due to its high altitude, vast area, rich biodiversity, and distinctive climatic conditions. These characteristics influence erosion processes through complex interactions among monsoon-driven rainfall patterns, varying rainfall intensities, raindrop impact, runoff scouring, and soil freeze–thaw cycles. Global climate change has accelerated snowmelt rates and increased the frequency of extreme precipitation events on the Qinghai–Tibet Plateau, thereby heightening the risk of soil erosion [30]. Researchers have conducted a lot of work on rainfall erosivity on the Qinghai–Tibet Plateau. They used precipitation data from different data sources to evaluate the prediction accuracy [35], developed a rainfall erosivity model for the Qinghai–Tibet Plateau based on particle swarm optimization [36] and the China Meteorological Forcing Dataset (CMFD) [30], evaluated the current rainfall erosivity, and predicted future erosion.
Due to the complex and variable topography of high-altitude areas, climatic conditions are extremely special. Factors such as precipitation patterns and temperature fluctuations at high altitudes have a profound impact on the ecological environment and soil and water conservation. By zoning the Tibetan Plateau, the results of zonal rainfall erosivity calculations were obtained to be better than the results of region-wide calculations [36]. Therefore, an in-depth study of rainfall erosivity according to the watershed scale can not only help us best understand and predict the environmental changes in these areas, but also provides a scientific basis for local agricultural production, disaster prevention and mitigation, and ecological protection. However, different watersheds on the Tibetan Plateau have unique geographic characteristics and complex erosion processes, Assessing and predicting rainfall erosivity proves especially challenging. Currently, the study of rainfall erosivity in a watershed within the Tibetan Plateau is not very deep and sufficiently comprehensive, and there are still many uncertainties, especially in the quantification of rainfall erosivity, influencing factors, and regional differences. Therefore, there is a need for further research on rainfall erosivity in small watersheds.
The Niyang River Basin, a primary left-bank tributary of the Yarlung Zangbo River, exhibits significant climatic diversity. This study aims to examine the temporal and spatial variations in rainfall erosivity within the basin and its relationship with pertinent factors. The objective is to provide insights for soil erosion control and risk assessment in the Tibetan Plateau, offering guidance for regional-scale soil management and establishing a foundation for addressing climate change challenges. The research objectives include (1) computing rainfall erosivity in the Niyang River Basin using CMADS grid data; (2) analyzing variations in rainfall erosivity across different time scales; (3) exploring spatial trends in rainfall erosivity within the basin; and (4) examining correlations between basin rainfall erosivity and various precipitation types, temperature, and elevation.

2. Materials and Methods
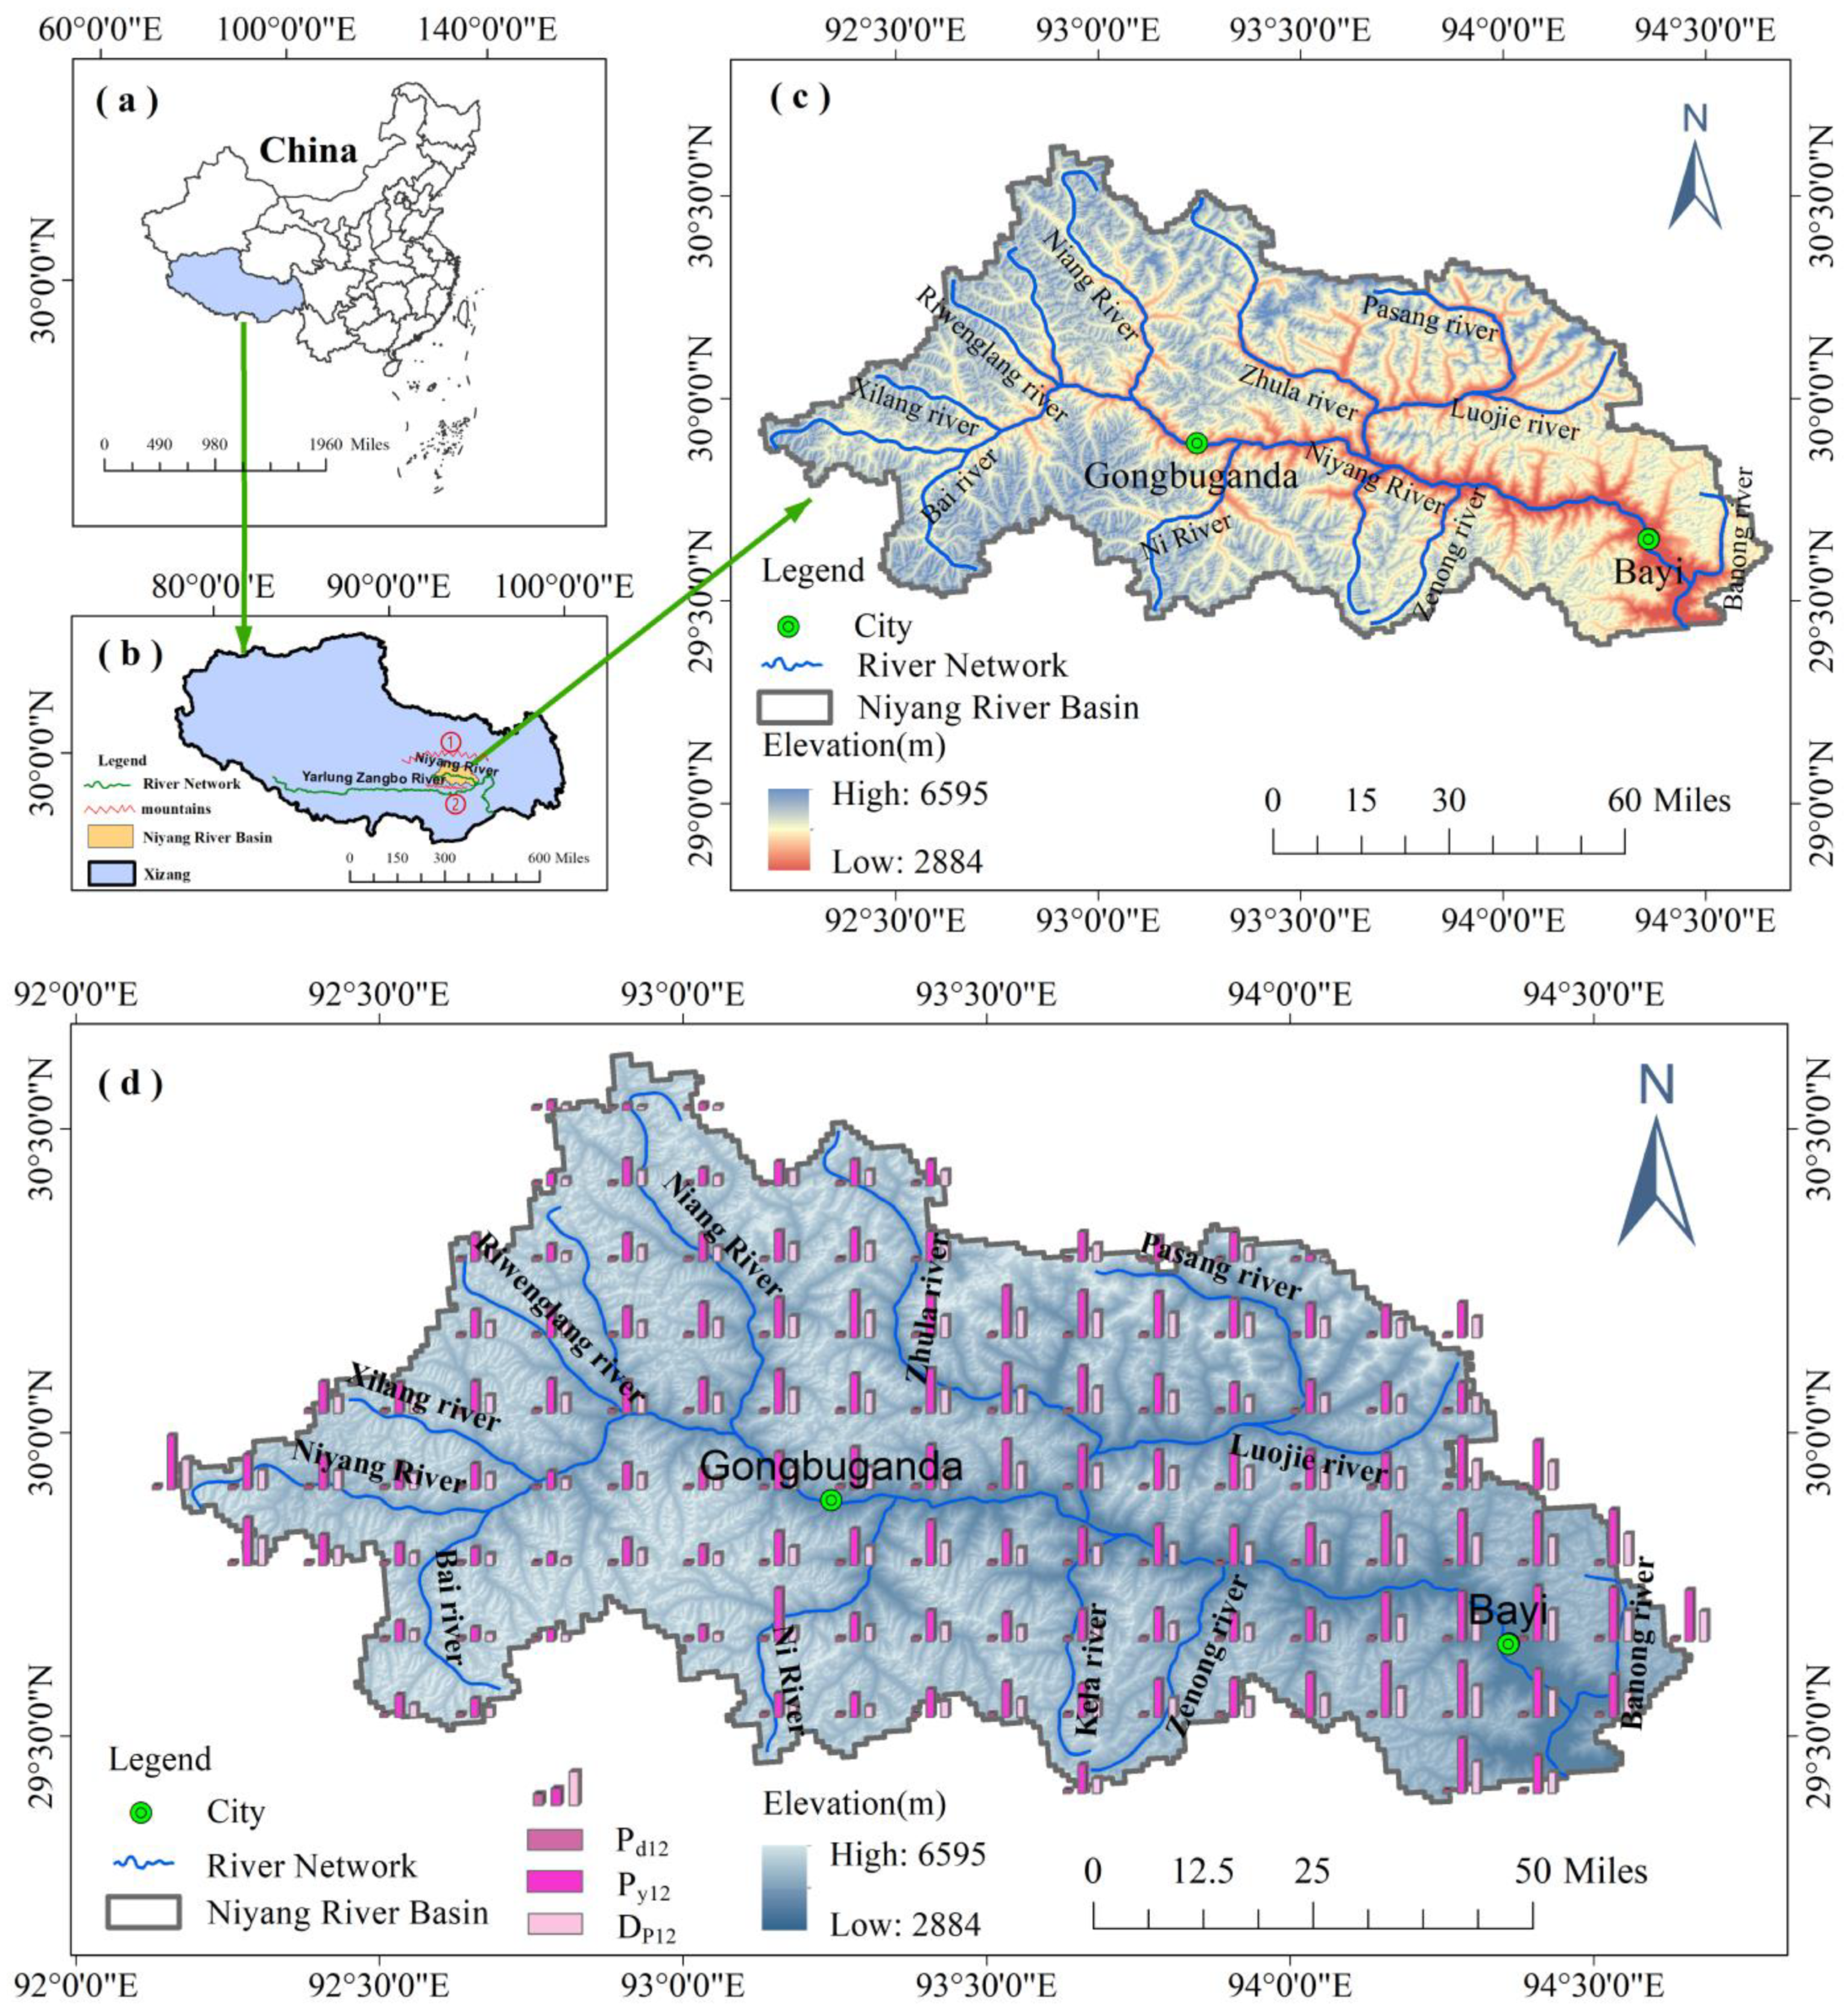
2.1. Study Area

This paper delves into the Niyang River Basin, a primary tributary of the Yarlung Zangbo River in Xizang, China (refer to Figure 1). Situated in the southeastern region of the Qinghai–Tibet Plateau, north of the Yarlung Zangbo River, it spans latitudes approximately between 29°23′ N and 30°38′ N and longitudes 92°10′ E to 94°40′ E, covering a length of 286 km and an area of 17,535 km2, with elevations ranging from 2884 m to 6595 m. The Niyang River Basin is flanked by the Nyenchen Tanglha Mountains to the north and the eastern extension of the Gangdise Mountains, the Guokarla Range, to the south. Its terrain is characterized by rugged mountains and expansive valleys, predominantly covered in forests and meadows. The upper reaches, from its source to Gongbujiangda County, constitute the upstream section, followed by the middle reaches extending from Gongbujiangda to Bayi District, and finally, the downstream section from Bayi District to its confluence with the Yarlung Zangbo River. Annually, from June to September, the Niyang River Basin experiences its wet season as warm and humid air currents from the Yarlung Zangbo River influence the region, coinciding with the northward shift of the Indian monsoon. From October to May of the subsequent year, the Niyang River Basin transitions into its dry season characterized by clear and dry weather as the influence of the westerlies strengthens.

2.2. Data Source

Precipitation data are mainly acquired through meteorological satellite remote sensing, ground-based meteorological radar, and rainfall station observations [37]. Among them, rainfall stations can provide the most long-term and accurate point precipitation data, meteorological radar can record the spatial and temporal patterns of precipitation over a restricted period, and remote-sensing data from meteorological satellites, unlike the spatial limitations of the other two, can accurately respond to the characteristics of the distribution of precipitation in space and time [18]. Due to the complex topography of Xizang, the mountain ranges are not dense enough, and a watershed often contains only a few or fewer meteorological stations, so the calculated rainfall erosive power value is inaccurate. Combining the advantages of the three forms of precipitation data acquisition mentioned above, precipitation and temperature data are sourced from the China Meteorological Assimilation Driving Datasets (CMADS) V1.2 (the data were obtained from https://www.cmads.org/ accessed on 17 October 2023), spanning from 2008 to 2016 with a spatial resolution of 1/8 * 1/8 * grid points. A total of 123 grid points covering the Niyang River Basin and adjacent stations were identified, with outliers being excluded. This dataset, derived from daily precipitation data from national meteorological stations and CMORPH satellite data [38,39,40,41,42,43,44], is particularly well suited for use in vast regions with limited rainfall stations, such as the plateau area. The digital elevation data were acquired via the Geospatial Data Cloud platform (https://www.gscloud.cn (accessed on 14 September 2021)) with data type ASTER GDEM and a spatial resolution of 30 m.

2.3. Calculation Model of Rainfall Erosivity

The traditional calculation of rainfall erosivity involves multiplying the kinetic energy of a storm’s rainfall by the maximum 30 min rainfall intensity of the day [45]. The accuracy of the R-value calculation is evaluated from various perspectives, including the rainfall kinetic energy equation, data collection methods, and interpolation techniques [46]. Despite the challenges in obtaining high-temporal-resolution precipitation data, low-resolution data (such as daily data) can still yield high accuracy. In the Niyang River Basin, rainfall typically occurs at night [47]. Consequently, using a semi-monthly interval for rainfall event statistics can effectively prevent the division of a single rainfall event, resulting in greater accuracy compared to daily interval statistics [36].
This study employs the simplified algorithm model developed by Zhang Wenbo [48]. This model, based on Richardson’s daily rainfall erosion factor model, applies to most regions of China. Numerous researchers have validated its low error rate in various studies of rainfall erosivity [36,49,50]. Shaojuan Lu [36] found that, through regional calculations on the Qinghai–Tibet Plateau, the results obtained using the semi-monthly model were superior to those derived from the daily model. The model requires excluding low-intensity rainfall that does not cause soil erosion, selecting daily rainfall of 12 mm or more as erosive rainfall to calculate the semi-monthly rainfall erosivity at various sites within the study area [48]. Subsequently, the semi-monthly rainfall erosivity values are accumulated to determine the monthly, seasonal, and annual rainfall erosivity. The calculation expression for the semi-monthly rainfall erosivity model is as follows:
R i = α k = 1 m P k β
In the formula:
R i denotes the erosive force of the i-th half-month, expressed in “MJ · m m · h m 2 · h 1 ”.
P k is the precipitation amount on the k-th day of the i-th half-month with precipitation ≥ 12 mm, in mm.
m denotes the count of days with precipitation ≥ 12 mm during the i-th half-month, in days.
α and β are parameters, see Formulas (2) and (3).
α = 21.586 β 7.1891
β = 0.8363 + 18.144 P d 12 + 24.455 P y 12
P d 12 denotes the average daily precipitation (mm) on days where daily precipitation totals 12 mm or more.
P y 12 represents the mean annual rainfall (mm) on days when daily precipitation is ≥12 mm.
The values of the model parameters α and β were obtained by regression fitting.

2.4. Spatial Statistical Analysis

Ordinary Kriging is a widely used spatial interpolation technique in geostatistics, designed to estimate values at unknown locations on the Earth’s surface, and is also widely used for the spatial distribution of precipitation [51,52]. It provides the best linear unbiased estimation by considering the spatial correlation between known points through a weighted average, yielding precise and unbiased estimates for unknown locations. This method effectively accounts for spatial autocorrelation, thus enhancing the accuracy of the estimation. The Ordinary Kriging interpolation process involves fitting a semi-variogram to the known data points and calculating the weighted average for unknown locations based on the distances between known points. Subsequently, cross-validation is employed to confirm result accuracy, followed by analysis of interpolation results and implementation of any required post-processing.
To determine monthly, seasonal, and annual rainfall erosivity, all rainfall data for each half-month were accumulated. For the 123 grid points in the Niyang River Basin, the average annual rainfall erosivity over the nine consecutive years from 2008 to 2016 was calculated. The average monthly rainfall erosivity was computed to derive the monthly average values for January to December. The seasons are grouped into four: (i) spring typically ranges from March to May, (ii) summer from June to August, (iii) autumn from September to November, and (iv) winter from December to February. The seasons are also divided based on rainfall: (i) the dry season, which lasts from October to May, and (ii) the wet season, which lasts from June to September. Spatial distribution modeling of annual, monthly, and seasonal average erosivity data was implemented using the geostatistical analysis tool of ArcMap 10.5 by utilizing Ordinary Kriging interpolation.

2.5. Correlation Analysis

Correlation analysis involves examining the relationship between variables to understand their interdependence and to quantify the extent of their correlation and is widely used in hydrological analysis [53]. Using Origin 2024 analysis software, Spearman correlation analysis was conducted on rainfall erosivity and various factors, including rainfall volume, erosive rainfall, precipitation during dry and wet seasons, temperature, and elevation.

3. Results

3.1. Calculation of Rainfall Erosivity

Daily precipitation at all stations in the Niyang River Basin was screened, and average daily precipitation greater than 12 mm was identified as erosive rainfall (Pd12). Then, the number of days of erosive rainfall was accumulated at each grid point during the study period, and it was found that the maximum cumulative number of days of erosive rainfall (DP12) accounted for 4.08 percent of the total number of days of precipitation (Figure 1). This particular rainfall predominantly occurred between June and September. The areas with the most frequent cumulative occurrences of erosive rainfall are concentrated in the lower reaches of the Niyang River, the river’s source region, and the northern part of the midstream area (Figure 2). The tributaries of the Zhula River and Ba Rivers in the central part of the basin are typical fan-shaped water systems, where erosive rainfall occurs more frequently than in other tributaries.
The characteristics of the tributaries of the Niyang River are similar to those of the mainstem, with relatively high erosive rainfall in the downstream areas. Analysis of daily (Pd12) and annual (Py12) mean erosive rainfall showed that the values were larger at the headwaters of the mainstem and the confluence of the Yarlung Zangbo River downstream, and both Pd12 and annual mean Py12 showed an increasing trend from upstream to downstream of the mainstem. On the tributaries, Pd12 and Py12 also showed a gradual increasing trend from upstream to downstream.
Referring to Formulas (2) and (3), the regression fitting calculations were used to obtain the values of α and β of the semi-monthly rainfall erosivity model parameters (Figure 3a), with the values of β ranging from 1.75 to 2.77 and α ranging from 0.014 to 1.39. The semi-monthly rainfall erosivity calculations were carried out according to Formula (1), and then cumulative superposition was used to obtain the erosivity of the rainfall for each month, season, and year (Figure 3b–d).

3.2. Temporal Analysis of Rainfall Erosivity

The yearly fluctuation patterns of rainfall erosivity in the Niyang River Basin from 2008 to 2016 were analyzed using a rainfall erosivity model. This analysis also examined the seasonal variations during spring, summer, autumn, winter, the dry season, and the wet season, as well as the interannual variations (Figure 3). The long-term average annual precipitation in the basin is 535 mm, the long-term average erosive precipitation is 196 mm, and the long-term average rainfall erosivity is 711 MJ · m m · h m 2 · h 1 . The distribution of precipitation, erosive precipitation, and rainfall erosivity in the Niyang River Basin shows similar trends in their intra-annual, seasonal, and interannual patterns. The intra-annual distribution of these three variables (Figure 3b) begins to increase in May, with the elevated levels of precipitation and rainfall erosivity primarily concentrated during the wet season from June to September. During this period, erosive precipitation constitutes more than 40% of the total precipitation, and the rainfall erosivity generated during this time accounts for 93.9% of the annual total. Rainfall erosivity reaches its peak in July, at 191 MJ · m m · h m 2 · h 1 . In April and May, erosive precipitation accounts for 15–20% of the total precipitation, generating a small portion of the annual rainfall erosivity; the average monthly rainfall erosivity stands at 16 MJ · m m · h m 2 · h 1 . From October to December, the overall precipitation is low, but the proportion of erosive precipitation ranges from 8% to 18%, resulting in a very small amount of rainfall erosivity, averaging a monthly value of 3.25 MJ · m m · h m 2 · h 1 . From January to March, rainfall erosivity is less than 1 MJ · m m · h m 2 · h 1 , nearly zero.
The Niyang River Basin is located in a deep mountain valley area. Different seasons are affected by the monsoon climate and show different climate characteristics (Figure 3c). Precipitation is mostly concentrated in the summer, which accounts for 63.9% of the annual precipitation. This period is also the period when erosion in the Niyang River Basin is most significant. In total, 42.6% of the summer precipitation is erosive precipitation, which forms 542 MJ · m m · h m 2 · h 1 of rainfall erosivity, accounting for 76.2% of the annual rainfall erosivity. Autumn precipitation accounts for 22.3% of the annual precipitation. The proportion of erosive precipitation in this period is 33.2%, which is relatively high. However, since the total precipitation is only 119 mm, the rainfall erosivity value is relatively low, at 134 MJ · m m · h m 2 · h 1 . Statistics of precipitation for 12 months in 2008–2016 show that precipitation is mainly concentrated in the wet season from June to September, totaling 431 mm, of which erosive precipitation accounts for 42.3%, reaching 183 mm. The precipitation in these four months accounts for 80.7% of the annual precipitation. The precipitation erosivity during the wet season constitutes 93.9% of the annual total, reaching 667.9 MJ · m m · h m 2 · h 1 . Even during the dry season, the precipitation constitutes 20% of the annual total; due to the low precipitation intensity, the rainfall erosivity is only 43.2 MJ · m m · h m 2 · h 1 .
The patterns of precipitation, erosive precipitation, and rainfall erosivity in the Niyang River Basin showed consistent interannual distribution trends from 2008 to 2016 (Figure 3d). Precipitation in the basin generally showed a slowly increasing trend during these nine years, with 2010 and 2014 being high-water years with 610 mm and 695 mm of precipitation. The trend of erosive precipitation differed from that of precipitation, with an increase of 61.1% in 2009, which stayed within 14% variation for five consecutive years from 2009, followed by an increase of 67.3% in 2014, with the variation in the following two years maintained within 17%. The basin rainfall erosivity showed a trend of stability in the first period and growth in the second period, increasing in 2009 by 73.7% of the 2008 level, and stabilizing at 600 MJ · m m · h m 2 · h 1 from 2009 to 2013. It reached a maximum value of 1098 MJ · m m · h m 2 · h 1 in 2014, and then began to decrease by 16.6% and 13.6% in the following two years. Overall, the interannual trend of rainfall erosivity most closely matches the trend of erosive precipitation.

3.3. Spatial Analysis of Rainfall Erosivity

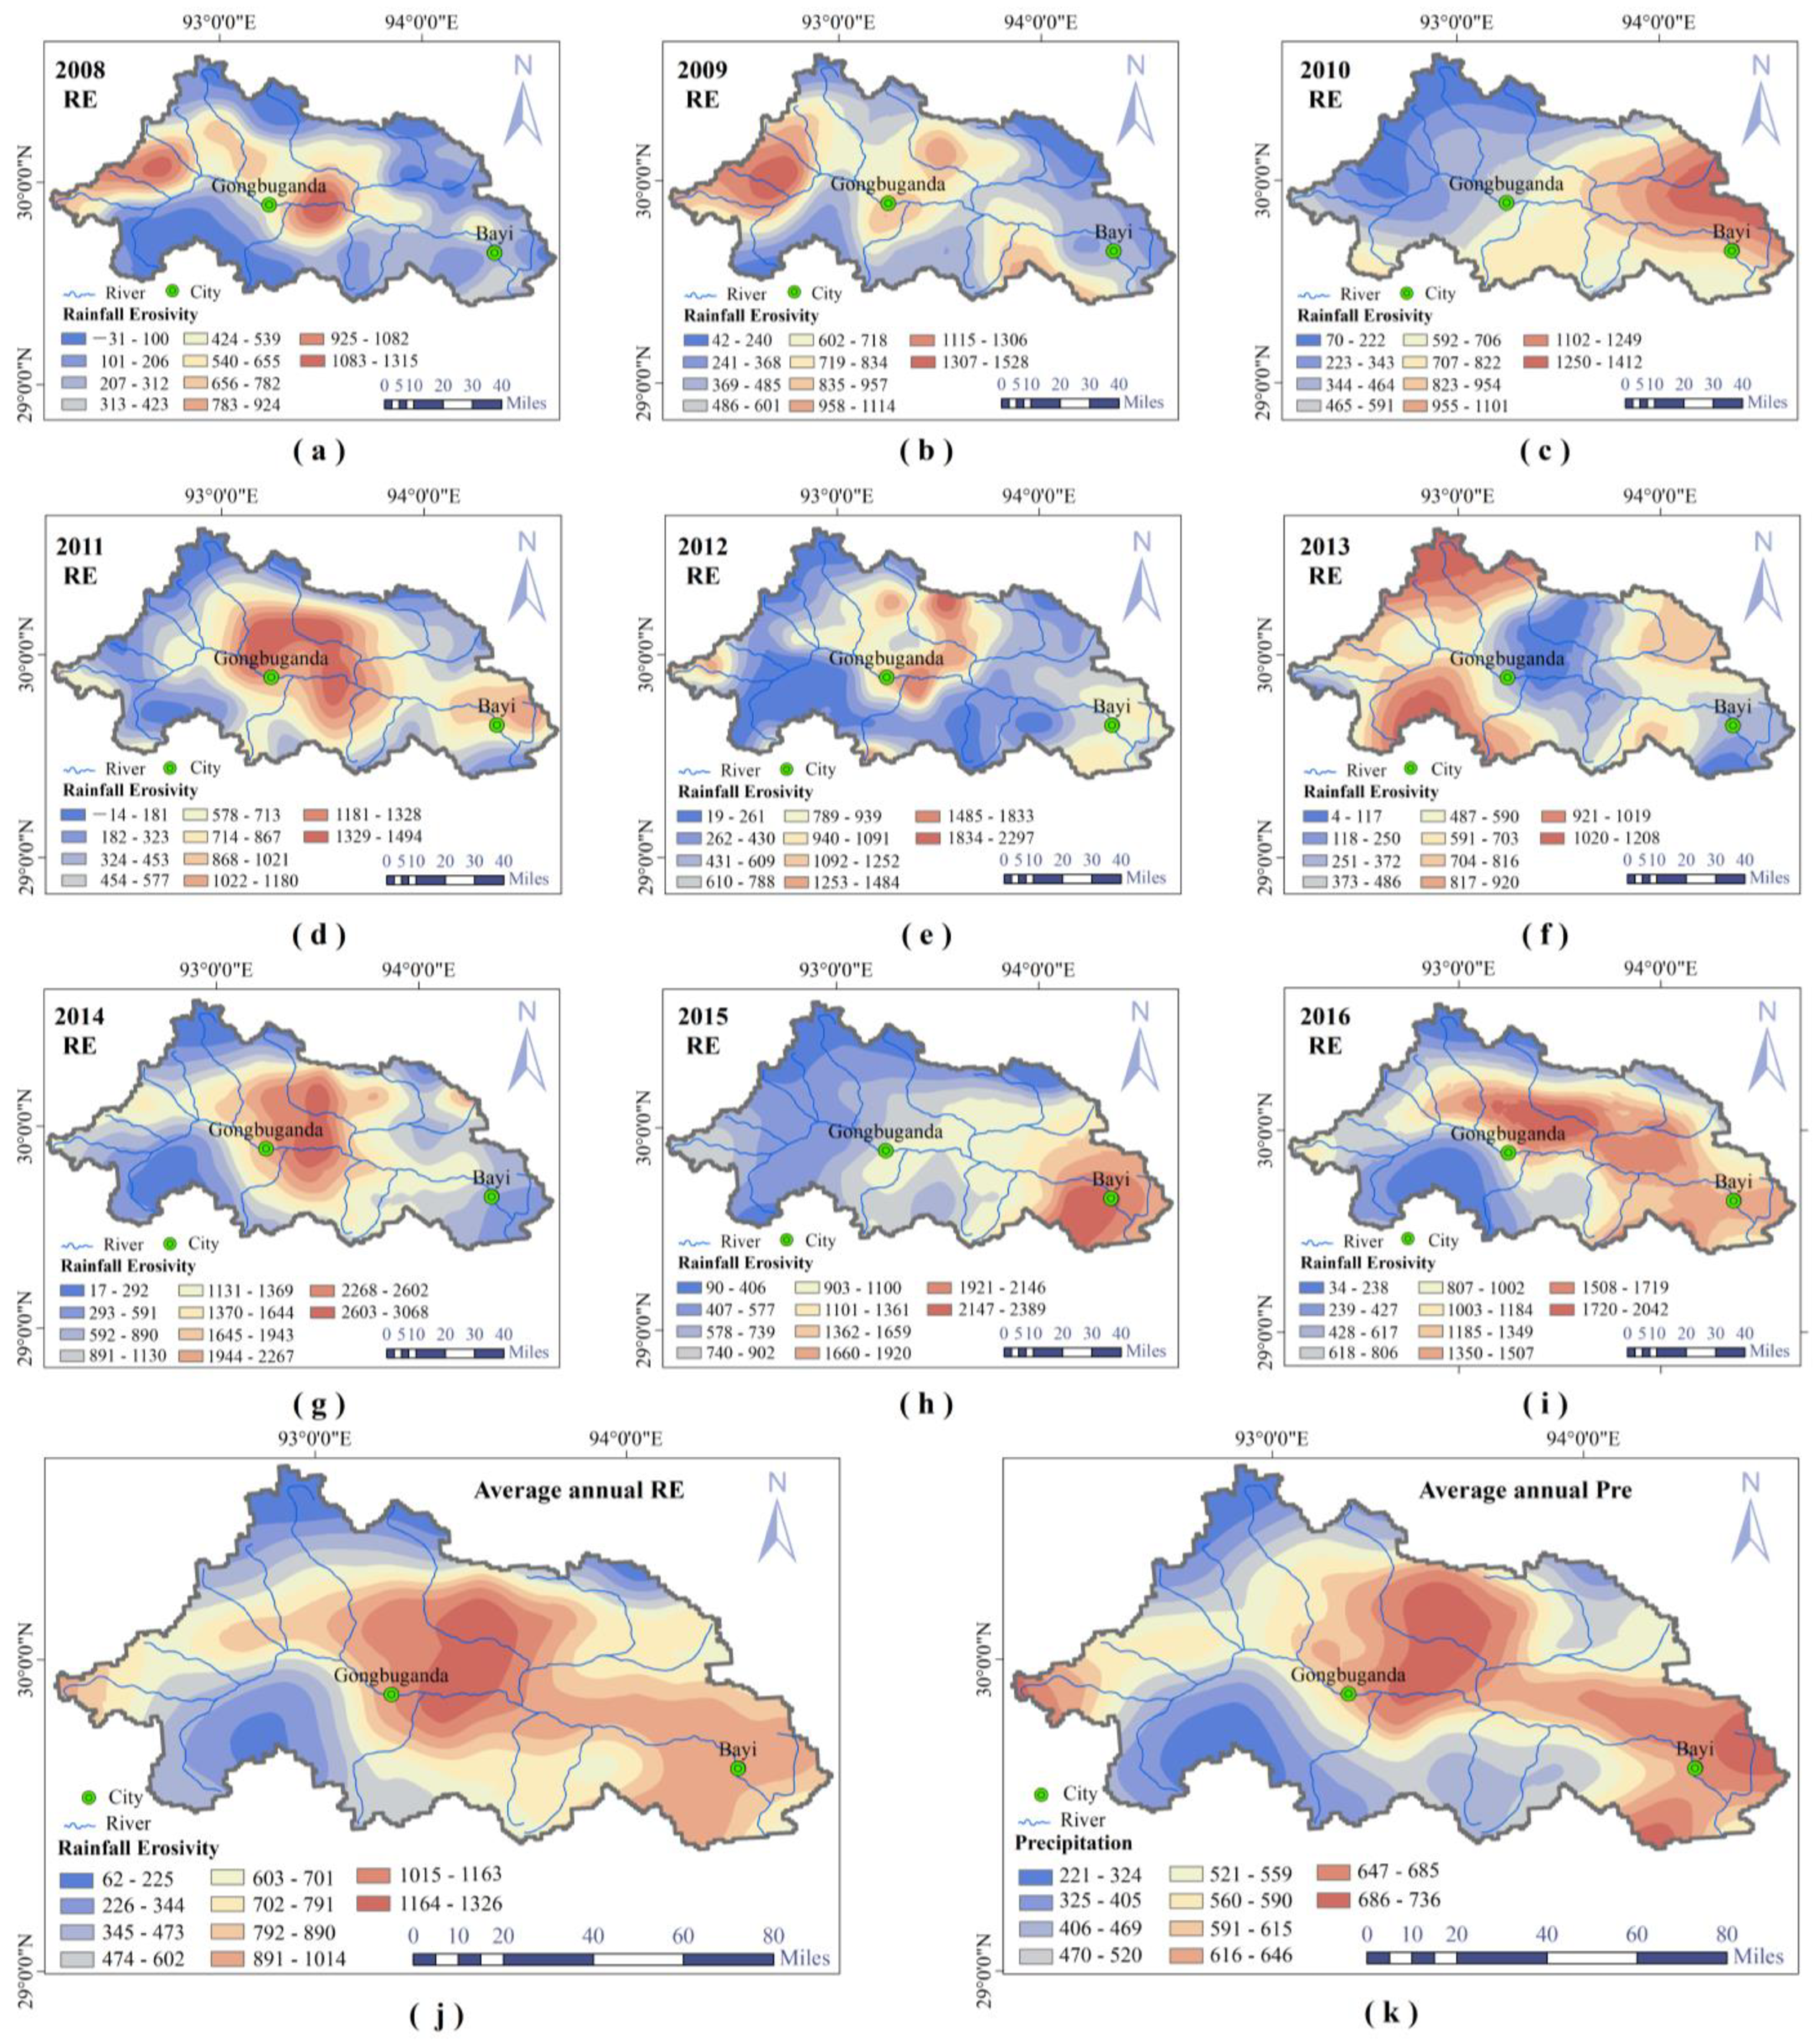
3.3.1. Spatial Variability of Average Annual Rainfall Erosivity

Kriging interpolation was performed on the annual precipitation and annual rainfall erosivity of each grid point in the Niyang River Basin from 2008 to 2016, resulting in spatial distributions of precipitation and rainfall erosivity across the basin (Figure 4). The average annual precipitation was 534 mm, peaking at 753 mm and reaching a minimum of 223 mm. Areas with relatively high precipitation are mainly concentrated in the source of the basin, the left bank of the middle of the mainstream (the middle and downstream stretches of the Zhula River), and the downstream area (Figure 4k). The distribution of rainfall erosivity in the Niyang River Basin resembles the average precipitation over multiple years. The average over multiple years of rainfall erosivity from 2008 to 2016 was 711 MJ · m m · h m 2 · h 1 , with a maximum value ranging from 1015 to 1326 MJ · m m · h m 2 · h 1 , predominantly concentrated in the central part of the basin. Most of the areas are distributed in the mainstream of the Niyang River within 30 km downstream of Gongbujiangda County and the northern section of the Zhula River, specifically, its middle and lower reaches, and a small part is distributed in the lower reaches of the Niang River (Figure 4j). The larger values are between 792 and 1014 MJ · m m · h m 2 · h 1 ; the primary focus lies predominantly in the central and southeastern regions of the basin, and a small part is located at the source of the basin. The lower values of the multi-year average rainfall erosivity are predominantly found in the eastern section of the upper Bai River Basin. Some are scattered in the marginal areas of the northern part of the Niyang River Basin, which are mainly the source areas of the tributaries on the left bank of the Niyang River Basin.

3.3.2. Interannual Variation in Rainfall Erosivity

The annual pattern of rainfall erosivity distribution within the basin showed considerable variation (Figure 4a–i). From 2008 to 2011, the maximum values of rainfall erosivity were within the range of 1530 MJ · m m · h m 2 · h 1 . The spatial distribution in 2008 and 2009 was similar, primarily concentrated in the central part of the basin and the northern part of the source region. In 2010, it was concentrated on the left bank of the middle and lower reaches, whereas in 2011, it was mostly in the center of the basin, with some higher values appearing on the left bank of the lower reaches. In 2012, increased precipitation caused the rainfall erosivity on the left bank at the junction of the upper and middle reaches to nearly double compared to the previous year, while other areas did not show significant changes from the previous year. The spatial distribution in 2013 was similar to that in 2011, with relatively smaller values. In 2014, the rainfall intensity was the highest among these years, resulting in the maximum rainfall erosivity value of 3010 MJ · m m · h m 2 · h 1 , with elevated values remaining concentrated in the central region of the basin. In 2015, the higher values of rainfall erosivity shifted to the downstream areas, decreasing by 30% compared to 2014. In 2016, the maximum values decreased further, and the spatial range expanded, from the Riwenglang River in the upstream region to the basin outlet.

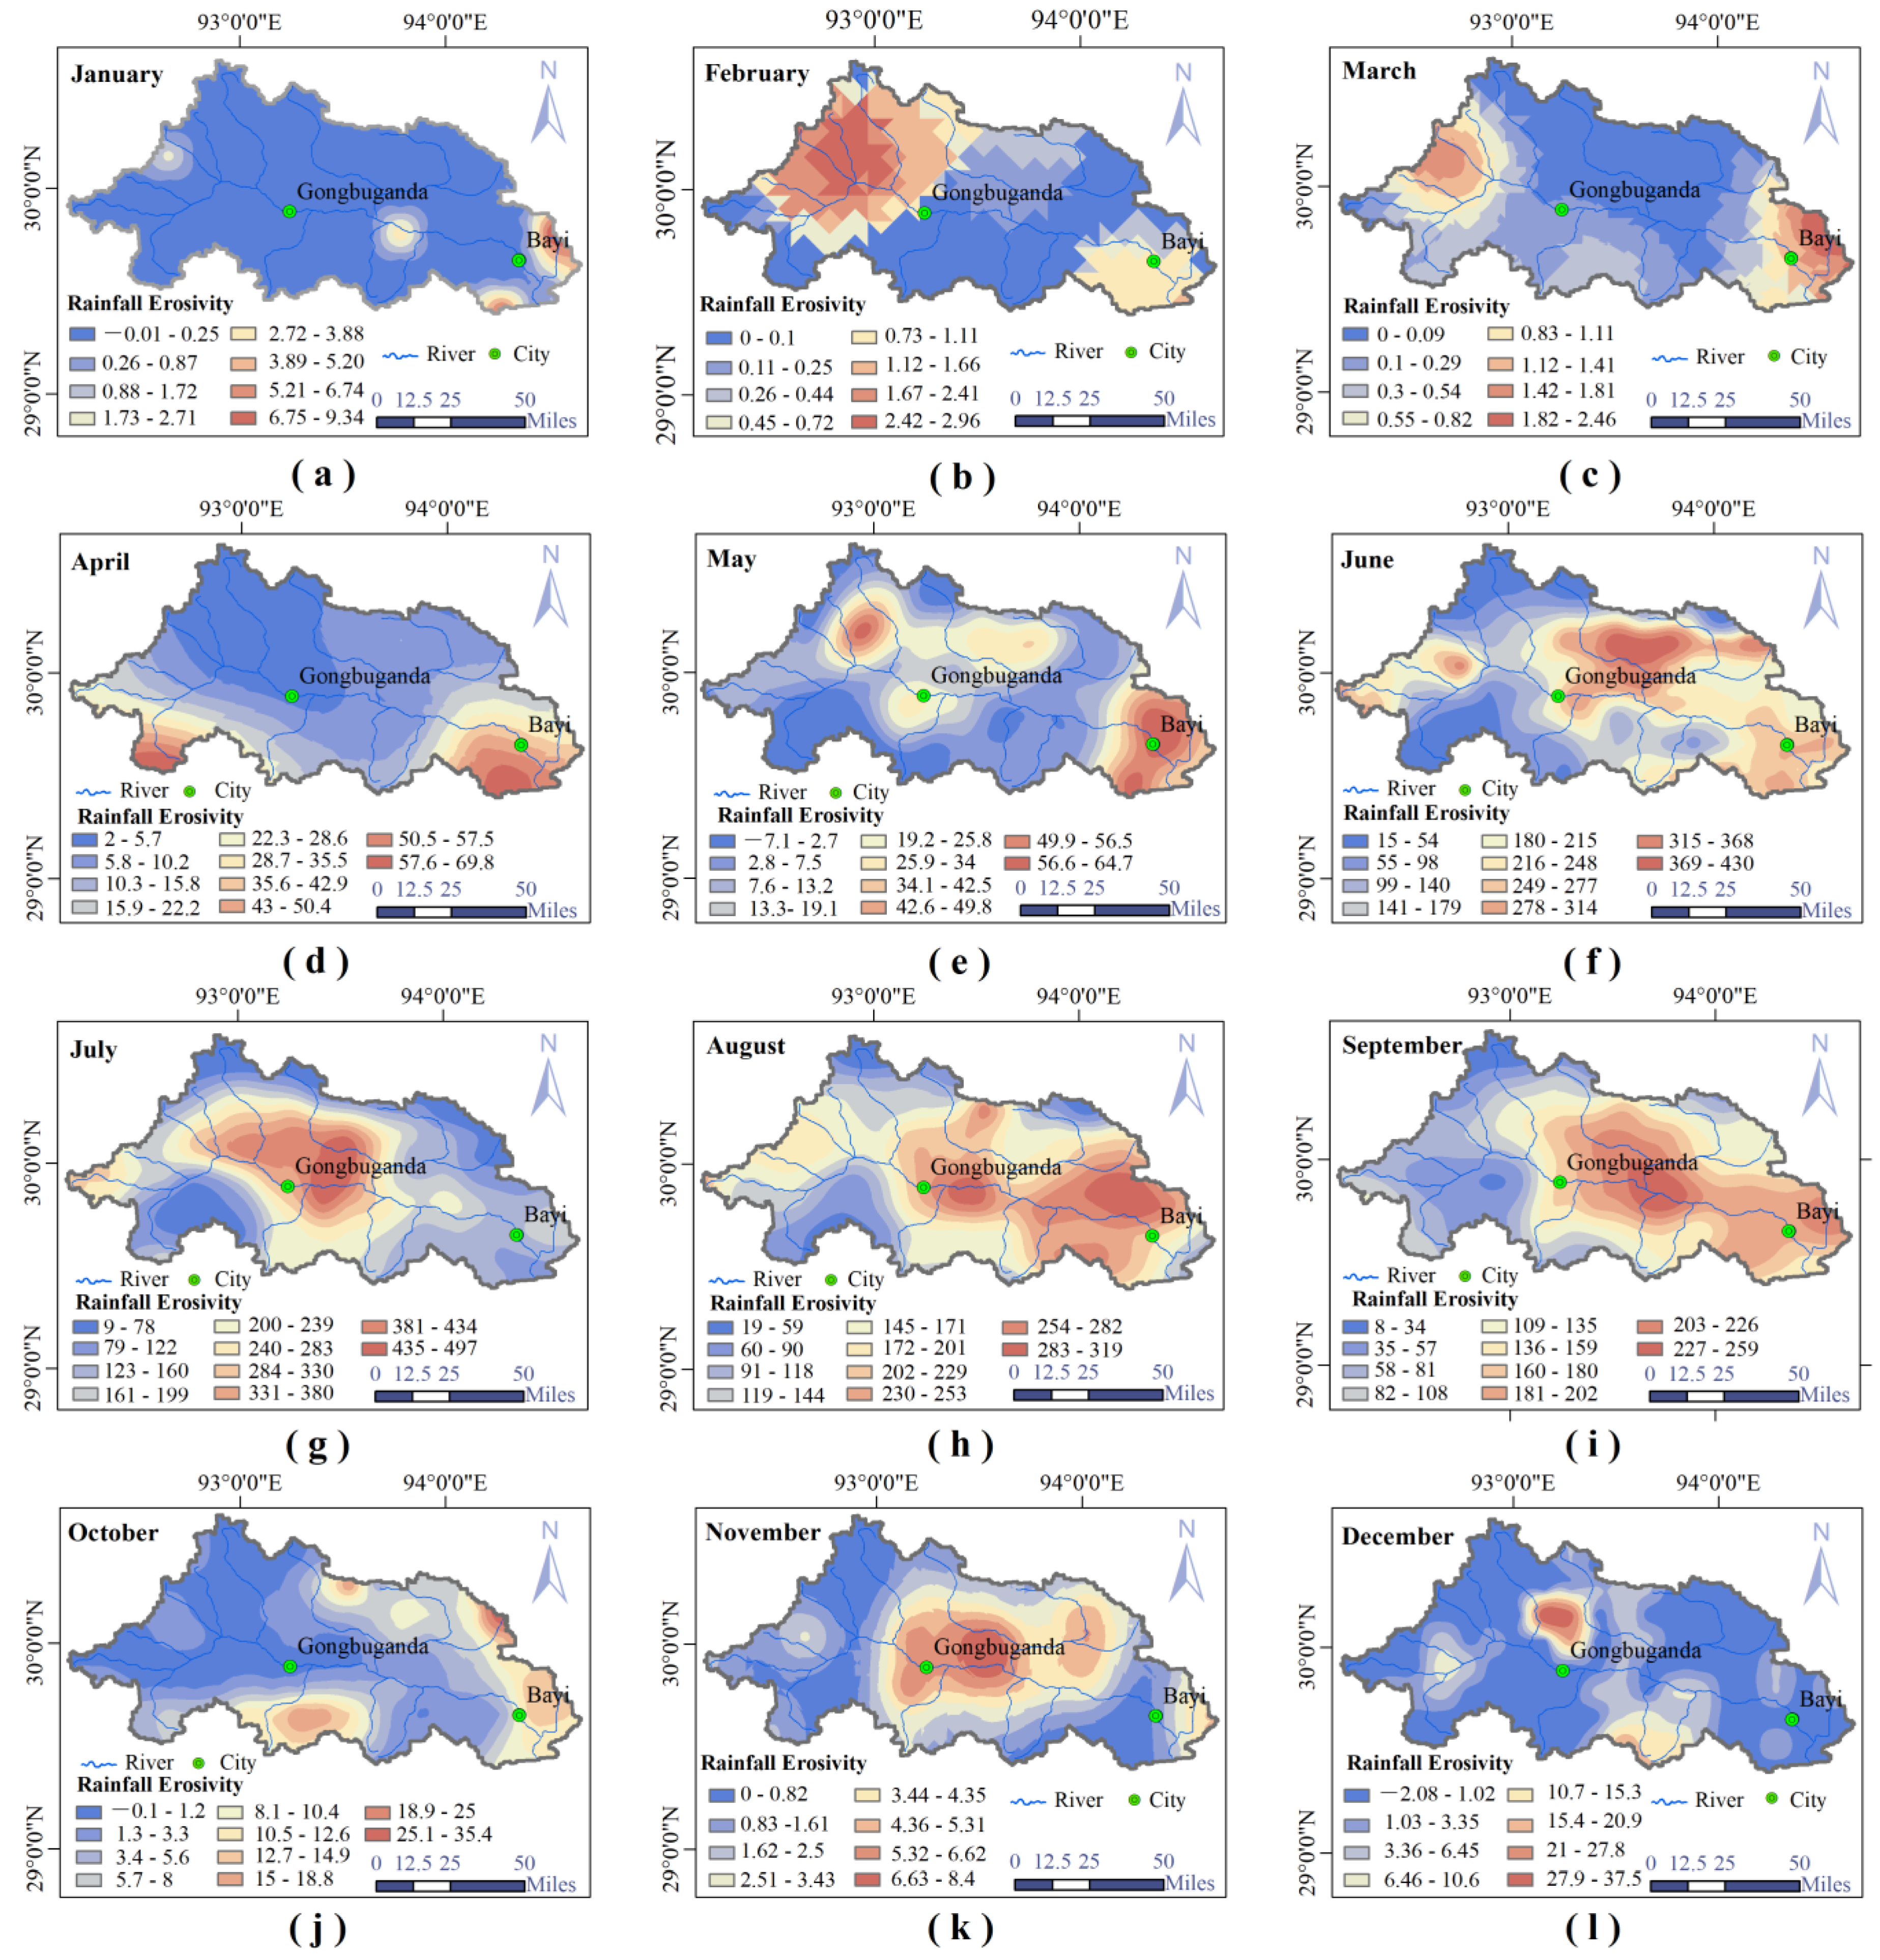
3.3.3. Intra-Annual Spatial Distribution of Rainfall Erosivity

The distribution of rainfall erosivity varies throughout the year (Figure 5). During the period from October to March of the subsequent year, the values are relatively small, below 40 MJ · m m · h m 2 · h 1 , and most areas are zero. In February and March, the Riwenglang River and Niang River are affected by the partial melting of glaciers, resulting in very little rainfall erosion. In April and May, the maximum RE reaches 70 MJ · m m · h m 2 · h 1 , mainly concentrated in the downstream. Starting from June, rainfall erosivity increased significantly, with a maximum value of 430 MJ · m m · h m 2 · h 1 . The larger value range is concentrated on the left bank of the Zhula River. In July, the largest rainfall erosivity of the year was produced, and the larger value range moved upstream. In August and September, the larger value decreased by 35–48%, and the larger value range returned to the middle and lower reaches.

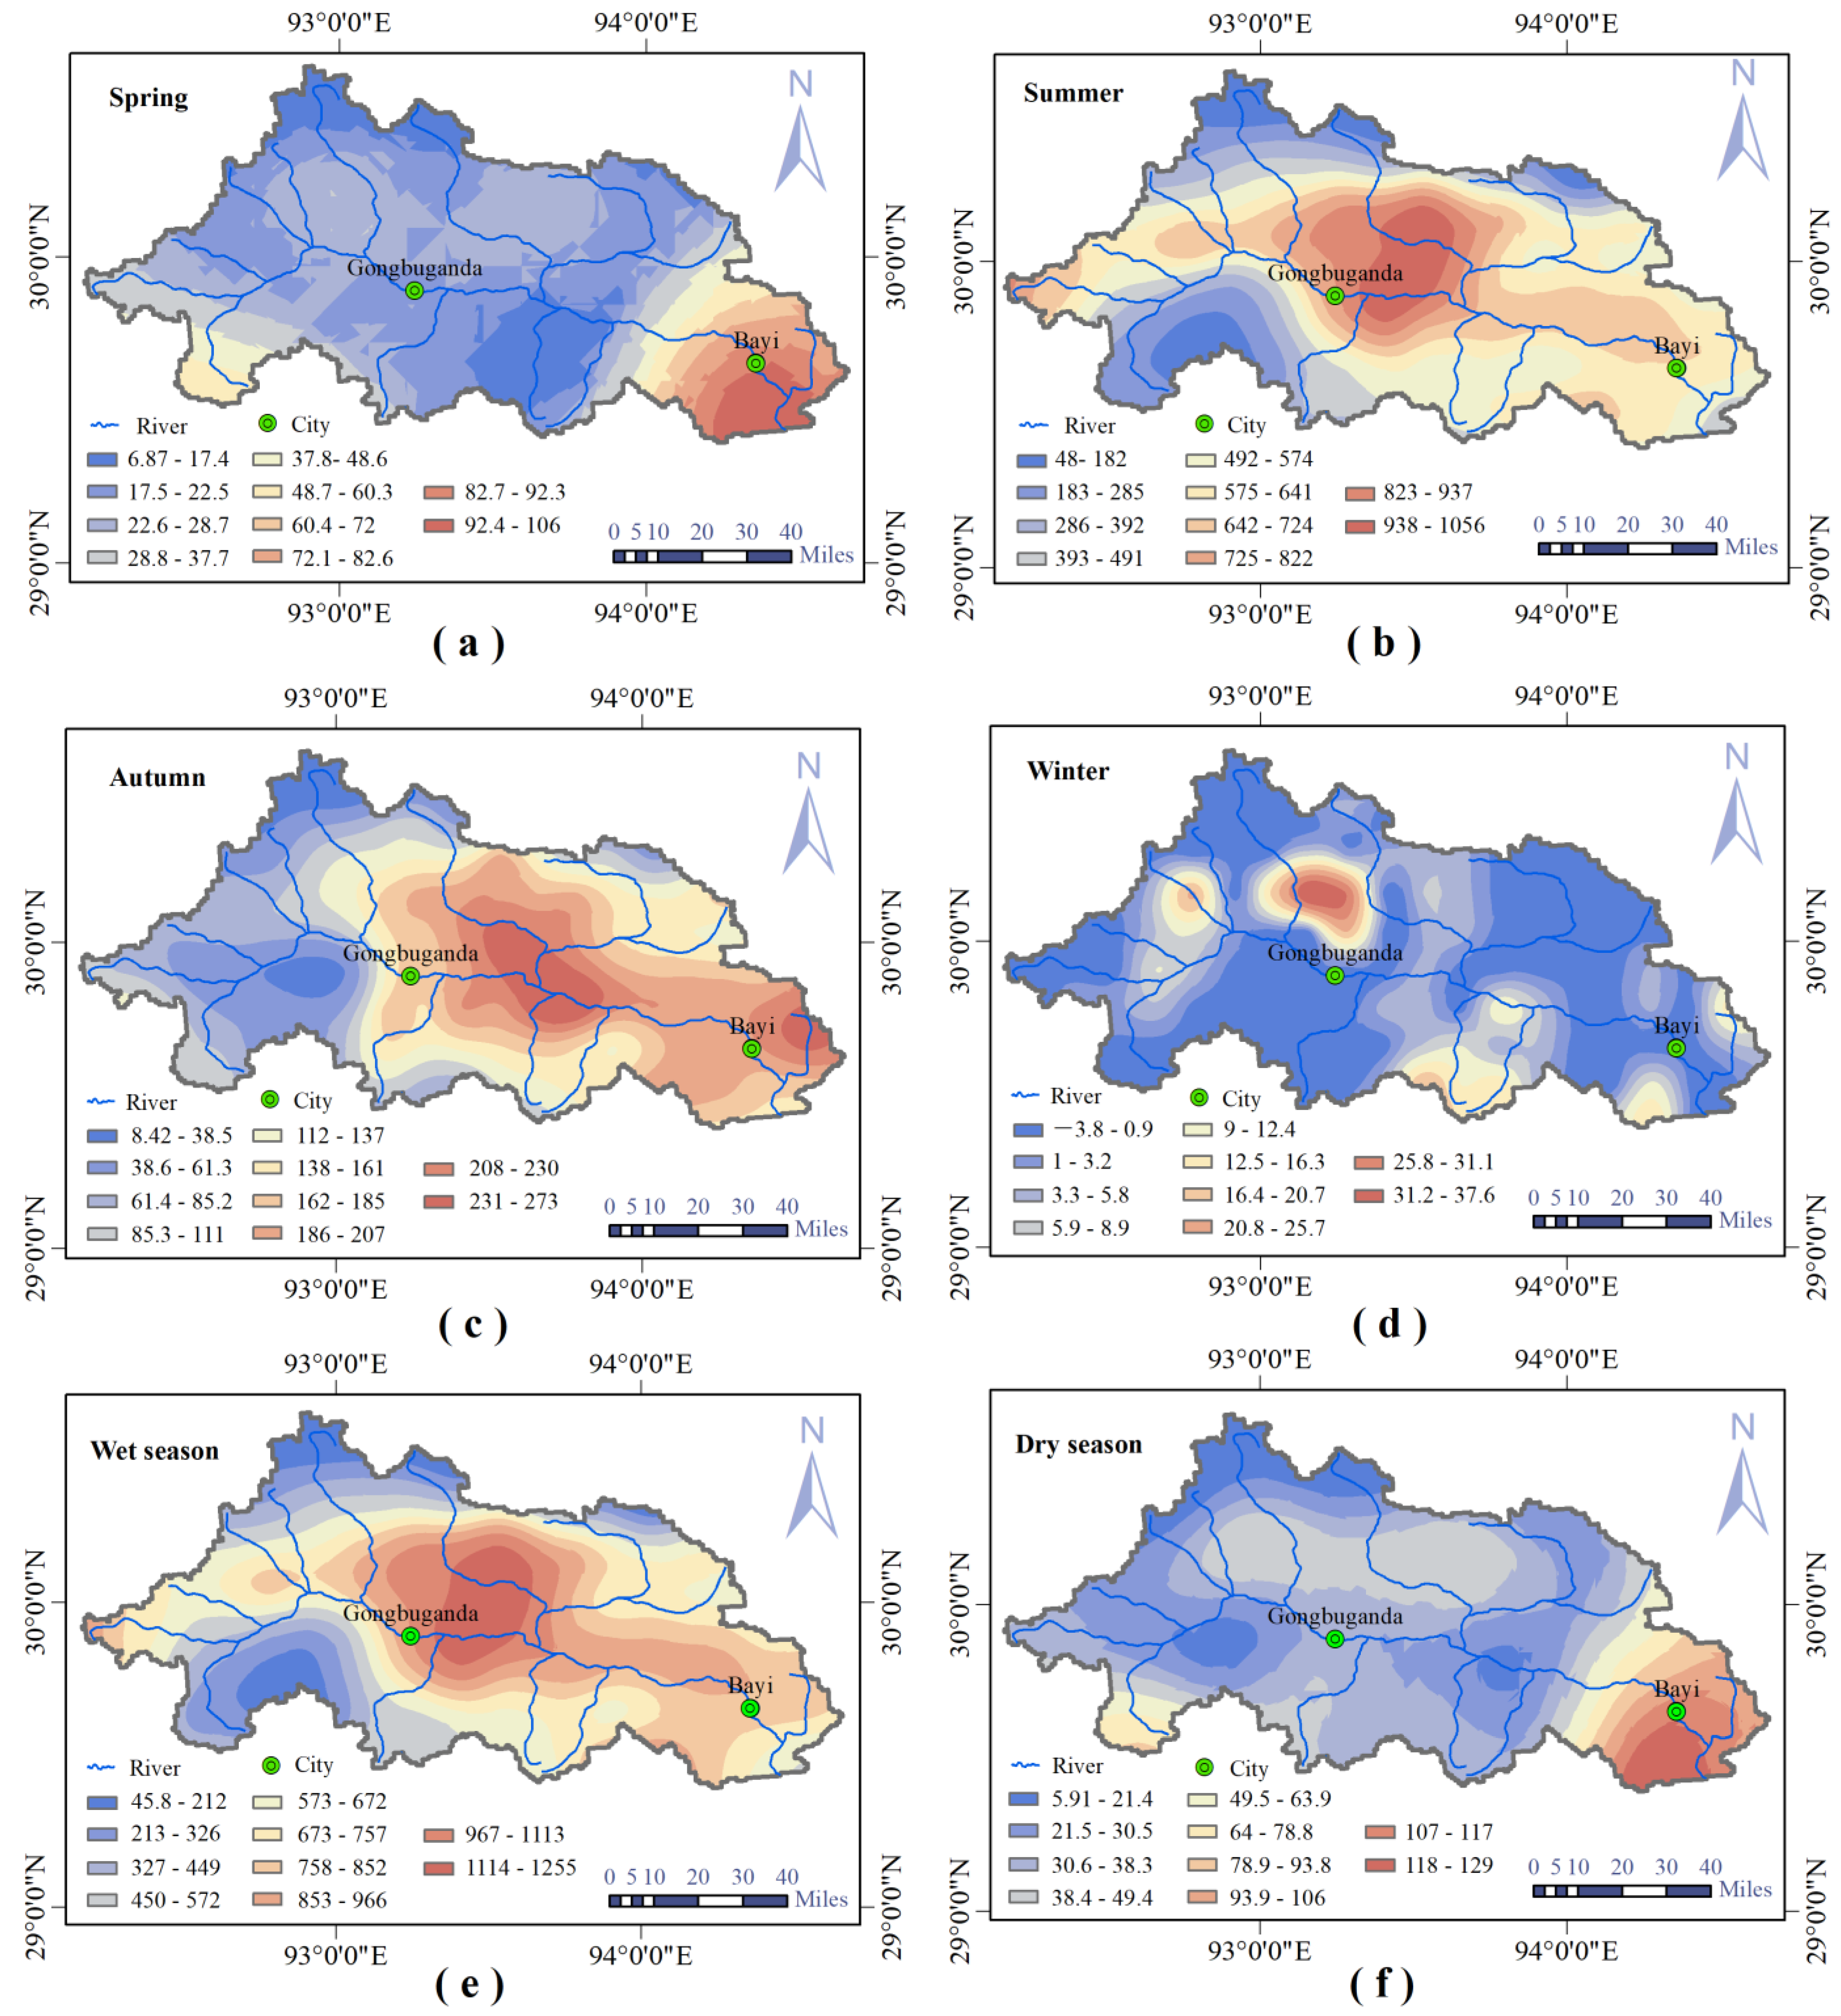
3.3.4. Seasonal Distribution of Rainfall Erosivity

The seasonal patterns of rainfall erosivity across the Niyang River Basin (Figure 6) indicate that rainfall erosivity reaches its peak in summer, followed by autumn, spring, and then winter. In spring (Figure 6a), as temperatures rise, the influence of the westerlies leads to localized areas with erosivity values of 0, while rainfall erosivity increases in the southern downstream regions, reaching a maximum of 106 MJ · m m · h m 2 · h 1 . Summer (Figure 6b) is the primary rainy season, influenced by the northward movement of the Indian Ocean monsoon. Rainfall erosivity ranges from 61.5 to 1070 MJ · m m · h m 2 · h 1 , with an average of 542 MJ · m m · h m 2 · h 1 , showing significant spatial variability. Most regions exhibit an upward trend in rainfall erosivity, particularly in the source area, the first half of the middle reaches, the mid-lower reaches of the left-bank tributary Zhulaqu, and the junction areas of the mid-lower reaches. The potential for soil erosion in these regions could rise due to the increased rainfall erosivity, making it crucial to implement stronger soil and water conservation measures. In autumn (Figure 6c), rainfall erosivity significantly decreases, remaining mainly concentrated in the mid-lower reaches. The maximum value is reduced by 72% compared to summer, with the middle reaches showing the greatest decrease. In winter (Figure 6d), as the westerlies migrate, the region becomes drier with minimal rainfall, resulting in rainfall erosivity values of zero in most areas. However, the mid-lower reaches of the Niang River and the junction areas with the Zhula River show some erosion, with a maximum value of 37.4 MJ · m m · h m 2 · h 1 . During the wet season (June–September) (Figure 6e), the spatial distribution of rainfall erosivity resembles that in summer, ranging from 76.6 to 1263 MJ · m m · h m 2 · h 1 . In the dry season (October–May) (Figure 6f), intense rainfall erosivity affects both the upper reaches and downstream areas of the Bai River.

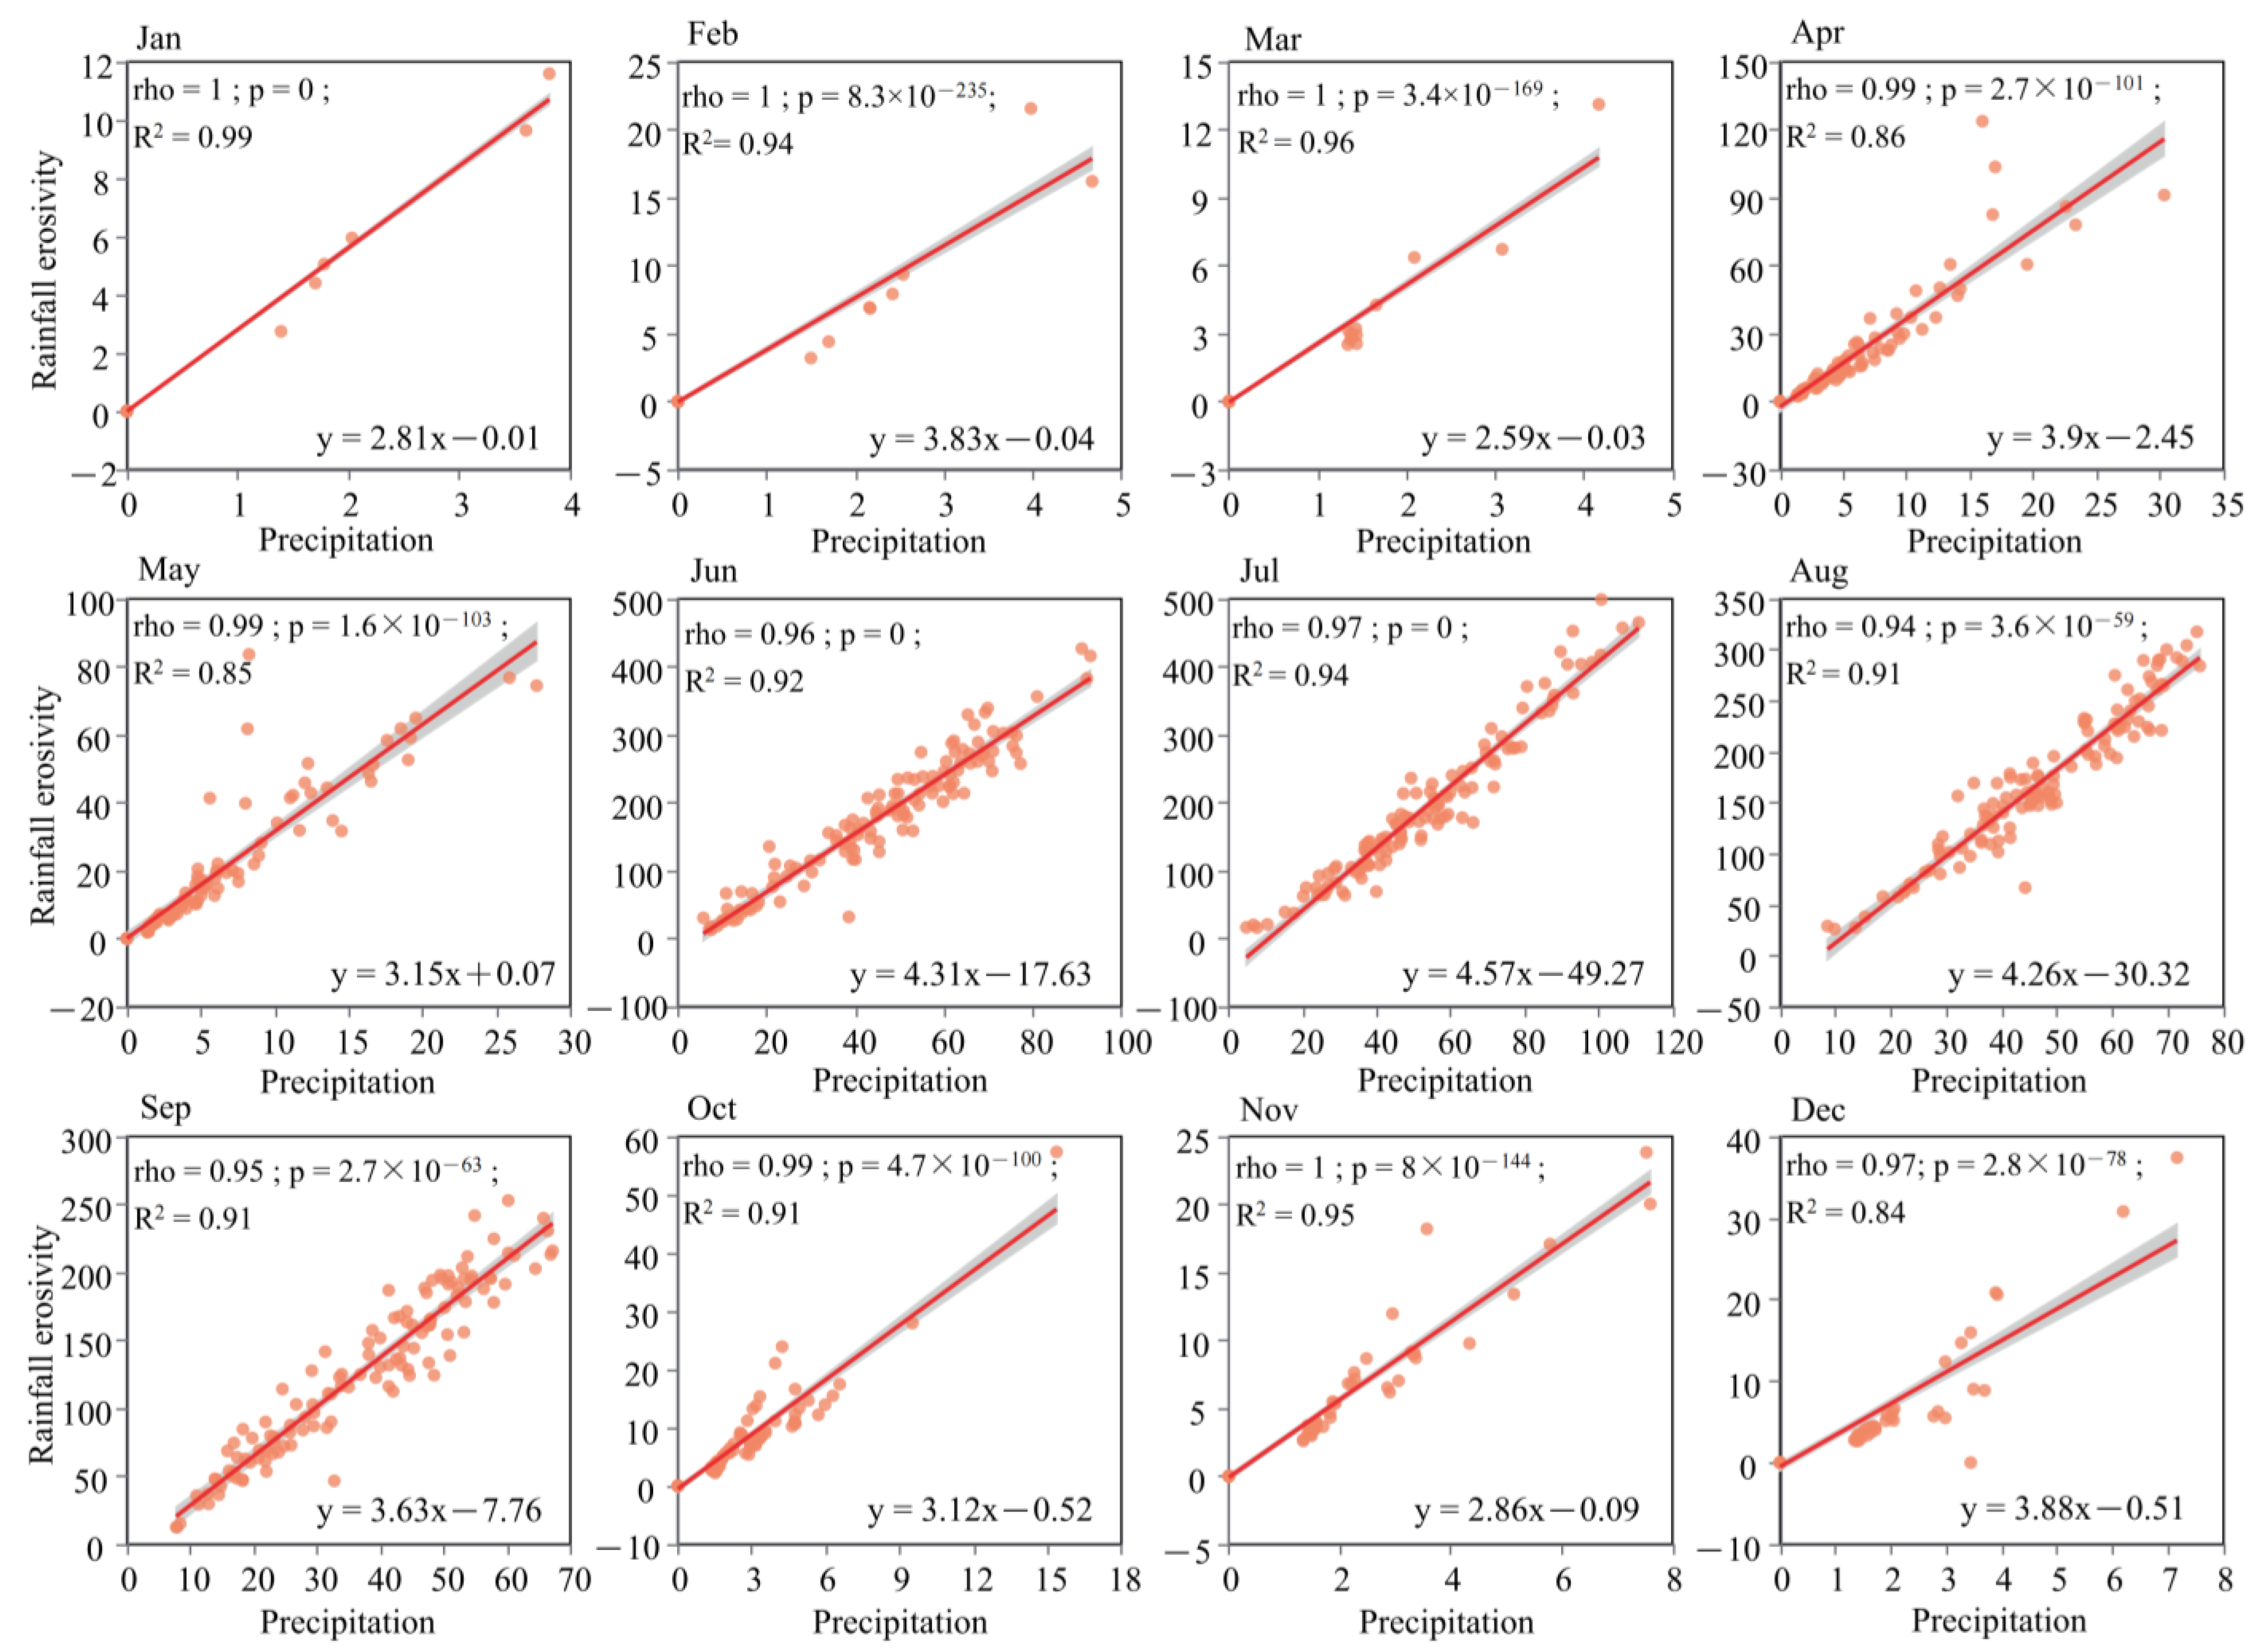
3.4. Correlation Analysis of Factors Affecting Rainfall Erosivity

Rainfall is the primary driver of soil erosion. Higher rainfall amounts and intensities lead to increased surface runoff, thereby enhancing erosion. Analyzing rainfall quantity and intensity allows for a direct assessment of potential erosion risks. Erosive rainfall events are defined by their intense, short-lived downpours, which easily trigger significant runoff and soil erosion. These events can occur in different seasons: the wet season typically sees frequent rainfall, heightening erosion risk, while in the dry season, despite lower rainfall, occasional intense downpours can still cause severe erosion. Besides rainfall, erosion susceptibility also hinges on factors like temperature and elevation. Therefore, employing Spearman correlation analysis, we examine the relationships between annual rainfall erosivity (RE) and multi-year averages of precipitation (Pre), erosive precipitation (E-Pre), dry-season precipitation (Pre10-5), wet-season precipitation (Pre6-9), temperature (TEM), and elevation (EL) (Figure 7).
The correlation between rainfall erosivity and temperature is very weak with a correlation coefficient ρ (rho) of less than 0.2. There is a moderately negative correlation with elevation, with the correlation coefficient showing a negative value. Rainfall erosivity (RE) is positively correlated with several other factors, with the strongest correlation being with erosive precipitation (E-Pre) with a ρ (rho) of 0.93. This is followed by total precipitation (Pre) and wet-season precipitation (Pre6-9), both with a ρ (rho) of 0.86, suggesting that there is a very strong correlation between them and rainfall erosivity. A significant correlation (ρ = 0.68) exists between rainfall erosivity and dry-season precipitation (Pre10-5).
As an example, a linear regression analysis (Figure 8) of monthly rainfall erosivity and precipitation data spanning the years 2008 to 2016 in the Niyang River Basin was carried out with least-squares fitting by month and correlation test using Spearman’s correlation coefficient. The analysis results indicated that August had the lowest correlation coefficient, which was 0.94, while the maximum correlation coefficient among all the months was 1. The significance level p-value for each month was less than 0.05. The linear fit achieved a minimum coefficient of determination R2 of 0.84, which was found in December, which indicates that each of the months had a high degree of linear fit. This indicates a strong positive linear relationship between precipitation and rainfall erosivity, suggesting that higher levels of precipitation result in increased rainfall erosivity.

4. Discussion

The results of this study indicate that erosive precipitation is closely linked to rainfall erosivity and is a primary factor in determining it (Figure 7). From 2008 to 2016, the erosivity of rainfall in the Niyang River Basin showed marked fluctuations throughout seasons and years. Overall, rainfall erosivity increased year by year, particularly during the wet season. During this period, the erosive precipitation became more frequent and intense as it moved downstream, impacting both the main river and its tributaries. The peak rainfall erosivity values were predominantly clustered in the central and lower sections of the basin. As the global climate undergoes significant shifts, high-altitude regions are likely to experience more frequent extreme rainfall events. This intensifies the rainfall erosivity, worsening the severity of soil erosion. As a result, exposed soil increases the ground’s albedo, which affects surface temperature and disrupts the energy balance, potentially altering local or even regional climates. Moreover, soil erosion can diminish soil fertility and alter carbon storage within the soil, impacting the global carbon cycle and contributing to climate change.
According to Yueli Chen et al. [30], rainfall erosivity on the Tibetan Plateau exhibited a general upward trend from 1979 to 2018. The map illustrating the geographical pattern of rainfall erosivity across the Yarlung Zangbo River Basin from 1991 to 2015, created by Liu, H. et al. [54], indicated that the rainfall erosivity values in the Niyang River Basin fluctuated between 800 and 1100 MJ · m m · h m 2 · h 1 . This research determined that the mean erosivity of rainfall from 2008 to 2016 averaged 711 MJ · m m · h m 2 · h 1 , with some stations recording a maximum value of 1326 MJ · m m · h m 2 · h 1 . These findings align with previous studies. The variations in rainfall erosivity over time and space are significantly influenced by rainfall, and notable differences were observed. However, rainfall does not necessarily produce greater rainfall erosivity (Figure 7). During the period from 2001 to 2020, the patterns of annual rainfall erosivity and the frequency of erosive rainfall events in various regions of China demonstrated consistent trends. This correlation was especially notable in the lush, rain-rich southeastern coastal areas where erosive rainfall led to elevated levels of rainfall erosivity [55]. Using the Poyang Lake Basin as a case study, research has shown that when the erosive rainfall amount is benchmarked at 10mm, the resulting deviation in rainfall erosivity is minimal [56]. Brychta and Janeček’s [57] findings in 2019 further reinforced this conclusion, suggesting that by filtering out non-erosive rainfall and focusing on effective rainfall amounts, the precision of rainfall erosivity calculations is significantly enhanced. Consequently, erosive rainfall is a crucial determinant of rainfall erosivity.
The Niyang River Basin is a plateau temperate monsoon semi-humid area with a significant three-dimensional climate. The basin landform is mainly mountainous and of a river valley type. The river valley’s elevation drops as you move from north to south. The general terrain of the basin slopes from the northwest to the southeast. In summer, the warm and humid air currents from the south will produce heavy precipitation on the windward side after being lifted by the terrain [35]. The timing of the wet season in the Niyang River Basin from 2008 to 2016 was slightly different from that in other regions. The wet season predominantly occurred between June and September (Figure 4), with rainfall during this period making up 90% of the total annual precipitation [58]. During the spring, the warm air brought northward by the typhoon from the Bay of Bengal resulted in higher rainfall erosivity [59], predominantly affecting the lower reaches. In the summer, the cool air from the westerly disturbances and the warm air from the Bay of Bengal typhoon converged over the basin, forming heavy precipitation (Figure 6b), which greatly increased the risk of landslides, mudslides, and flash floods. Therefore, soil erosion was most significant in summer. Due to the basin’s elevation gradient from north to south, rainfall erosivity was concentrated mainly within the middle-to-lower reaches. Due to the great influence of the valley terrain on the airflow in the basin, the precipitation in autumn was relatively reduced (Figure 6c), but the proportion of erosive precipitation was relatively high. In winter, it was manifested in the source, and in spring, it began to concentrate in the middle reaches, and so on. From 2008 to 2016, the central part of the Niyang River Basin experienced the highest concentration of rainfall erosivity, with the left bank experiencing higher values than the right bank (Figure 5). Annually, 2014 recorded the highest erosivity, reaching 3010 MJ · m m · h m 2 · h 1 , primarily in the central part of the basin. In spring, areas of high rainfall erosivity gradually moved from downstream to midstream and upstream, then concentrated again in the midstream and downstream regions by August. In winter, most areas showed values close to zero. During the wet season, the highest rainfall erosivity values were predominantly clustered in the middle and lower reaches of the river, while in the dry season, they were confined to the downstream regions.
According to the above data analysis and the results of Figure 8, we can analyze the correlation between each factor and rainfall erosivity in detail. Erosive precipitation is the factor with the strongest correlation with rainfall erosivity because erosive precipitation not only has a higher intensity but is also usually accompanied by a longer rainfall duration, which directly leads to increased soil erosion. Heavy rainfall will produce larger surface runoff, scouring the surface soil, thus significantly enhancing rainfall erosivity. Wet-season rainfall is usually concentrated and frequent, and continuous rainfall will loosen the soil structure and make it more susceptible to erosion. In this basin, temperature is not the main factor driving erosion. Temperature has relatively little effect on soil structure and water evaporation and thus has limited effect on rainfall erosivity. Rainfall erosivity decreases with increasing altitude. Increased altitude may lead to reduced precipitation [60,61]. However, this negative correlation is not very strong because the effect of altitude on rainfall characteristics is indirect.
The precipitation data in this study have some limitations, mainly reflected in the failure to distinguish snowfall, thus ignoring the monitoring of the influence of melted snow runoff on soil erosion. The small number of measured meteorological stations within the basin also limits the precise analysis of precipitation and erosion phenomena. In addition, the remote-sensing data used in this study came from a single source, which may have deficiencies in data accuracy and completeness. Future studies can introduce multi-source data for more comprehensive and accurate analysis. These multi-source data may include satellite observations, ground measurements, etc. Remote-sensing data inherently contain errors, thus verifying them with measured data is essential to enhance reliability and precision in research outcomes. Future research should focus on these aspects, and these problems need to be further addressed to improve the comprehensive understanding of rainfall erosivity in the basin. The findings of this study are crucial for understanding the factors affecting precipitation erosivity. They can provide more accurate input data for soil erosion prediction models, guide the formulation of relevant policies and measures, and thus more effectively protect water and soil resources. By applying the methods and results of this study to other basins or regions, their applicability in different geographical environments can be verified, and the universal influence of precipitation characteristics on erosion can be further explored. This will help deepen the global understanding of the erosion process and provide a reference for global water resources management and land-use planning.

5. Conclusions

This study aims to deeply explore the temporal and spatial distribution patterns of rainfall-induced soil erosion in the Niyang River Basin and its correlation with various influencing factors. The findings indicate that the erosive power of rainfall fluctuates seasonally and annually, with a marked increase during the wet season, particularly in the midstream and downstream areas of the basin. Rainfall characteristics are identified as the primary drivers of erosion, while temperature and altitude play a relatively minor role. Based on these insights, it is recommended to enhance the monitoring of rainfall patterns in the Niyang River Basin, especially during the wet season, and to focus on the erosion risks in the midstream and downstream regions by implementing appropriate soil and water conservation measures. Additionally, the potential effects of temperature and altitude should be taken into account. A holistic approach that considers multiple factors is essential to maintaining the ecological balance of the basin and ensuring the sustainable use of soil and water resources. The findings of this study are significant for advancing our understanding of soil erosion mechanisms in plateau regions, predicting soil erosion trends, and developing effective conservation strategies. However, given the limitations of relying on a single data source, future research should integrate multi-source data to further examine the interactions between extreme rainfall and factors such as topography, soil type, and vegetation cover. This would enable a more comprehensive and accurate understanding of soil erosion processes. Moreover, the impact of climate change on rainfall patterns and erosion processes should be considered to better predict future soil erosion trends and to provide scientific support for climate change adaptation strategies.

Author Contributions

Conceptualization, Q.B.; methodology, Q.B. and L.W.; formal analysis, Q.B.; data curation, Q.B. and Y.C.; writing—original draft preparation, Q.B. All authors have read and agreed to the published version of the manuscript.

Funding

This research was funded by the Open Research Fund from the Research Center of Civil, Hydraulic, and Power Engineering of Xizang, grant number XZA202305CHP2010B; Central Support to Local Projects in Xizang, grant number XZ202301YD0044C.

Institutional Review Board Statement

Not applicable.

Informed Consent Statement

Not applicable.

Data Availability Statement

Data is contained within the article.

Acknowledgments

In this study, the authors express sincere gratitude for the data sharing of the utilized dataset. Furthermore, the authors deeply appreciate the professional insights provided by the editors and anonymous reviewers.

Conflicts of Interest

The authors declare no conflicts of interest.

References

  1. Sun, W.; Shao, Q.; Liu, J. Soil erosion and its response to the changes of precipitation and vegetation cover on the Loess Plateau. J. Geogr. Sci. 2013, 23, 1091–1106. [Google Scholar] [CrossRef]
  2. Wuepper, D.; Borrelli, P.; Finger, R. Countries and the global rate of soil erosion. Nat. Sustain. 2020, 3, 51–55. [Google Scholar] [CrossRef]
  3. Owens, P.N. Soil erosion and sediment dynamics in the Anthropocene: A review of human impacts during a period of rapid global environmental change. J. Soils Sediments 2020, 20, 4115–4143. [Google Scholar] [CrossRef]
  4. Panagos, P.; Borrelli, P.; Poesen, J.; Ballabio, C.; Lugato, E.; Meusburger, K.; Montanarella, L.; Alewell, C. The new assessment of soil loss by water erosion in Europe. Environ. Sci. Policy 2015, 54, 438–447. [Google Scholar] [CrossRef]
  5. Tsitsagi, M.; Berdzenishvili, A.; Gugeshashvili, M. Spatial and temporal variations of rainfall-runoff erosivity (R) factor in Kakheti, Georgia. Ann. Agrar. Sci. 2018, 16, 226–235. [Google Scholar] [CrossRef]
  6. Jian, Z.; Rong, L.I. Soil Erosion and Subarea Characteristics in Yarlung Tsangpo River Basin. J. Yangtze River Sci. Res. Inst. 2008, 25, 42–45. [Google Scholar]
  7. Chen, Y.; Xu, M.; Wang, Z.; Gao, P.; Lai, C. Applicability of two satellite-based precipitation products for assessing rainfall erosivity in China. Sci. Total Environ. 2021, 757, 143975. [Google Scholar] [CrossRef]
  8. Lukić, T.; Micić Ponjiger, T.; Basarin, B.; Sakulski, D.; Gavrilov, M.; Marković, S.; Zorn, M.; Komac, B.; Milanović, M.; Pavić, D.; et al. Application of Angot precipitation index in the assessment of rainfall erosivity: Vojvodina Region case study (North Serbia). Acta Geogr. Slov. 2021, 61, 123–153. [Google Scholar] [CrossRef]
  9. Boardman, J. Communicating soil erosion in the UK: How should we present extreme events? Geogr. J. 2023, 190, e12554. [Google Scholar] [CrossRef]
  10. Lai, C.; Chen, X.; Wang, Z.; Wu, X.; Zhao, S.; Wu, X.; Bai, W. Spatio-temporal variation in rainfall erosivity during 1960–2012 in the Pearl River Basin, China. Catena 2016, 137, 382–391. [Google Scholar] [CrossRef]
  11. Cook, H.L. The Nature and Controlling Variables of the Water Erosion Process. Soil Sci. Soc. Am. J. 1937, 1, 487–494. [Google Scholar] [CrossRef]
  12. Wischmeier, W.H. Predicting rainfall erosion losses-a guide to conservation planning. In Agriculture Handbook; U.S. Department of Agriculture: Washington, DC, USA, 1978; p. 537. [Google Scholar]
  13. Liang, X.; Zhang, L.; He, S.; Song, K.; Zheng, Z. Characteristics and Projection of Rainfall Erosivity Distribution in the Hengduan Mountains. Land 2023, 12, 1435. [Google Scholar] [CrossRef]
  14. Sakhraoui, F.; Hasbaia, M. Evaluation of the sensitivity of the RUSLE erosion model to rainfall erosivity: A case study of the Ksob watershed in central Algeria. Water Supply 2023, 23, 3262–3284. [Google Scholar] [CrossRef]
  15. Fenta, A.A.; Tsunekawa, A.; Haregeweyn, N.; Yasuda, H.; Tsubo, M.; Borrelli, P.; Kawai, T.; Sewale Belay, A.; Ebabu, K.; Liyew Berihun, M.; et al. Improving satellite-based global rainfall erosivity estimates through merging with gauge data. J. Hydrol. 2023, 620, 129555. [Google Scholar] [CrossRef]
  16. Panagos, P.; Borrelli, P.; Matthews, F.; Liakos, L.; Bezak, N.; Diodato, N.; Ballabio, C. Global rainfall erosivity projections for 2050 and 2070. J. Hydrol. 2022, 610, 127865. [Google Scholar] [CrossRef]
  17. Panagos, P.; Hengl, T.; Wheeler, I.; Marcinkowski, P.; Rukeza, M.B.; Yu, B.; Yang, J.E.; Miao, C.; Chattopadhyay, N.; Sadeghi, S.H.; et al. Global rainfall erosivity database (GloREDa) and monthly R-factor data at 1 km spatial resolution. Data Brief 2023, 50, 109482. [Google Scholar] [CrossRef]
  18. Wang, L.; Li, Y.; Gan, Y.; Zhao, L.; Qin, W.; Ding, L. Rainfall erosivity index for monitoring global soil erosion. Catena 2024, 234, 107593. [Google Scholar] [CrossRef]
  19. Padulano, R.; Santini, M.; Mancini, M.; Stojiljkovic, M.; Rianna, G. Monthly to seasonal rainfall erosivity over Italy: Current assessment by empirical model and future projections by EURO-CORDEX ensemble. Catena 2023, 223, 106943. [Google Scholar] [CrossRef]
  20. de Sousa Teixeira, D.B.; Cecilio, R.A.; Moreira, M.C.; Pires, G.F.; Fernandes Filho, E.I. Assessment, regionalization, and modeling rainfall erosivity over Brazil: Findings from a large national database. Sci. Total Environ. 2023, 891, 164557. [Google Scholar] [CrossRef]
  21. Johannsen, L.L.; Schmaltz, E.M.; Mitrovits, O.; Klik, A.; Smoliner, W.; Wang, S.; Strauss, P. An update of the spatial and temporal variability of rainfall erosivity (R-factor) for the main agricultural production zones of Austria. Catena 2022, 215, 106305. [Google Scholar] [CrossRef]
  22. Padulano, R.; Rianna, G.; Santini, M. Datasets and approaches for the estimation of rainfall erosivity over Italy: A comprehensive comparison study and a new method. J. Hydrol. Reg. Stud. 2021, 34, 100788. [Google Scholar] [CrossRef]
  23. Pidoto, R.; Bezak, N.; Müller-Thomy, H.; Shehu, B.; Callau-Beyer, A.C.; Zabret, K.; Haberlandt, U. Comparison of rainfall generators with regionalisation for the estimation of rainfall erosivity at ungauged sites. Earth Surf. Dyn. 2022, 10, 851–863. [Google Scholar] [CrossRef]
  24. da Silva, R.M.; Santos, C.A.G.; da Costa Silva, J.F.C.B.; Silva, A.M.; Brasil Neto, R.M. Spatial distribution and estimation of rainfall trends and erosivity in the Epitácio Pessoa reservoir catchment, Paraíba, Brazil. Nat. Hazards 2020, 102, 829–849. [Google Scholar] [CrossRef]
  25. Li, Y.; He, Y.; Zhang, Y.; Jia, L. Spatiotemporal evolutionary analysis of rainfall erosivity during 1901–2017 in Beijing, China. Environ. Sci. Pollut. Res. Int. 2022, 29, 2510–2522. [Google Scholar] [CrossRef]
  26. Wang, W.; Yin, S.; He, Z.; Chen, D.; Wang, H.; Klik, A. Projections of rainfall erosivity in climate change scenarios for mainland China. Catena 2023, 232, 107391. [Google Scholar] [CrossRef]
  27. Zhou, J.; Bao, Y.H.; He, X.B.; Wen, A.B.; Jiang, G.Y.; Long, Y.; Li, J.L. Risk analysis of rainfall erosion on upland adjacent to riparian zone of the Three Gorges Reservoir. Catena 2023, 232, 107458. [Google Scholar] [CrossRef]
  28. Jiang, G.; Lv, J.; He, X.; Bao, Y. Influence of reservoir impoundment on rainfall erosivity in the Three Gorges Reservoir region of China. Hydrol. Res. 2022, 53, 1357–1371. [Google Scholar] [CrossRef]
  29. Zhang, Y.; Zhang, Y.; Shi, F.; Li, M. Temporal and Spatial Variation of Rainfall Erosivity in Middle Reaches of Yellow River Based on Different Models. Bull. Soil Water Conserv. 2023, 43, 220–229+238. [Google Scholar] [CrossRef]
  30. Chen, Y.; Ding, M.; Zhang, G.; Duan, X.; Wang, C. The possible role of fused precipitation data in detection of the spatiotemporal pattern of rainfall erosivity over the Tibetan Plateau, China. Catena 2023, 228, 107114. [Google Scholar] [CrossRef]
  31. Chen, Y.; Duan, X.; Zhang, G.; Ding, M.; Lu, S. Rainfall erosivity estimation over the Tibetan plateau based on high spatial-temporal resolution rainfall records. Int. Soil Water Conserv. Res. 2022, 10, 422–432. [Google Scholar] [CrossRef]
  32. Zeng, W.; Ding, X.; Sun, W.; Mu, X. Improvement of satellite-based rainfall product CHIRPS in estimating rainfall erosivity on the Loess Plateau. Land Degrad. Dev. 2023, 34, 4517–4528. [Google Scholar] [CrossRef]
  33. Dai, W.; Zeng, Y.; Jing, T.; Wang, Z.; Zong, R.; Ni, L.; Fang, N. Estimation of rainfall erosivity on the Chinese Loess Plateau: A new combination of the ERA5 dataset and machine learning. J. Hydrol. 2023, 624, 129892. [Google Scholar] [CrossRef]
  34. Li, X.; Wang, X.; Gu, J.; Sun, C.; Zhao, H.; You, S. Temporal and Spatial Variation in Rainfall Erosivity in the Rolling Hilly Region of Northeast China. Agronomy 2023, 13, 2877. [Google Scholar] [CrossRef]
  35. Yin, B.; Xie, Y.; Liu, B.; Liu, B. Rainfall Erosivity Mapping for Tibetan Plateau Using High-Resolution Temporal and Spatial Precipitation Datasets for the Third Pole. Remote Sens. 2023, 15, 5267. [Google Scholar] [CrossRef]
  36. Lu, S.J.; Chen, Y.L.; Duan, X.W.; Yin, S.Q. Rainfall erosivity estimation models for the Tibetan Plateau. Catena 2023, 229, 107186. [Google Scholar] [CrossRef]
  37. Xiong, L.; Liu, C.; Chen, S.; Zha, X.; Ma, Q. Review of post-processing research for remote-sensing precipitation products. Adv. Water Sci. 2021, 32, 627–637. [Google Scholar] [CrossRef]
  38. Meng, X.; Zhang, X.; Yang, M.; Wang, H.; Chen, J.; Pan, Z.; Wu, Y. Application and Evaluation of the China Meteorological Assimilation Driving Datasets for the SWAT Model (CMADS) in Poorly Gauged Regions in Western China. Water 2019, 11, 2171. [Google Scholar] [CrossRef]
  39. Meng, X.; Wang, H.; Shi, C.; Wu, Y.; Ji, X. Establishment and Evaluation of the China Meteorological Assimilation Driving Datasets for the SWAT Model (CMADS). Water 2018, 10, 1555. [Google Scholar] [CrossRef]
  40. Meng, X.; Wang, H.; Chen, J.; Yang, M.; Pan, Z. High-resolution simulation and validation of soil moisture in the arid region of Northwest China. Sci. Rep. 2019, 9, 17227. [Google Scholar] [CrossRef]
  41. Zhang, L.; Meng, X.; Wang, H.; Yang, M.; Cai, S. Investigate the Applicability of CMADS and CFSR Reanalysis in Northeast China. Water 2020, 12, 996. [Google Scholar] [CrossRef]
  42. Meng, X.; Wang, H.; Wu, Y.; Long, A.; Wang, J.; Shi, C.; Ji, X. Investigating spatiotemporal changes of the land-surface processes in Xinjiang using high-resolution CLM3.5 and CLDAS: Soil temperature. Sci. Rep. 2017, 7, 13286. [Google Scholar] [CrossRef] [PubMed]
  43. Meng, X.; Wang, H.; Chen, J. Profound Impacts of the China Meteorological Assimilation Driving Datasets for the SWAT Model (CMADS). Water 2019, 11, 832. [Google Scholar] [CrossRef]
  44. Meng, X.; Wang, H. Significance of the China Meteorological Assimilation Driving Datasets for the SWAT Model (CMADS) of East Asia. Water 2017, 9, 765. [Google Scholar] [CrossRef]
  45. Renard, K.G.; Freimund, J.R. Using monthly precipitation data to estimate the R-factor in the revised USLE. J. Hydrol. 1994, 157, 287–306. [Google Scholar] [CrossRef]
  46. Brychta, J.; Podhrázská, J.; Šťastná, M. Review of methods of spatio-temporal evaluation of rainfall erosivity and their correct application. Catena 2022, 217, 106454. [Google Scholar] [CrossRef]
  47. Li, J. Hourly station-based precipitation characteristics over the Tibetan Plateau. Int. J. Climatol. 2018, 38, 1560–1570. [Google Scholar] [CrossRef]
  48. Zhang, W.; Fu, J. Rainfall erosivity estimation under different rainfall amounts. Resour. Sci. 2003, 25, 35–41. [Google Scholar]
  49. Cui, Y.; Pan, C.; Liu, C.; Luo, M.; Guo, Y. Spatiotemporal variation and tendency analysis on rainfall erosivity in the Loess Plateau of China. Hydrol. Res. 2020, 51, 1048–1062. [Google Scholar] [CrossRef]
  50. Cui, B.; Zhang, Y.; Liu, L.; Xu, Z.; Wang, Z.; Gu, C.; Wei, B.; Gong, D. Spatiotemporal Variation in Rainfall Erosivity and Correlation with the ENSO on the Tibetan Plateau since 1971. Int. J. Environ. Res. Public Health 2021, 18, 11054. [Google Scholar] [CrossRef] [PubMed]
  51. Achite, M.; Katipoğlu, O.M.; Javari, M.; Caloiero, T. Hybrid interpolation approach for estimating the spatial variation of annual precipitation in the Macta basin, Algeria. Theor. Appl. Climatol. 2023, 155, 1139–1166. [Google Scholar] [CrossRef]
  52. Gharnouki, I.; Aouissi, J.; Benabdallah, S.; Tramblay, Y. Assessing the variability of satellite and reanalysis rainfall products over a semiarid catchment in Tunisia. Acta Geophys. 2024, 72, 1257–1273. [Google Scholar] [CrossRef]
  53. Alifujiang, Y.; Abuduwaili, J.; Samat, A.; Feng, P.; Jiang, Y. Concentration and correlation analysis of hydro-meteorological factors in the northern sub-basin of Lake Issyk-Kul in Central Asia. Ecol. Indic. 2024, 158, 111465. [Google Scholar] [CrossRef]
  54. Liu, H.; Li, X.; Yao, Z. Rainfall Erosivity in Yarlung Zangbo River Basin during 1961–2015. J. Desert Res. 2019, 39, 166–176. [Google Scholar]
  55. Liang, Y.; Shen, R.; Shi, C.; Xing, Y.; Sun, S. Rainfall erosivity in China based on CLDAS fusion precipitation. Arid Land Geogr. 2022, 45, 1333–1346. [Google Scholar] [CrossRef]
  56. Tian, X.; Li, F.; He, X.; Wan, X.; Lü, X.; Fang, L.; Yu, Q. Study on Daily Erosive Rainfall Standard in the Poyang Lake Basin. J. Soil Water Conserv. 2021, 35, 185–189. [Google Scholar] [CrossRef]
  57. Brychta, J.; Janeček, M. Determination of erosion rainfall criteria based on natural rainfall measurement and its impact on spatial distribution of rainfall erosivity in the Czech Republic. Soil Water Res. 2019, 14, 153–162. [Google Scholar] [CrossRef]
  58. Zhang, M.; Ren, Q.; Wei, X.; Wang, J.; Yang, X.; Jiang, Z. Climate change, glacier melting and streamflow in the Niyang River Basin, Southeast Tibet, China. Ecohydrology 2011, 4, 288–298. [Google Scholar] [CrossRef]
  59. Wang, J.; Li, Y.; Wu, J. Precipitation anomalies over Qinghai-Tibet Plateau during Bay of Bengal Storm double-peak periods. Theor. Appl. Climatol. 2024, 155, 3133–3146. [Google Scholar] [CrossRef]
  60. Sun, H.; Su, F.; Huang, J.; Yao, T.; Luo, Y.; Chen, D. Contrasting precipitation gradient characteristics between westerlies and monsoon dominated upstream river basins in the Third Pole. Chin. Sci. Bull. 2020, 65, 91–104. [Google Scholar] [CrossRef]
  61. Miao, W.; Liu, S.; Zhu, Y.; Duan, S.; Han, F. Spatio-temporal differentiation and altitude dependence of temperature and precipitation in Meili Snow Mountains. Progress. Inquisitiones Mutat. Clim. 2022, 18, 328–342. [Google Scholar]
Figure 1. Geographic location of the Niyang River Basin and bar chart of the regional distribution of D p 12 , P d 12 , and P y 12 . (a) Location of China; (b) location of Xizang, ① Nyenchen Tanglha Mountains, ② Guokarla Range; (c) location of the Niyang River Basin; (d) bar chart of the regional distribution of D p 12 , P d 12 , and P y 12 . D p 12 :   erosive rainfall days; P d 12 :   average daily erosive rainfall; P y 12 : average annual erosive rainfall.
Atmosphere 15 01032 g001
Figure 2. Three-dimensional modeling of erosive rainfall as a percentage of total days for the entire study period 2008–2018.
Atmosphere 15 01032 g002
Figure 3. Values of rainfall erosivity model parameters α, β, and temporal distribution of precipitation, erosive precipitation, and rainfall erosivity in the Niyang River Basin, 2008–2016. (a) Values of rainfall erosion modeling parameters α and β for each station. (b) Monthly distribution of precipitation, erosive precipitation, and rainfall erosivity in the Niyang River Basin. (c) Seasonal distribution of rainfall erosivity, precipitation, and erosive precipitation in the Niyang River Basin; from June to September marks the wet season, while October to May constitutes the dry season. The amounts of rainfall, erosive rainfall, and rainfall erosion rates are displayed on a vertical box plot. From bottom to top, the plot represents the minimum value, lower quartile, median, upper quartile, and maximum value. (d) Intra-annual spatial distribution of precipitation, erosive precipitation, and rainfall erosivity in the Niyang River basin.
Atmosphere 15 01032 g003
Figure 4. Spatial variation trend of precipitation, erosive precipitation, and rainfall erosivity across the Niyang River Basin from 2008 to 2016 and multi-year average spatial variation trend. RE: rainfall erosivity; Pre: precipitation. (ai) show the spatial distribution of rainfall erosivity for each year from 2008 to 2016; (j) displays how average annual rainfall erosivity is distributed; (k) depicts the average annual precipitation distribution.
Atmosphere 15 01032 g004
Figure 5. Monthly spatial variation in rainfall erosivity across the Niang River Basin. (al) show the spatial distribution of rainfall erosivity for each month from January to December.
Atmosphere 15 01032 g005
Figure 6. The geographical variation in rainfall erosivity across the Niyang River Basin is illustrated across spring (a), summer (b), autumn (c), winter (d), the wet season (e), and the dry season (f).
Atmosphere 15 01032 g006
Figure 7. Heat map of rainfall erosivity (RE), precipitation (Pre), erosive precipitation (E-Pre), dry-season precipitation (Pre10-5), wet-season precipitation (Pre6-9), air temperature (TEM), and elevation (EL) correlation. “***” signifies statistical significance at p < 0.05, whereas “****” indicates significance at p < 0.001. Numbers represent ρ (rho): Spearman’s rank correlation coefficient.
Atmosphere 15 01032 g007
Figure 8. Linear regression plots of monthly rainfall erosivity and precipitation (monthly precipitation measured in mm and monthly rainfall erosivity expressed as MJ · m m · h m 2 · h 1 ) in the Niyang River Basin from 2008 to 2016. Orange scatters are monthly rainfall erosivity and precipitation values at each site, red straight lines are fitted regression lines, and gray areas are confidence intervals. Rho: Spearman’s rank correlation coefficient. P: Indicator for determining the statistical significance of the model. R2: Expresses the extent to which the independent variable accounts for the variability in the dependent variable.
Atmosphere 15 01032 g008
Disclaimer/Publisher’s Note: The statements, opinions and data contained in all publications are solely those of the individual author(s) and contributor(s) and not of MDPI and/or the editor(s). MDPI and/or the editor(s) disclaim responsibility for any injury to people or property resulting from any ideas, methods, instructions or products referred to in the content.

