Article

Health Risk Assessment of Ambient Volatile Organic Compounds in a Border City in Canada

1
Department of Civil and Environmental Engineering, University of Windsor, Windsor, ON N9B 3P4, Canada
2
Environmental Monitoring and Reporting Branch, Ontario Ministry of the Environment, Conservation and Parks, Toronto, ON M9P 3V6, Canada
3
Technical Assessment and Standards Development Branch, Ontario Ministry of the Environment, Conservation and Parks, Toronto, ON M4V 1M2, Canada
*
Authors to whom correspondence should be addressed.
Atmosphere 2024, 15(9), 1038; https://doi.org/10.3390/atmos15091038
Submission received: 29 June 2024 / Revised: 15 August 2024 / Accepted: 22 August 2024 / Published: 28 August 2024
(This article belongs to the Special Issue Air Pollution Exposure and Health Impact Assessment (2nd Edition))

Abstract

:
This study characterizes cancer and non-cancer risks due to inhalation exposure to volatile organic compounds (VOCs) in a border city of Windsor in southern Ontario, Canada, using hourly ambient concentrations collected from 17 November 2021 to 17 March 2023. The total incremental lifetime cancer risk (CR) due to benzene and ethylbenzene is 4.33 × 10⁻⁶, which is in the acceptable risk range of 1 × 10⁻⁶ to 1 × 10⁻⁴ used by the USEPA. The CR was higher in winter (5.20 × 10⁻⁶), followed by fall (4.32 × 10⁻⁶), spring (3.86 × 10⁻⁶), and summer (2.96 × 10⁻⁶), all in the acceptable range. The total chronic non-cancer risk (Hazard Quotient, HQ) of inhalation exposure to 16 VOCs was 0.0488, with a higher value in fall (0.0571), followed by winter (0.0464), and lower in spring (0.0454) and summer (0.0451), all in the safe level of below HQ = 1 used by the USEPA. The hazard index (HI) by organs was higher for the nervous system (0.0213), followed by the hematologic system and immune system (0.0165 each), but much lower for the other five target organs, i.e., the liver/kidney (1.52 × 10⁻⁴), developmental system (3.38 × 10⁻⁴), endocrine system and urinary system (2.82 × 10⁻⁴ each), and respiratory system (9.70 × 10⁻⁵). Similar hour-of-day trends were observed in the total CR, total HQ, and HI by organs with higher values in the early morning hours of 5:00–8:00 and lower values during 12:00 to 15:00. Benzene was the major contributor to both total CR (89%) and total HQ (34%) due to its high toxicity and high concentrations. Benzene, toluene, ethylbenzene, and xylenes (BTEX) contributed 100% of the total CR and 51% of the total HQ. Further, BTEX is the sole contributor to the HI for the hematologic system and immune system and the major contributor to the HI for the nervous system (39%) and developmental system (55%). Higher cancer and non-cancer risks were associated with the airmass from the east, southeast, and southwest of Windsor.

Graphical Abstract

1. Introduction

Urban air pollution is a complex mixture of inorganic and organic compounds, among which volatile organic compounds (VOCs) are abundant in the urban environment with adverse effects on both human health and the environment [1]. VOCs are known as the main precursor for both O3 and secondary organic aerosol [2]. Major sources of VOCs include anthropogenic, mainly the combustion of fossil fuels and use of solvents, and biogenic sources, e.g., plants [3,4]. In urban environments, anthropogenic sources contribute more to the ambient VOC concentrations than biogenic emissions [5]. Epidemiological studies have shown that exposure to even trace levels of ambient VOCs can cause adverse health effects, both carcinogenic and non-carcinogenic, including leukemia, asthma, hematological diseases, irritation in the mucous membrane, physical weakness, nervous system impairment, difficulties in concentrating, and nausea [1]. Among VOCs, BTEX (benzene, toluene, ethylbenzene, and xylenes) compounds are of great concern due to their high concentrations in the urban environment, toxicity, and carcinogenicity. The International Agency for Research on Cancer (IARC), as part of the World Health Organization (WHO), and the US Environmental Protection Agency (USEPA) classify benzene as carcinogenic to humans [6,7]. The IARC and California Office of Environmental Health Hazard Assessment (OEHHA) have determined that ethylbenzene is a possible human carcinogen [6,8]. It is estimated that two in five Canadians will develop cancer in their lifetime, and one in four Canadians will die from cancer. In 2023, projected age-standardized incidence rates, i.e., the number of new cancer cases per 100,000 people, is 555 and 481 in Canada for males and females, respectively, with higher rates of 577 and 503 in Ontario for males and females, respectively. Ontario ranks third in cancer incidence rates among all the provinces and territories [9]. Thus, assessing human health risks due to exposure to ambient VOCs is essential for air quality management.
Many studies investigated levels of ambient VOCs in urban areas and the corresponding cancer and non-cancer risks by applying the USEPA’s risk assessment methods [10]. Studies on inhalation exposure to ambient VOCs in Seoul, South Korea [11], Duzce, Turkey [12], and Beijing, China [13] revealed cancer risks of 4.96 × 10⁻⁶ to 2 × 10⁻⁵, within the USEPA’s acceptable range of 1 × 10⁻⁶ to 1 × 10⁻⁴ used to assess air quality health effects [14]. The non-cancer risks were all in the safe level of less than an HQ = 1 [14]. A study of cancer and non-cancer risks of VOCs in Hefei, China [15] revealed that benzene was the predominant contributor to total cancer risks with a higher mean value of cancer risks compared with other investigated VOCs (i.e., 1,2-dichloroethane, chloroform, carbon tetrachloride, trichloroethylene, and dichloromethane). The total non-cancer risks in this study exceeded the safe level of <1, although the HQ by species were all at the safe level. A study of seasonal variability in cancer and non-cancer risks in Beijing, China [16] indicated that the highest cancer and non-cancer risks were observed in winter and fall compared to spring and summer. However, only a few such studies have been carried out in Western Canada. Three studies in Alberta, Canada, in Calgary, Edmonton, and the Athabasca oil sands region, included nine, 15, and three VOCs respectively, with benzene being one of them [4,17,18]. The total cancer risks in all three cities were within the range of acceptable risk. In a recent study of 2012–2016 data, cumulative cancer risks of 11 VOCs (including benzene) were 9.2 × 10⁻⁵ and 7.6 × 10⁻⁵ in Port Moody and Burnaby, British Columbia, respectively. The probabilities for cumulative cancer risks of those 11 VOCs exceeding the USEPA’s acceptable risk level of 1.0 × 10⁻⁴ [19] were 34% and 19% in Port Moody and Burnaby, respectively [20]. The HQs (Hazard Quotients) of all VOCs investigated were far below the safe level of 1 used by the USEPA (2000) in all four above-mentioned Canadian studies.
The city of Windsor is in southern Ontario, Canada, bordering Detroit Michigan, United States of America. Border crossing traffic across the Detroit River and local/regional industries lead to high concentrations of VOCs in Windsor [21,22,23]. The 2021 annual mean concentrations of benzene (0.53 µg/m3) and toluene (1.08 µg/m3) in Windsor were close to the average concentrations in Ontario for benzene (0.57 µg/m3) and toluene (1.15 µg/m3). However, these benzene concentrations are above the annual Ambient Air Quality Criteria (AAQC) of 0.45 µg/m3 [23]. The 2021 concentrations in Windsor were higher than the provincial averages for ethylbenzene (0.33 µg/m3 in Windsor vs. 0.23 µg/m3 in Ontario), m,p-xylene (0.62 µg/m3 vs. 0.47 µg/m3), and o-xylene (0.25 µg/m3 vs. 0.18 µg/m3) [23], suggesting significant contributions by local emissions and transboundary input. Despite relatively high VOCs concentrations in Windsor, there is a lack of recent studies on human health risks associated with ambient VOCs. Moreover, one of the shortcomings of previous health risk assessments is that they mostly relied on integrated measurements of ambient VOCs over 24 h [4,12,17,18,20,21,22,24], which provided limited information on diurnal variability. This study collected hourly VOC concentrations in a border city in southern Ontario, Canada by using a research-grade instrument. The seasonal means and averages in each hour-of-day (totaling 24) over the 16 months (November 2021 to March 2023) were calculated. By using this unique data set, the objectives of this study are to investigate (a) cancer and non-cancer human health risks due to exposure to ambient VOCs, (b) seasonal and diurnal variation in those risks, and (c) the directional distribution of cancer and non-cancer risks, thus to identify directions of airmass associated with higher risks. The novelty of this study is the use of hourly VOC concentrations measured continuously over the 16-month period to characterize the seasonal and diurnal variation of risks. The findings will help residents in Windsor better understand what VOC levels mean to their health, how the health risks vary diurnally and seasonally, and how the health risks are related to wind directions or potential source areas.

2. Materials and Methods

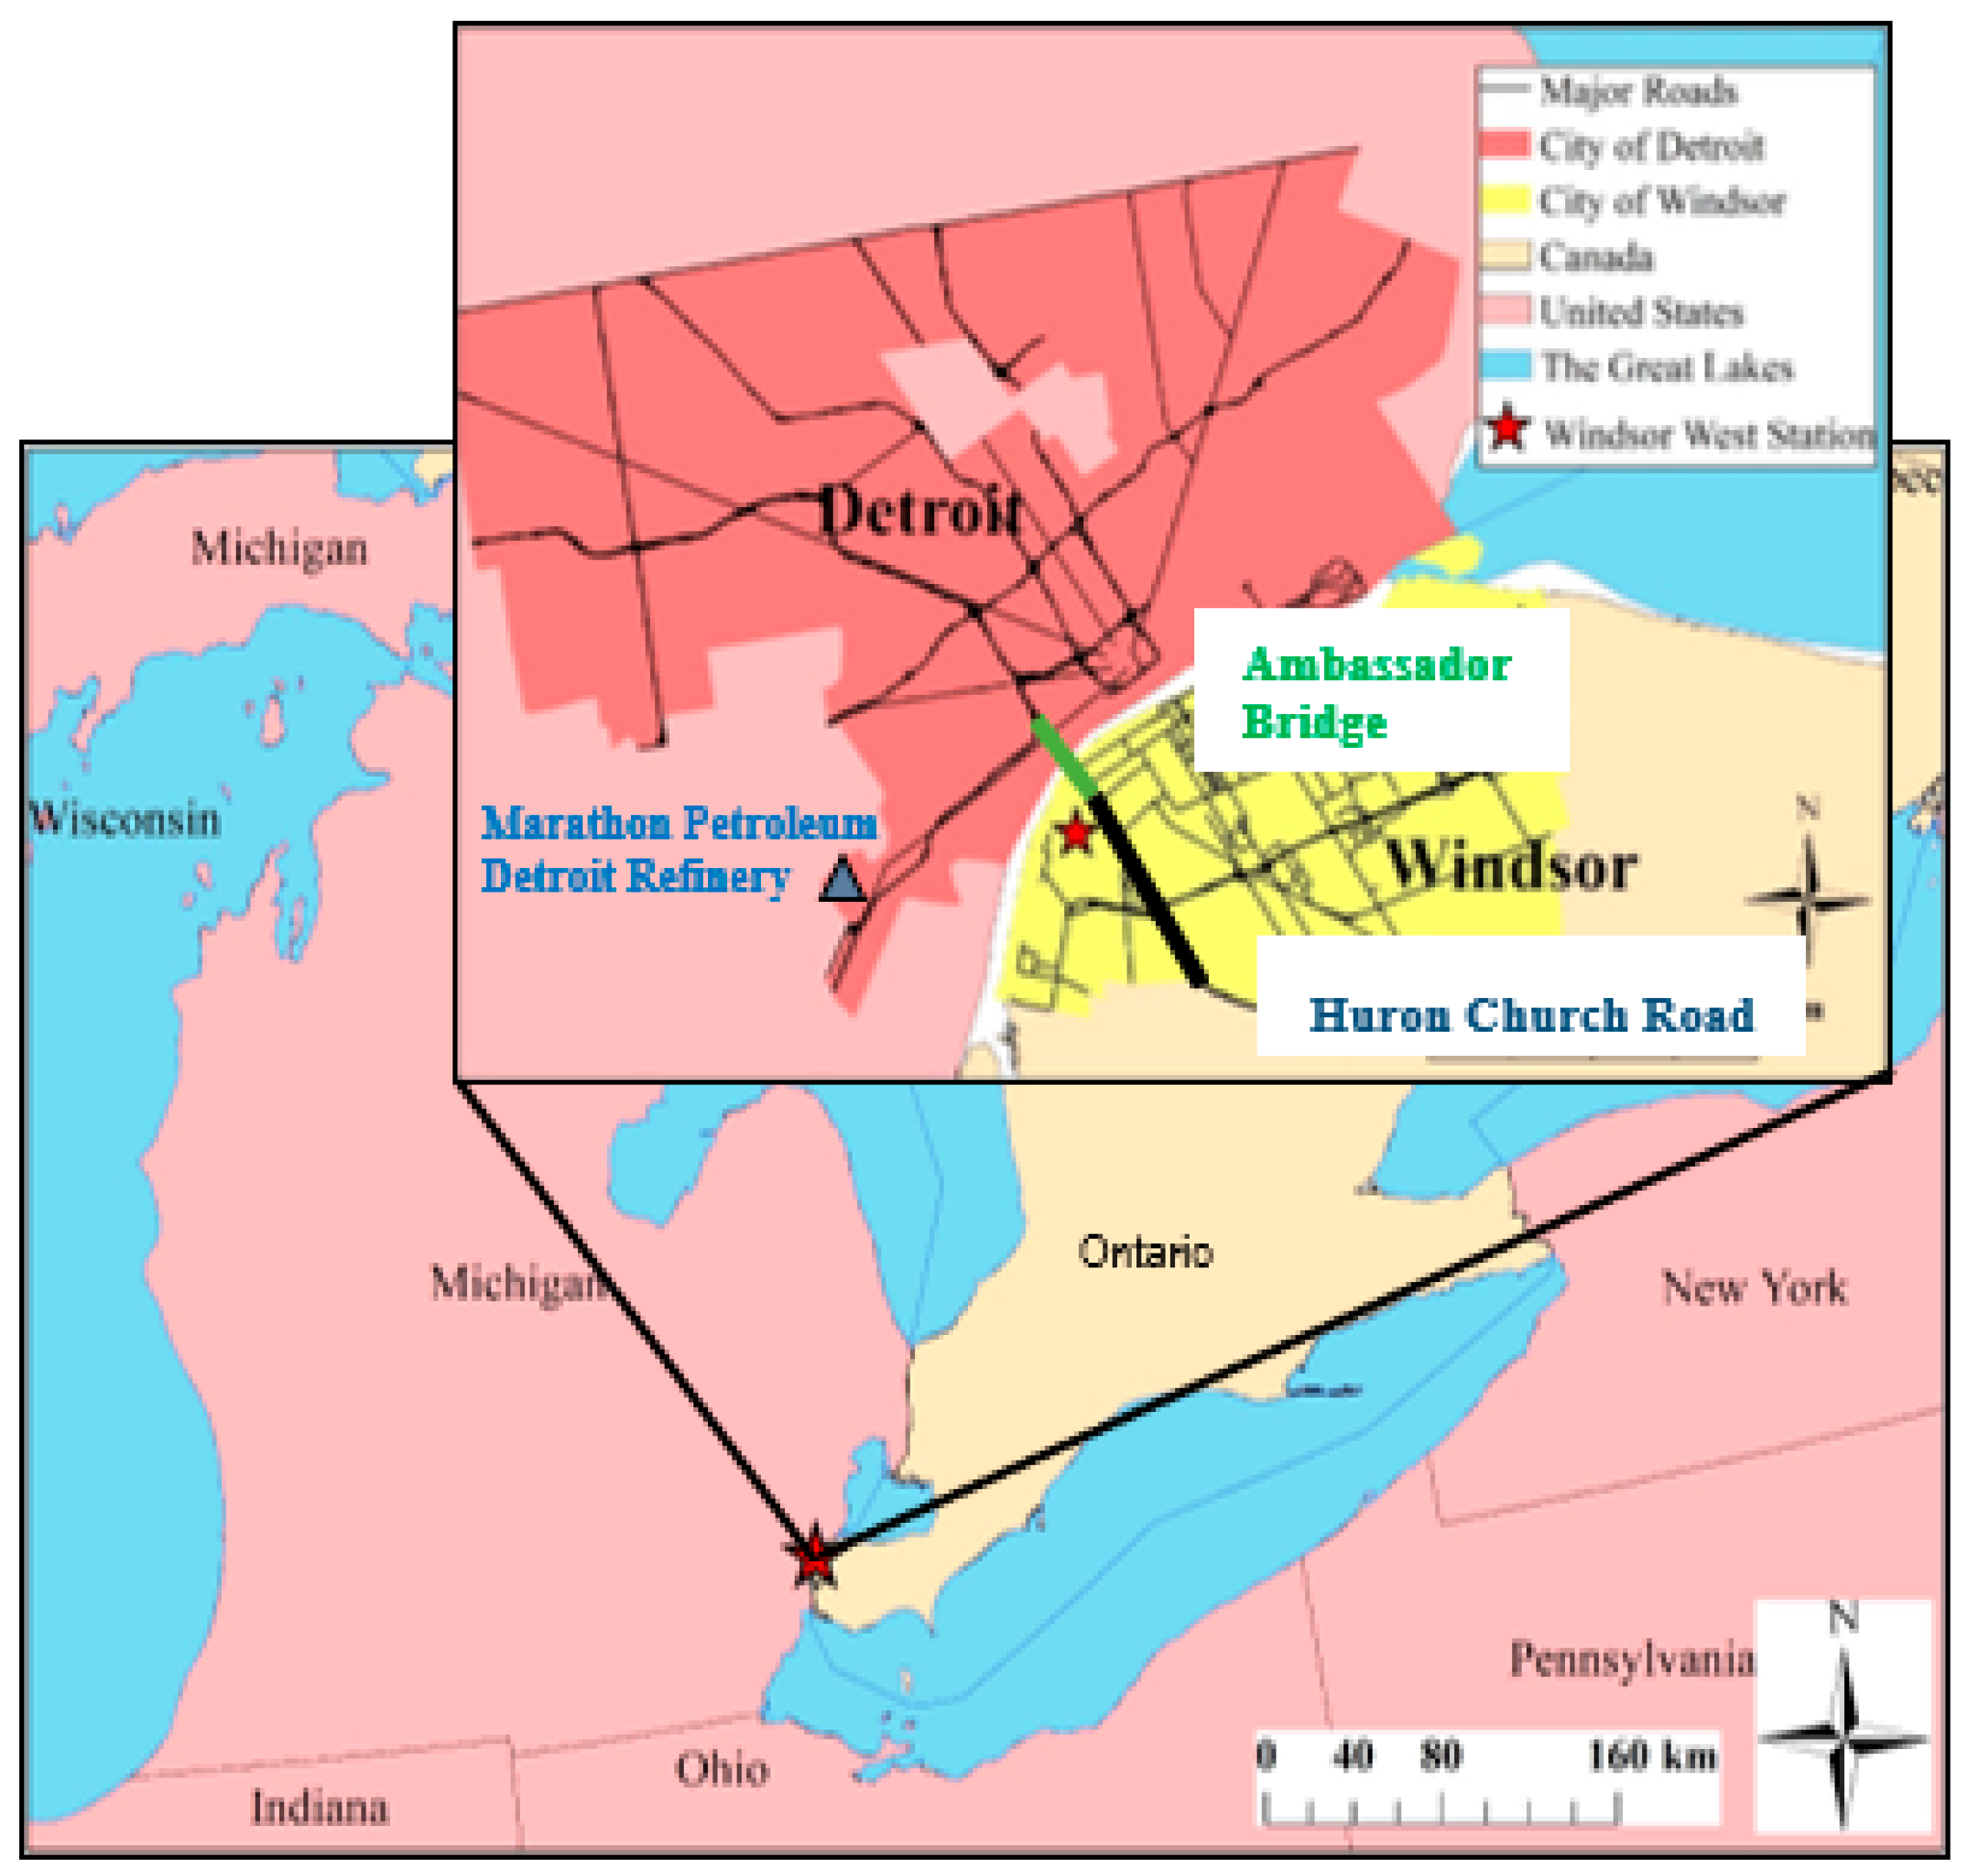
2.1. Data Collection

Hourly concentrations of 54 VOC species, wind speeds, and directions were collected from 17 November 2021 to 17 March 2023 at the Windsor West air quality monitoring station (42°17’34” N, 83°04′23″ W, Figure 1). The monitoring station is located in an urban setting and is not directly influenced by point sources. The VOC concentrations were monitored using the AMA Online Gas Chromatographs 5000 Series with flame ionization detection technology (AMA Instrument, Ulm, Germany). Wind speeds and directions were measured using a Vaisala Weather Transmitter WXT520 (Vaisala, Helsinki, Finland).

2.2. Data Processing

Of the 54 VOCs monitored, 16 were selected for the risk assessment based on the availability of toxicity data. They are n-hexane, cyclohexane, benzene, toluene, ethylbenzene, m,p-xylene, styrene, o-xylene, n-nonane, methylcyclohexane, 1,2,3-trimethylbenzene, 1,3,5-trimethylbenzene, 1,2,4-trimethylbenzene, propene, i-propylbenzene, and n-propylbenzene. The original data were screened for flags, which were then replaced with blanks. Concentration values less than method detection limits (MDLs) were replaced with MDLs (Table S1). The percentage of missing and flagged, below-MDL, and equal-to-or-above-MDL samples for the 16 VOCs are presented in Table S1. The general statistics of the hourly ambient VOC concentrations, wind speed, and directions were calculated, including the minimum, mean, median, maximum, standard deviation (SD), and coefficient of variation (CV = [SD/mean] × 100).

2.3. Cancer and Non-Cancer Human Health Risks

The cancer and non-cancer human health risks due to inhalation exposure to ambient VOCs were estimated assuming a lifetime exposure of 70 years. The incremental lifetime cancer risks (CRs) were calculated using the USEPA method (2009), as shown in Equation (1),
CR = IUR × AC
where AC is the measured ambient VOC concentration (µg/m3), and the inhalation unit risk (IUR) is the upper-bound excess lifetime cancer risk estimated to result from continuous inhalation exposure to an agent at a concentration of 1 µg/m3 in the atmosphere. Only benzene and ethylbenzene have available IUR values. CRs for those two compounds were calculated. The USEPA has established the range of generally acceptable risks for known or suspected carcinogens as 1 × 10⁻⁶ to 1 × 10⁻⁴. Risks less than 1 × 10⁻⁶ (one additional cancer in 1,000,000 individuals) generally are not of concern, whereas risk levels exceeding 1 × 10⁻⁴ (one additional cancer in 10,000 individuals) are usually considered unacceptable [19].
Following the USEPA (2009), the chronic non-cancer health risk due to inhalation exposure to hazardous air pollutants, defined as the Hazard Quotient (HQ), was estimated for each of the 16 VOCs using Equation (2):
HQ = AC/RfC
where RfC is the reference concentration (µg/m3), i.e., a continuous inhalation exposure that is likely to be without an appreciable risk of deleterious effects during a lifetime [25]. The RfC values and target organs of each VOC are in Table S2. Then, the hazard index (HI) for each of eight organs was calculated as the sum of the HQs for several VOCs that affect the same target organ [14]. Those eight organs are the nervous system, hematologic system, immune system, liver/kidney, developmental system, urinary system, endocrine system, and respiratory system. The HQ and HI are not expressed as a probability of an individual suffering an adverse effect. According to the USEPA (2000), an HQ or HI less than one indicates that adverse non-cancer effects are not likely to occur and therefore can be considered to have a negligible risk. When the HI or HQ is greater than one, the potential for adverse effects increases, and remedial actions should be considered.
The seasonal means and hour-of-day means of total CR, CR values for benzene and ethylbenzene, HQ values for 16 VOCs, and HI values for each target organ were calculated. The four seasons are winter (December, January, and February), spring (March, April, and May), summer (June, July, and August), and fall (September, October, and November). ANOVA and Tukey’s test were applied to identify statistically significant differences between the seasonal means. Directional distribution plots were generated with Grapher (Golden Software, LLC., Golden, CO, USA) using the hourly wind directions and calculated hourly risks.

3. Results and Discussion

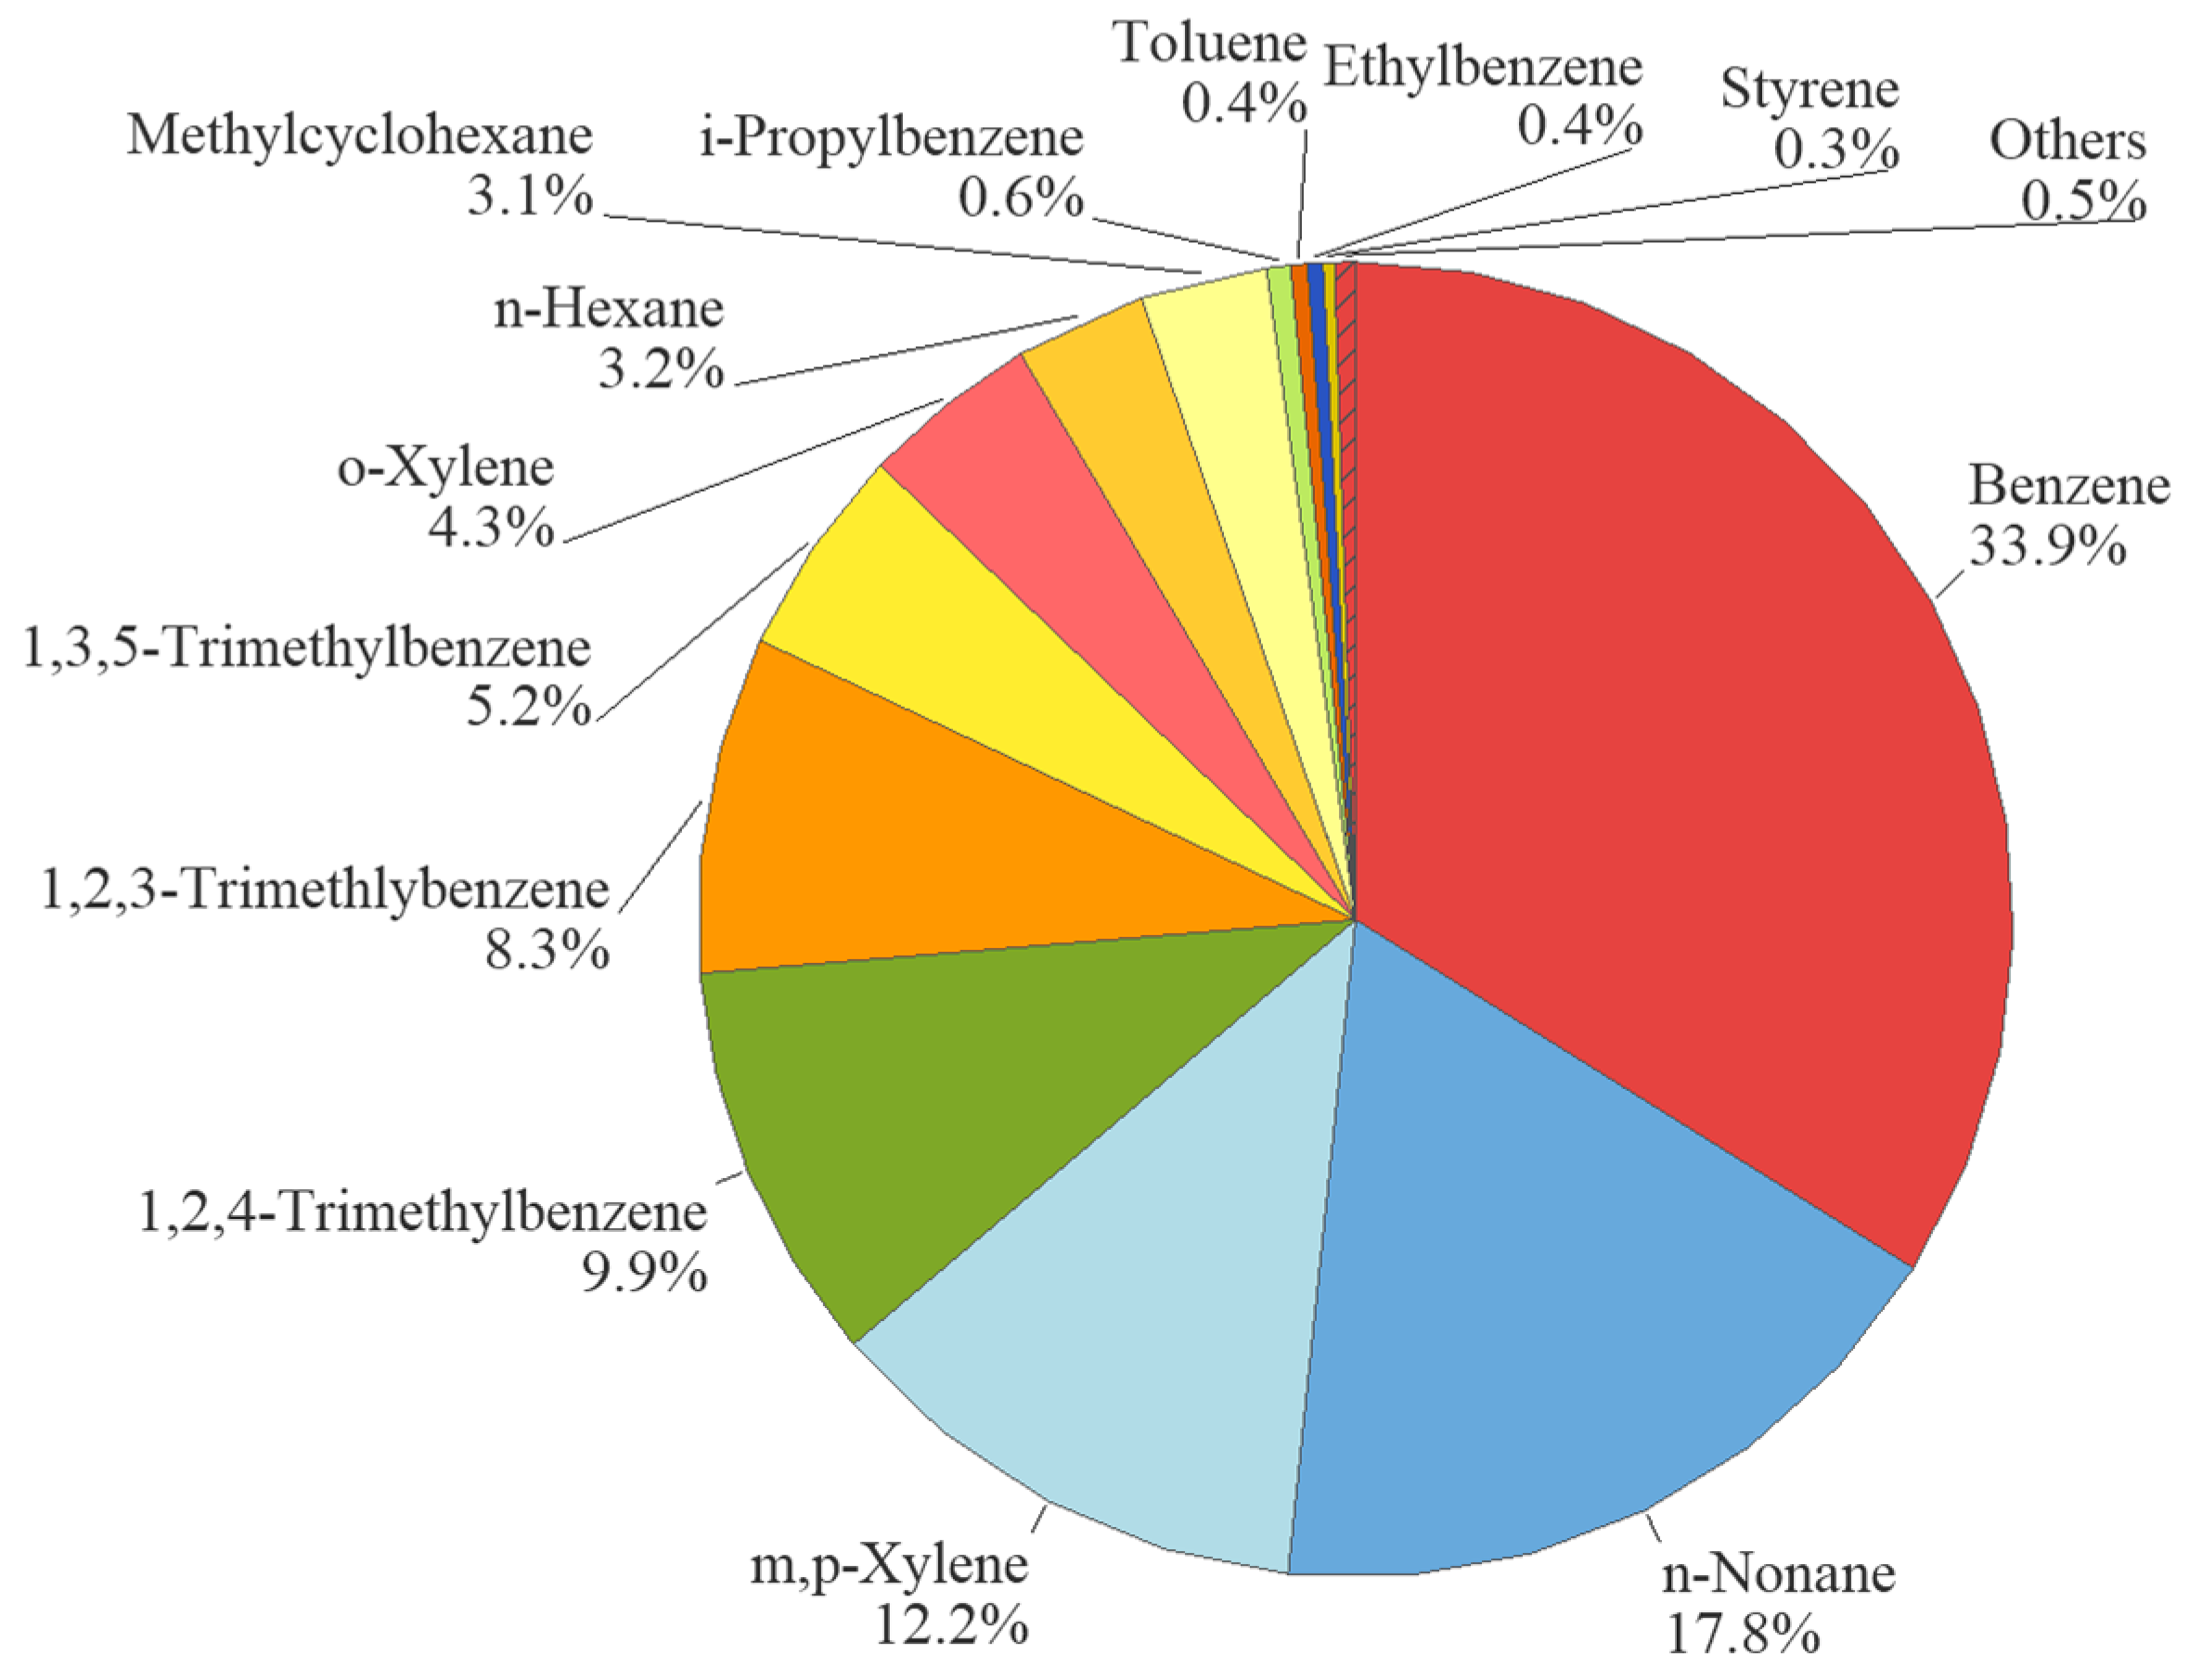
3.1. VOC Concentrations
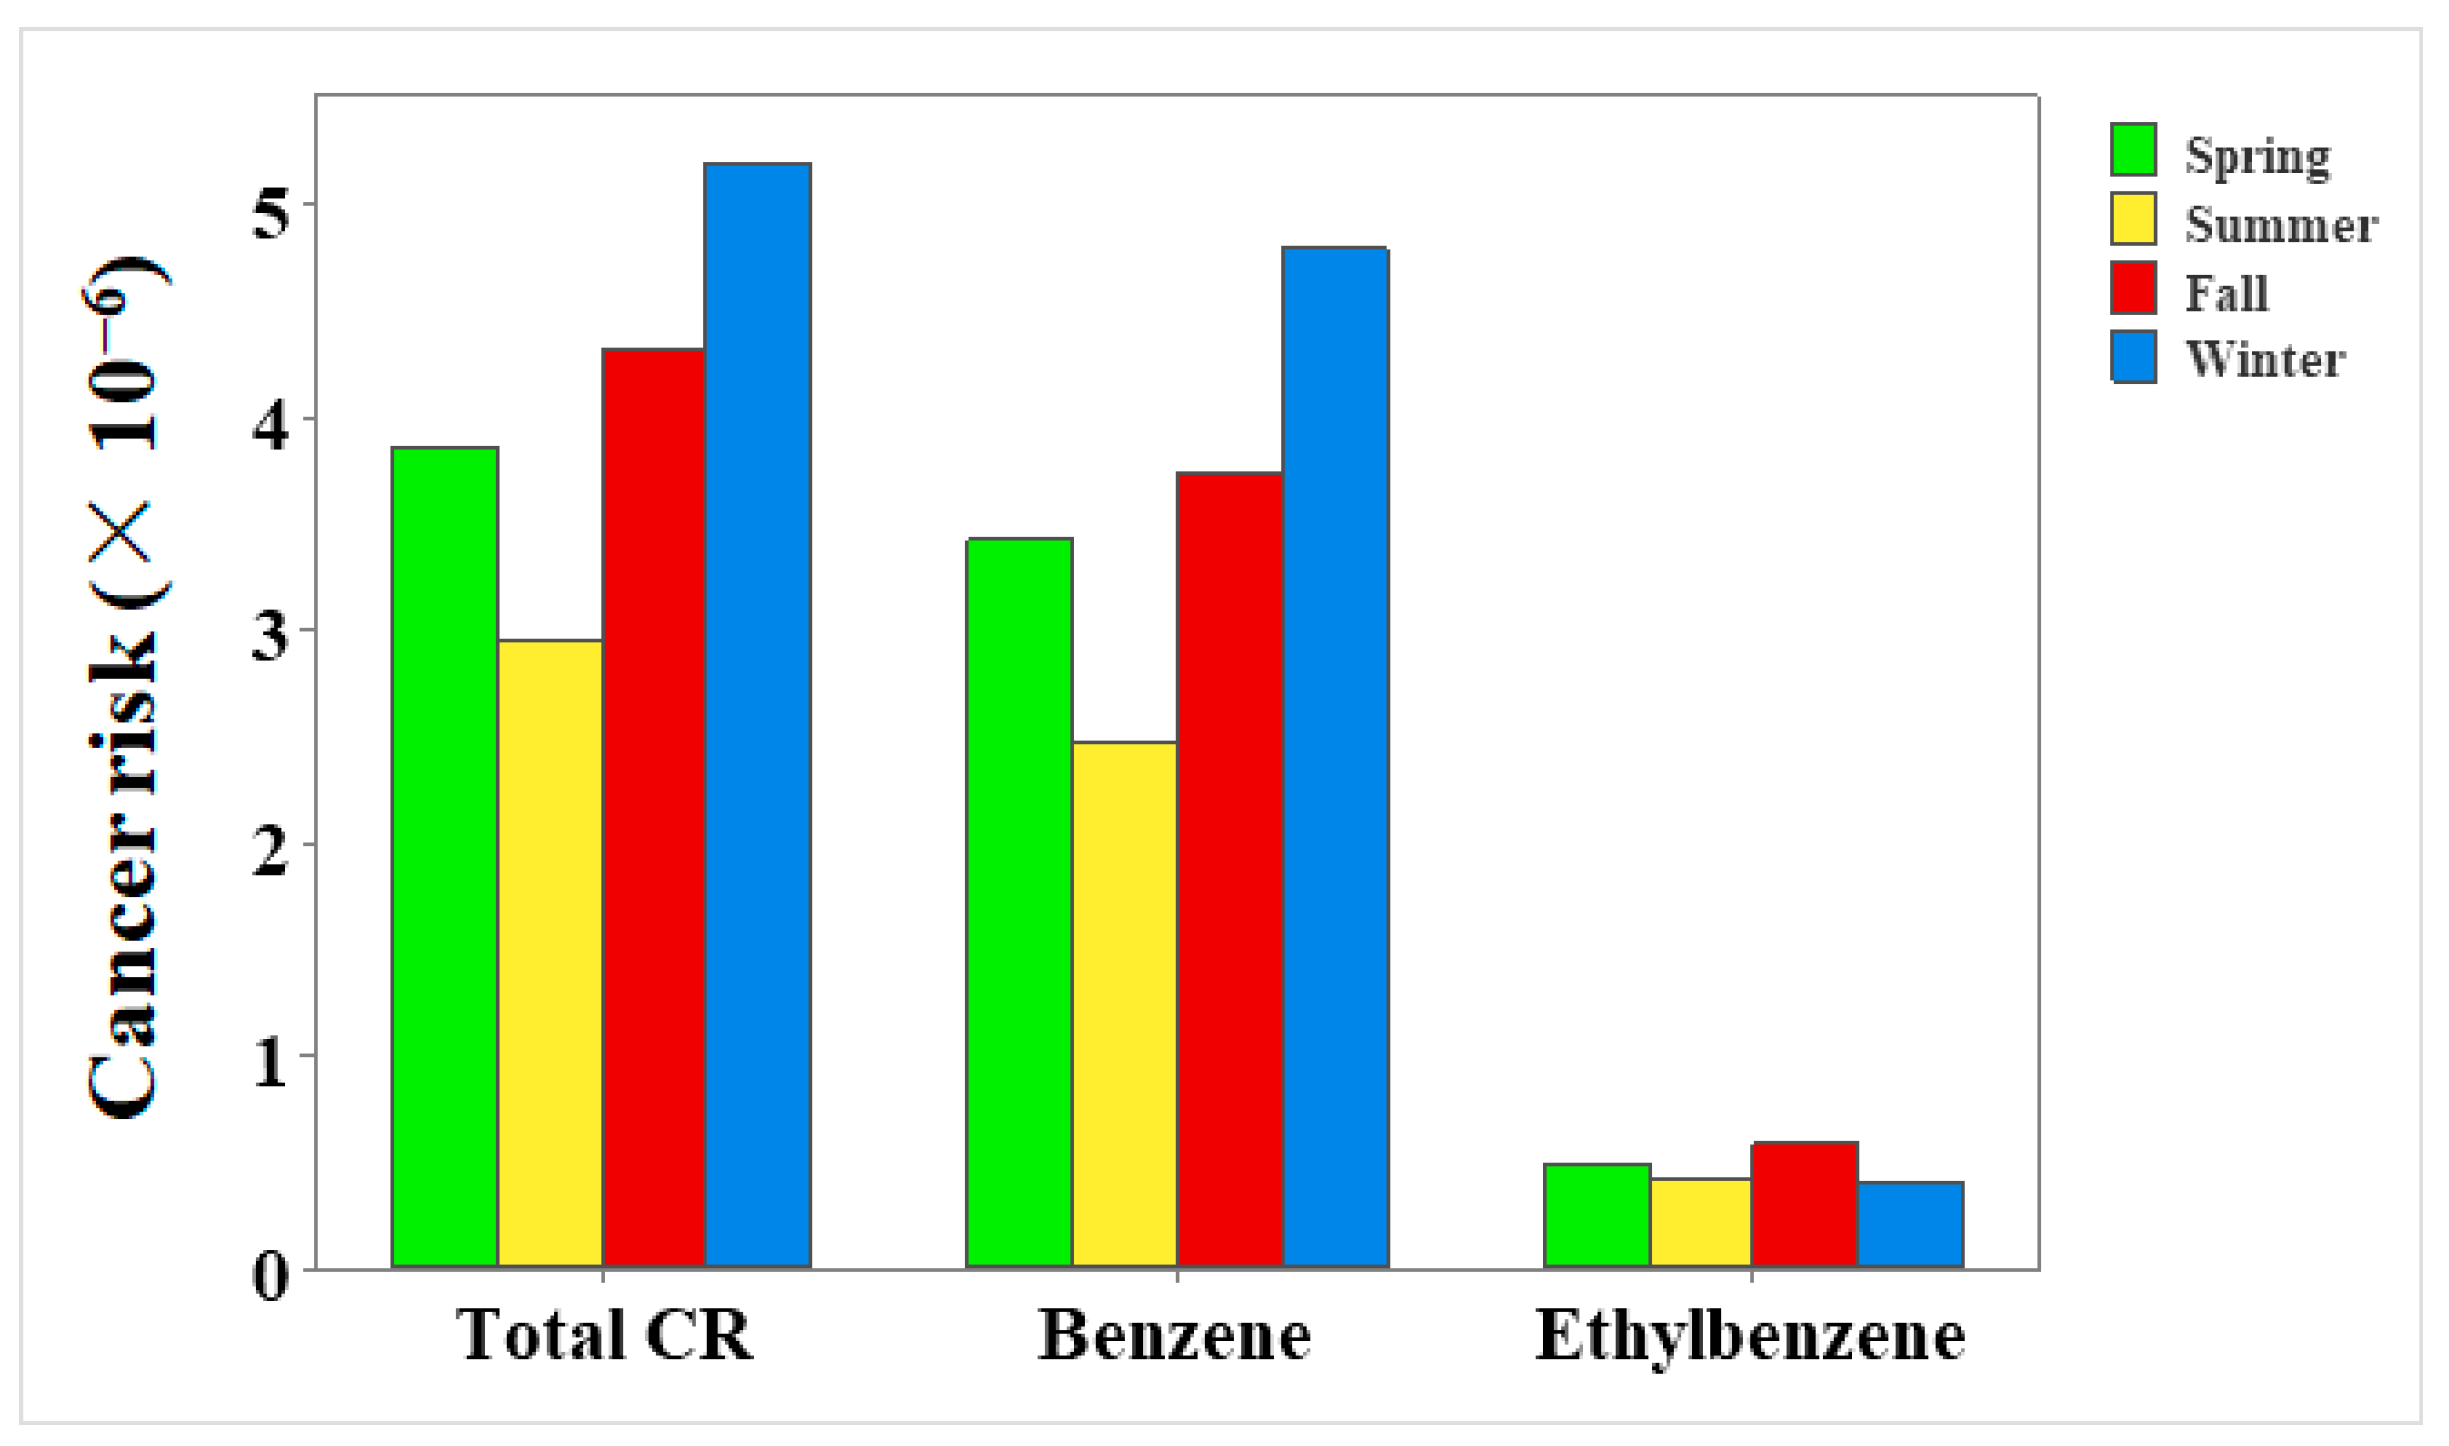
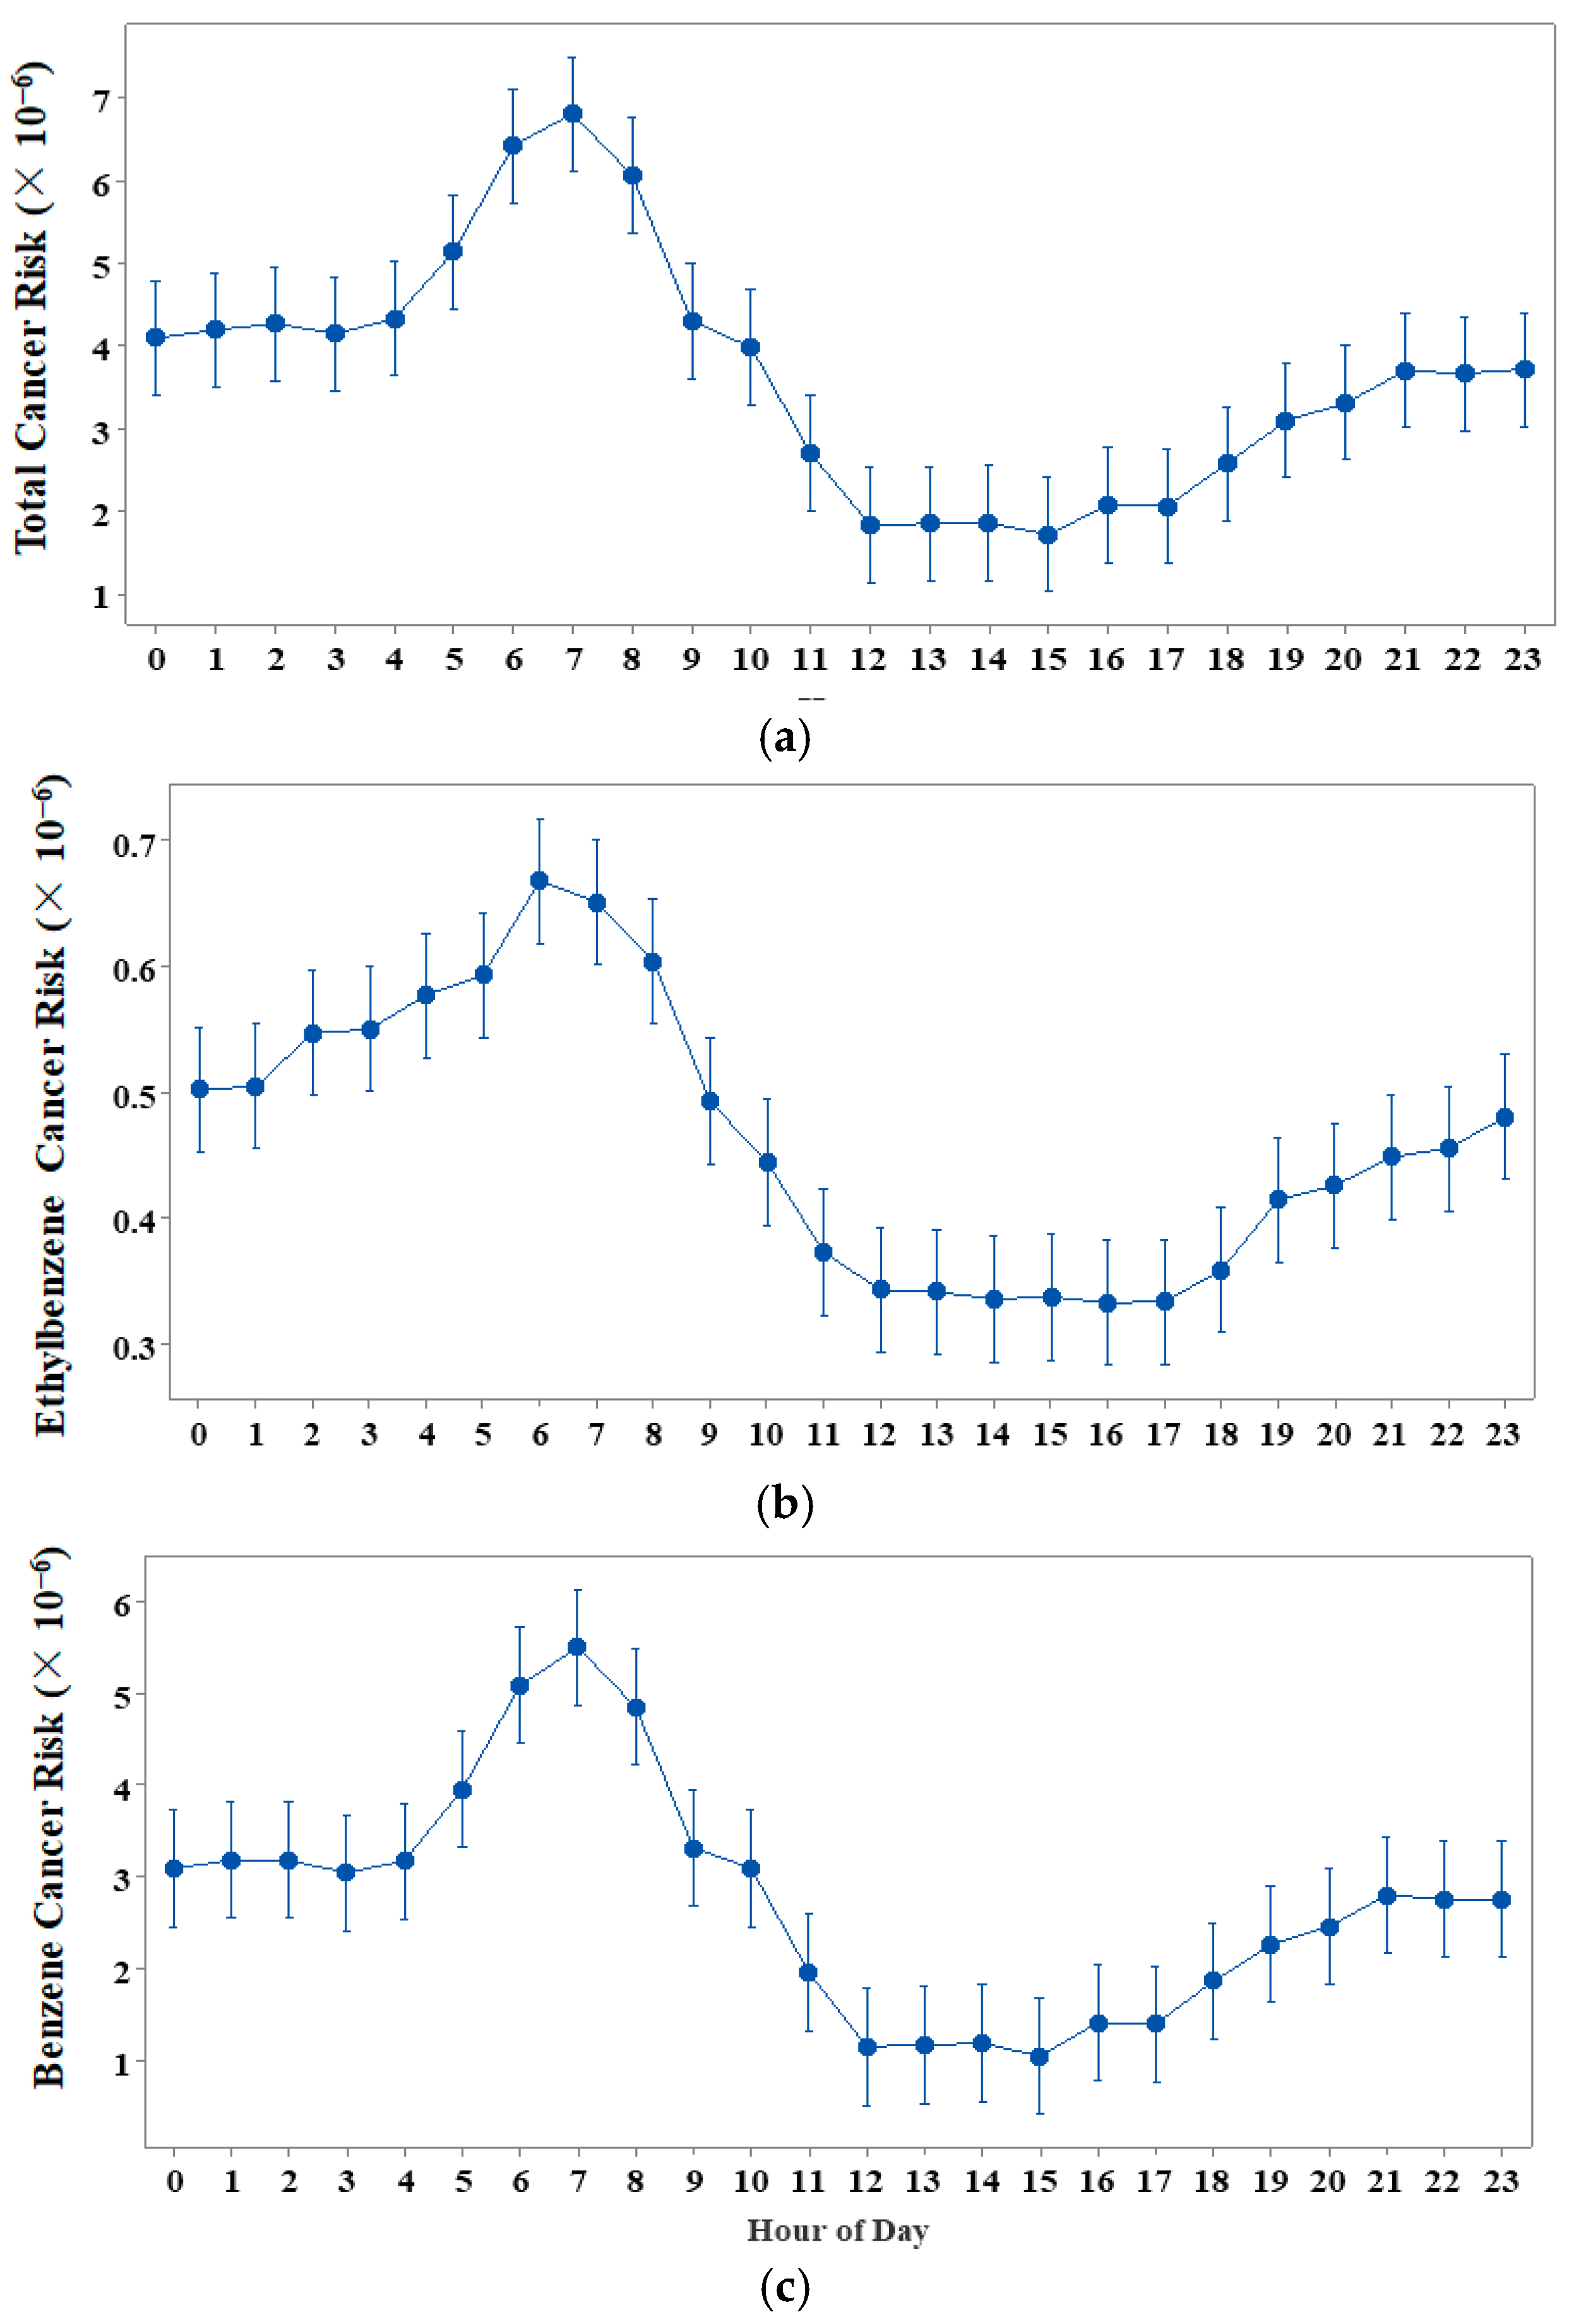
The mean TVOC concentration during the study period of 17 November 2021 to 17 March 2023 is 27 µg/m3. The total concentrations of the 16 compounds considered for risk assessment is 5.39 µg/m3, which is 20% of the TVOC. Among the 16 compounds (Table 1), high mean concentrations are observed for n-hexane (1.1 µg/m3), toluene (0.999 µg/m3), m,p-xylene (0.595 µg/m3), and benzene (0.496 µg/m3), which is above the annual Ambient Air Quality Criteria of 0.45 µg/m3 for benzene [23]. The mean BTEX concentration is 2.49 µg/m3, which is 46% of the 16-compound total. This BTEX concentration is lower than the BTEX concentration of 2.81 µg/m3 in Windsor in 2021 [23]. N-hexane had a larger variability (CV = 263%) compared to the other 15 VOCs (CVs ranged from 37% to 180%). The average wind speed during the study period was 9.36 km/h. The prevailing winds were from the south (22%) and southwest (18%).

3.2. Cancer Risks

In Windsor, the incremental lifetime cancer risk due to inhalation exposure to benzene in the ambient air is 3.87 × 10⁻⁶, which is within the acceptable risk range of 1 × 10⁻⁶ to 1 × 10⁻⁴ used by the USEPA. The benzene risk values are lower than those in Port Moody and Burnaby, British Columbia, Canada due to British Columbia’s elevated benzene concentrations [20], yet higher than those in other studies (Table 2). The reason for the higher benzene cancer risk in Windsor compared to the other studies is relatively high benzene concentrations in Windsor, which are mainly emitted from industrial activities (22%), evaporation emissions (18%), and vehicular exhaust (16%) [24].
The cancer risk due to inhalation exposure to ethylbenzene is 4.63 × 10⁻⁷, which is not of concern or is negligible. This value is lower than those estimated in other studies (Table 2), due to a lower concentration of ethylbenzene, which is mainly emitted from solvent usage in Windsor [24], compared to the ethylbenzene concentrations in other studies (Table 2). The total CR due to benzene and ethylbenzene is 4.33 × 10⁻⁶, which is above the 1 × 10⁻⁶ risk range but lower than those in other studies (Table 2). Benzene made a much larger share of the contribution (89%) due to its higher mean concentration (0.496 µg/m3 for benzene vs. 0.185 µg/m3 for ethylbenzene) and higher IUR value (7.8 × 10⁻⁶ per µg/m3 for benzene vs. 2.5 × 10⁻⁶ per µg/m3 for ethylbenzene).
The seasonal and hour-of-day trends of cancer and non-cancer risk for each individual species are governed by seasonal and hour-of-day trend of perspective concentrations because IURs and RfCs are constant. As such, the discussion focuses on concentrations.
As seen in Figure 2, the seasonal cancer risk of benzene was higher in winter (4.80 × 10⁻⁶), similar between fall (3.74 × 10⁻⁶) and spring (3.43 × 10⁻⁶), and lower in summer (2.47 × 10⁻⁶), all in the acceptable range. The seasonal cancer risks of ethylbenzene exhibited a higher value in fall (5.84 × 10⁻⁷), followed by summer (4.93 × 10⁻⁷), spring (4.25 × 10⁻⁷), and winter (3.99 × 10⁻⁷), and all were negligible. The winter high summer low trend of total cancer risk is similar to that of benzene due to its predominant contribution to the total cancer risk.
A similar hour-of-day trend was observed for benzene, ethylbenzene, and the total cancer risks. The total CRs were all in the acceptable range (Figure 3). All three risks were higher during the morning rush hours of 5:00–8:00 due to vehicular emissions and weak atmospheric mixing leading to higher concentrations of those two VOCs. The lower risk values during 12:00–15:00 are due to higher temperature and solar radiation, which cause more consumption of VOCs in photochemical reactions and strong mixing leading to low concentrations.

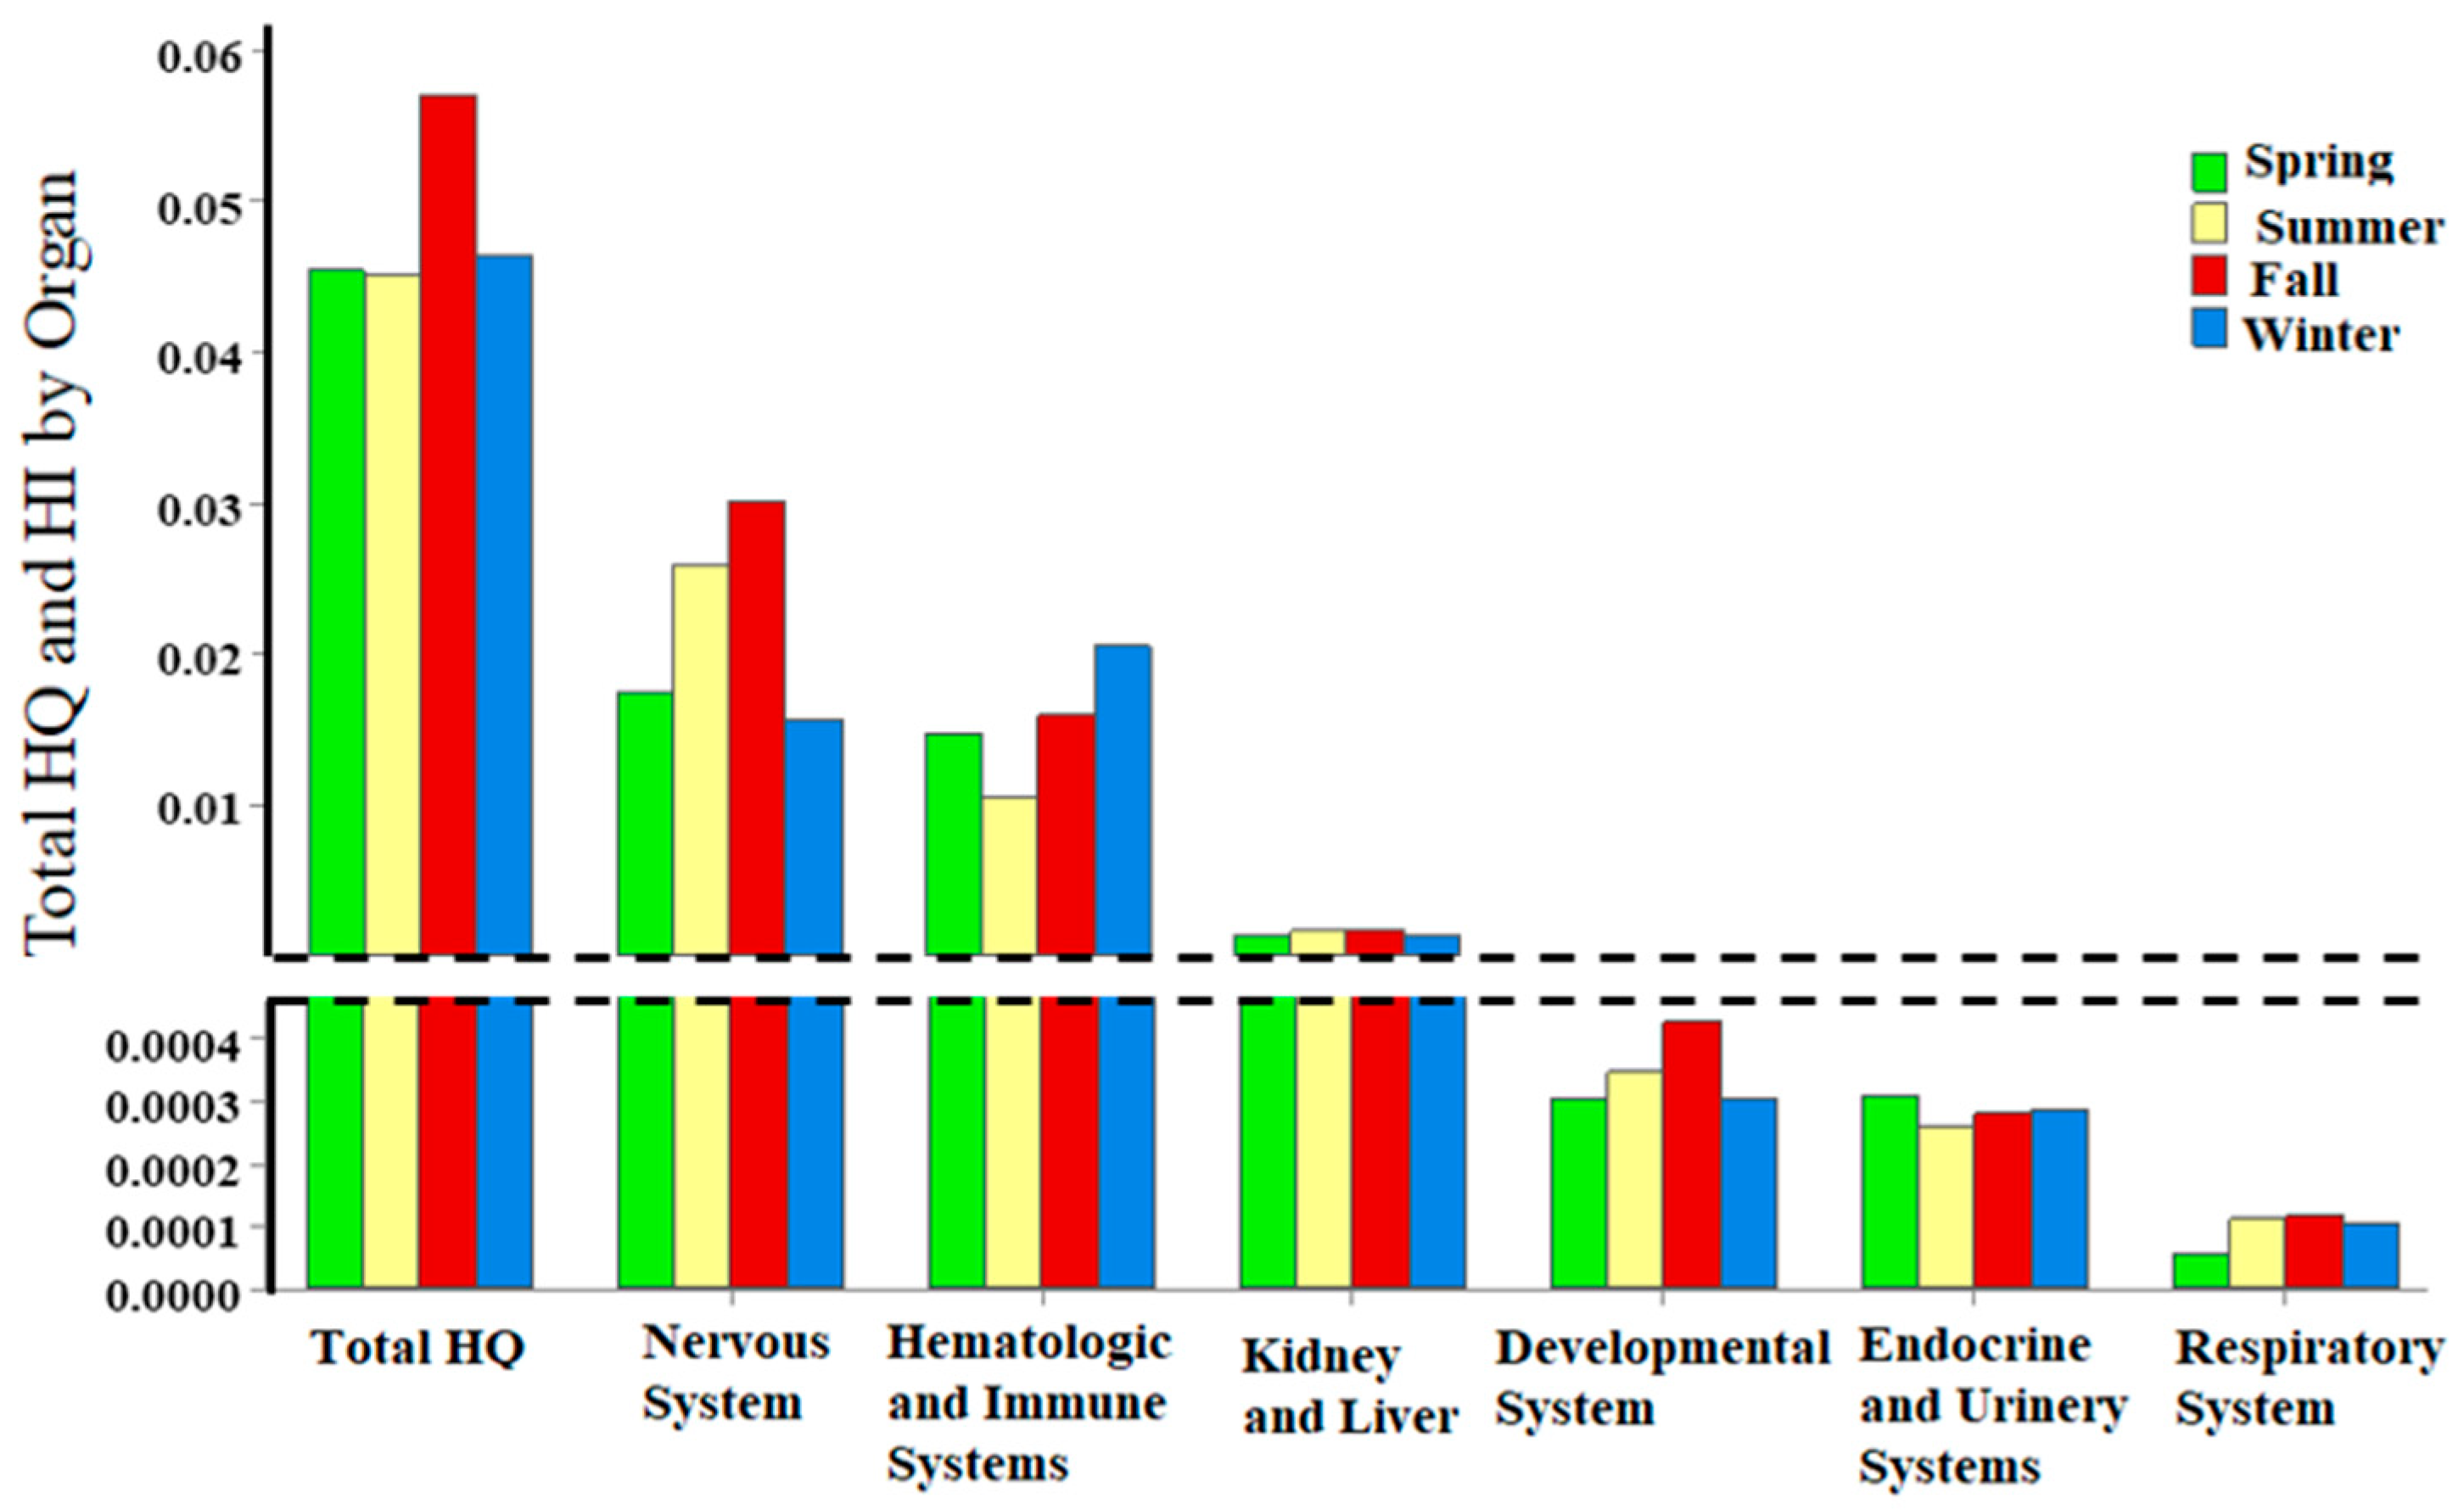
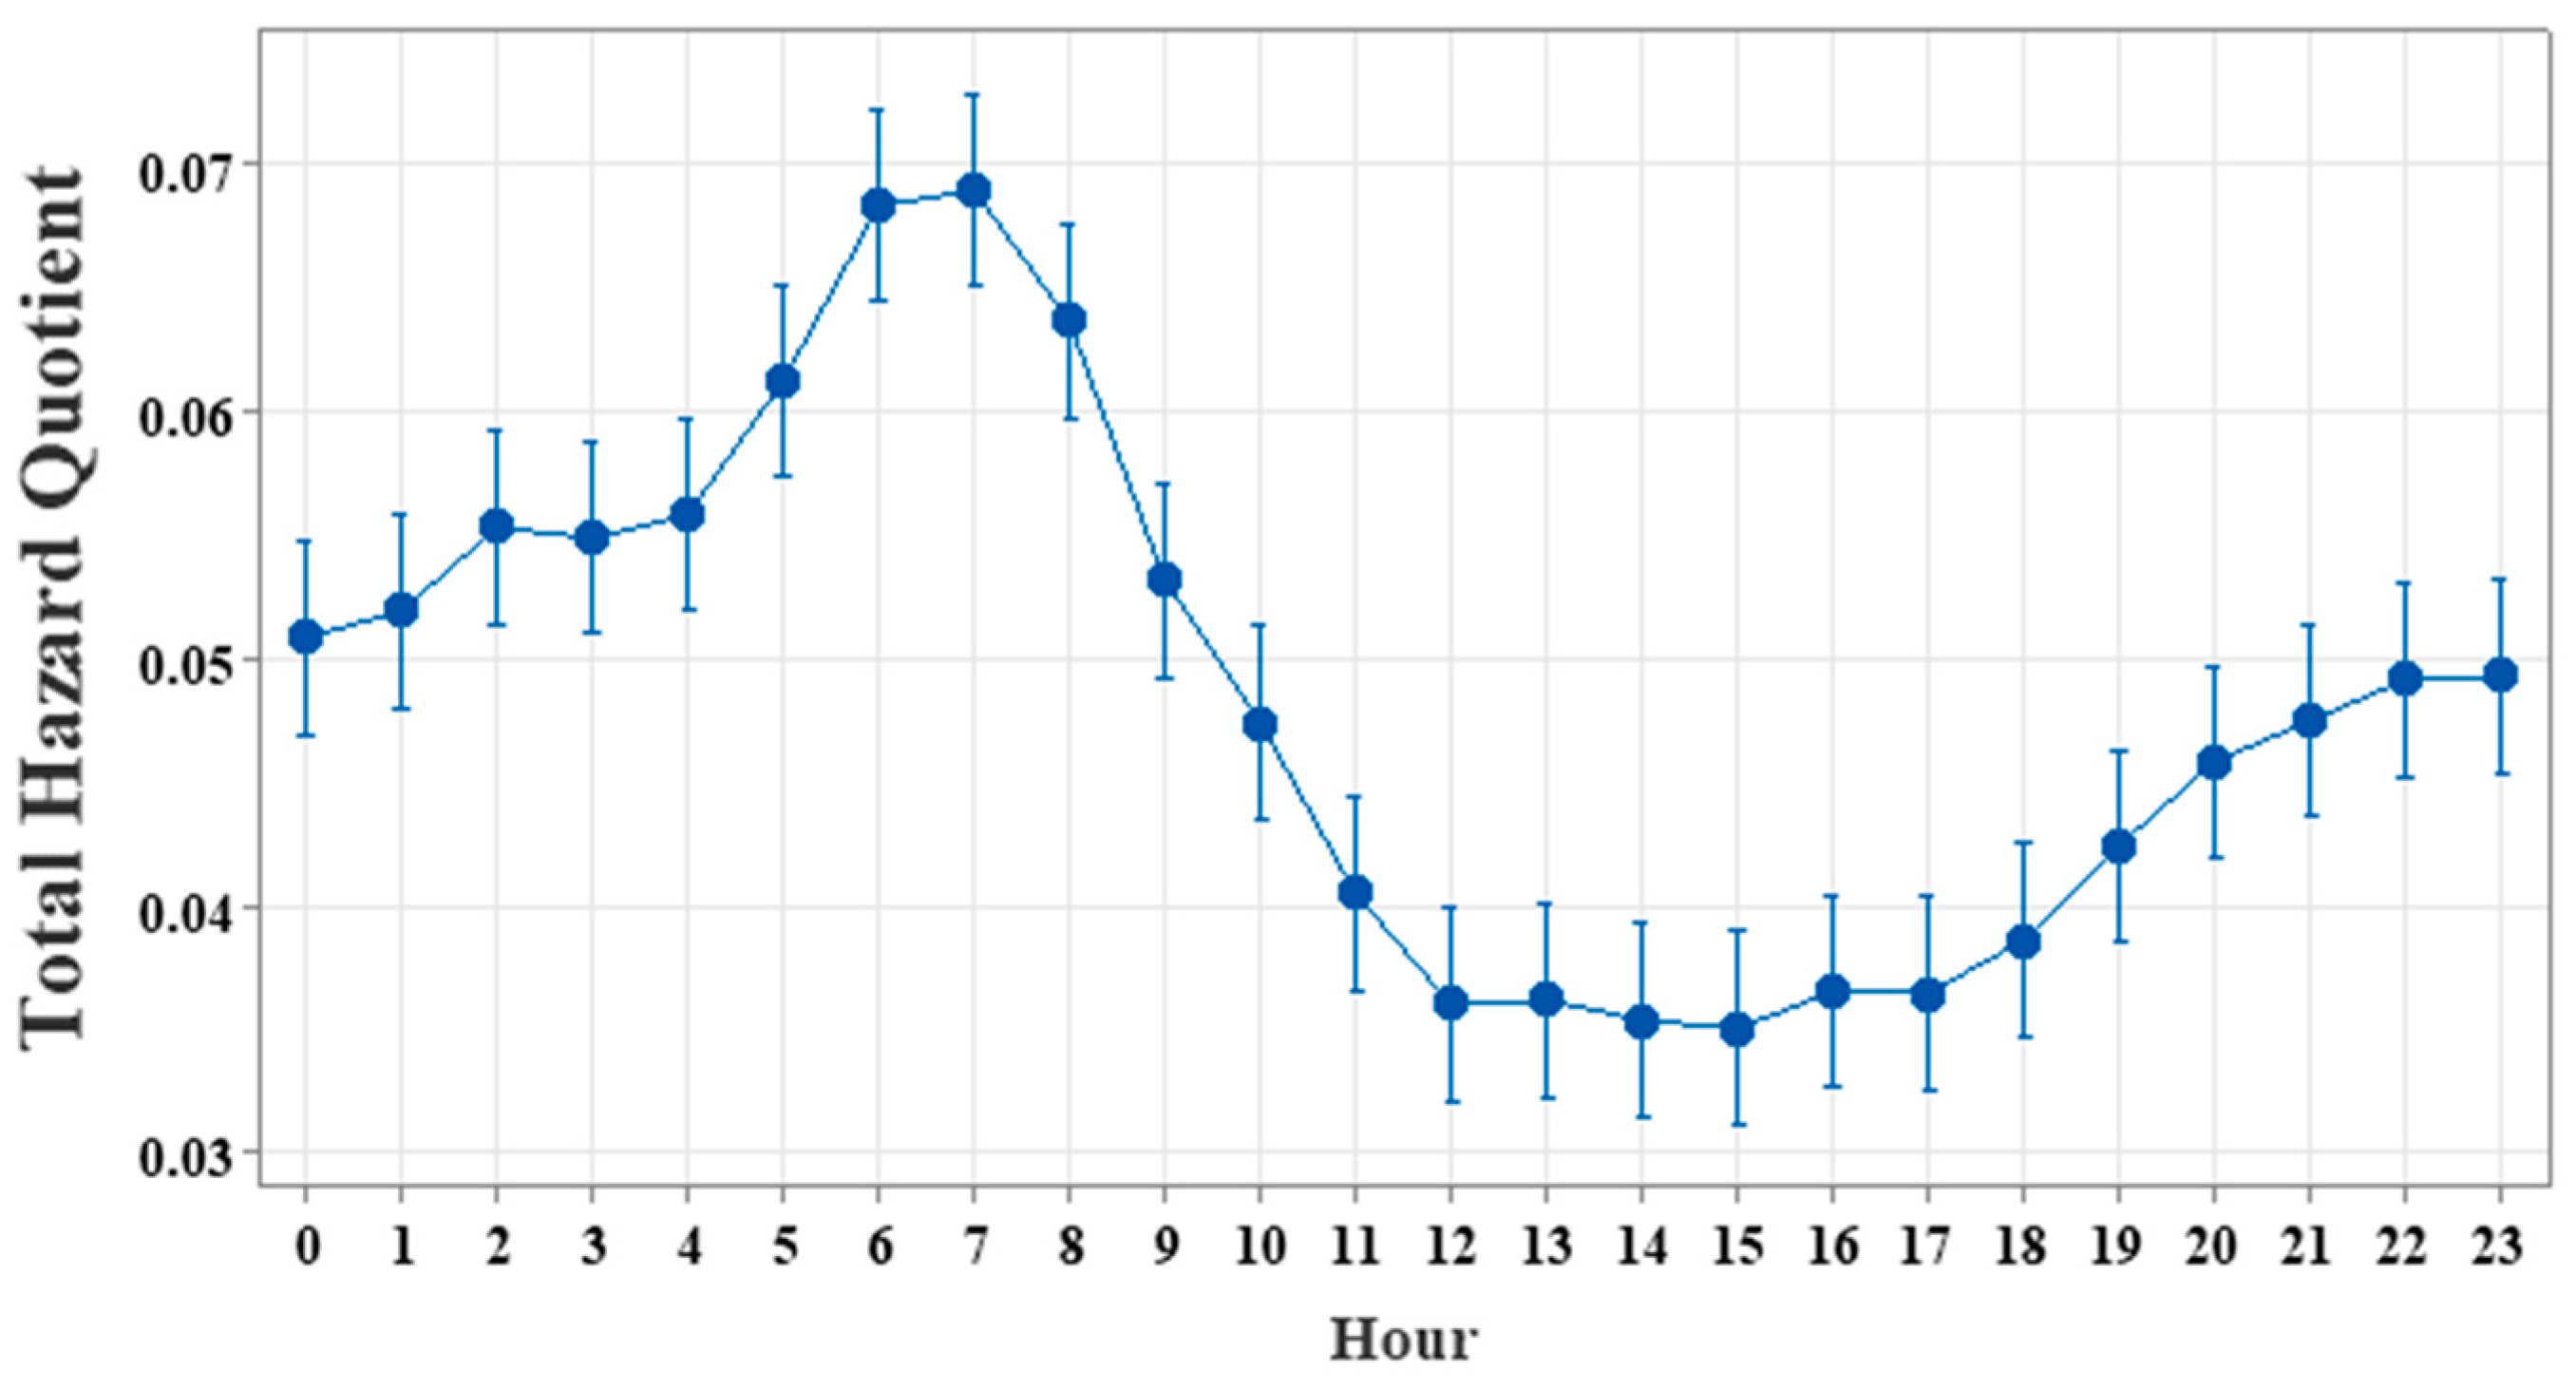
3.3. Chronic Non-Cancer Risks

The HQs for each of the 16 VOCs and their contribution to the total HQ are shown in Table 3 and Figure 4. The estimated HQs for each of the 16 VOCs (0.00002–0.0165) and total HQ (0.0488) were substantially lower than the safe level of 1 used by the USEPA, indicating a negligible risk due to inhalation exposure to those ambient VOCs. Among the 16 VOCs, benzene had the highest HQ (0.0165, 34% of total HQ), followed by n-nonane (0.00866, 18%), m,p-xylene (0.00595, 12%), 1,2,4-thrimethylbenzene (0.00482, 10%), and 1,2,3-thrimethylbenzene (0.00403, 8%). When combined, BTEX contributed 51% to the total HQ. Benzene had the largest HQ due to its substantially higher concentration (0.496 µg/m3), ranked #4, and lower RfC value (30 µg/m3, ranked #2 in toxicity) compared to other species. N-nonane ranked #10 in mean concentrations but #2 in the contribution to the total HQ, because of its substantially lower RfC (20 µg/m3, #1), i.e., most toxic (Table 3). On the other hand, n-hexane and toluene ranked #1 and #2 in mean concentrations but ranked #8 and #11 in the contribution to the total HQ, respectively, due to larger RfCs (700 and 5000 µg/m3, ranked #6 and #9, respectively). Overall, there is a much stronger Spearman rank correlation between RfCs and HQs (r = 0.93, p < 0.001) than between concentrations and HQs (r = 0.41, p = 0.11). In other words, compounds with high toxicity are likely to have a larger HQ, although their concentrations could be low.
The comparison of the HQs of 16 investigated VOCs in Windsor, Canada with other cities around the world is presented in Table 4. The HQs of benzene, toluene, ethylbenzene, and xylenes were within the range of those reported in other studies, indicating that the concentrations of these compounds in all the selected study areas were comparable. For 1,2,3-trimethylbenzene, the HQ in this study was the same as in the study in Duzce, Turkey. The HQs of methylcyclohexane and n-hexane in this study were higher than that in other studies (Table 4). Major sources of methylcyclohexane and n-hexane in Windsor are chemical processes, combustion, and diesel exhaust [24]. Therefore, the higher concentrations of these two compounds in Windsor are not unexpected due to the border crossing traffic, the east of Windsor West Station, and refineries in Detroit, the west of Windsor West Station. The HQs of propene, cyclohexane, and styrene were lower in Windsor compared to other studies due to lower concentrations of these VOCs, which are primarily emitted from industrial activities and traffic in Windsor. The HQs of n-nonane, 1,3,5-trimethylbenzene, and 1,2,4-trimethylbenzene in this study were lower than those in Duzce, Turkey. The reason for the higher concentration of these three compounds in Duzce, Turkey compared to Windsor is due to intense traffic and a plain geography surrounded by mountains, which restrict the dispersion of the pollutants.
As seen in Table 5, the HI values for each target organ were all less than 0.03, below the safe level of 1. The highest HI was observed for the nervous system (0.0213), followed by the hematologic system and immune system (0.0165 each) and liver/kidney (0.00152). Exposure to ambient VOCs carries a much smaller risk for the developmental system (3.37 × 10⁻⁴), endocrine system and urinary system (2.80 × 10⁻⁴ each), and respiratory system (9.70 × 10⁻⁵). Among the 16 selected VOCs, eight and three VOCs contributed to the HI of the nervous system and developmental system, respectively. As seen in Table 5, large contributors to the nervous system are m,p-xylene (28%), 1,2,4-trimethylbenzene (23%), 1,2,3-trimethylbenzene (19%), 1,3,5-trimethylbenzene (12%), o-xylene (10%), and n-hexane (7%), with similar small contributions made by toluene and styrene (1% each). For the developmental system, ethylbenzene is the largest contributor (55%), followed by n-propylbenzene (39%) and cyclohexane (6%). Among the four organs that involve BTEX, benzene is responsible for 100% of the HI for both the hematologic system and immune system, while the xylenes and toluene contributed 39% to the HI for the nervous system, and ethylbenzene is the dominant contributor to the HI for the developmental system (55%).
As shown in Figure 5, the seasonal total HQ was higher in fall (0.0571) and lower in winter (0.0464), spring (0.0454), and summer (0.0451), with all below the safe level of 1. The same trend was observed for styrene (Table S3). Three VOCs (benzene, n-nonane, and i-propylbenzene) had higher HQs in the cold season (winter or spring) and lower HQs in summer. However, cyclohexane had a higher HQ in spring, a lower HQ in winter, and values in between for the other two seasons. The other 11 HQs share the same seasonal trend, having higher HQs in the warm seasons (fall and summer) and lower HQs in the cold seasons (spring and winter).
For the seasonal trend of HI by organ, the nervous system, developmental system, respiratory system, and liver/kidney followed the same trend of higher HQs in the warm seasons (fall and summer) and lower HQs in the cold seasons (spring and winter). There was little variability in the seasonal HI for the endocrine system and urinary system (ranging 0.000257 to 0.000305) due to a large percentage (84%) of <MDL samples for i-propylbenzene as the only contributor to the HI for these two organs. The seasonal HI for the hematologic system and immune system was the highest in winter (0.0205 each), followed by fall (0.0160) and spring (0.0147), and lower in summer (0.0106).
Similar hour-of-day trends for the total HQ (Figure 6) and HI by each of the eight organs were observed. The trend is also similar to that of the total CR (Figure 3c). Those trends are all governed by diurnal variations in VOC concentrations.

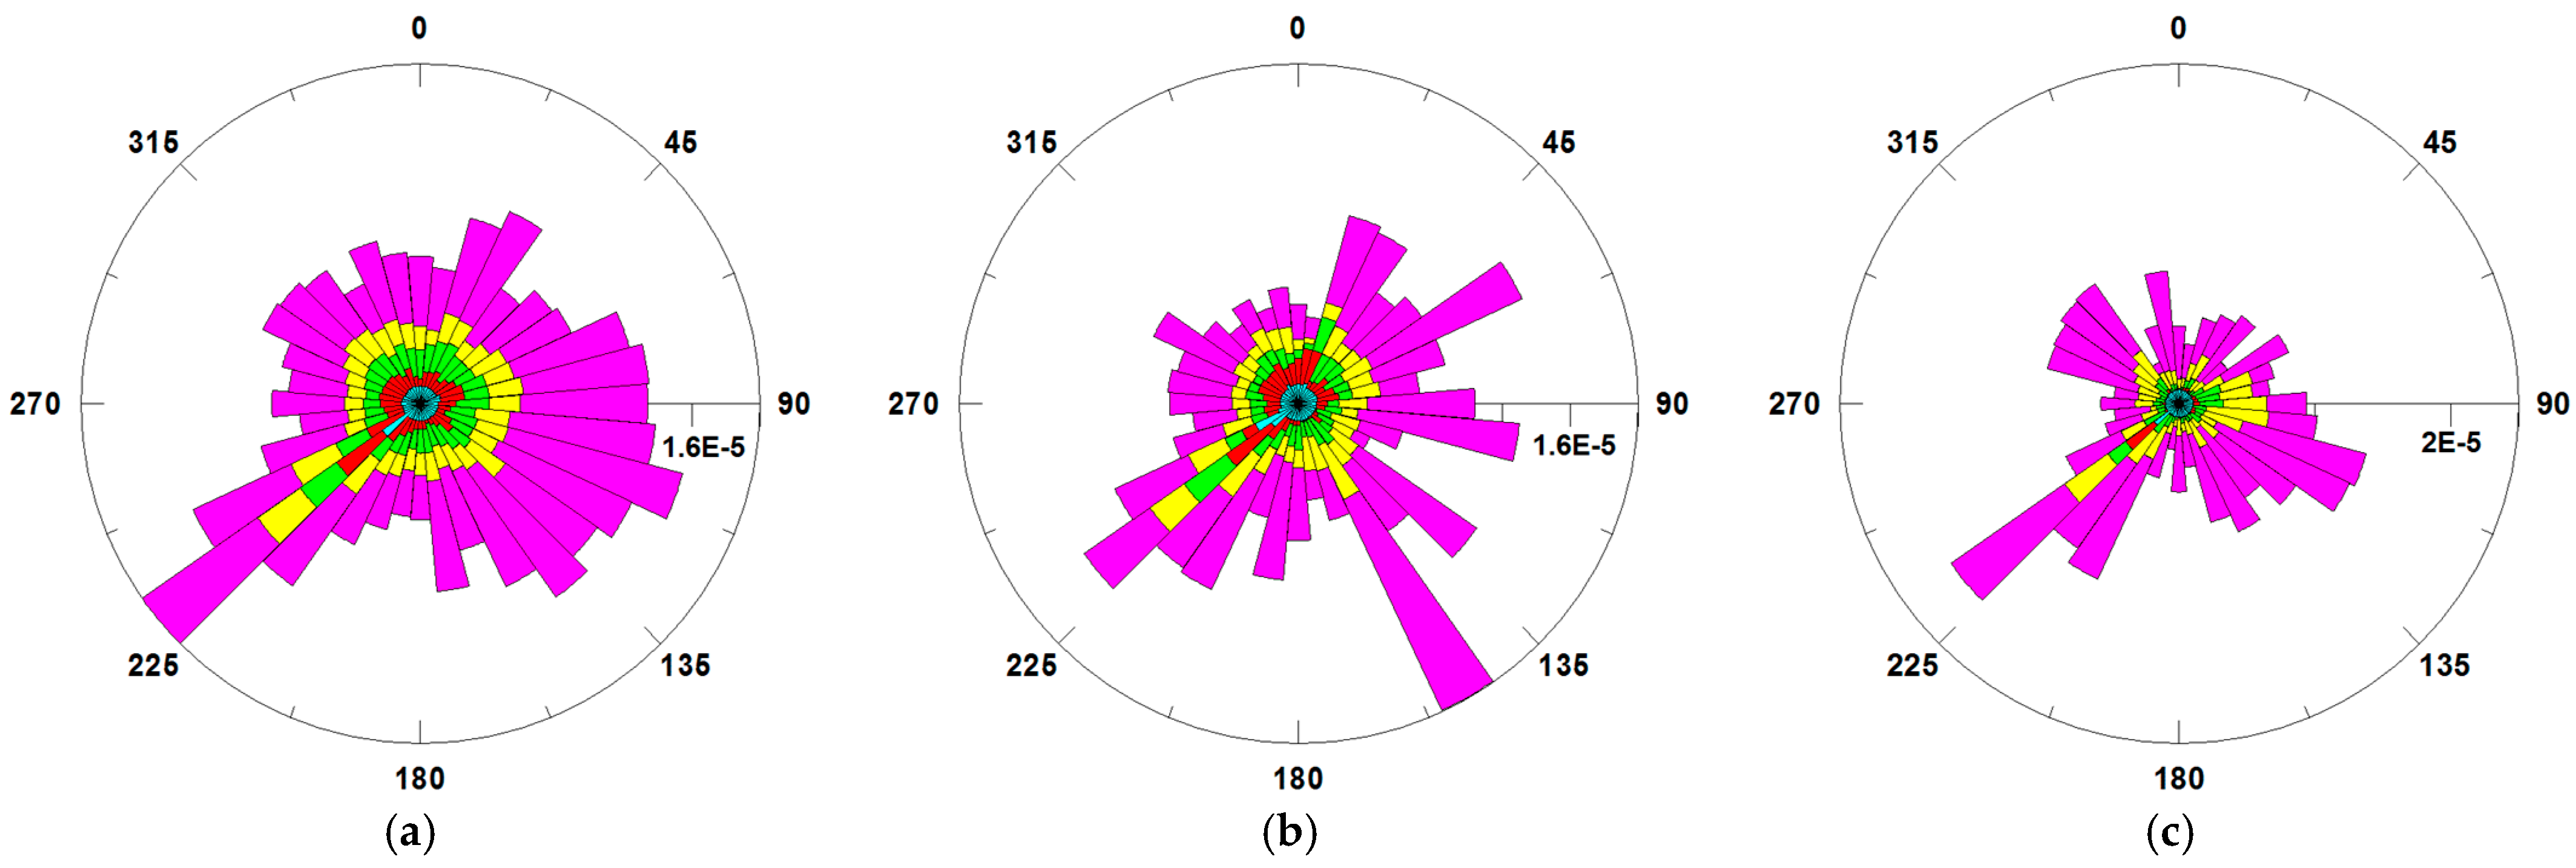
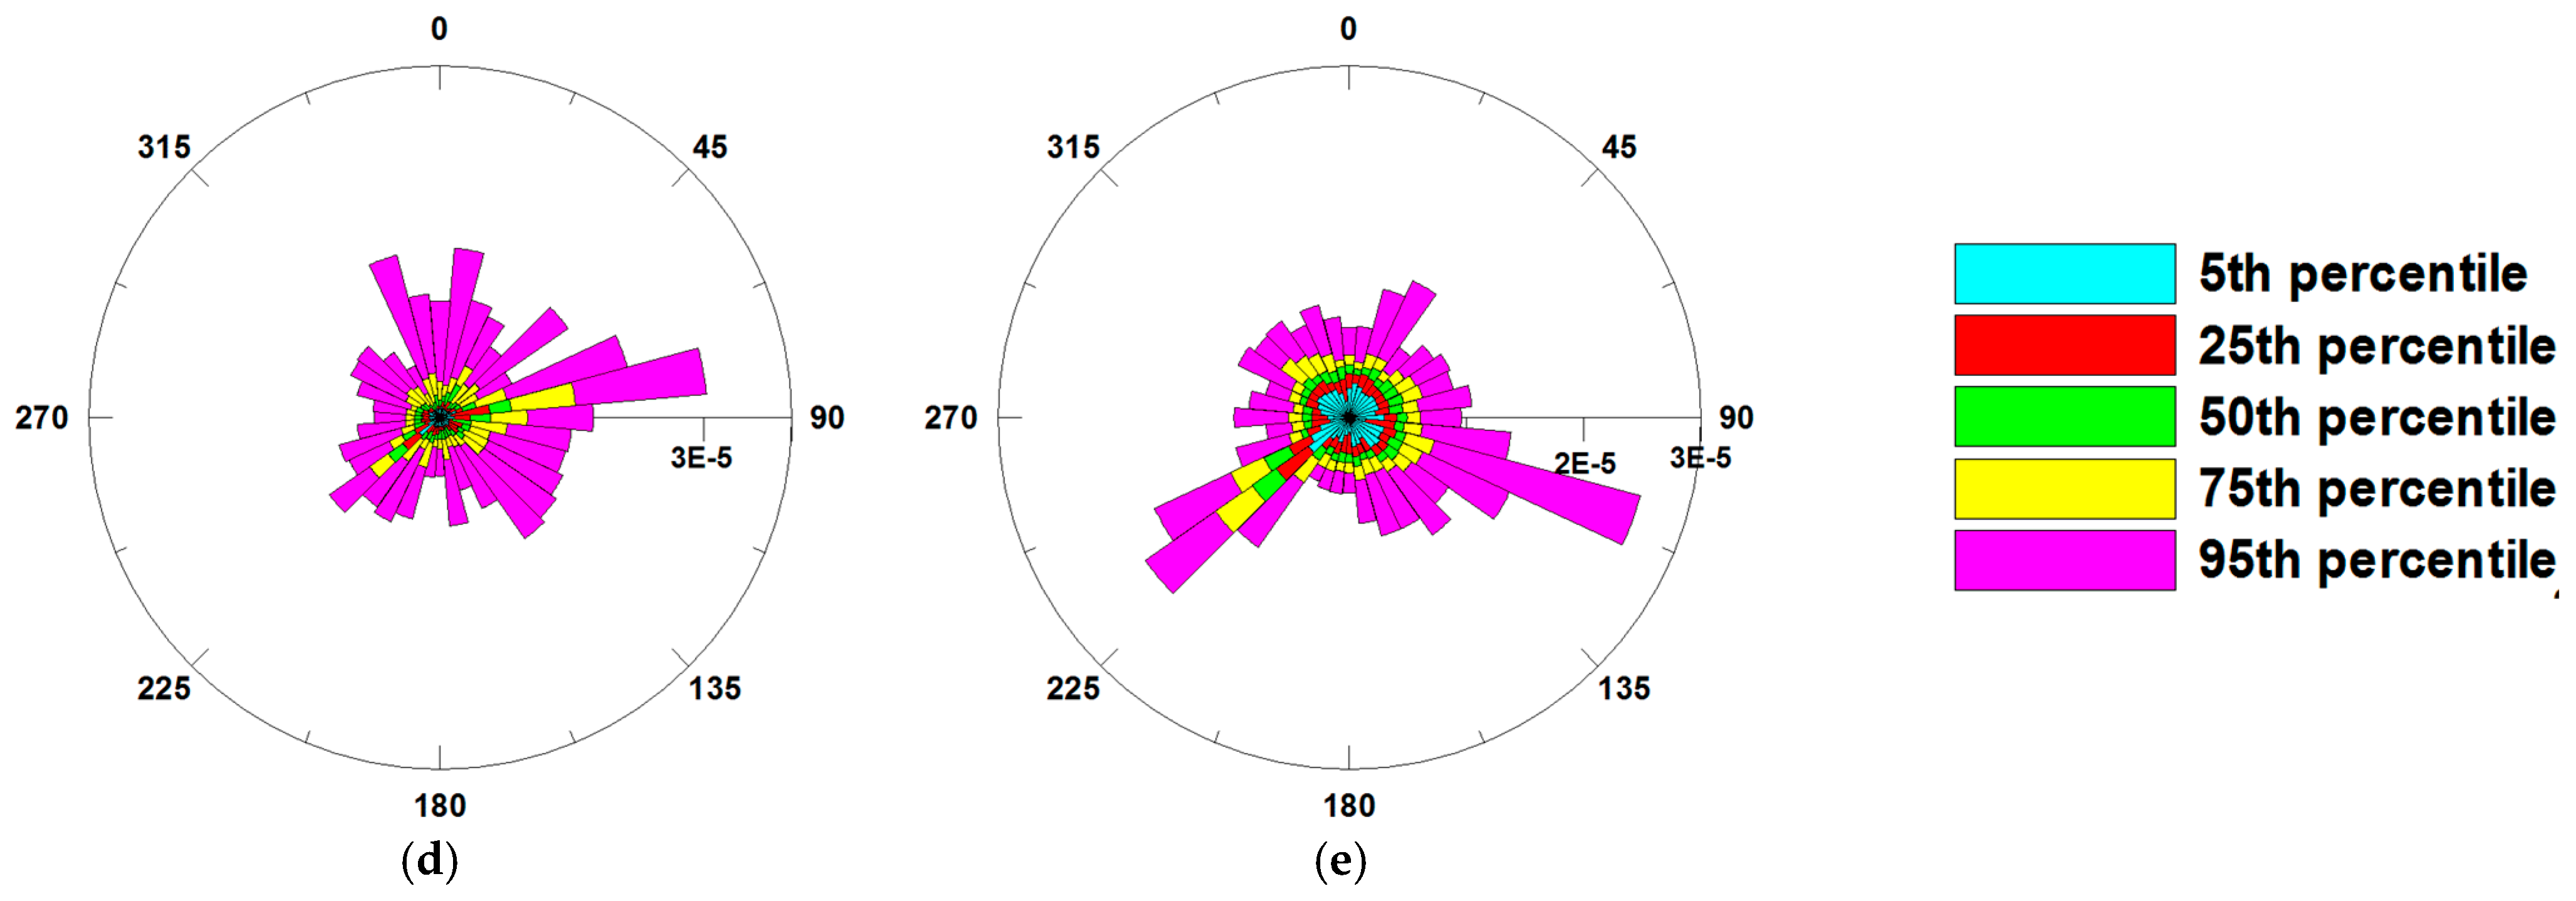
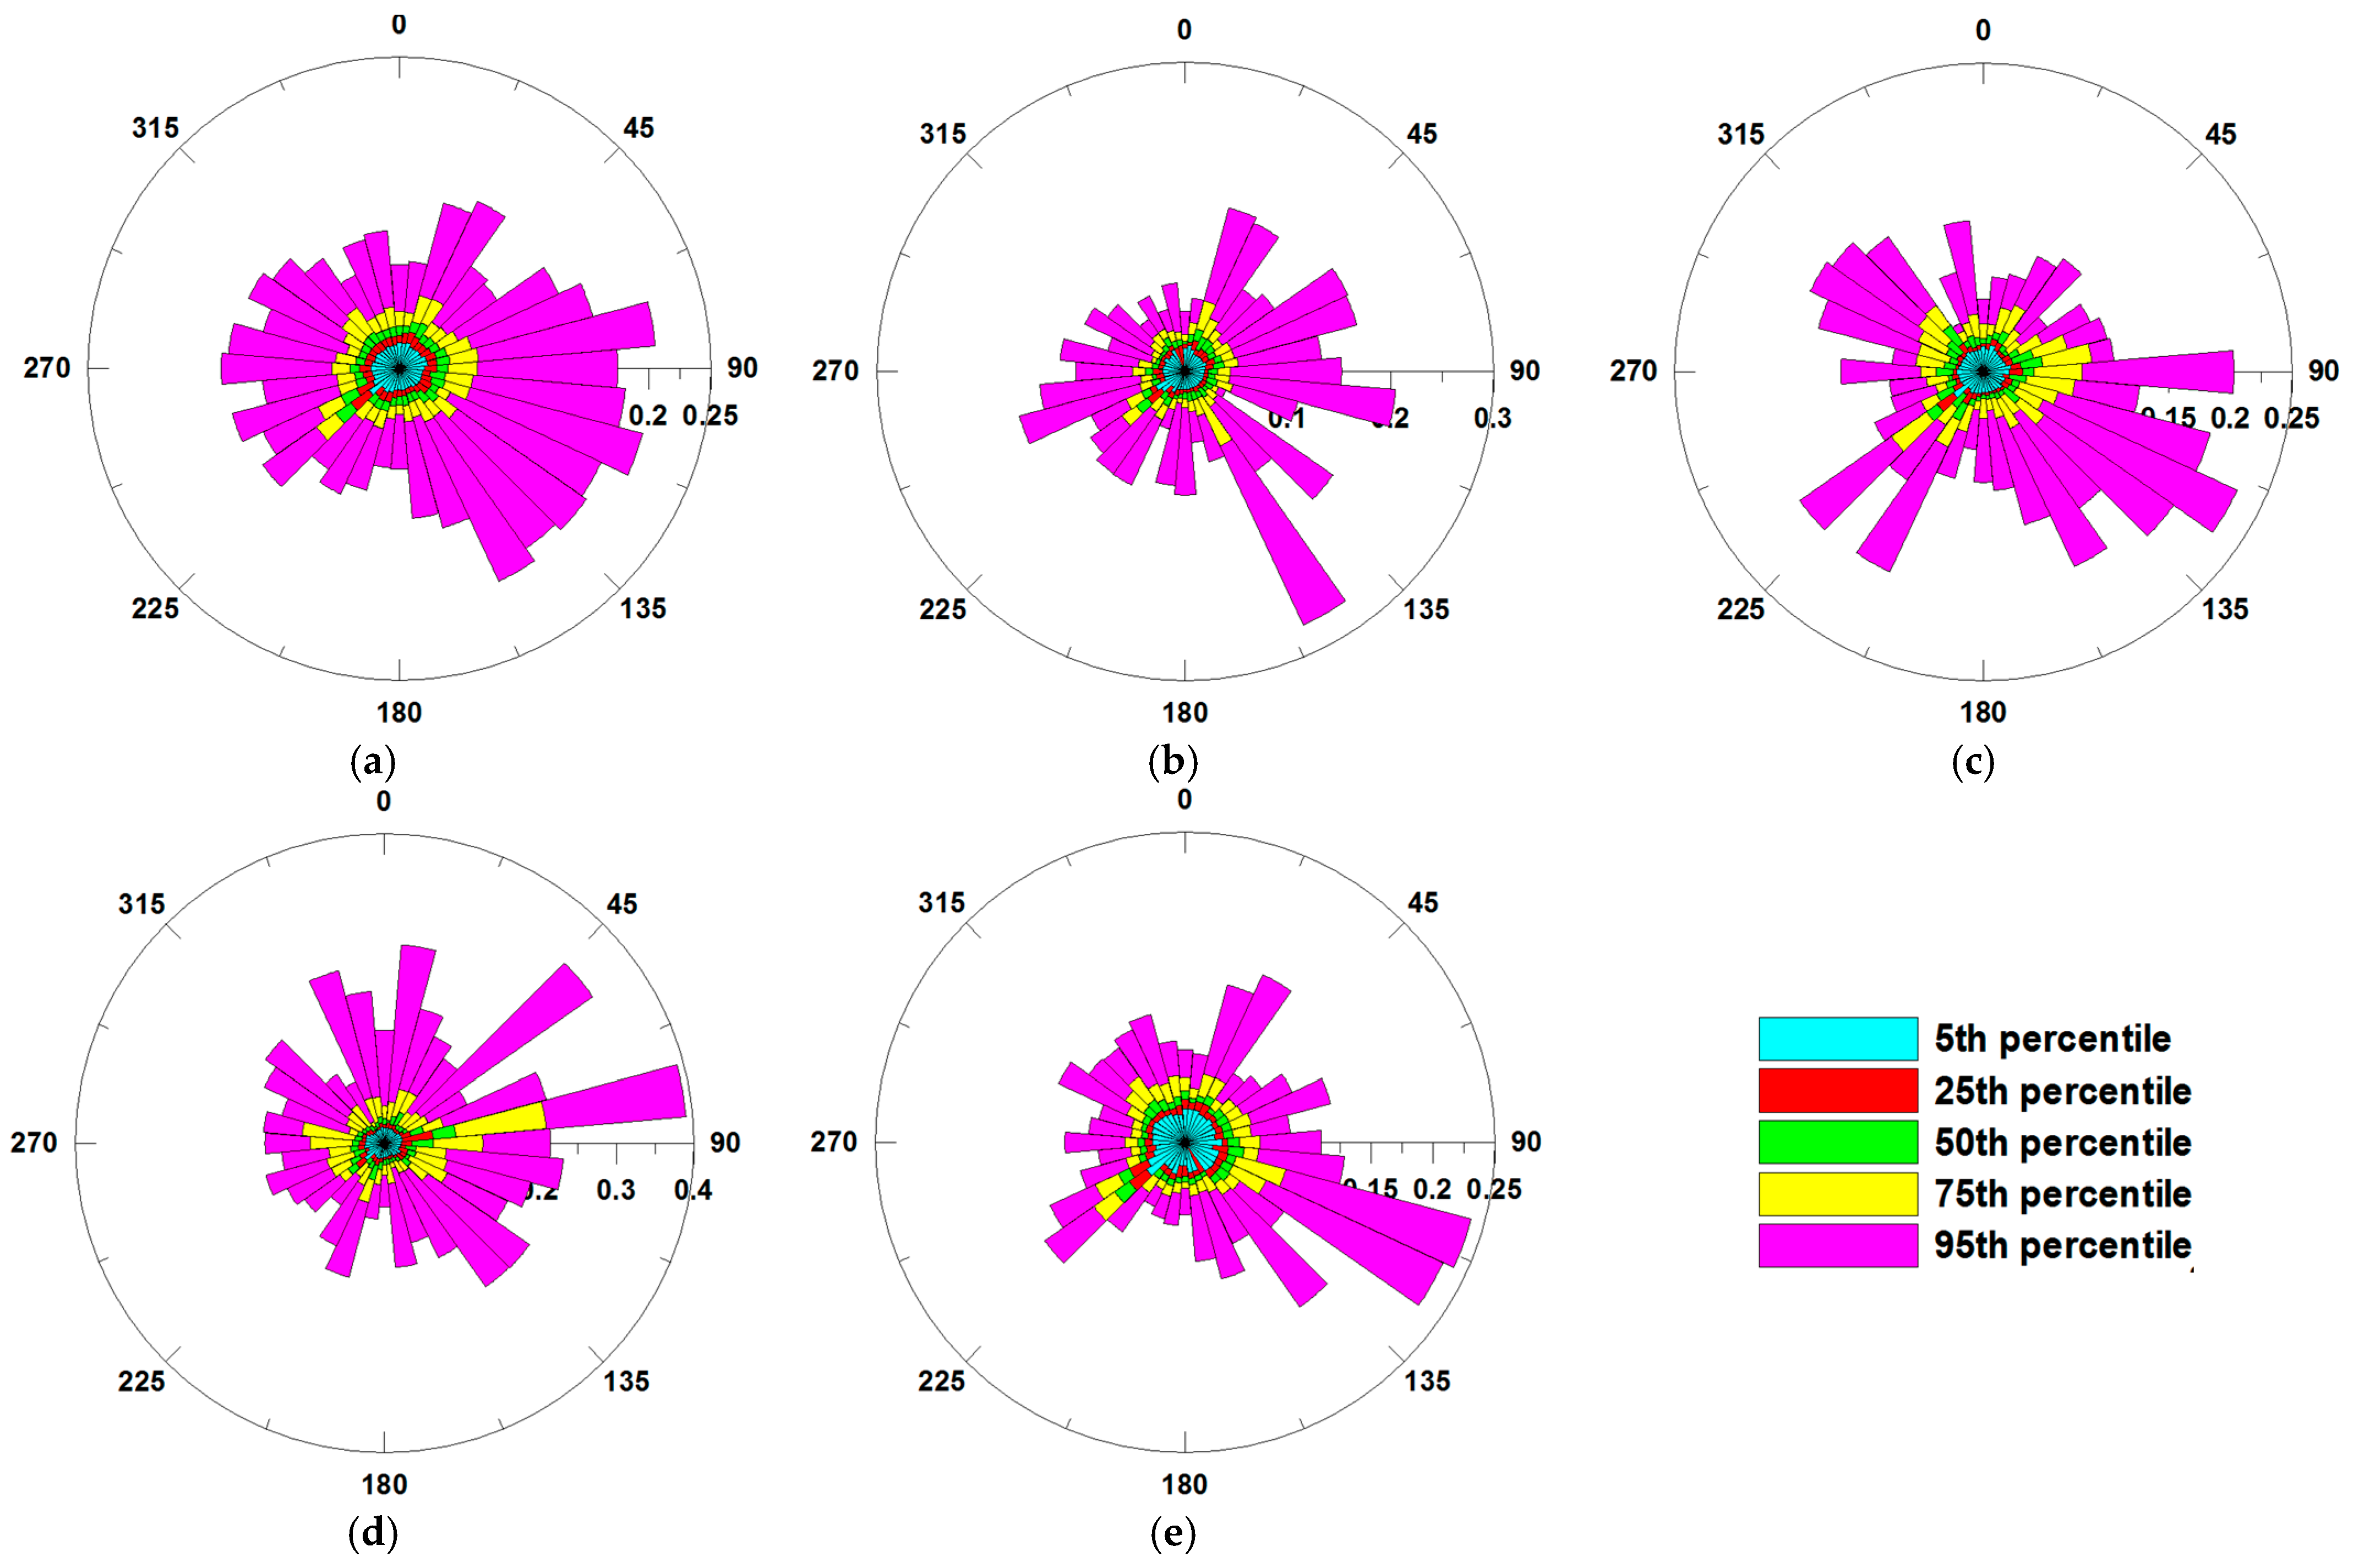
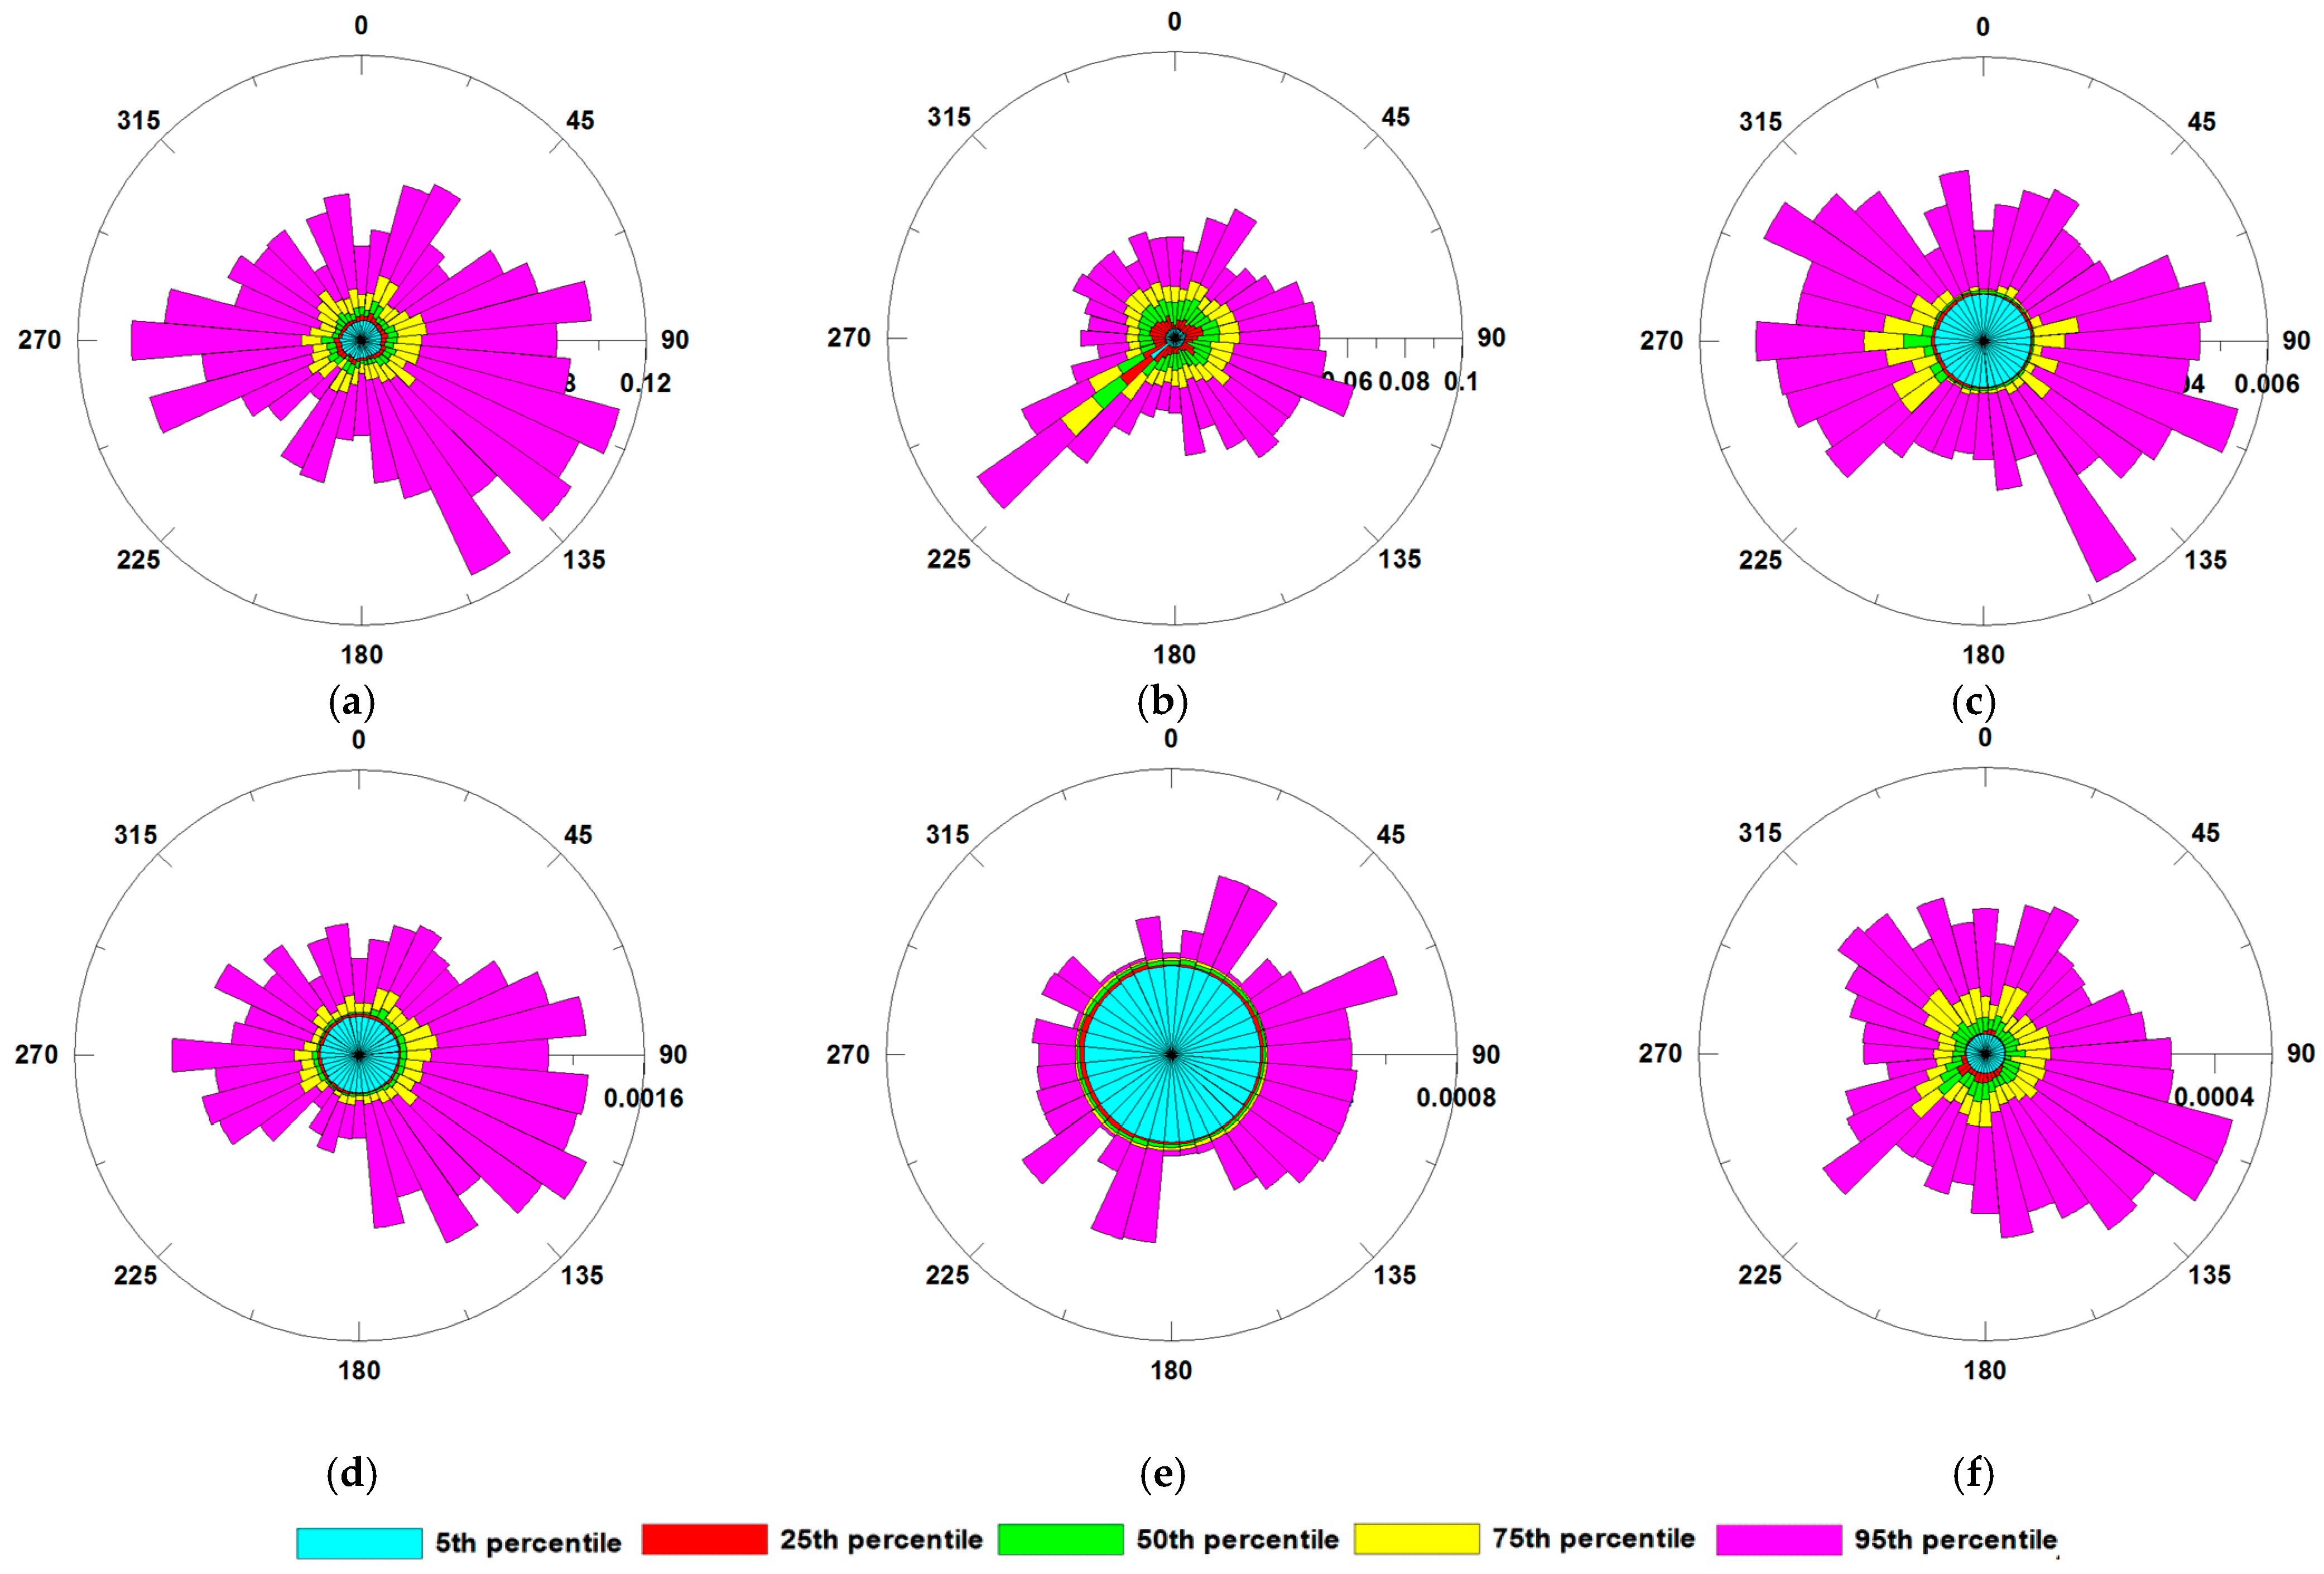
3.4. Directional Risks

Figure 7 illustrates the overall and seasonal directional distribution of the total CR. A higher total CR (e.g., the 75th or 95th percentile, a longer length of the bar indicates higher probability in that direction of the wind) was associated with winds from the east and southeast (65°–150°) and the southwest (210–240°). This is not unexpected due to numerous industrial sources, such as coal-fired electricity-generating stations (e.g., River Rouge Power Plant) and manufactories (e.g., Ford Moter complex) southwest of Windsor and border crossing traffic on Huron Church road and the Ambassador Bridge east of the Windsor West Station. The only major oil refinery of Michigan, Marathon Petroleum Detroit Refinery, with a daily processing capacity of 140,000 barrels [27] and an annual VOC emission of 281.6 tons (255.5 metric tons) in 2020 [28] is located seven kilometers west of the Windsor West monitoring station. In their study of the ambient concentrations of ozone in Windsor, Zhang et al. [29] reported that higher O3 concentrations were associated with airmass from the south and southwest of Windsor, which is largely consistent with our results. The directional distributions in each of the four seasons are largely consistent with the overall patten of the total CR; however, there is a lack of higher risks associated with the airmass from the southwest in fall.
As shown in Figure 8, the overall total HQs and total HQs in each of the four seasons were higher when airmasses arrived from the east and southeast. The patten is largely consistent with the directional distribution for the total CR.
Figure 9 depicts the directional distribution of HIs for each of the target organs. For six of the eight organs, the patterns of HIs were consistent with that of the overall total HQ (Figure 8). However, the patten of the overall total HQ was less consistent with that of the HIs of the other two organs (endocrine system and urinary system) due to a large percentage (84%) of samples with below-MDL concentrations for i-propylbenzene, which was the only contributor to HIs of these two organs. The higher risks associated with the airmass from the southwest are more pronounced for the hematologic system and immune system because benzene is the only compound involved. Similarly, higher risks associated with the airmass from the west are observed for the nervous system.

4. Conclusions

The lifetime incremental cancer and chronic non-cancer health risks due to inhalation exposure to ambient VOCs were estimated using hourly concentrations of 16 VOCs collected in Windsor, Ontario, Canada from 17 November 2021 to 17 March 2023. The total CR due to benzene and ethylbenzene was 4.33 × 10⁻⁶, in the acceptable risk range of 1.0 × 10⁻⁶ to 1.0 × 10⁻⁴ used by the USEPA, and much lower than total CRs in other studies in Canada.
The total HQ of inhalation exposure to 16 VOCs in Windsor (0.0488) was in the safe level of less than HQ = 1 used by the USEPA and within the range of those reported in other studies. Among the eight target organs, three (i.e., nervous system, hematologic system, and immune system) had higher HIs ranging from 0.0165 to 0.0213, and five (i.e., the liver/kidney, developmental system, endocrine system, urinary system, and respiratory system) had lower HIs ranging from 9.70 × 10⁻⁵ to 1.52 × 10⁻³. The HIs less than one suggest negligible risks.
Although the total CR and total HQ in all four seasons are in the acceptable and safe range, respectively, the total CR was higher in winter, and the total HQ was higher in fall compared to the other three seasons. The total CR, total HQ, and HI by organs were all higher in the early morning hours of 5:00–8:00 and lower during 12:00 to 15:00. This trend is driven by the diurnal pattern of VOC concentrations. Residents of Windsor can mitigate their risks by limiting outdoor recreation activities during early morning hours.
In most cases involved in this study, the rank order of CRs or HQs by species is dictated by their toxicities, i.e., the major contributors to the total CR, total HQ, or HI by organ were compounds with lower RfCs or higher IURs. The exception is benzene with high concentrations, i.e., a mean value of 0.496 µg/m3, which is above the annual Ambient Air Quality Criteria of 0.45 µg/m3 for benzene, and high toxicity, i.e., a high IUR and low RfC. Consequently, benzene is the dominant contributor to the total CR, i.e., 89% vs. 11% by ethylbenzene. Benzene is also the largest contributor to the total HQ (51%) among the 16 individual VOCs. BTEX is the largest contributor to the HI of each of the four target organs (39–100%) involving BTEX. Higher cancer and non-cancer risks were associated with sources located east, southeast, and southwest of Windsor. Reducing emissions of VOCs, including BTEX, especially in the transportation and industrial sectors, will help mitigate exposure and protect the environment and human health.
This study provides an insight into human health risks posed by inhalation exposure to ambient VOCs and major contributors to those risks in Windsor, Canada. The findings may aid in air quality and human health risk management in the study area. One of the limitations of this study is the measurements of ambient VOCs at one monitoring station. However, VOC concentrations may vary spatially depending on the wind directions and distance from industrial point sources and major roads [21]. Another limitation is that health risks may not be fully captured in this study due to the fewer monitored VOCs compared to these in other studies [17,20,30]. Those additional species, such as acetaldehyde, acetone, acrolein, formaldehyde, and methanol, are measured once every six days with 24 h integrated samples at the Windsor West Station under the National Air Pollution Surveillance Program [31] but were not available in our continuous VOC measurements. An analysis of additional species could help to better understand human health risks due to inhalation exposure to VOCs in the study area.

Supplementary Materials

The following supporting information can be downloaded at: https://www.mdpi.com/article/10.3390/atmos15091038/s1, Table S1. Method detection limit (MDL), percentage of missing and flagged, below-MDL, and equal-to-or-above-MDL concentrations for each of the 16 VOCs used in this study; Table S2. Toxicity values and target organs for each of the 16 VOCs; Table S3. Seasonal HQs for 16 VOCs in Windsor, Ontario, Canada (all significant at p < 0.001, i.e., not all four seasonal means are significantly the same).

Author Contributions

Conceptualization, methodology, and supervision, X.X. and Y.S.; data collection and curation, T.Z., J.W., J.G., M.N., A.M., and C.C.; formal analysis and visualization, T.M.; writing—original draft preparation, T.M. and X.X.; writing—review and editing, Y.S., T.M., T.Z., J.W., J.G., M.N., A.M., C.C., and X.X.; funding acquisition, Y.S. and X.X. All authors have read and agreed to the published version of the manuscript.

Funding

This research was funded by Environment and Climate Change Canada, and the Natural Sciences and Engineering Research Council of Canada.

Institutional Review Board Statement

Not applicable.

Informed Consent Statement

Not applicable.

Data Availability Statement

Hourly concentrations of VOCs collected at the Windsor West Station between 17 November 2021 and 17 March 2023 are available upon request from the corresponding authors.

Acknowledgments

The authors would like to acknowledge Meetkumar Maheshbhai Mathukiya and Om Sandilya, the Mitacs Globalink Research Interns at the University of Windsor, for generating the plots of the directional distribution of risks and for their editorial assistance.

Conflicts of Interest

The authors declare no conflicts of interest.

References

  1. United States Environmental Protection Agency (USEPA). Health and Environmental Effects of Hazardous Air Pollutants. 2024. Available online: https://www.epa.gov/haps/health-and-environmental-effects-hazardous-air-pollutants (accessed on 12 August 2024).
  2. Dumanoglu, Y.; Kara, M.; Altiok, H.; Odabasi, M.; Elbir, T.; Bayram, A. Spatial and Seasonal Variation and Source Apportionment of Volatile Organic Compounds (VOCs) in a Heavily Industrialized Region. Atmos. Environ. 2014, 98, 168–178. [Google Scholar] [CrossRef]
  3. Liu, Y.; Shao, M.; Fu, L.; Lu, S.; Zeng, L.; Tang, D. Source Profiles of Volatile Organic Compounds (VOCs) Measured in China: Part I. Atmos. Environ. 2008, 42, 6247–6260. [Google Scholar] [CrossRef]
  4. Bari, M.A.; Kindzierski, W.B. Ambient Volatile Organic Compounds (VOCs) in Calgary, Alberta: Sources and Screening Health Risk Assessment. Sci. Total Environ. 2018, 631–632, 627–640. [Google Scholar] [CrossRef] [PubMed]
  5. Barletta, B.; Meinardi, S.; Sherwood Rowland, F.; Chan, C.-Y.; Wang, X.; Zou, S.; Yin Chan, L.; Blake, D.R. Volatile Organic Compounds in 43 Chinese Cities. Atmos. Environ. 2005, 39, 5979–5990. [Google Scholar] [CrossRef]
  6. International Agency for Research on Cancer (IARC). IARC Monographs on the Identification of Carcinogenic Hazards to Humans. 2002. Available online: https://monographs.iarc.who.int (accessed on 25 June 2024).
  7. United States Environmental Protection Agency (USEPA). Integrated Risk Information System (IRIS), Chemical Assessment Summary for Benzene. Benzene (CASRN 71-43-2)|IRIS|US EPA. 2003. Available online: https://iris.epa.gov/ChemicalLanding/&substance_nmbr=276 (accessed on 6 June 2024).
  8. California Office of Environmental Health Hazard Assessment (OEHHA). OEHHA Acute, 8-Hour and Chronic Reference Exposure Level (REL) Summary. 2023. Available online: https://oehha.ca.gov/air/general-info/oehha-acute-8-hour-and-chronic-reference-exposure-level-rel-summary (accessed on 12 August 2024).
  9. Canadian Cancer Statistics|Canadian Cancer Society. Available online: https://cancer.ca/en/research/cancer-statistics/canadian-cancer-statistics?_gl=1*17fxbcs*_up*MQ..&gclid=EAIaIQobChMI75_jjoSTiAMVexatBh2ZajOREAAYASAAEgJ9AfD_BwE (accessed on 12 August 2024).
  10. United States Environmental Protection Agency (USEPA). Risk Assessment Guidance for Superfund (RAGS): Part F|US EPA. 2009. Available online: https://www.epa.gov/risk/risk-assessment-guidance-superfund-rags-part-f (accessed on 12 August 2024).
  11. Kim, S.-J.; Lee, S.-J.; Lee, H.-Y.; Son, J.-M.; Lim, H.-B.; Kim, H.-W.; Shin, H.-J.; Lee, J.Y.; Choi, S.-D. Characteristics of Volatile Organic Compounds in the Metropolitan City of Seoul, South Korea: Diurnal Variation, Source Identification, Secondary Formation of Organic Aerosol, and Health Risk. Sci. Total Environ. 2022, 838, 156344. [Google Scholar] [CrossRef] [PubMed]
  12. Bozkurt, Z.; Üzmez, Ö.Ö.; Döğeroğlu, T.; Artun, G.; Gaga, E.O. Atmospheric Concentrations of SO2, NO2, Ozone and VOCs in Düzce, Turkey Using Passive Air Samplers: Sources, Spatial and Seasonal Variations and Health Risk Estimation. Atmos. Pollut. Res. 2018, 9, 1146–1156. [Google Scholar] [CrossRef]
  13. Xuan, L.; Ma, Y.; Xing, Y.; Meng, Q.; Song, J.; Chen, T.; Wang, H.; Wang, P.; Zhang, Y.; Gao, P. Source, Temporal Variation and Health Risk of Volatile Organic Compounds (VOCs) from Urban Traffic in Harbin, China. Environ. Pollut. 2021, 270, 116074. [Google Scholar] [CrossRef] [PubMed]
  14. Fowle, J.R.; Dearfield, K.L. Risk Characterization: Handbook; U.S. Environmental Protection Agency: Washington, DC, USA, 2000. [Google Scholar] [CrossRef]
  15. Hui, L.; Liu, X.; Tan, Q.; Feng, M.; An, J.; Qu, Y.; Zhang, Y.; Cheng, N. VOC Characteristics, Sources and Contributions to SOA Formation during Haze Events in Wuhan, Central China. Sci. Total Environ. 2019, 650, 2624–2639. [Google Scholar] [CrossRef] [PubMed]
  16. Zhang, H.; Li, H.; Zhang, Q.; Zhang, Y.; Zhang, W.; Wang, X.; Bi, F.; Chai, F.; Gao, J.; Meng, L.; et al. Atmospheric Volatile Organic Compounds in a Typical Urban Area of Beijing: Pollution Characterization, Health Risk Assessment and Source Apportionment. Atmosphere 2017, 8, 61. [Google Scholar] [CrossRef]
  17. Bari, M.A.; Kindzierski, W.B. Concentrations, Sources and Human Health Risk of Inhalation Exposure to Air Toxics in Edmonton, Canada. Chemosphere 2017, 173, 160–171. [Google Scholar] [CrossRef] [PubMed]
  18. Bari, M.A.; Kindzierski, W.B. Ambient Volatile Organic Compounds (VOCs) in Communities of the Athabasca Oil Sands Region: Sources and Screening Health Risk Assessment. Environ. Pollut. 2018, 235, 602–614. [Google Scholar] [CrossRef] [PubMed]
  19. United States Environmental Protection Agency (USEPA). The Technical Support Document for the Hazardous Waste Delisting Risk Assessment Software (DRAS)|US EPA. 2020. Available online: https://www.epa.gov/hw/technical-support-document-hazardous-waste-delisting-risk-assessment-software-dras (accessed on 12 August 2024).
  20. Xiong, Y.; Bari, M.A.; Xing, Z.; Du, K. Ambient Volatile Organic Compounds (VOCs) in Two Coastal Cities in Western Canada: Spatiotemporal Variation, Source Apportionment, and Health Risk Assessment. Sci. Total Environ. 2020, 706, 135970. [Google Scholar] [CrossRef] [PubMed]
  21. Wheeler, A.J.; Smith-Doiron, M.; Xu, X.; Gilbert, N.L.; Brook, J.R. Intra-Urban Variability of Air Pollution in Windsor, Ontario—Measurement and Modeling for Human Exposure Assessment. Environ. Res. 2008, 106, 7–16. [Google Scholar] [CrossRef] [PubMed]
  22. Miller, L.; Xu, X.; Grgicak-Mannion, A.; Brook, J.; Wheeler, A. Multi-Season, Multi-Year Concentrations and Correlations amongst the BTEX Group of VOCs in an Urbanized Industrial City. Atmos. Environ. 2012, 61, 305–315. [Google Scholar] [CrossRef]
  23. Ontario Ministry of the Environment, Conservation and Parks (MECP). Air Quality in Ontario 2021 Report|ontario.ca. Available online: https://www.ontario.ca/document/air-quality-ontario-2021-report (accessed on 8 August 2024).
  24. Stroud, C.A.; Zhang, J.; Boutzis, E.I.; Zhang, T.; Mashayekhi, R.; Nikiema, O.; Majdzadeh, M.; Wren, S.N.; Xu, X.; Su, Y. Impact of Solvent Emissions on Reactive Aromatics and Ozone in the Great Lakes Region. Atmosphere 2023, 14, 1094. [Google Scholar] [CrossRef]
  25. United States Environmental Protection Agency (USEPA). Review of the Reference Dose and Reference Concentration Processes Document|US EPA. 2002. Available online: https://www.epa.gov/risk/review-reference-dose-and-reference-concentration-processes-document (accessed on 12 August 2024).
  26. Li, Y.; Yin, S.; Yu, S.; Yuan, M.; Dong, Z.; Zhang, D.; Yang, L.; Zhang, R. Characteristics, Source Apportionment and Health Risks of Ambient VOCs during High Ozone Period at an Urban Site in Central Plain, China. Chemosphere 2020, 250, 126283. [Google Scholar] [CrossRef] [PubMed]
  27. Detroit Refinery|Marathon Petroleum Refineries. Available online: https://www.marathonpetroleum.com/Operations/Refining/Detroit-Refinery/ (accessed on 12 August 2024).
  28. United States Environmental Protection Agency (USEPA). National Emission Inventory. 2020 NEI Data Retrieval Tool. 2024. Available online: https://awsedap.epa.gov/public/single/?appid=20230c40-026d-494e-903f-3f112761a208&sheet=5d3fdda7-14bc-4284-a9bb-cfd856b9348d&opt=ctxmenu,currsel (accessed on 12 August 2024).
  29. Zhang, T.; Xu, X.; Su, Y. Impacts of Regional Transport and Meteorology on Ground-Level Ozone in Windsor, Canada. Atmosphere 2020, 11, 1111. [Google Scholar] [CrossRef]
  30. Zhang, D.; He, B.; Yuan, M.; Yu, S.; Yin, S.; Zhang, R. Characteristics, Sources and Health Risks Assessment of VOCs in Zhengzhou, China during Haze Pollution Season. J. Environ. Sci. 2021, 108, 44–57. [Google Scholar] [CrossRef] [PubMed]
  31. Environment and Climate Change Canada (ECCC). National Air Pollution Surveillance (NAPS) Program—Open Government Portal. Available online: https://open.canada.ca/data/en/dataset/1b36a356-defd-4813-acea-47bc3abd859b (accessed on 12 August 2024).
Figure 1. Location of the study area and Windsor West monitoring station in Ontario, Canada.
Atmosphere 15 01038 g001
Figure 2. Seasonal variation in total cancer risk and cancer risk of benzene and ethylbenzene.
Atmosphere 15 01038 g002
Figure 3. Diurnal variation in cancer risk (solid circles) and 95% confidence interval (error bars) for (a) benzene, (b) ethylbenzene, and (c) total cancer risk.
Atmosphere 15 01038 g003
Figure 4. HQ and contribution (%) of each of 16 VOCs to total HQ. “Others” include n-propylbenzene, propene, and cyclohexane.
Atmosphere 15 01038 g004
Figure 5. Seasonal variation in the total HQ and HI for each organ in Windsor.
Atmosphere 15 01038 g005
Figure 6. Diurnal variation in total HQ (solid circles) and 95% confidence interval (error bars).
Atmosphere 15 01038 g006
Figure 7. Directional distribution of total CR: (a) overall, (b) spring, (c) summer, (d) fall, and (e) winter.
Atmosphere 15 01038 g007aAtmosphere 15 01038 g007b
Figure 8. Directional distribution of total HQ: (a) overall, (b) spring, (c) summer, (d) fall, and (e) winter.
Atmosphere 15 01038 g008
Figure 9. Directional distribution of HI by organ for the (a) nervous system, (b) hematologic system and immune system, (c) liver/ kidney, (d) developmental system, (e) endocrine system and urinary system, and (f) respiratory system.
Atmosphere 15 01038 g009
Table 1. General statistics of hourly concentrations of the 16 VOCs (CV stands for coefficient of variation).
CompoundMin (µg/m3)Mean (µg/m3)Median (µg/m3)Max (µg/m3) SD (µg/m3)CV (%)
n-Nonane0.09450.1730.1093.290.191110
Benzene0.09480.4960.4015.700.44289
1,3,5-Trimethylbenzene0.09470.1510.1072.460.14596
1,2,4-Trimethylbenzene0.09470.2890.1126.760.520180
1,2,3-Trimethylbenzene0.09520.2420.1113.320.282116
m,p-Xylene0.09470.5950.34213.20.822138
o-Xylene0.09430.2120.1125.020.273129
Methylcyclohexane0.09440.1520.1072.200.12784
i-Propylbenzene0.09470.1130.1051.040.041737
n-Hexane0.09501.100.30153.12.90263
Ethylbenzene0.09430.1850.1107.250.217117
n-Propylbenzene0.09470.1320.1051.040.041737
Styrene0.09450.1370.1063.290.170124
Propene0.09640.2910.1996.570.315108
Toluene0.09700.9990.62919.01.26126
Cyclohexane0.09500.1220.1052.520.089974
Table 2. The IURs and a comparison of CRs in this study with these in other studies.
Study AreasBenzene
IUR = 7.8 × 10⁻⁶ (µg/m3)−1 [7]
Ethylbenzene
IUR = 2.5 × 10⁻⁶ (µg/m3)−1 [8]
Total CRInvestigated CompoundsReferences
Windsor, ON, Canada3.87 × 10−64.63 × 10−74.33 × 10−6Benzene and ethylbenzenePresent study
Port Moody, BC, Canada 3.8 × 10−52.8 × 10−61.4 × 10−411 VOCs[20]
Burnaby, BC, Canada 2.8 × 10−51.4 × 10−61.1 × 10−411 VOCs[20]
Athabasca oil sands region, AB, Canada 6.51 × 10−61.55 × 10−62.69 × 10⁻⁵Benzene, ethylbenzene, and acetaldehyde[18]
Harbin, China4.73 × 10−66.39 ×10−75.37 × 10−6Benzene and ethylbenzene[13]
Beijing, China4.96 ×10−6 4.96 × 10⁻⁶Benzene only[26]
Zhengzhou, China1.0 × 10−62.45 ×10−72.92 × 10−521 VOCs[27]
Table 3. RfCs and HQs for each of 16 VOCs and HI by organ in Windsor, Ontario, Canada. Sources of RfCs and target organs are presented in Table S2.
CompoundRfC (µg/m3)Target OrgansMean Concentration (µg/m3) [Rank]HQContribution to HI (%) [Rank]
n-Nonane20 N.A.0.173 [10]0.0086617.7 [2]
Benzene30Hematologic and immune system0.496 [4]0.016533.9 [1]
1,3,5-Trimethylbenzene60Nervous system0.151 [12]0.002525.17 [6]
1,2,4-Trimethylbenzene60Nervous system0.289 [6]0.004829.88 [4]
1,2,3-Trimethylbenzene60Nervous system0.242 [7]0.004038.28 [5]
m,p-Xylene100Nervous system0.595 [3]0.0059512.2 [3]
o-Xylene100Nervous system0.212 [8]0.002124.35 [7]
Methylcyclohexane100Liver/ kidney0.152 [11]0.001523.12 [9]
i-Propylbenzene400Endocrine and urinary system0.113 [16]0.0002820.578 [10]
n-Hexane700 Nervous system1.10 [1]0.001573.23 [8]
Ethylbenzene1000 Developmental system0.185 [9]0.0001850.379 [12]
n-Propylbenzene1000 Developmental system0.132 [14]0.0001320.270 [14]
Styrene1000Nervous system0.137 [13]0.0001370.281 [13]
Propene3000 Respiratory system0.291 [5]0.0000970.199 [15]
Toluene5000Nervous system0.999 [2]0.00020.409 [11]
Cyclohexane6000Developmental system0.122 [15]0.00002030.0416 [16]
Total HQ 0.0488100
Table 4. Comparison of HQs for 16 VOCs in this study with these in other studies.
CompoundWindsor, ON, CanadaPort Moody, BC, CanadaBurnaby, BC, Canada Düzce, TurkeyHarbin, ChinaZhengzhou, ChinaBeijing, China
n-Nonane8.66 × 10−3 2.00 × 10⁻²
Benzene1.65 × 10−22.02 × 10−11.51 × 10−19.00 × 10−25.06 × 10−24.27 × 10−34.91 × 10−5
1,3,5-Trimethylbenzene2.52 × 10−3 7.00 × 10⁻³
1,2,4-Trimethylbenzene4.82 × 10−3 7.00 × 10⁻³
1,2,3-Trimethylbenzene4.03 × 10−3 4.00 × 10⁻³
m,p-Xylene5.95 × 10−2 1.00 × 10−22.20 × 10−31.32 × 10−31.92 × 10−4
o-Xylene2.12 × 10−3 7.00 × 10−31.09 × 10−31.08 × 10−38.55 × 10−3
Methylcyclohexane1.52 × 10−3 5.00 × 10⁻⁵
i-Propylbenzene2.82 × 10−4
n-Hexane1.57 × 10−37.33 × 10−54.38 × 10−56.00 × 10⁻⁴
Ethylbenzene1.85 × 10−42.62 × 10−41.32 × 10−47.00 × 10−41.16 × 10−49.81 × 10−54.13 × 10−4
n-Propylbenzene1.32 × 10−4
Styrene1.37 × 10−42.11 × 10−41.06 × 10−44.00 × 10⁻⁴
Propene9.70 × 10−51.60 × 10−41.10 × 10−4
Toluene2.00 × 10−49.17 × 10−36.29 × 10−39.00 × 10−41.73 × 10−46.46 × 10−51.88 × 10−4
Cyclohexane2.03 × 10−5 3.00 × 10⁻⁵
ReferencesPresent Study[20][20][12][13][27][26]
Table 5. The hazard index (HI) for each target organ due to exposure to 16 VOCs.
CompoundNervous System (% of HI)Hematologic System and Immune SystemLiver/KidneyDevelopmental System (% of HI)Endocrine System and Urinary SystemRespiratory System
Benzene 1.65 × 10⁻²
1,3,5-Trimethylbenzene2.52 × 10−3 (12%)
1,2,4-Trimethylbenzene4.82 × 10−3 (23%)
1,2,3-Trimethylbenzene4.03 × 10−3 (19%)
m,p-Xylene5.95 × 10−2 (28%)
o-Xylene2.12 × 10−3 (10%)
Methylcyclohexane 1.52 × 10⁻³
i-Propylbenzene 2.80 × 10⁻⁴
n-Hexane1.57 × 10−3 (7%)
Ethylbenzene 1.85 × 10⁻⁴ (55%)
n-Propylbenzene 1.32 × 10⁻⁴ (39%)
Styrene1.37 × 10−4 (1%)
Propene 9.70 × 10⁻⁵
Toluene2.00 × 10−4 (1%)
Cyclohexane 2.03 × 10⁻⁵ (6%)
Hazard Index (HI)2.13 × 10−21.65 × 10−21.52 × 10−33.37 × 10−42.80 × 10−49.70 × 10−5
Disclaimer/Publisher’s Note: The statements, opinions and data contained in all publications are solely those of the individual author(s) and contributor(s) and not of MDPI and/or the editor(s). MDPI and/or the editor(s) disclaim responsibility for any injury to people or property resulting from any ideas, methods, instructions or products referred to in the content.

