
Assessment of BDS-3 PPP-B2b Service and Its Applications for the Determination of Precipitable Water Vapour
 ,
,  and
and
Abstract
1. Introduction
2. Data and Methodologies
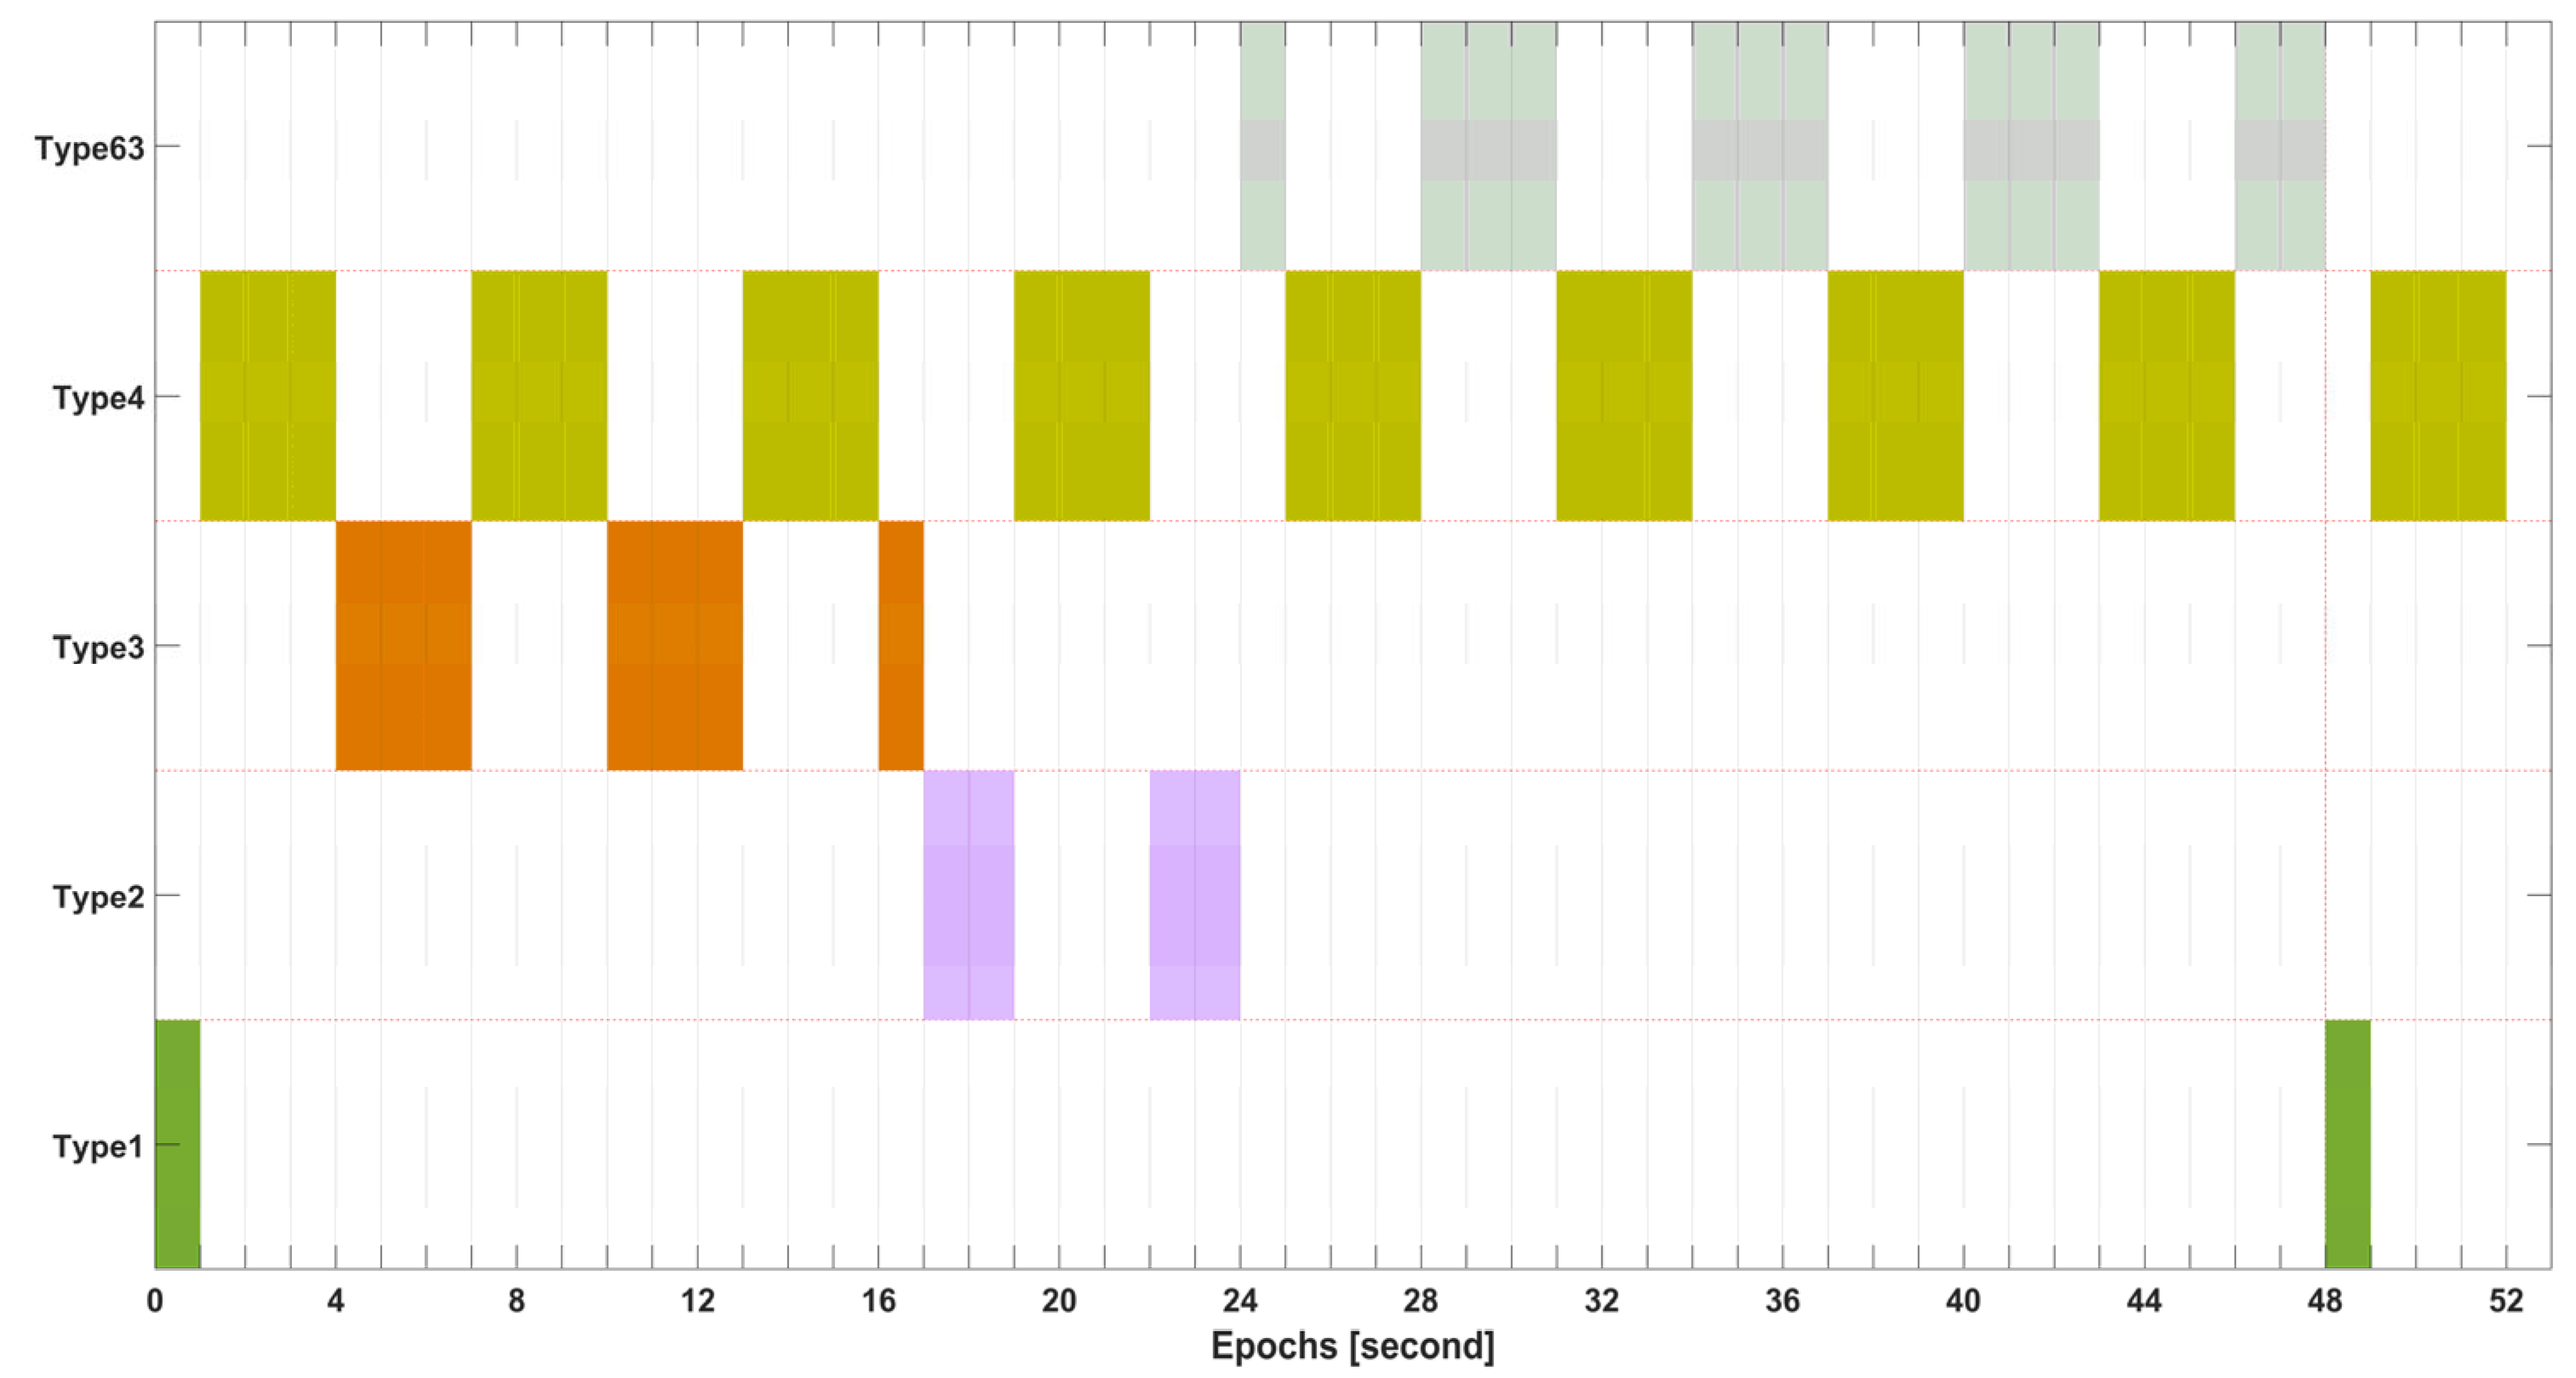
2.1. PPP-B2b Message and GNSS Observations
2.2. ERA5 Data
2.3. Radiosonde
2.4. ZTD and PWV Estimation with PPP
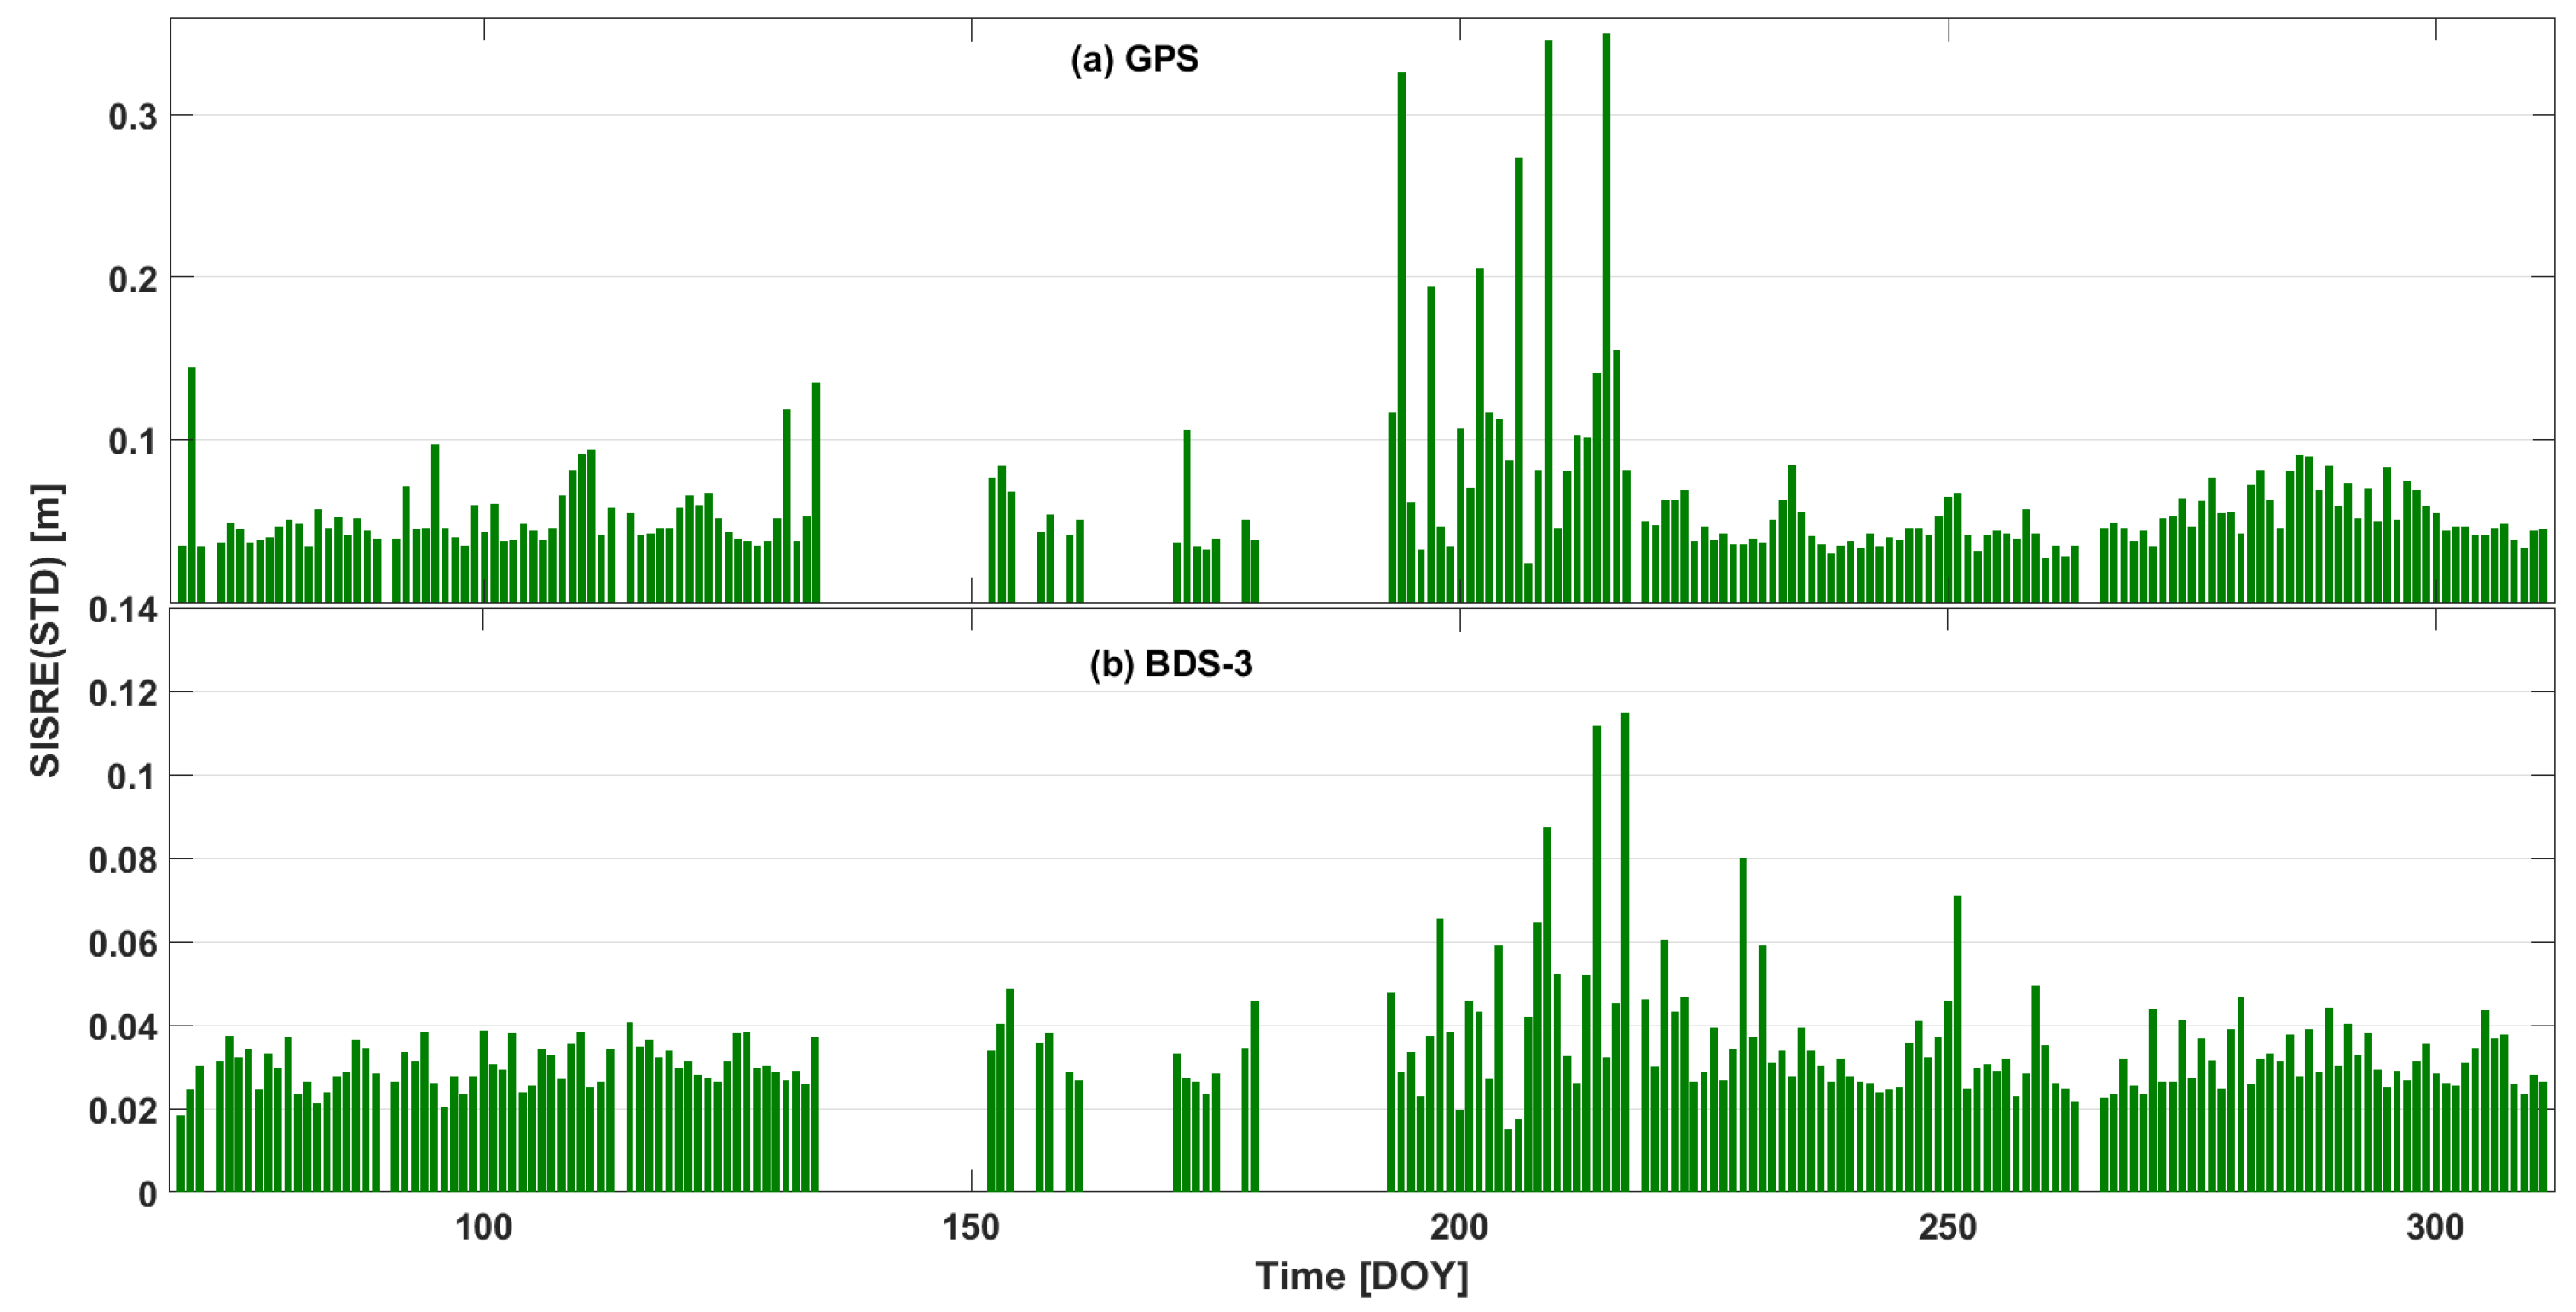
3. Evaluation of the Results for Clock, Orbit, and DCB
4. PPP-B2b ZTD Estimation and Evaluation of the Results
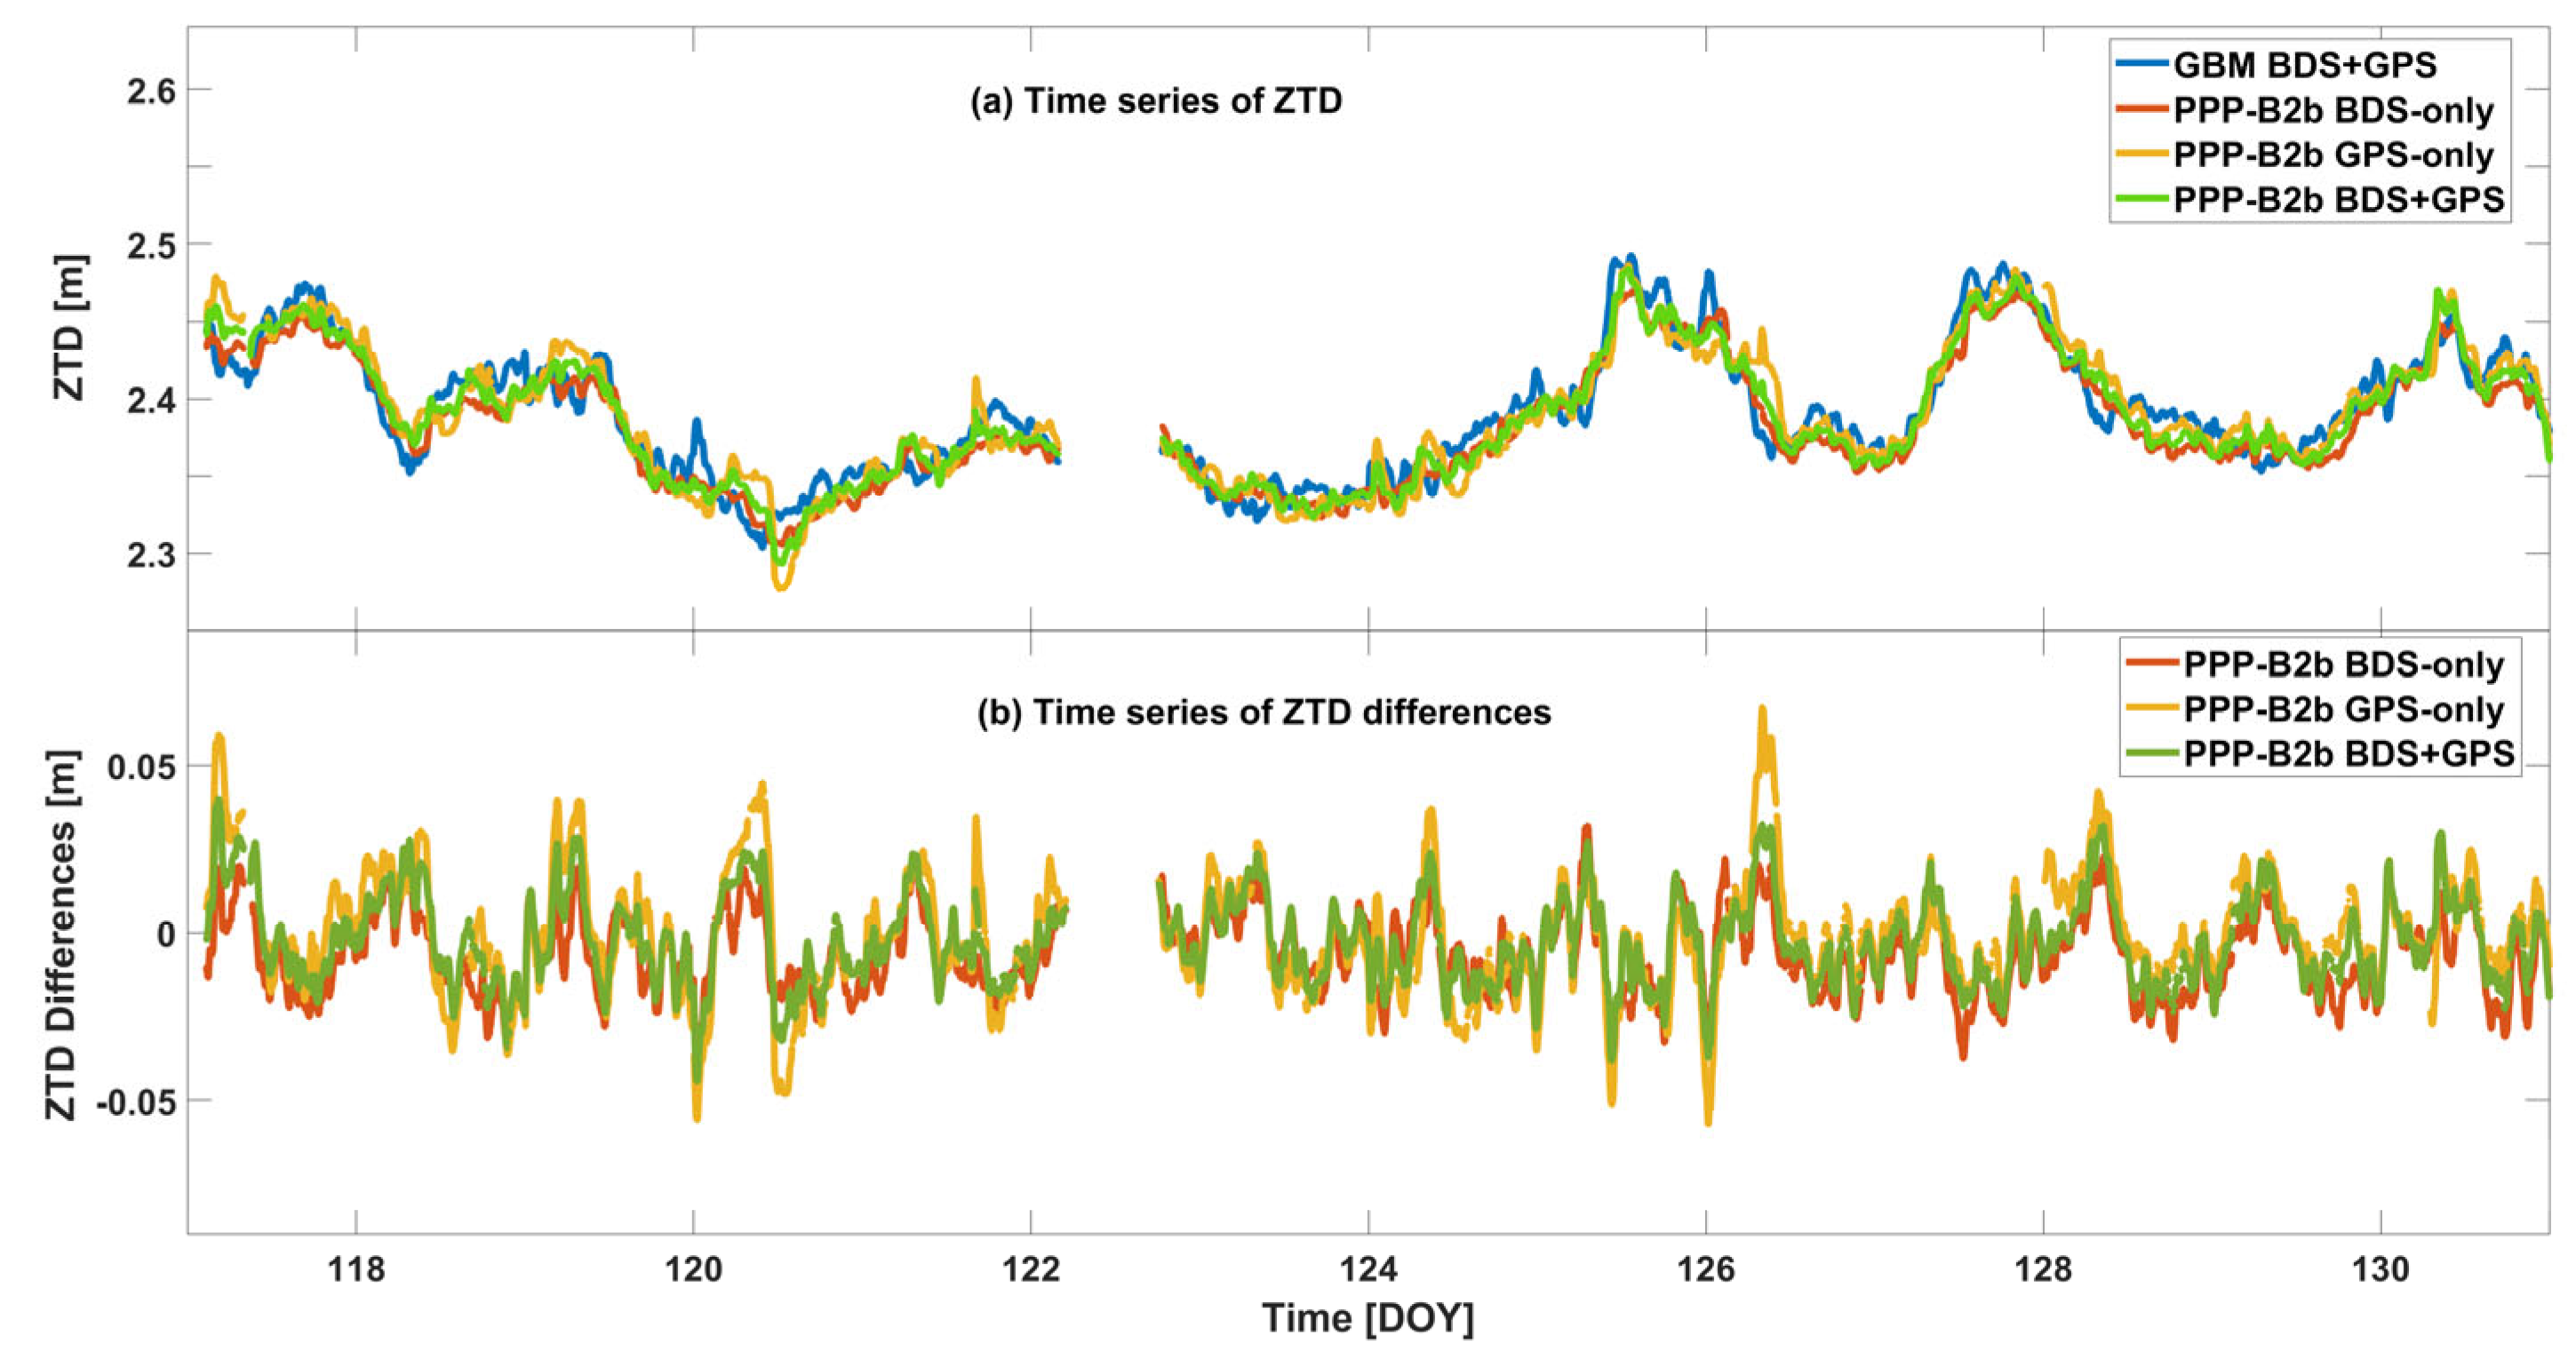
4.1. Evaluation of Real-Time PPP-B2b ZTD at Station BJ01
4.2. Comparison between ZTD Derived with PPP-B2b/CNES and the Post-Processed Results
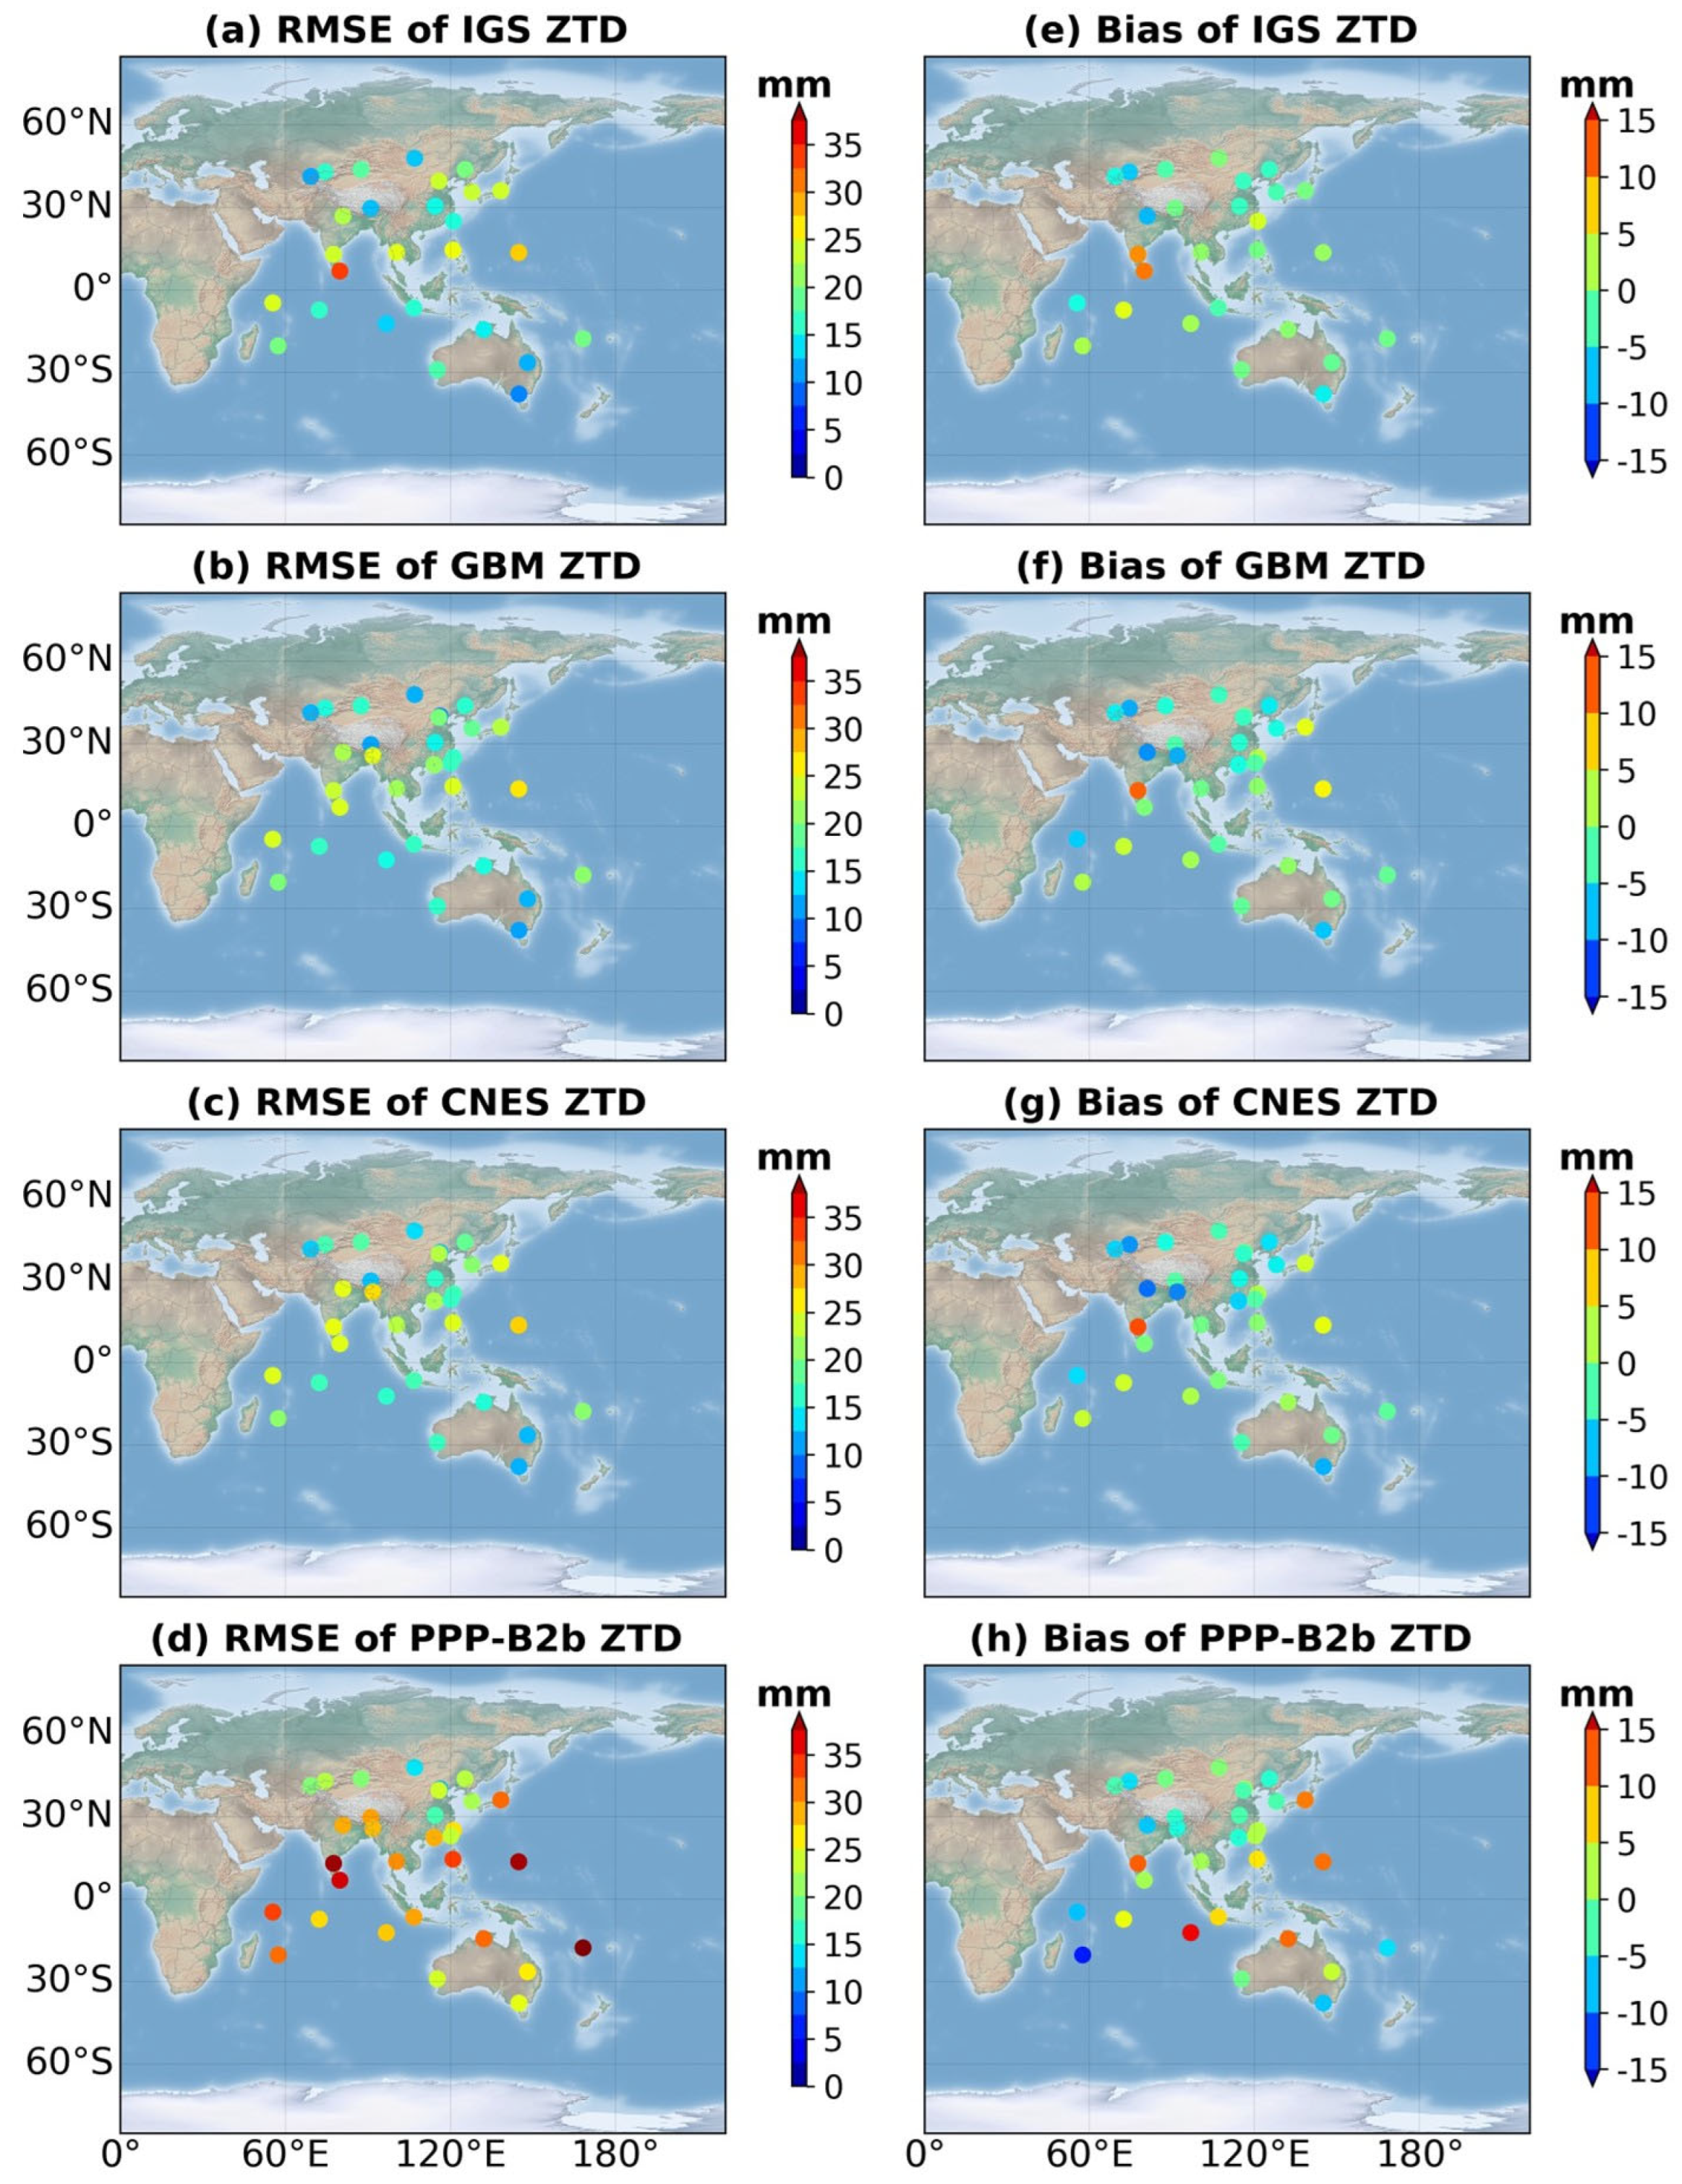
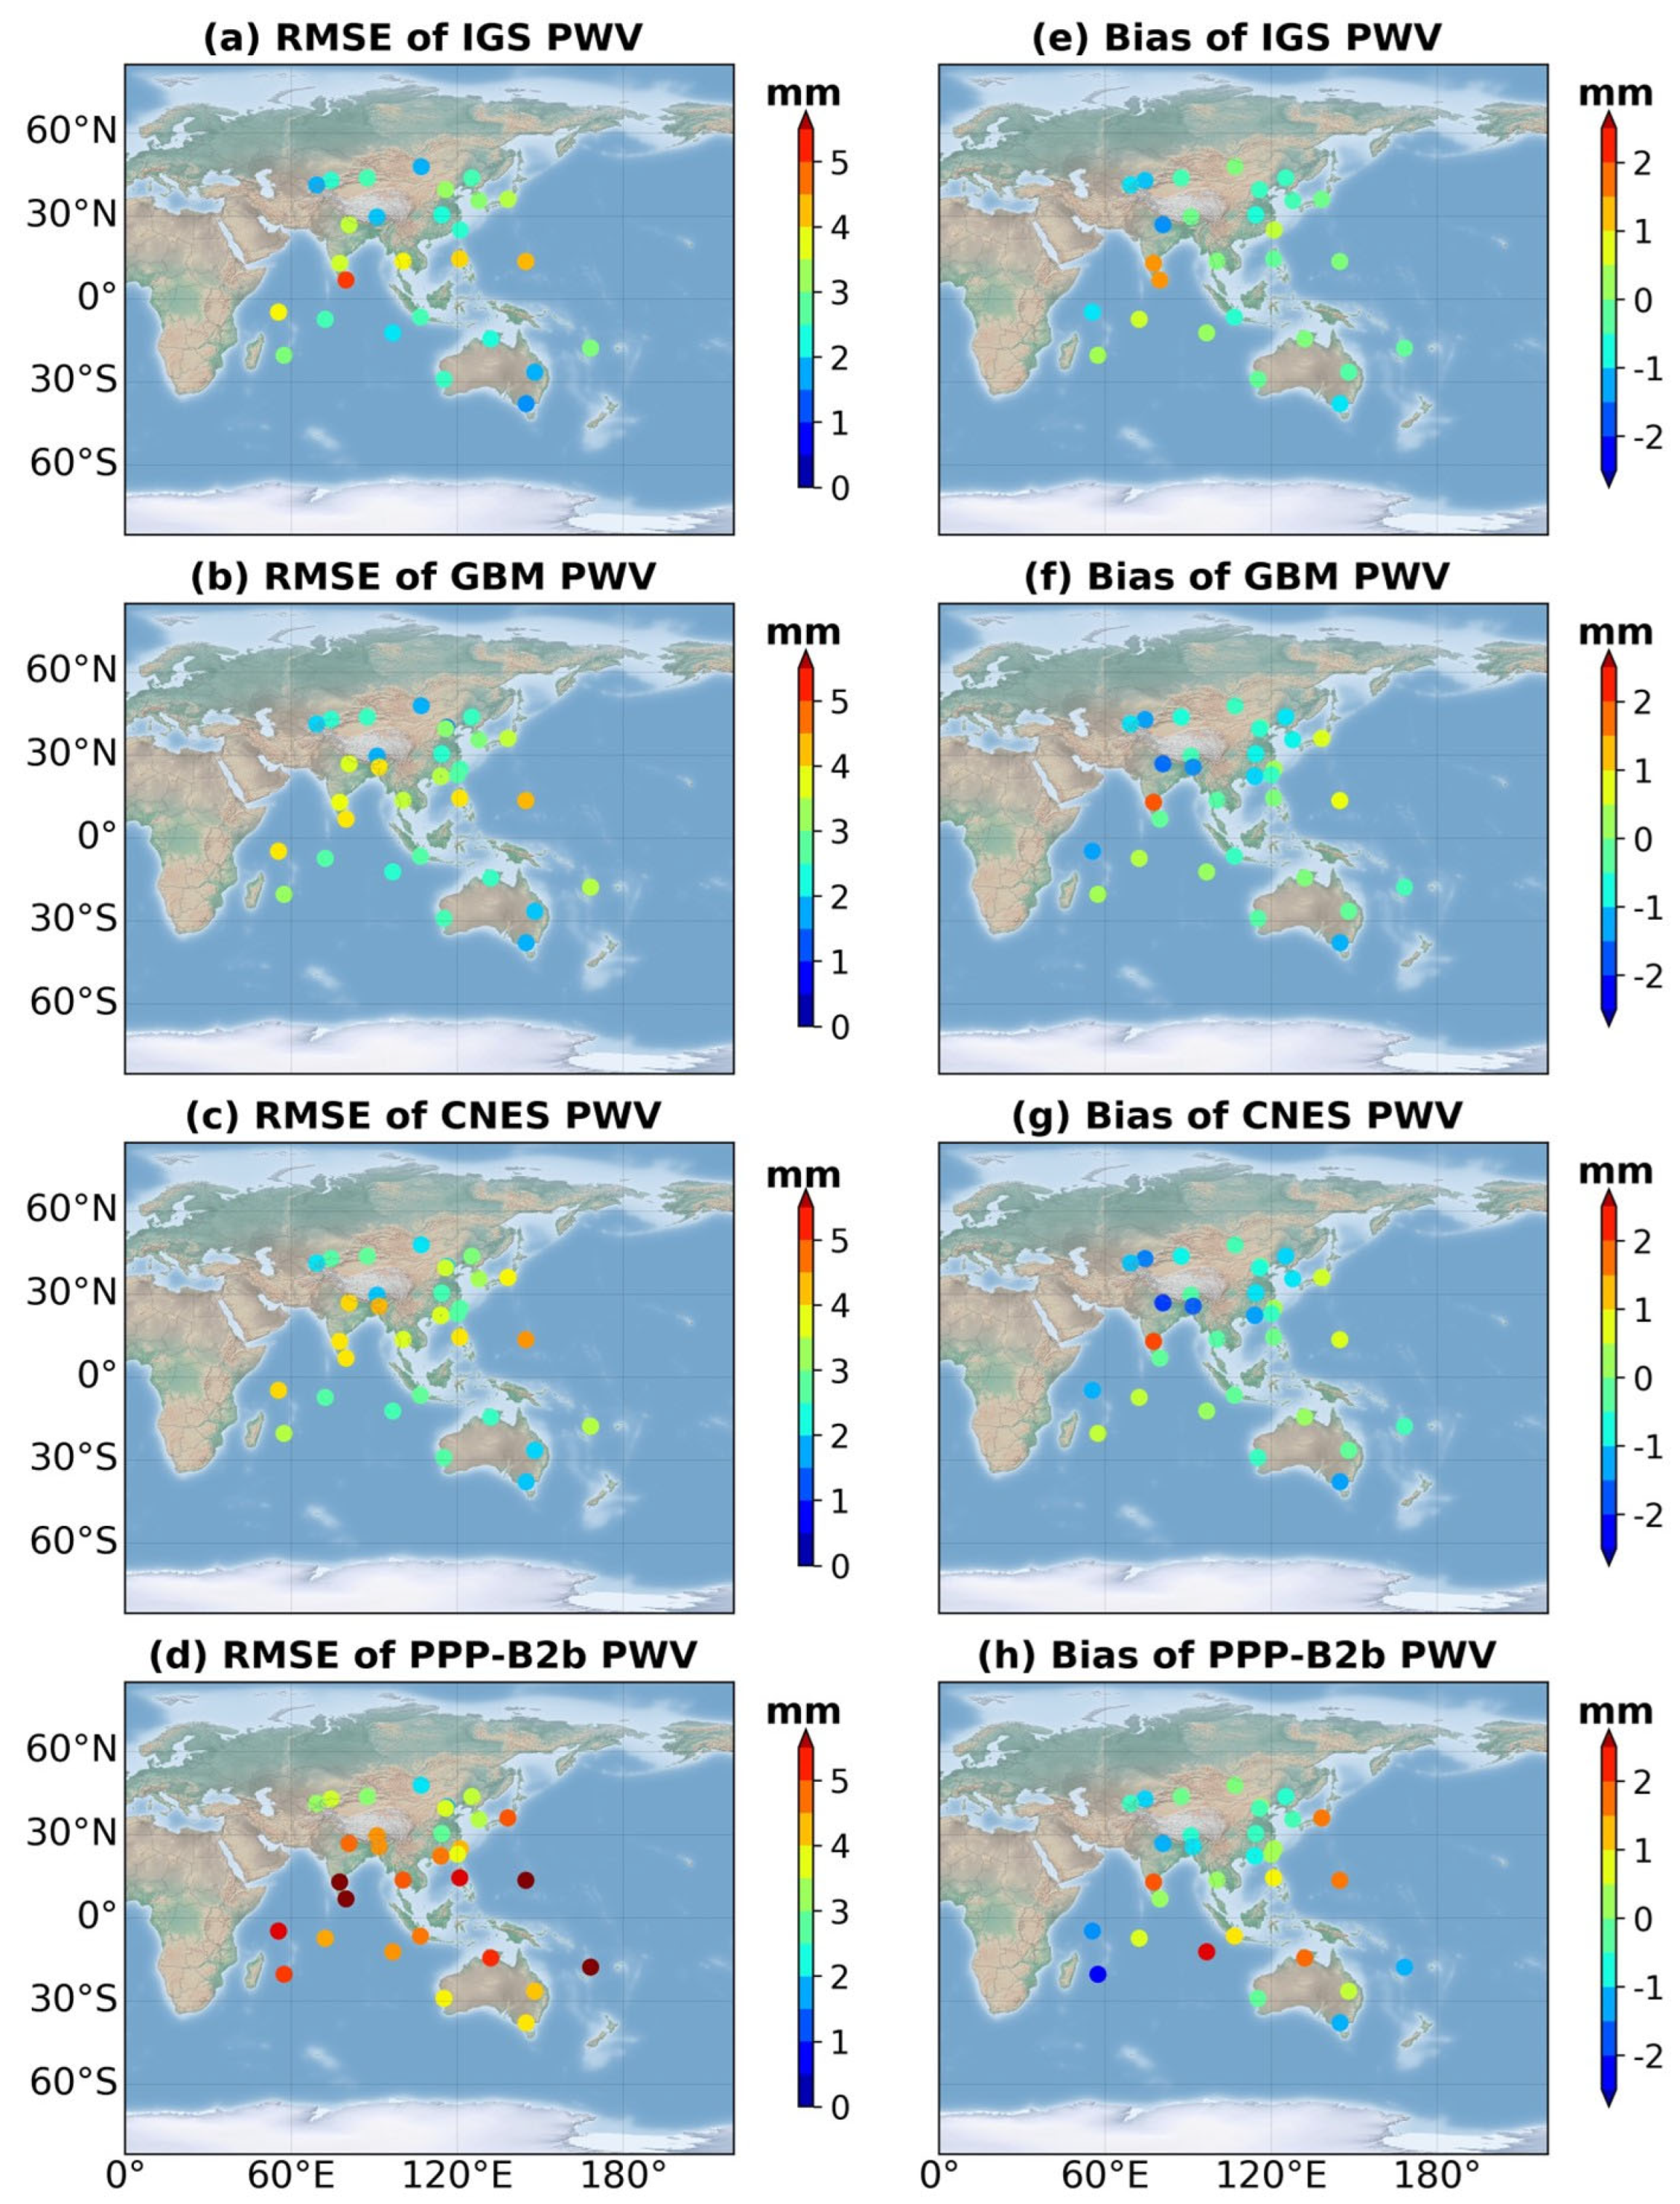
4.3. Comparison of the GNSS-Derived ZTD/PWV with That Derived from ERA5
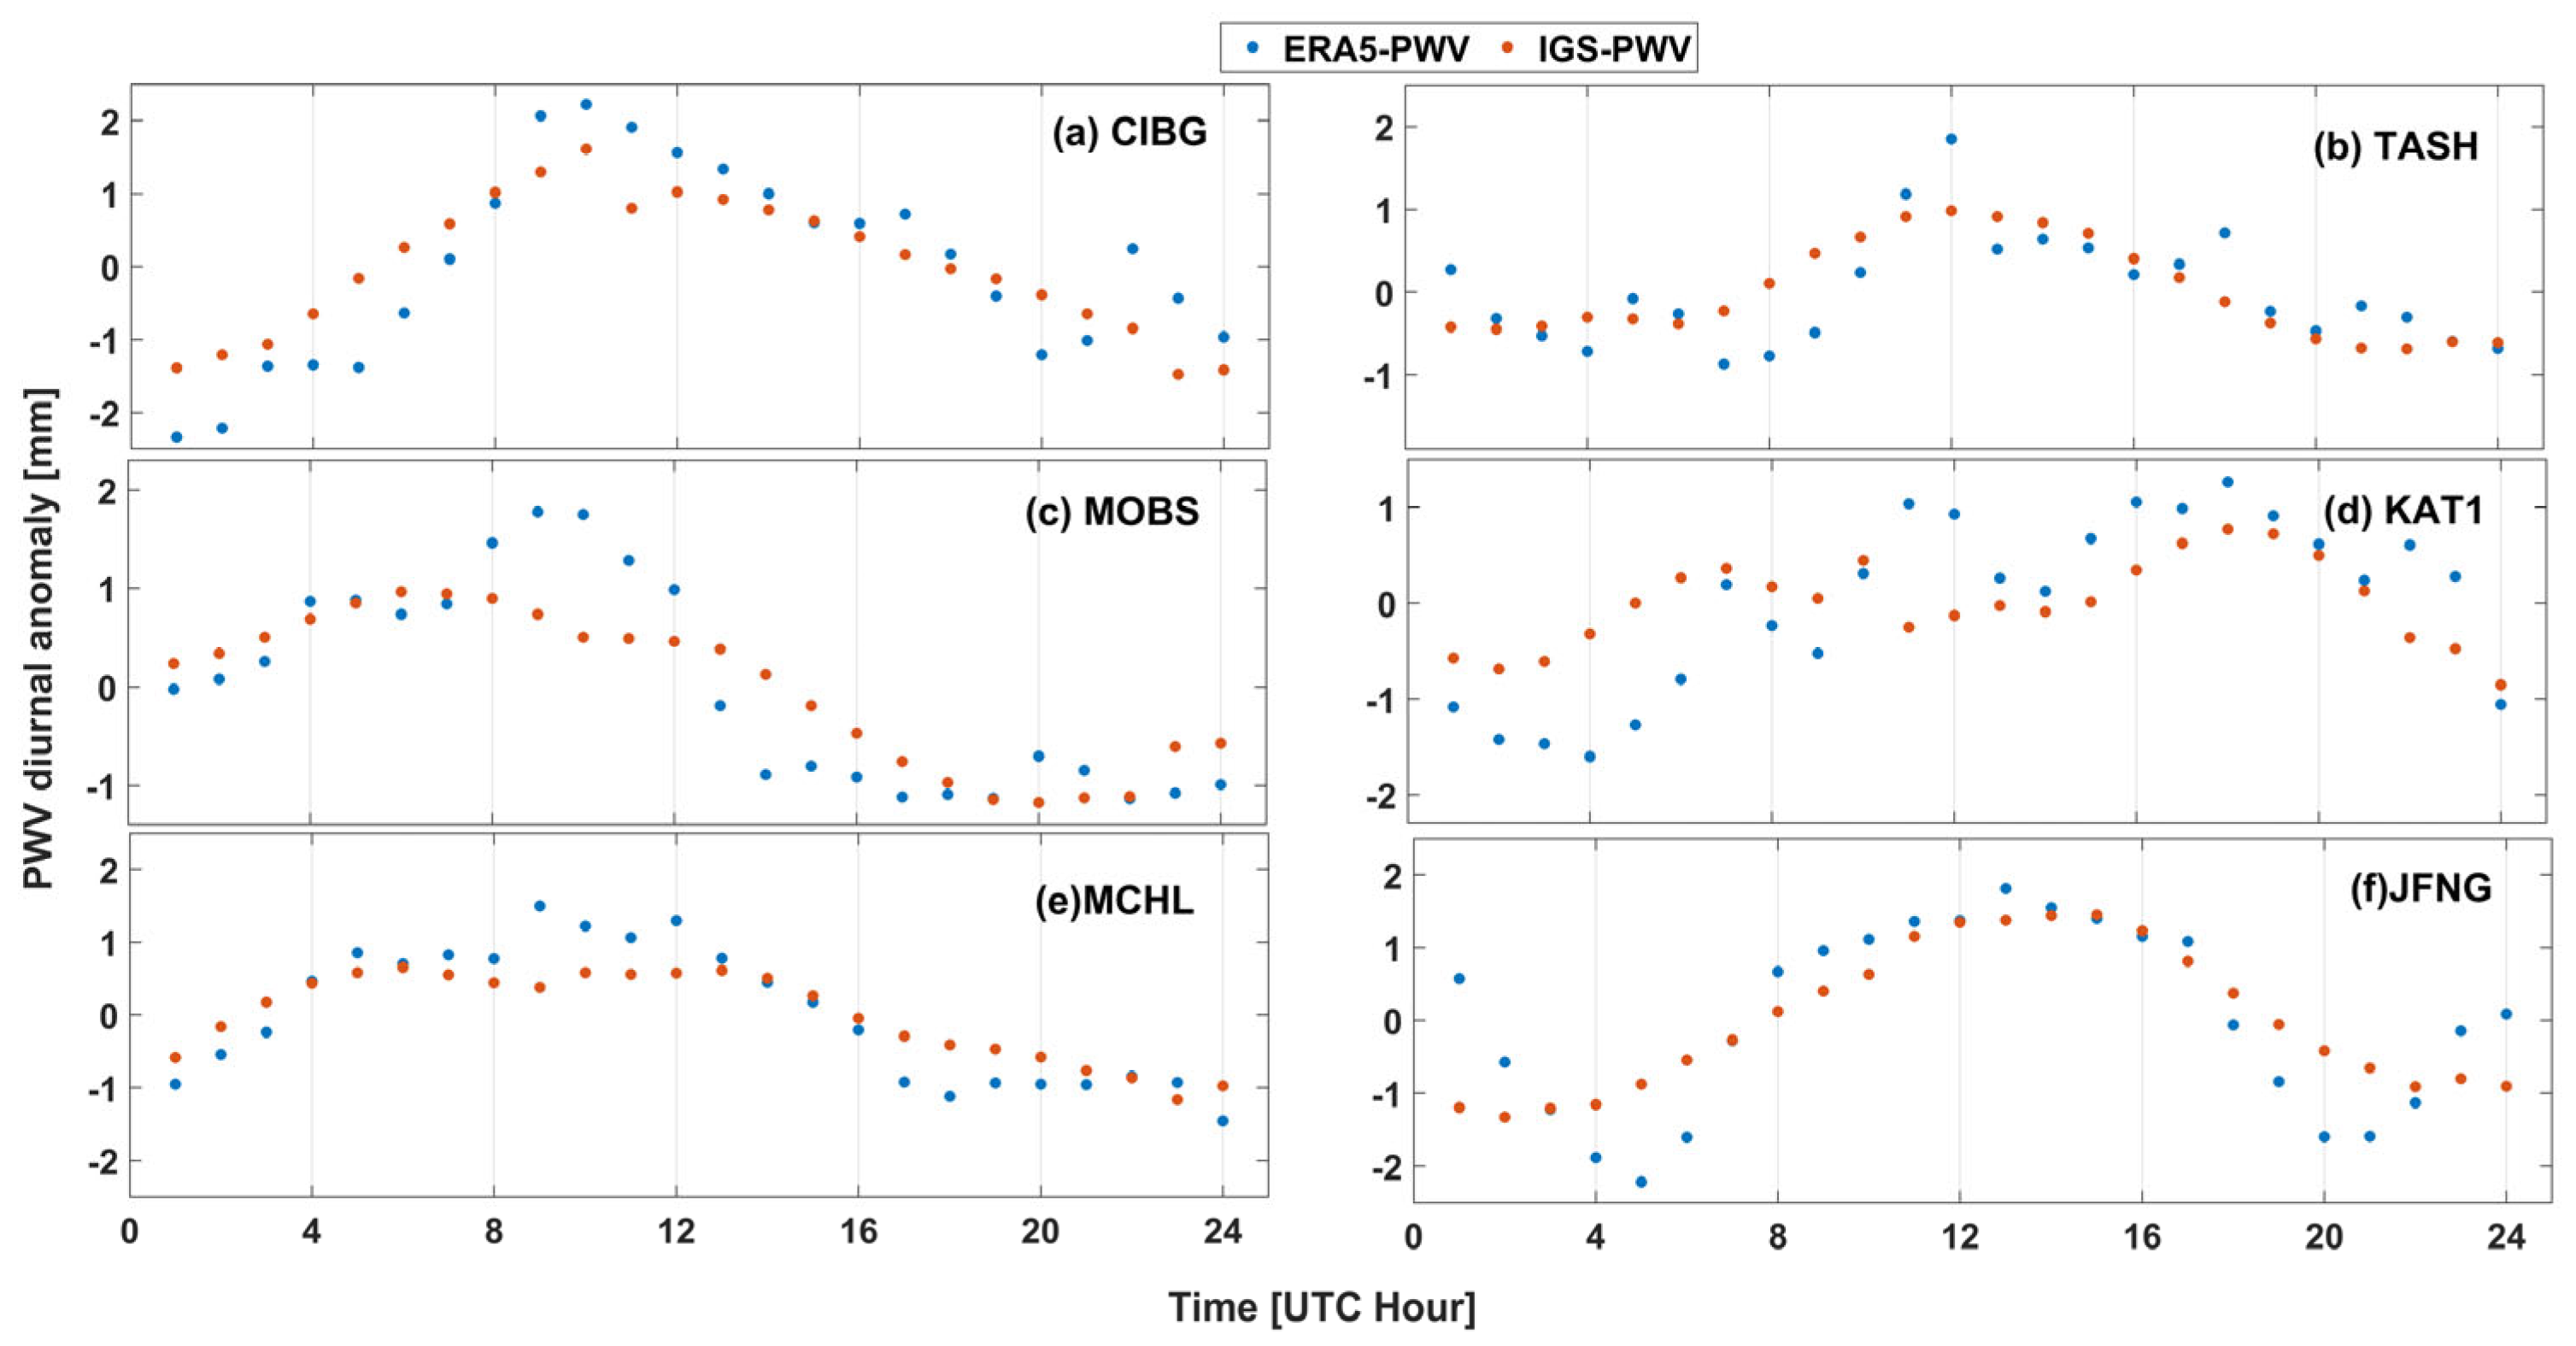
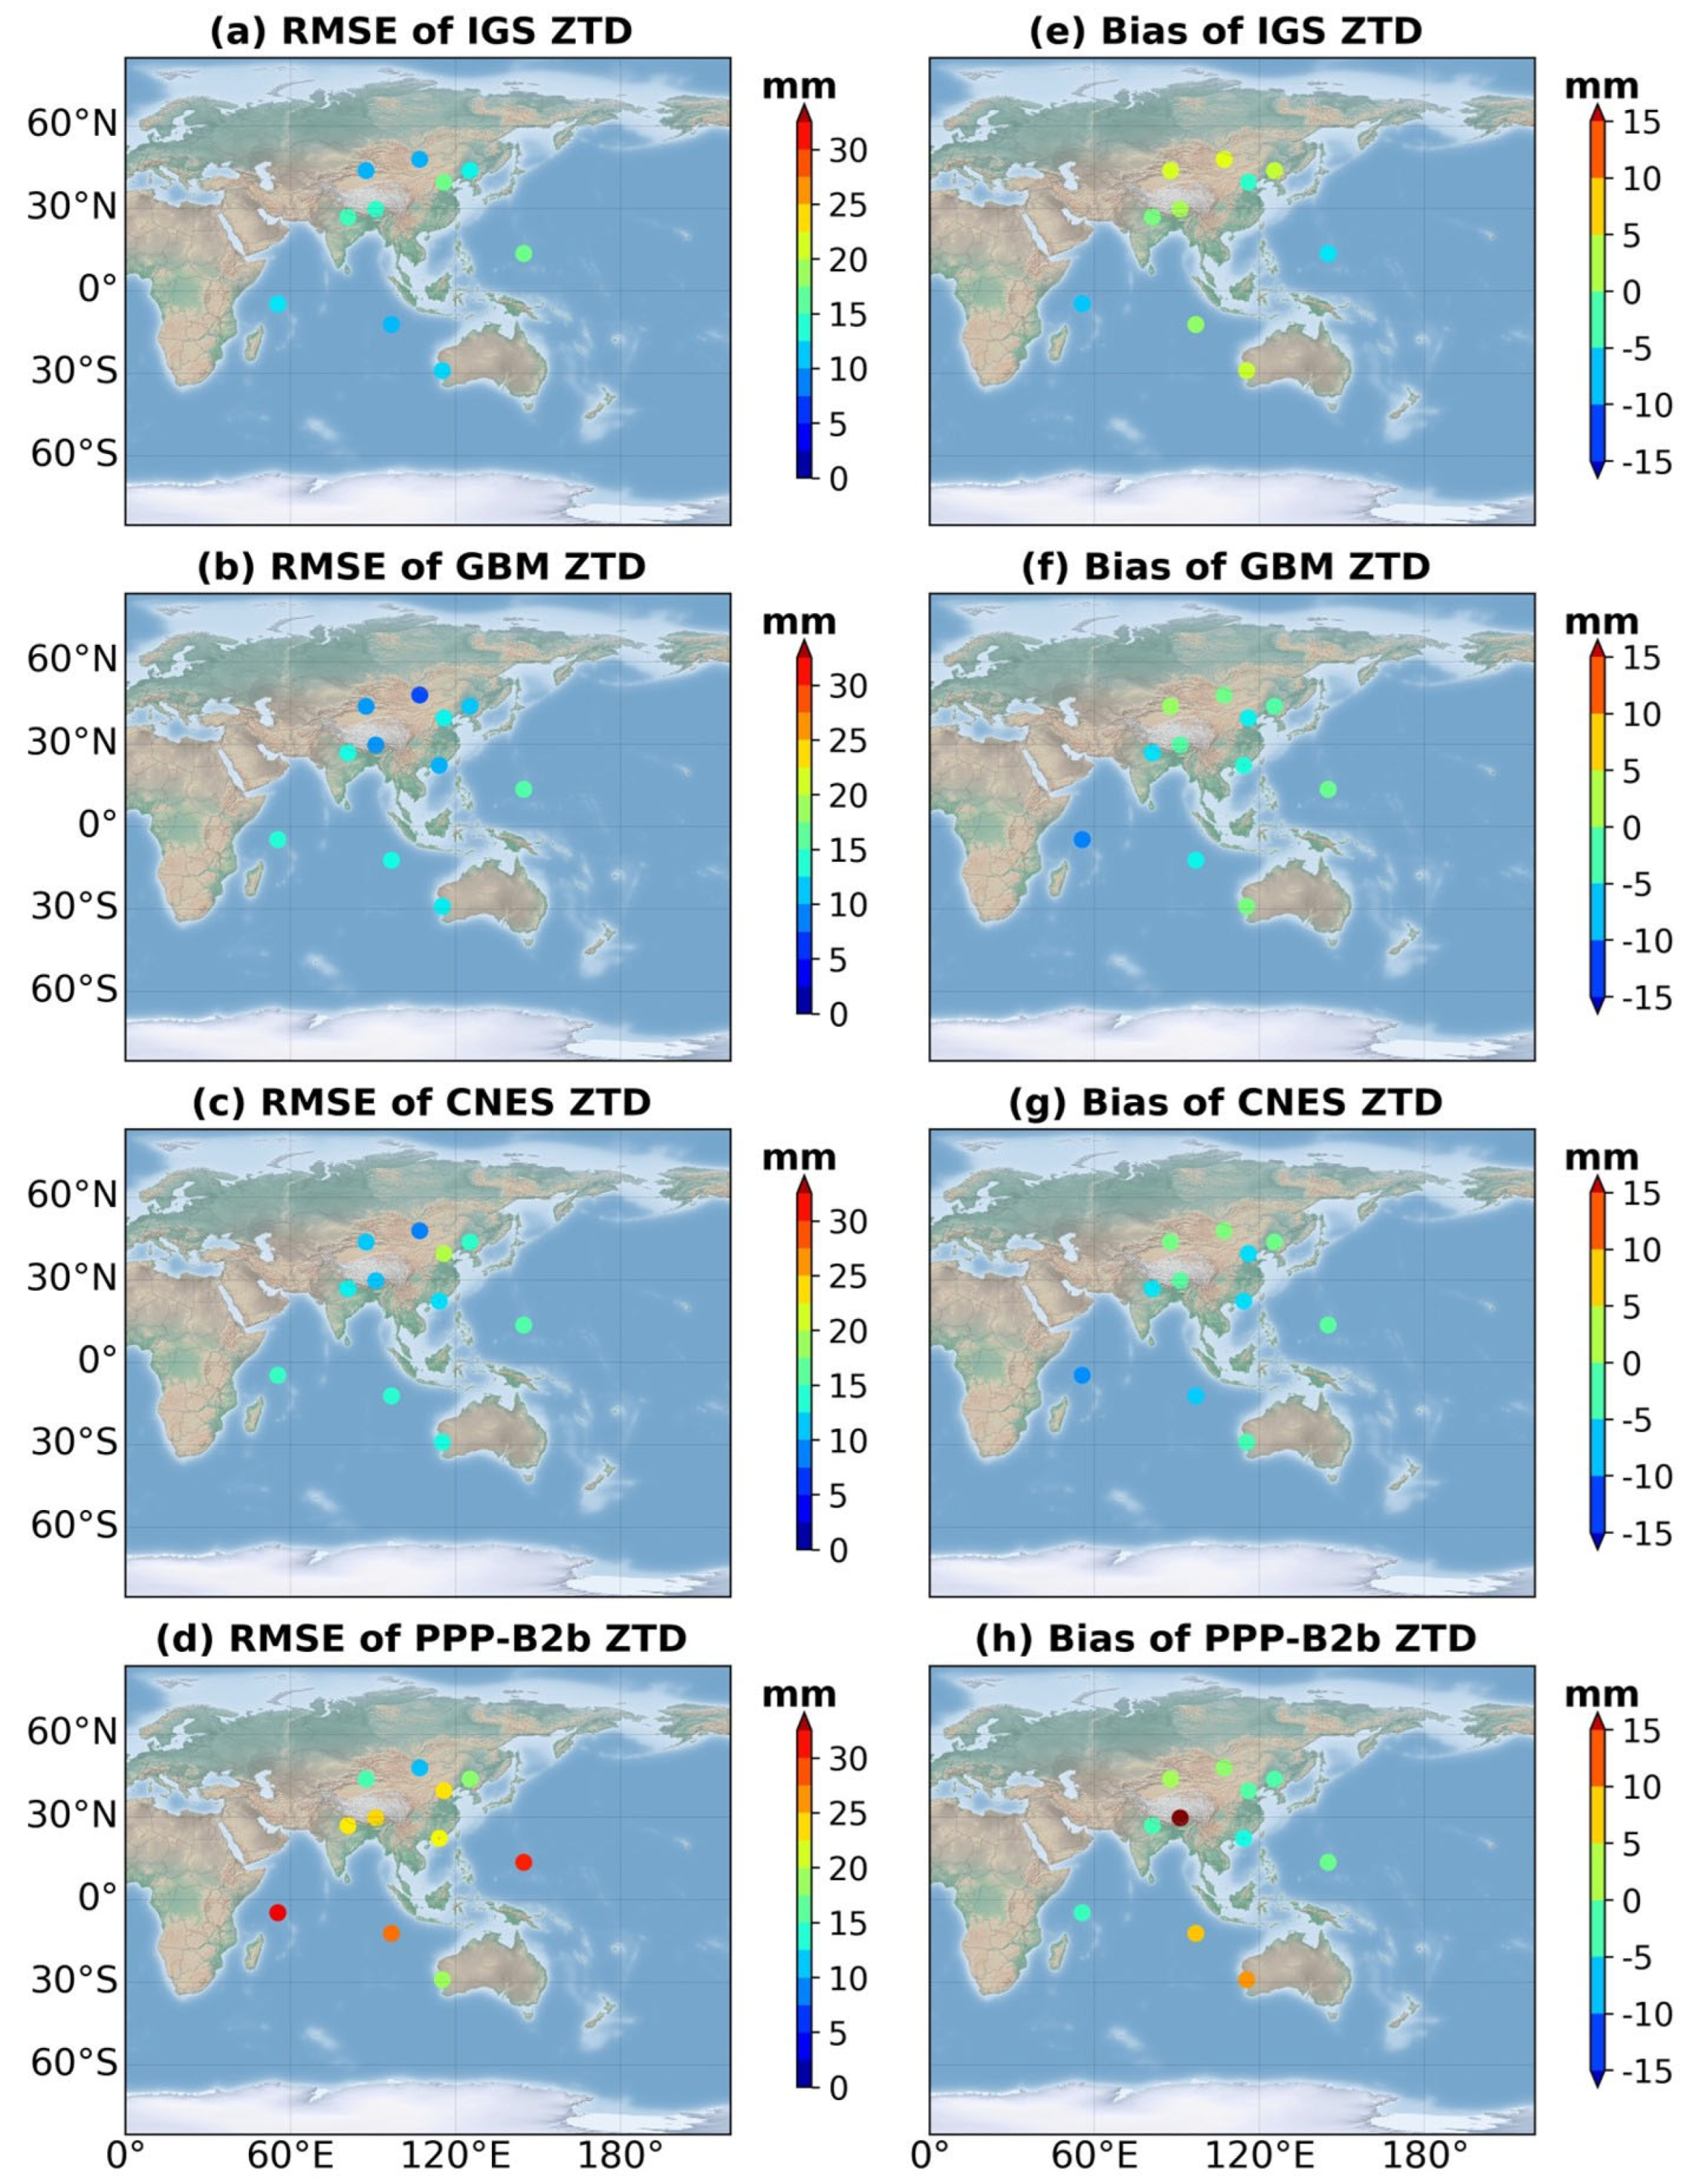
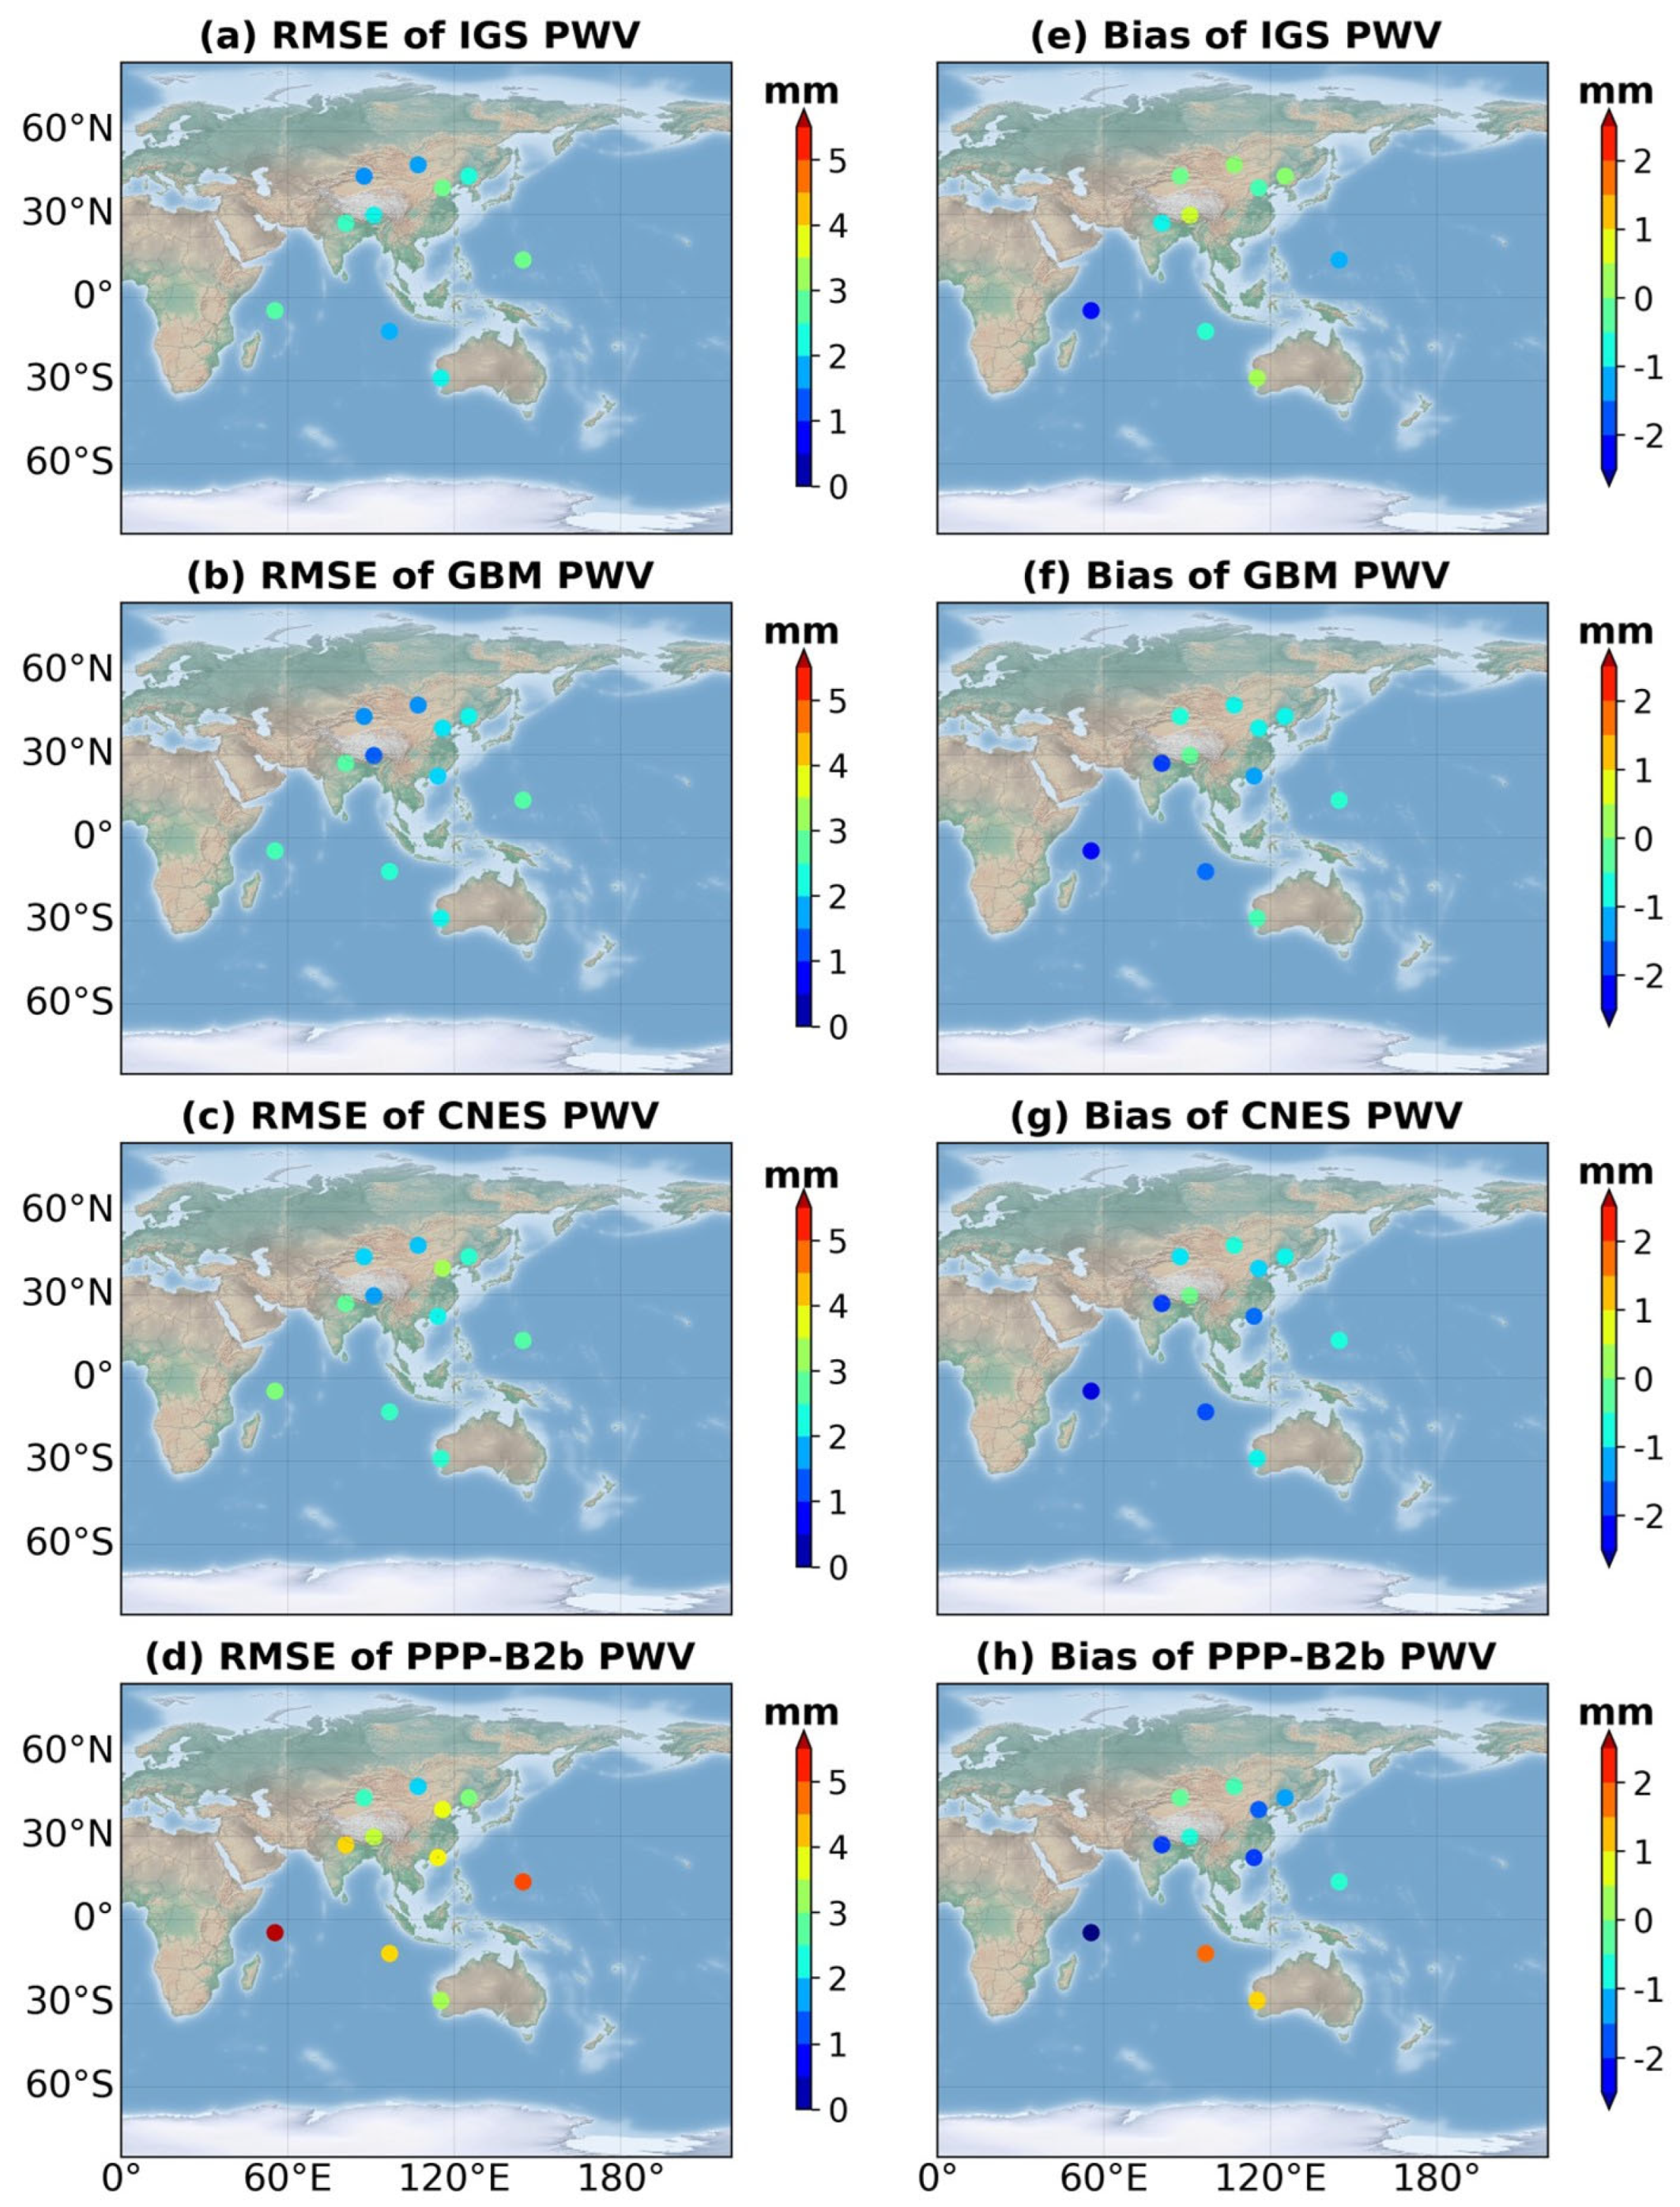
4.4. Comparison of the GNSS-Derived ZTD/PWV with That Derived from Radiosonde Data
5. Discussion
6. Conclusions
Author Contributions
Funding
Institutional Review Board Statement
Informed Consent Statement
Data Availability Statement
Acknowledgments
Conflicts of Interest
Appendix A. Decoding PPP-B2b Corrections

| Information Content | Update Interval | Nominal Validity |
|---|---|---|
| Orbit correction | 48 s | 96 s |
| Clock correction | 6 s | 12 s |
| Differential code bias | 48 s | 86,400 s |
| Message Types | Information Content | IOD Type |
|---|---|---|
| 1 | Satellite mask | IOD SSR, IODP |
| 2 | Orbit correction and user range accuracy index | IOD SSR, IODN, IODC |
| 3 | Differential code bias | IOD SSR |
| 4 | Satellite clock correction | IOD SSR, IODP, IODC |
| 5 | User range accuracy index | - |
| 6 | Clock correction and orbit correction—combination 1 | - |
| 7 | Clock correction and orbit correction—combination 2 | - |
| 8–62 | Reserved | |
| 63 | Null message |
Appendix B. Recovering Precise Orbit Corrections, Clock Offsets, and DCB
Appendix C. Performance Assessment of Orbit, Clock, and DCB
References
- And, I.M.H.; Soden, B.J. Water vapor feedback and global warming. Annu. Rev. Energy Environ. 2000, 25, 441–475. [Google Scholar]
- Dessler, A.E.; Zhang, Z.; Yang, P. Water-vapor climate feedback inferred from climate fluctuations, 2003–2008. Geophys. Res. Lett. 2008, 35, 1–4. [Google Scholar] [CrossRef]
- Lavers, D.A.; Pappenberger, F.; Zsoter, E. Extending medium-range predictability of extreme hydrological events in Europe. Nat. Commun. 2014, 5, 5382. [Google Scholar] [CrossRef]
- Parkinson, B.W.; Enge, P.; Axelrad, P.; Spilker, J.J., Jr. Global Positioning System: Theory and Applications, Volume II; American Institute of Aeronautics and Astronautics: Reston, VA, USA, 1996. [Google Scholar]
- Bevis, M.; Businger, S.; Herring, T.A.; Rocken, C.; Anthes, R.A.; Ware, R.H. GPS meteorology: Remote sensing of atmospheric water vapor using the Global Positioning System. J. Geophys. Res. Atmos. 1992, 97, 15787–15801. [Google Scholar] [CrossRef]
- Bock, O.; Bosser, P.; Pacione, R.; Nuret, M.; Fourrié, N.; Parracho, A. A high-quality reprocessed ground-based GPS dataset for atmospheric process studies, radiosonde and model evaluation, and reanalysis of HyMeX Special Observing Period. Q. J. R. Meteorol. Soc. 2016, 142, 56–71. [Google Scholar] [CrossRef]
- Li, H.; Choy, S.; Wang, X.; Zhang, K.; Jiang, C.; Li, L.; Liu, X.; Hu, A.; Wu, S.; Zhu, D. Estimation of diurnal-provided potential evapotranspiration using GNSS and meteorological products. Atmos. Res. 2022, 280, 106424. [Google Scholar] [CrossRef]
- Nilsson, T.; Elgered, G. Long-term trends in the atmospheric water vapor content estimated from ground-based GPS data. J. Geophys. Res. Atmos. 2008, 113, 1–12. [Google Scholar] [CrossRef]
- Ning, T.; Elgered, G.; Willén, U.; Johansson, J.M. Evaluation of the atmospheric water vapor content in a regional climate model using ground-based GPS measurements. J. Geophys. Res. Atmos. 2013, 118, 329–339. [Google Scholar] [CrossRef]
- Vey, S.; Dietrich, R.; Fritsche, M.; Rülke, A.; Steigenberger, P.; Rothacher, M. On the homogeneity and interpretation of precipitable water time series derived from global GPS observations. J. Geophys. Res. Atmos. 2009, 114, 1–15. [Google Scholar] [CrossRef]
- Wang, J.; Zhang, L.; Dai, A.; Van Hove, T.; Van Baelen, J. A near-global, 2-hourly data set of atmospheric precipitable water from ground-based GPS measurements. J. Geophys.Res. Atmos. 2007, 112, 1–17. [Google Scholar] [CrossRef]
- Wang, X.; Zhang, K.; Wu, S.; Li, Z.; Cheng, Y.; Li, L.; Yuan, H. The correlation between GNSS-derived precipitable water vapor and sea surface temperature and its responses to El Niño–Southern Oscillation. Remote Sens. Environ. 2018, 216, 1–12. [Google Scholar] [CrossRef]
- Zhao, Q.; Yao, Y.; Yao, W. Studies of precipitable water vapour characteristics on a global scale. Int. J. Remote Sens. 2018, 40, 72–88. [Google Scholar] [CrossRef]
- Li, H.; Choy, S.; Wang, X.; Liang, H.; Purwar, S.; Zhang, K. Investigating the Optimal Spatial Resolution for Assimilating GNSS PWV into an NWP System to Improve the Accuracy of Humidity Field. IEEE J. Sel. Top. Appl. Earth Obs. Remote Sens. 2023, 16, 6876–6887. [Google Scholar] [CrossRef]
- Li, H.; Wang, X.; Choy, S.; Jiang, C.; Wu, S.; Zhang, J.; Qiu, C.; Zhou, K.; Li, L.; Fu, E. Detecting heavy rainfall using anomaly-based percentile thresholds of predictors derived from GNSS-PWV. Atmos. Res. 2022, 265, 105912. [Google Scholar] [CrossRef]
- Rohm, W.; Guzikowski, J.; Wilgan, K.; Kryza, M. 4DVAR assimilation of GNSS zenith path delays and precipitable water into a numerical weather prediction model WRF. Atmos. Meas. Tech. 2019, 12, 345–361. [Google Scholar] [CrossRef]
- Yan, X.; Ducrocq, V.; Poli, P.; Hakam, M.; Jaubert, G.; Walpersdorf, A. Impact of GPS zenith delay assimilation on convective-scale prediction of Mediterranean heavy rainfall. J. Geophys. Res. Atmos. 2009, 114, 1–15. [Google Scholar] [CrossRef]
- Yao, Y.B.; Shan, L.L.; Zhao, Q.Z. Establishing a method of short-term rainfall forecasting based on GNSS-derived PWV and its application. Sci. Rep. 2017, 7, 11. [Google Scholar] [CrossRef]
- Li, Z.; Muller, J.P.; Cross, P. Comparison of precipitable water vapor derived from radiosonde, GPS, and Moderate-Resolution Imaging Spectroradiometer measurements. J. Geophys. Res. Atmos. 2003, 108, 1–10. [Google Scholar] [CrossRef]
- Vaquero-Martínez, J.; Antón, M.; Ortiz de Galisteo, J.P.; Cachorro, V.E.; Álvarez-Zapatero, P.; Román, R.; Loyola, D.; Costa, M.J.; Wang, H.; Abad, G.G.; et al. Inter-comparison of integrated water vapor from satellite instruments using reference GPS data at the Iberian Peninsula. Remote Sens. Enviorn. 2018, 204, 729–740. [Google Scholar] [CrossRef]
- Shamshiri, R.; Motagh, M.; Nahavandchi, H.; Haghshenas Haghighi, M.; Hoseini, M. Improving tropospheric corrections on large-scale Sentinel-1 interferograms using a machine learning approach for integration with GNSS-derived zenith total delay (ZTD). Remote Sens. Environ. 2020, 239, 111608. [Google Scholar] [CrossRef]
- Caissy, M.; Agrotis, L.; Weber, G.; Hernandez-Pajares, M.; Hugentobler, U. Coming Soon: The International GNSS Real-Time Service. GPS World. 2012. Available online: https://gge.ext.unb.ca/Resources/gpsworld.june12.pdf (accessed on 24 August 2024).
- Dousa, J. Precise near Real-Time Gnss Analyses at Geodetic Observatory Pecny—Precise Orbit Determination and Water Vapour Monitoring. Acta Geodyn. Geomater. 2010, 7, 7–17. [Google Scholar]
- Dow, J.M.; Neilan, R.E.; Rizos, C. The International GNSS Service in a changing landscape of Global Navigation Satellite Systems. J. Geod. 2009, 83, 191–198. [Google Scholar] [CrossRef]
- Zumberge, J.; Heflin, M.; Jefferson, D.; Watkins, M.; Webb, F. Precise point positioning for the efficient and robust analysis of GPS data from large networks. J. Geophys. Res. Solid Earth 1997, 102, 5005–5017. [Google Scholar] [CrossRef]
- Shi, J.; Xu, C.; Li, Y.; Gao, Y. Impacts of real-time satellite clock errors on GPS precise point positioning-based troposphere zenith delay estimation. J. Geod. 2015, 89, 747–756. [Google Scholar] [CrossRef]
- Danchik, R.J. An overview of transit development. Johns Hopkins APL Tech. Dig. 1998, 19, 19. [Google Scholar]
- Dousa, J.; Vaclavovic, P. Real-time zenith tropospheric delays in support of numerical weather prediction applications. Adv. Space Res. 2014, 53, 1347–1358. [Google Scholar] [CrossRef]
- Li, X.; Dick, G.; Ge, M.; Heise, S.; Wickert, J.; Bender, M. Real-time GPS sensing of atmospheric water vapor: Precise point positioning with orbit, clock, and phase delay corrections. Geophys. Res. Lett. 2014, 41, 3615–3621. [Google Scholar] [CrossRef]
- Yuan, Y.; Zhang, K.; Rohm, W.; Choy, S.; Norman, R.; Wang, C.S. Real-time retrieval of precipitable water vapor from GPS precise point positioning. J. Geophys. Res. Atmos. 2014, 119, 10044–10057. [Google Scholar] [CrossRef]
- Lu, C.; Li, X.; Nilsson, T.; Ning, T.; Heinkelmann, R.; Ge, M.; Glaser, S.; Schuh, H. Real-time retrieval of precipitable water vapor from GPS and BeiDou observations. J. Geod. 2015, 89, 843–856. [Google Scholar] [CrossRef]
- Guerova, G.; Jones, J.; Dousa, J.; Dick, G.; de Haan, S.; Pottiaux, E.; Bock, O.; Pacione, R.; Elgered, G.; Vedel, H. Review of the state of the art and future prospects of the ground-based GNSS meteorology in Europe. Atmos. Meas. Tech. 2016, 9, 5385. [Google Scholar] [CrossRef]
- Yu, C.; Penna, N.T.; Li, Z. Generation of real-time mode high-resolution water vapor fields from GPS observations. J. Geophys. Res. Atmos. 2017, 122, 2008–2025. [Google Scholar] [CrossRef]
- Yang, Y.; Mao, Y.; Sun, B. Basic performance and future developments of BeiDou global navigation satellite system. Satell. Navig. 2020, 1, 1. [Google Scholar] [CrossRef]
- Yang, Y.; Liu, L.; Li, J.; Yang, Y.; Zhang, T.; Mao, Y.; Sun, B.; Ren, X. Featured services and performance of BDS-3. Sci. Bull. 2021, 66, 2135–2143. [Google Scholar] [CrossRef] [PubMed]
- Nie, Z.; Xu, X.; Wang, Z.; Du, J. Initial Assessment of BDS PPP-B2b Service: Precision of Orbit and Clock Corrections, and PPP Performance. Remote Sens. 2021, 13, 2050. [Google Scholar] [CrossRef]
- Ren, Z.; Gong, H.; Peng, J.; Tang, C.; Huang, X.; Sun, G. Performance assessment of real-time precise point positioning using BDS PPP-B2b service signal. Adv. Space Res. 2021, 68, 3242–3254. [Google Scholar] [CrossRef]
- Tao, J.; Liu, J.; Hu, Z.; Zhao, Q.; Chen, G.; Ju, B. Initial Assessment of the BDS-3 PPP-B2b RTS compared with the CNES RTS. GPS Solut. 2021, 25, 131. [Google Scholar] [CrossRef]
- Yang, H.; He, X.; Ferreira, V.; Ji, S.; Xu, Y.; Song, S. Assessment of precipitable water vapor retrieved from precise point positioning with PPP-B2b service. Earth Sci. Inform. 2023, 16, 315–328. [Google Scholar] [CrossRef]
- Xu, Y.; Zhao, P.; Wang, J.; Meng, X. Performance Assess of BDS-3 PPP-B2b Signal Service and Its Application in Precipitable Water Vapor Retrieval. In Proceedings of the China Satellite Navigation Conference, Jinan, China, 22–24 May 2024; pp. 118–131. [Google Scholar]
- Li, X.; Zhu, Y.; Zheng, K.; Yuan, Y.; Liu, G.; Xiong, Y. Precise Orbit and Clock Products of Galileo, BDS and QZSS from MGEX Since 2018: Comparison and PPP Validation. Remote Sens. 2020, 12, 1415. [Google Scholar] [CrossRef]
- Li, B.; Ge, H.; Bu, Y.; Zheng, Y.; Yuan, L. Comprehensive assessment of real-time precise products from IGS analysis centers. Satell. Navig. 2022, 3, 12. [Google Scholar] [CrossRef]
- Yu, C.; Zhang, Y.; Chen, J.; Chen, Q.; Xu, K.; Wang, B. Performance Assessment of Multi-GNSS Real-Time Products from Various Analysis Centers. Remote Sens. 2023, 15, 140. [Google Scholar] [CrossRef]
- Hersbach, H.; Bell, B.; Berrisford, P.; Hirahara, S.; Horányi, A.; Muñoz-Sabater, J.; Nicolas, J.; Peubey, C.; Radu, R.; Schepers, D.; et al. The ERA5 global reanalysis. Q. J. R. Meteorol. Soc. 2020, 146, 1999–2049. [Google Scholar] [CrossRef]
- Haase, J.; Ge, M.; Vedel, H.; Calais, E. Accuracy and variability of GPS tropospheric delay measurements of water vapor in the western Mediterranean. J. Appl. Meteorol. 2003, 42, 1547–1568. [Google Scholar] [CrossRef]
- Bevis, M.; Businger, S.; Chiswell, S.; Herring, T.A.; Anthes, R.A.; Rocken, C.; Ware, R.H. GPS meteorology: Mapping zenith wet delays onto precipitable water. J. Appl. Meteorol. 1994, 33, 379–386. [Google Scholar] [CrossRef]
- NOAA. US Standard Atmosphere; National Oceanic and Atmospheric Administration: Washington, DC, USA, 1976. Available online: https://ntrs.nasa.gov/citations/19770009539 (accessed on 24 August 2024).
- WMO. Guide to Meteorological Instruments and Methods of Observation 2018 Edition (WMO-No. 8); World Meteorological Organisation: Geneva, Switzerland, 2018. [Google Scholar]
- Wang, X.; Zhang, K.; Wu, S.; Fan, S.; Cheng, Y. Water vapor-weighted mean temperature and its impact on the determination of precipitable water vapor and its linear trend. J. Geophys. Res. Atmos. 2016, 121, 833–852. [Google Scholar] [CrossRef]
- Wang, X.; Zhang, K.; Wu, S.; He, C.; Cheng, Y.; Li, X. Determination of zenith hydrostatic delay and its impact on GNSS-derived integrated water vapor. Atmos. Meas. Tech. Discuss 2017, 10, 14. [Google Scholar] [CrossRef]
- Pham, C.C.; Nguyen, X.A. Determination of radio wave propagation conditions in the atmosphere of Hanoi using the radiosonde data of balloons. ICT Express 2022, 8, 611–617. [Google Scholar] [CrossRef]
- Johnston, G.; Riddell, A.; Hausler, G. The International GNSS Service. In Springer Handbook of Global Navigation Satellite Systems; Teunissen, P.J.G., Montenbruck, O., Eds.; Springer International Publishing: Cham, Switzerland, 2017; pp. 967–982. [Google Scholar]
- Junbo, S.; Chaoqian, X.; Jiming, G.; Yang, G. Real-Time GPS Precise Point Positioning-Based Precipitable Water Vapor Estimation for Rainfall Monitoring and Forecasting. Geosci. Remote Sens. IEEE Trans. 2015, 53, 3452–3459. [Google Scholar] [CrossRef]
- Takasu, T. RTKLIB: An Open Source Program Package for GNSS Positioning. 2011. Available online: https://www.rtklib.com/ (accessed on 24 August 2024).
- Bar-Sever, Y.E.; Kroger, P.M.; Borjesson, J.A. Estimating horizontal gradients of tropospheric path delay with a single GPS receiver. J. Geophys. Res. Solid Earth 1998, 103, 5019–5035. [Google Scholar] [CrossRef]
- Tregoning, P.; Herring, T. Impact of a priori zenith hydrostatic delay errors on GPS estimates of station heights and zenith total delays. Geophys. Res. Lett. 2006, 33, 1–5. [Google Scholar] [CrossRef]
- Yao, Y.; Zhu, S.; Yue, S. A globally applicable, season-specific model for estimating the weighted mean temperature of the atmosphere. J. Geod. 2012, 86, 1125–1135. [Google Scholar] [CrossRef]
- Wang, J.; Zhang, L.; Dai, A. Global estimates of water-vapor-weighted mean temperature of the atmosphere for GPS applications. J. Geophys. Res. Atmos. 2005, 110, 1–17. [Google Scholar] [CrossRef]
- Ding, M. A neural network model for predicting weighted mean temperature. J. Geod. 2018, 925, 1187–1198. [Google Scholar] [CrossRef]
- Huang, L.; Jiang, W.; Liu, L.; Chen, H.; Ye, S. A new global grid model for the determination of atmospheric weighted mean temperature in GPS precipitable water vapor. J. Geod. 2018, 93, 159–176. [Google Scholar] [CrossRef]
- Landskron, D.; Böhm, J. VMF3/GPT3: Refined discrete and empirical troposphere mapping functions. J. Geod. 2018, 92, 349–360. [Google Scholar] [CrossRef] [PubMed]
- Li, X.; Dick, G.; Lu, C.; Ge, M.; Nilsson, T.; Ning, T.; Wickert, J.; Schuh, H. Multi-GNSS Meteorology: Real-Time Retrieving of Atmospheric Water Vapor From BeiDou, Galileo, GLONASS, and GPS Observations. Geosci. Remote Sens. IEEE Trans. 2015, 53, 6385–6393. [Google Scholar] [CrossRef]
- Lu, C.; Chen, X.; Liu, G.; Dick, G.; Wickert, J.; Jiang, X.; Zheng, K.; Schuh, H. Real-Time Tropospheric Delays Retrieved from Multi-GNSS Observations and IGS Real-Time Product Streams. Remote Sens. 2017, 9, 1317. [Google Scholar] [CrossRef]
- Hadas, T.; Hobiger, T.; Hordyniec, P. Considering different recent advancements in GNSS on real-time zenith troposphere estimates. GPS Solut. 2020, 24, 99. [Google Scholar] [CrossRef]
- Zhou, F.; Cao, X.; Ge, Y.; Li, W. Assessment of the positioning performance and tropospheric delay retrieval with precise point positioning using products from different analysis centers. GPS Solut. 2020, 24, 12. [Google Scholar] [CrossRef]
- Wilgan, K.; Dick, G.; Zus, F.; Wickert, J. Towards operational multi-GNSS tropospheric products at GFZ Potsdam. Atmos. Meas. Tech. 2022, 15, 21–39. [Google Scholar] [CrossRef]
- Boehm, J.; Niell, A.; Tregoning, P.; Schuh, H. Global Mapping Function (GMF): A new empirical mapping function based on numerical weather model data. Geophys. Res. Lett. 2006, 33, 1–4. [Google Scholar] [CrossRef]
- Vey, S.; Dietrich, R.; Fritsche, M.; Rülke, A.; Rothacher, M.; Steigenberger, P. Influence of mapping function parameters on global GPS network analyses: Comparisons between NMF and IMF. Geophys. Res. Lett. 2006, 33, 1–4. [Google Scholar] [CrossRef]
- Boehm, J.; Kouba, J.; Schuh, H. Forecast Vienna Mapping Functions 1 for real-time analysis of space geodetic observations. J. Geod. 2009, 83, 397–401. [Google Scholar] [CrossRef]
- Yao, Y.; Xu, C.; Zhang, B.; Cao, N. A global empirical model for mapping zenith wet delays onto precipitable water vapor using GGOS Atmosphere data. Sci. China Earth Sci. 2015, 58, 1361–1369. [Google Scholar] [CrossRef]
- Qiu, C.; Wang, X.; Li, Z.; Zhang, S.; Li, H.; Zhang, J.; Yuan, H. The Performance of Different Mapping Functions and Gradient Models in the Determination of Slant Tropospheric Delay. Remote Sens. 2020, 12, 130. [Google Scholar] [CrossRef]
- Li, X.; Zus, F.; Lu, C.; Dick, G.; Ning, T.; Ge, M.; Wickert, J.; Schuh, H. Retrieving of atmospheric parameters from multi-GNSS in real time: Validation with water vapor radiometer and numerical weather model. J. Geophys. Res. Atmos. 2015, 120, 7189–7204. [Google Scholar] [CrossRef]
- Zhang, J.; Wang, X.; Li, Z.; Li, S.; Qiu, C.; Li, H.; Zhang, S.; Li, L. The Impact of Different Ocean Tide Loading Models on GNSS Estimated Zenith Tropospheric Delay Using Precise Point Positioning Technique. Remote Sens. 2020, 12, 3080. [Google Scholar] [CrossRef]
- Macmillan, D.S. Atmospheric gradients from very long baseline interferometry observations. Geophys. Res. Lett. 1995, 22, 1041–1044. [Google Scholar] [CrossRef]
- Hadas, T.; Teferle, F.N.; Kazmierski, K.; Hordyniec, P.; Bosy, J. Optimum stochastic modeling for GNSS tropospheric delay estimation in real-time. GPS Solut. 2017, 21, 1069–1081. [Google Scholar] [CrossRef]
- China Satellite Navigation Office. BeiDou Navigation Satellite System Signal in Space Interface Control Document: Open Service Signal B2b. 2020. Available online: http://www.beidou.gov.cn/xt/gfxz/202008/P020200803362062482940.pdf (accessed on 24 August 2024).
- Montenbruck, O.; Steigenberger, P.; Prange, L.; Deng, Z.; Zhao, Q.; Perosanz, F.; Romero, I.; Noll, C.; Stürze, A.; Weber, G. The Multi-GNSS Experiment (MGEX) of the International GNSS Service (IGS)—Achievements, Prospects and Challenges. Adv. Space Res. 2017, 59, 1671–1697. [Google Scholar] [CrossRef]
- Douša, J. The impact of errors in predicted GPS orbits on zenith troposphere delay estimation. GPS Solut. 2010, 14, 229–239. [Google Scholar] [CrossRef]
- Montenbruck, O.; Steigenberger, P.; Hauschild, A. Broadcast versus precise ephemerides: A multi-GNSS perspective. GPS Solut. 2015, 19, 321–333. [Google Scholar] [CrossRef]
- Vey, S.; Calais, E.; Llubes, M.; Florsch, N.; Woppelmann, G.; Hinderer, J.; Amalvict, M.; Lalancette, M.; Simon, B.; Duquenne, F. GPS measurements of ocean loading and its impact on zenith tropospheric delay estimates: A case study in Brittany, France. J. Geod. 2002, 76, 419–427. [Google Scholar] [CrossRef]
- Byram, S.; Hackman, C.; Tracey, J. Computation of a high-precision GPS-based troposphere product by the USNO. In Proceedings of the 24th International Technical Meeting of the Satellite Division of the Institute of Navigation (ION GNSS 2011), Portland, OR, USA, 20–23 September 2011; pp. 572–578. [Google Scholar]
- Lu, X.; Chen, L.; Shen, N.; Wang, L.; Jiao, Z.; Chen, R. Decoding PPP Corrections From BDS B2b Signals Using a Software-Defined Receiver: An Initial Performance Evaluation. IEEE Sens. J. 2021, 21, 7871–7883. [Google Scholar] [CrossRef]
- Guo, F.; Zhang, X.; Wang, J. Timing group delay and differential code bias corrections for BeiDou positioning. J. Geod. 2015, 89, 427–445. [Google Scholar] [CrossRef]
- Montenbruck, O.; Hauschild, A.; Steigenberger, P. Differential code bias estimation using multi-GNSS observations and global ionosphere maps. Navig. J. Inst. Navig. 2014, 61, 191–201. [Google Scholar] [CrossRef]
- Wang, N.; Yuan, Y.; Li, Z.; Montenbruck, O.; Tan, B. Determination of differential code biases with multi-GNSS observations. J. Geod. 2016, 90, 209–228. [Google Scholar] [CrossRef]
- Cheng, P.; Cheng, Y.; Wang, X.; Xu, Y. Update China geodetic coordinate frame considering plate motion. Satell. Navig. 2021, 2, 2. [Google Scholar] [CrossRef]
- Yang, Y. Chinese geodetic coordinate system 2000. Chin. Sci Bull. 2009, 54, 2714–2721. [Google Scholar] [CrossRef]
- Merrigan, M.J.; Swift, E.R.; Wong, R.F.; Saffel, J.T. A refinement to the World Geodetic System 1984 reference frame. In Proceedings of the 15th International Technical Meeting of the Satellite Division of the Institute of Navigation (ION GPS 2002), Portland, OR, USA, 24–27 September 2002; pp. 1519–1529. [Google Scholar]
- Rebischung, P. IGSMAIL-7921: Switch to IGb14 Reference Frame. 2020. Available online: https://lists.igs.org/pipermail/igsmail/2020/007917.html (accessed on 24 August 2024).
- Altamimi, Z.; Rebischung, P.; Métivier, L.; Collilieux, X. ITRF2014: A new release of the International Terrestrial Reference Frame modeling nonlinear station motions. J. Geophys. Res. Solid Earth 2016, 121, 6109–6131. [Google Scholar] [CrossRef]
- Yang, C.; Guo, J.; Zhao, Q. Yaw attitudes for BDS-3 IGSO and MEO satellites: Estimation, validation and modeling with inter-satellite link observations. arXiv 2021, arXiv:2112.13252. [Google Scholar] [CrossRef]
- Kouba, J.; Héroux, P. Precise Point Positioning Using IGS Orbit and Clock Products. GPS Solut. 2001, 5, 12–28. [Google Scholar] [CrossRef]
- China Satellite Navigation Office. Release of the BDS-2/3 Satellite Related Parameters. 2019. Available online: http://www.beidou.gov.cn/yw/gfgg/201912/t20191209_19613.html (accessed on 24 August 2024).
- Hauschild, A. Precise GNSS Clock-Estimation for Real-Time Navigation and Precise Point Positioning. Ph.D. Thesis, Technische Universität München, München, Germany, 2010. [Google Scholar]


| Items | Strategies |
|---|---|
| Observables | IFLC of the pseudorange and carrier phase |
| Frequencies | GPS L1/L2 and BDS-3 B1I/B3I (B1C/B2a) |
| Elevation cut-off angle | |
| ZTD estimation | The a priori value for the hydrostatic delay was calculated using the Saastamoinen model with pressure and temperature from GPT3; the wet delay was estimated as a random walk process noise of |
| Mapping function | GPT3 |
| Gradient parameters | North and east components of the tropospheric gradient parameters were estimated |
| Receiver clock | The receiver clock was estimated for GPS and BDS-3 separately |
| Solution type | Static with float ambiguities |
| Corrections models | Phase wind-up, relativistic delays, and the effects of the solid Earth pole tide and ocean pole tide were modelled according to IERS Conventions 2010 |
| System | STD of Clock Errors (ns) | RMSE of Orbit Errors (m) | ||
|---|---|---|---|---|
| Radial | Along-Track | Cross-Track | ||
| GPS | 0.16 | 0.08 | 0.36 | 0.28 |
| BDS-3 MEO | 0.13 | 0.10 | 0.27 | 0.28 |
| BDS-3 IGSO | 0.18 | 0.13 | 0.37 | 0.40 |
| Frequency | B1I | B1C(P) | B2a(P) | B1I | B1C(P) | B2a(P) | B1I | B1C(P) | B2a(P) |
| STD | 0.36 | 0.37 | 0.22 | 0.35 | 0.37 | 0.27 | 0.15 | 0.14 | 0.13 |
| System | Satellite Type | [RMSE] | [RMSE] | [STD] |
|---|---|---|---|---|
| GPS | IIR | 0.11 | 1.94 | 0.07 |
| IIR-M | 0.10 | 0.94 | 0.06 | |
| IIF | 0.11 | 0.96 | 0.06 | |
| III | 0.12 | 0.63 | 0.04 | |
| Mean | 0.11 | 1.12 | 0.06 | |
| BDS-3 | MEO | 0.12 | 0.58 | 0.03 |
| IGSO | 0.14 | 0.87 | 0.04 | |
| Mean | 0.13 | 0.72 | 0.03 |
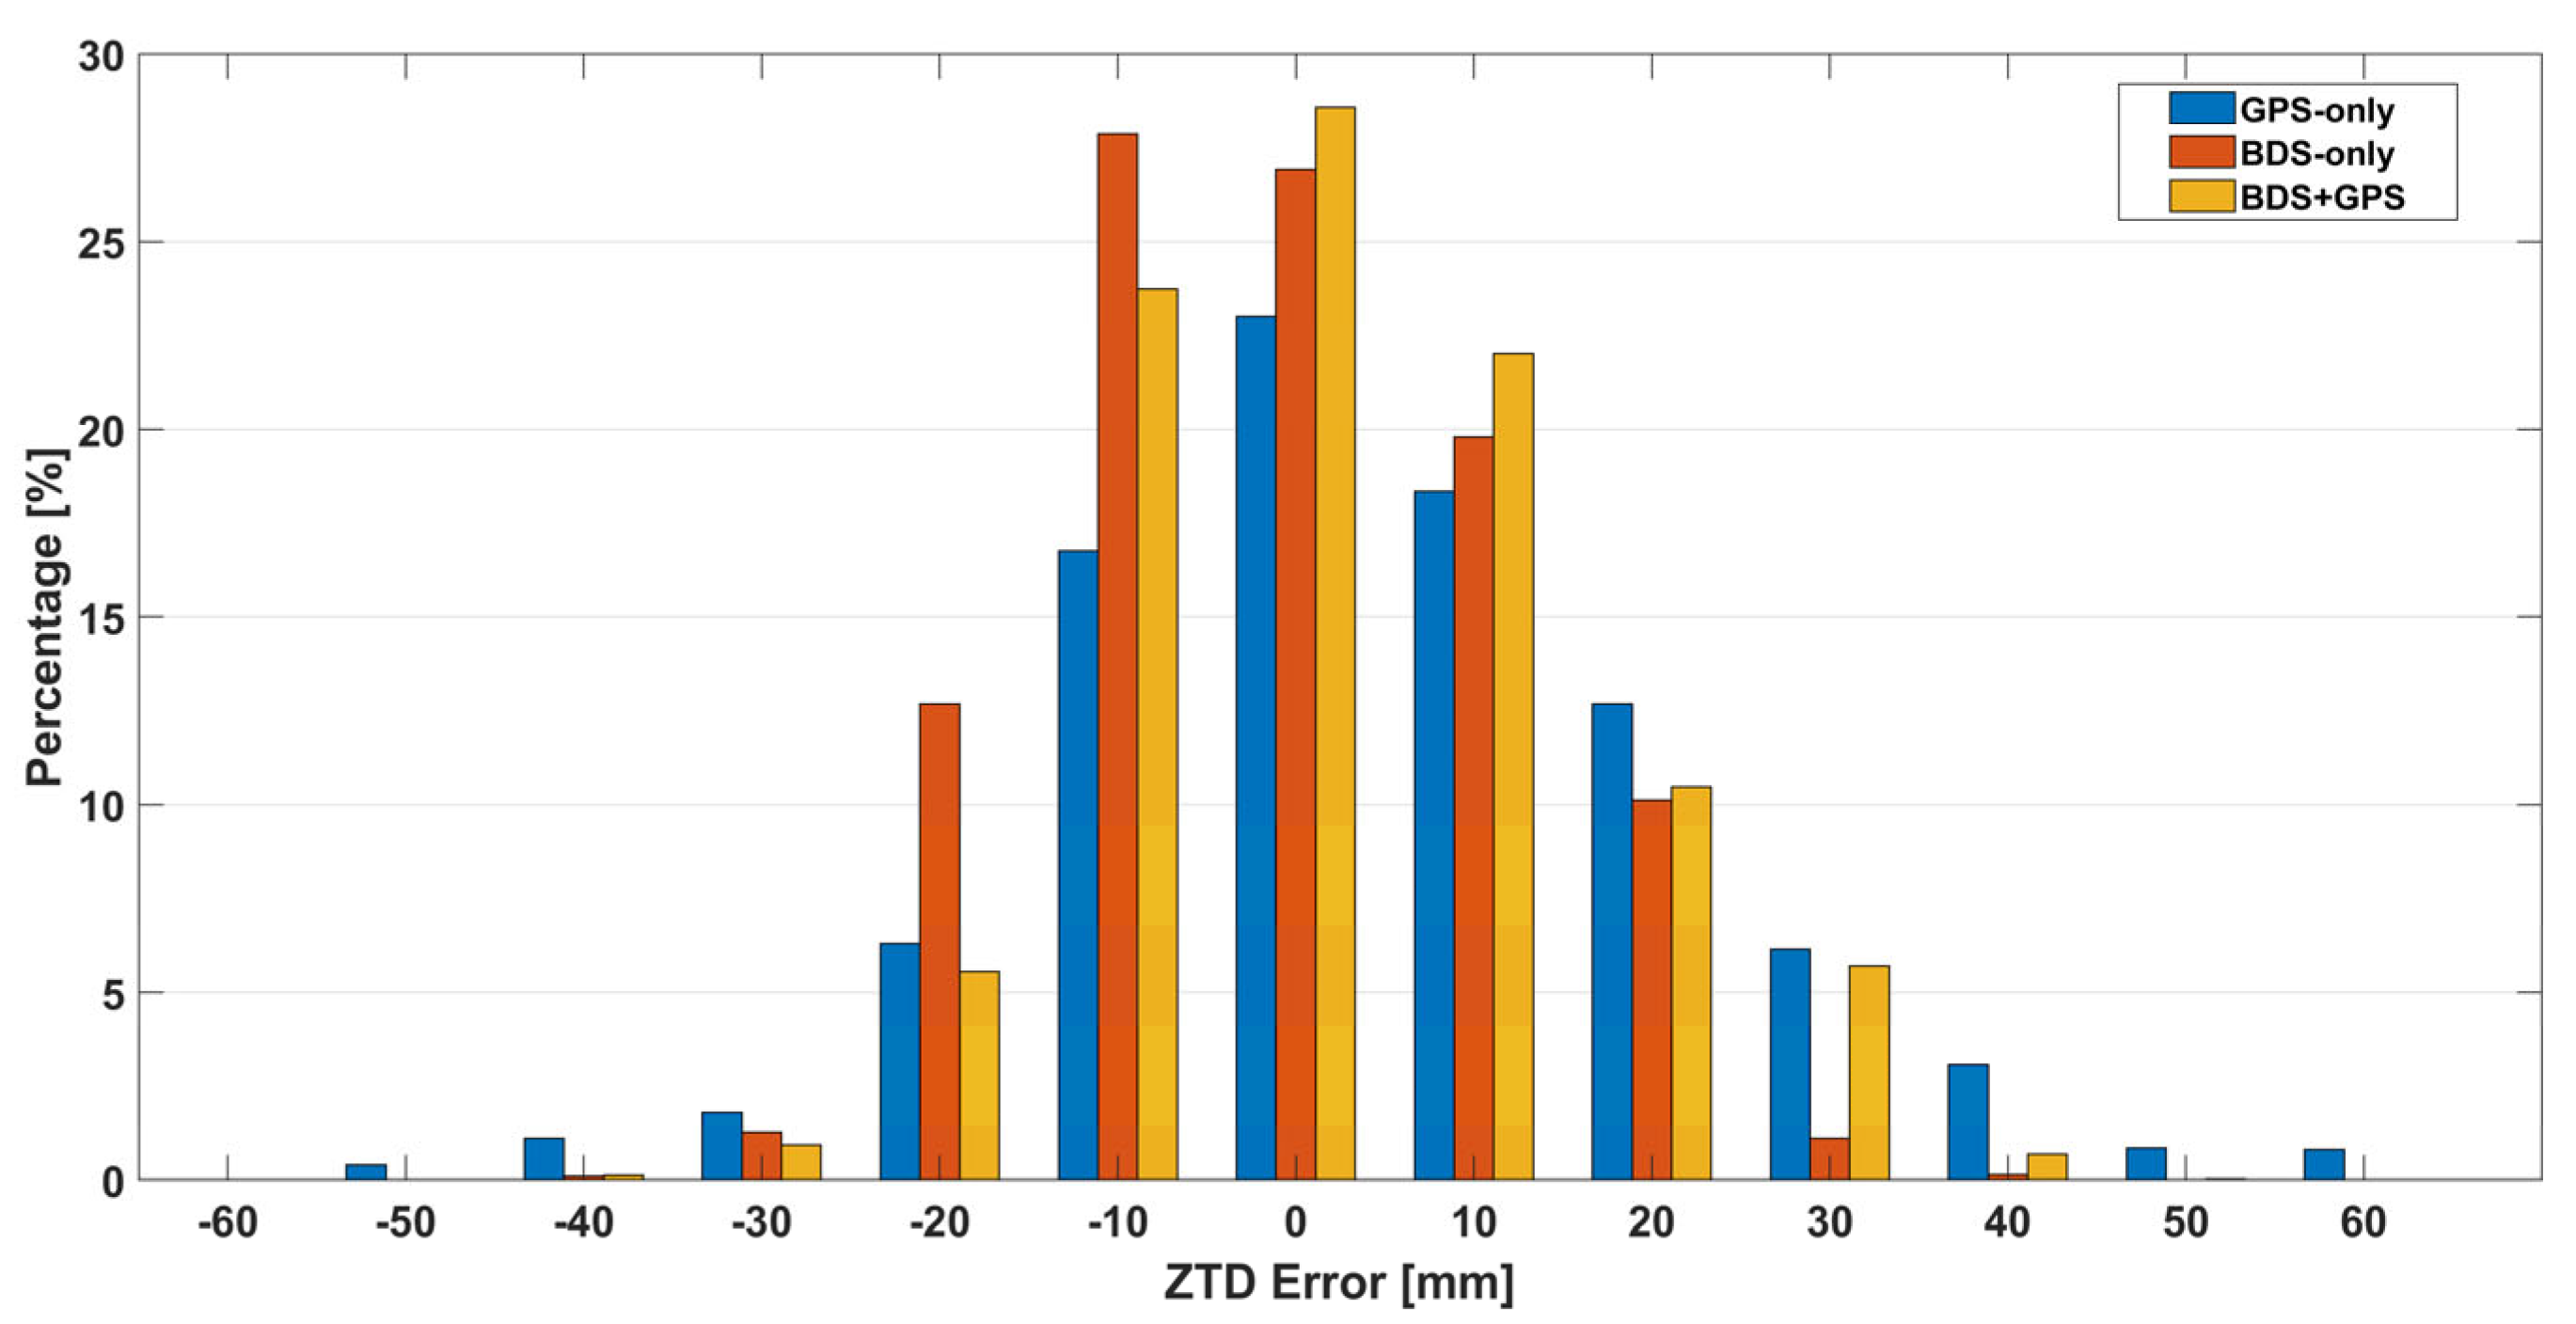
| Strategy | Error Range [Min, Max] | Percentage in the Range [−30 mm, 30 mm] (%) | Bias (mm) | RMSE (mm) |
|---|---|---|---|---|
| GPS-only | [−57.7, 67.5] | 91.1 | −0.3 | 17.8 |
| BDS-only | [−41.9, 32.2] | 98.5 | −6.4 | 13.9 |
| BDS + GPS | [−44.6, 40.3] | 98.2 | −2.5 | 13.4 |
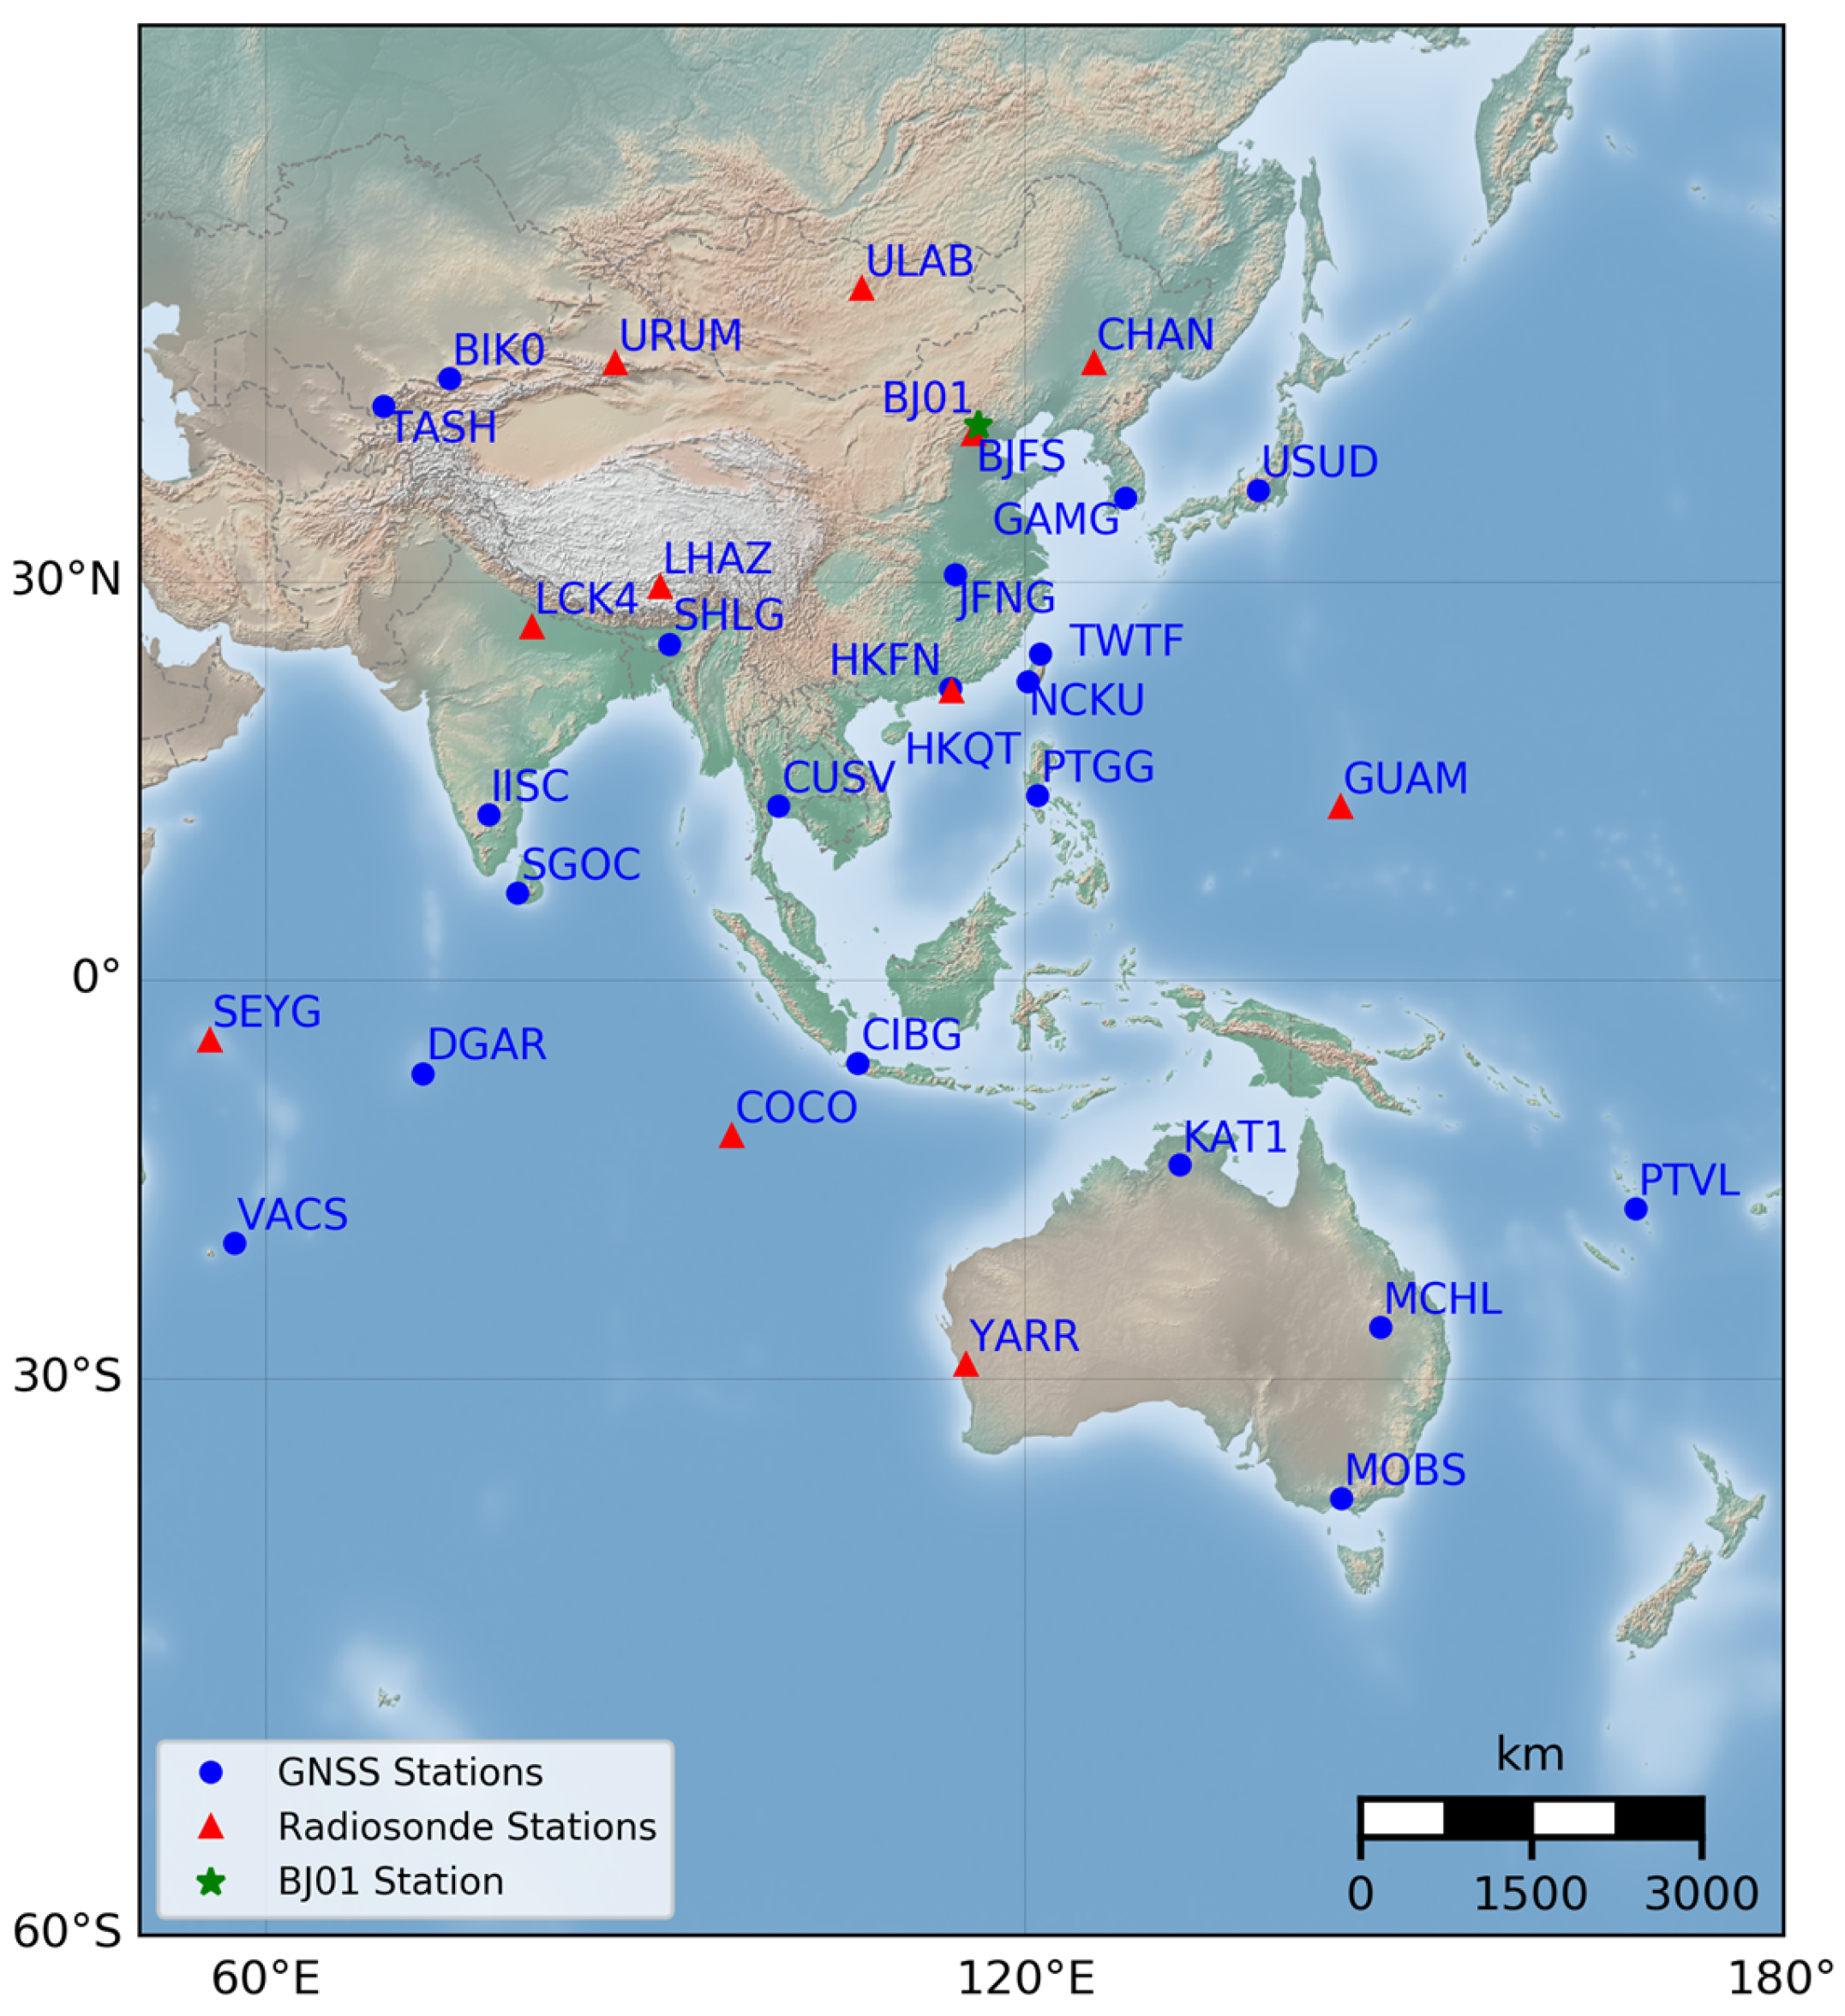
| GNSS | Co-Located Radiosonde | ||||||
|---|---|---|---|---|---|---|---|
| Station Name | Latitude (°) | Longitude (°) | Height (m) | Observation System | Station Name | Horizontal Distance (km) | Height Difference (m) |
| ULAB | 47.9 | 107.1 | 1575.6 | G + C | MGM00044292 | 14.98 | −117.4 |
| URUM | 43.8 | 87.6 | 858.9 | G + C | CHM00051463 | 3.09 | 2.4 |
| CHAN | 43.8 | 125.4 | 271.5 | GPS only | CHM00054161 | 21.89 | 20.1 |
| BIK0 | 42.9 | 74.5 | 744.9 | GPS only | N/A | N/A | N/A |
| TASH | 41.3 | 69.3 | 439.7 | G + C | N/A | N/A | N/A |
| BJ01 | 40.1 | 116.3 | 85.5 | G + C | N/A | N/A | N/A |
| BJFS | 39.6 | 115.9 | 87.4 | GPS only | CHM00054511 | 49.19 | 64.6 |
| USUD | 36.1 | 138.4 | 1508.6 | G + C | N/A | N/A | N/A |
| GAMG | 35.6 | 127.9 | 925.9 | G + C | N/A | N/A | N/A |
| JFNG | 30.5 | 114.5 | 71.3 | G + C | N/A | N/A | N/A |
| LHAZ | 29.7 | 91.1 | 3646.3 | GPS only | CHM00055591 | 3.00 | 1.0 |
| LCK4 | 26.9 | 81.0 | 64.2 | G + C | INM00042369 | 19.43 | 7.2 |
| SHLG | 25.7 | 91.9 | 1007.2 | G + C | N/A | N/A | N/A |
| TWTF | 25.0 | 121.2 | 201.5 | G + C (C19-37) | N/A | N/A | N/A |
| NCKU | 23.0 | 120.2 | 98.2 | G + C (C19-30) | N/A | N/A | N/A |
| HKFN | 22.5 | 114.1 | 41.2 | G + C (C19-30) | N/A | N/A | N/A |
| HKQT | 22.3 | 114.2 | 5.2 | G + C (C19-30) | HKM00045004 | 6.10 | −17.2 |
| PTGG | 14.5 | 121.0 | 84.9 | G + C | N/A | N/A | N/A |
| CUSV | 13.7 | 100.5 | 76.1 | G + C | N/A | N/A | N/A |
| GUAM | 13.6 | 144.9 | 201.9 | G + C | GQM00091212 | 14.86 | 70.3 |
| IISC | 13.0 | 77.6 | 843.7 | G + C | N/A | N/A | N/A |
| SGOC | 6.9 | 79.9 | −78.5 | G + C | N/A | N/A | N/A |
| SEYG | −4.7 | 55.5 | −37.6 | G + C | SEM00063985 | 1.62 | −1.0 |
| CIBG | −6.5 | 106.8 | 169.1 | G + C | N/A | N/A | N/A |
| DGAR | −7.3 | 72.4 | −64.9 | G + C | N/A | N/A | N/A |
| COCO | −12.2 | 96.8 | −35.3 | G + C | CKM00096996 | 0.10 | −0.2 |
| KAT1 | −14.4 | 132.2 | 184.3 | G + C | N/A | N/A | N/A |
| PTVL | −17.7 | 168.3 | 86.4 | G + C | N/A | N/A | N/A |
| VACS | −20.3 | 57.5 | 421.2 | G + C | N/A | N/A | N/A |
| MCHL | −26.4 | 148.1 | 534.6 | G + C | N/A | N/A | N/A |
| YARR | −29.0 | 115.3 | 241.4 | G + C | ASM00094403 | 68.58 | 229.45 |
| MOBS | −37.8 | 145.0 | 40.6 | G + C | N/A | N/A | N/A |
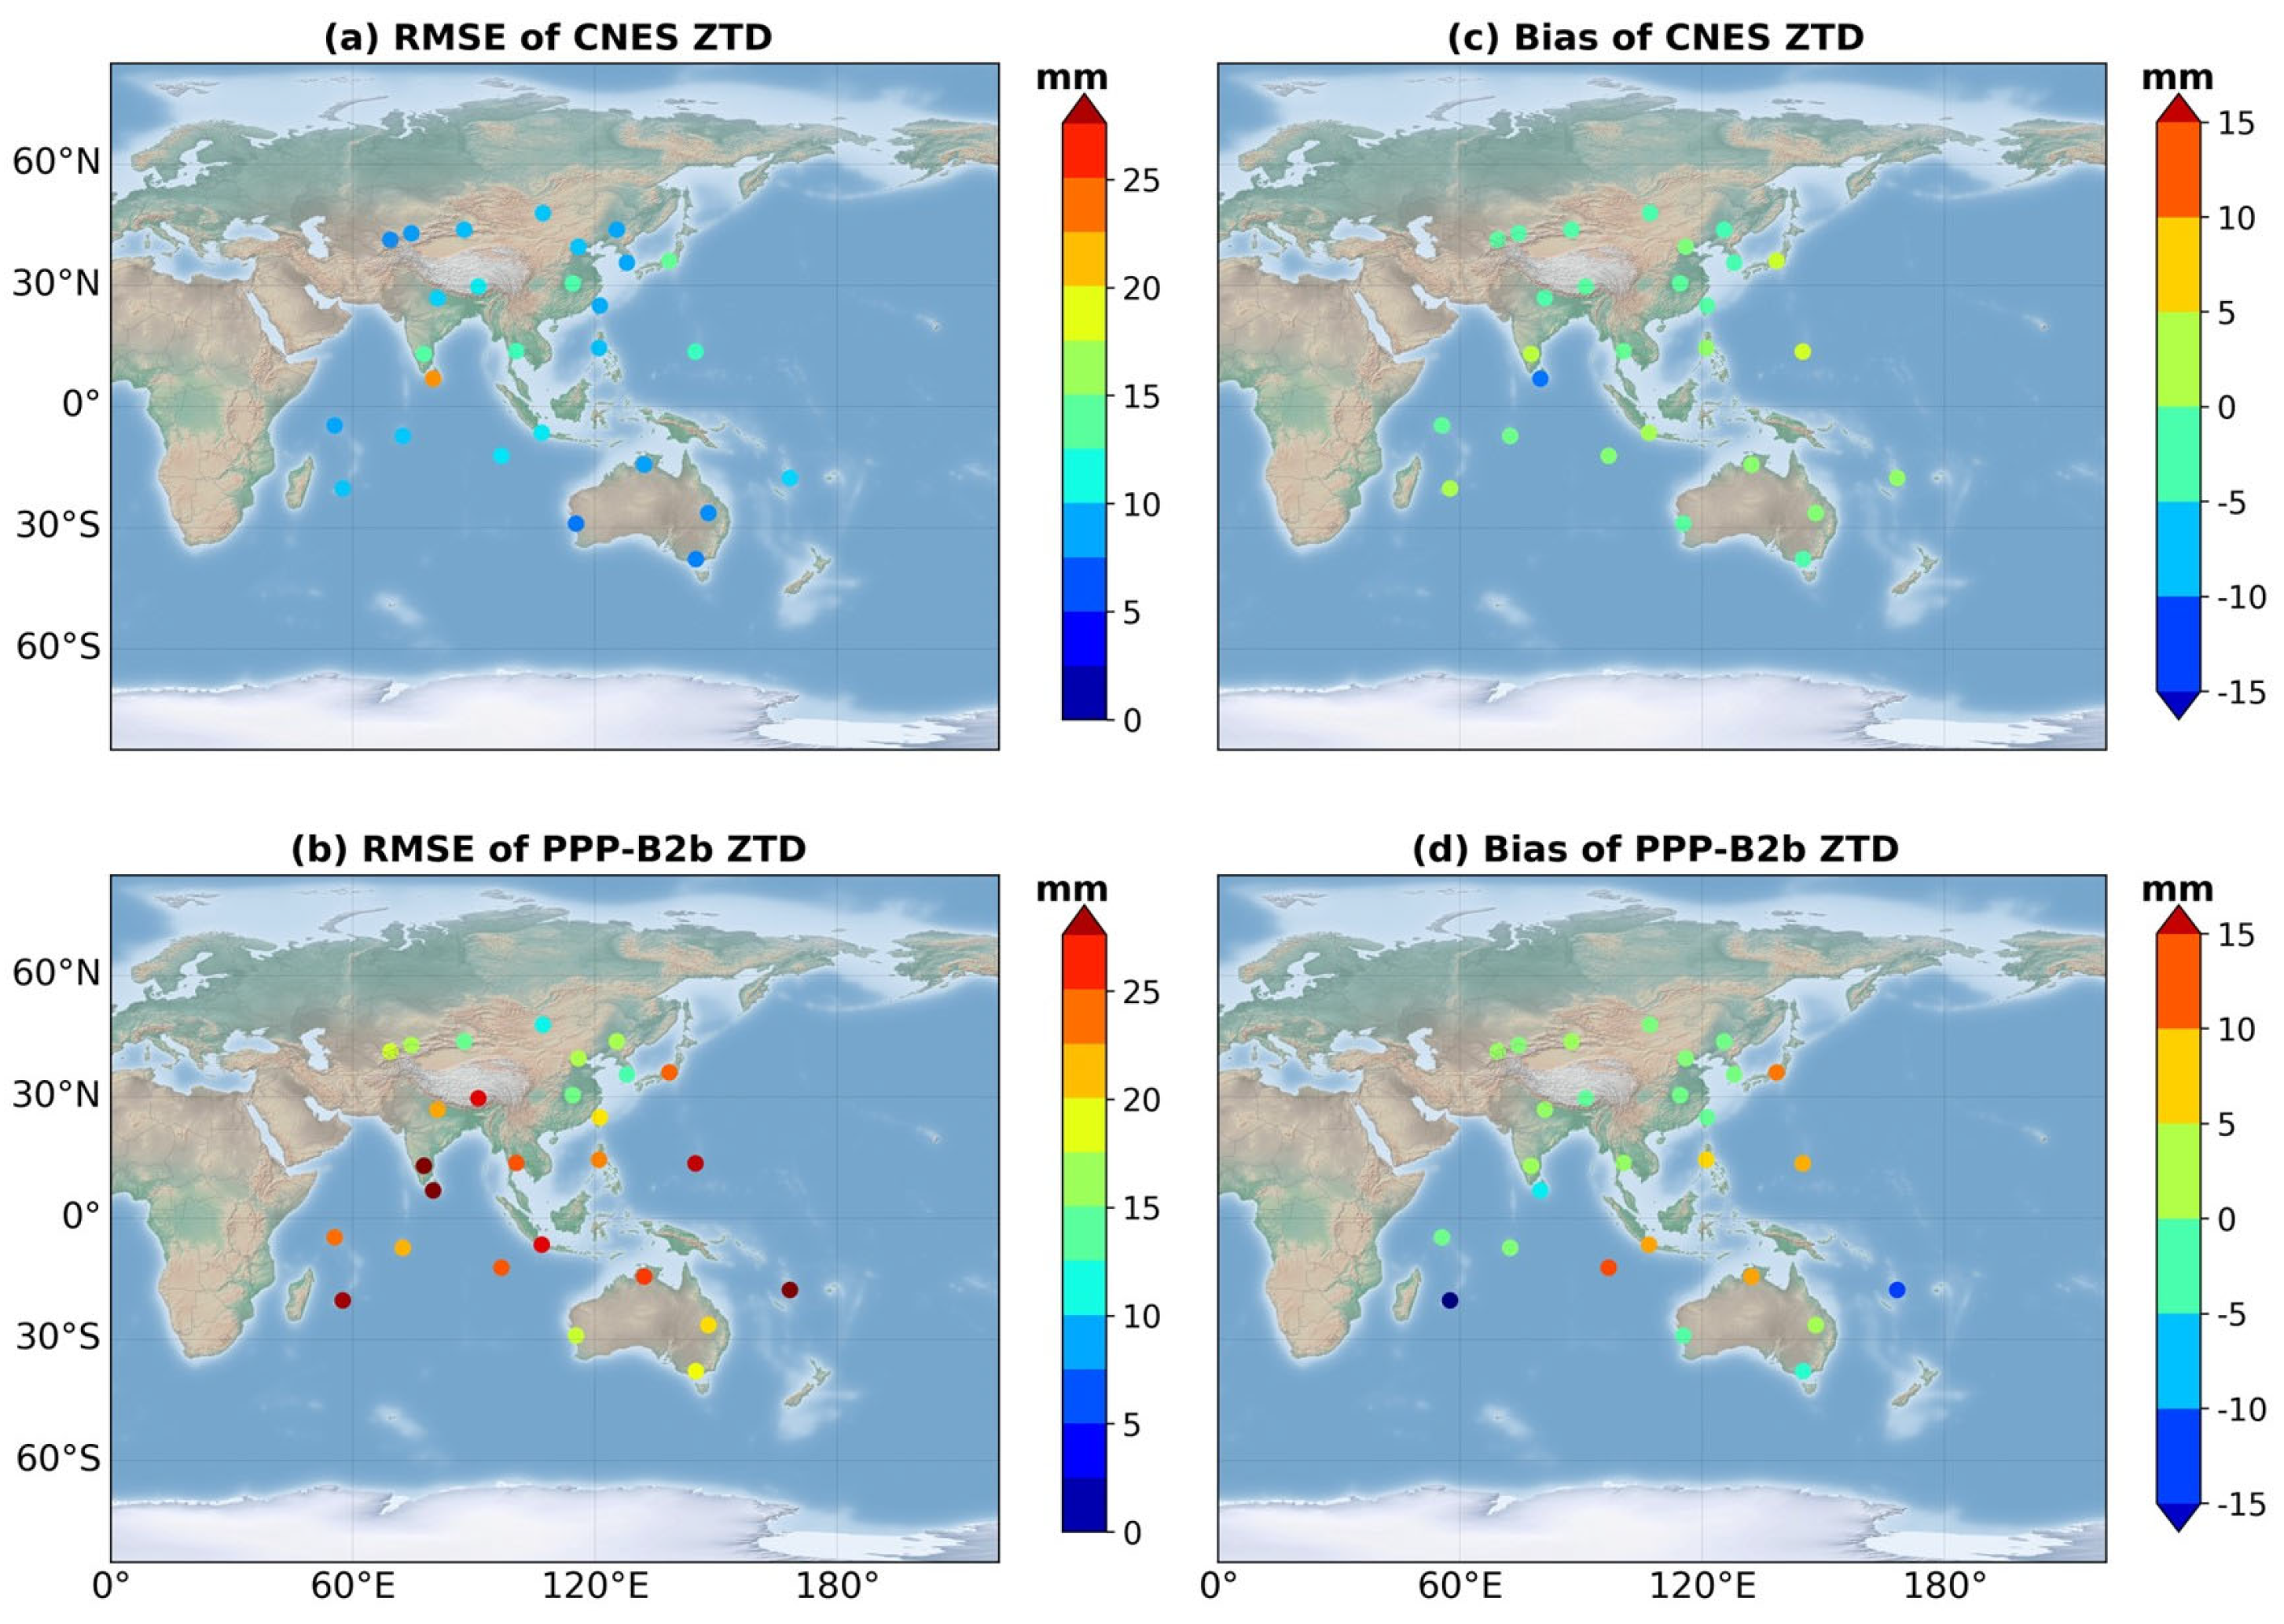
| Solutions | Latitude Range | IGS Results as Reference | GBM Results as Reference | ||
|---|---|---|---|---|---|
| RMSE | Bias | RMSE | Bias | ||
| CNES | 30~48° N | 10.0 | −1.3 | 8.0 | −0.4 |
| 0~30° N | 11.2 | 0.1 | 8.0 | −0.4 | |
| 0~38° S | 10.3 | −0.9 | 7.9 | 0.3 | |
| Mean | 10.4 | −0.8 | 8.0 | −0.1 | |
| PPP-B2b | 30~48° N | 16.2 | 1.5 | 15.7 | 2.7 |
| 0~30° N | 25.7 | 2.5 | 23.9 | 2.6 | |
| 0~38° S | 24.8 | −1.0 | 25.0 | 1.1 | |
| Mean | 22.2 | 0.7 | 21.7 | 2.1 | |
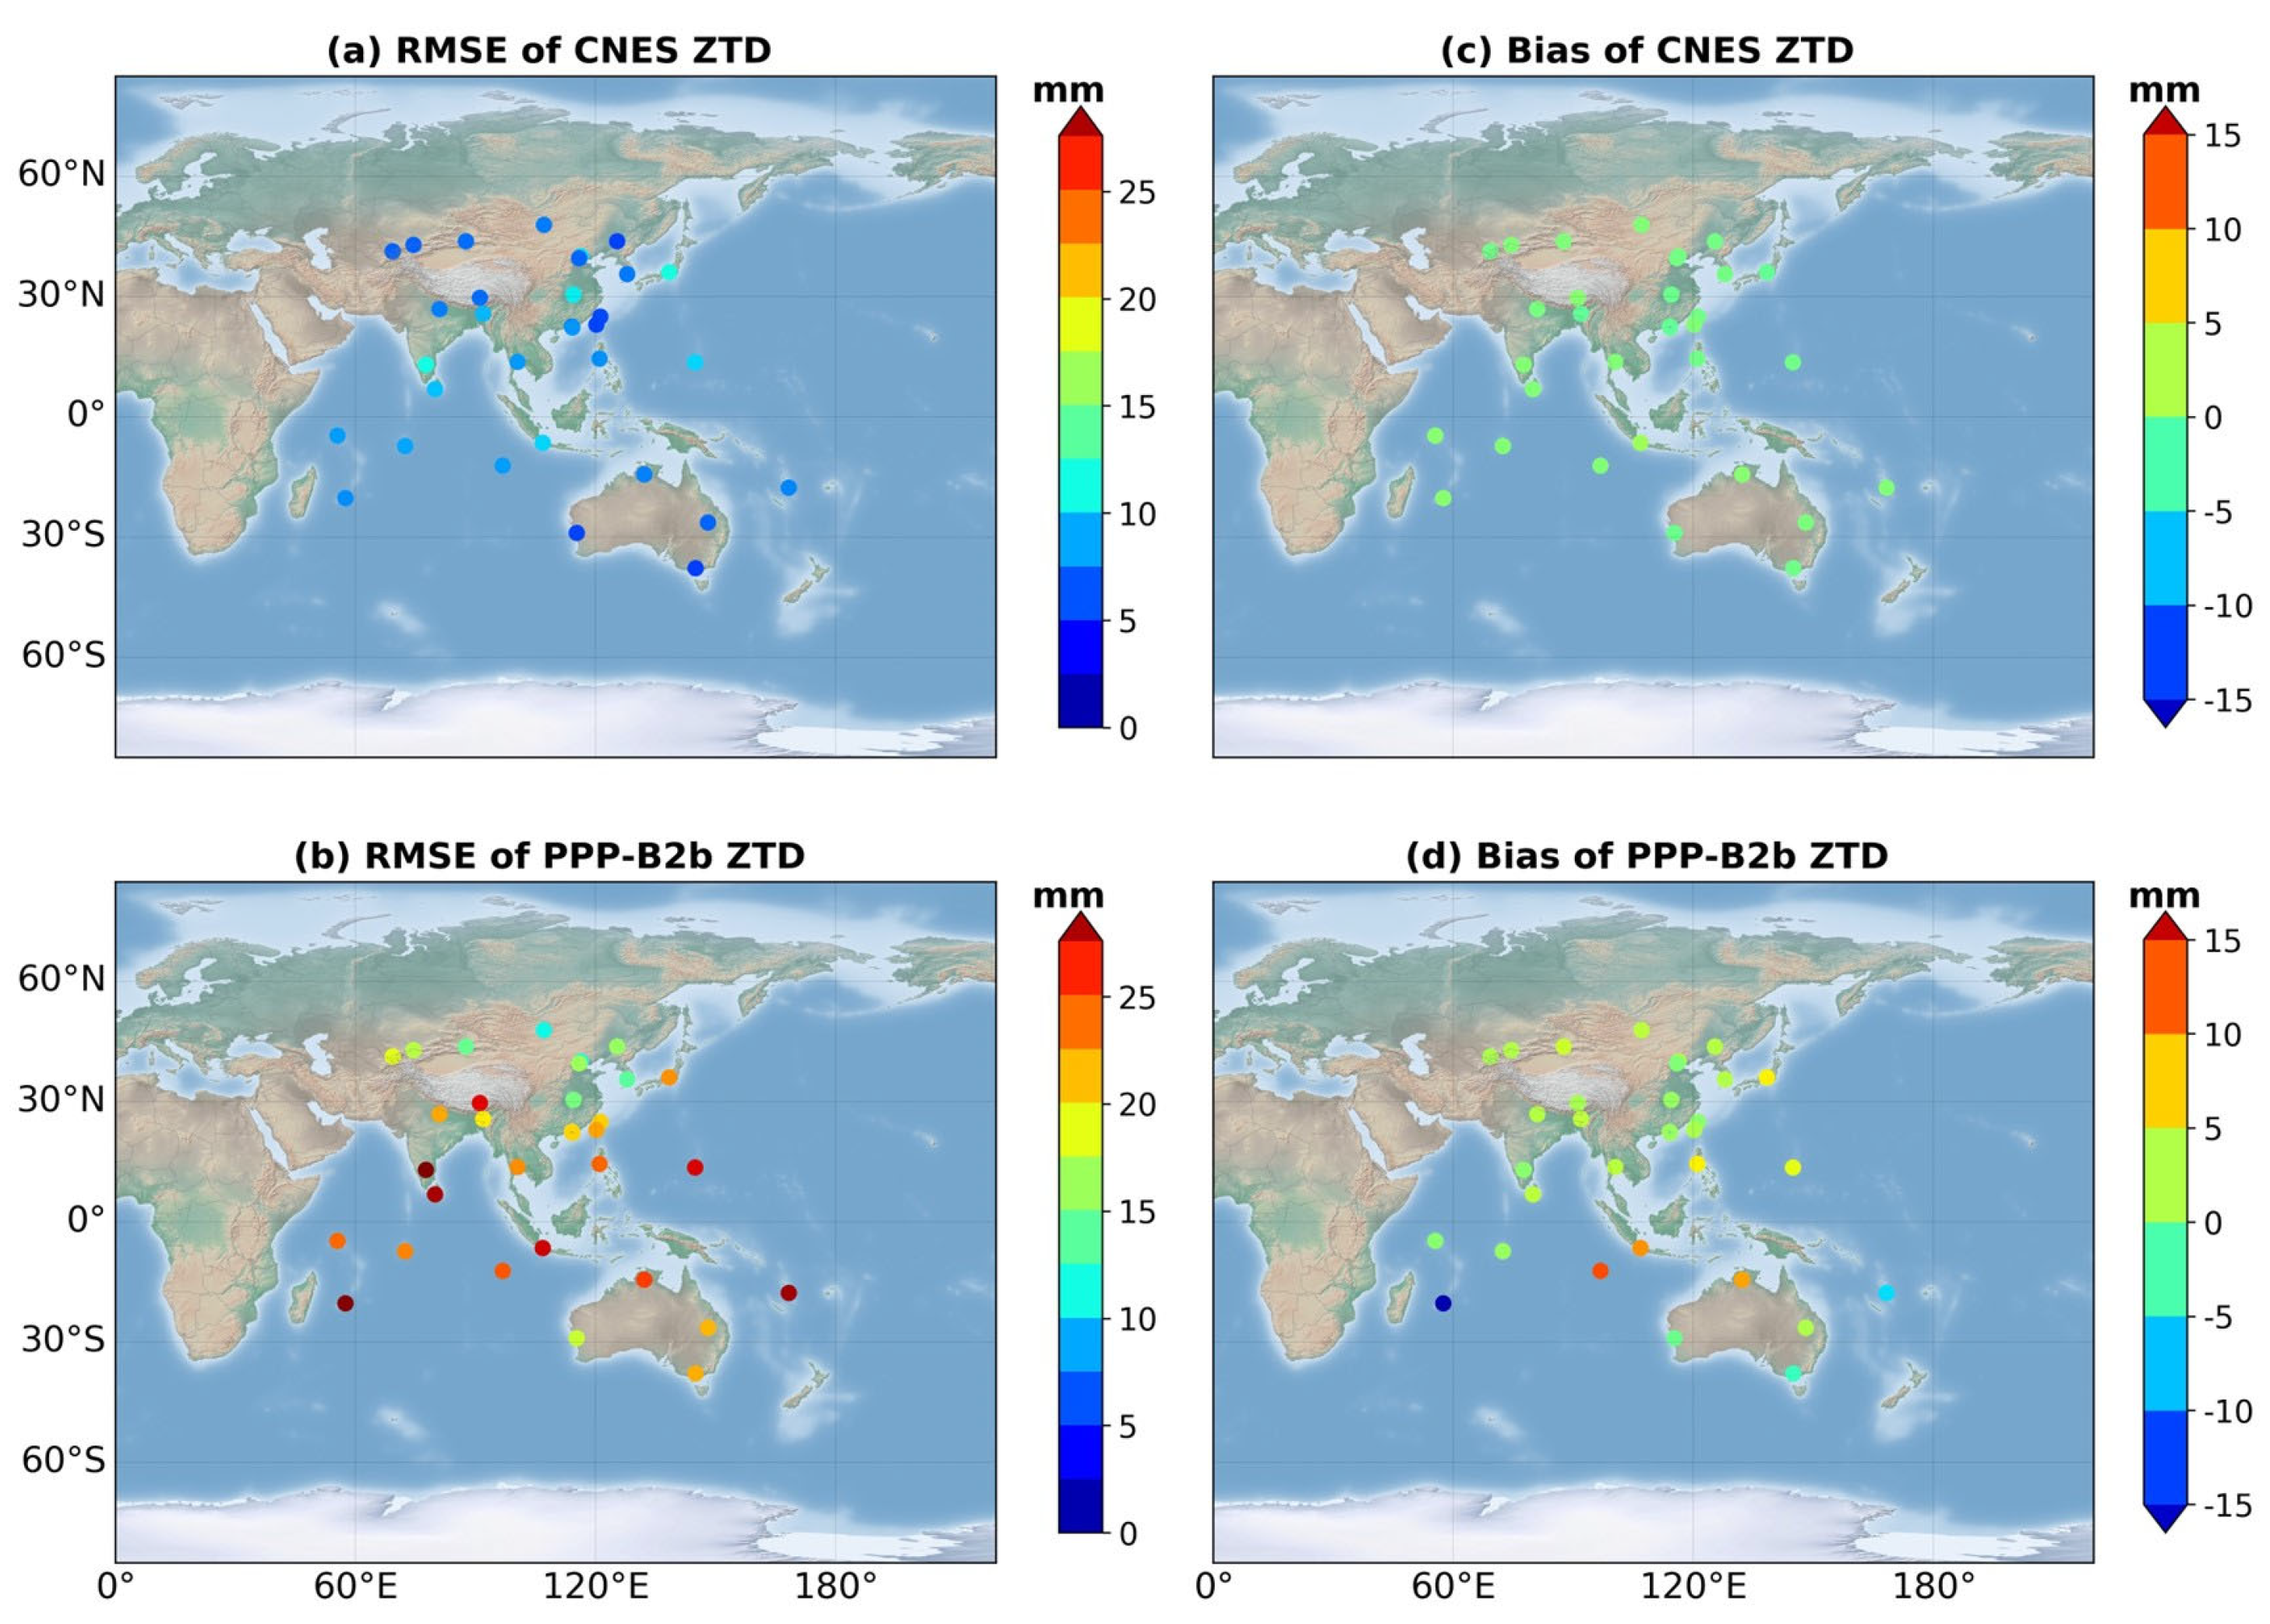
| Solutions | Latitude Range | ZTD | PWV | ||
|---|---|---|---|---|---|
| RMSE | Bias | RMSE | Bias | ||
| IGS | 30~48° N | 18.3 | −3.0 | 2.9 | −0.5 |
| 0~30° N | 22.4 | 0.8 | 3.6 | 0.1 | |
| 0~38° S | 16.4 | −0.6 | 2.7 | −0.1 | |
| Mean | 19.0 | −0.9 | 3.1 | −0.1 | |
| GBM | 30~48° N | 15.7 | −3.5 | 2.5 | −0.6 |
| 0~30° N | 21.2 | −0.9 | 3.4 | −0.3 | |
| 0~38° S | 16.8 | −1.0 | 2.7 | −0.3 | |
| Mean | 18.4 | −1.7 | 3.0 | −0.4 | |
| CNES | 30~48° N | 17.8 | −4.1 | 2.8 | −0.7 |
| 0~30° N | 22.3 | −1.4 | 3.6 | −0.4 | |
| 0~38° S | 17.3 | −0.7 | 2.8 | −0.2 | |
| Mean | 19.6 | −2.0 | 3.2 | −0.4 | |
| PPP-B2b | 30~48° N | 20.9 | −0.7 | 3.2 | −0.2 |
| 0~30° N | 31.2 | 1.3 | 5.0 | 0.1 | |
| 0~38° S | 29.9 | 0.9 | 4.8 | 0.0 | |
| Mean | 27.8 | 0.7 | 4.4 | 0.0 | |
| Solutions | Latitude Range | ZTD | PWV | ||
|---|---|---|---|---|---|
| RMS | Bias | RMS | Bias | ||
| IGS | 30~48° N | 12.7 | 2.3 | 2.1 | −0.1 |
| 0~30° N | 15.3 | −1.4 | 2.5 | −0.5 | |
| 0~38° S | 11.6 | −0.9 | 2.2 | −0.8 | |
| Mean | 13.1 | 0.2 | 2.3 | −0.4 | |
| GBM | 30~48° N | 10.2 | −1.7 | 1.9 | −0.8 |
| 0~30° N | 12.2 | −3.4 | 2.2 | −1.0 | |
| 0~38° S | 13.1 | −5.2 | 2.4 | −1.4 | |
| Mean | 11.7 | −3.2 | 2.1 | −1.0 | |
| CNES | 30~48° N | 13.5 | −1.9 | 2.4 | −0.9 |
| 0~30° N | 12.9 | −3.9 | 2.4 | −1.1 | |
| 0~38° S | 13.9 | −6.4 | 2.6 | −1.7 | |
| Mean | 13.4 | −3.8 | 2.4 | −1.2 | |
| PPP-B2b | 30~48° N | 17.0 | −0.4 | 2.8 | −0.9 |
| 0~30° N | 25.1 | 4.6 | 4.1 | −1.3 | |
| 0~38° S | 26.1 | 5.0 | 4.4 | −0.1 | |
| Mean | 22.4 | 2.9 | 3.7 | −0.8 | |
Disclaimer/Publisher’s Note: The statements, opinions and data contained in all publications are solely those of the individual author(s) and contributor(s) and not of MDPI and/or the editor(s). MDPI and/or the editor(s) disclaim responsibility for any injury to people or property resulting from any ideas, methods, instructions or products referred to in the content. |
© 2024 by the authors. Licensee MDPI, Basel, Switzerland. This article is an open access article distributed under the terms and conditions of the Creative Commons Attribution (CC BY) license (https://creativecommons.org/licenses/by/4.0/).
Share and Cite
Wang, X.; Chen, Y.; Zhang, J.; Qiu, C.; Zhou, K.; Li, H.; Huang, Q. Assessment of BDS-3 PPP-B2b Service and Its Applications for the Determination of Precipitable Water Vapour. Atmosphere 2024, 15, 1048. https://doi.org/10.3390/atmos15091048
Wang X, Chen Y, Zhang J, Qiu C, Zhou K, Li H, Huang Q. Assessment of BDS-3 PPP-B2b Service and Its Applications for the Determination of Precipitable Water Vapour. Atmosphere. 2024; 15(9):1048. https://doi.org/10.3390/atmos15091048
Chicago/Turabian StyleWang, Xiaoming, Yufei Chen, Jinglei Zhang, Cong Qiu, Kai Zhou, Haobo Li, and Qiuying Huang. 2024. "Assessment of BDS-3 PPP-B2b Service and Its Applications for the Determination of Precipitable Water Vapour" Atmosphere 15, no. 9: 1048. https://doi.org/10.3390/atmos15091048
APA StyleWang, X., Chen, Y., Zhang, J., Qiu, C., Zhou, K., Li, H., & Huang, Q. (2024). Assessment of BDS-3 PPP-B2b Service and Its Applications for the Determination of Precipitable Water Vapour. Atmosphere, 15(9), 1048. https://doi.org/10.3390/atmos15091048