Article

Spatiotemporal Variation Patterns of Drought in Liaoning Province, China, Based on Copula Theory

1
College of Water Conservancy, Shenyang Agricultural University, Shenyang 110866, China
2
Key Laboratory of Agricultural Soil and Water Engineering in Arid and Semiarid Areas, Ministry of Education, Northwest A&F University, Yangling 712100, China
3
College of Water Resources and Architectural Engineering, Northwest A&F University, Yangling 712100, China
4
Institute of Water-Saving Agriculture in Arid Areas of China, Northwest A&F University, Yangling 712100, China
*
Authors to whom correspondence should be addressed.
These authors contributed equally to this work.
Atmosphere 2024, 15(9), 1063; https://doi.org/10.3390/atmos15091063
Submission received: 2 August 2024 / Revised: 23 August 2024 / Accepted: 29 August 2024 / Published: 3 September 2024
(This article belongs to the Section Meteorology)

Abstract

:
Liaoning Province, a crucial agricultural region in Northeast China, has endured frequent drought disasters in recent years, significantly affecting both agricultural production and the ecological environment. Conducting drought research is of paramount importance for formulating scientific drought monitoring and prevention strategies, ensuring agricultural production and ecological safety. This study developed a Comprehensive Joint Drought Index (CJDI) using the empirical Copula function to systematically analyze drought events in Liaoning Province from 1981 to 2020. Through the application of MK trend tests, Morlet wavelet analysis, and run theory, the spatiotemporal variation patterns and recurrence characteristics of drought in Liaoning Province were thoroughly investigated. The results show that, compared to the three classic drought indices, Standardized Precipitation Index (SPI), Evaporative Demand Drought Index (EDDI), and Standardized Precipitation Evapotranspiration Index (SPEI), CJDI has the highest accuracy in monitoring actual drought events. From 1981 to 2020, drought intensity in all regions of Liaoning Province (east, west, south, and north) exhibited an upward trend, with the western region experiencing the most significant increase, as evidenced by an MK test Z-value of −4.53. Drought events in Liaoning Province show clear seasonality, with the most significant periodic fluctuations in spring (main cycles of 5–20 years, longer cycles of 40–57 years), while the frequency and variability of drought events in autumn and winter are lower. Mild droughts frequently occur in Liaoning Province, with joint and co-occurrence recurrence periods ranging from 1.0 to 1.8 years. Moderate droughts have shorter joint recurrence periods in the eastern region (1.2–1.4 years) and longer in the western and southern regions (1.4–2.2 years), with the longest co-occurrence recurrence period in the southern region (3.0–4.0 years). Severe and extreme droughts are less frequent in Liaoning Province. This study provides a scientific foundation for drought monitoring and prevention in Liaoning Province and serves as a valuable reference for developing agricultural production strategies to adapt to climate change.

1. Introduction

Drought is a climatic phenomenon caused by a significant reduction in precipitation [1]. It is typically classified into four types based on its impact and extent: meteorological drought, agricultural drought, hydrological drought, and socio-economic drought [2,3]. Liaoning Province, a vital agricultural region in northeastern China, has long faced significant impacts on agricultural production due to persistent drought issues. In recent years, driven by global warming, the intensification of the hydrological cycle, along with increased evaporation and changes in precipitation patterns, has extended the duration and increased the frequency of drought events in Liaoning Province, resulting in insufficient soil moisture and severely hindering crop growth. Particularly, droughts in spring and summer often result in inadequate water supply during the sowing and growing periods of crops, causing large-scale yield reductions and significantly impacting farmers’ economic income [4,5,6]. Against this backdrop, investigating the spatiotemporal variation patterns of drought in Liaoning Province, China, is of paramount importance for addressing drought and alleviating its effects on agricultural production.
Drought indices are commonly used indicators to measure the severity of drought, assessing the frequency, duration, and intensity of drought events. Prominent drought indices include the Standardized Precipitation Index (SPI), the Evaporative Demand Drought Index (EDDI), and the Standardized Precipitation Evapotranspiration Index (SPEI) [7,8,9]. The SPI is a drought index calculated based on standardized precipitation data, which can effectively reflect precipitation anomalies over different time scales [10,11]. McKee et al. [12] employed the SPI to assess drought conditions in the Midwestern United States. The research results indicated that the SPI could accurately monitor both short-term and long-term precipitation changes and successfully identify regional drought events, offering strong support for drought warning and management. The EDDI is a drought index calculated based on evapotranspiration data, which can reflect changes in soil and crop moisture conditions [13,14]. Noguera et al. [15] evaluated that the EDDI generated using a log-logistic distribution has higher reliability compared to the original non-parametric method, making it suitable for drought monitoring under different climatic conditions. However, both of these drought indices consider only one factor, either precipitation or evaporation, neglecting the multifaceted meteorological influences that contribute to drought. The SPEI integrates precipitation and potential evapotranspiration, offering a more comprehensive reflection of the water balance in the hydrological cycle, making it one of the key tools in recent drought research [16,17]. Ismallianto et al. [18] conducted a drought analysis in Sarawak, Malaysia, utilizing both the Standardized Precipitation Evapotranspiration Index (SPEI) and the Standardized Precipitation Index (SPI). The study revealed that, compared to the SPI, the SPEI more comprehensively reflects drought conditions, especially in identifying severe to extreme drought events over longer time scales.
However, the SPEI uses a default linear combination method for drought assessment, which has relatively fixed statistical characteristics. This implies that the SPEI might not perform well under certain special climatic conditions, failing to accurately reflect drought conditions [19]. Copula functions provide greater flexibility, enabling researchers to choose the most appropriate type of Copula function (such as Gumbel, Clayton, or Frank) according to the specific study area and objectives to better capture the regional climate and drought characteristics [20]. For instance, Noguera et al. [15] employed the Gumbel Copula to analyze sudden drought conditions in Spain. The study showed that the Gumbel Copula more precisely captures abrupt droughts resulting from the combined effect of insufficient precipitation and increased evaporation demand, providing a new method for drought risk assessment under climate change. Won et al. [21] employed Copula to construct a Combined Joint Drought Index (CJDI) that integrates the SPI and EDDI to monitor meteorological droughts in South Korea. The study results indicated that CJDI could more accurately reflect past drought events and predict future drought trends compared to the SPI and EDDI. Additionally, Zhu et al. [22] employed the Copula function to quantify the propagation time of meteorological drought to hydrological and vegetation droughts across different seasons in the Ganjiang River Basin. The study found that the Copula method could better describe the complex propagation mechanisms of meteorological drought, providing scientific evidence for the development of effective water resource management and drought warning systems. There are currently some studies on other drought modeling methods, such as machine learning algorithms based on nonlinear theory. However, a large body of research indicates that when constructing a joint drought index for drought monitoring, the Copula function can better capture the complex nonlinear relationships that traditional drought index models and machine learning models often fail to detect. For example, Yang et al. [23] employed the Copula function to construct a drought index combining meteorological, agricultural, and hydrological variables, demonstrating that the Copula function outperforms traditional drought indices and machine learning models in drought monitoring.
Therefore, building on previous studies, this research constructed a Combined Joint Drought Index (CJDI) for Liaoning Province, China, by using the Copula function to integrate the SPI and EDDI. It identified the spatiotemporal variation patterns of drought in Liaoning Province and established the joint distribution of drought duration and intensity through the Copula function. The study calculated the joint return period and co-occurrence return period of droughts in the study area, providing a more comprehensive and accurate tool for drought assessment. This approach more effectively captures the spatiotemporal characteristics and cyclical variations of droughts in the region. This innovative methodology introduces new perspectives and techniques for drought monitoring and management, enhancing drought warning and response capabilities, mitigating the adverse impacts of drought on agricultural production and the ecological environment, ensuring food security, and promoting sustainable agricultural development.

2. Data and Methodology
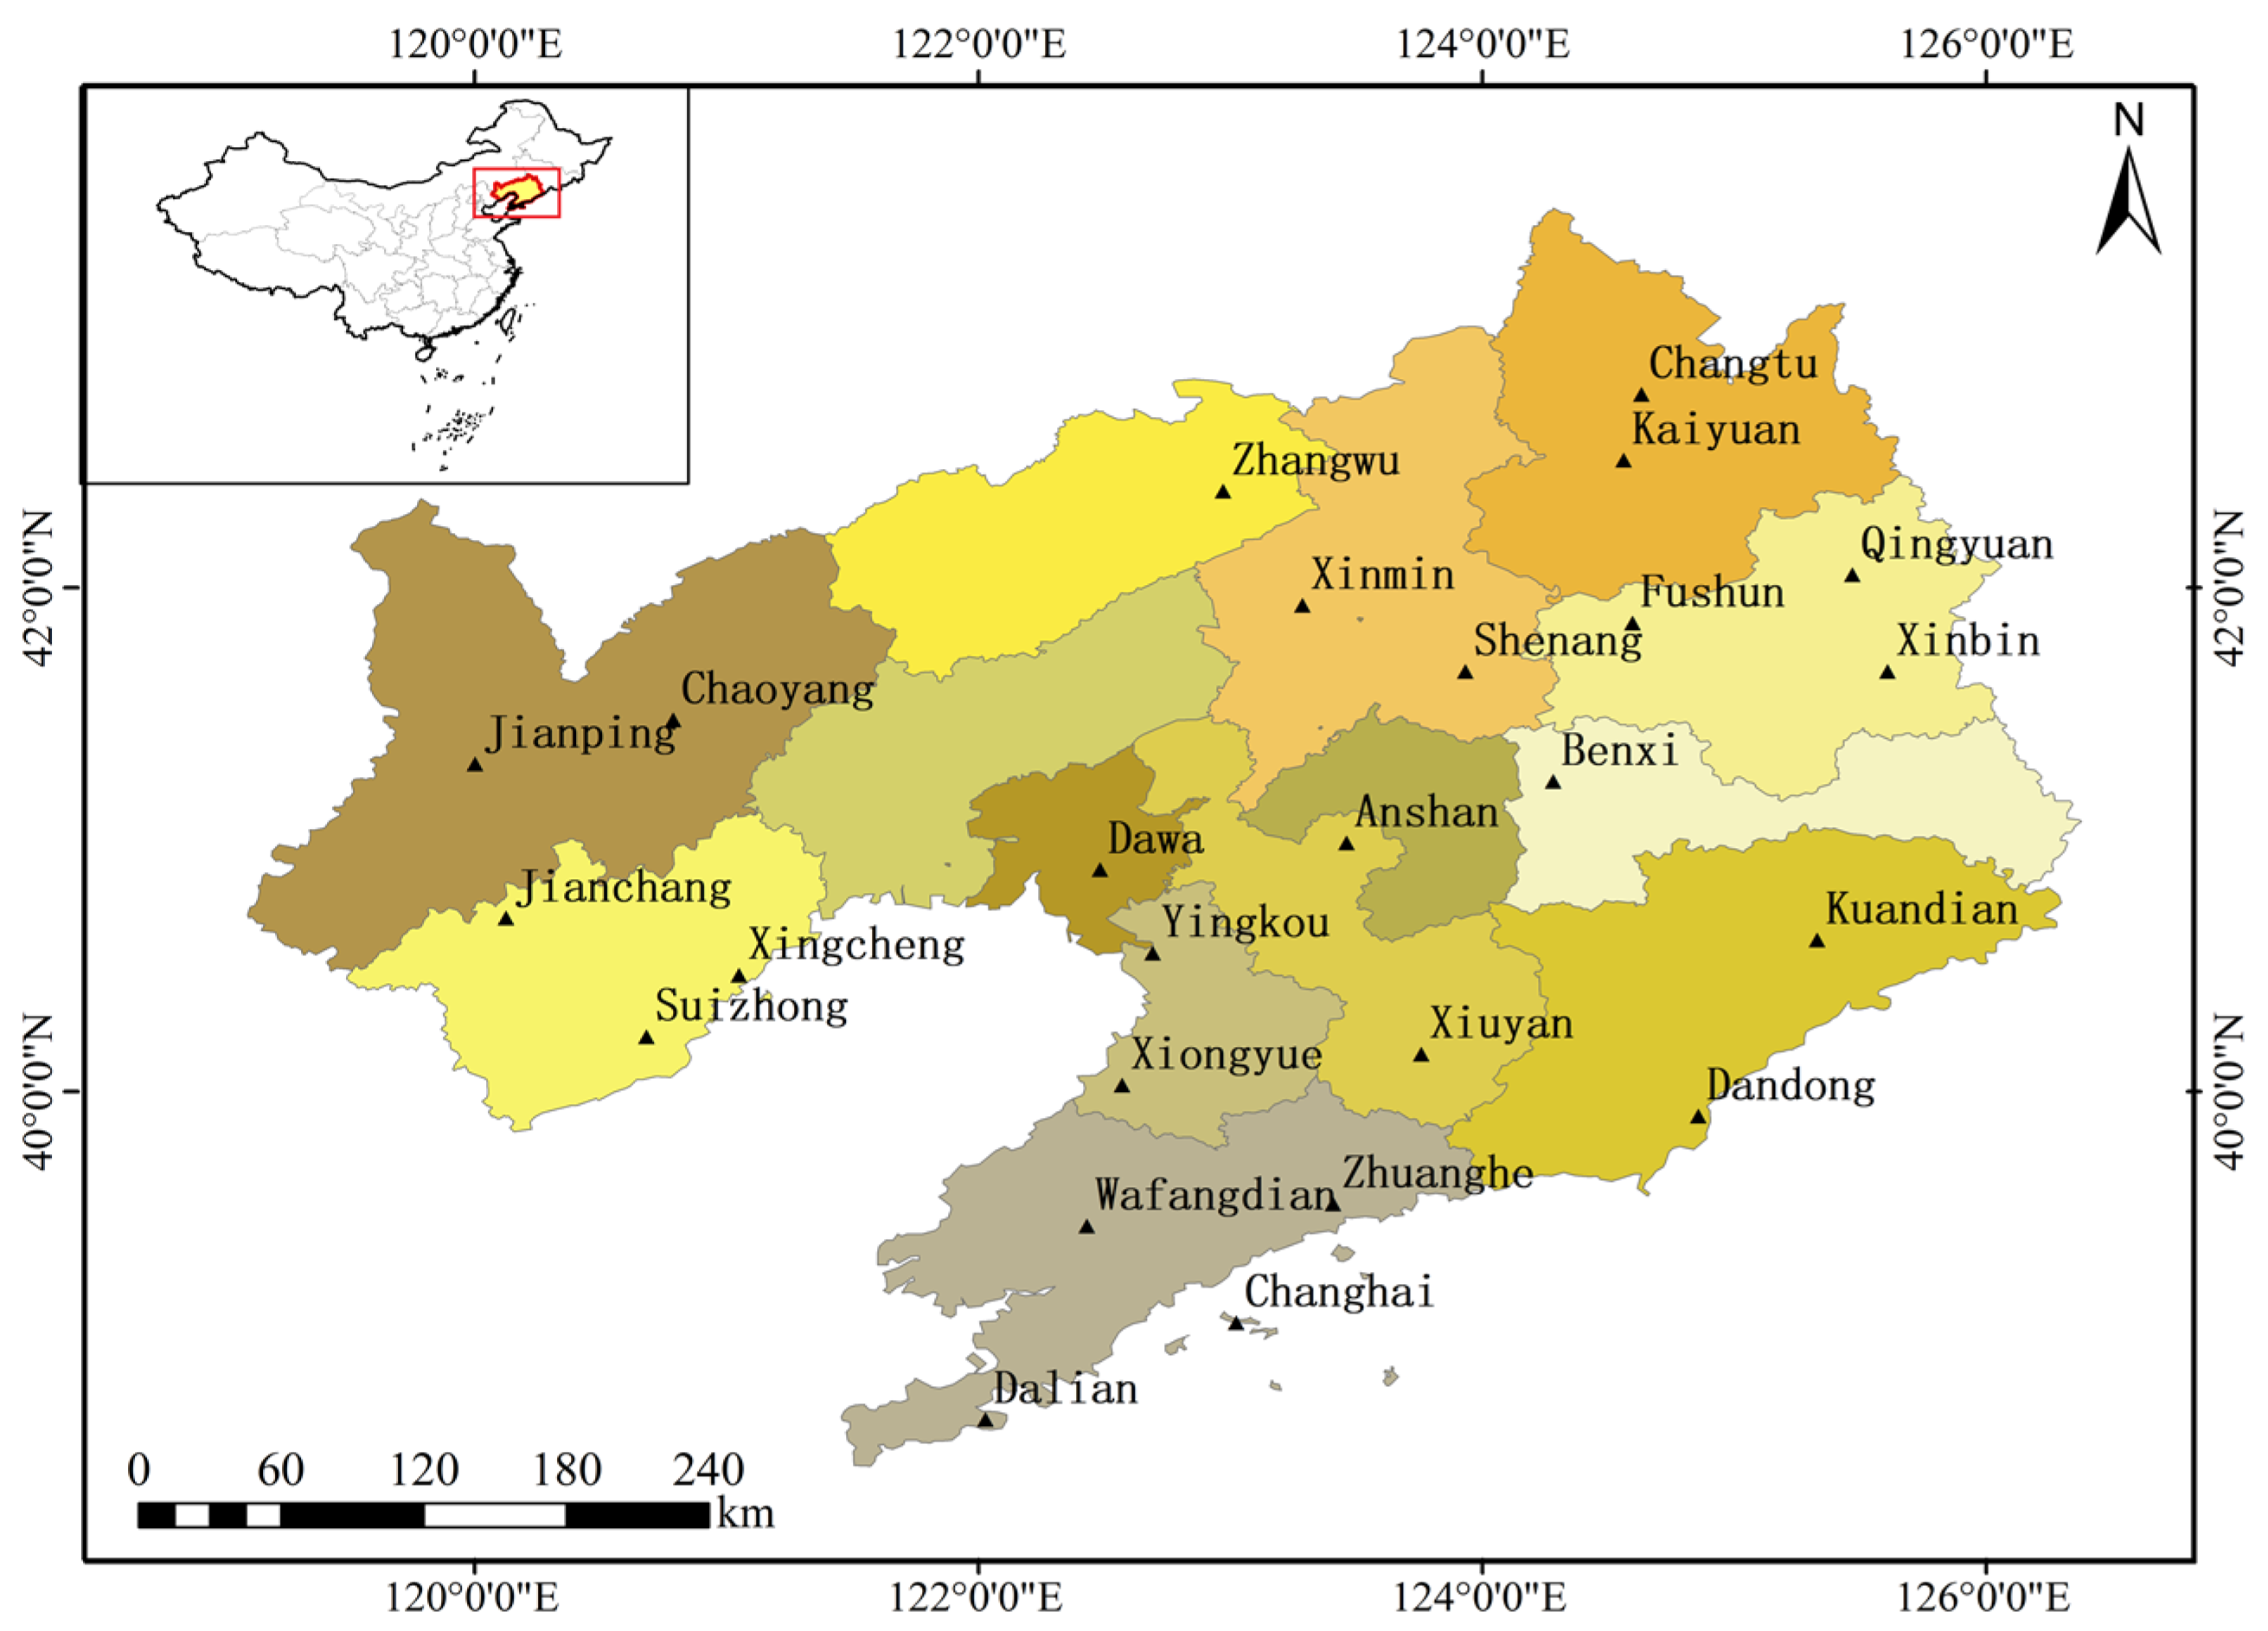
2.1. Study Area

Liaoning Province (118°53′~125°46′ E, 38°43′~43°26′ N) is one of China’s important grain-producing regions, located on the eastern coast of the Eurasian continent, at the southernmost tip of China’s three northeastern provinces (Figure 1). The area has a temperate continental monsoon climate, with ample sunshine, annual sunlight hours ranging from 190 to 290 h, an evaporation rate of 1500 mm, and precipitation of 598 mm. The four seasons are distinct, with precipitation and evaporation primarily concentrated from June to August. During these months, the average annual evaporation is 600–700 mm, and the precipitation is 499 mm. Climatic conditions lead to significant differences within Liaoning Province: the average annual evaporation is generally higher in the east than in the west, while the average annual precipitation is greater in the east than in the west and higher in the south than in the north [24].

2.2. Data Source

This study selects data from 25 meteorological stations in Liaoning Province, with long-term meteorological records from the China Meteorological Data Network http://data.cma.cn/ (accessed on 31 October 2021). The distribution of these stations is shown in Figure 1. The meteorological data required for the study include daily data on average humidity, sunlight hours, temperature, wind speed, and precipitation from 1981 to 2020. All selected data have undergone strict quality control and are relatively complete. The missing data rates for average humidity, sunlight hours, temperature, and wind speed are all less than 1%, while the missing data rate for precipitation is less than 10%. Missing data were supplemented using data from nearby stations on the same day, which were interpolated and extended to complete the records, serving as the basis for calculating the various drought indices.
To further analyze the regional and seasonal differences in drought in Liaoning Province, the province was divided into four regions: east, west, south, and north. The specific division details are shown in Table 1. The seasons were divided based on the actual conditions in Liaoning Province, with spring being March to May, summer from June to August, autumn from September to November, and winter from December to February of the following year.
Using drought event records from 2010 to 2020 provided by the China National Climate Center database https://www.emdat.be/ (accessed on 31 October 2021) as reference values, the accuracy of various drought indices in monitoring drought events was evaluated.

2.3. Research Methods

2.3.1. Calculation of Reference Crop Evapotranspiration

The reference crop evapotranspiration (ET0) for each station is calculated using the most widely used Penman–Monteith equation [25], as shown in Equation (1).
E T 0 = 0.408 R n G + 900 γ μ 2 ( e s     e a ) T + 273 + γ ( 1 + 0.34 μ 2 )
In the equation, Rn is the net radiation, MJ/(m2d); G is the soil heat flux, MJ∙m2/d, which is calculated as 0 for the daily scale in this study; µ2 is the wind speed at 2 m height, m/s; es is the saturated vapor pressure, kPa; ea is the actual vapor pressure, kPa; △ is the slope of the saturated vapor pressure–temperature curve, kPa/°C; γ is the psychrometric constant, kPa/°C; and T is the average air temperature, °C.

2.3.2. Calculation of Drought Indices

When calculating drought indices, using a 3-month scale data can provide more stable drought assessments, suitable for seasonal drought monitoring. It also captures moisture accumulation or deficits over a longer period, making it suitable for evaluating water supply conditions during the crop growth cycle. This time scale not only helps accurately reflect the water needs of agricultural production but also facilitates more effective mid-term drought warnings and water resource management [26]. Therefore, the time scale for all drought indices in this study is 3 months. Among the four drought indices, lower values of SPI, SPEI, and CJDI indicate more severe drought, while higher values of EDDI indicate more severe drought.
(1)
Standardized Precipitation Index (SPI)
The calculation of the Standardized Precipitation Index (SPI) involves fitting the gamma probability distribution to the precipitation data of each station in the study area, followed by normal standardization to obtain the SPI [27]. The specific steps are as follows:
For given independent random precipitation data x, the first step is to calculate the mean precipitation and standard deviation for the period, and then use these values to calculate the skewness of the given precipitation data, as shown in Equation (2):
S k e w = N N 1 N 2 x x ¯ S 3
where N is the number of precipitation samples; x ¯ is the mean precipitation; S is the standard deviation.
The second step is to transform the precipitation data into logarithmic normal values, thereby calculating the gamma distribution statistics U, shape parameter β, and scale parameter α, as shown in Equations (3)–(5):
U = x l n ¯ ln x N
β = 1 + 1 + 4 U / 3 4 U
α = x ¯ β
Based on the shape parameter and scale parameter, the cumulative probability of the precipitation data can be calculated, as shown in Equation (6):
G x = 0 x x α 1 e x β d x β α Г α
Since the gamma function is undefined at x = 0 and precipitation during a certain period may be 0, the cumulative probability needs to be calculated using Equation (7):
H x = q + 1 q G x
where q may be 0 in the equation, the equation for calculating the Standardized Precipitation Index is given by Equation (8):
S P I = S t c 2 t + c 1 t + c 0 d 3 t + d 2 t + d 1 t + 1.0
where t = ln 1 G x 2 ; x is the precipitation during the period, mm; G(x) is the cumulative probability corresponding to x; S is the probability density sign coefficient, with S = 1 when G(x) > 0.5 and S = −1 when G(x) ≤ 0.5; c0 = 2.515517, c1 = 0.802853, c2 = 0.010328, d1 = 1.432788, d2 = 0.189269, and d3 = 0.001308.
(2)
Evaporative Demand Drought Index (EDDI)
The calculation of the Evaporative Demand Drought Index (EDDI) uses the empirical Equation (9) to compute the cumulative empirical probability P(ET0) of ET0 at each station in the study area [28]:
P E T 0 = i 0.33 n + 0.33
where i is the rank of the cumulative ET0 for a given time period in the time series, with i = 1 representing the maximum ET0; n is the length of the time series.
The EDDI can be obtained by standardizing the cumulative empirical probability P(ET0i) using Equation (10):
E D D I = W c 0 + c 1 W + c 2 W 2 1 + d 1 W + d 2 W 2 + d 3 W 3
when P ( E T 0 ) : W = 2 l n P ( E T 0 ) ; when P ( E T 0 ) , replace P ( E T 0 ) with 1 P E T 0 and take the opposite sign.
(3)
Standardized Precipitation Evapotranspiration Index (SPEI)
The Standardized Precipitation Evapotranspiration Index (SPEI) is an index based on the difference between precipitation and ET0 (D = PET0) for standardized calculations, suitable for monitoring and assessing droughts over different time scales. First, calculate the reference crop evapotranspiration (ET0), then determine the cumulative water deficit over different time scales. The water deficit data series is then fitted using a three-parameter log-logistic probability distribution function, Equation (11), and the SPEI is obtained through the standardized cumulative probability density Equation (12) [29].
F x = 1 + α x γ β 1
S P E I = V c 0 + c 1 V + c 2 V 2 1 + d 1 V + d 2 V 2 + d 3 V 3
where α is the scale parameter, β is the shape parameter, and γ is the location parameter. These three parameters can all be estimated using the L-moments method. The probability of D > 0 is P ( D ) = 1 F ( x ) ; when p ≤ 0.5, V = 2 l n P ( D ) ; when p > 0.5, replace P(D) with 1 P ( D ) and take the opposite sign.
(4)
Combined Joint Drought Index (CJDI)
There are multiple types of Copula functions, such as Clayton, Frank, and Gumbel. However, these high-dimensional parametric Copulas typically require numerous parameters, which can constrain the correlation structures they represent [30]. When calculating the Comprehensive Joint Drought Index (CJDI) by integrating SPI and EDDI, due to the availability of sufficient data, the empirical Copula function, as used in Won’s [21] method, was employed for its intuitive and simple formula to derive CJDI data on a 3-month time scale. Compared to high-dimensional parametric Copula functions, the empirical Copula function is advantageous for its simplicity and ease of use, and its feasibility has been validated in prior studies [31]. The specific calculation method is as follows:
The first step is to set variable X1 as SPI and variable X2 as −EDDI. Then, the bivariate empirical Copula with a sample size n for variables X1 and X2, Cn is defined as:
X 1 , , X d C n k 1 n , k 2 n = a n
where ki is the ith rank of Xj (sorted in ascending order), Xj(ki) is the value of Xj corresponding to the ith rank, and a is the number of {X1, X2} in the time series that simultaneously satisfy X 1 X 1 ( k 1 ) and X 2 X 2 k 2 . Using the Copula function with SPI and −EDDI as variables, the correlation between the two drought indices can be considered. For a given bivariate marginal sample u 1 x , u 2 x , the Copula C U 1 , U 2 ( u 1 x , u 2 x ) is the cumulative probability measure P [ U 1 u 1 x , U 2 u 2 x ] = q . There may be several marginal values with the same cumulative probability C = q. If the cumulative probability q is used as the drought index, drought events with the same q value can be considered to have the same impact. In this case, the Kendall distribution function Kc is defined as the cumulative probability measure:
K c q = P C U 1 , U 2 u 1 , u 2 q
The second step is to construct the empirical distribution function, as shown in Equation (15):
K C n l n = b n
where b is the number of samples {X1,X2} such that C n ( k 1 / n , k 2 / n ) l / n .
The third step is to apply this cumulative probability to the inverse function of the cumulative standard normal distribution to calculate CJDI, as shown in Equation (16):
C J D I = N 1 K c q = N 1 P C U 1 , U 2 u 1 , u 2 q
where N 1 is the inverse of the normal function. As variables for estimating CJDI, SPI, and −EDDI show similar performance under drought conditions. Therefore, using −EDDI and SPI to estimate CJDI also aligns with the drought classification of SPI. The CJDI, like existing drought indices, is dimensionless.

2.3.3. Calculation of Drought Return Period

The run theory, first proposed by Yevjevich [32] to describe drought characteristics, is also known as the run length theory. This paper combines CJDI time series values and drought thresholds to identify and extract drought characteristics. In this study, when the drought index value is less than −1, it is recorded as the occurrence of a drought event, with the month identified as the start of the drought event. The event is considered to end when CJDI > 0. The duration of a drought event is referred to as the drought duration, and the sum of the absolute values of the drought index for all months during the event is recorded as the drought intensity for that event. Based on the classification of SPEI-3 drought duration and intensity in Northeast China by Shen et al. [33] and the actual conditions, the drought levels for Liaoning Province are defined, as shown in Table 2.
Drought return periods are divided into joint return periods and concurrent return periods. The joint return period T represents the return period when either drought duration or drought intensity exceeds a given threshold. By calculating the joint return period, the likelihood of a specific drought level reoccurring within a certain time frame can be assessed. The concurrent return period T represents the return period when both drought duration and drought intensity simultaneously exceed a given threshold. By calculating the concurrent return period, the likelihood of multiple drought events occurring simultaneously can be evaluated. The calculation methods for the two return periods are shown in Equations (17) and (18):
T = E L P D d a D s b = E L 1 C u , v
T = E L P D d a D s b = E L 1 u v + C u , v
where u and v are the marginal distributions of drought duration and drought intensity, respectively; C(u,v) is the joint probability distribution of drought duration and drought intensity; a and b are the thresholds for drought duration and drought intensity, respectively; and E(L) is the mean value of drought intervals.

2.3.4. Data Analysis Methodology

The Mann-Kendall (MK) test is a non-parametric trend test used to determine whether there is a statistically significant trend in data. Compared to traditional trend test methods, the MK test is distribution-free, meaning it does not require the sample distribution to follow a specific pattern, and its results are not affected by outliers in the sample. This makes it more convenient to apply to ordinal and categorical variables, allowing for the quantitative calculation of trends in drought indices over time [34]. In this study, the standard normal test statistic (Z) obtained from the MK test is used to assess the trend changes in various indicators involved in the water cycle and soil moisture content over specific periods. When |Z| is ≥1.28, 1.64, and 2.32, it indicates passing the significance test at confidence levels of 90%, 95%, and 99%, respectively.
Morlet wavelet analysis is a time–frequency analysis method used to reveal local features at different time scales in time series data. Compared to traditional Fourier transform, Morlet wavelet analysis can provide both time and frequency information simultaneously, making it more advantageous in handling non-stationary signals [35]. The Morlet wavelet function is a complex wavelet. In this study, Morlet wavelet analysis was used to monitor the multi-scale variation characteristics of drought index time series at various meteorological stations. By performing wavelet transform on the time series, the real part and variance of the complex wavelet for each station were calculated, revealing the periodic changes of drought events in the study area and identifying the critical time points of drought occurrence.
In this study, Matlab 2020a was used for data calculation and analysis, and Origin 2021 was used for plotting the figures.

3. Results

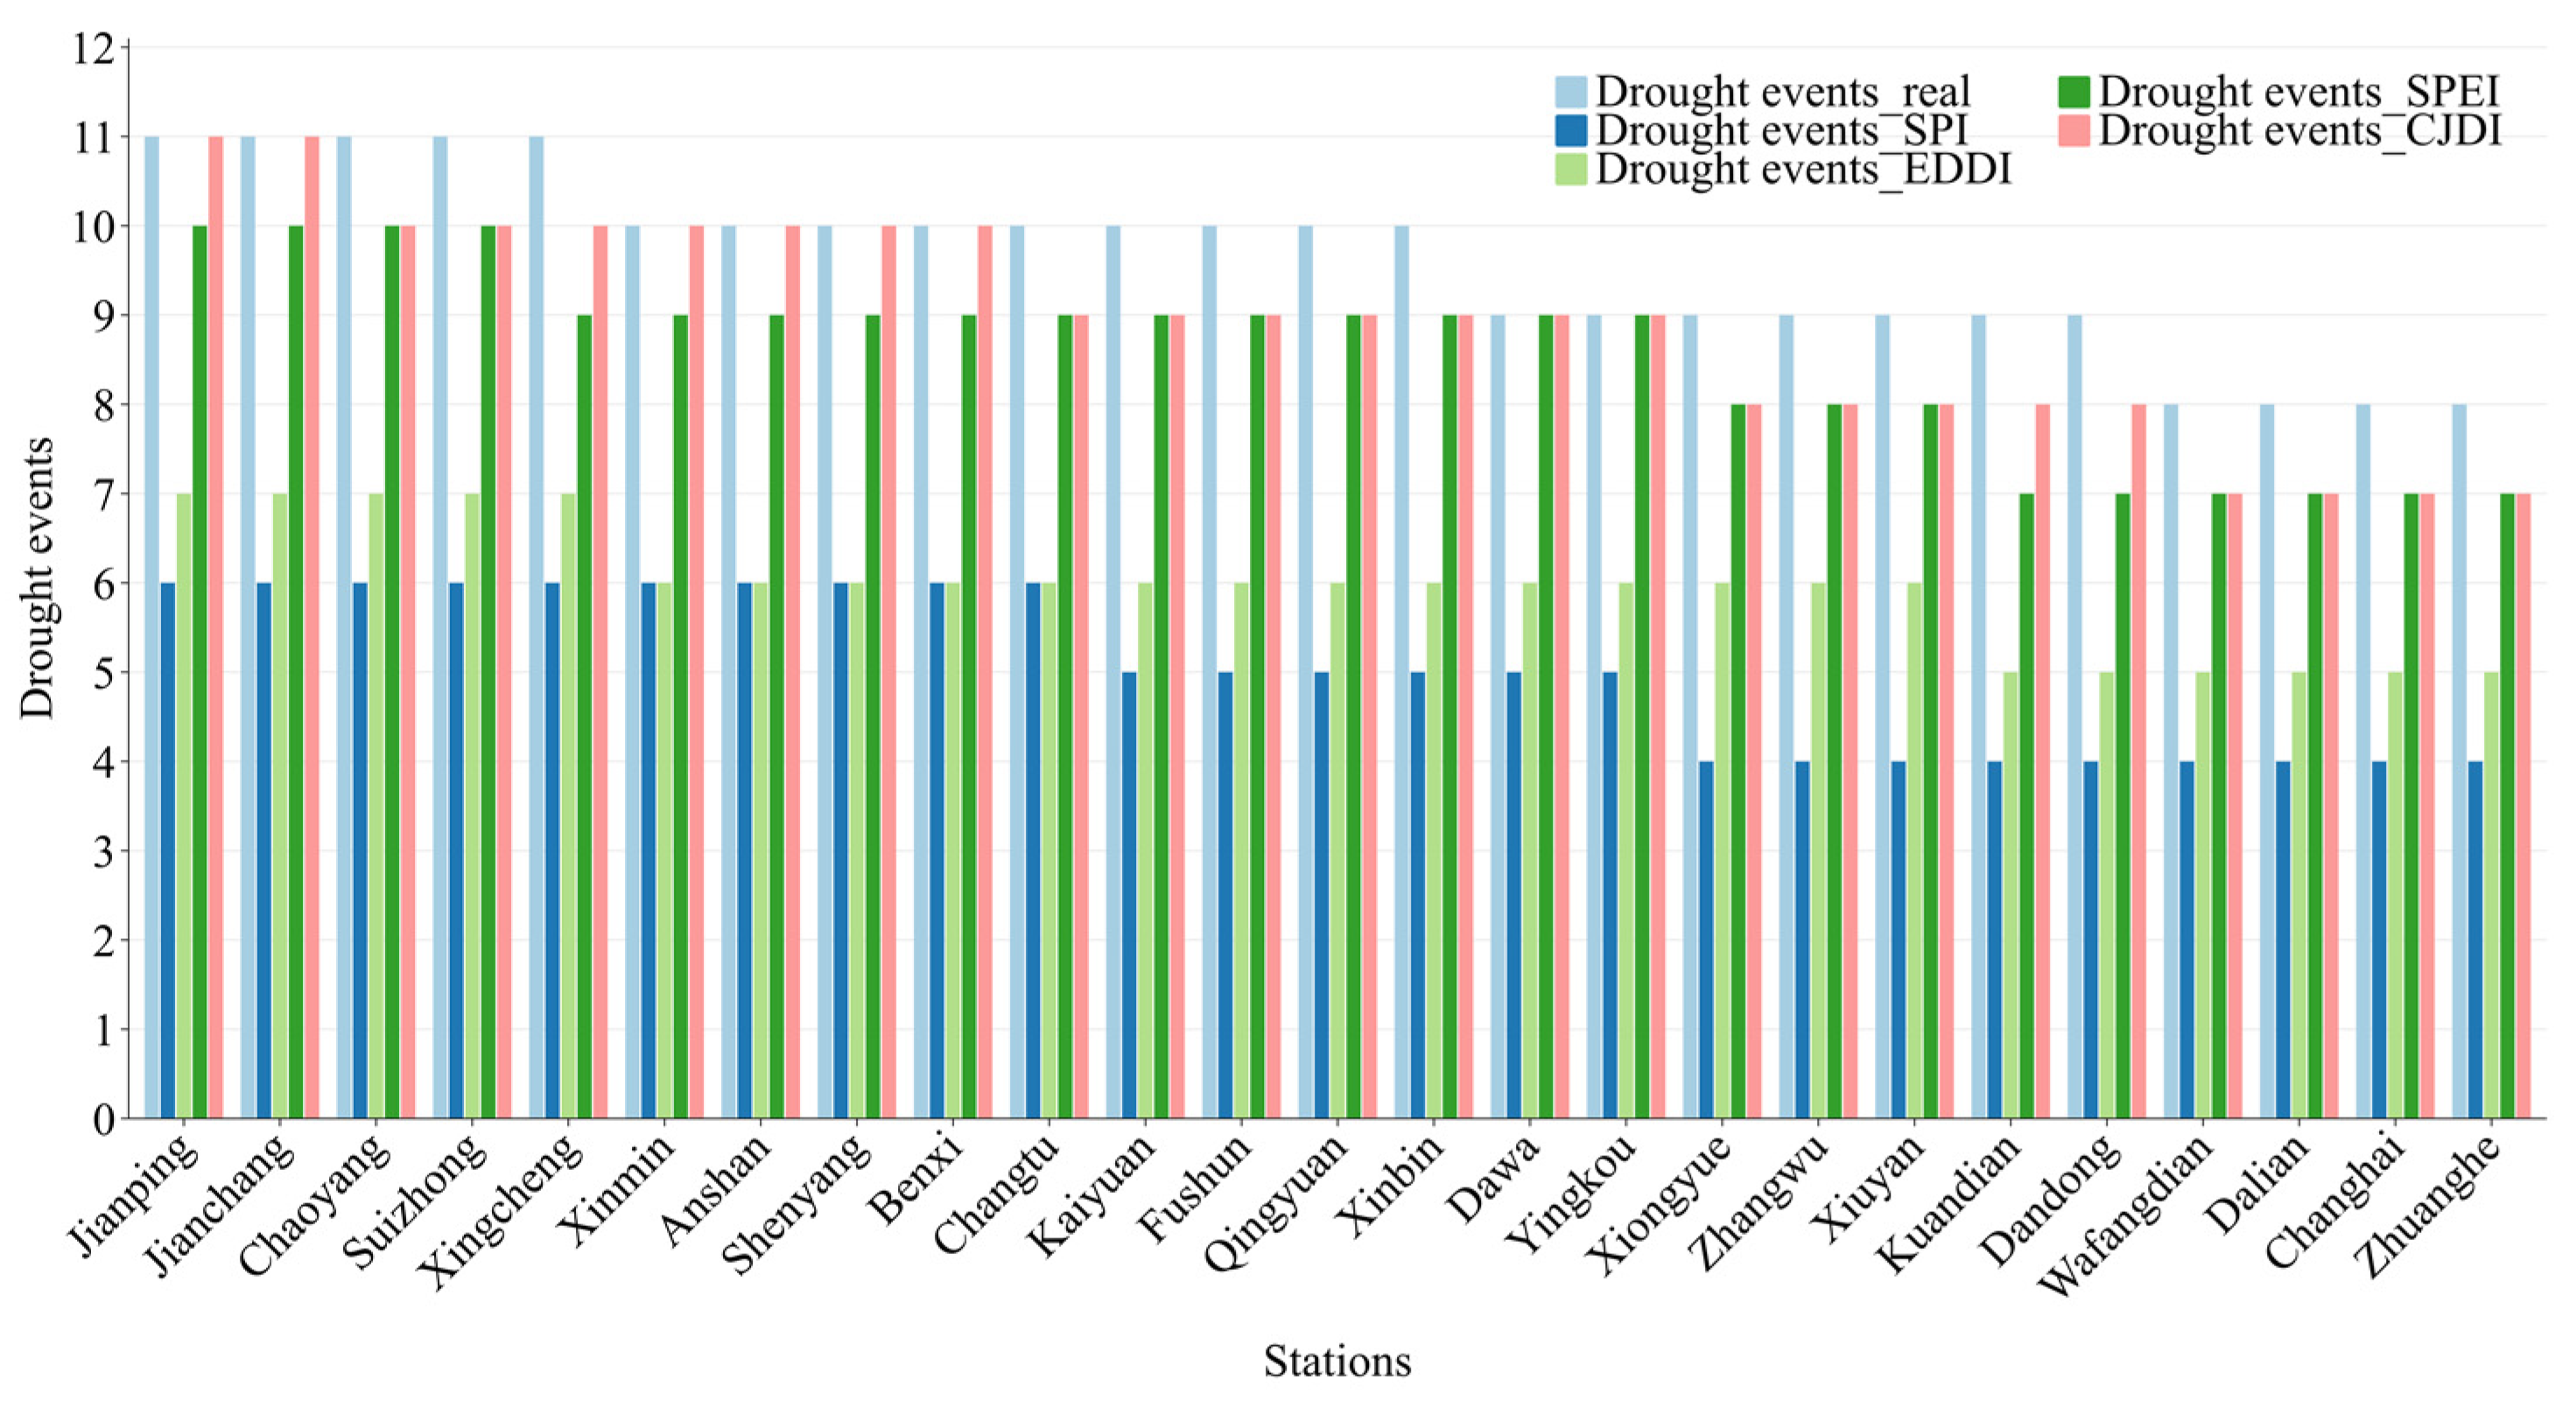
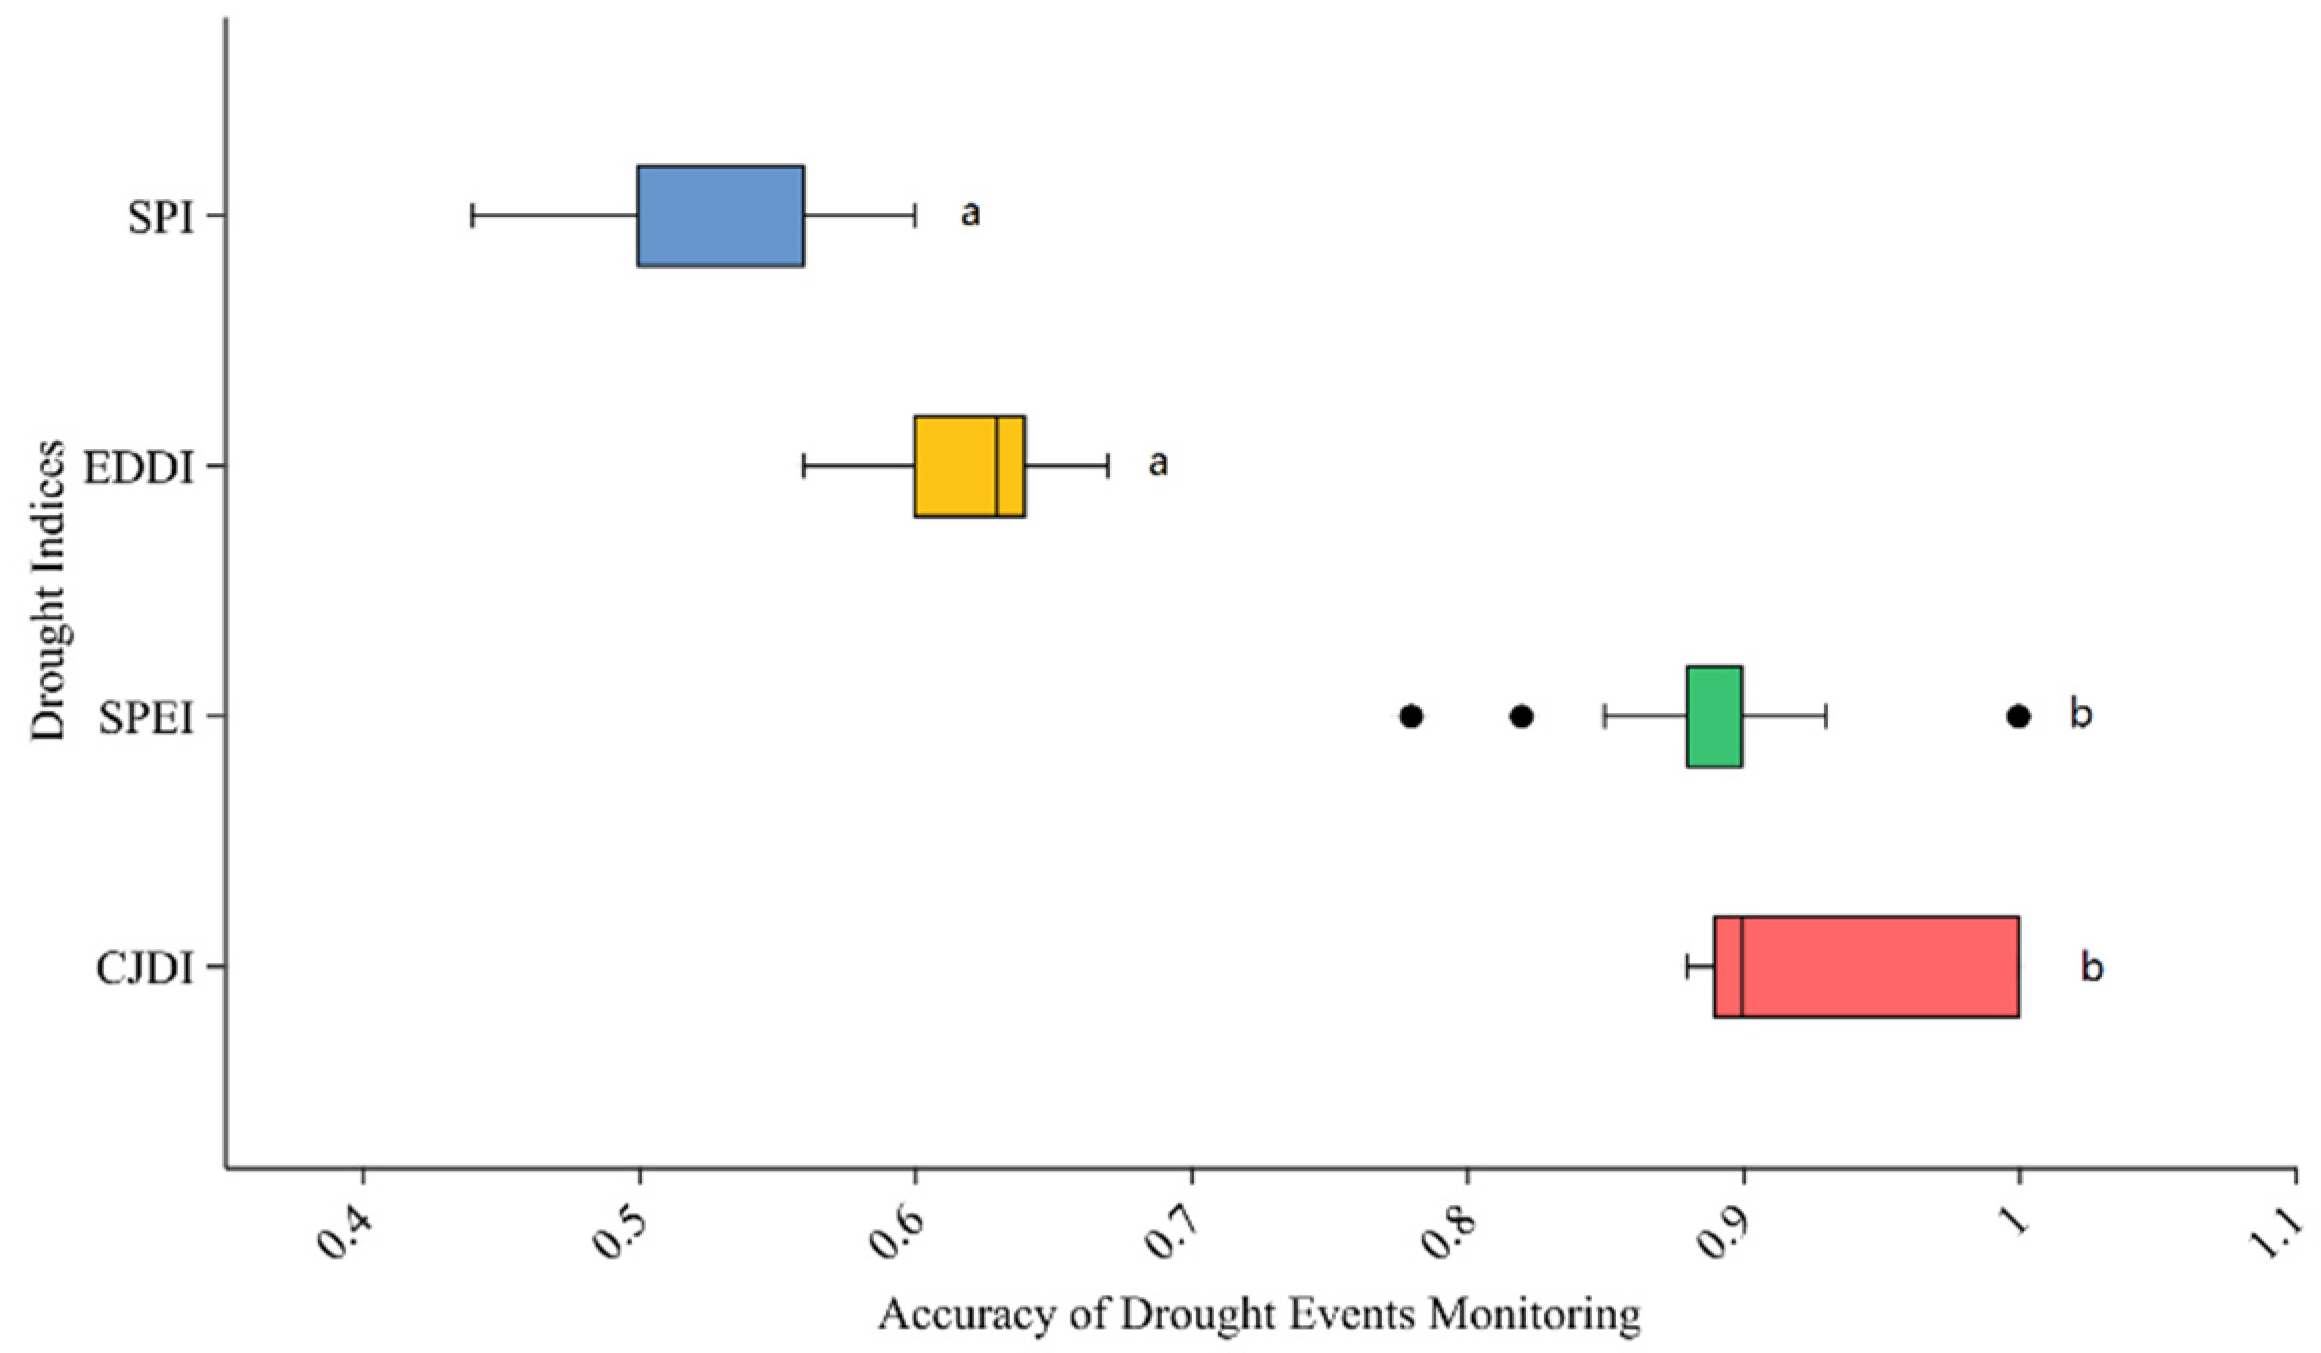
3.1. Comparison of Drought Indices in Monitoring Actual Drought Events

Figure 2 shows the monthly variation trends of four drought indices (CJDI, −EDDI, SPEI, and SPI) at 25 meteorological stations in the study area from 1981 to 2020. The frequency of data fluctuations is significantly lower for the comprehensive drought indices SPEI and CJDI. The figure shows that the SPI and −EDDI, as standardized indices based on single data, have 39 and 43 months, respectively, with mean values < −1 at each station during the study period, and 6 and 4 months with mean values < −1.5. In contrast, the SPEI and CJDI, as composite indices combining precipitation and evaporation, have 49 and 140 months with mean values < −1, and 3 and 2 months with mean values < −1.5, respectively. From the figure, it can be seen that the SPI has the largest fluctuation range, while the EDDI has the smallest. The fluctuation ranges of the SPEI and CJDI are between those of the SPI and EDDI, but their fluctuation frequency is significantly higher than that of the SPI. It is evident that severe droughts in Liaoning Province are mainly caused by insufficient precipitation, and excessive evaporation is not the main factor causing severe drought events in Liaoning Province. The the SPEI and CJDI can monitor more drought events than the SPI and EDDI.
Additionally, from the monthly variation trends of each drought index, it can be observed that the changes in the drought indices in Liaoning Province exhibit clear seasonality. The drought indices fluctuate significantly in spring and summer, with the mean drought indices at various stations frequently falling below −1. In contrast, the CJDI in autumn and winter is relatively stable, although in some extreme years, the mean drought indices can also fall below −1.
Figure 3 and Figure 4 show the ability of four drought indices to monitor actual drought events at various meteorological stations in the study area from 2010 to 2020. By comparing the performance of these indices at each station, their accuracy in monitoring actual drought events can be evaluated. As shown in Figure 1 and Figure 3, the western part of Liaoning Province experienced the most actual drought events from 2010 to 2020, with 11 occurrences, while the southern part had the least, with 8 occurrences. Figure 4 indicates that the SPI and EDDI, as standardized indices based on single data, have a significantly lower accuracy in monitoring drought events compared to the actual number of drought events. The average monitoring rates for drought events at each station were only 52.24% and 62.11%, respectively, indicating that the SPI and EDDI have poor sensitivity in identifying drought events. In contrast, the composite indices SPEI and CJDI, which combine precipitation and evaporation, monitored a number of drought events close to the actual occurrences, with monitoring rates of 89.11% and 92.69%, respectively. This shows that the SPEI and CJDI have higher accuracy and sensitivity in drought monitoring and can more comprehensively capture the occurrence of drought events. Among them, the CJDI had the strongest monitoring ability for drought events; therefore, the CJDI will be used as the calculation index in subsequent analyses of the spatiotemporal variation patterns of drought in Liaoning Province.

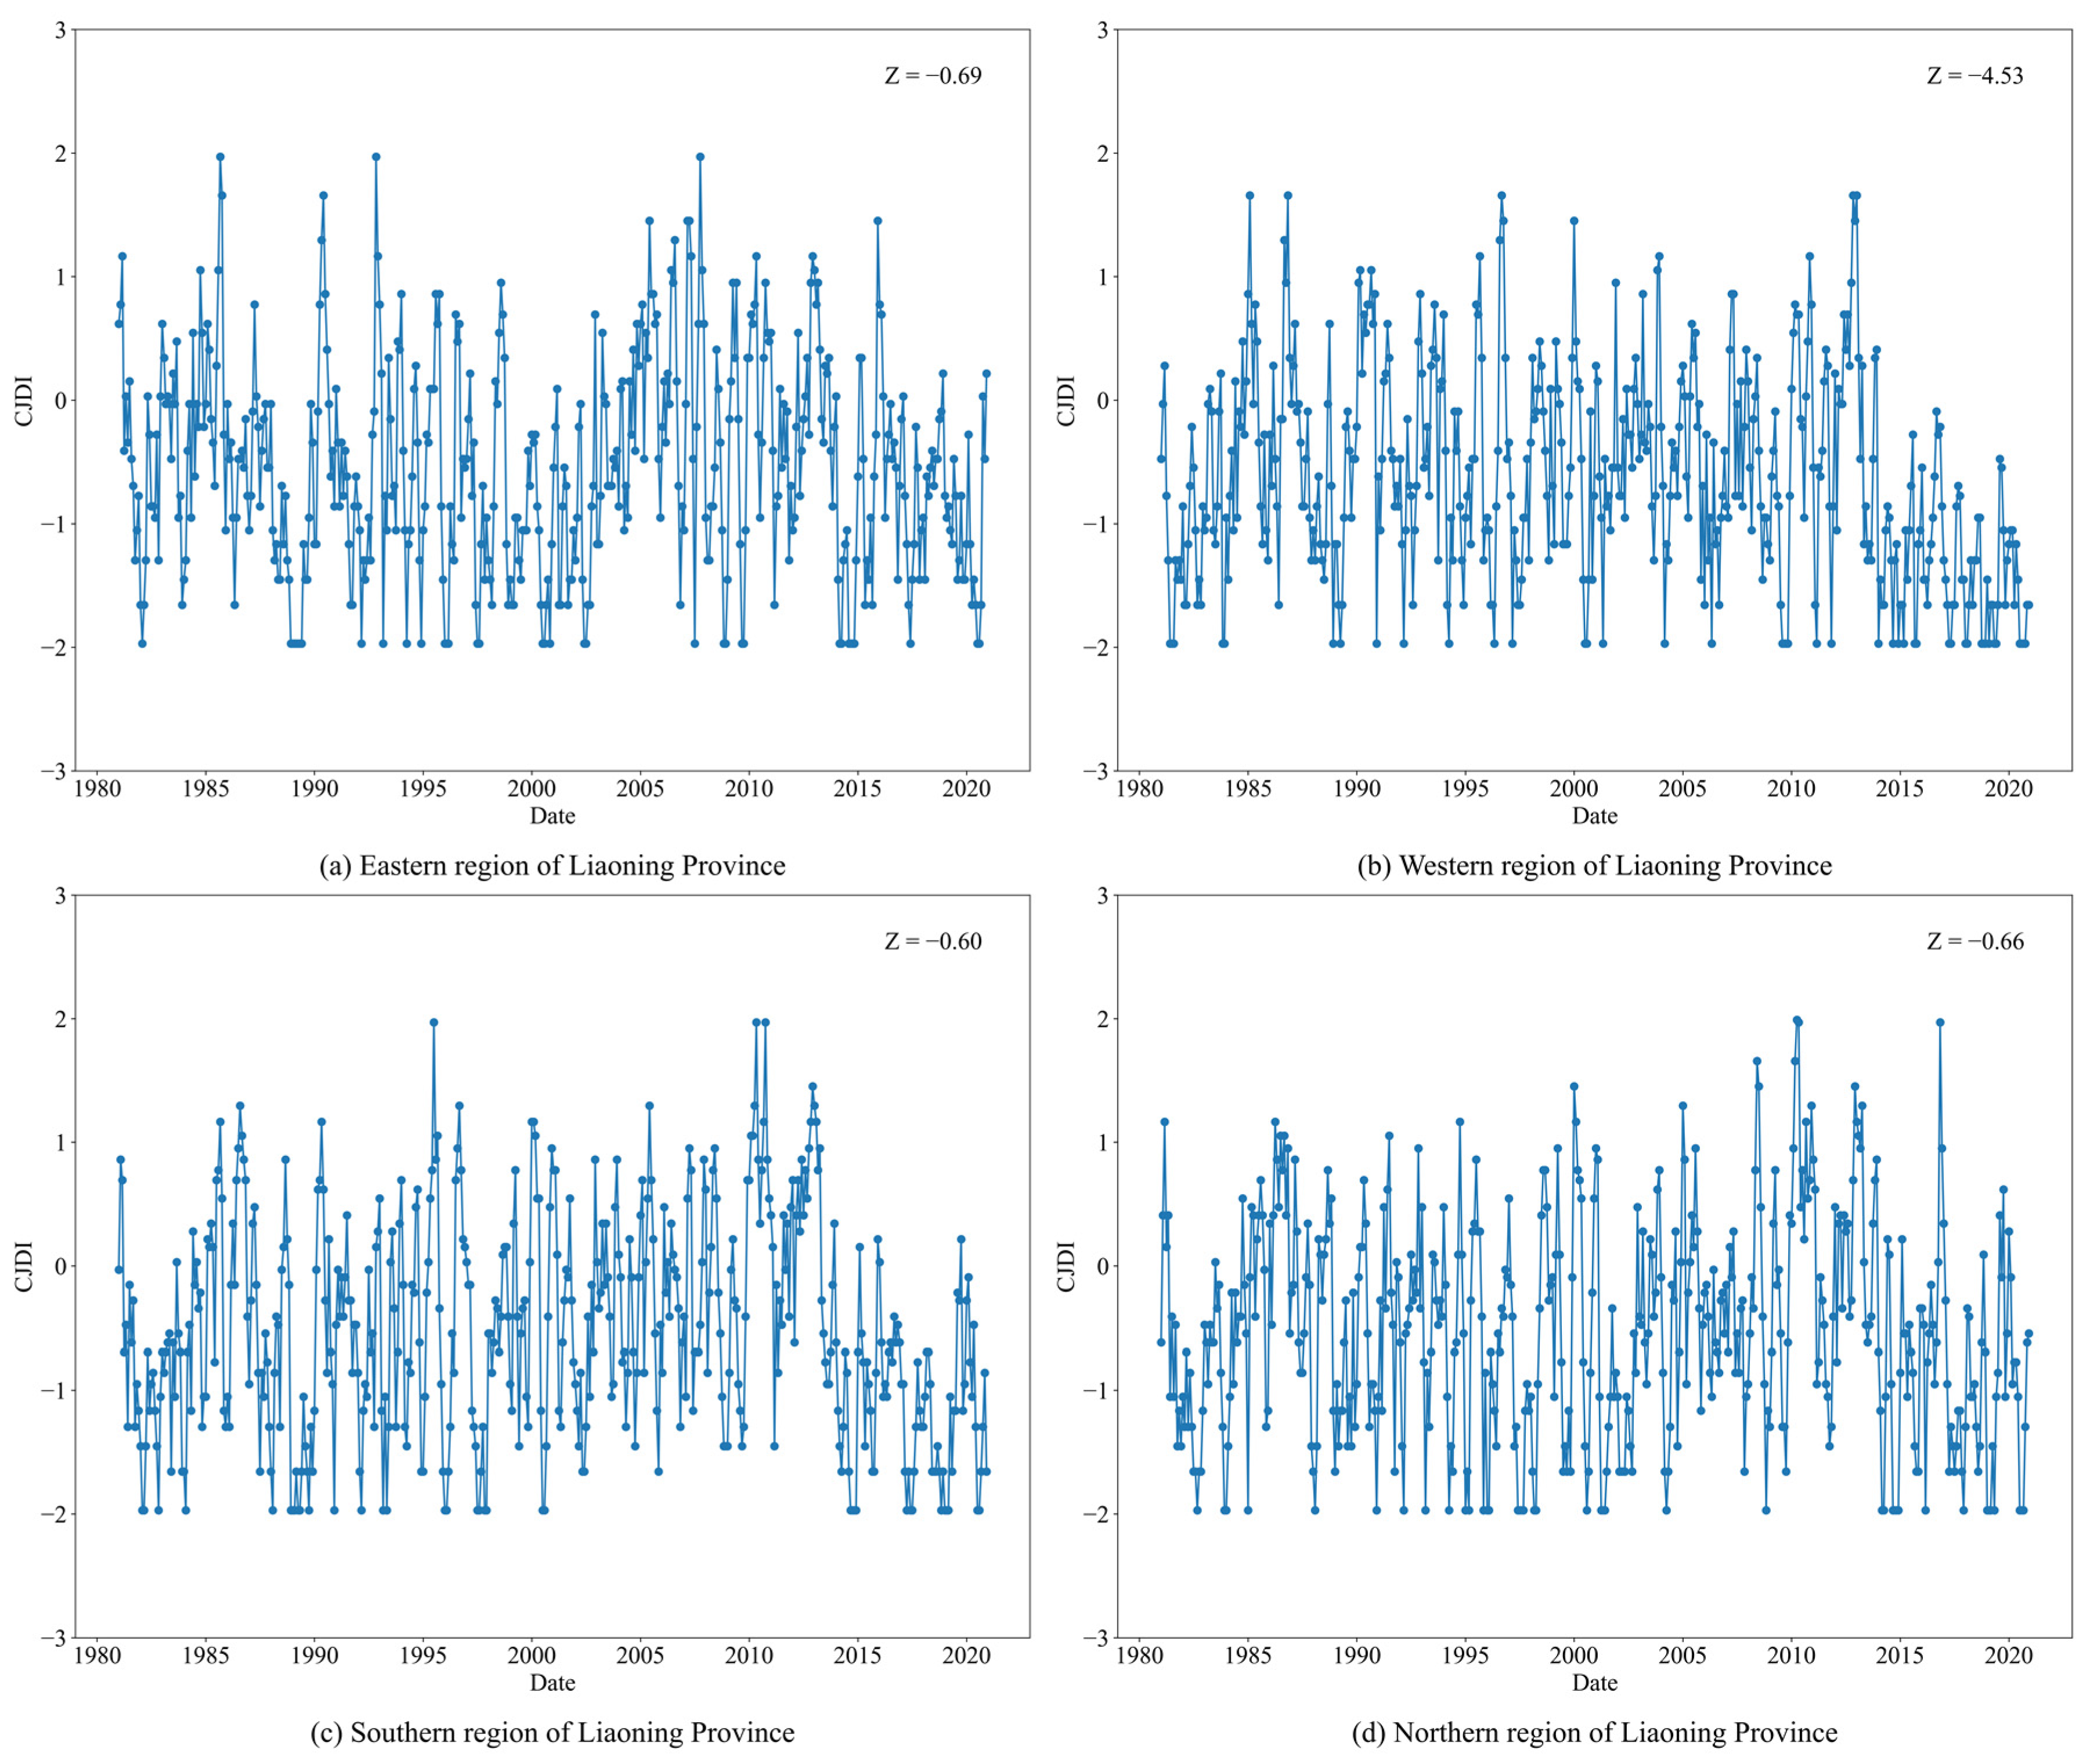
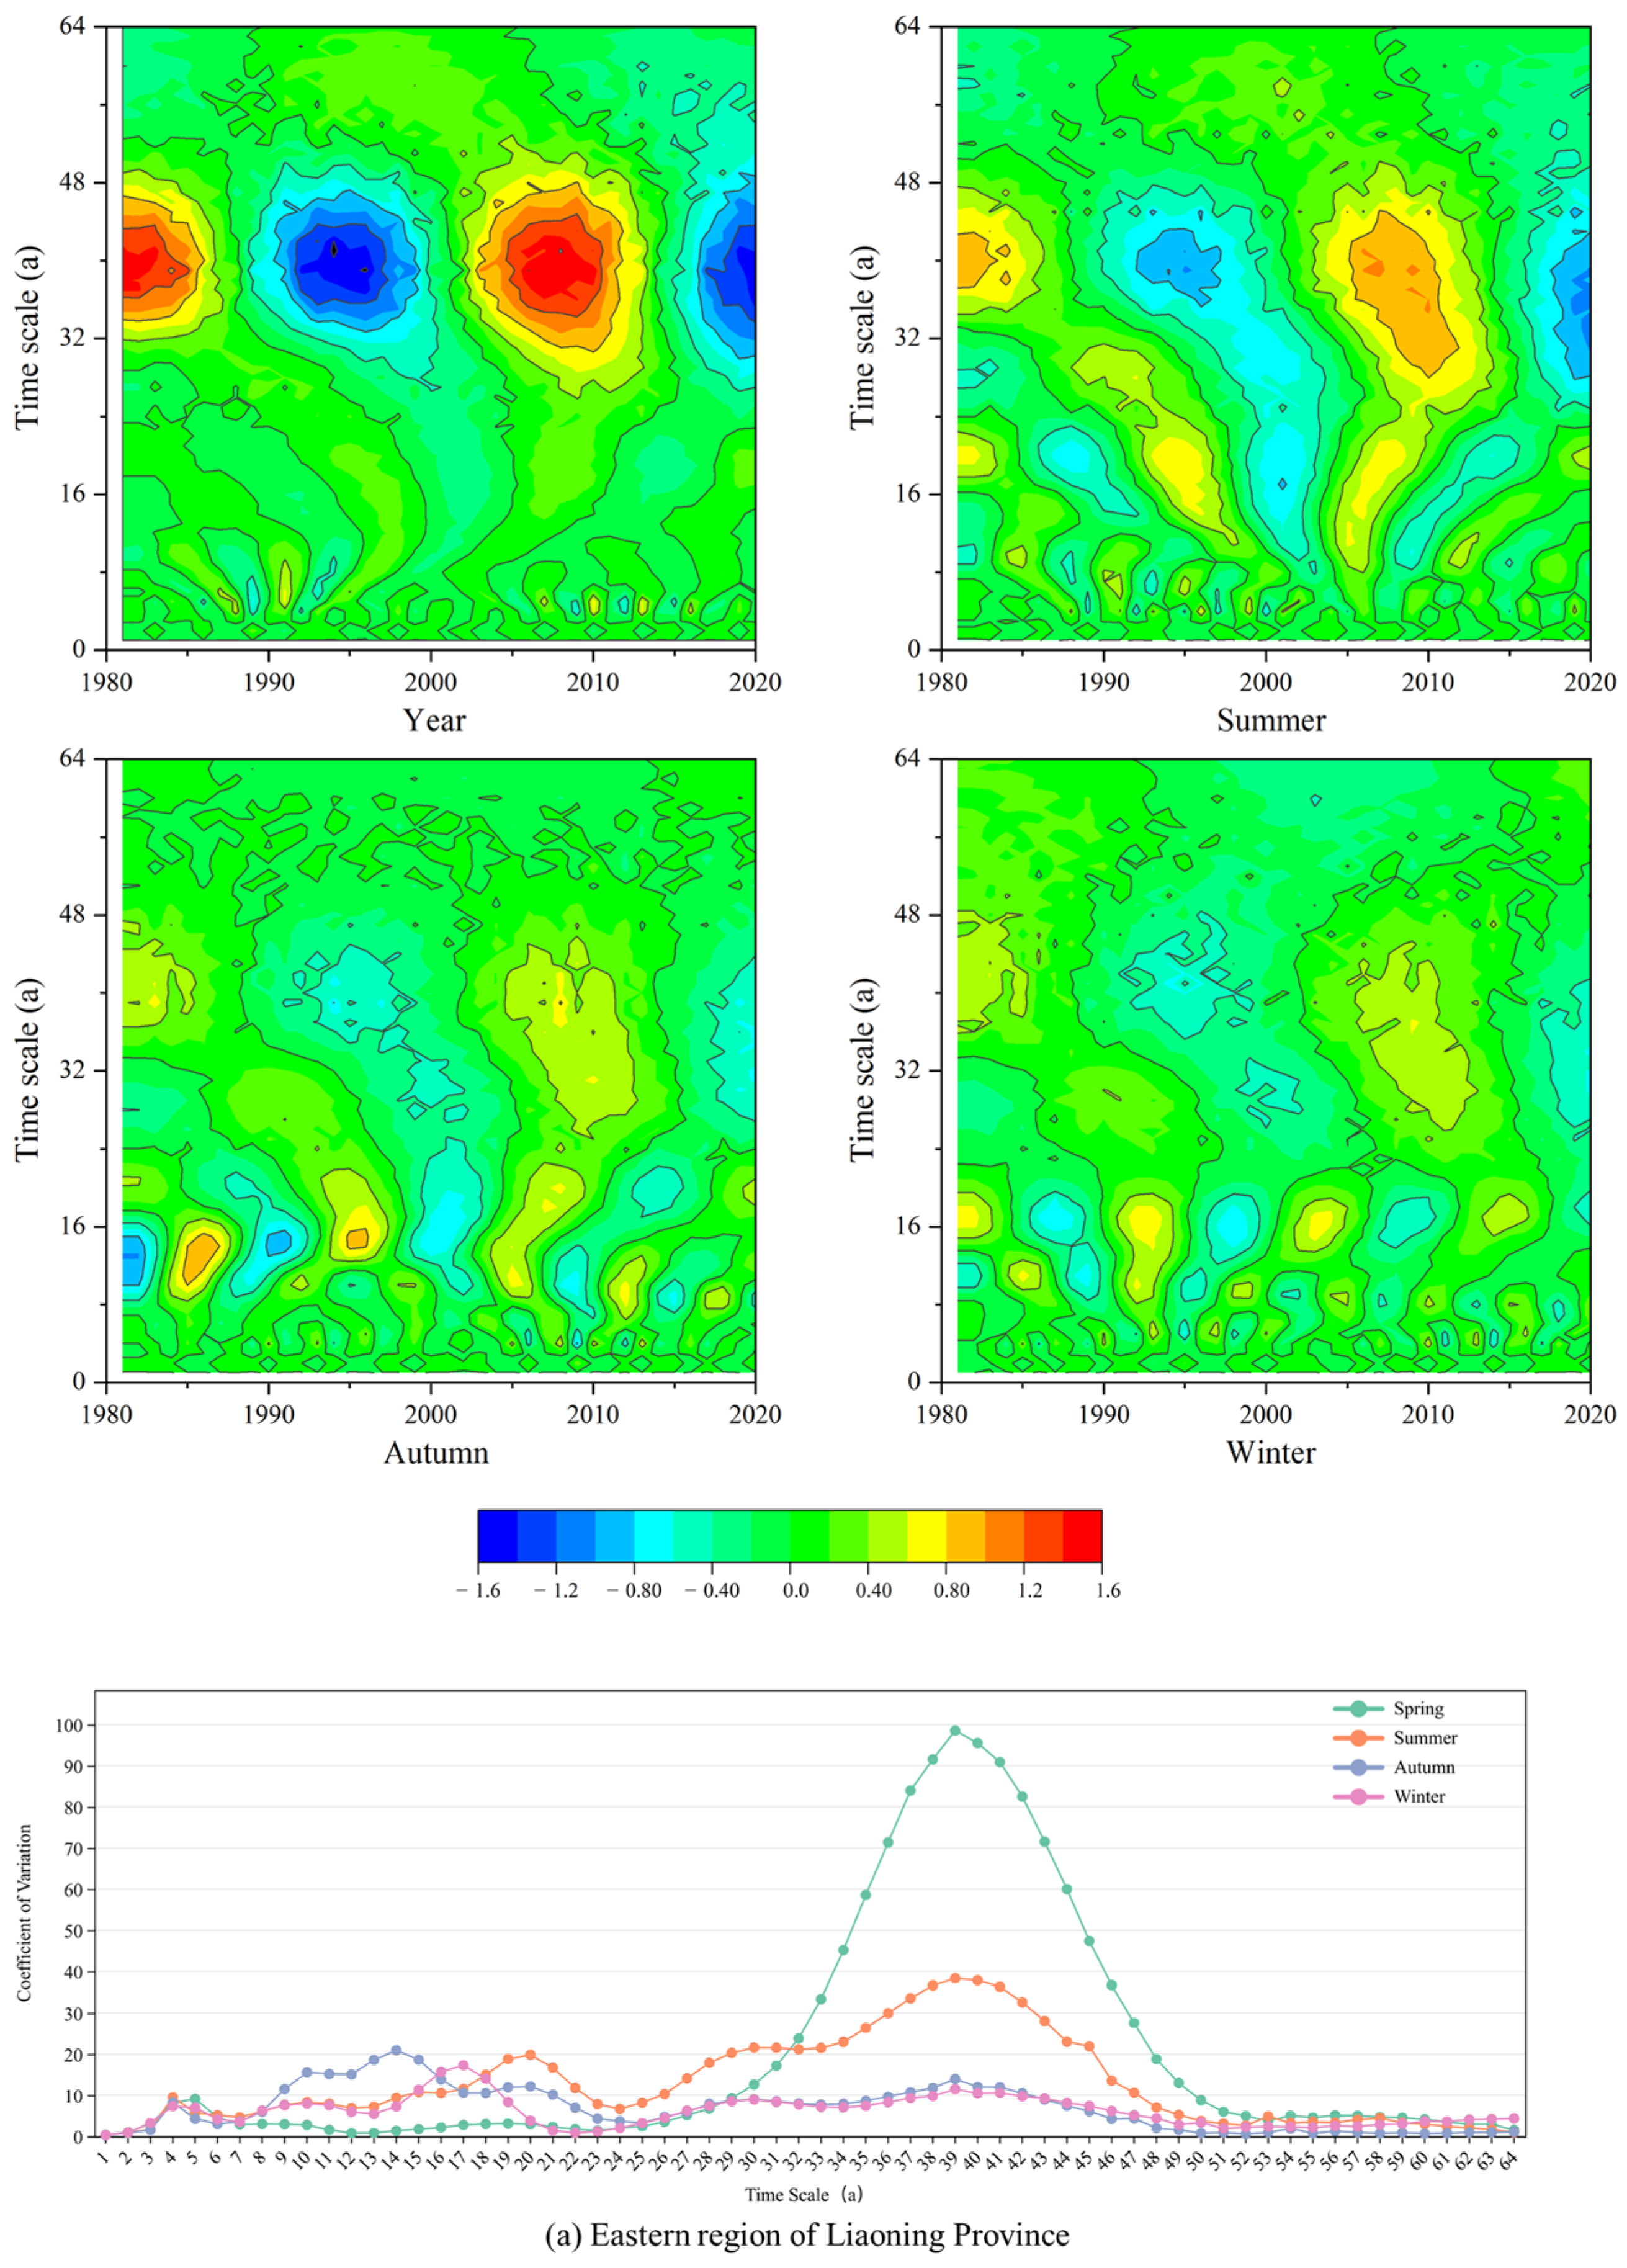
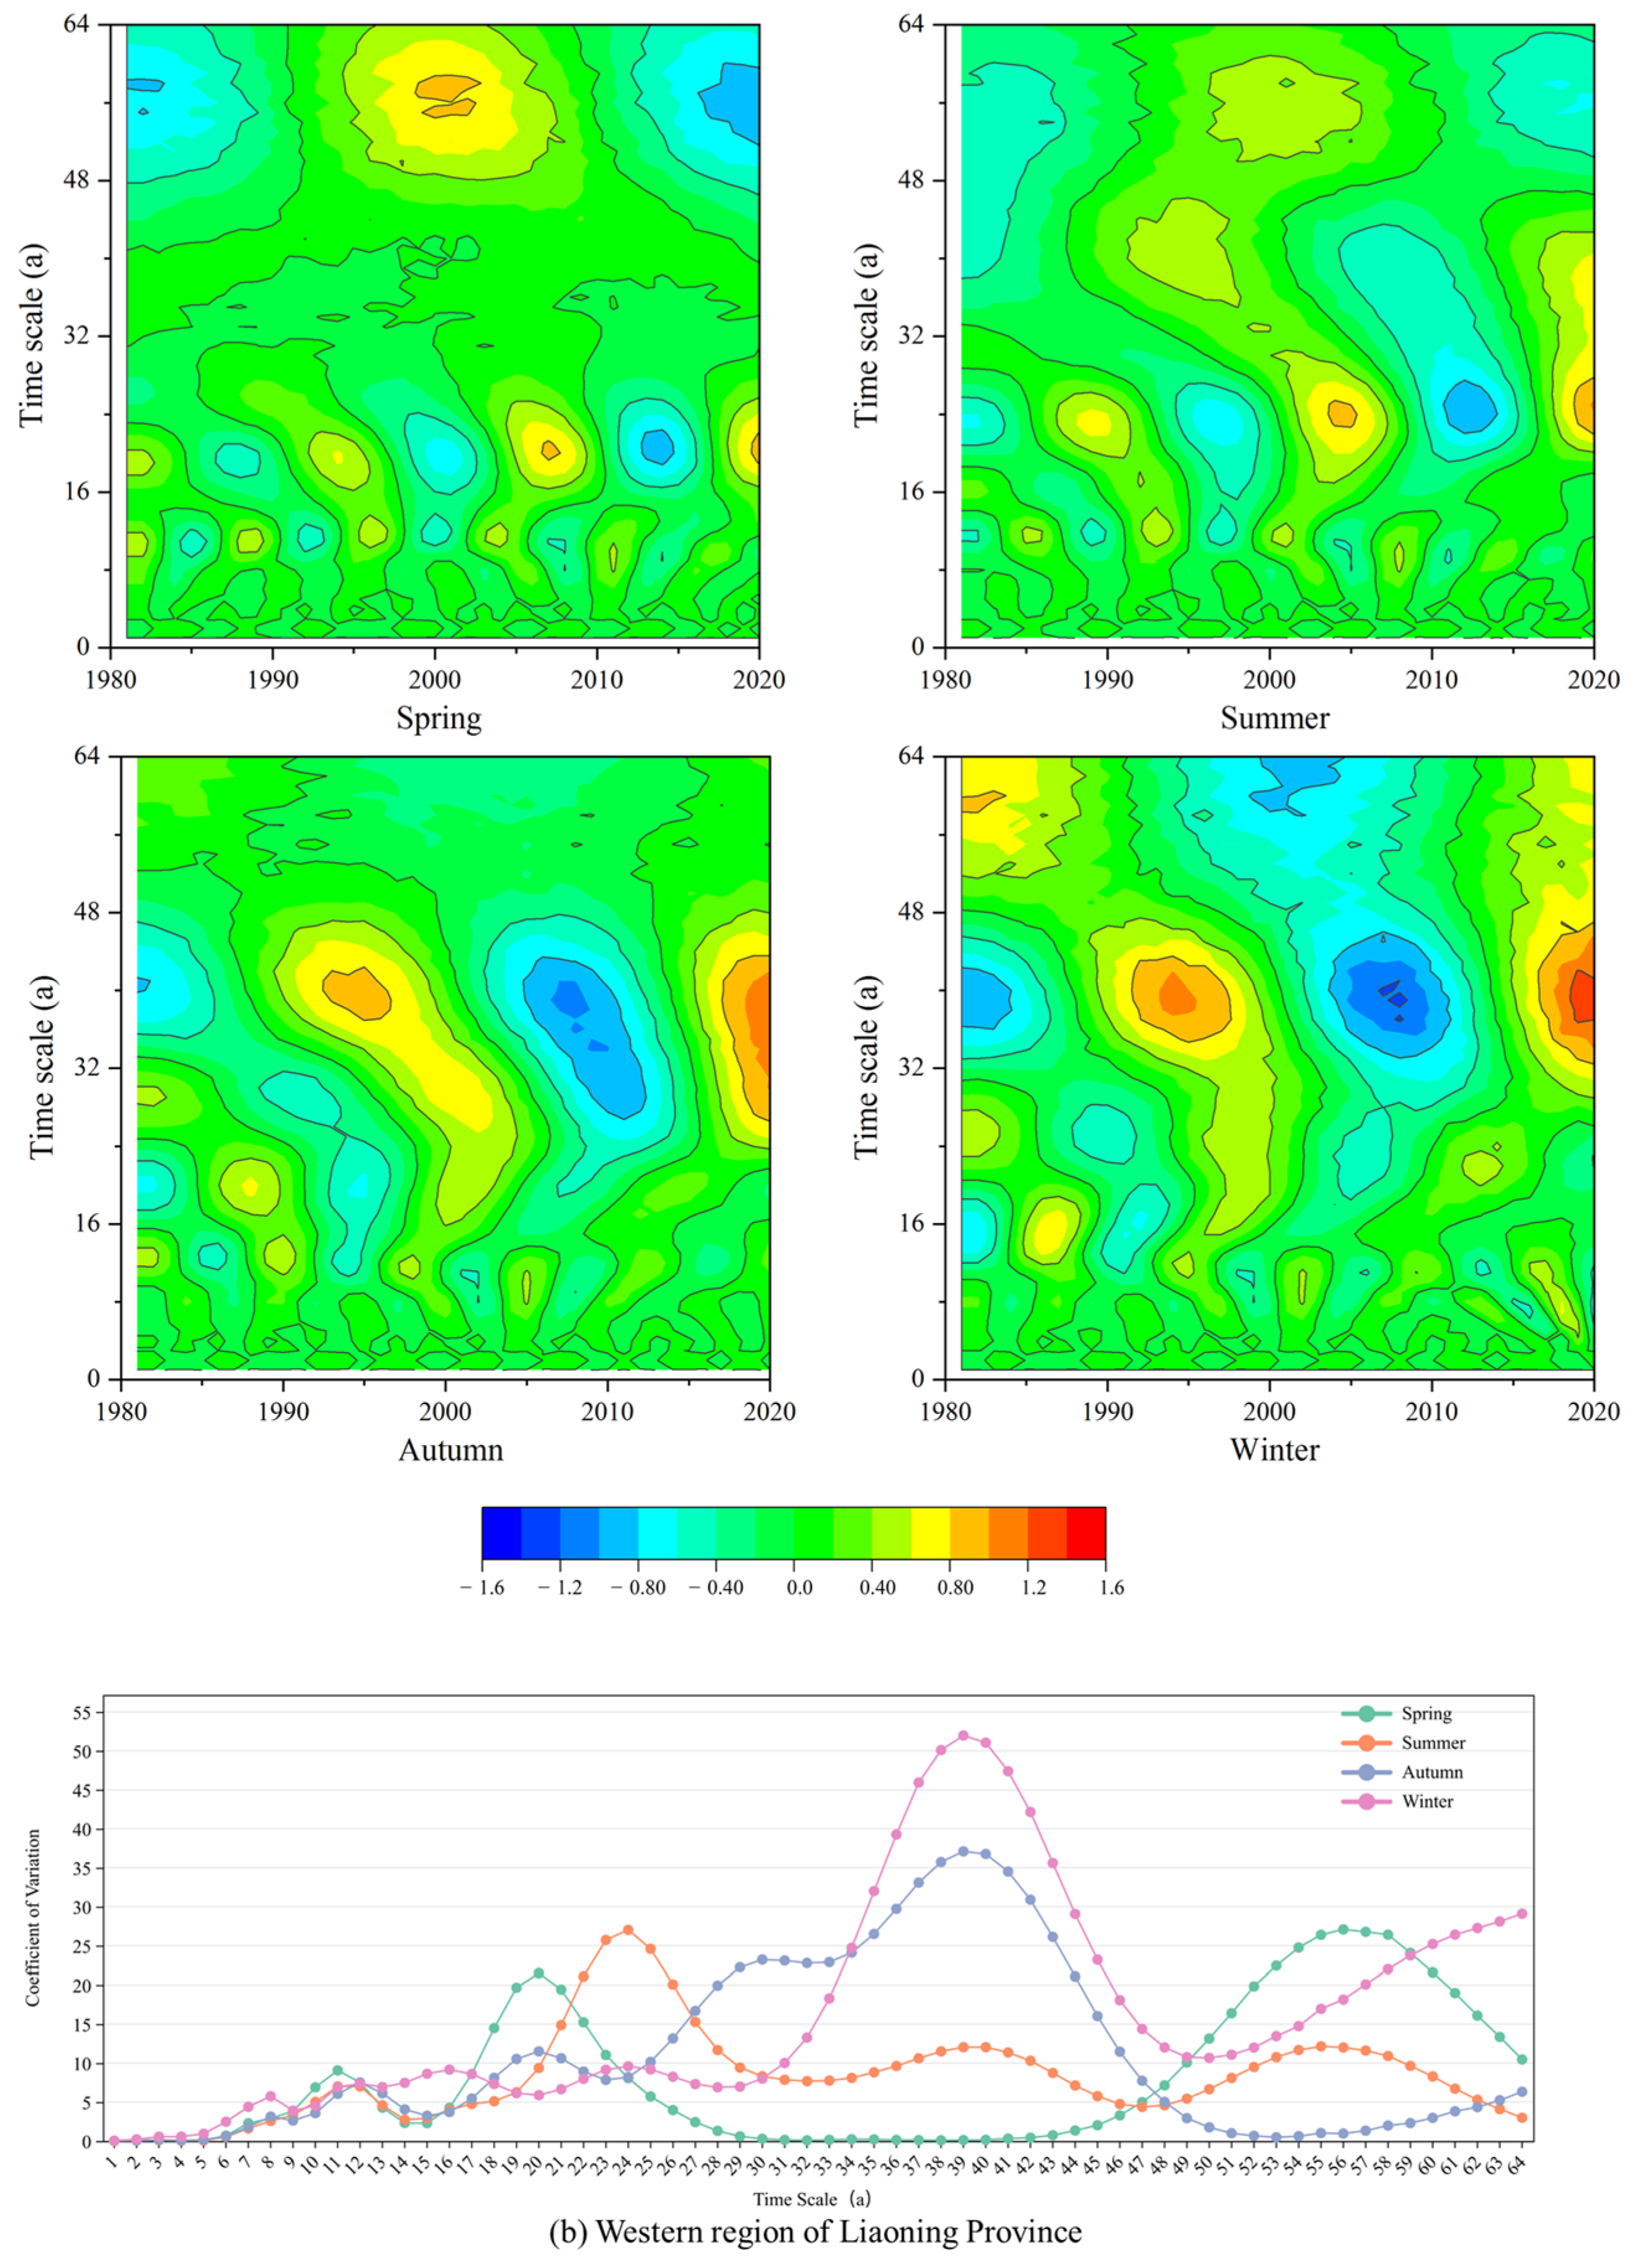
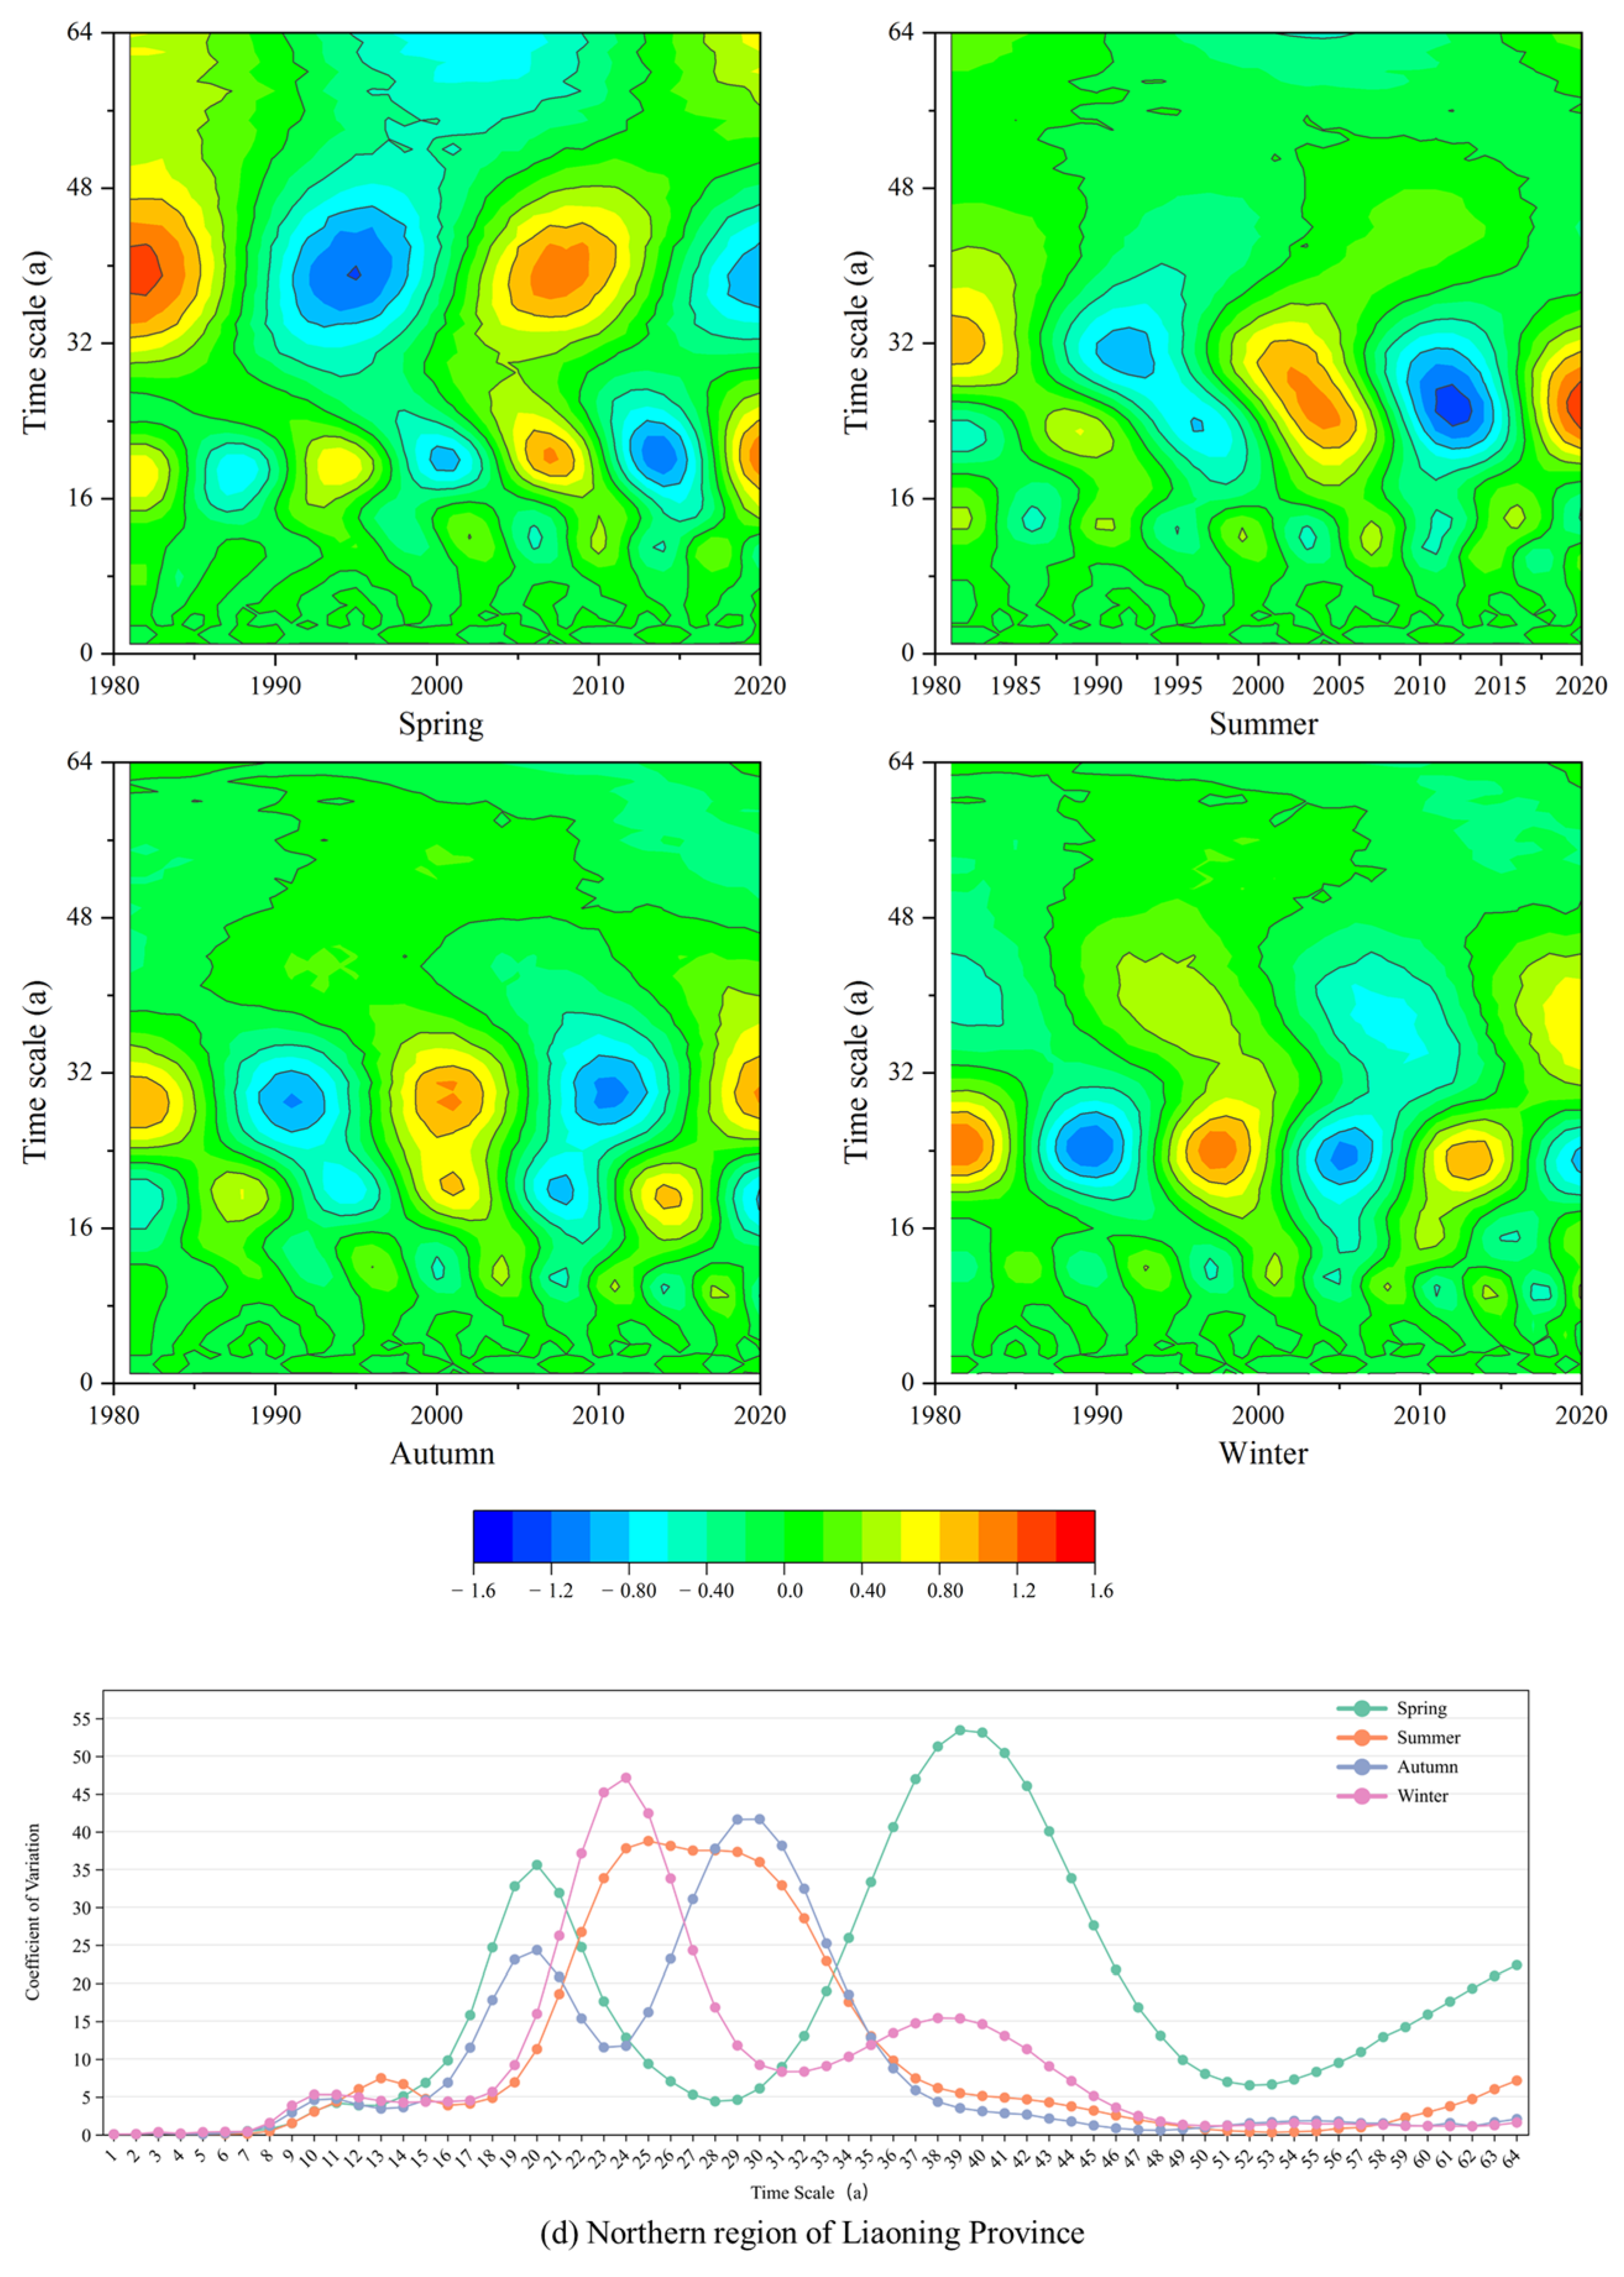
3.2. Spatiotemporal Variation Patterns of Drought in Liaoning Province

The results of the MK trend test for the average CJDI values at each station in the eastern, western, southern, and northern regions of Liaoning Province from 1981 to 2020 are shown in Figure 5. The figure shows that the MK trend test Z-values for all four regions (east, west, south, and north) of Liaoning Province are negative, indicating an increasing trend in drought intensity across these regions. Specifically, the MK test Z-values for the eastern, southern, and northern regions of Liaoning Province are −0.69, −0.60, and −0.66, respectively, suggesting an increasing trend in drought intensity in these three regions, but not significantly. In contrast, the MK test Z-value for the western region is −4.53, indicating a highly significant increasing trend in drought intensity in the western region. Additionally, the average CJDI values in the eastern and western regions of Liaoning Province fluctuate greatly over time, indicating frequent drought events, while the average CJDI values in the southern and northern regions fluctuate more steadily, indicating a lower frequency of drought events.
To further analyze the response of drought intensity to seasonal variations in the eastern, western, southern, and northern regions of Liaoning Province and the periodic changes in the average CJDI values at each station during spring, summer, autumn, and winter, a Morlet wavelet analysis was conducted on the average CJDI values at each station in the four regions. The resulting real part contour maps and variance line charts of the complex wavelets for each region are shown in Figure 6. The figure shows that in the spring contour maps, the blue areas are the most extensive, and the variance values are the highest, indicating the most significant periodic fluctuations in drought across all regions, with main cycles of 5–20 years and longer cycles of 40–57 years. In summer, both the blue areas in the contour maps and the variance values decrease, indicating that the periodic fluctuations in drought are weaker than in spring, with the main drought occurrence period lagging by about 5 years compared to spring. In autumn and winter, most areas in the contour maps for the eastern and southern regions are green, and the variance values show weaker fluctuations, indicating a lower probability of drought occurrence and weaker periodic fluctuations in these two seasons. However, in the western and northern regions of Liaoning Province, strong drought events still occur in autumn and winter, but with longer cycles. The main drought occurrence period in the western region is 35–42 years, and in the northern region, it is 20–25 years.
In summary, from 1981 to 2020, the drought intensity in all regions of Liaoning Province showed an upward trend, with the increase being most significant in the western region. Drought events in Liaoning Province are greatly influenced by the seasons, with the most significant periodic fluctuations occurring in spring. In contrast, severe drought events rarely occur in autumn and winter.

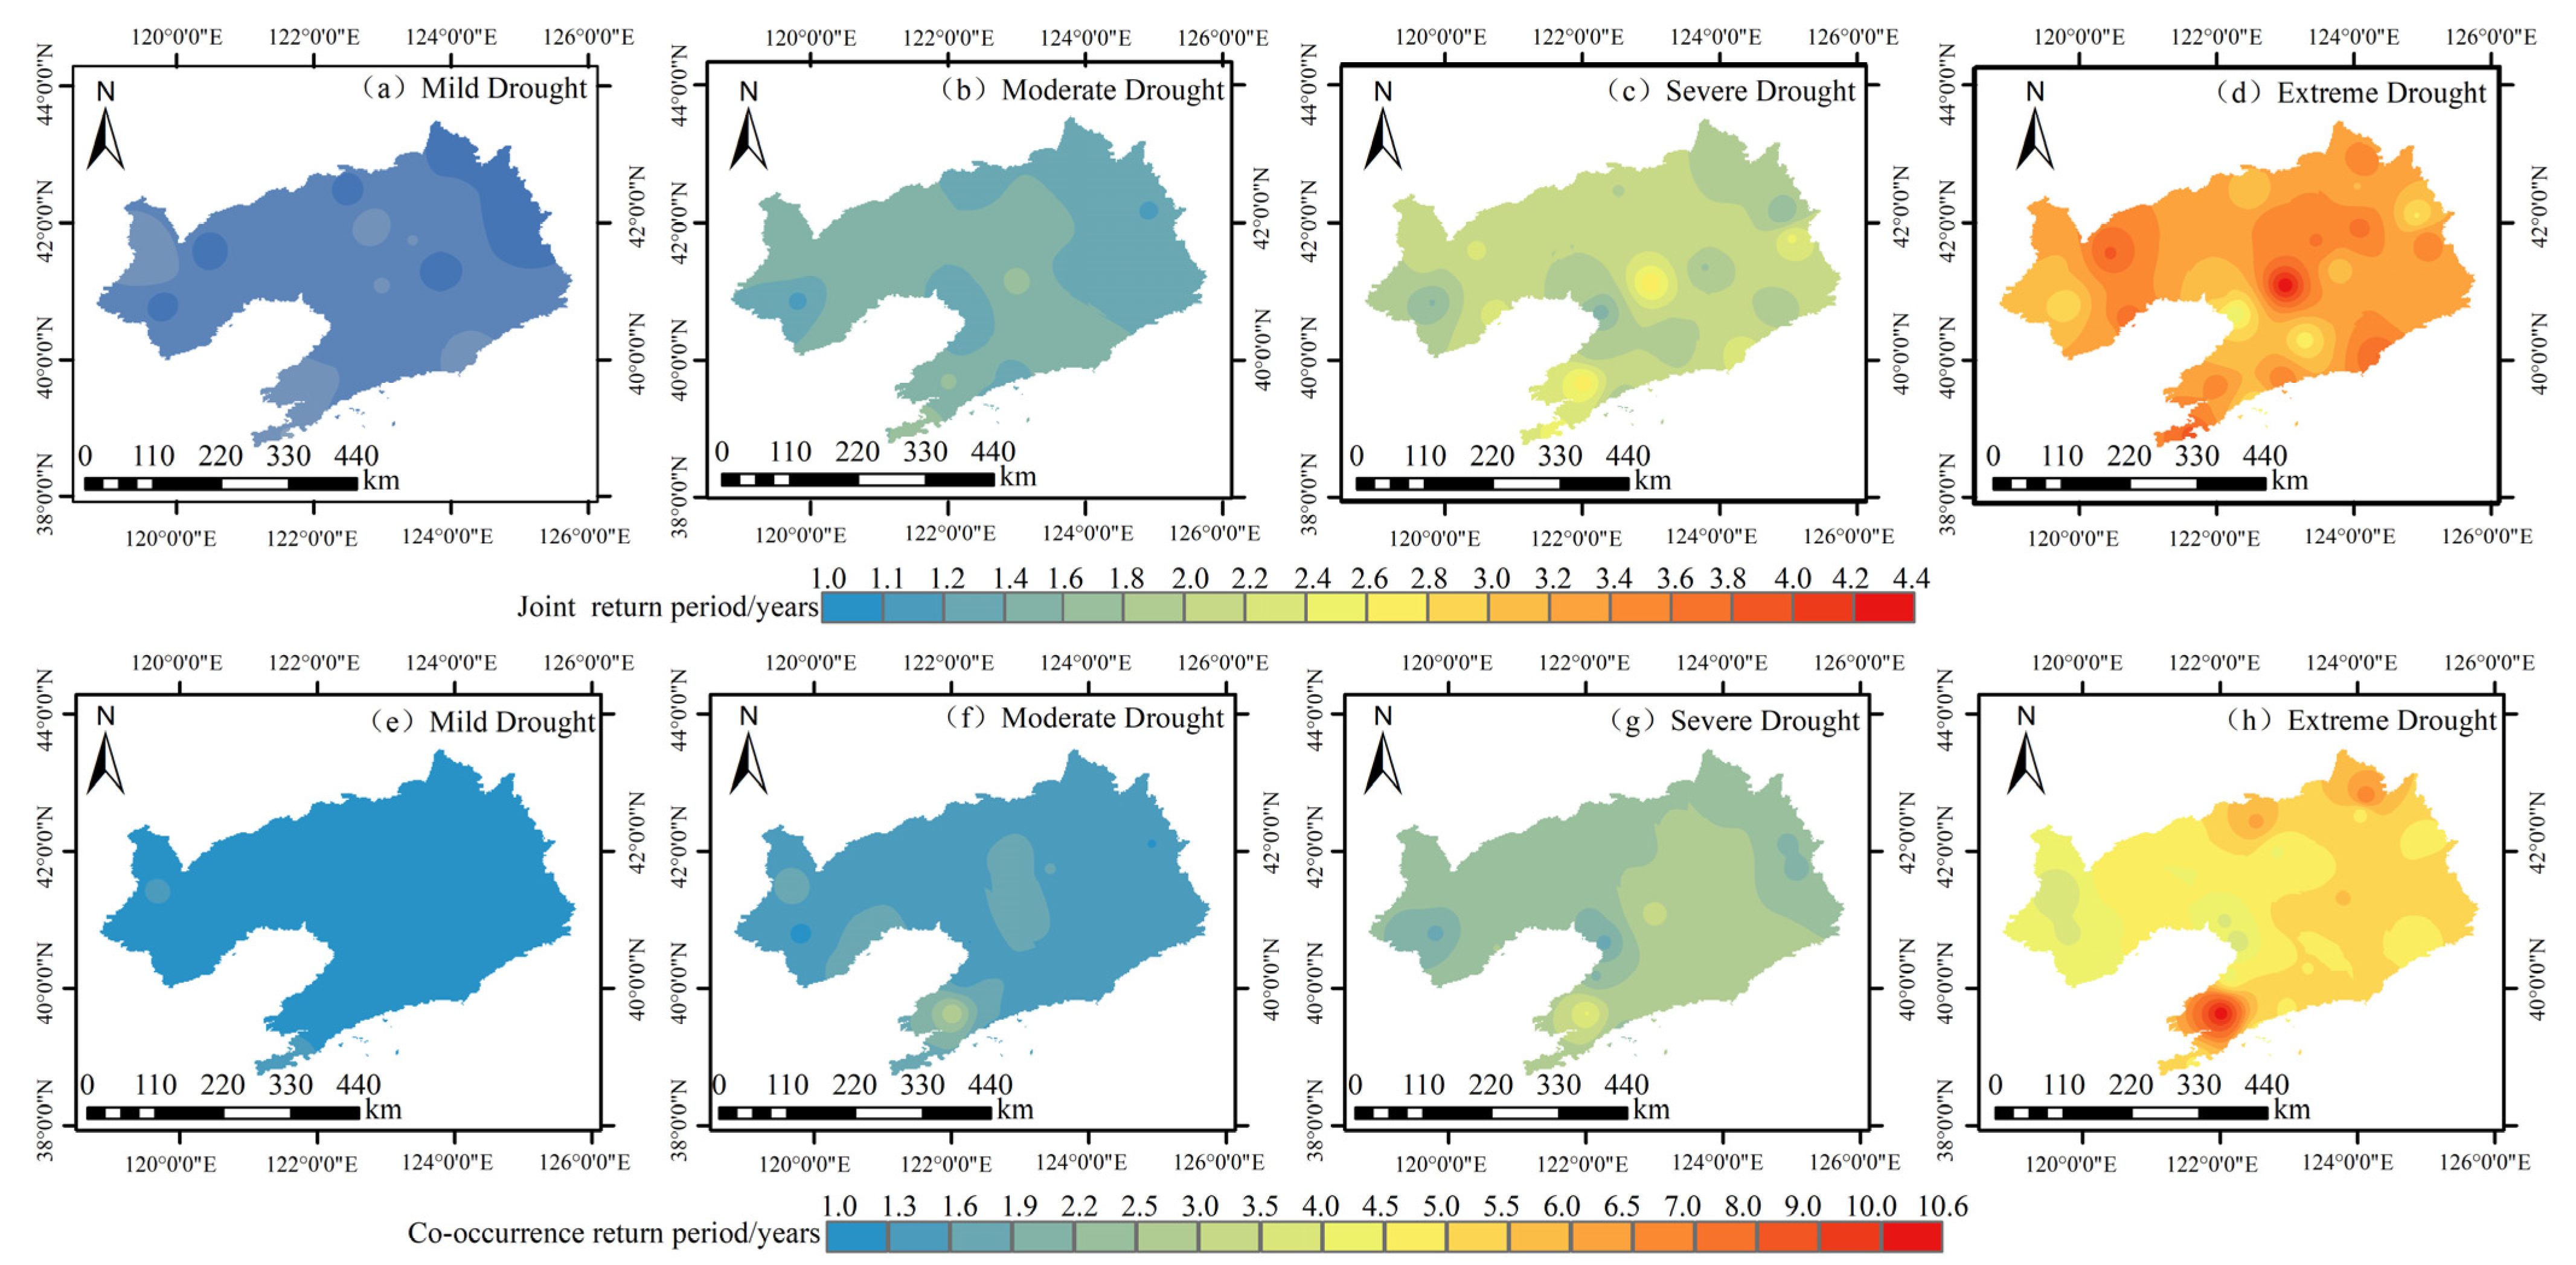
3.3. Analysis of Drought Recurrence Periods

Figure 7 shows the spatial distribution of the drought recurrence periods for different drought levels (mild drought, moderate drought, severe drought, and extreme drought) calculated based on the Combined Joint Drought Index (CJDI). As shown in the figure, the distribution patterns of the co-occurrence recurrence period and the joint recurrence period are generally consistent. Mild droughts occur frequently in Liaoning Province, with joint and co-occurrence recurrence periods ranging from 1.0 to 1.8 years. Moderate droughts show significant spatial differences in recurrence periods within Liaoning Province, with the eastern region having shorter joint recurrence periods between 1.2 and 1.4 years, while the western and southern regions have joint recurrence periods ranging from 1.4 to 2.2 years. The co-occurrence recurrence period for moderate droughts is longest in the southern region, ranging from 3.0 to 4.0 years, while other regions have co-occurrence recurrence periods between 1.6 and 2.5 years. Severe droughts occur less frequently in Liaoning Province, with joint and co-occurrence recurrence periods ranging from 1.6 to 2.8 years and 1.6 to 4.5 years, respectively. In particular, the southern region and the Anshan station have significantly higher severe drought recurrence periods than other stations, with joint recurrence periods of 2.4 to 2.8 years and co-occurrence recurrence periods of 3.5 to 4.5 years. Extreme droughts have the lowest occurrence frequency, with joint recurrence periods over 2.6 years and co-occurrence recurrence periods over 3.5 years.

4. Discussion

In this study, the SPI and EDDI were able to monitor fewer drought events, with the average accuracy of drought event monitoring at each station being only 52.24% and 62.11%, respectively. This is because the traditional SPI and EDDI primarily rely on single precipitation or evaporation indicators, which cannot reflect droughts caused by complex climate variable changes. Won et al. [21] also suggested that compared to the SPI, which only considers precipitation, and the EDDI, which mainly focuses on evaporation, the CJDI integrates both precipitation and evaporation through the Copula function in drought prediction, capturing the nonlinear dependencies between these factors. This more accurately reflects the complexity of drought events; thus, the accuracy of the SPI and EDDI in monitoring drought events is lower than that of the CJDI. However, Hobbins et al. [13] found that the EDDI overestimates the frequency of drought events, whereas in this study, the EDDI’s accuracy in monitoring drought events is slightly higher than the SPI, but the number of drought events monitored from 2010 to 2020 is significantly lower than the actual number of drought events. This is because Liaoning Province is at a higher latitude with lower surface temperatures, and the average annual evaporation is only 914 mm, which is below the average annual evaporation of other provinces in China, making it not a major factor in the occurrence of drought events in the region.
It can be seen at Figure 8 that the slopes of the changes in precipitation and evaporation in Liaoning Province from 1980 to 2020 are −0.76 and 0.24, respectively. This indicates that in recent years, precipitation in Liaoning Province has shown a decreasing trend, while evaporation has shown an increasing trend. Therefore, it is necessary to construct a combined drought index that integrates multiple meteorological variables to monitor drought events. In this study, the accuracy of drought event monitoring using the SPEI is significantly higher than that of the SPI and EDDI, which is similar to previous research results [36,37]. However, Kim et al. [17] pointed out in their study that although the SPEI considers both precipitation and evaporation, its performance in Korea is similar to that of the SPI and does not fully reflect the impact of evaporation on drought events. This is because, in calculating the SPEI, although both precipitation and evaporation are theoretically considered, when the precipitation in a given month increases significantly, even if evaporation also increases, the water balance (precipitation–evaporation) may still be positive, causing the SPEI to fail to indicate drought conditions. In this study, the CJDI has the highest accuracy in monitoring drought events among the four indices, 3.58% higher than the SPEI, which also considers both precipitation and evaporation. This is because, compared to the SPEI, the CJDI uses the Copula function to combine the marginal distributions of the SPI and EDDI to construct a joint distribution model. This method can capture the dependency between precipitation and evaporative demand, enhancing sensitivity to changes in evaporative demand and avoiding potential information loss from simple linear combinations [38]. The results of this study also verify that the CJDI has significant advantages in drought monitoring compared to the SPI, EDDI, and SPEI, making it a more comprehensive and accurate tool for drought assessment.
By studying the spatiotemporal variation patterns of drought in Liaoning Province, it was found that from 1981 to 2020, the drought intensity in all regions of Liaoning Province showed an upward trend, with the western region experiencing the most significant increase in drought intensity, as indicated by the MK trend test Z-value of −4.53. Figure 9a shows that the western region of Liaoning has the highest annual evaporation but significantly lower precipitation compared to the other three regions, with an annual precipitation deficit of 105.17 mm compared to the third-ranked southern region, leading to frequent drought events in the western region. Yue et al. [39] also concluded in their study of drought characteristics in Northeast China from 1970 to 2014 that the western region of Liaoning Province experiences the most severe and frequent droughts, with a risk of intensification. Additionally, the periodic variations in different regions show that the most significant periodic fluctuations in drought events occur in the spring, while severe drought events rarely occur in autumn and winter. Figure 9b indicates that the fluctuations in precipitation and evaporation are greater in spring and summer, leading to more significant fluctuations in the drought index. In particular, in spring, high evaporation and insufficient precipitation result in an annual evaporation-to-precipitation difference of 66.67 mm, which is 84.88, 41.62, and 48.11 mm higher than in summer, autumn, and winter, respectively. This indicates that in Liaoning Province, the mismatch between rainfall and heat in spring, with evaporation significantly exceeding precipitation, leads to frequent drought events. The calculation results of the joint recurrence period and co-occurrence recurrence period in Liaoning Province show that their spatial distribution patterns are generally consistent, with similar frequencies of mild and moderate droughts. This suggests that in future drought prevention strategies, it is important to consider not only the recurrence period of single drought events but also the risk of multiple drought events occurring simultaneously. The findings of this study hold significant implications for regional planning and water resource management in Liaoning Province. Policymakers can leverage insights from drought recurrence pattern predictions to develop more resilient agricultural and water management strategies. Furthermore, understanding the seasonal variations of drought can aid in more effective water resource allocation, ensuring adequate water availability during critical agricultural periods, particularly when drought risks are higher in spring and summer. By incorporating these findings into regional planning, policymakers can alleviate the adverse effects of drought on both agriculture and urban areas, minimize economic losses, and strengthen the disaster resilience of communities in Liaoning Province [22,40].
This study analyzed the spatiotemporal variation patterns of drought in Liaoning Province from 1981 to 2020. The results indicate that both drought intensity and the frequency of drought events have shown an increasing trend in Liaoning Province. Influenced by global climate change, global temperatures are increasing, leading to higher evaporation rates and changes in precipitation patterns, which are expected to further exacerbate the drought trend in Liaoning Province [40], especially in the western region, where the frequency and intensity of drought events may further intensify. Currently, CMIP6 (the Sixth Coupled Model Intercomparison Project) provides various climate models and future climate scenarios. Compared to CMIP5 (the Fifth Coupled Model Intercomparison Project), CMIP6 has improved model physical processes, higher resolution, more comprehensive simulation datasets, and broader scientific coverage, thereby offering more accurate and detailed climate predictions and assessments [41]. In the future, it is necessary to consider using CMIP6 data to calculate the CJDI under various future climate models to predict the future drought trends in Liaoning Province more accurately, and thereby better manage drought risks.
Additionally, with the increase in extreme climate events in recent years, the importance of short-term drought monitoring has become increasingly prominent. Using Copula functions combined with the latest remote sensing products, such as solar-induced chlorophyll fluorescence (SIF) or soil moisture, can significantly improve the accuracy and reliability of short-term drought monitoring [42]. Copula functions have a unique advantage in handling multivariate dependency structures and can effectively capture the nonlinear correlations between meteorological, soil moisture and temperature, and satellite remote sensing data, thereby providing more accurate drought warnings and assessments. Furthermore, the flexibility of Copula functions allows them to adapt to the analytical needs of different temporal and spatial scales, enhancing the applicability and responsiveness of drought monitoring systems [43]. Future research could consider constructing a combined drought index based on Copula functions that comprehensively considers meteorological, soil moisture and temperature, and satellite remote sensing data, aiming to respond quickly to short-term drought events and reduce the adverse impacts of extreme climate events on agriculture, hydrology, and socio-economic sectors.

5. Conclusions

This study is based on the empirical Copula function to construct the Comprehensive Joint Drought Index (CJDI), which takes both precipitation and evaporation into account. The study investigates the spatiotemporal patterns of drought in Liaoning Province, China, and the following conclusions were drawn:
(1) The CJDI, developed using the empirical Copula function, provides a more comprehensive representation of both precipitation and evaporation demands. Its drought monitoring capability significantly surpasses that of the single-indicator SPI and EDDI, as well as the linear combination of precipitation and evaporation in the SPEI. The accuracy of drought event monitoring is improved by 40.45%, 30.58%, and 3.58%, respectively.
(2) Monitoring via the CJDI reveals that from 1981 to 2020, the drought intensity in all regions of Liaoning Province (east, west, south, and north) exhibited an upward trend, with the western region showing the most pronounced increase, indicated by an MK test Z-value of −4.53. Additionally, drought events in Liaoning Province display clear seasonality, with the most significant periodic fluctuations occurring in spring, while the frequency of drought events in autumn and winter is lower and less variable.
(3) The spatial distribution patterns of the co-occurrence recurrence period and the joint recurrence period are generally consistent. As drought intensity increases, the joint and co-occurrence recurrence periods lengthen, while the frequencies of mild and moderate drought events are nearly identical. Future drought prevention strategies should prioritize addressing the frequently occurring mild and moderate droughts. It is important to consider not only the recurrence period of single drought events but also the risk of multiple drought events occurring simultaneously.

Author Contributions

Conceptualization, J.W. and X.Z.; methodology, J.W.; formal analysis, J.W. and Y.L.; resources, H.C.; data curation, J.W.; writing—original draft preparation, Y.L.; writing—review and editing, J.W.; visualization, J.W. and Y.L.; project administration, X.Z. and H.C.; funding acquisition, X.Z. and H.C. All authors have read and agreed to the published version of the manuscript.

Funding

National Natural Science Foundation of China (Grant No. 51879223 and Grant No. 51309192).

Institutional Review Board Statement

Not applicable.

Informed Consent Statement

Not applicable.

Data Availability Statement

The dataset used in this study belongs to “Data derived from public domain resources.” These data were derived from the following resources available in the public domain: [http://data.cma.cn/].

Acknowledgments

Special thanks to the Atmosphere reviewers and the editor for their extensive work on editing the language of the manuscript and providing useful suggestions for improving the quality of the manuscript.

Conflicts of Interest

The authors declare that they have no known competing financial interests or personal relationships that could have appeared to influence the work reported in this paper.

References

  1. Ma, L.; Huang, Q.; Huang, S.; Liu, D.; Leng, G.; Wang, L.; Li, P. Propagation dynamics and causes of hydrological drought in response to meteorological drought at seasonal timescales. Hydrol. Res. 2022, 53, 193–205. [Google Scholar] [CrossRef]
  2. Ahopelto, L.; Kallio, M.; Heino, M.; Kinnunen, P.; Fallon, A.; Kummu, M. Quantifying the co-occurrence of hydrological, meteorological, and agricultural droughts on a global scale. In Proceedings of the EGU General Assembly 2020, Online, 4–8 May 2020. [Google Scholar] [CrossRef]
  3. Wu, Y.; Bake, B.; Zhang, J.; Rasulov, H. Spatio-temporal patterns of drought in North Xinjiang, China, 1961–2012 based on meteorological drought index. J. Arid Land 2015, 7, 527–543. [Google Scholar] [CrossRef]
  4. Wang, Y.; Lv, J.; Wang, Y.; Sun, H.; Hannaford, J.; Su, Z.; Barker, L.; Qu, Y. Drought risk assessment of spring maize based on APSIM crop model in Liaoning province, China. Int. J. Disaster Risk Reduct. 2020, 45, 101483. [Google Scholar] [CrossRef]
  5. Wang, X.; Li, X.; Gu, J.; Shi, W.; Zhao, H.; Sun, C.; You, S. Drought and Waterlogging Status and Dominant Meteorological Factors Affecting Maize (Zea mays L.) in Different Growth and Development Stages in Northeast China. Agronomy 2023, 13, 374. [Google Scholar] [CrossRef]
  6. Yu, W.; Ji, R.; Wu, J.; Feng, R.; Mi, N.; Chen, N. Combined Effects of Heat and Drought Stress on the Growth Process and Yield of Maize (Zea mays L.) in Liaoning Province, China. Atmosphere 2023, 14, 1397. [Google Scholar] [CrossRef]
  7. Yao, N.; Li, Y.; Lei, T.; Peng, L. Drought evolution, severity and trends in mainland China over 1961–2013. Sci. Total Environ. 2018, 616, 73–89. [Google Scholar] [CrossRef]
  8. Li, B.; Liang, Z.; Zhang, J.; Wang, G. A revised drought index based on precipitation and pan evaporation. Int. J. Climatol. 2017, 37, 793–801. [Google Scholar] [CrossRef]
  9. Polong, F.; Chen, H.; Sun, S.; Ongoma, V. Temporal and spatial evolution of the standard precipitation evapotranspiration index (SPEI) in the Tana River Basin, Kenya. Theor. Appl. Climatol. 2019, 138, 777–792. [Google Scholar] [CrossRef]
  10. Raziei, T. Revisiting the Rainfall Anomaly Index to serve as a Simplified Standardized Precipitation Index. J. Hydrol. 2021, 602, 126761. [Google Scholar] [CrossRef]
  11. Guenang, G.; Kamga, F. Computation of the Standardized Precipitation Index (SPI) and Its Use to Assess Drought Occurrences in Cameroon over Recent Decades. J. Appl. Meteorol. Climatol. 2014, 53, 2310–2324. [Google Scholar] [CrossRef]
  12. McKee, T.B.; Doesken, N.J.; Kleist, J. The relationship of drought frequency and duration to time scales. In Proceedings of the 8th Conference on Applied Climatology, Anaheim, CA, USA, 17–22 January 1993; Volume 17, pp. 179–183. [Google Scholar]
  13. Hobbins, M.; Wood, A.; McEvoy, D.; Huntington, J.; Morton, C.; Anderson, M.; Hain, C. The Evaporative Demand Drought Index. Part I: Linking Drought Evolution to Variations in Evaporative Demand. J. Hydrometeorol. 2016, 17, 1745–1761. [Google Scholar] [CrossRef]
  14. Zhang, L.; Yao, Y.; Bei, X.; Jia, K.; Zhang, X.; Xie, X.; Jiang, B.; Shang, K.; Xu, J.; Chen, X. Assessing the Remotely Sensed Evaporative Drought Index for Drought Monitoring over Northeast China. Remote Sens. 2019, 11, 1960. [Google Scholar] [CrossRef]
  15. Noguera, I.; Domínguez-Castro, F.; Vicente-Serrano, S. Flash Drought Response to Precipitation and Atmospheric Evaporative Demand in Spain. Atmosphere 2021, 12, 165. [Google Scholar] [CrossRef]
  16. Zarei, A.; Mahmoudi, M. Assessment of the effect of PET calculation method on the Standardized Precipitation Evapotranspiration Index (SPEI). Arab. J. Geosci. 2020, 13, 182. [Google Scholar] [CrossRef]
  17. Kim, B.; Sung, J.; Lee, B.; Kim, D. Evaluation on the Impact of Extreme Droughts in South Korea using the SPEI and RCP8.5 Climate Change Scenario. J. Korean Soc. Hazard Mitig. 2013, 13, 97–109. [Google Scholar] [CrossRef]
  18. Ismallianto Isia, T.; Hadibarata, T.; Jusoh, M.N.H.; Bhattacharjya, R.; Shahedan, N.F.; Bouaissi, A.; Fitriyani, N.L.; Syafrudin, M. Drought analysis based on Standardized Precipitation Evapotranspiration Index and Standardized Precipitation Index in Sarawak, Malaysia. Sustainability 2022, 15, 734. [Google Scholar] [CrossRef]
  19. Vicente-Serrano, S.M.; Beguería, S.; López-Moreno, J.I. A multiscalar drought index sensitive to global warming: The standardized precipitation evapotranspiration index. J. Clim. 2010, 23, 1696–1718. [Google Scholar] [CrossRef]
  20. Ayantobo, O.; Li, Y.; Song, S. Multivariate Drought Frequency Analysis using Four-Variate Symmetric and Asymmetric Archimedean Copula Functions. Water Resour. Manag. 2019, 33, 103–127. [Google Scholar] [CrossRef]
  21. Won, J.; Choi, J.; Lee, O.; Kim, S. Copula-based Joint Drought Index using SPI and EDDI and its application to climate change. Sci. Total Environ. 2020, 744, 140701. [Google Scholar] [CrossRef] [PubMed]
  22. Zhu, S.; Huang, W.; Luo, X.; Guo, J.; Yuan, Z. The Spread of Multiple Droughts in Different Seasons and Its Dynamic Changes. Remote Sens. 2023, 15, 3848. [Google Scholar] [CrossRef]
  23. Yang, J.; Chang, J.; Wang, Y.; Li, Y.; Hu, H.; Chen, Y.; Huang, Q.; Yao, J. Comprehensive drought characteristics analysis based on a nonlinear multivariate drought index. J. Hydrol. 2018, 557, 651–667. [Google Scholar] [CrossRef]
  24. Zhang, Y.; Ma, L. Variation Characteristics of Heat Resources in Liaoning Province, China in Recent 60 Years and Their Impact on Meteorological Services. J. Geosci. Environ. Prot. 2022, 10, 158–169. [Google Scholar] [CrossRef]
  25. Allen, R.; Pruitt, W.; Wright, J.; Howell, T.; Ventura, F.; Snyder, R.; Itenfisu, D.; Steduto, P.; Berengena, J.; Yrisarry, J.; et al. A recommendation on standardized surface resistance for hourly calculation of reference ET0 by the FAO56 Penman-Monteith method. Agric. Water Manag. 2006, 81, 1–22. [Google Scholar] [CrossRef]
  26. Zuo, D.; Cai, S.; Xu, Z.; Peng, D.; Kan, G.; Sun, W.; Pang, B.; Yang, H. Assessment of meteorological and agricultural droughts using in-situ observations and remote sensing data. Agric. Water Manag. 2019, 222, 125–138. [Google Scholar] [CrossRef]
  27. Naresh Kumar, M.; Murthy, C.S.; Sesha Sai, M.V.R.; Roy, P.S. On the use of Standardized Precipitation Index (SPI) for drought intensity assessment. Meteorol. Appl. 2009, 16, 381–389. [Google Scholar] [CrossRef]
  28. Wilks, D.S. Statistical Methods in the Atmospheric Sciences, 3rd ed.; Academic Press: Cambridge, MA, USA, 2011. [Google Scholar]
  29. Singh, V.P.; Guo, H.; Yu, F.X. Parameter estimation for 3-parameter log-logistic distribution (LLD3) by POME. Stoch. Hydrol. Hydraul. 1993, 7, 163–177. [Google Scholar] [CrossRef]
  30. Wilks, D. Multivariate ensemble Model Output Statistics using empirical copulas. Q. J. R. Meteorol. Soc. 2015, 141, 945–952. [Google Scholar] [CrossRef]
  31. Li, X.; Babovic, V. A new scheme for multivariate, multisite weather generator with inter-variable, inter-site dependence and inter-annual variability based on empirical copula approach. Clim. Dyn. 2019, 52, 2247–2267. [Google Scholar] [CrossRef]
  32. Yevjevich, V. An Objective Approach to Definitions and Investigations of Continental Hydrologic Droughts; Colorado State University: Fort Collins, CO, USA, 1967; Volume 23. [Google Scholar]
  33. Shen, G.; Zheng, H.; Lei, Z. Applicability analysis of SPEI for drought research in Northeast China. Acta Ecol. Sin. 2017, 37, 3787–3795. [Google Scholar] [CrossRef]
  34. Hamed, K.H.; Rao, A.R. A modified Mann-Kendall trend test for autocorrelated data. J. Hydrol. 1998, 204, 182–196. [Google Scholar] [CrossRef]
  35. Cohen, M.X. A better way to define and describe Morlet wavelets for time-frequency analysis. NeuroImage 2019, 199, 81–86. [Google Scholar] [CrossRef]
  36. Krishna, P.; Krishna, B.; Nafisa, S.; Sravani, T.; Madhuri, J.; Vanditha, C. Prediction of Droughts using SPEI. In Proceedings of the 2023 IEEE 12th International Conference on Communication Systems and Network Technologies (CSNT), Bhopal, India, 8–9 April 2023; pp. 839–845. [Google Scholar] [CrossRef]
  37. Ariyanto, D.; Aziz, A.; Komariah, K.; Sumani, S.; Abara, M. Comparing the accuracy of estimating soil moisture using the Standardized Precipitation Index (SPI) and the Standardized Precipitation Evapotranspiration Index (SPEI). Sains Tanah J. Soil Sci. Agroclimatol. 2020, 17, 23–29. [Google Scholar] [CrossRef]
  38. Serinaldi, F.; Bonaccorso, B.; Cancelliere, A.; Grimaldi, S. Probabilistic characterization of drought properties through copulas. Phys. Chem. Earth 2009, 34, 596–605. [Google Scholar] [CrossRef]
  39. Yue, Y.; Shen, S.; Wang, Q. Trend and Variability in Droughts in Northeast China Based on the Reconnaissance Drought Index. Water 2018, 10, 318. [Google Scholar] [CrossRef]
  40. Chen, T.; Xia, G.; Liu, T.; Chen, W.; Chi, D. Assessment of Drought Impact on Main Cereal Crops Using a Standardized Precipitation Evapotranspiration Index in Liaoning Province, China. Sustainability 2016, 8, 1069. [Google Scholar] [CrossRef]
  41. Liang, J.; Tan, M.; Hawcroft, M.; Catto, J.; Hodges, K.; Haywood, J. Monsoonal precipitation over Peninsular Malaysia in the CMIP6 HighResMIP experiments: The role of model resolution. Clim. Dyn. 2022, 58, 2783–2805. [Google Scholar] [CrossRef]
  42. Ren, H.; Du, L.; Peng, C.; Yang, J.; Gao, W. The Composite Drought Index Incorporated Solar-Induced Chlorophyll Fluorescence Enhances the Monitoring Capability of Short-Term Drought. J. Hydrol. 2024, 637, 131361. [Google Scholar] [CrossRef]
  43. Xu, K.; Yang, D.; Xu, X.; Lei, H. Copula based drought frequency analysis considering the spatio-temporal variability in Southwest China. J. Hydrol. 2015, 527, 630–640. [Google Scholar] [CrossRef]
Figure 1. The geographic location of the selected meteorological stations.
Atmosphere 15 01063 g001
Figure 2. Dynamic changes of various drought indices at all meteorological stations in the study area from 1981 to 2020. Note: in the figure, SPI, SPEI, EDDI, and CJDI represent the Standardized Precipitation Index, Standardized Precipitation Evapotranspiration Index, Evaporative Demand Drought Index, and Comprehensive Joint Drought Index, respectively.
Atmosphere 15 01063 g002
Figure 3. The ability of various drought indicators to monitor drought events. Note: in the figure, SPI, SPEI, EDDI, and CJDI represent the Standardized Precipitation Index, Standardized Precipitation Evapotranspiration Index, Evaporative Demand Drought Index, and Comprehensive Joint Drought Index, respectively.
Atmosphere 15 01063 g003
Figure 4. Percentage of drought events monitored by each drought indicator. Note: different letters on the same row indicate that the data within each box differs significantly at the 5% probability level. The SPI, SPEI, EDDI, and CJDI represent the Standardized Precipitation Index, Standardized Precipitation Evapotranspiration Index, Evaporative Demand Drought Index, and Comprehensive Joint Drought Index, respectively.
Atmosphere 15 01063 g004
Figure 5. The variation in CJDI over time across different regions in Liaoning Province. Note: in the figure, CJDI represents the Comprehensive Joint Drought Index, and the Z value is the standardized statistic of the MK trend test. The larger the absolute value of Z, the more significant the upward or downward trend in the data.
Atmosphere 15 01063 g005
Figure 6. Periodic variation patterns of CJDI in different regions of Liaoning Province.
Atmosphere 15 01063 g006aAtmosphere 15 01063 g006bAtmosphere 15 01063 g006cAtmosphere 15 01063 g006d
Figure 7. The spatial distribution of drought return periods for different drought event levels based on CJDI. Note: CJDI stands for the Comprehensive Joint Drought Index. The joint return period indicates the return period when either drought duration or drought intensity exceeds a given threshold, which helps evaluate the likelihood of a specific drought level reoccurring within a certain period. The co-occurrence return period signifies the return period when both drought duration and drought intensity simultaneously exceed a given threshold, assessing the probability of multiple drought events occurring at the same time.
Atmosphere 15 01063 g007
Figure 8. Precipitation and evaporation changes in Liaoning Province from 1981 to 2020. Note: the straight line in the figure is derived from linear fitting based on the mean annual precipitation and evaporation data from each station. A positive slope suggests an upward trend in the data, while a negative slope indicates a downward trend.
Atmosphere 15 01063 g008
Figure 9. Annual average precipitation and evaporation across regions and seasons in Liaoning Province from 1981 to 2020. Note: different letters on the same row indicate that the data within each box differs significantly at the 5% probability level. In the legend, Eastern, Western, Southern, and Northern represent the four regions of Liaoning Province. The specific provinces included in each region are listed in Table 1.
Atmosphere 15 01063 g009
Table 1. Criteria for dividing Liaoning Province into eastern, western, southern, and northern regions.
RegionsIncluded Meteorological Stations
EasternFushun, Qingyuan, Xinbin, Benxi, Kuandian, Dandong
WesternJianping, Jianchang, Chaoyang, Suizhong, Xingcheng, Zhangwu
SouthernDalian, Changhai, Wafangdian, Xiongyue, Yingkou, Dawa, Anshan, Xiuyan
NorthernChangtu, Kaiyuan, Xinmin, Shenyang
Table 2. Criteria for dividing drought events levels.
Drought Events LevelsCriteria
Light Drought and aboveDrought Duration > 1 Drought Intensity > 1
Moderate Drought and aboveDrought Duration > 3 Drought Intensity > 3
Severe Drought and aboveDrought Duration > 5 Drought Intensity > 5
Extreme Drought and aboveDrought Duration > 5 Drought Intensity > 5
Disclaimer/Publisher’s Note: The statements, opinions and data contained in all publications are solely those of the individual author(s) and contributor(s) and not of MDPI and/or the editor(s). MDPI and/or the editor(s) disclaim responsibility for any injury to people or property resulting from any ideas, methods, instructions or products referred to in the content.

