Article

Influence of Meteorological Parameters on Indoor Radon Concentration Levels in the Aksu School

1
Institute of Radiobiology and Radiation Protection NJSC, Astana Medical University, Astana 010000, Kazakhstan
2
The Center for Peace, Hiroshima University, 1-1-89 Higashisenda-machi, Naka-ku, Hiroshima 730-0053, Japan
3
Department of Medical Genetics and Molecular Biology NJSC, Astana Medical University, Astana 010000, Kazakhstan
4
Institute of Radiation Emergency Medicine, Hirosaki University, 66-1 Hon-cho, Hirosaki, Aomori 036-8564, Japan
5
Department of Radiological Sciences, Ibaraki Prefectural University of Health Sciences, Inashiki District, Ami 300-0394, Japan
*
Author to whom correspondence should be addressed.
Atmosphere 2024, 15(9), 1067; https://doi.org/10.3390/atmos15091067
Submission received: 9 July 2024 / Revised: 21 August 2024 / Accepted: 30 August 2024 / Published: 3 September 2024

Abstract

:
The radon concentration activity in buildings is influenced by various factors, including meteorological elements like temperature, pressure, and precipitation, which are recognized as significant influencers. The fluctuations of indoor radon in premises are related to seasonal change. This study aimed to understand better the effects of environmental parameters on indoor radon concentration levels in the Aksu school. Indoor and outdoor temperature differentials heavily influence diurnal indoor radon patterns. The analysis indicates that the correlation between indoor radon and outdoor temperature, dew point, and air humidity is weak and negligible for atmospheric pressure, wind speed, and precipitation, as determined by the obtained values of R2 and the Chaddock scale. The multiple regression model is characterized by the correlation coefficient rxy = 0.605, which corresponds to a close relationship on the Chaddock scale.

1. Introduction

Radon release from the earth has been extensively researched for many years from various perspectives. Radon is a naturally occurring radioactive noble gas with varying occurrences in geological settings due to the decay of uranium present in different types of rocks and soils. As the properties of soil are affected by fluctuations in weather conditions, changes in soil-gas radon concentration are frequently observed over time [1]. The radon concentrations in soil and indoor air vary both in the short term (daily to weekly) and in the long term (seasonal) [2]. Different buildings and soil types may lead to varying radon levels and fluctuations [3].
It is generally accepted that elevated radon levels in buildings can substantially increase the risk of lung cancer. Given that indoor radon is the second leading cause of lung cancer after smoking, significant resources have been dedicated to overseeing, mapping, simulating, and forecasting these levels, as well as rectifying them where feasible and justified. Reports highlight the importance of conducting thorough and methodical assessments of indoor radon concentrations to determine the levels of radon exposure [4,5].
The radon concentration activity in buildings is influenced by various factors, including meteorological elements like temperature, pressure, and precipitation, which are recognized as significant influencers [6]. Based on several investigations, the radon concentration and its decay products in premises have shown significant variations in temperature, pressure, humidity, building material, ventilation conditions, wind speed, and other factors that can lead to large temporal and local fluctuations [7,8,9]. The levels of indoor radon can vary due to seasonal changes, as climate variations can result in different impacts on indoor and outdoor air [10,11]. During the winter, buildings tend to keep their windows and doors closed for longer periods due to rain, snow, or ice. This results in lower ventilation rates in rooms, causing indoor radon levels to rise and potentially reach harmful levels. In contrast, during the summer, people tend to open doors and windows, increasing the ventilation in their homes [11,12,13,14,15]. The relationship between ventilation rate and radon concentration is inverse. Increasing ventilation is crucial for decreasing indoor radon levels, as enhancements to ventilation systems typically result in a reduction of radon concentration by less than 50 percent [16,17,18]. During wintertime, indoor radon levels usually increase compared to other seasons, although this is not always true [19,20,21].
Preliminary past study of indoor radon measurements in the Aksu school has shown wide variability, from 14 Bq/m3 to 4703 Bq/m3 (Short-Term Radon Measurements) and up to 9000 Bq/m3 (radon monitoring measurement—monthly) [22,23]. The high levels of radon contamination found in the ground-floor classrooms can be attributed to the fact that a gold-mining site existed in the area where the school now stands back in the 1930s. The remaining ore materials under the building are emitting high levels of radon. The test results indicate that the construction of the school building in Aksu does not meet the necessary radiation safety standards. Investigations of underground areas, such as basements, indicate that rural houses in Aksu are not adequately protected from radon. Radon from the soil is entering through vents and cracks in the floor. Radon concentrations in underground areas in Aksu have been measured to range from 130 Bq/m3 to 5870 Bq/m3, which is only three to seven times higher than the measurements recorded on the ground floor for 60% of the buildings. Only 30% of buildings have well-shielded living spaces, resulting in a 20–50-fold reduction in radon levels compared to those in the underground areas [24].
The previous research indicates that the indoor levels of radon at the Aksu school changed according to weather conditions, and it was clear that proper ventilation played a crucial role in decreasing the concentrations. One study revealed a direct connection between radon levels, outdoor temperature, and relative humidity, demonstrating that meteorological factors affect radon concentrations [25].
This study aimed to better understand the effect of environmental parameters on indoor radon concentration levels in the Aksu school.

2. Materials and Methods
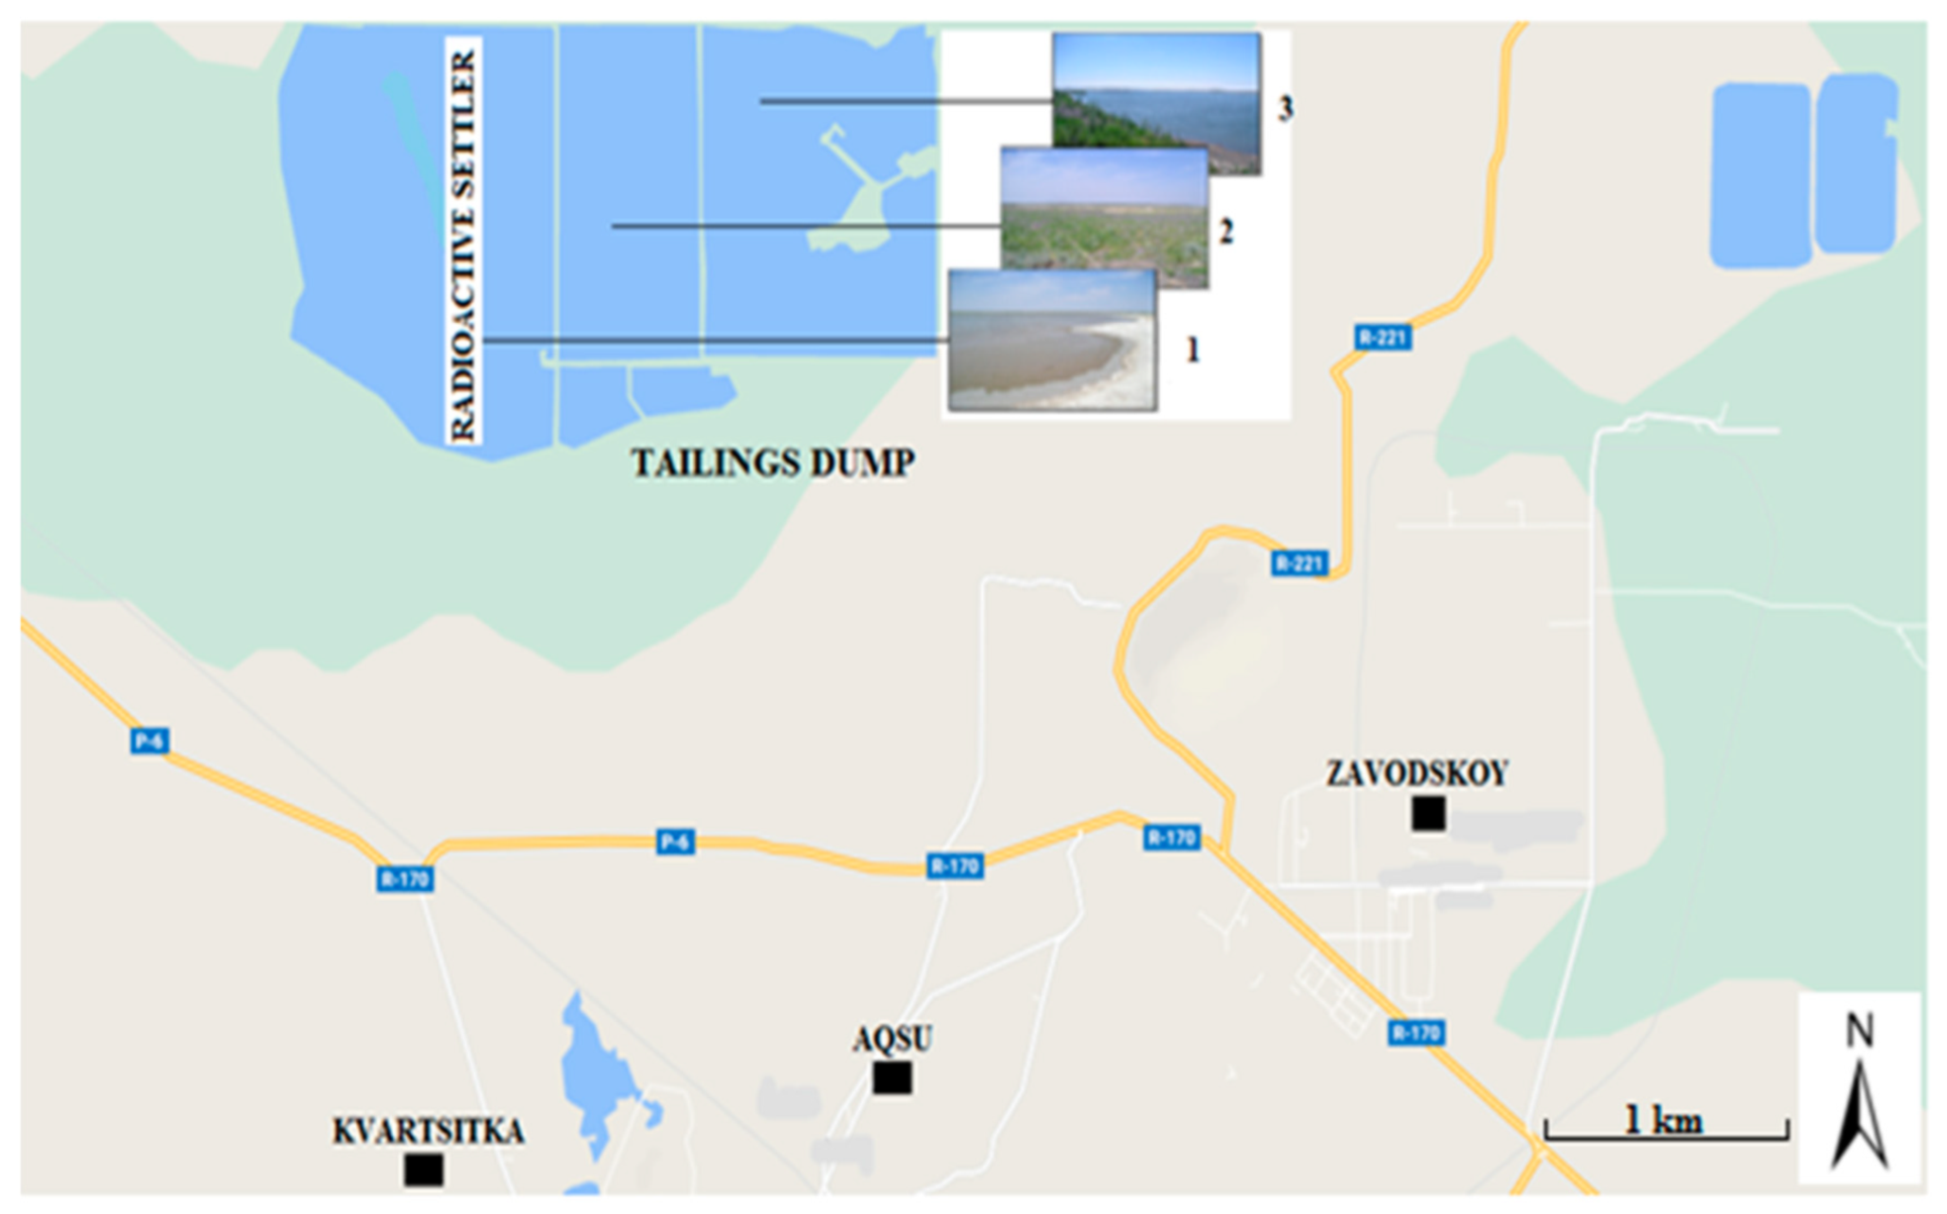
2.1. Study Area

The research area is situated in the Akmola region of Northern Kazakhstan, which includes the town of Aksu. Aksu is situated in an area known for uranium deposits and past gold mining activities (Figure 1). Some buildings and facilities in Aksu were built on land that was previously used for gold mining. Mines and the industrial area are located very close to residential areas. The surrounding environment within 5–10 km of the uranium mining complex is not regularly monitored for external gamma radiation, or outdoor and indoor radon.

2.2. Indoor Radon Measurements

The Radon Scout Professional radiometer, manufactured in Germany, was used to conduct radon monitoring measurements. Standard calibration was performed at a radon concentration of 3000 Bq/m³ after determining the background effect. The radiometer operates in diffusion mode, ensuring that thoron does not affect the measurement results. The measuring chamber, equipped with a semiconductor detector and high-voltage electrode (SARAD GmbH, Dresden, Germany), is not affected by fluctuations in air humidity. The sampling time for the measurements was 240 min. For radon concentration results at or below the reference level of 300 Bq/m³, at least 60 min intervals should be used, particularly when measuring outdoors [26].
The measurements were conducted during the autumn and winter of 2021 in classrooms where high radon levels were identified. In 2022, measurements were conducted in the autumn and winter in specific classrooms: room 2 on the first floor, room 24 on the second floor, and room 36 on the third floor. To determine the average annual radon concentration, the Radon Scout Professional radiometer was installed on the ground floor in room 2 from May 2022 to April 2023, covering 12 months. [27].
Together with employees of the National Center for Expertise in Stepnogorsk and specialists of the Republican State Institution “Stepnogorsk City Department of Sanitary and Epidemiological Control of the Department of Sanitary and Epidemiological Control of the Akmola region of the Committee for Sanitary and Epidemiological Control of the Ministry of Health of the Republic of Kazakhstan”, a ventilation system was installed in the school and control measurements of radon erosion were carried out in the school premises. Ventilation pipes are installed along all classrooms on the first floor of the Aksu school and in the classrooms of the kindergarten. A mechanical ventilation system is used only in cold periods; a natural ventilation system is used in warm periods.
The heated ventilation system is installed during the winter in the ground floor classrooms of the school, minicenter, and basements. The VK-100 fan model (1, Mikhaila Kotzubinskogo St., Kiev, 01030, Ukraine) is installed in the school and designed for installation in a circular duct with a 100 mm diameter. It is used in supply and exhaust ventilation systems in various residential and industrial buildings, schools, sports and recreation complexes, and other premises. The fan has a galvanized steel housing and is equipped with a reliable electric motor on a ball bearing, significantly increasing the service life and allowing for mounting in a horizontal or vertical position. The maximum air consumption is 290 m3/h, and the rotation speed is 2180 revolutions per minute.
The effect of ventilation rate on indoor air quality may be seen from its impact on airborne pollutant concentration by examining the equation of ventilation in the premises [28].
R p = Q V × ( D × h )
where R p —ventilation rate per person, m3/h person or L/s person;
  • Q—fresh air flow through the room, m3/h;
  • V—volume of the room, m3;
  • D—occupancy density, m2 person;
  • h—height, m.
Air change per hour (ACH) can be calculated by Equation (2) [29]
A C H = Q V
where ACH—air change per hour, h−1;
  • Q—fresh air flow through the room, m3/h;
  • V—volume of the room, m3.

2.3. Measurement of Meteorological Quantities

As part of the study, the results of atmospheric air temperature, humidity, precipitation, soil surface temperature, atmospheric pressure, and dew points were obtained from the official website, www.kazhydromet.kz (accessed on 10 February 2024), of the National Hydrometeorological Service of the Republic of Kazakhstan, the Republican State Enterprise—(RSE) “Kazhydromet”. The database was established using the guidelines for sharing data by the National Hydrometeorological Service, allowing for the open utilization of observational findings from RSE “Kazhydromet’s” meteorological stations [30].
The database holds data gathered through the state observation network and serves general purposes. It contains operational meteorological information derived from the processing and analysis of primary meteorological data. This data are extracted from the files (RES) following the initial processing of current meteorological information from stations conducted on the PERSONA MIS program (an automated system for the primary processing of current meteorological information from stations). The data span from 2000 to the present and are regularly updated every month as observation materials become available [31].
Kazhydromet RSE has 15 branches in the Republic and 228 meteorological data measurement stations. We received data from the substation of settlement Akkol, which is located near Aksu. The distance between these settlements is 100 km. At the stations, the following measurement devices are used:
  • Measurement of the maximum temperature—TM-1-1 and TM-1-2 thermometer; TM-1 meteorological glass thermometers are designed to measure the maximum temperature over a certain period of time. The measurement range of the TM-1-1 is from −35 to 50 °C, and for TM-1-2 from −20 to +70 °C. The limit of permissible error of the thermometers after the introduction of corrections is not more than ±0.2 °C. The manufacturer is JSC “Thermopribor”, Klin, Moscow region, Volokolamsk highway, 44.
  • Measurement of the minimum temperature—thermometer TM-2-3; meteorological glass TM-2 thermometers (hereinafter referred to as the thermometers) are designed to measure the minimum air temperature over a certain period of time. The measurement range of the TM-2-3 is from −50 to 40 °C, and the limit of permissible error of the thermometers after the introduction of corrections is not more than 0.5 °C. The manufacturer is JSC “Thermopribor”, Klin, Moscow region, Volokolamsk highway, 44.
  • Measuring soil temperature—thermometer TM-3-1; meteorological glass TM-3 thermometers (hereinafter referred to as the thermometer) are designed to measure the temperature of the soil’s surface. The measurement range of the TM-2-3 is from −35 to 60 °C, and the limit of permissible error of the thermometers after the introduction of corrections is no more than 0.2 °C. The manufacturer is JSC “Thermopribor”, Klin, Moscow region, Volokolamsk highway, 44.
  • TM10-1 meteorological glass thermometers (hereinafter referred to as the thermometers) are designed to measure the temperature of deep soil layers and measure the temperature of the surface layer of water in reservoirs. The measurement range of the TM10-1 is from −20 to 30 °C, and the limit of permissible error of the thermometers after the introduction of corrections is no more than 0.1 °C. The manufacturer is JSC “Thermopribor”, Klin, Moscow region, Volokolamsk highway, 44.
  • TM4 meteorological glass thermometers (hereinafter referred to as the thermometers) are designed to determine the temperature and humidity of the air. They are used in pairs in station psychrometers. The measuring range of the TM4-2 is from −25 to +50 °C, and the limit of permissible error of the thermometers after the introduction of corrections is not more than 0.1 °C. The manufacturer is JSC “Thermopribor”, Klin, Moscow region, Volokolamsk highway, 44 [32].
  • Humidity and temperature sensor HMP155—humidity and temperature measurement, humidity measurement range from 0 to 100%, temperature from 80 to +60 °C. The error is ±0.6% (0–40%), ±1.0% (40–10%) [33].
  • The M63M-1 anemorumbometer is designed for remote measurement of instantaneous, maximum, and average wind speeds and directions. Measurement ranges: instantaneous wind speed, m/s from 1.5 to 60; maximum wind speed, m/s from 3 to 60; average wind speed, m/s from 1.2 to 40; and wind direction, degrees from 0 to 360. The averaging periods of the average wind speed are 2 and 10 min. The main measurement error is no more than, when measuring wind speeds, m/s ± (0.5 + 0.05 V), where V is the measured wind speed; and when measuring wind direction, degrees ± 10. The manufacturer is JSC Safonovsky Plant Gidrometpribor, Russia, 215500, Safonovo, Smolensk region [34].
  • For the BRS-1M-1 barometer, the barometer is designed to operate under conditions established for the performance of UHL category 4.2 according to GOST 15150-69, but at ambient temperatures from 5 to 50 °C and a maximum relative humidity of 95% (at a temperature of 30 °C). The range is 450–825 mmHg. The error is 0.25. The manufacturer is LLC Enterprise “Barometer”, Moscow, Tkatskaya str., 19 [35].
  • The regional meteorological service of the Akkol station also has an AMS 111 system, available for stationary or mobile meteorological stations, applicable in areas where there are difficulties connecting the industrial power supply. The temperature measurement range is from −65 °C to +75 °C, atmospheric pressure from 500 to 1100 gPa, soil temperature from −65 °C to +75 °C, operating humidity range from 0 to 100%, and wind sensor from 0 to 60 m/s [36].

2.4. Statistical Analysis

The statistical analysis was conducted using StatTech version 3.1.10, developed by StatTech LLC v. 4.5.0 in Russia (developer—Stattech LLC, Kazan, Russia). Descriptive statistics for quantitative variables are presented in Table 1. The normality of the quantitative variables was evaluated using the Shapiro–Wilk test for sample sizes less than 50, and the Kolmogorov–Smirnov test for sample sizes greater than 50.
If the data do not follow a normal distribution, quantitative information is represented using the median (Me) and the first and third quartiles (Q1–Q3) (Table 1).
Descriptive statistics were used to summarize categorical data, while the Mann–Whitney U-test was applied to compare two groups based on a non-normally distributed quantitative variable. For comparisons involving three or more groups and non-normally distributed quantitative variables, the Kruskal–Wallis test and Dunn’s criterion with Holm correction were used as a post hoc method. The analysis of multifield contingency tables involved the use of Pearson’s chi-square test for expected values greater than 10. Spearman’s correlation coefficient was employed to assess the relationship between two non-normally distributed quantitative variables, and ordinary least squares linear regression was used to develop a prognostic model for the dependence of a quantitative variable on predictors. Additionally, logistic regression was utilized to create a prognostic model for the probability of a binary outcome, with Nagelkerke R2 serving as a performance measure for the model.

3. Results

According to a previous study, the indoor radon concentrations decreased after cleaning the ventilation shaft of the school, but during the cold period, indoor radon concentrations exceeded the permitted level [25]. The results of measuring radon concentration in the school premises after installing the supply ventilation system in the classrooms are shown in Table 2.
As it can be seen from Table 2, before the ventilation system was turned on, in the classrooms of the first floor and the kindergarten the radon concentration ranged from 489 to 683 Bq/m3, on the second floor from 132 Bq/m3 to 457 Bq/m3, and on the third floor from 225 Bq/m3 to 531 Bq/m3. After turning on the ventilation system for 30 min in the classrooms of the 2nd and 3rd floors, the radon concentration decreased below the reference level. In the classrooms on the first floor, it ranged from 120 Bq/m3 to 433 Bq/m3. An hour after connecting the ventilation system in the classrooms on the first floor, the radon concentration ranged from 85 Bq/m3 to 153 Bq/m3, which is lower than the reference level. In connection with the above, recommendations were made to turn on the ventilation system for an hour before the start of classes at the school and the kindergarten.
The previous research revealed that indoor radon levels fluctuated depending on weather conditions, and it is clear that effective ventilation significantly reduces the concentrations [25]. This study found that there are positive correlations between the levels of radon, outside temperature, and relative humidity, indicating that radon concentrations are affected by meteorological factors.
Figure 2 shows a comparative analysis of radon concentration in the seasons spring (March, April, and May), summer (June, July, and August), autumn (September, October, and November), and winter (December, January, and February). According to the data obtained, when comparing radon concentrations, statistically significant differences are revealed depending on the season (p < 0.001) (applied method: the Kruskal–Wallis test).
As it can be seen from Figure 2, it is possible to see an increase in the concentration of radon in the spring and winter period of the year; this is due to the diminished natural ventilation of the rooms. To fully clarify the reason for the difference, we analyzed the relationship of radon concentration with meteorological parameters such as temperature, relative humidity, atmospheric pressure, and soil surface temperature.
The statistical correlation between radon concentration and environmental parameters such as temperature, humidity, and atmospheric pressure was analyzed to determine if there is a relationship between them. Figure 3 shows a correlation analysis of the association between the outside air temperature and radon concentration.
As it can be seen from Figure 3, with a 1 °C decrease of air temperature, a 65.56 ± 27.36 Bq/m3 change in radon concentration should be expected, for which there was a close correlation (by the Chaddock scale). According to the coefficient of determination R2 of the resulting model, 26.1% of the observed variance of radon concentration was explained. According to prior studies, in the summer, the radon concentration is lower than in the cold period of the year [9]. This is due to the fact that during the warm period, especially on hot days, the premises are often ventilated and there is also no stack effect, which allows for reducing the concentration of radon in the premises. These data are confirmed by the anticorrelation between the outdoor air temperature and the radon concentration inside residential premises. In winter, with the strengthening of the stack effect caused by higher temperature differences between the internal and external environment, the concentration of radon increases.
For a detailed analysis of the relationship between the outside air temperature and the radon concentration, the outside air temperature was divided into groups. Based on the data obtained during the analysis of radon concentration, depending on the outside air temperature by groups, statistically significant differences were revealed depending on air temperature by groups (p < 0.001) (applied method: the Kruskal–Wallis test). Figure 4 shows a comparative analysis of radon concentration and outside air temperature by groups.
Figure 4 shows that the radon concentration starts higher in groups from 0 to −5 and −25 to −20 °C, and then the radon concentration decreases above −30; this may be due to the fact that the soil surface temperature under buildings can also freeze, which reduces air exchange in the soil. In studies on measuring radon flux density in different seasons, scientists revealed the fact that with a decrease in soil surface temperature, the activity of radon release decreases [37].
We conducted a correlation analysis of the relationship between dew point and radon concentration. There was a noticeable tightness of feedback between radon concentration and dew point. Figure 5 shows a correlation analysis of the association between dew point and radon concentration.
In the studies of a number of authors, the dew point temperature also negatively correlates with the radon concentration in the premises [13,18]. With a 1 °C decrease of dew point, a 70.08 ± 25.40 Bq/m3 change in radon concentration should be expected, for which there was close correlation (by the Chaddock scale). According to the coefficient of determination R2 of the resulting model, 21.4% of the observed variance of radon concentration was explained.
Other meteorological parameters were demonstrated to have less influence on radon levels in the house. The atmospheric pressure generally exhibited variations of periodicity longer than the diurnal cycles, and radon concentrations were not noticeably influenced by pressure changes. Figure 6 shows a correlation analysis of the association between atmospheric pressure and radon concentration.
As it can be seen from Figure 6, a weak correlation positive association between radon concentration and atmospheric pressure at station level was estimated. With a 1 mm Hg increase of atmospheric pressure at station level, a 24.33 ± 9.52 Bq/m3 change in radon concentration should be expected, for which there was a weak correlation. According to the coefficient of determination R2 of the resulting model, 1.8% of the observed variance of radon concentration was explained.
Figure 7 shows a correlation analysis of the association between air humidity and radon concentration.
As it can be seen from Figure 7, a moderate correlation and positive association between radon concentration and air humidity was estimated. With a 1% increase in air humidity, a 54.66 ± 19.21 Bq/m3 change in radon concentration should be expected; the correlation on the Chaddock scale was average. According to the coefficient of determination R2 of the resulting model, 15.6% of the observed variance of radon concentration was explained. According to the data obtained, the radon concentration is moderately positively correlated with the relative humidity of the outdoor air. In the studies of Spasić, D. and Gulan, L., no clear correlation was found between indoor and outdoor radon concentrations and relative humidity and precipitation [38]. In the work of Aquilina, N.J. and Fenech, S., radon conjugation in combination also weakly correlates with temperature load and relative humidity [39].
Throughout the day, the wind speeds followed a daily cycle, peaking in the early afternoon and reaching their lowest levels after midnight. Even though it was anticipated that the higher wind speeds would create negative pressure differences in the school, which could result in the transport of radon through advection, there was no apparent connection between the variations in radon concentration and the daily wind-speed pattern, except when the wind cycle aligned with the temperature fluctuation cycle. Figure 8 performed a correlation analysis of the association between wind speed and radon concentration.
As it can be seen from Figure 8, a weak correlation and positive association between radon concentration and wind speed was estimated. With a 1 m/s increase of wind speed, a 350.55 ± 115.42 Bq/m3 change in radon concentration should be expected, for which there was a weak correlation. According to the coefficient of determination R2 of the resulting model, 8.5% of the observed variance of radon concentration was explained.
A meteorological parameter that did appear to affect the indoor radon concentrations was precipitation, as periods following significant rainfall often exhibited decreased indoor radon levels. Figure 9 shows a correlation analysis of the association between precipitation and radon concentration. As a result of comparing radon concentration depending on precipitation, statistically significant differences were established (p = 0.007) (method used: the Kruskal–Wallis criterion).
Figure 9shows a weak correlation positive association between radon concentration and precipitation was estimated. With a 1 mm/h increase of precipitation, a 29.50 ± 9.57 Bq/m3 change in radon concentration should be expected, for which there was close correlation (by the Chaddock scale). According to the coefficient of determination R2 of the resulting model, 0.2% of the observed variance of radon concentration was explained. Indicators of radon concentration and precipitation have statistically significant differences: radon concentration increases with precipitation of 0–1.9 mm, and with an increase in precipitation, radon concentration decreases. This is because, with a low moisture content, the process of radon emanation increases with an increase in soil moisture [40,41], which leads to an increase in the radon flux density. With a high moisture content, radon output to the surface is prevented by water in the pores, i.e., water shields the radon output from the ground, therefore, the radon flux density decreases [38]. Precipitation saturates the soil and prevents the release of radon due to the deterrent effect [42,43]. The release of radon from the soil depends on the amount of precipitation, and the radon diffusion coefficient increases with temperature [44].
The regression analysis approach is largely insufficient to constrain the very complex dynamics of radon, and time series, multiple linear regression, and multivariate analysis should be performed [45]. The indoor radon concentrations are influenced by meteorological parameters, and multiple linear regression was performed, as shown in Table 3, to estimate the dependence of radon concentration on quantitative variables. The number of observations was 352.
The observed association of radon concentration with dew point, wind speed, and air humidity is presented by a linear regression equation:
Yradon concentration = −2065 − 61XDew point + 336Xwind speed + 34Xair humidity
where Y—radon concentration value, XDew point—dew point (°C), Xwind speed—wind speed (m/s), and Xair humidity—air humidity (%).
According to this equation, with a 1 °C decrease of dew point, a 60.71 ± 20.24 Bq/m3 change in radon concentration should be expected; with an 1 m/s increase of wind speed, a 335.92 ± 111.89 Bq/m3 change in radon concentration should be expected; and with a 1% increase of air humidity, a 33.96 ± 11.32 Bq/m3 change in radon concentration should be expected.
The resulting regression model is characterized by the correlation coefficient rxy = 0.605, which corresponds to a close relationship on the Chaddock scale. The model was statistically significant (p < 0.001). The resulting model explains 36.6% of the observed variance of radon concentration.
Table 4 presents the estimated air changes and ventilation rates per person for classrooms in the school and kindergarten.
As it can be seen from Table 4, the ventilation rate for all classrooms and kindergarten bedroom does not exceed the recommended level (8 L/s person) [46,47]. The gym has the maximum capacity in the school and the highest site volume at 450 m3, with the lowest ventilation rate per person. The ACH values varies from 0.6 to 4. These results fall within the bare minimum recommended by the healthy buildings site [48].

4. Discussion

Correlation analyses between indoor radon levels and outdoor weather conditions were conducted. As a result of the constant measurement of the radon level in the premises, taking into account the environmental factors of the outdoor air, attention should also be paid to the change in the temperature of the outdoor air, since this affects the temperature difference between indoor and outdoor air, and therefore the pressure drop between the indoor and outdoor environment. In various studies, authors also indicate that the daily fluctuations of radon are mainly associated with fluctuations in outdoor air temperature, which lead to frequent airing of the room in the summer, or to a decrease in ventilation of the heated period in winter. Ventilation of the room affects the dynamics of the radon level (i.e., chimney and ventilation) [49,50].
The levels of radon showed a regular pattern throughout the day, reaching a low point during the daytime and peaking at nighttime due to variations in atmospheric convection. On a seasonal time scale, an increase in the concentration of radon in the spring and winter period of the year is seen, and this is due to the natural ventilation of the room. The inverse relationship between indoor radon concentration and wind speed could be clarified by the drop in outdoor pressure as outdoor wind speed rises, thus resulting in a lower indoor radon concentration as the outdoor wind speed increases [51]. Another of the climatic parameters, precipitation also affects radon levels in the premises, and according to our data, statistically significant differences (p = 0.007) between the radon concentration and the amount of precipitation have been established. These results are in good agreement with the results of other studies, which also indicate that the radon flux density at a low moisture content increases the process of radon emanation with increasing soil moisture, and at a high moisture content, radon output to the surface is hindered by water in the pores. According to our data, the influence of atmospheric humidity on indoor radon levels is moderately positively correlated, and these results are consistent with previous observations and studies conducted by various authors [11,52,53]. The obtained results of the analysis of the relationship between indoor radon levels and climatic parameters indicate the importance of taking into account outdoor air temperature and atmospheric precipitation when conducting monitoring and short-term measurements of radon levels.

5. Conclusions

In this study, indoor radon concentrations have been correlated with meteorological parameters. Indoor and outdoor temperature differentials heavily influence diurnal indoor radon patterns. The analysis indicates that the correlation between indoor radon and outdoor temperature, dew point, and air humidity was weak and negligible for atmospheric pressure, wind speed, and precipitation, as determined by the obtained values of R2 and the Chaddock scale. The multiple regression model is characterized by the correlation coefficient rxy = 0.605, which corresponds to a close relationship on the Chaddock scale.
In our study, there is a weak correlation between outdoor air relative humidity and indoor radon levels. These findings are consistent with the work of Spasić D. and Gulan L., who also did not find a clear correlation between indoor and outdoor radon concentrations, relative humidity, and precipitation. Additionally, Aquilina, N.J. and Fenech, S. discovered that the combination of radon concentration weakly correlates with temperature and relative humidity.
The ventilation rate for all classrooms and kindergarten bedroom does not exceed the recommended level. The results fell within the bare minimum recommended.

Author Contributions

Conceptualization, Y.K. and P.K.; data curation, M.B.; formal analysis, Y.K. and D.I.; funding acquisition, Y.K. and M.H.; methodology, Y.K., S.T., H.S., Y.O., M.B., D.I., N.A., A.L. and M.H.; writing—original draft preparation, Y.K., M.B., D.I., M.H., N.A., S.T., Y.O. and B.K.; writing—review and editing Y.K., S.T., A.L., H.S., B.K., M.B. and D.I. All authors have read and agreed to the published version of the manuscript.

Funding

This research was funded by the Committee of Science of the Ministry of Science and Higher Education of the Republic of Kazakhstan, grant number IRN AR13268875, “Assessment of the radon safety of the Aksu village school located near the radioactive waste storage facility and development of measures to reduce the risk of irradiation of students” (2022–2024). This research was supported by JST aXis B-type No. JPMJAS2014, JSPS KAKENHI grant no. 19H01149 and by the Environmental Radioactivity Research Network Center (ERAN) (F-22-14 and F-23-14). This research was supported by grant no. 248/30-22-24 of the Committee of Science of the Ministry of Science and Higher Education of the Republic of Kazakhstan and grant number IRN AR14871503 “Assessment of the dose load and epidemiological study of the population living near preserved uranium mines, development of measures to minimize negative technogenic factors” (2022–2024).

Institutional Review Board Statement

Not applicable.

Informed Consent Statement

Not applicable.

Data Availability Statement

The data presented in this study are available on request from the corresponding author Kashkinbayev Yerlan. The data are not publicly available due to privacy and ethical and can be provided upon reasonable request.

Acknowledgments

The work of the author Kashkinbayev Yerlan was funded by a project under the IRN AR1326875 (2022–2024), funded by the Science Committee of the Ministry of Science and Higher Education of the Republic of Kazakhstan for 2022–2024. The author expresses gratitude to scientific supervisor Kazymbet P.K. for the opportunity to work based on the Institute of Radiobiology and Radiation Protection and for advice in carrying out the work.

Conflicts of Interest

The authors declare no conflicts of interest.

References

  1. Ćujić, M.; Janković Mandić, L.; Petrović, J.; Ranko Dragović, R.; Dorđević, M.; Dokić, M.; Dragović, S. Radon-222: Environmental behavior and impact to (human and non-human) biota. Int. J. Biometeorol. 2021, 65, 69–83. [Google Scholar] [CrossRef] [PubMed]
  2. Al Jassim, M.; Isaifan, R. A review on the sources and impacts of radon indoor air pollution. J. Environ. Toxicol. Study 2018, 2, 1–9. [Google Scholar] [CrossRef]
  3. Asher-Bolinder, S.; Owen, D.E.; Schumann, R.; Asher-Bolinder, S.; Owen, D.E.; Schumann, R. A preliminary evaluation of environmental factors influencing day-to-day and seasonal soil-gas radon concentrations. In Studies of Radon in Rocks, Soils, and Water; Gundersen, L.C.S., Wanty, R.B., Eds.; US Geological Survey Bulletin: Washington, DC, USA, 1971; pp. 23–31. [Google Scholar]
  4. Baixeras, C.; Erlandsson, B.; Font, L.; Jönsson, G. Radon emanation from soil samples. Radiat. Meas. 2001, 34, 441–443. [Google Scholar] [CrossRef]
  5. Bruzzone, D.; Bussallino, M.; Castello, G.; Maggiolo, S.; Rossi, D. Measurement of the concentration of radon gas in the Toirano’s caves (Liguria). Ann. Chim. 2006, 96, 515–524. [Google Scholar] [CrossRef]
  6. Neznal, M.; Matolin, M.; Just, G.; Horak, K. Short-term temporal variations of soil gas radon concentration and comparison of measurement techniques. Rad. Prot. Dosim. 2004, 108, 55–63. [Google Scholar] [CrossRef]
  7. Phong Thu, H.N.; Van Thang, N.; Hao, L.C. The effects of some soil characteristics on radon emanation and diffusion. J. Environ. Radioact. 2020, 216, 106189. [Google Scholar] [CrossRef]
  8. Groves-Kirkby, C.; Denman, A.; Phillips, P.; Crockett, R.; Sinclair, J. Comparison of seasonal variability in European domestic radon measurements. Nat. Hazards Earth Syst. Sci. 2010, 10, 565–569. [Google Scholar] [CrossRef]
  9. Bruno, R.C. Sources of Indoor Radon in Houses: A Review. J. Air Pollut. Control. Assoc. 1983, 33, 105–109. [Google Scholar] [CrossRef]
  10. Marley, F. Investigation of the influences of atmospheric conditions on the variability of radon and radon progeny in buildings. Atmos. Environ. 2001, 35, 5347–5360. [Google Scholar] [CrossRef]
  11. Rey, J.F.; Goyette, S.; Gandolla, M.; Palacios, M.; Barazza, F.; Goyette Pernot, J. Long-Term Impacts of Weather Conditions on Indoor Radon Concentration Measurements in Switzerland. Atmosphere 2022, 13, 92. [Google Scholar] [CrossRef]
  12. Papaefthymiou, H.; Mavroudis, A.; Kritidis, P. Indoor radon levels and influencing factors in houses of Patras, Greece. J. Environ. Radioact. 2003, 66, 247–260. [Google Scholar] [CrossRef] [PubMed]
  13. Xie, D.; Liao, M.; Kearfott, K.J. Influence of environmental factors on indoor radon concentration levels in the basement and ground floor of a building—A case study. Radiat. Meas. 2015, 82, 52–58. [Google Scholar] [CrossRef]
  14. Rowe, J.E.; Kelly, M.; Price, L.E. Weather system scale variation in radon-222 concentration of indoor air. Sci. Total Environ. 2002, 284, 157–166. [Google Scholar] [CrossRef]
  15. Karpin’ska, M.; Mnich, Z.; Kapa1a, J. Seasonal changes in radon concentrations in buildings in the region of northeastern Poland. J. Environ. Radioact. 2004, 77, 101–109. [Google Scholar] [CrossRef] [PubMed]
  16. Groves-Kirkby, C.J.; Denman, A.R.; Crockett, R.G.M.; Phillips, P.S.; Gilmore, G.K. Identification of tidal and climatic influences within domestic radon time-series from Northamptonshire, UK. Sci. Total Environ. 2006, 367, 191–202. [Google Scholar] [CrossRef] [PubMed]
  17. Park, J.; Lee, C.; Lee, H.; Kang, D. Estimation of Seasonal Correction Factors for Indoor Radon Concentrations in Korea. Int. J. Environ. Res. Public Health 2018, 15, 2251. [Google Scholar] [CrossRef]
  18. Gillmore, G.; Phillips, P.; Denman, A. The Effects of Geology and the Impact of Seasonal Correction Factors on Indoor Radon Levels: A Case Study Approach. J. Environ. Radioact. 2005, 84, 469–479. [Google Scholar] [CrossRef]
  19. Muntean, L.; Cosma, C.; Cucos, A.; Dicu, T.; Moldovan, D. Assessment of Annual and Seasonal Variation of Indoor Radon Levels in Dwelling Houses from Alba County, Romania. Rom. J. Phys. 2014, 59, 163–171. [Google Scholar]
  20. Giagias, V.; Burghele, D.; Cosma, C. Seasonal Variation of Indoor Radon in Dwellings from Athens, Greece. Rom. J. Phys. 2015, 60, 1581–1588. [Google Scholar]
  21. Soldati, G.; Ciaccio, M.G.; Piersanti, A.; Cannelli, V.; Galli, G. Active Monitoring of Residential Radon in Rome: A Pilot Study. Int. J. Environ. Res. Public Health 2022, 19, 13917. [Google Scholar] [CrossRef]
  22. Ibrayeva, D.; Bakhtin, M.; Kashkinbayev, Y.; Kazymbet, P.; Zhumadilov, K.; Altaeva, N.; Aumalikova, M.; Shishkina, E. Radiation situation in the territories affected by mining activities in Stepnogorsk areas, Republic of Kazakhstan: Pilot study. Radiat. Prot. Dosim. 2020, 189, 517–526. [Google Scholar] [CrossRef]
  23. Tokonami, S.; Kranrod, C.; Kazymbet, P.; Omori, Y.; Bakhtin, M.; Poltabtim, W.; Musikawan, S.; Pradana, R.; Kashkinbayev, Y.; Zhumadilov, K.; et al. Residential radon exposure in Astana and Aqsu, Kazakhstan. J. Radiol. Prot. 2023, 43, 023501. [Google Scholar] [CrossRef]
  24. Ibrayeva, D.; Ilbekova, K.; Aumalikova, M.; Kazymbet, P.; Zhumadilov, K.; Bakhtin, M.; Hoshi, M. Studies on gamma dose rates in outdoor environment and assessment of external exposure to public in Stepnogorsk area, northern Kazakhstan. Radiat. Prot. Dosim. 2022, 198, 1387–1398. [Google Scholar] [CrossRef] [PubMed]
  25. Kashkinbayev, Y.; Kazymbet, P.; Bakhtin, M.; Khazipova, A.; Hoshi, M.; Sakaguchi, A.; Ibrayeva, D. Indoor Radon Survey in Aksu School and Kindergarten Located near Radioactive Waste Storage Facilities and Gold Mines in Northern Kazakhstan (Akmola Region). Atmosphere 2023, 14, 1133. [Google Scholar] [CrossRef]
  26. Available online: https://www.sarad.de/cms/media/docs/handbuch/man-radonvision7-en.pdf (accessed on 5 February 2023).
  27. ASTM D6327-10; Standard Test Method for Determination of Radon Decay Product Concentration and Working Level in Indoor Atmospheres by Active Sampling on a Filter. Enter. 206-04-01. American Society for Testing and Materials: West Conshohocken, PA, USA, 2016; 5p.
  28. Available online: https://www.vcalc.com/equation/?uuid=e75656b9-a164-11e8-abb7-bc764e2038f2 (accessed on 20 August 2024).
  29. Available online: https://www.effiworkx.com/calculators/heating-cooling-calculators/air-changes-per-hour/ (accessed on 5 February 2023).
  30. Order of the Minister of Ecology, Geology and Natural Resources of the Republic of Kazakhstan No. 267 dated July 23, 2021 (Registered with the Ministry of Justice of the Republic of Kazakhstan on July 27, 2021 for No. 23716). Available online: https://adilet.zan.kz/rus/docs/V2100023716/ (accessed on 5 August 2024).
  31. Available online: https://meteo.kazhydromet.kz/database_meteo/ (accessed on 10 February 2024).
  32. Available online: https://xn--90ahjlpcccjdm.xn--p1ai/catalog/termometry-meteorologicheskie-tm-1-10/ (accessed on 26 August 2024).
  33. Available online: https://xena-vaisala.ru/products/avtomatizatsija_zdaniy/produktsija/temperatura_inbspvlazhnost/naruzhnie/hmp155/ (accessed on 26 August 2024).
  34. Available online: http://pp66.ru/katalog/meteorolog/anemorumbo/m63m-1-anemorumbometr/ (accessed on 26 August 2024).
  35. Available online: http://pp66.ru/katalog/meteorolog/barometry/brs-1m_barometr/ (accessed on 26 August 2024).
  36. Available online: https://www.adal-meteo.kz/avtomaticheskaya_meteorologicheskaya_stanciya.html (accessed on 26 August 2024).
  37. Fujiyoshi, R.; Sakamoto, K.; Imanishi, T.; Sumiyoshi, T.; Sawamura, S.; Vaupotic, J.; Kobal, I. Meteorological parameters contributing to variability in 222Rn activity concentrations in soil gas at a site in Sapporo, Japan. Sci. Total Environ. 2006, 370, 224–234. [Google Scholar] [CrossRef] [PubMed]
  38. Spasić, D.; Gulan, L. High Indoor Radon Case Study: Influence of Meteorological Parameters and Indication of Radon Prone Area. Atmosphere 2022, 13, 2120. [Google Scholar] [CrossRef]
  39. Aquilina, N.J.; Fenech, S. The influence of meteorological parameters on indoor and outdoor radon concentrations: A preliminary case study. J. Environ. Pollut. Control. 2019, 2, 1–8. [Google Scholar]
  40. Stanley, F.K.T.; Irwin, J.L.; Jacques, W.R.; Salgia, S.R.; Innes, D.G.; Winquist, B.D.; Torr, D.; Brenner, M.D.; Gudarzi, A.A. Radon exposure in the modern residential environment of North America is steadily increasing and becoming more uniform depending on the season. Sci. Rep. 2019, 9, 18472. [Google Scholar] [CrossRef]
  41. Wilson, D.L.; Gammage, R.B.; Dudney, C.S.; Saltz, R.J. Summer rise of 222Rn in Huntsville, Alabama. Health Phys. 1991, 60, 189–197. [Google Scholar] [CrossRef]
  42. Ryzhakova, N.K.; Ramenskaya, G.A. Methods and results of determination of coefficients of emanation of clay soils of the city of Tomsk. Geoecology. Engineering geology. Hydrogeology. Geocryology 2012, 2, 168–176. [Google Scholar]
  43. Yakovleva, V.S. Modeling of the influence of the state and variability of the atmosphere and lithosphere on the density of radon and thoron fluxes from the Earth’s surface. Proc. Tomsk Polytech. Univ. 2010, 317, 162–166. [Google Scholar]
  44. Ota, M.; Iida, T.; Yamazawa, H.; Nagara, S.; Ishimori, Y.; Sato, K.; Tokizawa, T. Suppression of Radon Exhalation from Soil by Covering with Clay-mixed Soil. J. Nucl. Sci. Technol. 2007, 44, 791–800. [Google Scholar] [CrossRef]
  45. Siino, M.; Scudero, S.; Cannelli, V.; Piersanti, A.; D’alessandro, A. Multiple seasonality in soil radon time series. Sci. Rep. 2019, 9, 8610. [Google Scholar] [CrossRef]
  46. CEN. BS EN 13779:2007; Ventilation for Non-Residential Buildings. Performance Requirements for Ventilation and Room-Conditioning Systems. European Committee for Standardization: Brussels, Belgium, 2007.
  47. Fisk, W.J. The ventilation problem in schools: Literature review. Indoor Air 2017, 27, 1039–1051. [Google Scholar] [CrossRef] [PubMed]
  48. Available online: https://schools.forhealth.org/risk-reduction-strategies-for-reopening-schools/healthybuildings/#:~:text=For%20improving%20indoor%20air%20quality,any%20combination%20of%20these%20approaches (accessed on 26 August 2024).
  49. Zhang, L.; Guo, Q.; Sun, K. Continuous measurement of radon exhalation rate of soil in Beijing. J. Radioanal. Nucl. Chem. 2015, 303, 1623–1627. [Google Scholar] [CrossRef]
  50. Valiya, V.; Su, T.K.; Fu, C.C.; Yan, T.F. Spatial variations of radon and helium concentrations in soil gas of the Shan-Chao fault, Northern Taiwan. Radiat. Meas. 2005, 40, 513–516. [Google Scholar]
  51. Lebedit, M.; Butkus, D.; Morkunas, G. Changes in the power of the ambient dose equivalent in the surface air. J. Environ. Radioact. 2003, 64, 45–57. [Google Scholar]
  52. Kitto, M.E. Interrelationship of indoor radon concentrations, soil-gas flux, and meteorological parameters. J. Radioanal. Nucl. Chem. 2005, 264, 381–385. [Google Scholar] [CrossRef]
  53. Saifulina, E.; Janabayev, D.; Kashkinbayev, Y.; Shokabaeva, A.; Ibrayeva, D.; Aumalikova, M.; Kazymbet, P.; Bakhtin, M. Epidemiology of Somatic Diseases and Risk Factors in the Population Living in the Zone of Influence of Uranium Mining Enterprises of Kazakhstan: A Pilot Study. Healthcare 2023, 11, 804. [Google Scholar] [CrossRef]
Figure 1. Scheme showed settlements location near the HMP tailings site, where 1—tailings dump evaporation pond; 2—pond 2; 3—pond 3.
Atmosphere 15 01067 g001
Figure 2. Comparative analysis of radon concentration and seasons.
Atmosphere 15 01067 g002
Figure 3. Regression line characterizing the dependence of radon concentration on outside air temperature.
Atmosphere 15 01067 g003
Figure 4. Comparative analysis of radon concentration and outside air temperature by groups.
Atmosphere 15 01067 g004
Figure 5. Regression line characterizing the dependence of radon concentration on dew point.
Atmosphere 15 01067 g005
Figure 6. Regression line characterizing the dependence of radon concentration on atmospheric pressure.
Atmosphere 15 01067 g006
Figure 7. Regression line characterizing the dependence of radon concentration on air humidity.
Atmosphere 15 01067 g007
Figure 8. Regression line characterizing the dependence of radon concentration on wind speed.
Atmosphere 15 01067 g008
Figure 9. Regression line characterizing the dependence of radon concentration on precipitation.
Atmosphere 15 01067 g009
Table 1. Descriptive statistics for quantitative variables.
VariablesM ± SD/Me95% CI/Q₁–Q₃n
Air temperature, Me (°C)2−9–16353
dew point, Me (°C)−2−13–6353
soil surface temperature, Me (°C)1.9−9.9–19.4353
atmospheric pressure at station level, M ± SD (mm Hg)974 ± 10973–975353
atmospheric pressure at sea level, Me (mm Hg)10201011–1029353
the magnitude of the barric trend, Me (hPa)10–1353
wind speed, Me (м/s)22–3353
precipitation1, Me00–0353
air humidity, Me (%)6857–78353
radon concentration, Me (Bq/m3)36499–2096353
Table 2. The results of radon concentrations in the school premises after installing the supply ventilation system in the classrooms.
Place of MeasurementThe Results of Radon Concentration, Bq/m3
Before Turning on the Ventilation System30 min after Turning on the Ventilation System60 min after the Ventilation System Is Turned on
1st floor552 ± 184255 ± 8544 ± 13
Bedroom No. 1 (children’s garden)683 ± 223433 ± 144153 ± 51
Gym491 ± 158335 ± 10785 ± 27
Canteen 489 ± 152120 ± 38106 ± 35
3rd floor, № 32 531 ± 177146 ± 44-
3rd floor, № 34225 ± 7164 ± 21-
3rd floor, № 36 388 ± 12742 ± 14-
2nd floor, № 21 220 ± 69174 ± 55-
2nd floor, № 26 132 ± 41--
2nd floor, № 22457 ± 147172 ± 49-
2nd floor, № 24 158 ± 4715 ± 4-
Table 3. Analysis of radon concentration conditioning on air temperature, dew point, soil surface temperature, atmospheric pressure at sea level, wind speed, precipitation, and air humidity.
BStd ErrortPR2
Intercept−2065427−5<0.001 *0.36
dew point−617−9<0.001 *
wind speed336526<0.001 *
air humidity3465<0.001 *
* differences are statistically significant (p < 0.05).
Table 4. The results of ventilation rate per hour and air change per hour in the classrooms in the school and kindergarten.
Place of Measurement R p , L/s Person ACH, h−1
1st floor74
Bedroom No. 1 (children’s garden)63.3
Gym40.6
Canteen 51.6
3rd floor, № 32 74
3rd floor, № 3473.6
3rd floor, № 36 73.1
2nd floor, № 21 84
2nd floor, № 26 73.8
2nd floor, № 2263
2nd floor, № 24 83.3
Disclaimer/Publisher’s Note: The statements, opinions and data contained in all publications are solely those of the individual author(s) and contributor(s) and not of MDPI and/or the editor(s). MDPI and/or the editor(s) disclaim responsibility for any injury to people or property resulting from any ideas, methods, instructions or products referred to in the content.

