Article

Performance Evaluation of TGFS Typhoon Track Forecasts over the Western North Pacific with Sensitivity Tests on Cumulus Parameterization

1
Department of Atmospheric Sciences, National Taiwan University, Taipei 106319, Taiwan
2
Technology Development Division, Central Weather Administration, Taipei 100006, Taiwan
3
Department of Atmospheric Sciences, National Central University, Taoyuan 320317, Taiwan
*
Author to whom correspondence should be addressed.
Atmosphere 2024, 15(9), 1075; https://doi.org/10.3390/atmos15091075
Submission received: 12 August 2024 / Revised: 30 August 2024 / Accepted: 3 September 2024 / Published: 5 September 2024
(This article belongs to the Special Issue Typhoon/Hurricane Dynamics and Prediction (2nd Edition))

Abstract

:
This study employed the new generation Taiwan global forecast system (TGFS) to focus on its performance in forecasting the tracks of western North Pacific typhoons during 2022–2023. TGFS demonstrated better forecasting performance in typhoon track compared to central weather administration (CWA) GFS. For forecasts with large track errors by TGFS at the 120th h, it was found that most of them originated during the early stages of typhoon development when the typhoons were of mild intensity. The tracks deviated predominantly towards the northeast and occasionally towards the southwest, which were speculated to be due to inadequate environmental steering guidance resulting from the failure to capture synoptic environmental features. The tracks could be corrected by replacing the original new simplified Arakawa–Schubert (NSAS) scheme with the new Tiedtke (NTDK) scheme to change the synoptic environmental field, not only for Typhoon Khanun, which occurred in the typhoon season of 2023, but also for Typhoon Bolaven, which occurred after the typhoon season, in October 2023, under atypical circulation characteristics over the western Pacific. The diagnosis of vorticity budget primarily analyzed the periods where divergence in typhoon tracks between control (CTRL) and NTDK experiments occurred. The different synoptic environmental fields in the NTDK experiment affected the wavenumber-1 vorticity distribution in the horizontal advection term, thereby enhancing the accuracy of typhoon translation velocity forecasts. This preliminary study suggests that utilizing the NTDK scheme might improve the forecasting skill of TGFS for typhoon tracks. To gain a more comprehensive understanding of the impact of NTDK on typhoon tracks, further examination for more typhoons is still in need.

1. Introduction

Numerical models have achieved a considerable level of forecast capabilities for synoptic-scale weather systems currently. With the advancement of global model resolution, there is also an increasing ability to capture the characteristics of convective structures and the development processes of mesoscale weather systems. The previous generation global forecast system (GFS) at the central weather administration (CWA) [1,2] utilized the non-iteration dimensional-split semi-Lagrangian (NDSL) dynamical core [3,4,5,6]. It employed an octahedral reduced Gaussian grid with TCo639 (~18 km horizontal resolution) and 72 vertical levels topped at 0.1 hPa. Most of the physical parameterizations were based on the GFS physics package from the operational models of the National Oceanic and Atmospheric Administration (NOAA). The grid-scale precipitation was parameterized using the Zhao–Carr microphysics scheme [7]. This version has been operationalized since 2020 and transitioned to a role in climate forecasting in 2023.
In 2019, the National Centers for Environmental Prediction (NCEP) GFS version 15 (v15) was officially launched. This nonhydrostatic model features the finite-volume cubed-sphere (FV3) dynamical core developed by the geophysical fluid dynamics laboratory (GFDL) at NOAA [8,9,10]. The cubed–sphere grid used in the model eliminates the need for the singular polar point presented in traditional global spectral models [11]. According to [12], the FV3-based GFS experiments exhibited statistically significant improvement in 500 hPa geopotential height. The reduction in FV3-based forecast root-mean square error for various metrics was quite remarkable. In addition, the FV3-based GFS showed improved hurricane track forecasts that even outperformed the IFS when superior ECMWF initial conditions (ICs) were used [13]. Recently, the hurricane analysis and forecast system (HAFS) was developed based on NCEP GFS version 16 (v16) to improve hurricane intensity forecasts [14]. The HAFS stand-alone regional model (HAFS-SAR), with a 3-km horizontal resolution, exhibited slower track error growth compared to internationally recognized regional models [15]. Updated from NCEP GFS v15, the Taiwan global forecast system (TGFS) has been launched as the new generation global forecast system by CWA since 2023, providing 16-day weather forecast products. By replacing CWAGFS as the operational model, TGFS forecasts enhance the efficiency and accuracy of predictions and have shown significant improvement in synoptic environment validation. Maintained by CWA, this model offers more flexible adjustment of model settings for regions of concern and real-time provision of model products for forecasting on finer spatial scales.
Since Taiwan is located in the western North Pacific and falls within the typhoon-prone region, the performance of TGFS in typhoon forecasting is an intensively studied research topic [16,17]. In this study, the focus is on the performance of TGFS in typhoon track forecasting. Previous studies have shown that the anomalies of the subtropical ridge and the monsoon trough were significantly related to the tropical cyclone track characteristics [18,19,20,21]. Ref. [22] indicated that the slowdown in typhoon translation velocity may be due to decreased environmental steering flows during 1958 to 2009. The inter-decadal shift in typhoon tracks was mainly attributed to the changes in large-scale steering flows and typhoon formation locations [23]. In addition to the ability of TGFS to capture large-scale environmental characteristics, the utilized cumulus parameterization scheme assumes a particularly crucial role in the interaction between typhoon circulation and the environment due to its relatively lower resolution compared to NCEP GFS. Related research on model cumulus parameterization used to compare the model performances by using the Tiedtke [24] and the Kain–Fritsch schemes. The Tiedtke scheme may have the potential to simulate the typhoon track more accurately with lower mean direct positional error [25,26,27]. The new Tiedtke (NTDK) scheme was modified by replacing the original moisture convergence closure with a convective available potential energy closure [28], which was found to have the potential for more accurate and detailed convective structures.
This study focused on TGFS global forecasts and investigated the track forecast capability of TGFS for typhoons in recent years to clarify the directions for model improvement by comparing results with internationally recognized global models. Forecasts with significant track errors were analyzed, and possible reasons for these errors were speculated upon. Sensitivity tests using the NTDK scheme were conducted to attempt to improve typhoon track errors. The model, data, and diagnostic methodology are described in Section 2. Statistical analysis and sensitivity tests using the NTDK scheme for typhoon track forecasts in TGFS are detailed in Section 3, followed by the conclusions and discussions in Section 4.

2. Model, Data, and Diagnostic Methodology

2.1. The TGFS Model

The global grid configuration of TGFS utilizes a cubed sphere C384T (~25 km grid spacing) with Taiwan at the center of one of the six tiles, along with 64 vertical Semi-Lagrangian layers with the top layer at 0.2 hPa. The detailed information of TGFS is available in Table 1 for reference. Most of the physical parameterizations used are based on NCEP GFS v15, e.g., hybrid eddy-diffusivity mass-flux (EDMF) planetary boundary layer (PBL) scheme [29], Noah land surface model [30,31], orographic and convective gravity wave drag schemes [32,33,34], GFDL microphysics scheme [35,36,37,38,39], and rapid radiative transfer model for general circulation models (RRTMG) shortwave and longwave radiation scheme [40,41]. For deep and shallow convection, the model utilizes a modified version of the new simplified Arakawa–Schubert scheme (NSAS) with scale-aware parameterization [42,43] to update the original scheme [44,45,46,47,48]. The surface physics were updated based on NCEP GFS v16, and the land use data were adjusted for higher-resolution data. The soil types and vegetation types were identified using moderate-resolution imaging spectroradiometer (MODIS) data in 2010, consistent with those in the operational weather research and forecasting model (WRF) of the CWA. In addition, the vegetation fraction data obtained by utilizing the satellite application facility for land surface analysis (LSASAF) from the European Organization for the Exploitation of Meteorological Satellites (EUMETSAT) could help improve the forecast performances of TGFS.

2.2. Statistical Analysis and Experimental Design

Subsequent analysis would compare the forecasts with those of other recognized global models, i.e., NCEP GFS and the internal family systems model (IFS). Different dynamical and physical options, as well as model resolution, crucially affect their performance. The horizontal and vertical resolutions of TGFS, as mentioned, are the results of decision making based on operational resources of the CWA, which is continuously making progress. In comparison, the horizontal resolution of NCEP GFS in the current operational version is 13 km, with 127 vertical layers and a model top raised to 0.01 hPa, while the IFS is set at 9 km horizontally with 137 vertical layers (also with a model top at 0.01 hPa).
The control experiments (hereafter called CTRL) were utilized for the official operational forecast products of TGFS, focusing on typhoon track forecast data for the first 120 h during the periods of selected typhoon cases in 2022 and 2023. In addition, the sensitivity tests by employing the NTDK scheme for deep convection in this study were integrated for 120 h without data assimilation. TGFS analysis data were utilized as the ICs in those experiments. All other physical settings remained consistent with the control experiments.

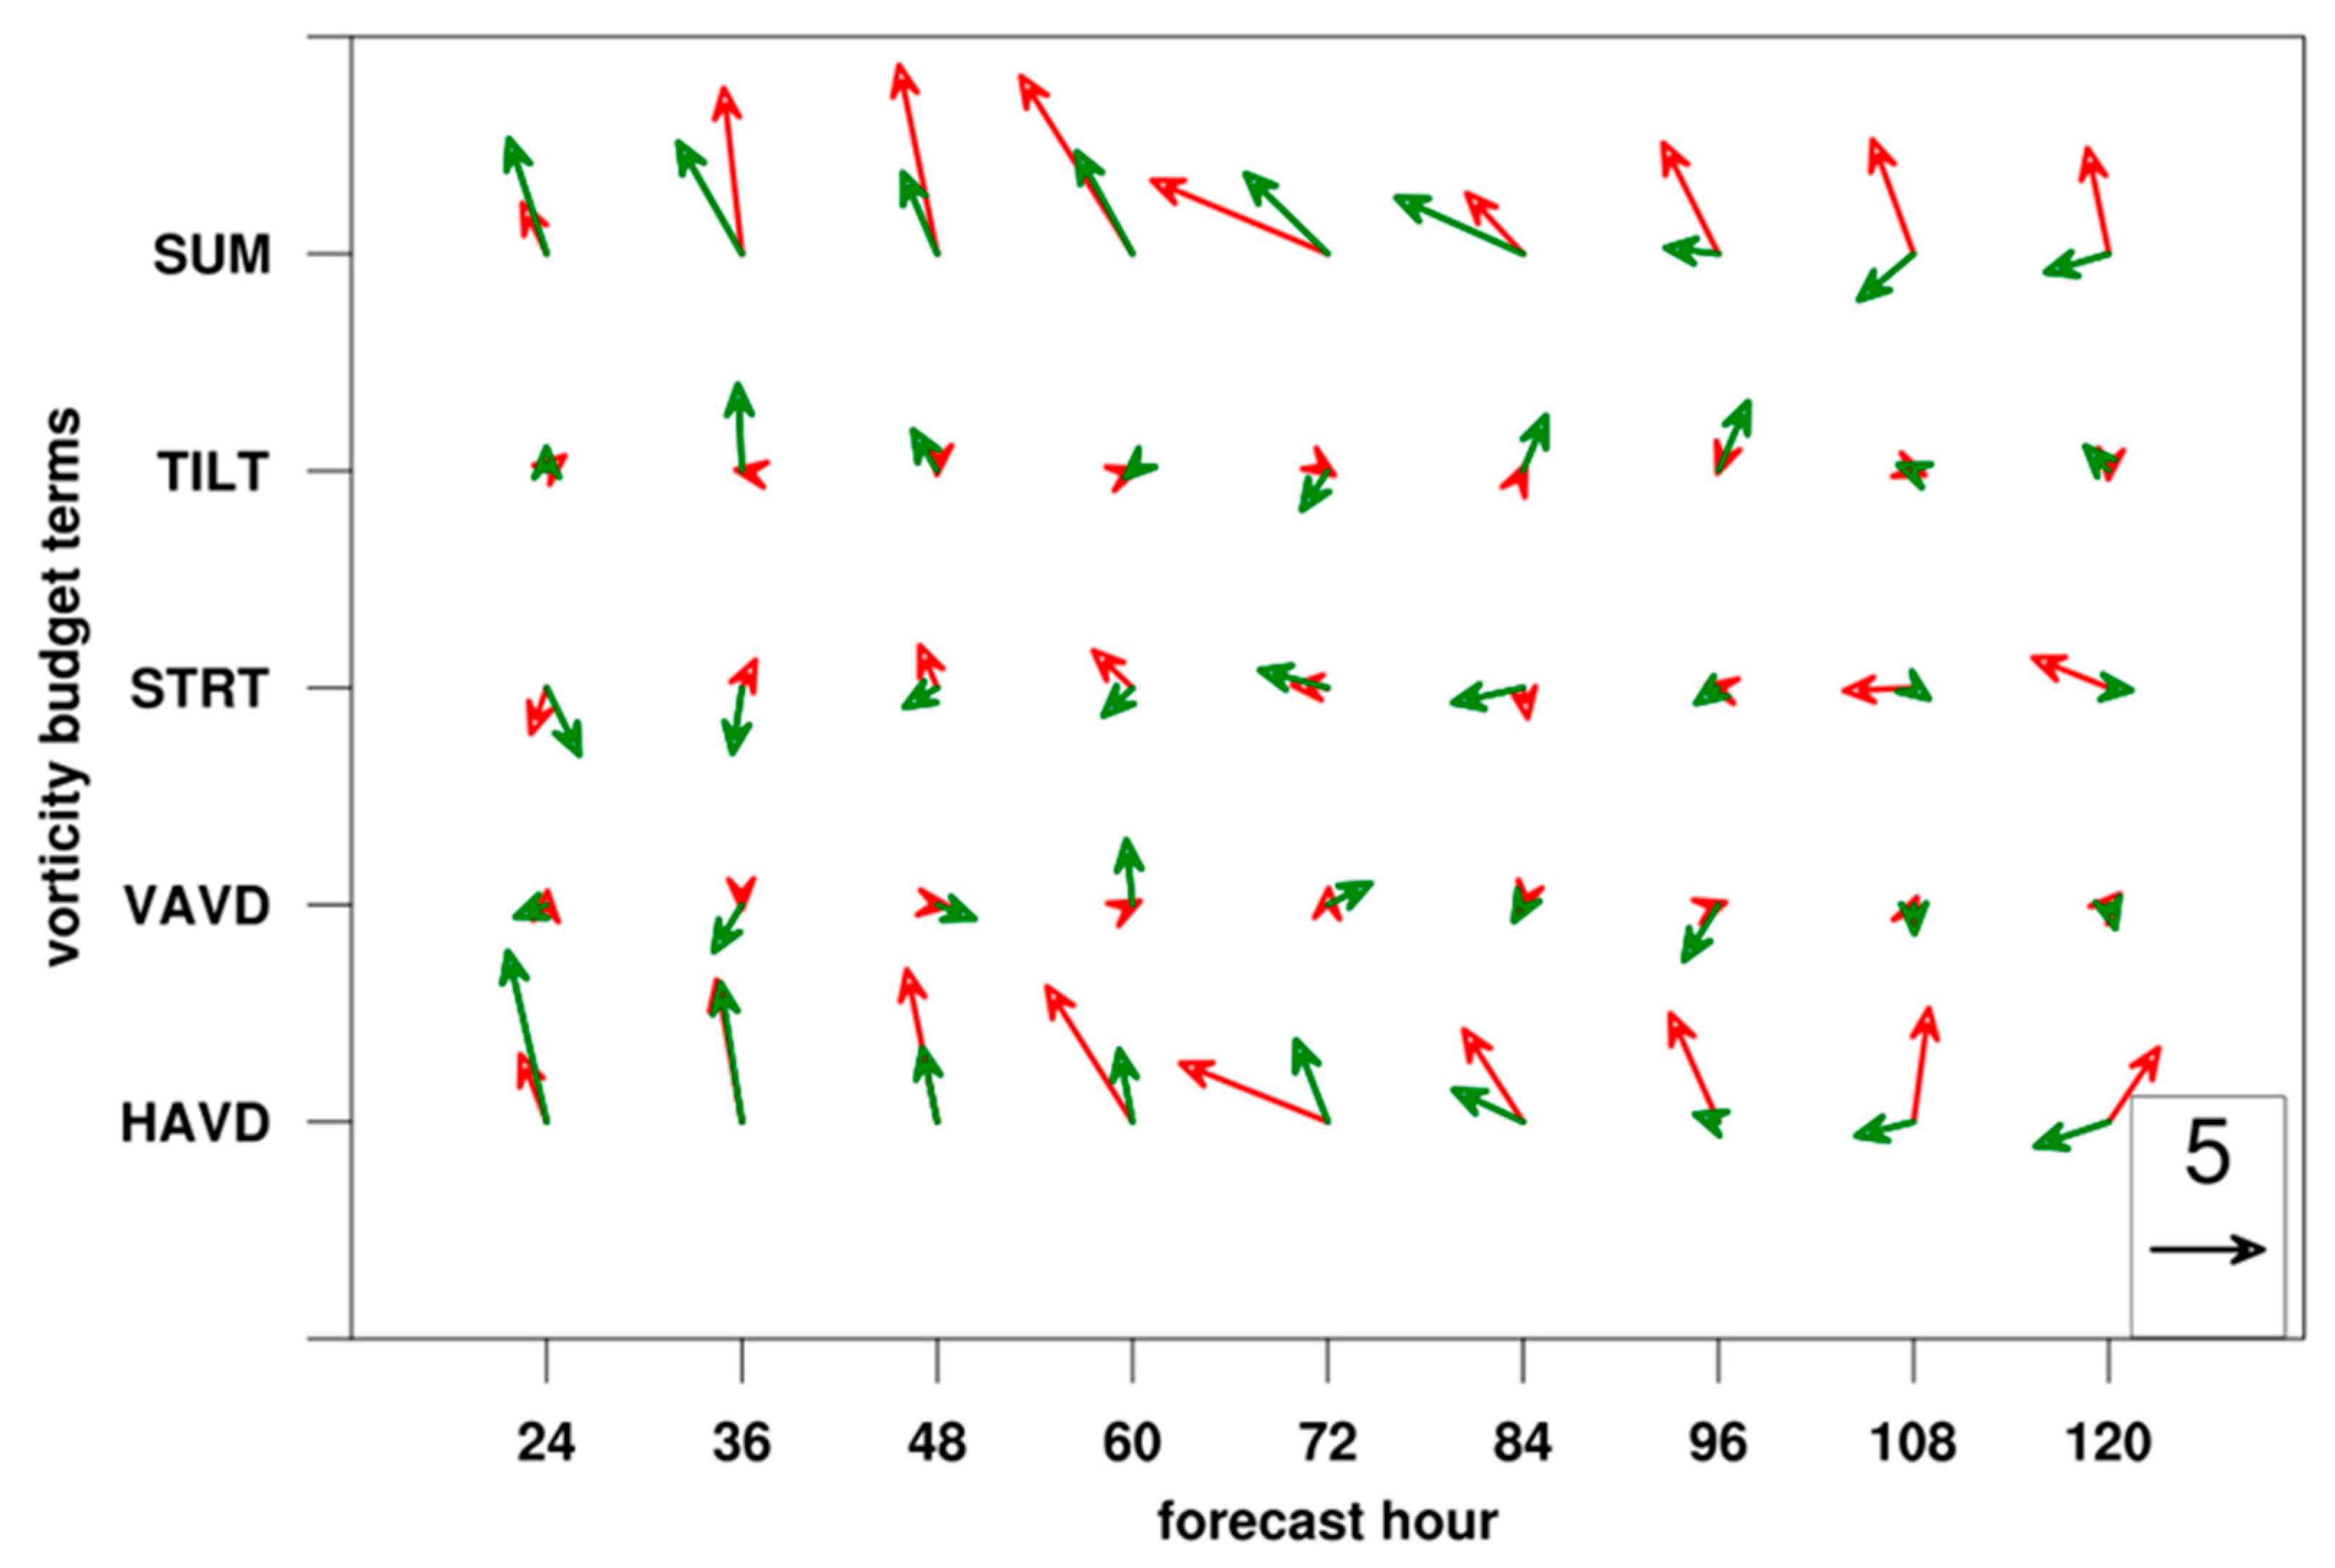
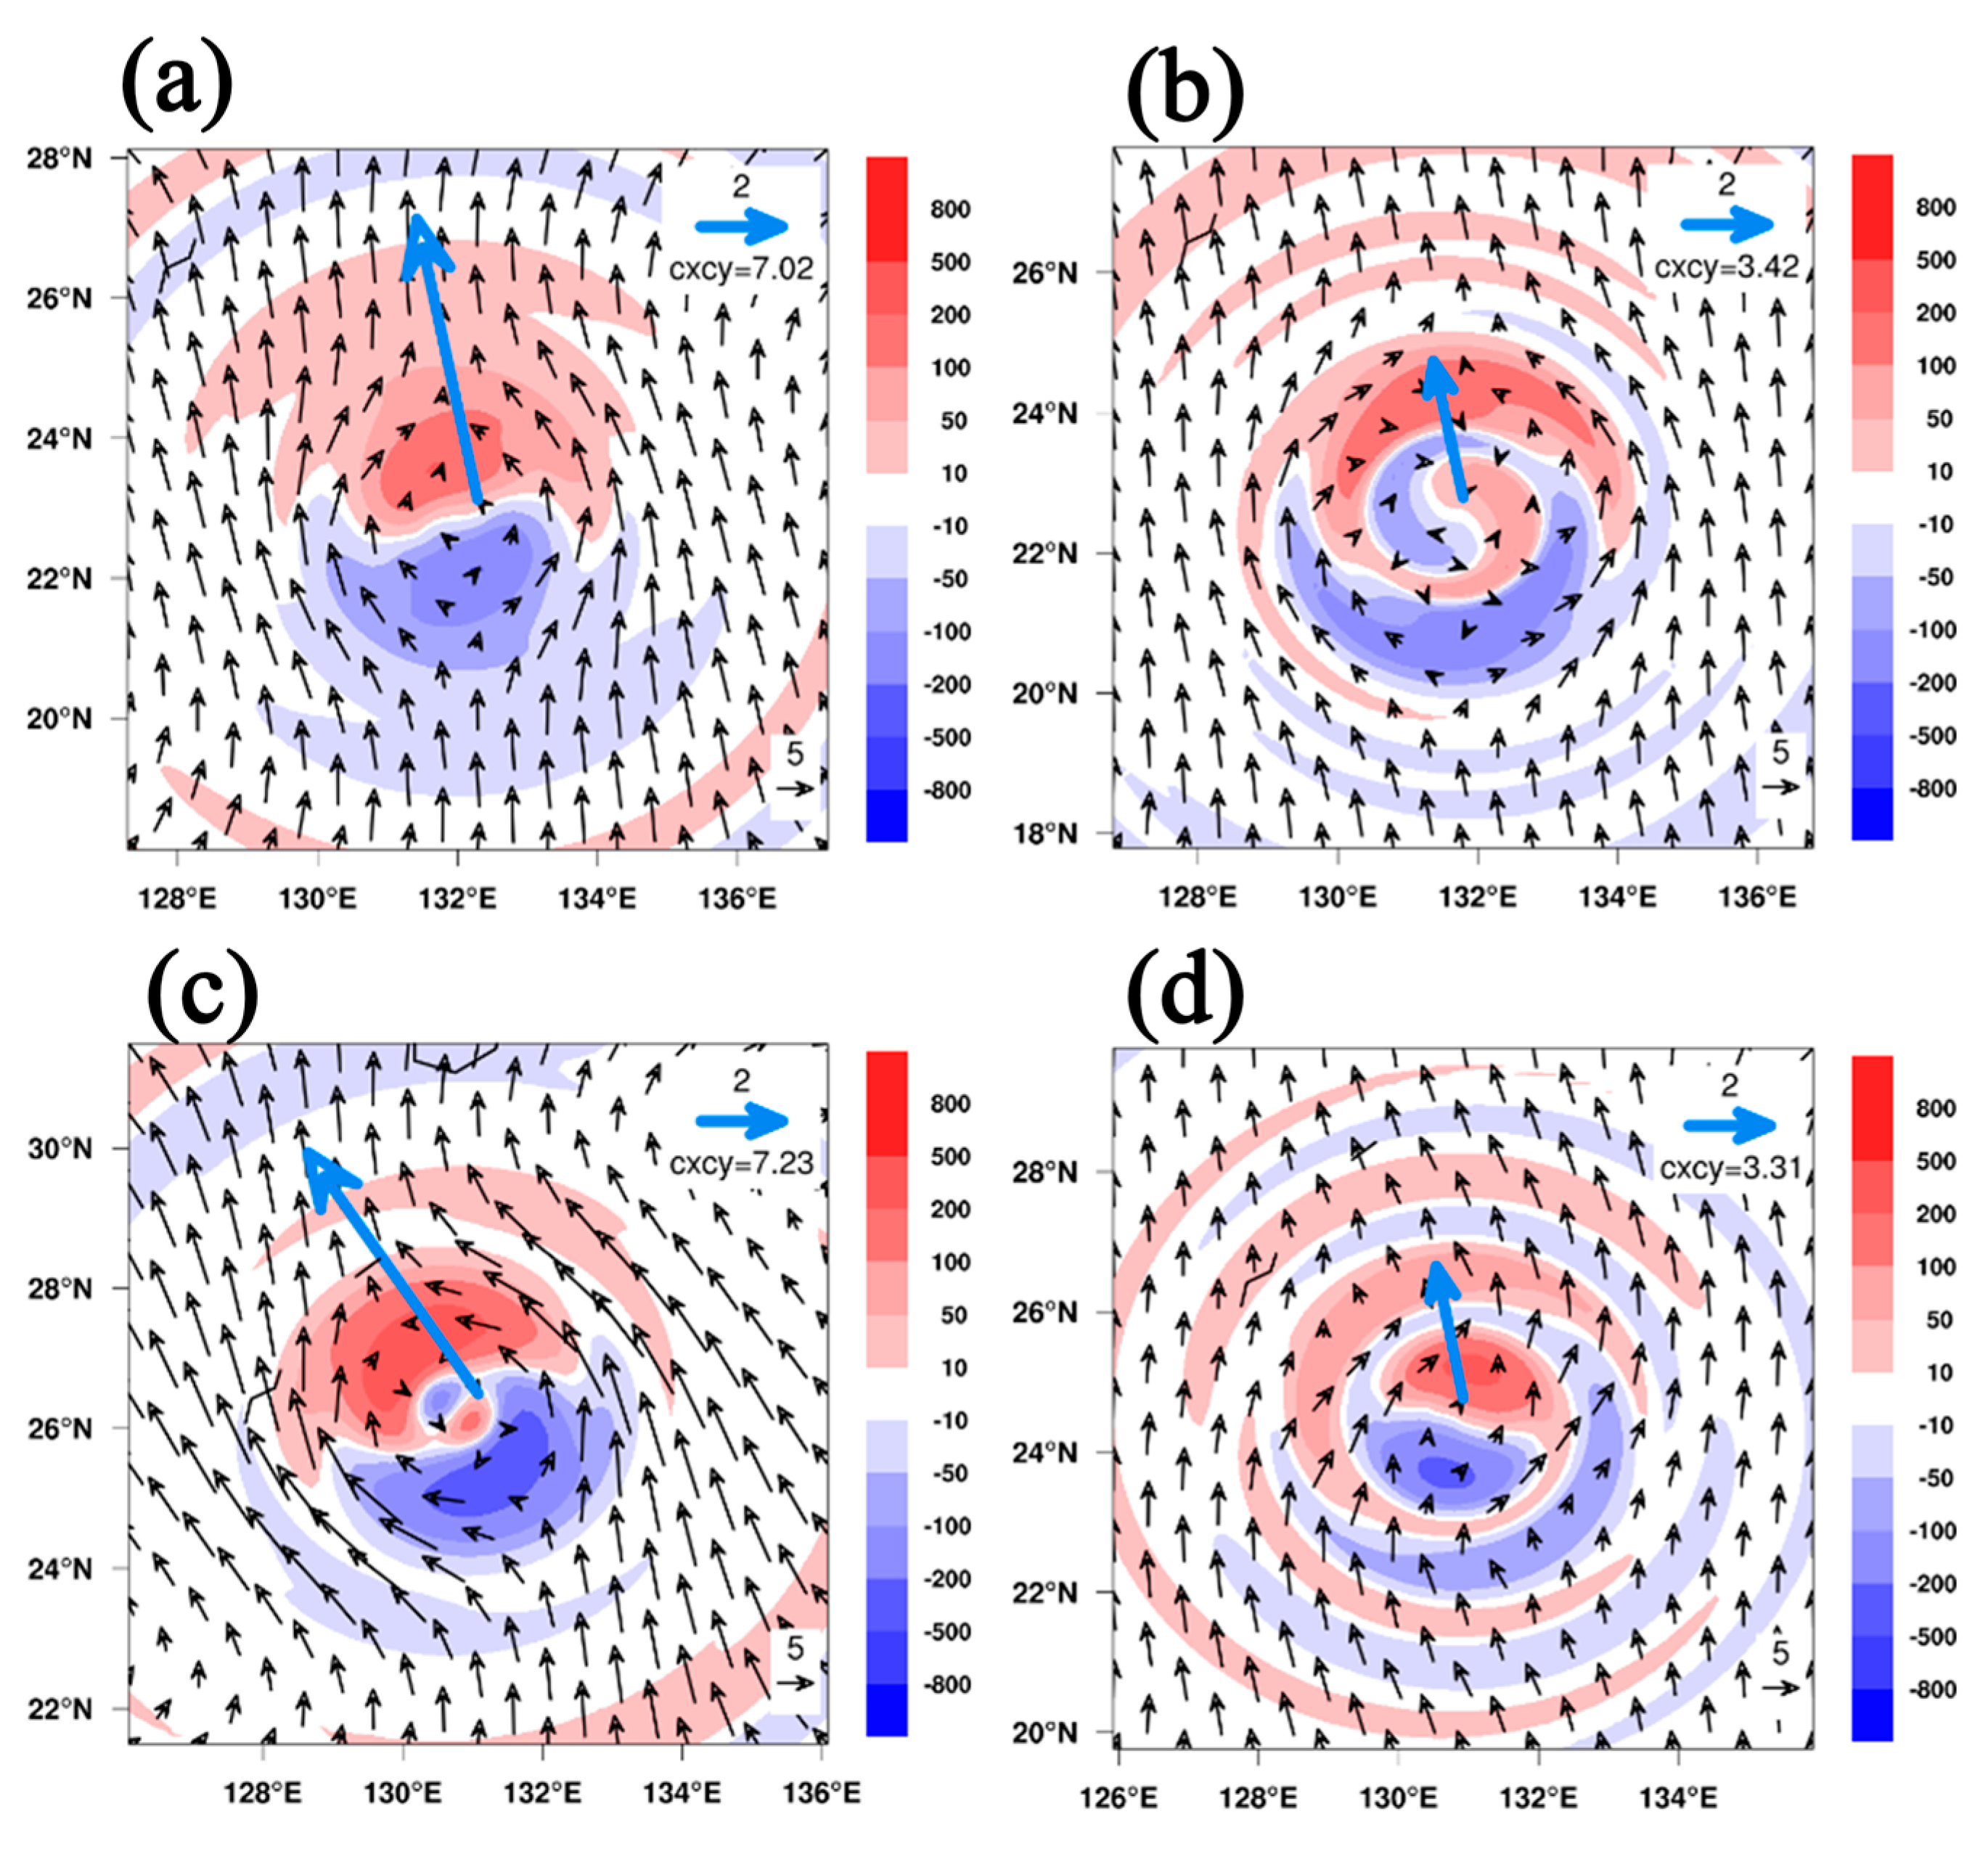
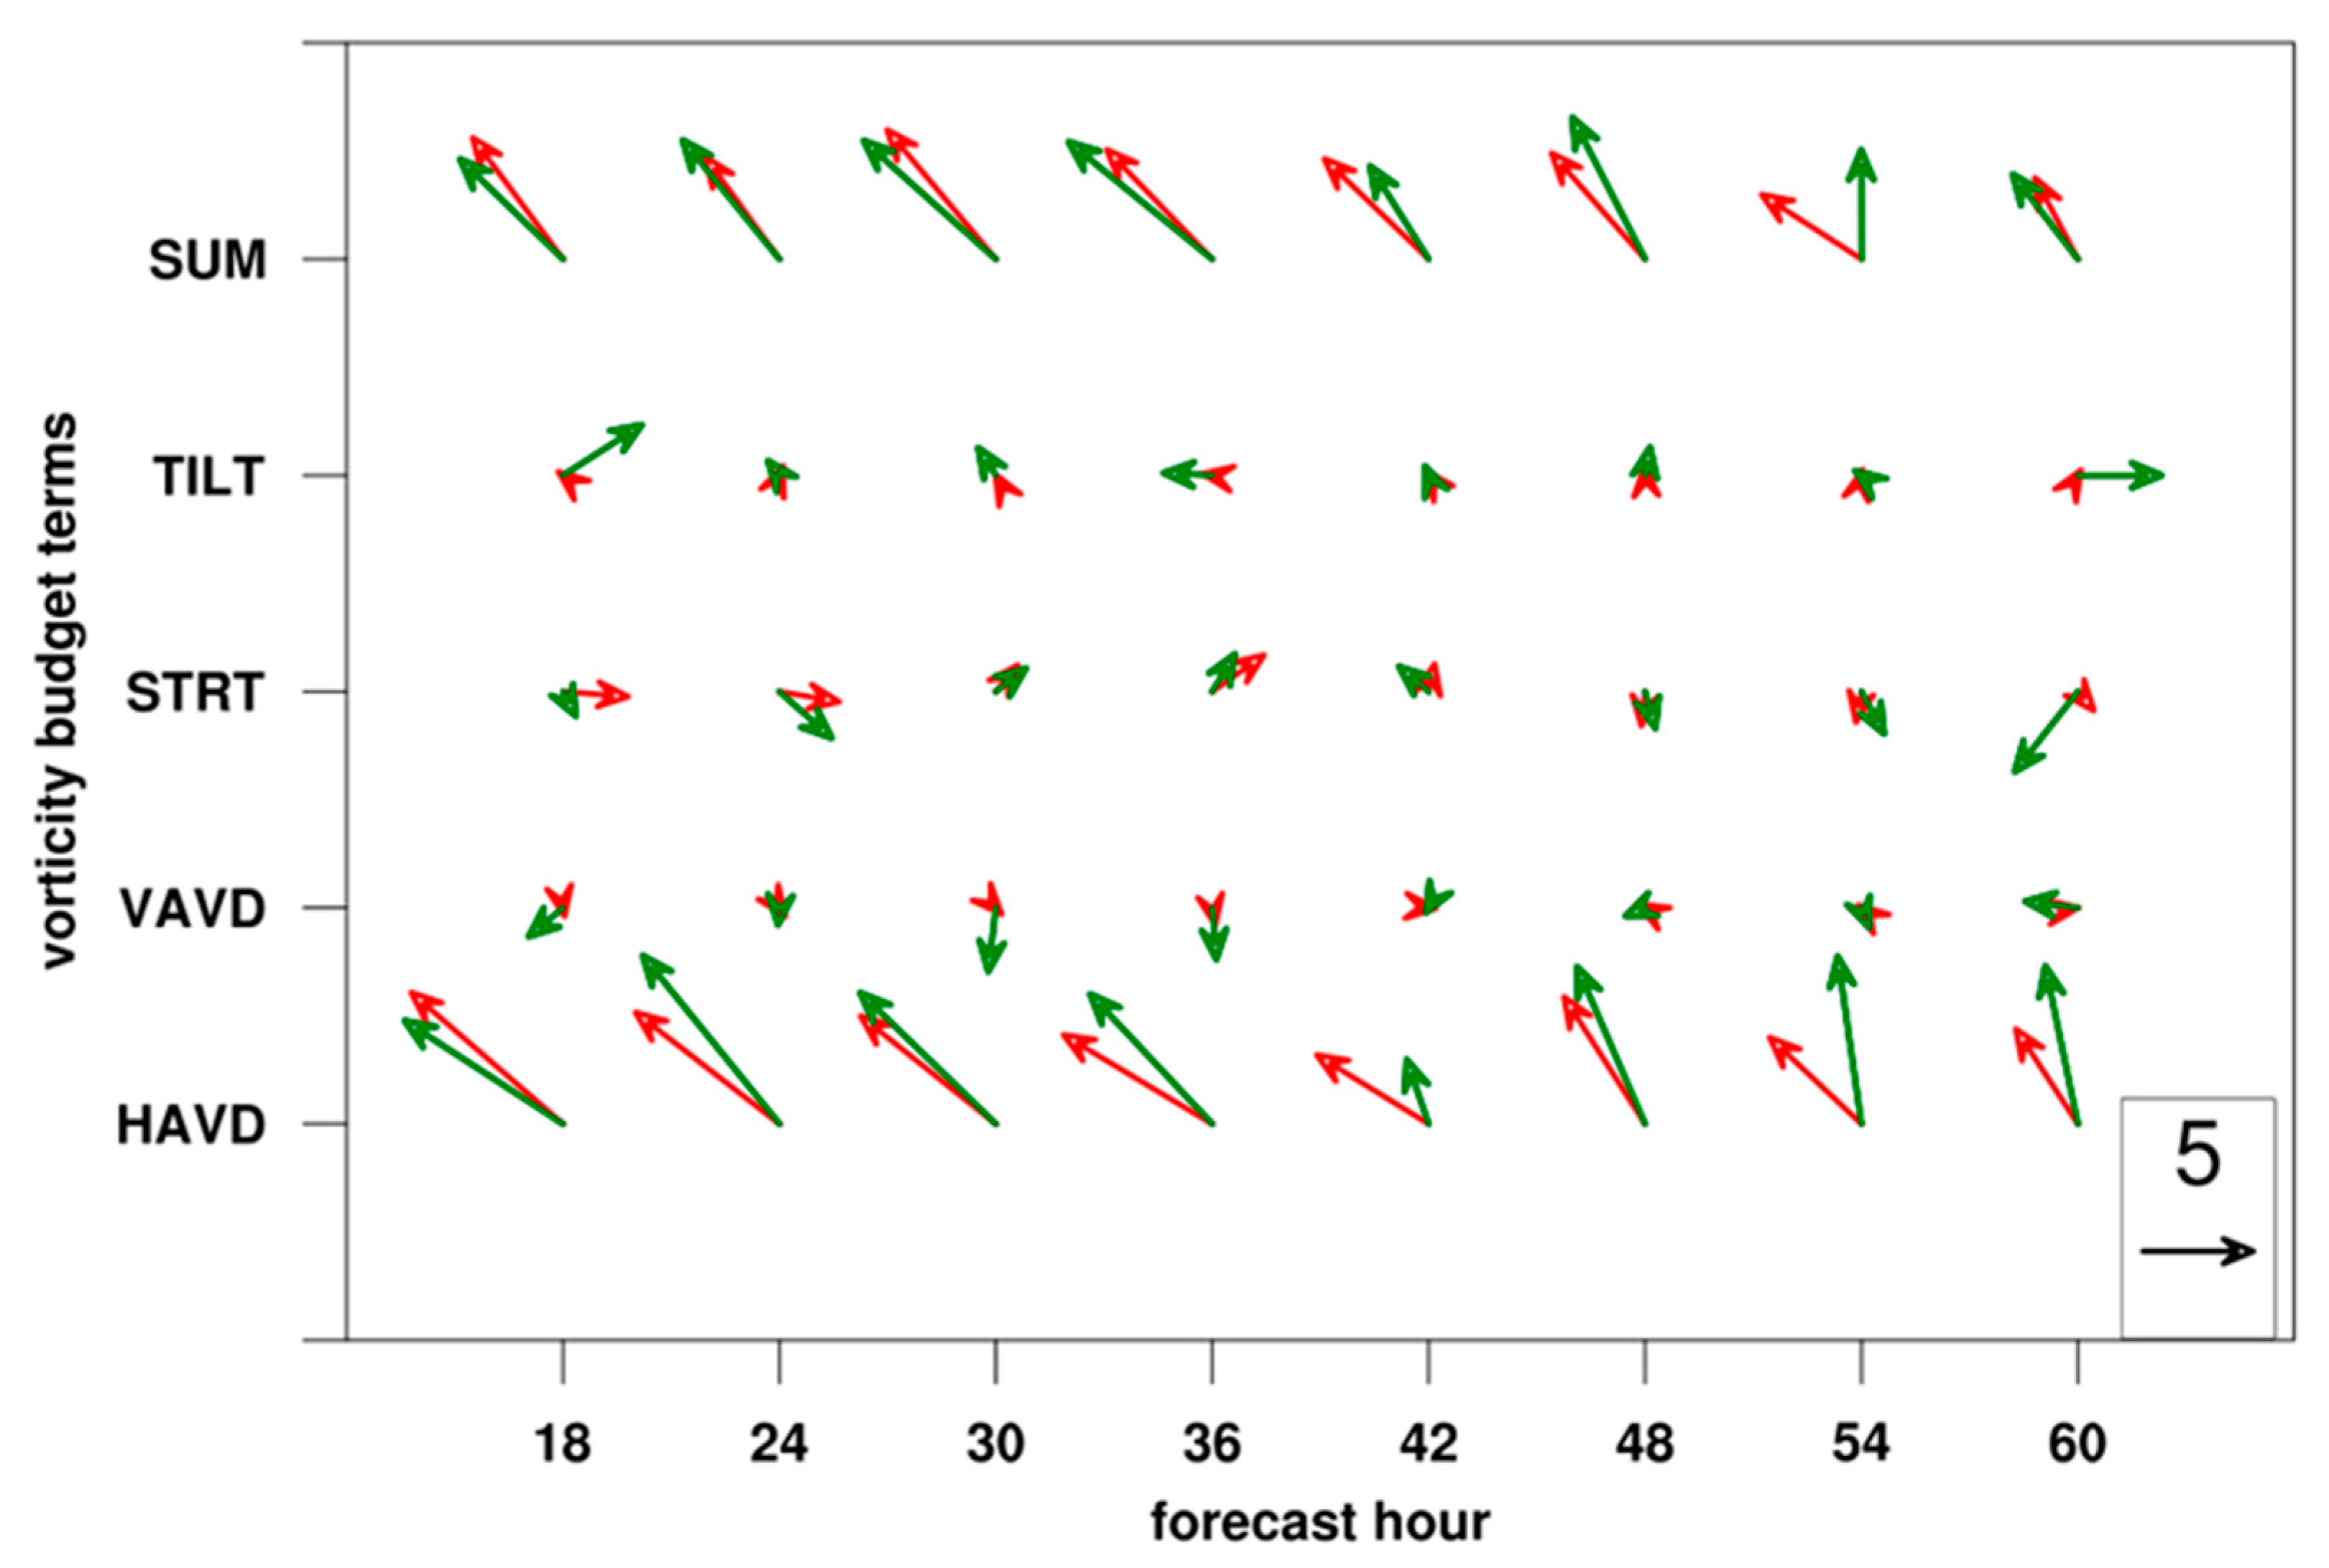
2.3. Diagnosis of Vorticity Budget and Regressed Typhoon Motion

This study employed the diagnostic method of decomposed wavenumber-1 vorticity budget for understanding typhoon motion in model results. The equation of absolute vorticity ζ + f is given by:
                       t ζ + f = V · ζ + f w ζ z ζ + f u x + v y w x v z w y u z + 1 ρ 2 ρ x p y ρ y p x ,        
where ζ = v x + u y represents the relative vorticity, f represents the planetary vorticity, V is the horizontal wind vector with u , v components, w is the vertical wind vector, ρ is density, and p is pressure. The local time change rate of the absolute vorticity is on the left-hand side of Equation (1). The terms that represent contributions from vorticity horizontal advection, vorticity vertical advection, vorticity stretching, vorticity tilting, and solenoidal effects are on the right-hand side, respectively. For diagnosis, the model output was interpolated to Cartesian coordinates with a grid resolution of 0.125° × 0.125° for latitude and longitude and a uniform vertical resolution of 200 m. Therefore, the decomposed vorticity budget was calculated to identify the roles of each term in Equation (1) in affecting the typhoon motion. The axis-symmetric component (wavenumber-0) and the azimuthal wavenumber-1 component of vorticity were obtained by selecting data heights ranging from 1 to 8 km and a 5° radius around the typhoon center for calculation.
By applying the regression method described in [49], the typhoon moving speed attributed to various physical processes in Equation (1) could be quantified. The equations for the zonal and meridional components of the typhoon moving speed, based on the decomposed wavenumber-1 vorticity budget, are given by:
C x = i = 1 N ζ 0 ¯ x i ζ 1 ¯ t i i = 1 N ζ 0 ¯ x i 2 ,  
and
C y = i = 1 N ζ 0 ¯ y i ζ 1 ¯ t i i = 1 N ζ 0 ¯ y i 2 ,  
where N represents all the grid points in the specified analysis area, the bar indicates vertical mean, and the subscripts 0 and 1 represent wavenumber-0 and wavenumber-1 components, respectively. Therefore, the contributions from each physical process to typhoon motion could be quantified for detailed analysis. The same diagnostic method was utilized in related studies [16,50].

3. TGFS Typhoon Track Forecast and Cumulus Parameterization Tests

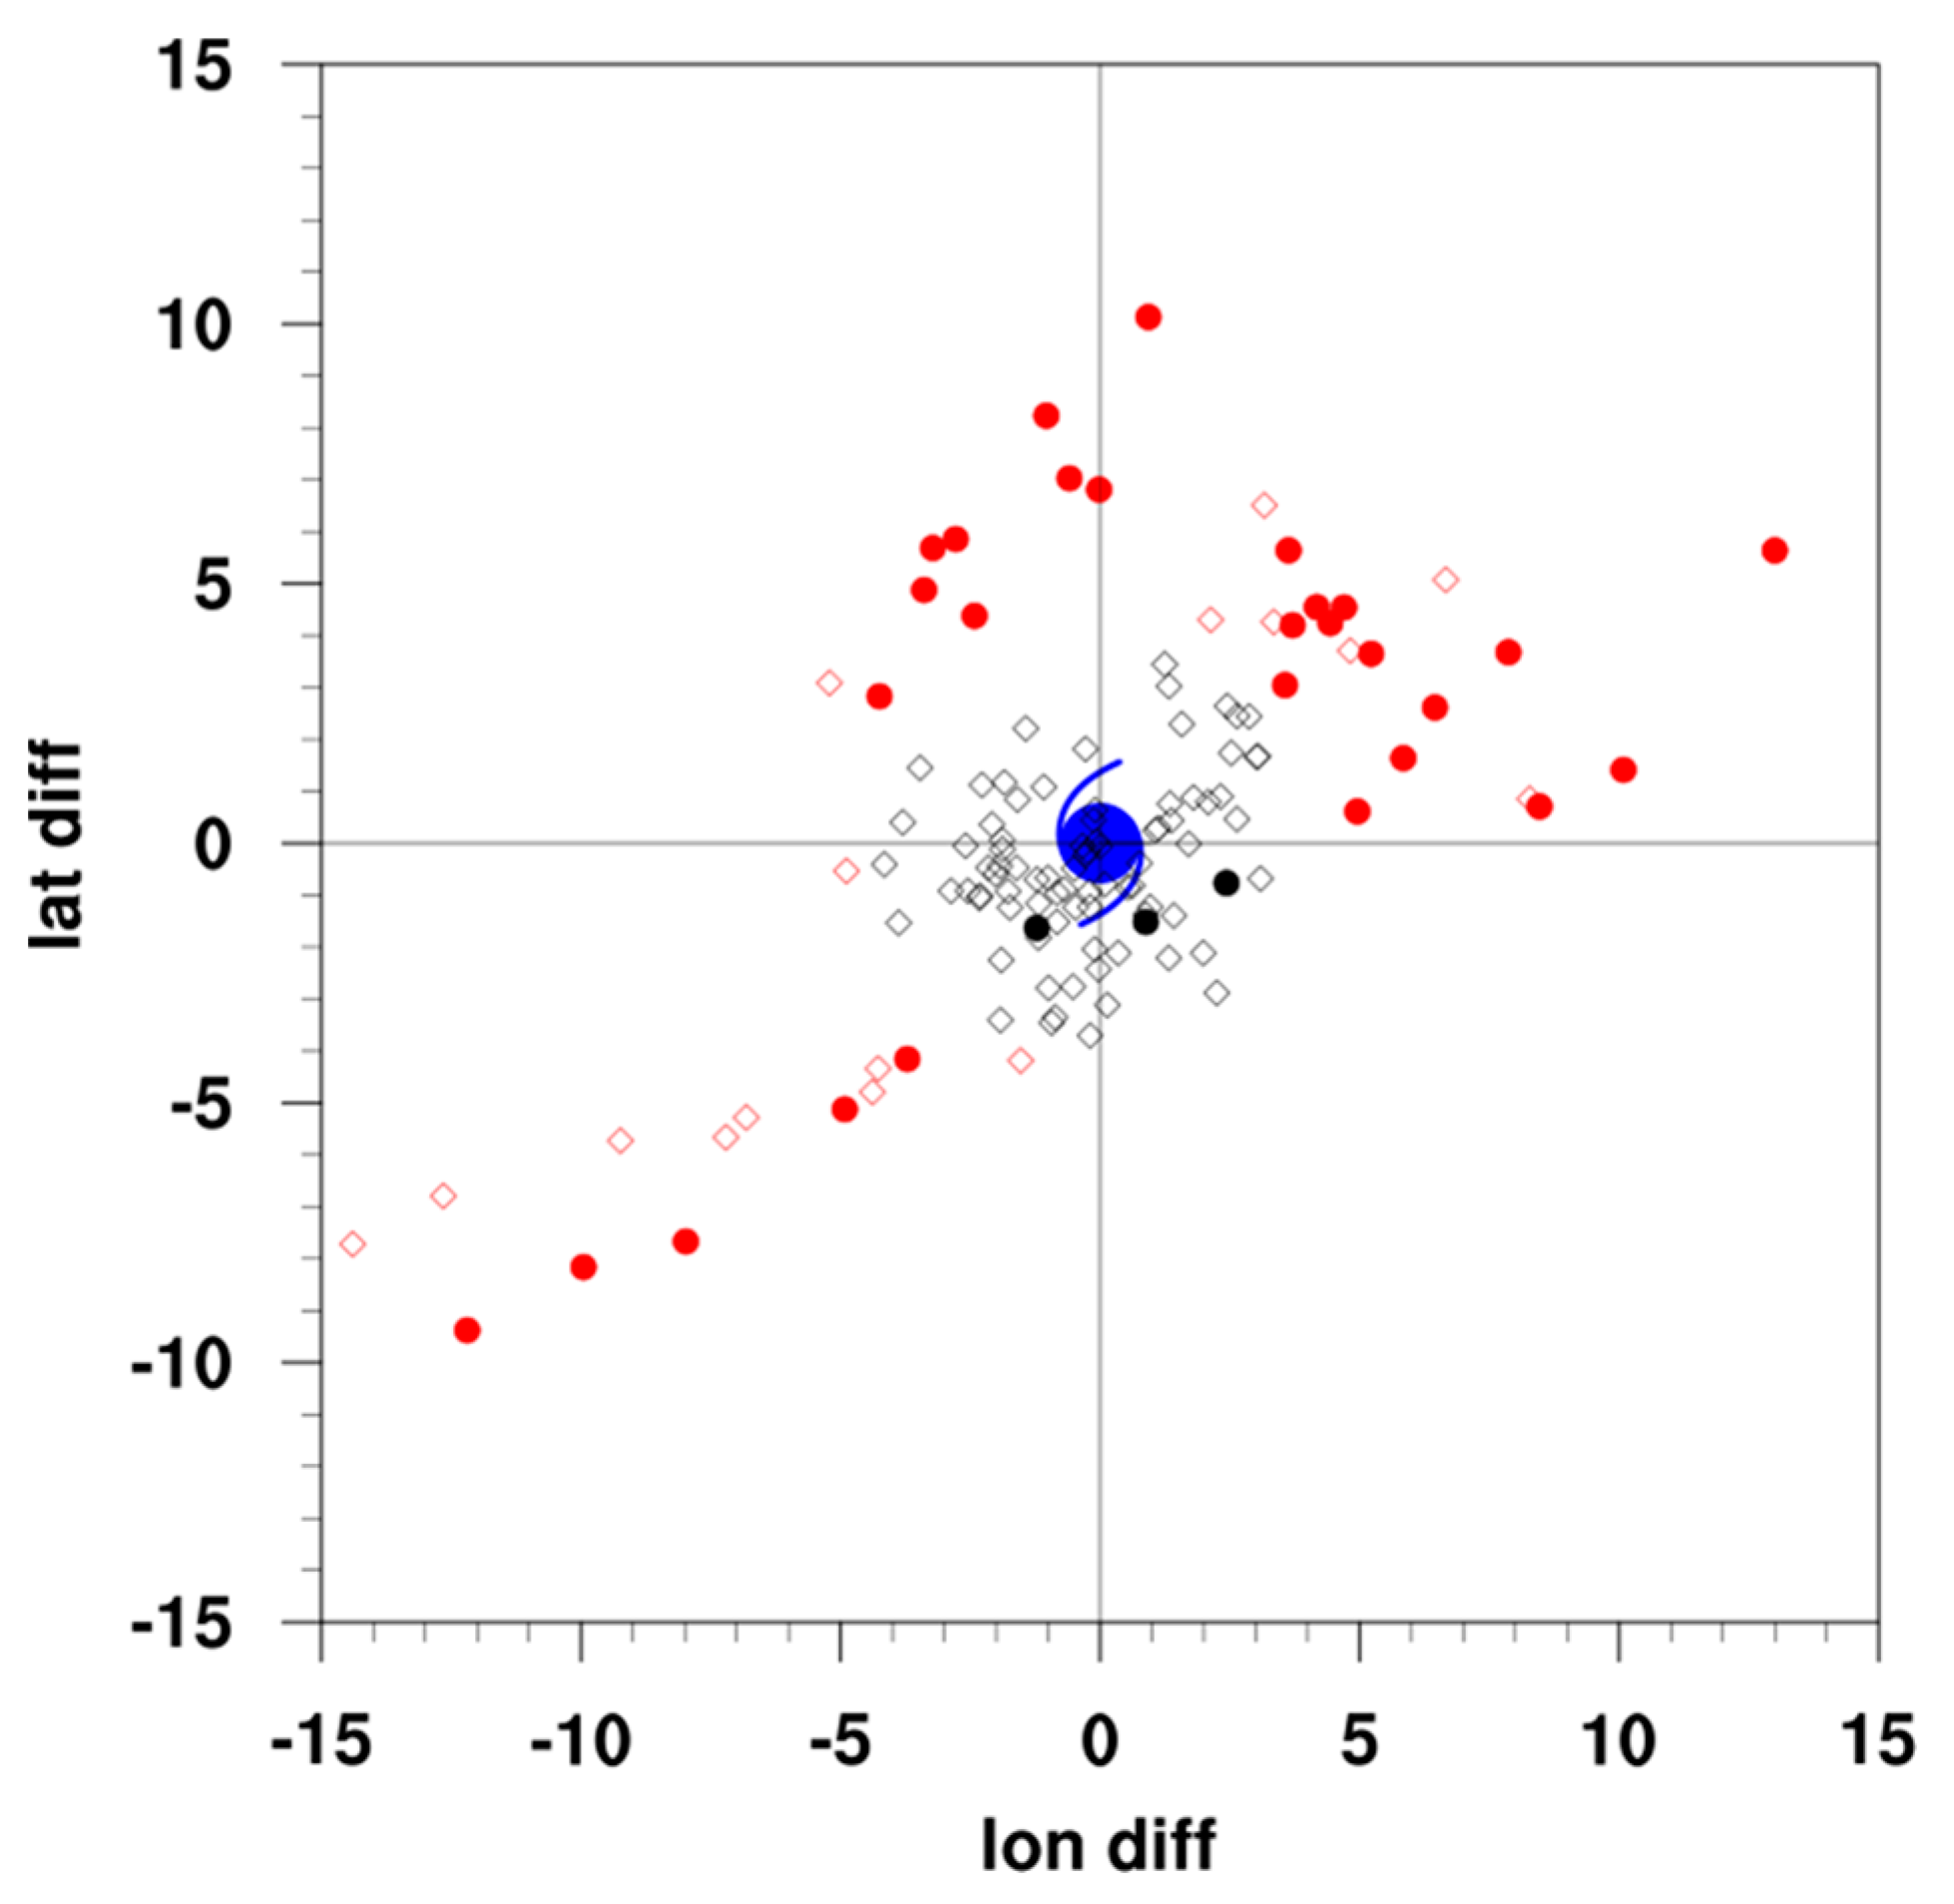
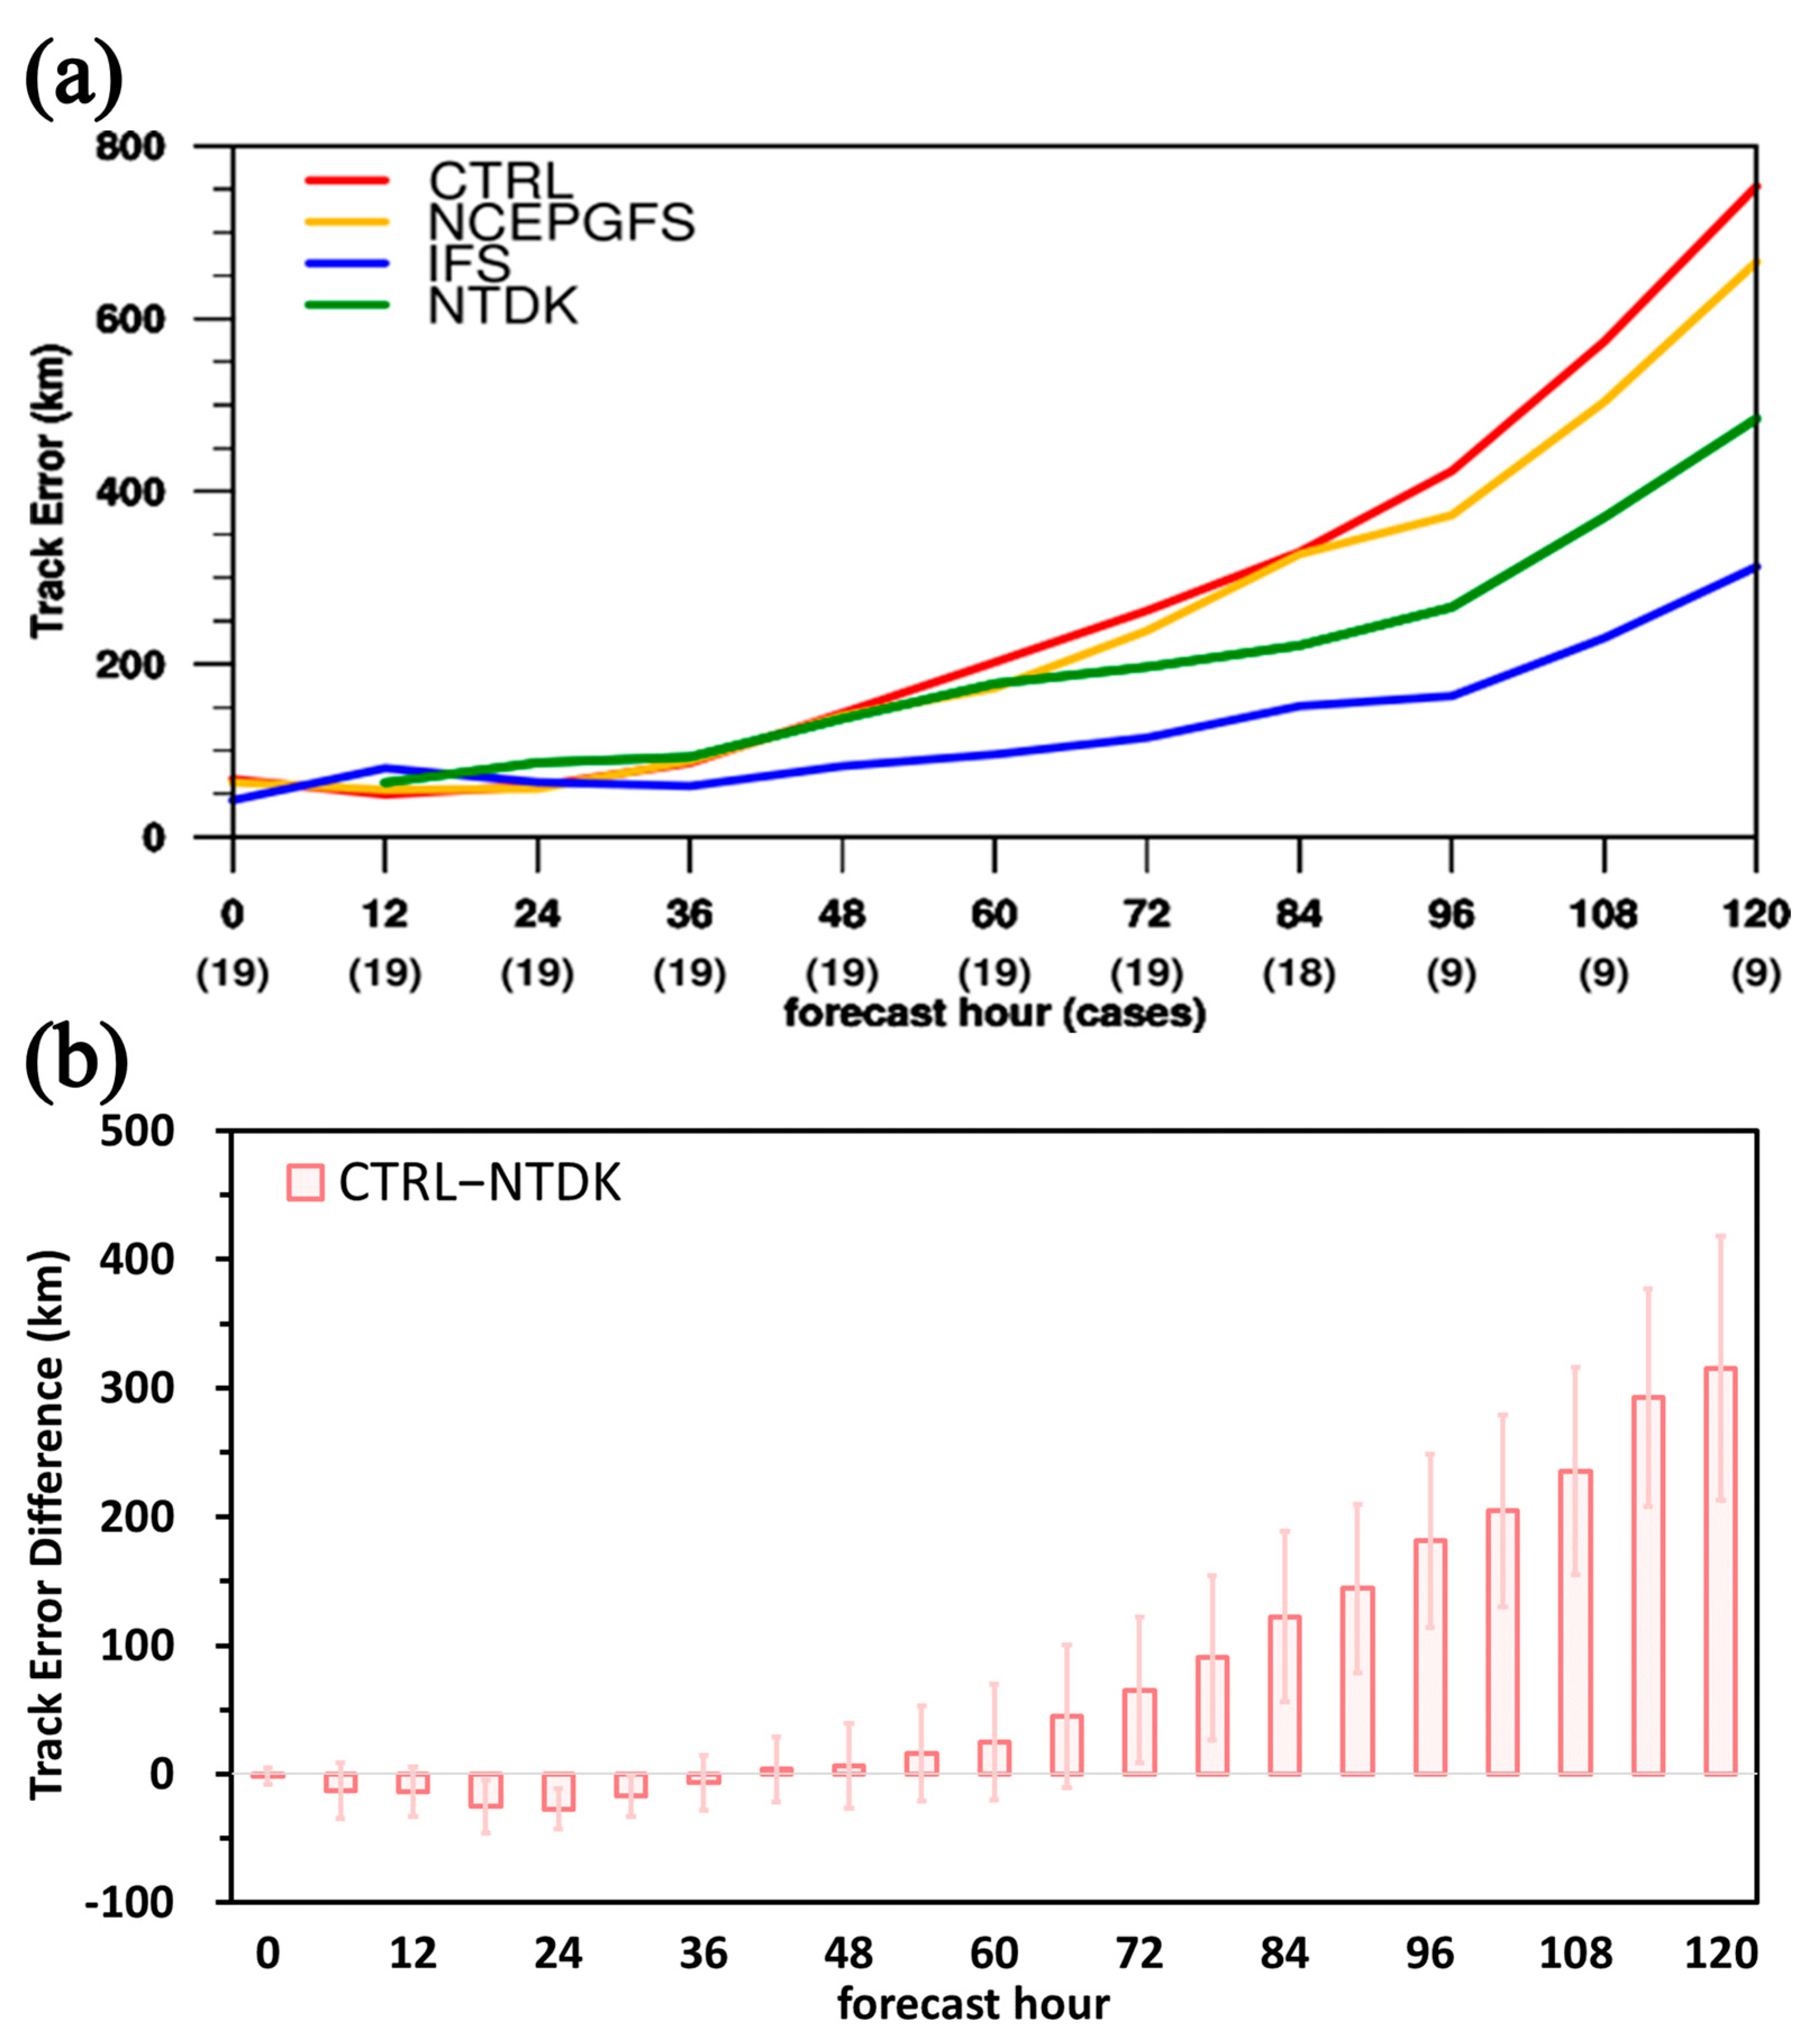
3.1. Statistical Analysis of Typhoon Track Error

In this study, we focused on all the western North Pacific typhoons in 2022 and 2023. The forecast data from four global forecast systems, i.e., TGFS, NCEP GFS, IFS, and CWAGFS, were homogenized for statistics and comparisons. Based on the best track data from CWA, track error was calculated for a total of 466 date–time groups (DTGs) (Figure 1). By comparison, as two internationally recognized global forecast systems, IFS and NCEP GFS performed excellently in typhoon track forecasts, with track error not exceeding 340 km for 120 h forecasts. TGFS replaced CWAGFS as the new generation of the global forecast system in Taiwan, with improved typhoon track forecasting results, but it requires further continuous development.
The typhoon track errors from the 120 h forecasts of TGFS were further analyzed. A total of 127 DTGs where typhoon data remained complete were selected (Figure 2), and their mean error equaled 417.1 km at the 120th forecast hour. For the 44 among them with track errors greater than the average, as many as 29 (red solid dots) initiated with mild typhoon category conditions (17.2 to 32.6 m s−1), representing the 65.9% of the forecasts with such initial conditions. This indicates that many forecasts with large 120 h track errors began during the early stages of typhoon formation when the typhoon was just starting to develop with relatively weak intensity. Conversely, among the 83 DTGs with track errors below the average, only three of them initiated during the mild typhoon intensity stage, accounting for only 3.6% of those DTGs with relatively small track errors. In fact, the typhoon intensity and track error were found to be negatively correlated, i.e., larger track error associated with weaker intensity [51]. In addition, [52] indicated that the model performed better for initially strong and large typhoons.
Furthermore, we found that the typhoon tracks in those 29 DTGs, which are represented by red dots in Figure 2, tended to deviate northward or eastward. It was hypothesized that when the model did not follow correctly the location and intensity changes in the western Pacific subtropical high (WPSH), the forecast typhoon movement direction may further deviate from reality due to the affected environmental steering flow. The northward- or eastward-biased tracks may result from the insufficient extent of the WPSH pattern in TGFS, which needs further analysis.
The capability of the model to represent the extent of the WPSH pattern seems to affect the prediction of typhoon movement in the model. Comparing the forecast characteristics of the synoptic environments from June to October in 2022 and 2023 among three global models, i.e., TGFS, NCEP GFS, and IFS, while also considering the ECMWF Reanalysis v5 (ERA5) data as one of the best reanalysis datasets for representing atmospheric characteristics, differences were revealed in their predictions. As indicated by the 500 hPa geopotential height field from ERA5 (Figure 3), the WPSH pattern extended further westward in IFS compared to the other two models. In contrast, the lack of extension of the WPSH was shown in both NCEP GFS and TGFS forecasts, with the 5880 gpm contour located east of Taiwan.
For TGFS, since it is constrained by lower model resolution than NCEP GFS, assimilating fewer observational data, and other factors, its forecast performances may fall short of expectations. In the early stages of typhoon development, unmatured typhoon structures underscored the crucial role played by steering flows. Therefore, it could be inferred that the incorrect environmental steering guidance due to the insufficient extent of the WPSH pattern may be the cause of the large northward or eastward track errors.

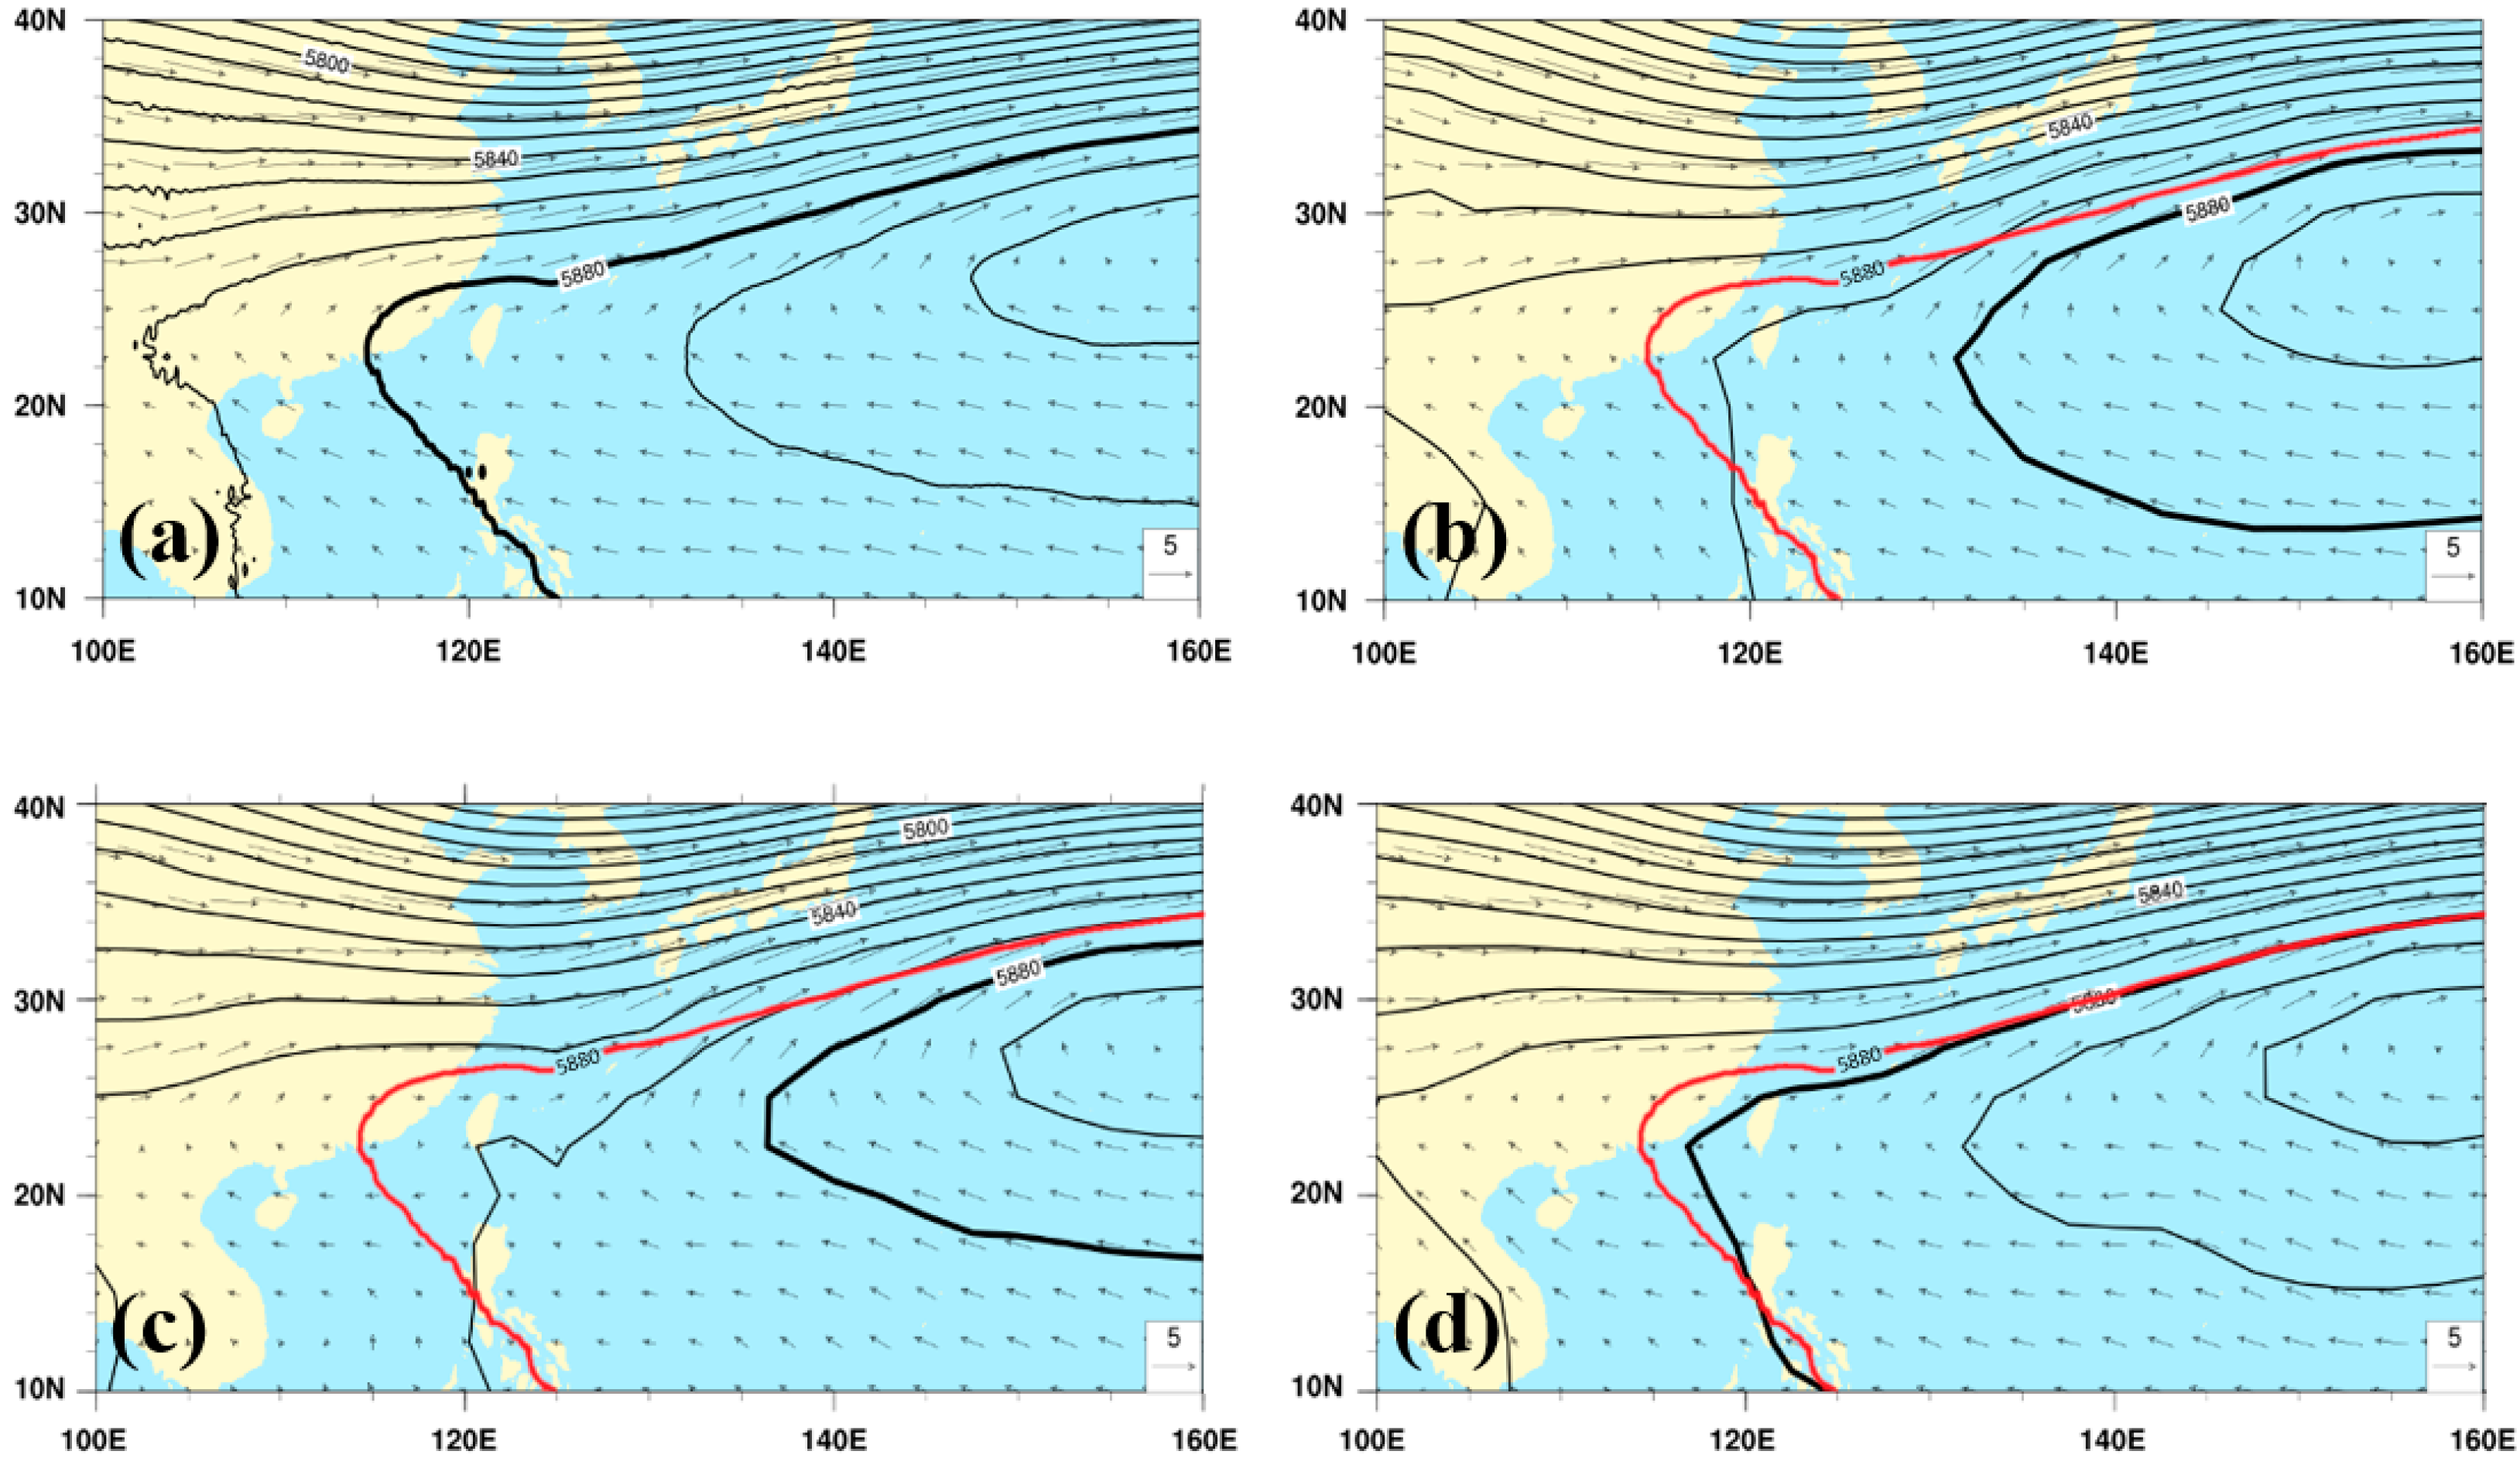
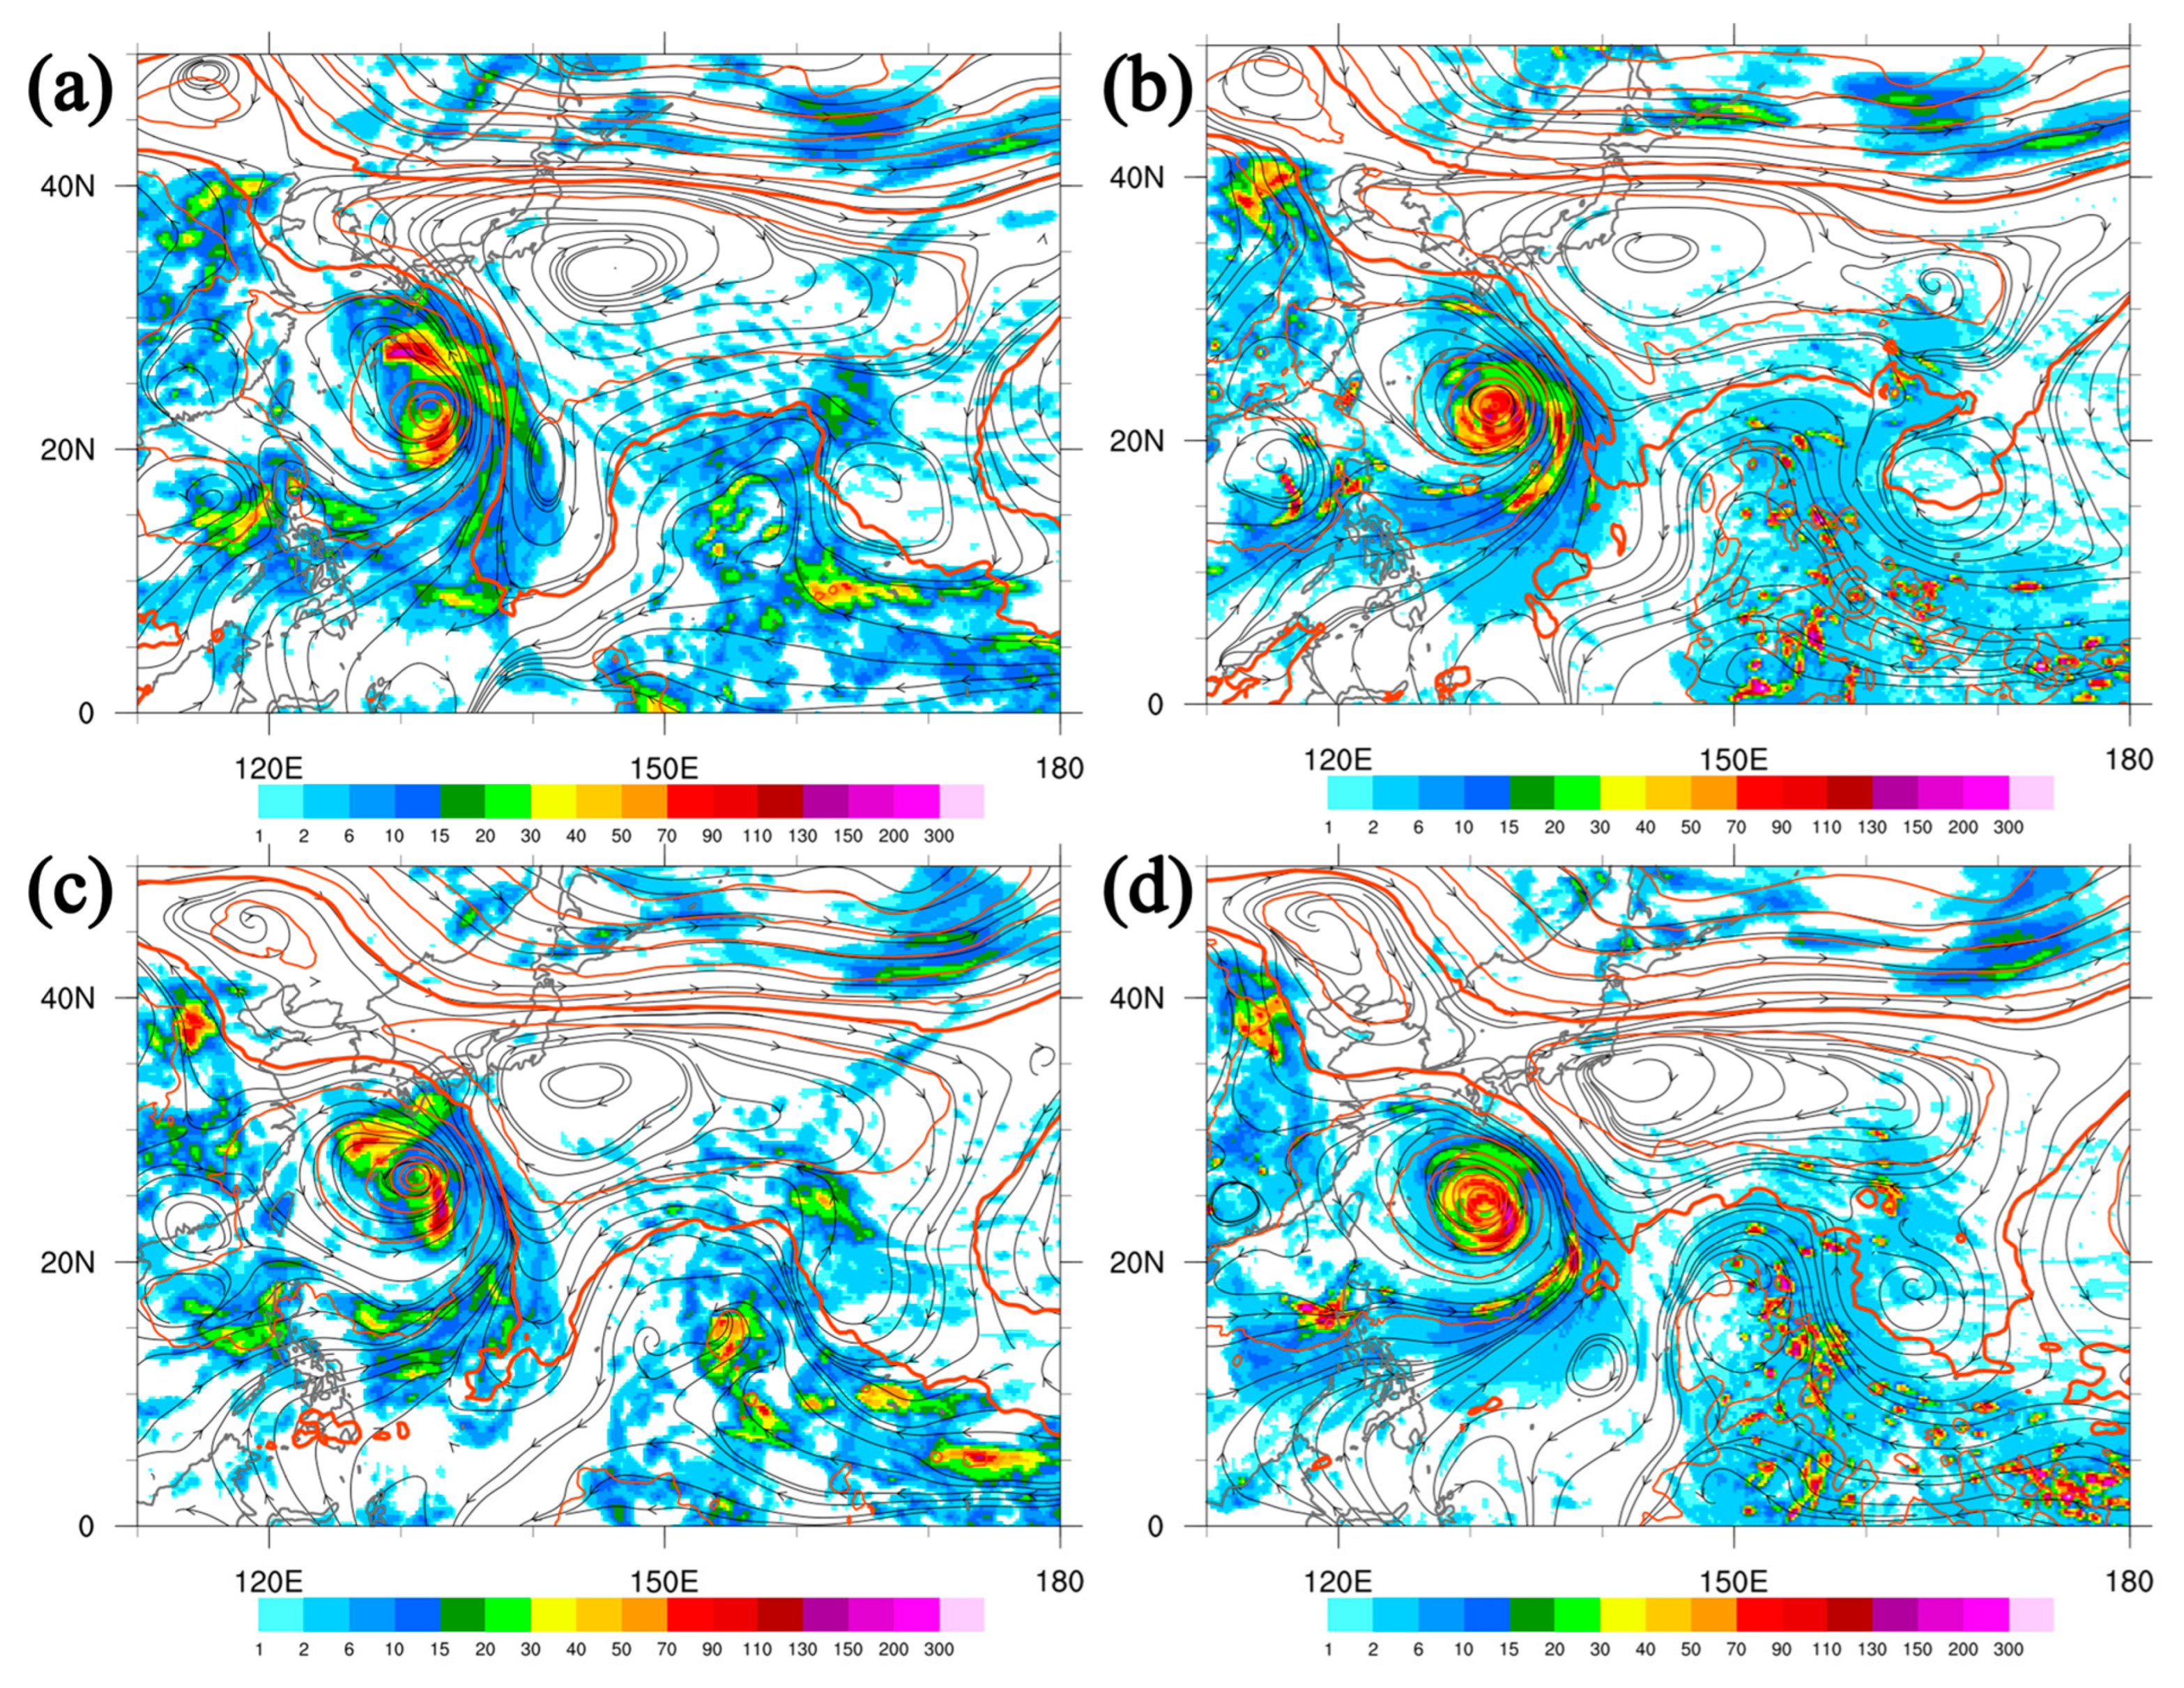
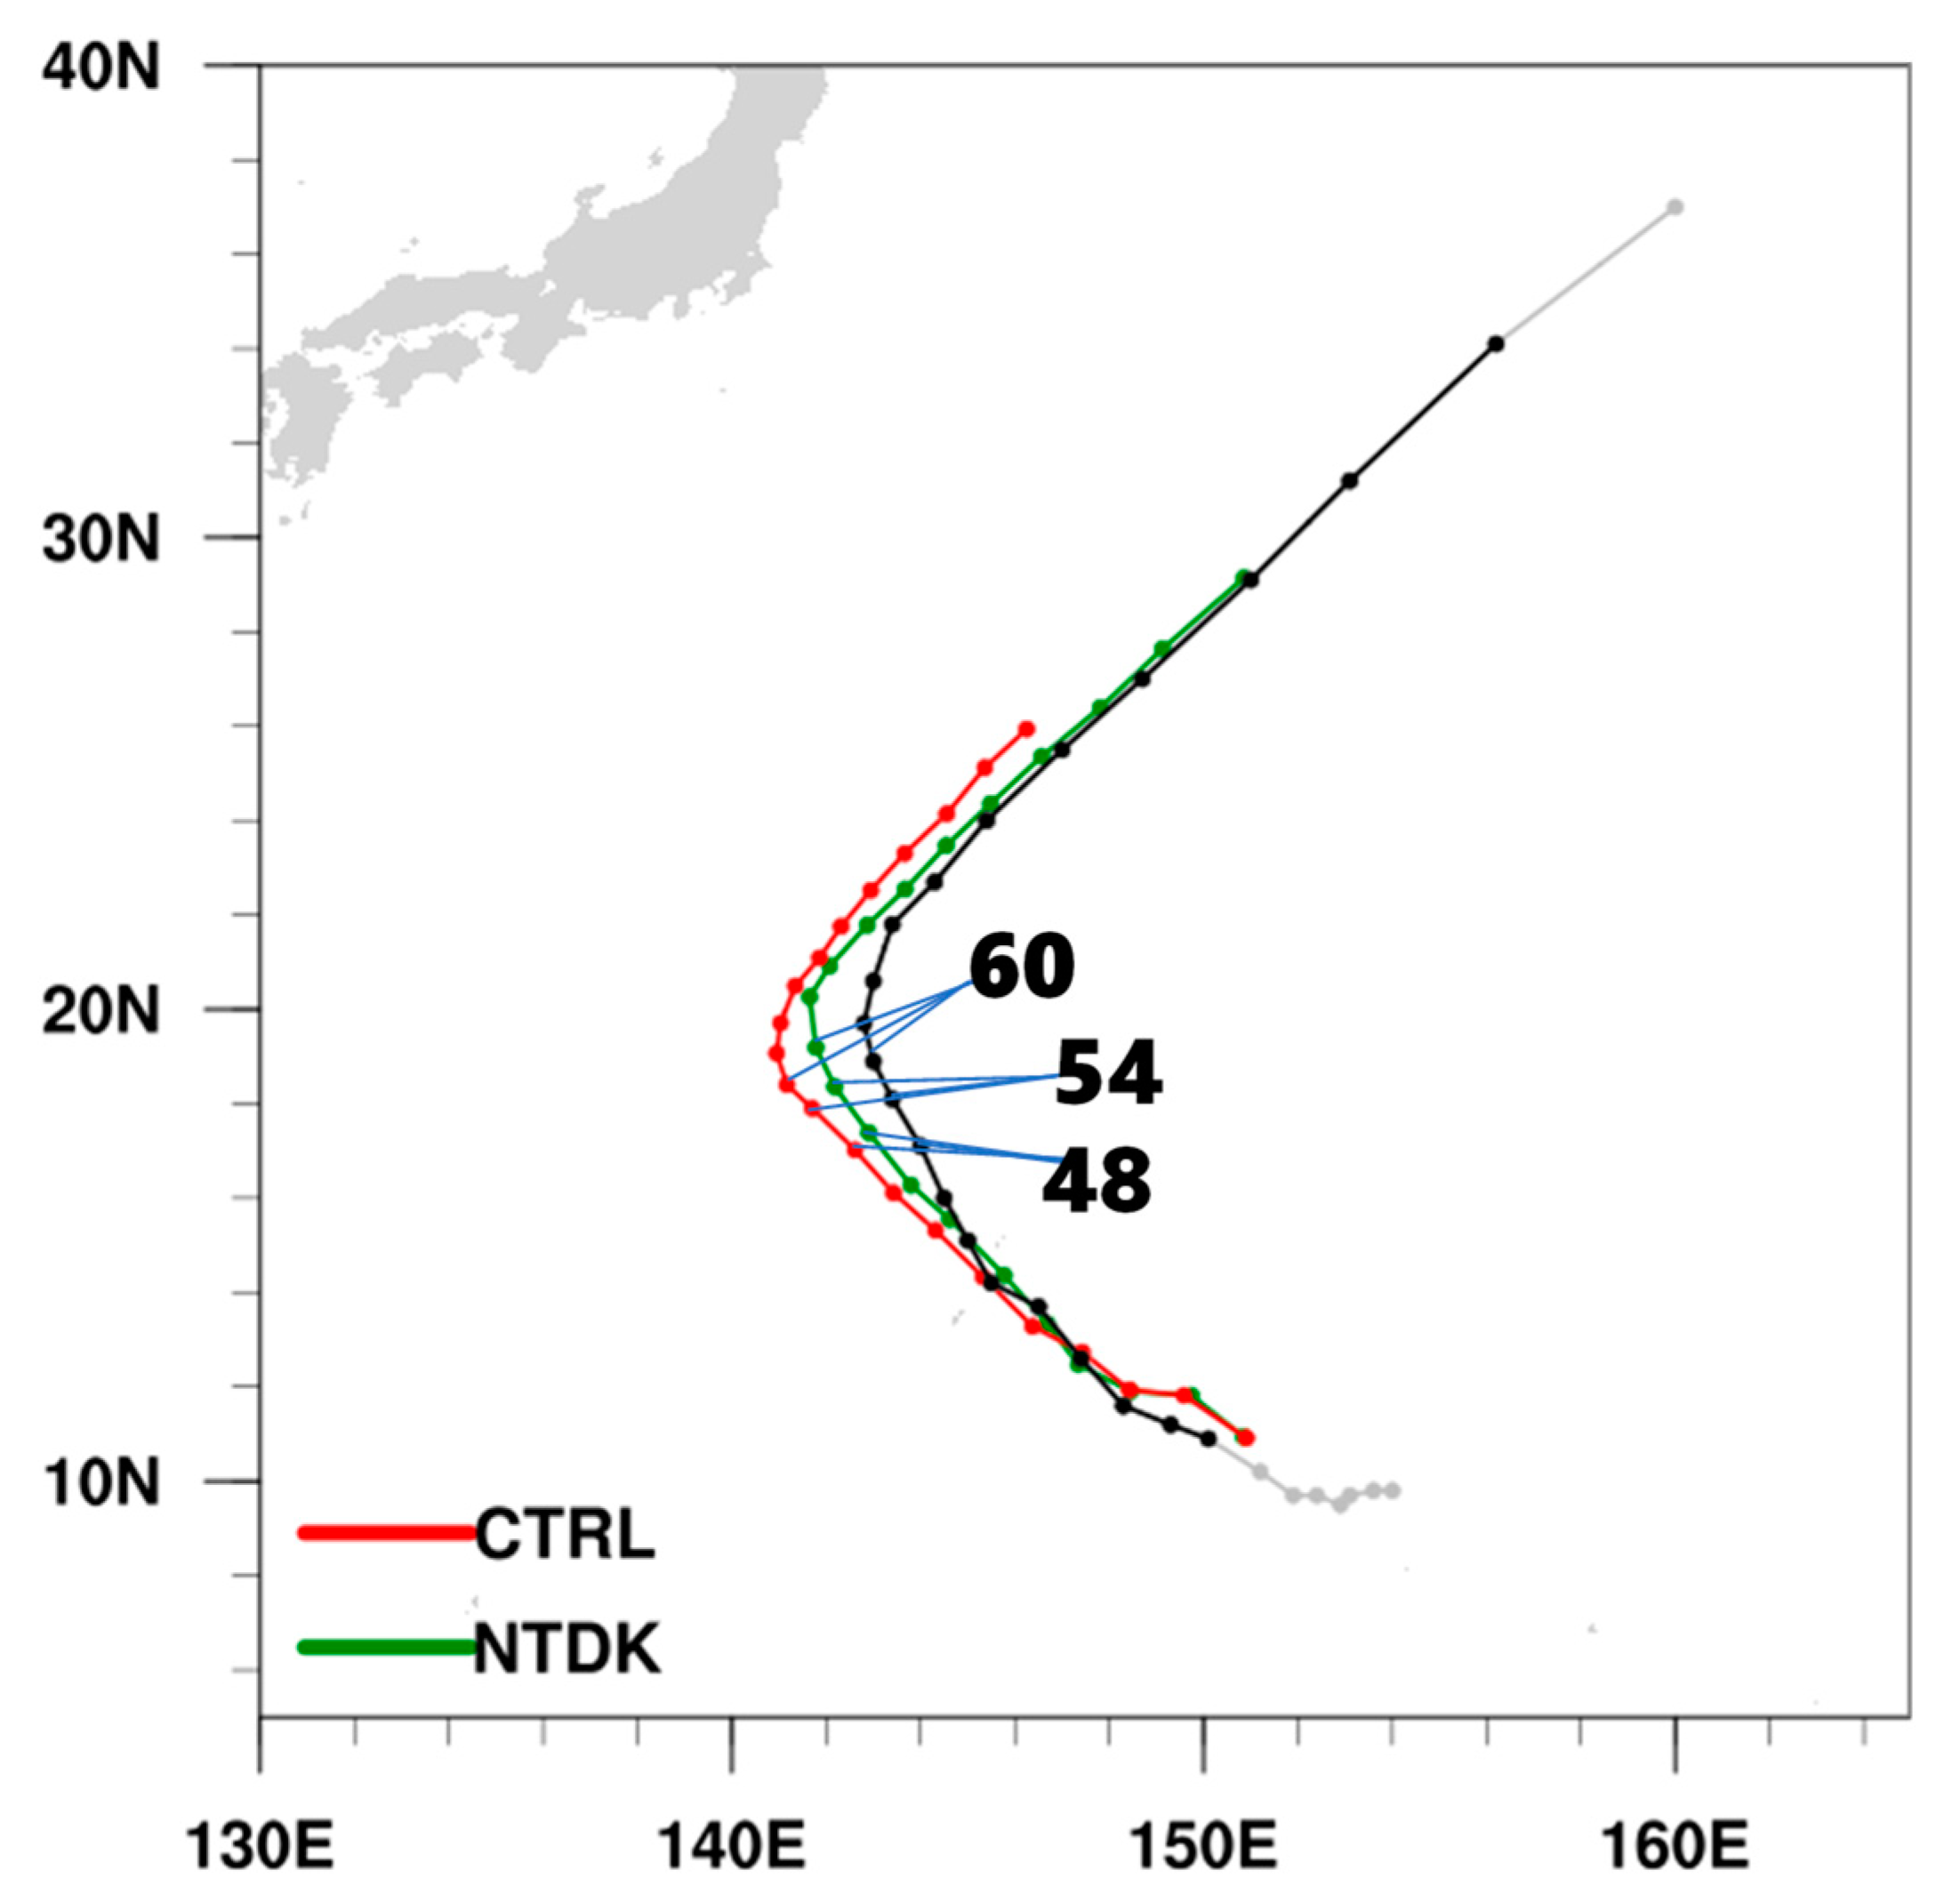
3.2. Sensitivity Tests of NTDK Cumulus Parameterization

Past studies suggesting the Tiedtke convection scheme may have the potential to produce an improvement in typhoon track forecasts compared to that of the Kain–Fritsch scheme [25,26,27], this study attempted to use a different cumulus scheme to improve global forecasts in TGFS. The new experiments, hereafter called NTDK, were designed by replacing the NSAS scheme originally used for deep convection in TGFS with the NTDK scheme. These sensitivity tests were expected to focus on those forecasts where the typhoon intensity was classified as mild at the initiation time and with large track errors in the later forecast stages.
In this preliminary study, several cases were selected from the typhoon cases belonging to the 29-DTG group as an initial assessment. A typhoon case containing more than four DTGs (greater than one day) from the group would be chosen for analysis priority. However, some of these forecasts were excluded if the typhoon intensity decreased to the tropical depression category (lower than 17.2 m s−1), i.e., failing to develop effectively for an extended period (Typhoon Haikui (2023)), or if the typhoon center made landfall within the 120 h forecast period (two DTGs for Typhoon Khanun (2023)). The remaining targets, as shown in Table 2, included 19 DTGs for three typhoons, Typhoon Doksuri (2023), Typhoon Khanun (2023), and Typhoon Lan (2023), during the typhoon season of July to August, and Typhoon Bolaven (2023) in October. In the NTDK experiments, forecasts were conducted for 120 h based on these initial times, and the results were compared with those of the CTRL experiments.
Figure 4 compares the forecast performance of typhoon tracks between the NTDK and the CTRL experiments. In the early stages, there were no obvious differences between the two experiments, which may be caused by an adjustment phase in the model since the NTDK experiments utilized TGFS analysis data as ICs. Subsequently, the track errors between the two experiments increased after the 48 h forecast. The modification with the NTDK scheme for parameterizing deep convection could effectively reduce the track errors in the mid-to-late forecast period for the four typhoons, indicating an excellent improvement at the 120th forecast hour, with the value reduced from 750 km to around 480 km (Figure 4a). The Student’s t-test was conducted to determine whether the differences in track errors between the CTRL and NTDK experiments were statistically significant. The vertical error bars in Figure 4b represent the 95% confidence interval for the mean differences between CTRL and NTDK. A difference is considered statistically significant at the 95% confidence level if the interval does not intercept zero. The results indicated that utilizing the NTDK scheme significantly improved the track forecasts for the four typhoons beyond 72 h. The improved tracks in the NTDK experiments were shown in Figure 5. Adjustments were made to the westward direction to better align with the best tracks, except for Typhoon Bolaven (2023) in October, which displayed faster eastward corrections, with its original track errors located within the third quadrant as depicted in Figure 2.

3.2.1. Summer Typhoons with Typical Wpsh Characteristic

For forecasts of the three typhoons during July to August under a synoptic environment with typical WPSH characteristics, the one showing the most significant improvement in magnitude of track error in the NTDK experiment was chosen for further analysis. This forecast corresponded to Typhoon Khanun (2023), initialed at 1800 UTC on 28 July 2023. A comparison of the CTRL and NTDK tracks was depicted in Figure 6. Since this study focused on forecasts initiated during the early stages of typhoon development, the eastward turn characteristic of Typhoon Khanun (2023) in its later stages was not the subject of discussion, and it was also not included in the forecast before 1800 UTC on 2 August. Comparing the two results to the best track, it became apparent that both forecast tracks maintained a northwestward direction but with excessive speed. Discrepancies started to emerge between the two tracks around the 48th to 60th forecast hours. In the CTRL experiment, the track moved faster and shifted further north, resulting in a significant track error. In contrast, the track in the NTDK experiment moved closer to the best track with slower speed than that in CTRL. The result demonstrated the improvement in track accuracy with the use of the NTDK scheme.
Further analysis was conducted on the characteristics of the environmental field between the two experiments to explore the reasons behind the improvement in typhoon track accuracy facilitated by the NTDK scheme. The analysis of 12 h accumulated precipitation distributions (Figure 7) revealed significant differences in precipitation characteristics in model forecasts when handling deep convection with the NSAS and NTDK schemes, respectively. The precipitation distribution in CTRL appeared broader, with relatively smaller extreme values, whereas NTDK exhibited a discrete precipitation distribution, characterized by small clusters with larger extremes. In the NTDK experiment, this feature was particularly prominent in the tropical region between 150–180° E. Previous studies have elucidated that forecasts employing the modified Tiedtke scheme tended to produce wet biases in the low-level troposphere, reflecting a substantially deep, well-mixed layer that aligned with the active deep convection in the intertropical convergence zone (ITCZ) [53].
The 500 hPa geopotential height field revealed that areas of vigorous convection were associated with stronger low pressure and easterly winds along the ITCZ in NTDK. Notable differences in the features of the WPSH were evident between the two experiments at this stage. The 5880-gpm contour extended further south in the CTRL experiment, covering the east to southeast side of the typhoon circulation, providing a strong southerly flow for typhoon movement. In contrast, the 5880-gpm contour did not significantly extend southward in the NTDK experiment, but it distributed slightly to the south on the front side of the typhoon movement. The former resulted in weaker southerly winds, potentially hindering the effective northward movement of the typhoon and resulting in a slower northward speed in NTDK. Meanwhile, the latter contributed to impeding the northward movement, thereby helping to correct the excessively fast typhoon speed. The characteristics of the environmental field aligned with the track direction in the two experiments.
The diagnosis of vorticity budget and regressed typhoon motion was utilized to clarify the contribution of each physical process to the two tracks. As shown in Figure 8, the summation (SUM) term of the vorticity budget was primarily influenced by the horizontal advection (HAVD) component, which had a significant impact on the typhoon motion. The variations of HAVD in the two experiments were carefully analyzed. At the 48th hour, although the directions of the two vectors were close, both heading north-northwest, the magnitude of the NTDK one was significantly smaller. Consequently, the typhoon center in NTDK fell behind that in CTRL and was positioned further south (Figure 6). At the 60th hour, the magnitude of the NTDK vector remained smaller, and the typhoon moved slowly north-northwest. Meanwhile, the HAVD in CTRL exhibited a larger and more northwestward trend, leading to an accelerated typhoon motion that reached a relatively more northern position. A large and more northwestward component continued to appear at the 72nd hour forecast in CTRL, causing a rapid translation velocity of the typhoon center toward the northwest side of the NTDK one. The two tracks had been clearly diverging and moved in parallel toward the northwest. In the NTDK experiment, the HAVD exhibited a more westward trend in the later stages of the forecast, predicting a more accurate track with smaller errors compared to the CTRL experiment. Other vorticity budget terms, namely vertical advection (VAVD), stretching (STRT), and tilting (TILT), had significantly smaller magnitudes and less impact on the typhoon motion during this forecast period.
The wavenumber-1 vorticity budget from the HAVD term was depicted with the wavenumber-1 horizontal wind in Figure 9. Comparing the CTRL and NTDK experiments, it was observed that the wavenumber-1 positive vorticity on the northern side of the typhoon center was relatively smaller in the NTDK experiment. The wavenumber-1 horizontal wind, which is obtained by subtracting the symmetric circulation (wavenumber-0), represents the environmental wind that primarily influences the typhoon motion. In this typhoon case, it predominantly exhibited southerly (southeasterly) winds in the NTDK (CTRL) experiment, leading to a generally northward (northwestward) movement of the typhoon center. As depicted in Figure 9, the southerly flow in the NTDK experiment was relatively weaker during the 48th to 60th hours of the forecast. Smaller asymmetric positive vorticity was induced to the northern side of the typhoon center, consequently hindering the northward moving speed. The typhoon speed in NTDK ranged approximately from 3.31 to 3.42 m s−1, whereas in contrast, the typhoon moved noticeably faster in CTRL, ranging from 7.02 to 7.23 m s−1. In addition, Typhoon Doksuri (2023) and Typhoon Lan (2023) both shown improved track forecasts through the NTDK experiments, and the differences in environmental features between them and CTRL were similar to the above results.

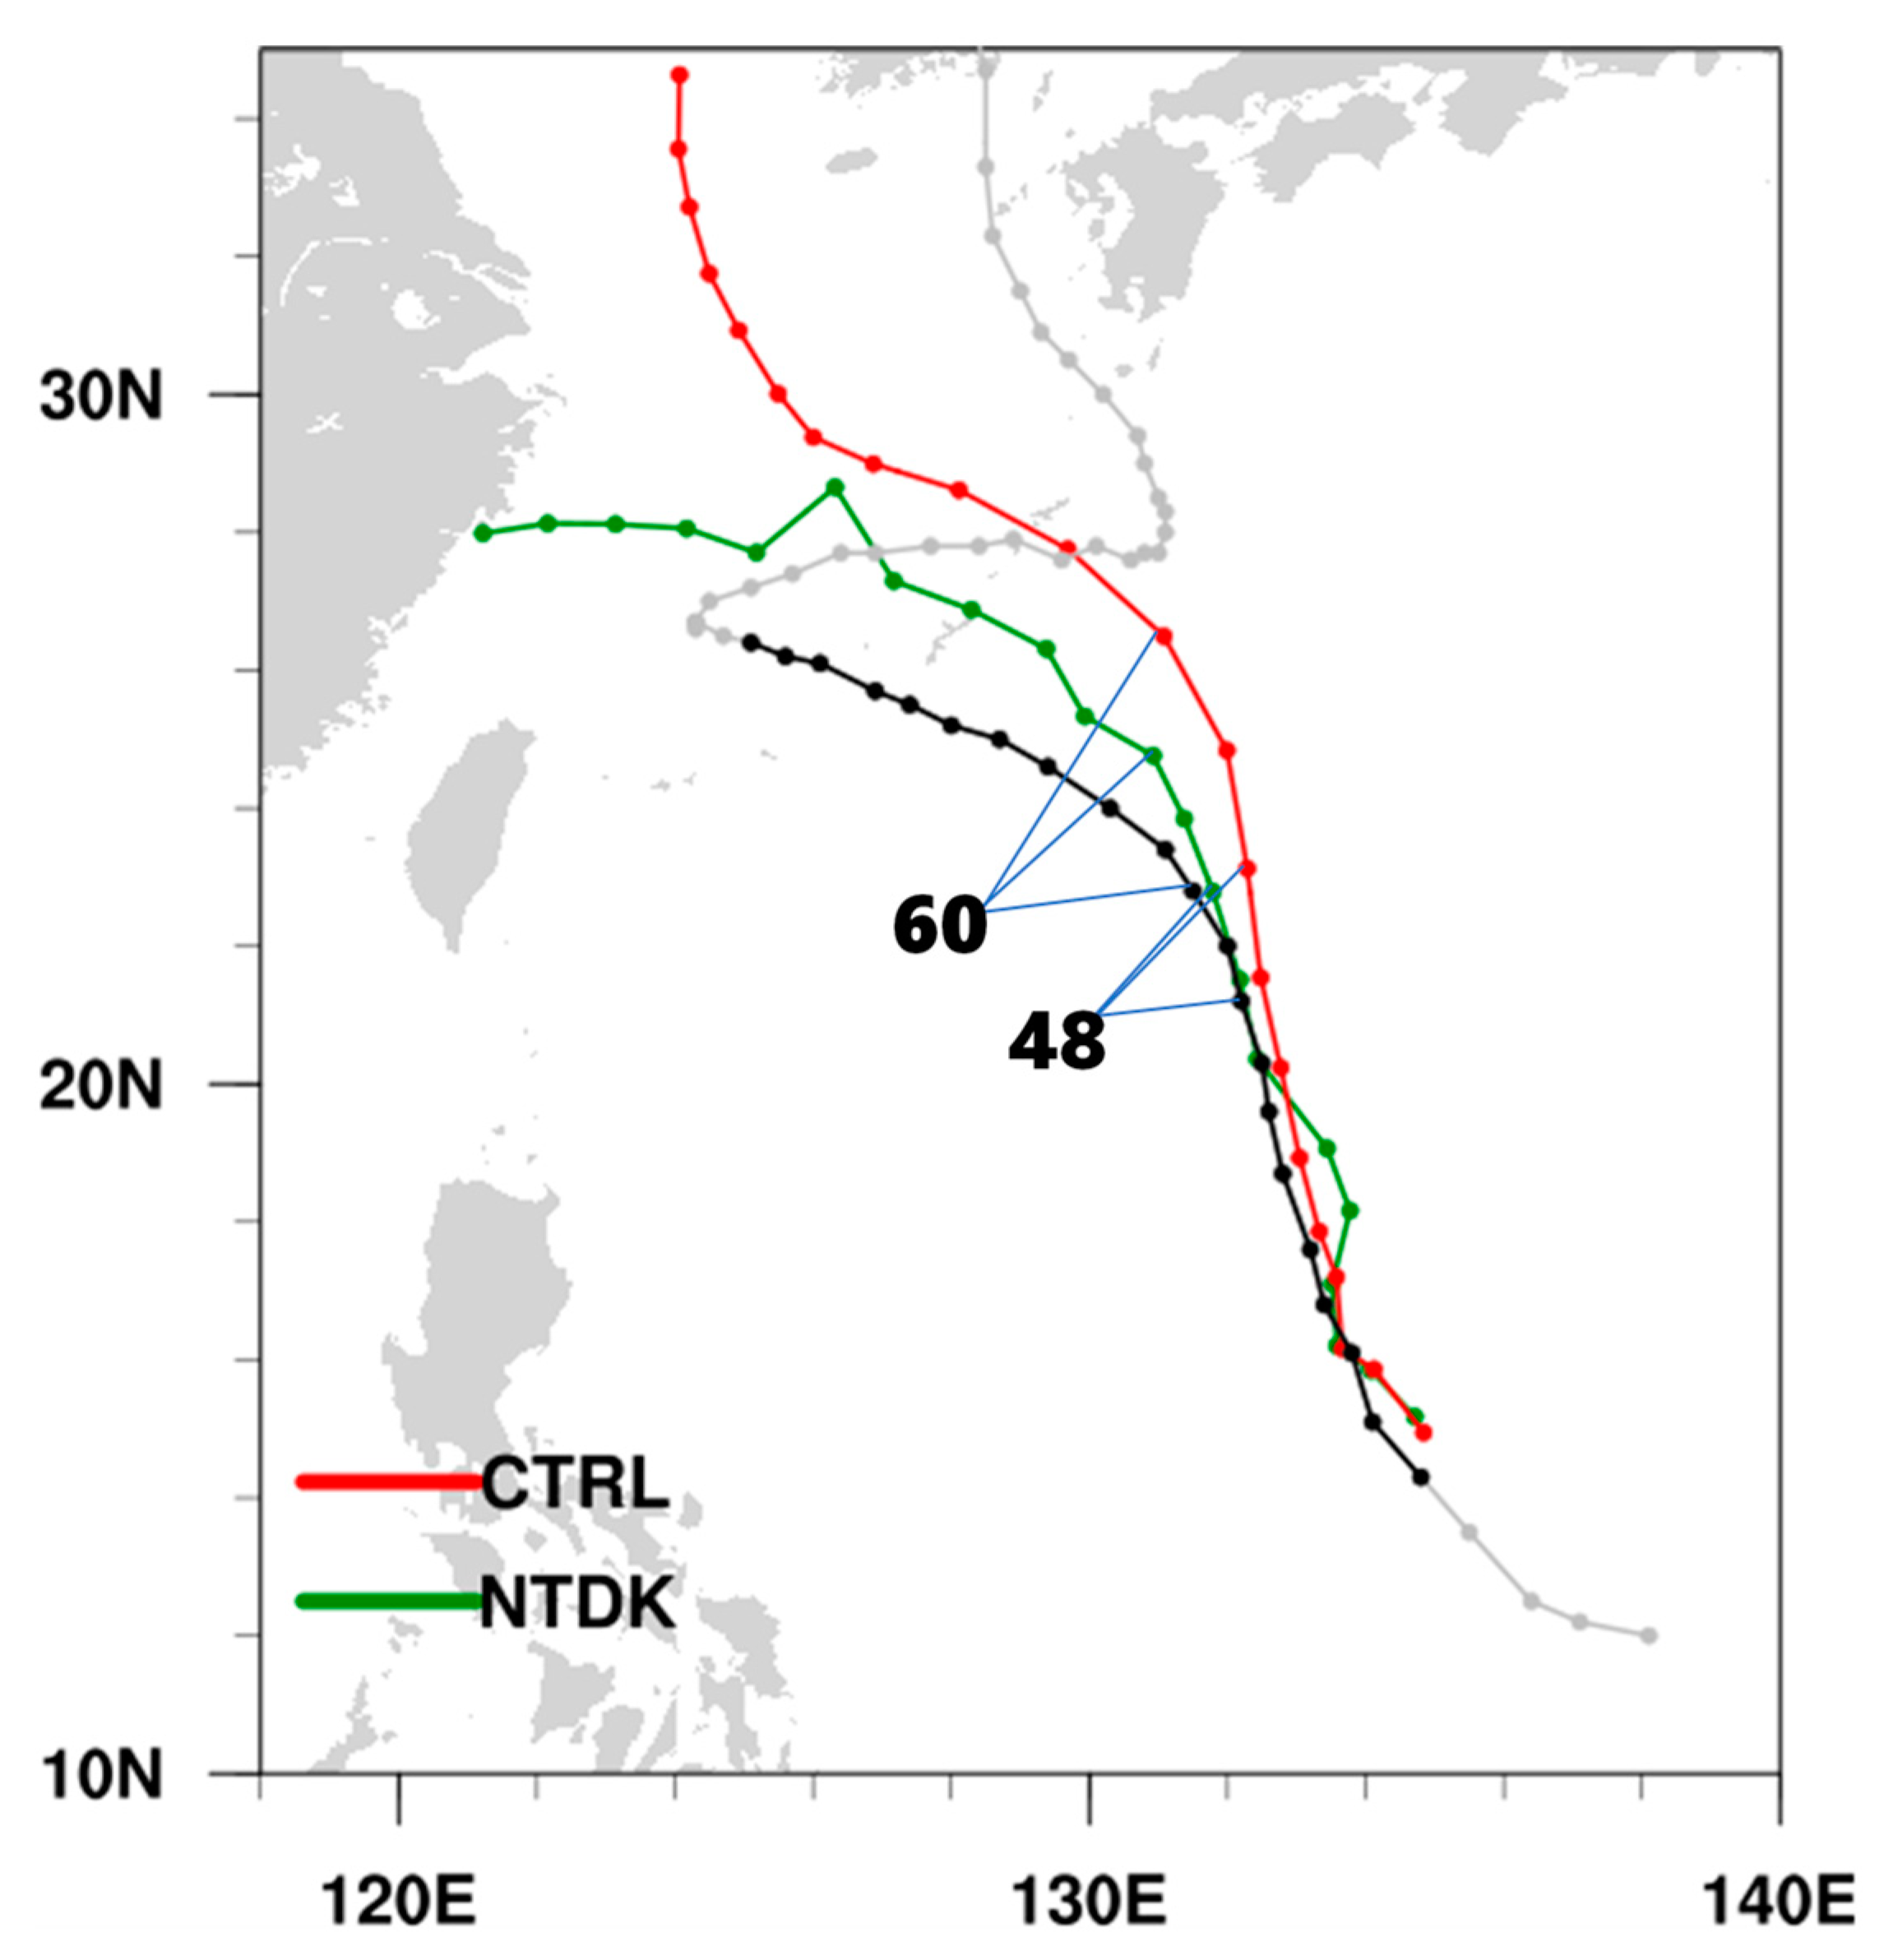
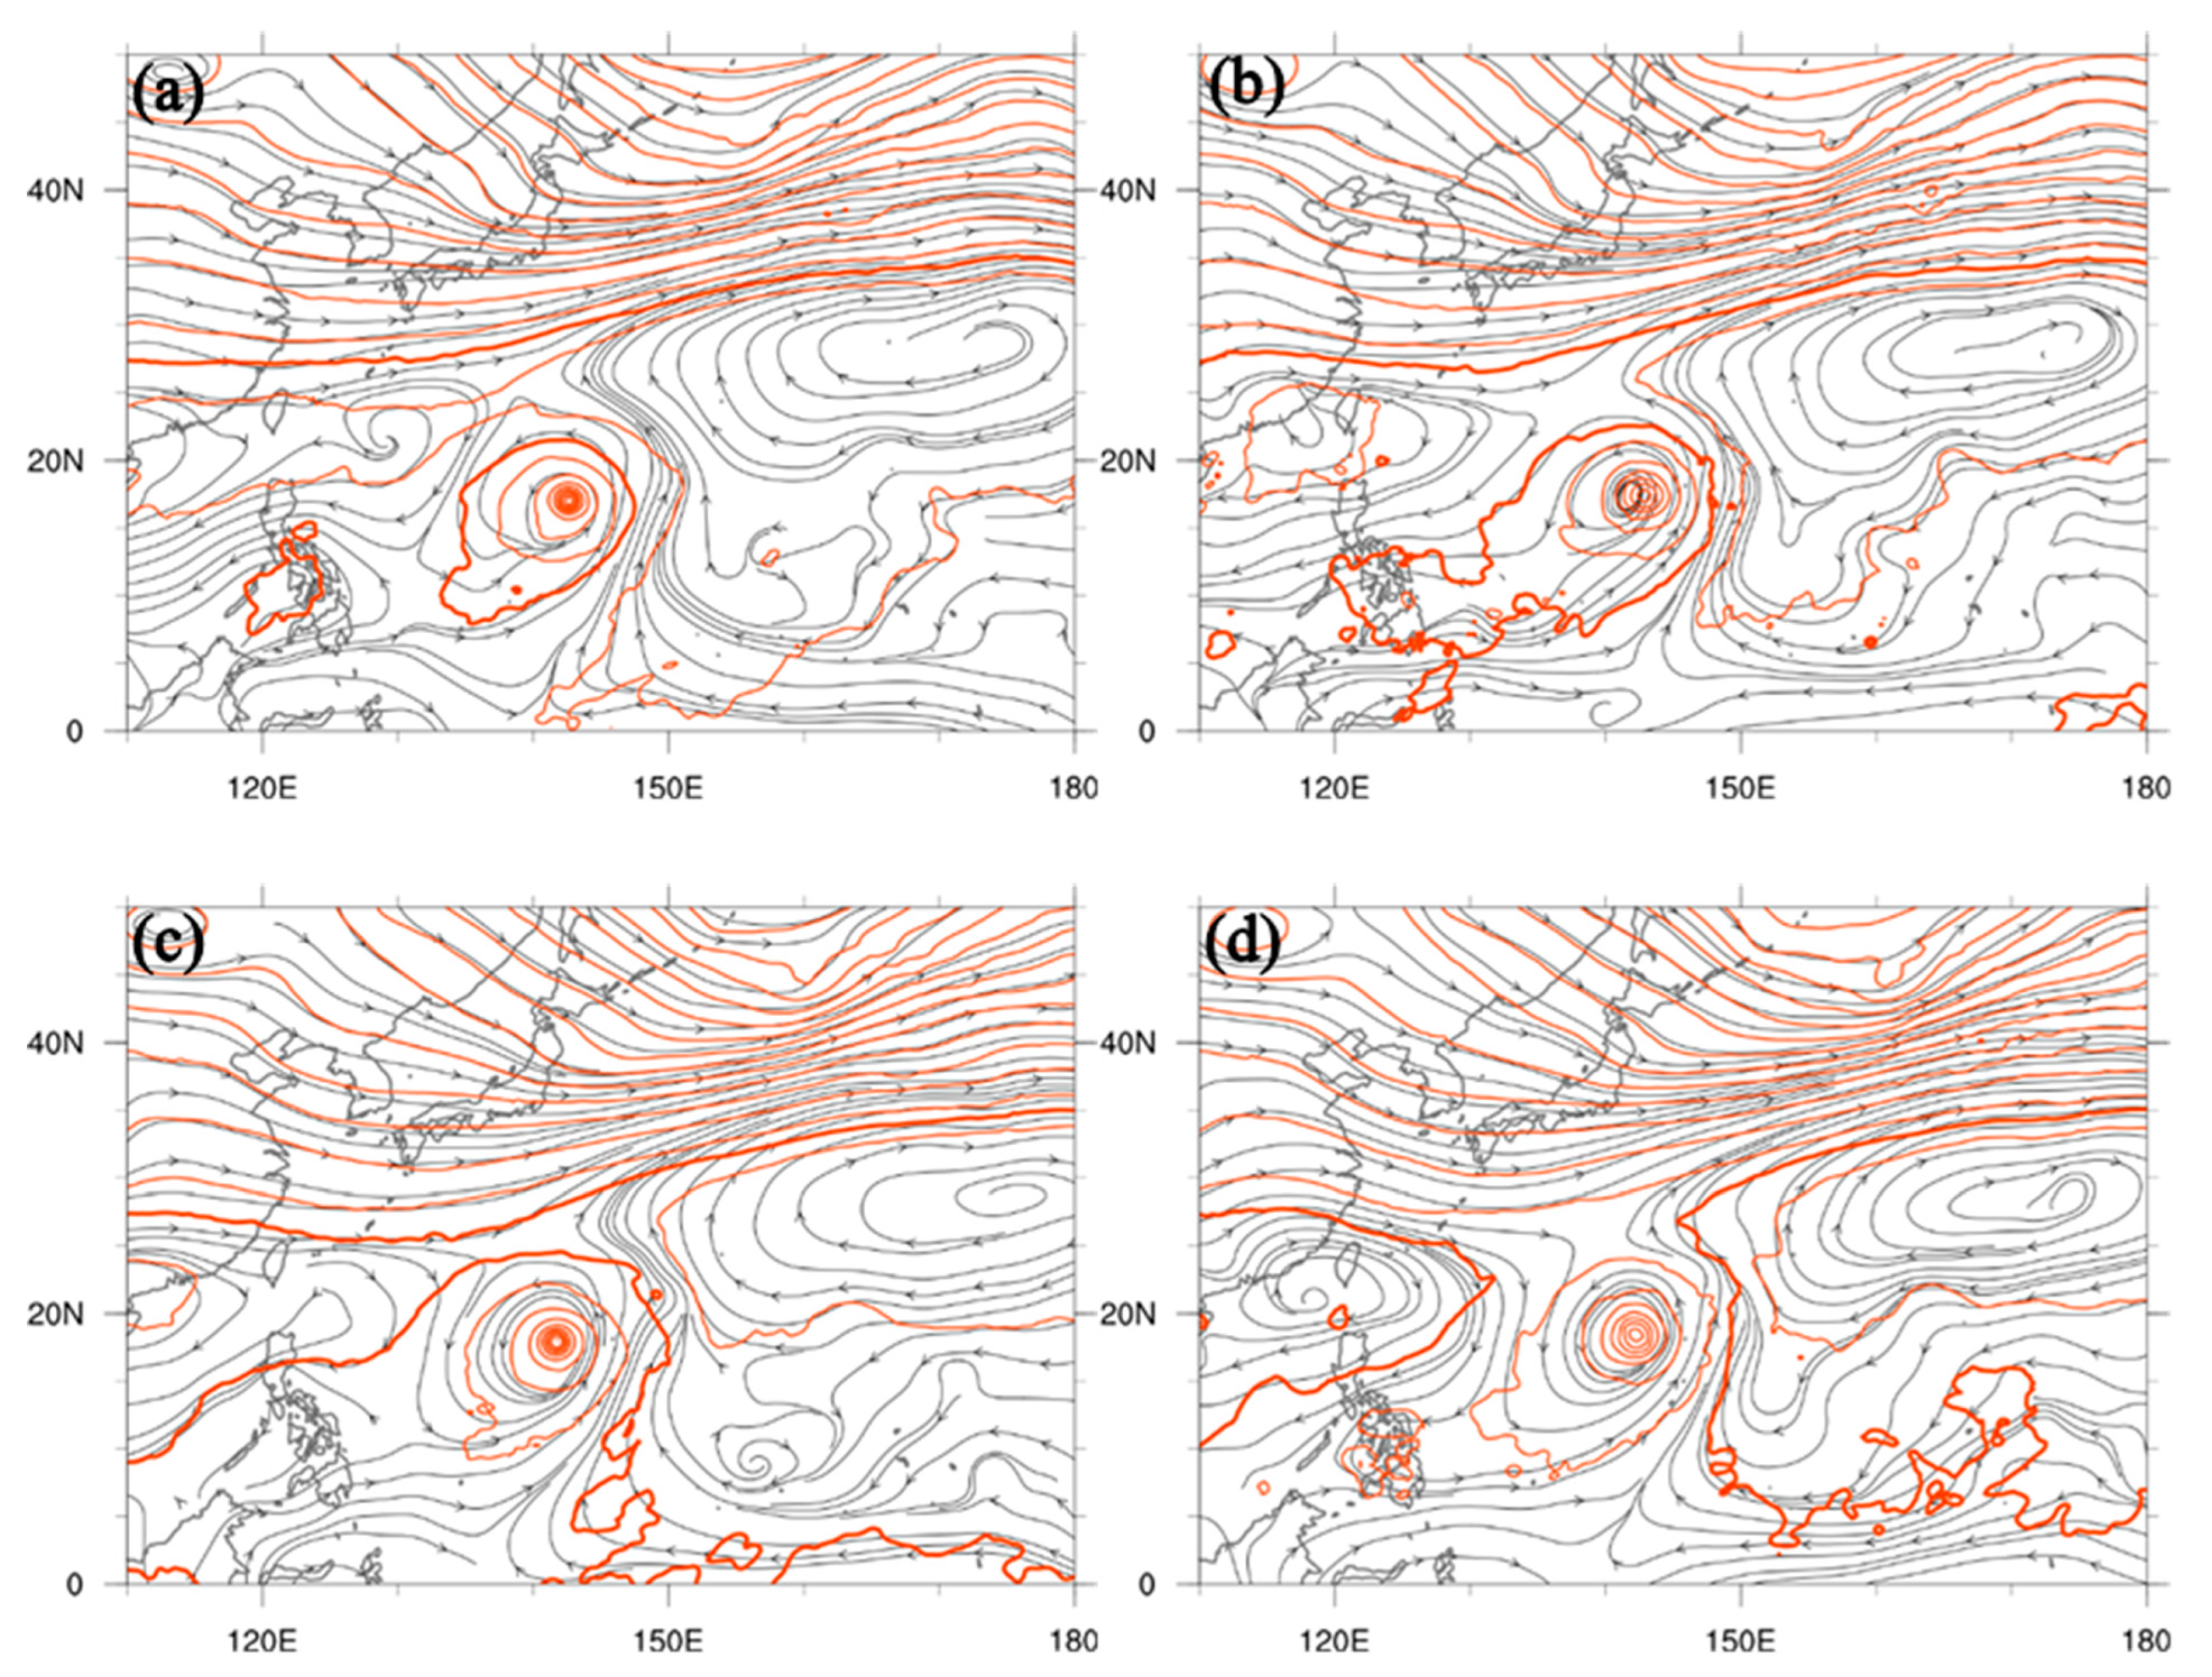
3.2.2. Typhoon Bolaven (2023) in October

This study also conducted an analysis of Typhoon Bolaven (2023), which occurred in October after the typhoon season. Similarly, the forecast using the NTDK scheme that resulted in the most significant improvement in magnitude of track error was selected. The initial time for this forecast was 0000 UTC on 9 October 2023. Comparing the tracks of CTRL and NTDK experiments (Figure 10), both shared the common shortcomings of underestimating the typhoon moving speed and exhibiting a westward bias in the typhoon track. Fortunately, the sensitivity tests using the NTDK scheme resulted in a typhoon moving speed closer to observations and a relatively minor westward bias in the track, indicating a significant overall improvement. Typhoon Bolaven (2023) moved in a northwesterly direction from the southeast initially. Throughout the entire period, the typhoon center of NTDK consistently remained to the east of CTRL. The two tracks began to diverge noticeably around the 54th forecast hour. The moving direction should begin to turn northeastward after 1200 UTC on 11 October (the 60th forecast hour). Although the timing of the turn was similar in CTRL and NTDK, different moving directions in the early stage led to variations in the location and environment of the typhoon centers when they turned. Additionally, CTRL showed a significant decrease in speed after the 72nd forecast hour, resulting in a notable increase in track errors in the later forecast period.
Examining the synoptic environmental fields during the divergence period of the CTRL and NTDK tracks (Figure 11), it was noted that the configuration of the WPSH differed from the typical characteristics of the typhoon season due to the timing of Typhoon Bolaven (2023). According to Figure 11, both the typhoon centers were positioned on the western side of the WPSH, which provided a southerly component to facilitate the northward movement. Particularly noteworthy was the relatively rapid eastward retreat of the WPSH in the NTDK experiment, especially in its configuration to the north of the typhoon center. Comparing the characteristics of the 5880-gpm contour at the 54th forecast hour, it was observed that the WPSH extended to the front side of the typhoon movement in CTRL, hindering the typhoon’s northward movement. In contrast, the distribution of the 5880-gpm contour separated into two parts to the north of the typhoon center in NTDK, resulting in less hindrance to the northward movement. This suggested faster and more realistic typhoon speed in the later forecast stage in NTDK compared to CTRL. Subsequent forecasts indicated that the typhoon circulation would soon merge with a trough. The center, driven by both the WPSH and the trough, would lead to a change in direction towards the northeast.
The typhoon translation velocity regressed by wavenumber-1 decomposition of vorticity budget due to different physical processes was diagnosed (Figure 12). The HAVD term remained the dominant component governing the SUM term. The diagnostic results revealed that both tracks generally moved in a northwesterly direction before the first 60 forecast hours. The vectors in CTRL consistently exhibited a more westward trend compared to those in NTDK, which may reflect the characteristic of track that was excessively westward-biased as presented in Figure 10. In contrast, the HAVD term in NTDK exhibited more northward components, resulting in a diminished westward bias and reduced track errors. As mentioned earlier, the wavenumber-1 horizontal wind primarily influenced the typhoon motion. For detailed analysis, Figure 13 indicated that compared to CTRL, the distribution of wavenumber-1 positive and negative vorticity tended to be more north-south oriented due to more northerly environmental winds in NTDK, especially evident at the 54th forecast hour when the two tracks diverged. This enabled the typhoon to move more towards the north-northwest direction, with the centers closer to reality. In addition, there was also a significant difference in typhoon moving speed between the two experiments. The speed was faster in NTDK during the forecast period from 48 to 54 h and ranged from approximately 7.68 to 7.77 m s−1, compared to a slower speed in CTRL from 5.72 to 6.83 m s−1.

4. Conclusions and Discussion

This study diagnosed the performance of TGFS for typhoon track forecasts in the northwest Pacific in 2022 and 2023. As the new generation global model, TGFS officially replaced CWAGFS and commenced operational use in 2023. It exhibited advancements in both accuracy and efficiency compared to CWAGFS in synoptic environmental forecasts. The focus of this study lay in evaluating TGFS’s capability in forecasting typhoon tracks and the accompanying synoptic environment during those impact periods. Statistics indicated that TGFS outperformed CWAGFS in the prediction accuracy of the typhoon track. However, further improvements are necessary to match the performance of internationally recognized global forecasting systems such as IFS and NCEP GFS.
The characteristics of typhoons with significant 120 h track errors by TGFS were investigated. Our analysis revealed that most of these forecasts originated during the early stages of typhoon development, i.e., mild typhoon intensity, and the track deviations predominantly lay to the north or east of the correct track. TGFS may exhibit a poor grasp of the environmental features at the beginning of typhoon development, leading to error accumulation over forecast time. The underestimated extent of the WPSH, possibly stemming from inherent constraints within the TGFS, such as lower model resolution or restricted assimilation of observational data, may have a direct influence on the early stages of typhoon movement. Therefore, the lack of accurate environmental steering flow guidance for typhoons may be a contributing factor to the northward or eastward bias in model tracks.
The NTDK cumulus parameterization was employed for sensitivity tests on the typhoon forecasts (NTDK experiments), revealing that using the NTDK scheme could yield more accurate track predictions compared to the original NSAS scheme (CTRL experiments). The analyzed typhoons could be categorized into two types based on their track characteristics. The first type occurred during the typhoon season of July to August with typical environmental characteristics. These typhoons typically moved from southeast to northwest, with an eastward and northward track bias in CTRL forecasts. For Typhoon Khanun (2023), the divergence between CTRL and NTDK tracks occurred during 48 to 60 forecast hours due to a faster northward progression in CTRL. The implementation of the NTDK scheme tended to demonstrate larger extremes but more discrete precipitation distribution in the ITCZ. Stronger low pressure and easterly winds were revealed in convective areas; thus, the 5880-gpm contour at 500 hPa did not extend southward as in CTRL but exhibited a more southerly distribution ahead of the typhoon movement direction. The relatively weaker wavenumber-1 southerly winds resulted in smaller wavenumber-1 positive vorticity on the northern side of the typhoon center and consequently affecting the typhoon’s moving speed. These might hinder the effective northward movement of the typhoon, thus correcting the initially excessive typhoon speed.
On the other hand, Typhoon Bolaven (2023) belonged to another type occurring after the typhoon season, lacking the typical configuration features of the WPSH. The CTRL experiment exhibited a more pronounced slow-moving and westward-biased track. The typhoon center in NTDK consistently positioned further east prior to the divergence of the two tracks. As the tracks diverged, the 5880-gpm contour at 500 hPa in CTRL extended to the north of the typhoon center, impeding its northward movement. This could explain the notable deceleration of the typhoon motion and the larger track errors in the later stage, whereas it was less evident in the NTDK experiment. The diagnosis of vorticity budget corroborated the findings, indicating more northward-directed HAVD components in NTDK compared to CTRL. The wavenumber-1 horizontal vorticity leaned more towards a north-south distribution, encouraging the typhoon to move north-northwestward. Subsequently, the steering of the WPSH and the trough influenced the typhoon movement and caused it to veer northeastward.
This study utilized the NTDK cumulus parameterization scheme to adjust the large-scale environmental fields and reduce the typhoon track errors for forecasts initialized with mild typhoons. The inclusion of the NTDK scheme might improve the forecasting skill of TGFS. However, since only several typhoon cases had been selected, further examination with the use of larger datasets is needed. In addition, the inherent issue of the TGFS underestimating the extent of the WPSH remained unresolved. The TGFS is still under development, and efforts are being made not only to optimize the physical processes of the model but also to enhance both horizontal and vertical resolution, aiming to improve the forecast performance in the future. On the other hand, despite the lack of enough observational data in the development process of typhoons in the Pacific, it may be possible in the future to use vortex initialization [54] to improve background vortex fields, which may help in obtaining more detailed typhoon information.

Author Contributions

Conceptualization, L.-F.H.; methodology, S.-H.S., C.-H.L. and Y.-H.C.; validation, S.-H.S. and L.-F.H.; formal analysis, S.-H.S., L.-F.H., C.-H.L. and Y.-H.C.; investigation, S.-H.S., C.-H.L. and Y.-H.C.; data curation, S.-H.S. and Y.-H.C.; writing—original draft preparation, Y.-H.C. and L.-F.H.; writing—review and editing, all authors; visualization, Y.-H.C., L.-F.H. and S.-H.S.; supervision, L.-F.H., C.-Y.H. and H.-C.K.; project administration, Y.-H.C. All authors have read and agreed to the published version of the manuscript.

Funding

This research received no external funding.

Institutional Review Board Statement

Not applicable.

Informed Consent Statement

Not applicable.

Data Availability Statement

The data presented in this study are available upon request from the corresponding author.

Acknowledgments

The CWA is acknowledged for providing computational resources and observational data used in this study. The ERA5 reanalysis data can be obtained from the Computational and Information Systems Laboratory at the National Center for Atmospheric Research, archived at https://rda.ucar.edu/datasets/ds633.0/ (accessed on 1 December 2023). The NCEP GFS analysis and forecast data are available at http://rda.ucar.edu/datasets/ds084.1/ (accessed on 2 January 2024). The ECMWF IFS analysis and forecast data are available at https://rda.ucar.edu/datasets/ds113.1/ (accessed on 2 January 2024). We appreciate the helpful comments from anonymous reviewers that improved the manuscript.

Conflicts of Interest

The authors declare no conflicts of interest.

References

  1. Liou, C.S.; Chen, J.H.; Terng, C.T.; Wang, F.J.; Fong, C.T.; Rosmond, T.E.; Kuo, H.C.; Shiao, C.H.; Cheng, M.D. The Second–Generation Global Forecast System at the Central Weather Bureau in Taiwan. Weather Forecast. 1997, 12, 653–663. [Google Scholar] [CrossRef]
  2. Su, C.Y.; Wu, C.M.; Chen, W.T.; Chen, J.H. Objectbased precipitation system bias in grey zone simulation: The 2016 South China Sea summer monsoon onset. Clim. Dyn. 2019, 53, 617–630. [Google Scholar] [CrossRef]
  3. Robert, A. A stable numerical integration scheme for the primitive meteorological euations. Atmos.-Ocean. 1981, 19, 35–46. [Google Scholar] [CrossRef]
  4. Juang, H.M.H. Semi-Lagrangian advection without iteration. In Proceedings of the Conference on Weather Analysis and Forecasting, Central Weather Bureau, Longtan, Taoyan, Taiwan, China, 23–26 January 2017; p. 277. [Google Scholar]
  5. Juang, H.M.H. Mass conserving and positive-definite semi-Lagrangian advection in NCEP GFS: Decomposition of massively parallel computing without halo. In Proceedings of the Thirteenth Workshop on Use of High Performance Computing in Meteorology, European Centre for Medium-Range Weather Forecasts, Reading, UK, 4 November 2008; pp. 3–7. [Google Scholar]
  6. Liu, P.Y.; Chen, J.H.; Juang, H.M. Use of non-iteration dimensional-split semi-Lagrangian (NDSL) in Central Weather Bureau global forecast system. In Proceedings of the 25th Conference on Numerical Weather Prediction, Denver, CO, USA, 3–8 June 2018; American Meteorological Society: Boston, MA, USA 12B.6. [Google Scholar]
  7. Zhao, Q.; Carr, F.H. A prognostic cloud scheme for operational NWP models. Mon. Weather Rev. 1997, 125, 1931–1953. [Google Scholar] [CrossRef]
  8. Lin, S.J. A finite-volume integration method for computing pressure gradient force in general vertical coordinates. Q. J. R. Meteorol. Soc. 1997, 123, 1749–1762. [Google Scholar] [CrossRef]
  9. Lin, S.J.; Rood, R.B. An explicit flux-form semi-Lagrangian shallow-water model on the sphere. Q. J. R. Meteorol. Soc. 1997, 123, 2477–2498. [Google Scholar]
  10. Lin, S.J. A “vertically Lagrangian” finite-volume dynamical core for global models. Mon. Weather Rev. 2004, 132, 2293–2307. [Google Scholar] [CrossRef]
  11. Putman, W.M.; Lin, S.J. Finite-volume transport on various cubed-sphere grids. J. Comput. Phys. 2007, 227, 55–78. [Google Scholar] [CrossRef]
  12. Kleist, D.; Mahajan, R.; Thomas, C. Data assimilation in the next-generation global prediction system (NGGPS) era: Initial implementation of FV3-based global forecast system (GFS). JCSDA Q. 2018, 61, 34. [Google Scholar]
  13. Chen, J.H.; Lin, S.J.; Magnusson, L.; Bender, M.; Chen, X.; Zhou, L.; Xiang, B.; Rees, S.; Morin, M.; Harris, L. Advancements in hurricane prediction with NOAA’s next-generation forecast system. Geophys. Res. Lett. 2019, 46, 4495–4501. [Google Scholar] [CrossRef]
  14. Wang, W.; Han, J.; Shin, J.; Chen, X.; Hazelton, A.; Zhu, L.; Kim, H.S.; Li, X.; Liu, B.; Liu, Q.; et al. Physics schemes in the first version of NCEP operational hurricane analysis and forecast system (HAFS). Front. Earth Sci. 2024, 12, 1379069. [Google Scholar] [CrossRef]
  15. Dong, J.; Liu, B.; Zhang, Z.; Wang, W.; Mehra, A.; Hazelton, A.T.; Winterbottom, H.R.; Zhu, L.; Wu, K.; Zhang, C.; et al. The evaluation of real-time Hurricane Analysis and Forecast System (HAFS) Stand-Alone Regional (SAR) model performance for the 2019 Atlantic hurricane season. Atmosphere 2020, 11, 617. [Google Scholar] [CrossRef]
  16. Huang, C.Y.; Juan, T.C.; Kuo, H.C.; Chen, J.H. Track deflection of Typhoon Maria (2018) during a westbound passage offshore of northern Taiwan: Topographic influence. Mon. Weather Rev. 2020, 148, 4519–4544. [Google Scholar] [CrossRef]
  17. Huang, C.Y.; Sha, S.H.; Kuo, H.C. A modeling study of Typhoon Lekima (2019) with the topographic influence of Taiwan. Mon. Weather Rev. 2022, 150, 1993–2011. [Google Scholar] [CrossRef]
  18. Harr, P.A.; Elsberry, R.L. Tropical cyclone track characteristics as a function of large-scale circulation anomalies. Mon. Weather Rev. 1991, 119, 1448–1468. [Google Scholar] [CrossRef]
  19. Harr, P.A.; Elsberry, R.L. Large-scale circulation variability over the tropical western North Pacific. Part I: Spatial patterns and tropical cyclone characteristics. Mon. Weather Rev. 1995, 123, 1225–1246. [Google Scholar] [CrossRef]
  20. Harr, P.A.; Elsberry, R.L. Large-scale circulation variability over the tropical western North Pacific. Part II: Persistence and transition characteristics. Mon. Weather Rev. 1995, 123, 1247–1268. [Google Scholar] [CrossRef]
  21. Carr, L.E., III; Elsberry, R.L. Dynamical tropical cyclone track forecast errors. Part I: Tropical region error sources. Weather Forecast. 2000, 15, 641–661. [Google Scholar] [CrossRef]
  22. Chu, P.S.; Kim, J.H.; Chen, Y.R. Have steering flows in the western North Pacific and the South China Sea changed over the last 50 years? Geophys. Res. Lett. 2012, 39, L10704. [Google Scholar] [CrossRef]
  23. Zhao, H.; Wu, L. Inter-decadal shift of the prevailing tropical cyclone tracks over the western North Pacific and its mechanism study. Meteorol. Atmos. Phys. 2014, 125, 89–101. [Google Scholar] [CrossRef]
  24. Tiedtke, M. A comprehensive mass flux scheme for cumulus parameterization in large scale models. Mon. Weather Rev. 1989, 117, 1779–1800. [Google Scholar] [CrossRef]
  25. Torn, R.D.; Davis, C.A. The influence of shallow convection on tropical cyclone track forecasts. Mon. Weather Rev. 2012, 140, 2188–2197. [Google Scholar] [CrossRef]
  26. Parker, C.L.; Lynch, A.H.; Mooney, P.A. Factors affecting the simulated trajectory and intensification of Tropical Cyclone Yasi (2011). Atmos. Res. 2017, 194, 27–42. [Google Scholar] [CrossRef]
  27. Delfino, R.J.; Bagtasa, G.; Hodges, K.; Vidale, P.L. Sensitivity of simulating Typhoon Haiyan (2013) using WRF: The role of cumulus convection, surface flux parameterizations, spectral nudging, and initial and boundary conditions. Nat. Hazards Earth Syst. Sci. 2022, 22, 3285–3307. [Google Scholar] [CrossRef]
  28. Bechtold, P.; Semane, N.; Lopez, P.; Chaboureau, J.P.; Beljaars, A.; Bormann, N. Representing equilibrium and nonequilibrium convection in large-scale models. J. Atmos. Sci. 2014, 71, 734–753. [Google Scholar] [CrossRef]
  29. Han, J.; Witek, M.L.; Teixeira, J.; Sun, R.; Pan, H.L.; Fletcher, J.K.; Bretherton, C.S. Implementation in the NCEP GFS of a hybrid eddy-diffusivity mass-flux (EDMF) boundary layer parameterization with dissipative heating and modified stable boundary layer mixing. Weather Forecast. 2016, 31, 341–352. [Google Scholar] [CrossRef]
  30. Chen, F.; Dudhia, J. Coupling an advanced land surface-hydrology model with the Penn State-NCAR MM5 modeling system. Part I: Model implementation and sensitivity. Mon. Weather Rev. 2001, 129, 569–585. [Google Scholar] [CrossRef]
  31. Ek, M.B.; Mitchell, K.E.; Lin, Y.; Rogers, E.; Grunmann, P.; Koren, V.; Gayno, G.; Tarpley, J.D. Implementation of Noahland surface model advances in the National Centers for Environ-mental Prediction operational mesoscale Eta model. J. Geophys. Res. 2003, 108, 8851. [Google Scholar]
  32. Chun, H.Y.; Baik, J.J. Weakly nonlinear response of a stably stratified atmosphere to diabatic forcing in a uniform flow. J. Atmos. Sci. 1994, 51, 3109–3121. [Google Scholar] [CrossRef]
  33. Kim, Y.J.; Arakawa, A. Improvement of orographic gravity wave parameterization using a mesoscale gravity wave model. J. Atmos. Sci. 1995, 52, 1875–1902. [Google Scholar] [CrossRef]
  34. Kim, Y.J.; Doyle, J.D. Extension of an orographic-drag parameterization scheme to incorporate orographic anisotropy and flow blocking. Q. J. R. Meteorol. Soc. A J. Atmos. Sci. Appl. Meteorol. Phys. Oceanogr. 2005, 131, 1893–1921. [Google Scholar]
  35. Lin, Y.L.; Farley, R.D.; Orville, H.D. Bulk parameterization of the snow field in a cloud model. J. Climate Appl. Meteor. 1983, 22, 1065–1092. [Google Scholar] [CrossRef]
  36. Lord, S.J.; Willoughby, H.E.; Piotrowicz, J.M. Role of a parameterized ice-phase microphysics in an axisymmetric, nonhydrostatic tropical cyclone model. J. Atmos. Sci. 1984, 41, 2836–2848. [Google Scholar] [CrossRef]
  37. Krueger, S.K.; Fu, Q.; Liou, K.N.; Chin, H.N.S. Improvement of an ice-phase microphysics parameterization for use in numerical simulations of tropical convection. J. Appl. Meteorol. 1995, 34, 281–287. [Google Scholar] [CrossRef]
  38. Chen, J.H.; Lin, S.J. The remarkable predictability of inter-annual variability of Atlantic hurricanes during the past decade. Geophys. Res. Lett. 2011, 38, L11804. [Google Scholar] [CrossRef]
  39. Chen, J.H.; Lin, S.J. Seasonal predictions of tropical cyclones using a 25-km-resolution general circulation model. J. Clim. 2013, 26, 380–398. [Google Scholar] [CrossRef]
  40. Mlawer, E.J.; Taubman, S.J.; Brown, P.D.; Iacono, M.J.; Clough, S.A. Radiative transfer for inhomogeneous atmospheres: RRTM, a validated correlated-k model for the longwave. J. Geophys. Res. 1997, 102, 16663–16682. [Google Scholar] [CrossRef]
  41. Clough, S.A.; Shephard, M.W.; Mlawer, E.J.; Delamere, J.S.; Iacono, M.J.; Cady-Pereira, K.; Boukabara, S.; Brown, P.D. Atmospheric radiative transfer modeling: A summary of the AER codes. J. Quant. Spectrosc. Radiat. Transf. 2005, 91, 233–244. [Google Scholar] [CrossRef]
  42. Lin, C.H.; Yang, M.J.; Hsiao, L.F.; Chen, J.H. The impact of scale-aware parameterization on the nest-generation global prediction system in Taiwan for front predictions. Atmosphere 2022, 13, 1063. [Google Scholar] [CrossRef]
  43. Han, J.; Wang, W.; Kwon, Y.C.; Hong, S.Y.; Tallapragada, V.; Yang, F. Updates in the NCEP GFS cumulus convection schemes with scale and aerosol awareness. Weather Forecast. 2017, 32, 2005–2017. [Google Scholar] [CrossRef]
  44. Arakawa, A.; Schubert, W.H. Interaction of a Cumulus Cloud Ensemble with the Large-Scale Environment, Part I. J. Atmos. Sci. 1974, 31, 674–701. [Google Scholar] [CrossRef]
  45. Grell, G.A. Prognostic evaluation of assumptions used by cumulus parameterizations. Mon. Weather Rev. 1993, 121, 764–787. [Google Scholar] [CrossRef]
  46. Han, J.; Pan, H.L. Revision of convection and vertical diffusion schemes in the NCEP global forecast system. Weather Forecast. 2011, 26, 520–533. [Google Scholar] [CrossRef]
  47. Arakawa, A.; Wu, C.M. A Unified representation of deep moist convection in numerical modeling of the Atmosphere. Part I. J. Atmos. Sci. 2013, 70, 1977–1992. [Google Scholar] [CrossRef]
  48. Grell, G.A.; Freitas, S.R. A scale and aerosol aware stochastic convective parameterization for weather and air quality modeling. Atmos. Chem. Phys. 2014, 14, 5233–5250. [Google Scholar] [CrossRef]
  49. Wu, L.; Wang, B. A potential vorticity tendency diagnostic approach for tropical cyclone motion. Mon. Weather Rev. 2000, 128, 1899–1911. [Google Scholar] [CrossRef]
  50. Huang, C.Y.; Zhang, Y.; Skamarock, W.C.; Hsu, L.H. Influences of large-scale flow variations on the track evolution of Typhoons Morakot (2009) and Megi (2010): Simulations with a global variable-resolution model. Mon. Weather Rev. 2017, 145, 1691–1716. [Google Scholar] [CrossRef]
  51. Goerss, J.S. Prediction of consensus tropical cyclone track forecast error. Mon. Weather Rev. 2007, 135, 1985–1993. [Google Scholar] [CrossRef]
  52. Yu, H.; Chen, G.; Brown, B. A new verification measure for tropical cyclone track forecasts and its experimental application. Trop. Cyclone Res. Rev. 2013, 2, 185–195. [Google Scholar]
  53. Zhang, C.; Wang, Y.; Hamilton, K. Improved representation of boundary layer clouds over the southeast Pacific in ARW-WRF using a modified Tiedtke cumulus parameterization scheme. Mon. Weather Rev. 2011, 139, 3489–3513. [Google Scholar] [CrossRef]
  54. Liu, Q.; Zhang, X.; Tong, M.; Zhang, Z.; Liu, B.; Wang, W.; Zhu, L.; Zhang, B.; Xu, X.; Trahan, S.; et al. Vortex initialization in the NCEP operational hurricane models. Atmosphere 2020, 11, 968. [Google Scholar] [CrossRef]
Figure 1. Track errors for the western North Pacific typhoons during 2022–2023 in TGFS (red), NCEP GFS (yellow), IFS (blue), and CWAGFS (green). The number of cases at each forecast hour was marked in brackets on the horizontal axis.
Atmosphere 15 01075 g001
Figure 2. Differences in longitude and latitude of TGFS typhoon centers relative to the best track (blue) at the 120th forecast hour. Red (black) represents the track error was greater (less) than the mean error. Solid dot represents forecasts initiated under mild typhoon category conditions (17.2 to 32.6 m s−1), while hollow diamond represents forecasts with mature typhoon phase at the forecast initiation.
Atmosphere 15 01075 g002
Figure 3. The 500 hPa geopotential height (contour) and wind (arrow, m s−1) fields averaged from June to October in 2022 and 2023 by (a) ERA5 reanalysis data, (b) TGFS, (c) NCEP GFS, and (d) IFS. The thick black line represents 5880 gpm. The thick red line in (bd) represents 5880 gpm by ERA5 as (a).
Atmosphere 15 01075 g003
Figure 4. (a) Track errors for the selected DTGs of Typhoon Doksuri (2023), Khanun (2023), Lan (2023), and Bolaven (2023) in CTRL (red), NCEP GFS (yellow), IFS (blue), and NTDK experiment (green). The number of cases at each forecast hour was marked in brackets on the horizontal axis. (b) Mean typhoon track error differences between CTRL and NTDK experiments (bars). Error bars denote the 95% confidence interval of the mean difference.
Atmosphere 15 01075 g004
Figure 5. Model tracks of total 120 h for the selected DTGs (Table 2) in CTRL (red) and NTDK (green) experiments and the best track of CWA (black) of Typhoon Doksuri (2023), Khanun (2023), Lan (2023), and Bolaven (2023). The black line starts from the initial time of the first DTG and ends at the last time of the last DTG of each typhoon.
Atmosphere 15 01075 g005
Figure 6. Model tracks of total 120 h in CTRL (red) and NTDK (green) experiments and the best track of CWA (black: during the 120 h forecasts; grey: out of the forecast period) from 1800 UTC, 28 July 2023 of Typhoon Khanun (2023). Dots were marked every six hours.
Atmosphere 15 01075 g006
Figure 7. The 500 hPa geopotential height (red), streamline (black), and 12 h accumulated precipitation (shaded, mm) fields in (a) CTRL and (b) NTDK experiments at 1800 UTC 30 July 2023 (the 48th forecast hour). The thick red contour represents 5880 gpm. (c,d) As in (a,b), but for 0600 UTC, 31 July 2023 (the 60th forecast hour).
Atmosphere 15 01075 g007
Figure 8. The translation velocity (m s−1) for Typhoon Khanun (2023) regressed by wavenumber-1 decomposition of vorticity budget terms averaged from 1–8 km height in CTRL (red) and NTDK (green) experiments. SUM, TILT, STRT, VAVD, and HAVD represent summation, tilting, stretching, vertical advection, and horizontal advection, respectively.
Atmosphere 15 01075 g008
Figure 9. (a) Wavenumber-1 HAVD of vorticity (s−2, ×10−10) and horizontal wind (m s−1) averaged over 1–8 km height at 1800 UTC, 30 July 2023 (the 48th forecast hour) for CTRL. The light blue arrow represents the translation velocity (m s−1) of Typhoon Khanun (2023) due to the HAVD term as in Figure 8. (b) As in (a), but for NTDK. (c,d) As in (a,b), but for 0600 UTC, 31 July 2023 (the 60th forecast hour).
Atmosphere 15 01075 g009
Figure 10. Model tracks of total 120 h in CTRL (red) and NTDK (green) experiments and the best track of CWA (black: during the 120 h forecasts; grey: out of the forecast period) from 0000 UTC, 9 October 2023 of Typhoon Bolaven (2023). Dots were marked every six hours.
Atmosphere 15 01075 g010
Figure 11. The 500 hPa geopotential height (red) and streamline (black) fields in (a) CTRL and (b) NTDK experiments at 000 UTC, 11 October 2023 (the 48th forecast hour). The thick red contour represents 5880 gpm. (c,d) As in (a,b), but for 0600 UTC, 11 October 2023 (the 54th forecast hour).
Atmosphere 15 01075 g011
Figure 12. The translation velocity (m s−1) for Typhoon Bolaven (2023) regressed by wavenumber-1 decomposition of vorticity budget terms averaged from 1–8 km height in CTRL (red) and NTDK (green) experiments. SUM, TILT, STRT, VAVD, and HAVD represent summation, tilting, stretching, vertical advection, and horizontal advection, respectively.
Atmosphere 15 01075 g012
Figure 13. (a) Wavenumber-1 HAVD of vorticity (s−2, ×10−10) and horizontal wind (m s−1) averaged over 1–8-km height at 0000 UTC, 11 October 2023 (the 48th forecast hour) for CTRL. The light blue arrow represents the translation velocity (m s−1) of Typhoon Bolaven (2023) due to the HAVD term as in Figure 12. (b) As in (a), but for NTDK. (c,d) As in (a,b), but for 0600 UTC, 11 October 2023 (the 54th forecast hour).
Atmosphere 15 01075 g013
Table 1. Dynamical and physical options and configurations of TGFS.
Model SettingsTGFS
DomainGlobal C384TL64 (~25 km horizontal resolution in six cubic spherical tiles with 64 vertical layers up to 0.2 hPa)
Dynamical coreFinite-Volume Cubed-Sphere (FV3), nonhydrostatic [11]
Data assimilationGSI hybrid 4-dimensional ensemble-variational (4DEnVar)
Planetary boundary layer (PBL) schemeHybrid eddy-diffusivity mass-flux (EDMF) [29]
Land surface modelNoah land surface model [30,31]
Deep/shallow cumulus parameterizationCWA modified new simplified Arakawa-Schubert scheme (NSAS) [42,43,44,45,46,47,48]
Cloud microphysicsGFDL six-category cloud microphysics scheme [35,36,37,38,39]
Shortwave/longwave radiationRapid radiative transfer model for general circulation models (RRTMG) [40,41]
Table 2. The 19 selected initial times belong to Typhoon Doksuri (2023), Typhoon Khanun (2023), Typhoon Lan (2023), and Typhoon Bolaven (2023) for the NTDK experiments.
Typhoon CasesDTGs (Mmddhh)
Doksuri (2023)072100, 072106, 072112, 072118, 072200, 072206
Khanun (2023)072718, 072806, 072812, 072818
Lan (2023)080800, 080900, 080906, 080912
Bolaven (2023)100806, 100812, 100818, 100900, 100906
Disclaimer/Publisher’s Note: The statements, opinions and data contained in all publications are solely those of the individual author(s) and contributor(s) and not of MDPI and/or the editor(s). MDPI and/or the editor(s) disclaim responsibility for any injury to people or property resulting from any ideas, methods, instructions or products referred to in the content.

