Article

Driving Factors and Decoupling Effects of Non-CO2 Greenhouse Gas Emissions from Agriculture in Southwest China

1
College of Architecture and Environment, Sichuan University, Chengdu 610065, China
2
College of Carbon Neutrality Future Technology, Sichuan University, Chengdu 610065, China
3
China Merchants Ecological Environmental Protection Technology Co., Ltd., Chongqing 400067, China
*
Authors to whom correspondence should be addressed.
Atmosphere 2024, 15(9), 1084; https://doi.org/10.3390/atmos15091084
Submission received: 31 July 2024 / Revised: 24 August 2024 / Accepted: 3 September 2024 / Published: 6 September 2024
(This article belongs to the Section Air Pollution Control)

Abstract

:
In light of the growing demand for green and low-carbon development, the advancement of low-carbon agriculture in alignment with China’s specific national circumstances is imminent. Given this urgency, the accounting of non-CO2 greenhouse gas (GHG) emissions in China’s agricultural system is still in the process of continuous research and improvement. Therefore, in this paper, we present an account of agricultural non-CO2 GHG emissions in Southwest China from 1995 to 2021, based on the carbon emission coefficient method. Furthermore, we explore the extent of the influence of the drivers and the relationship with economic development, utilizing the Stochastic Impact of Regression of Population, Affluence, and Technology (STIRPAT) model and the Tapio model. We observe a general trend of increasing and then decreasing non-CO2 GHG emissions from agriculture in the Southwest region, with a pattern of higher in the center and lower in the east and west. Economic, demographic, structural, and technological levels show different degrees of impact in different provinces, favoring the development of targeted agricultural planning policies in each region. For the majority of the study period, there was a weak or strong decoupling between economic growth and GHG emissions. Finally, recommendations are made to promote low-carbon agricultural development in Southwest China, providing a database and policy support to clarify the GHG contribution of the agricultural system.

1. Introduction

Global warming has been caused by the massive emission of GHG, with its harmful effects on nature and humanity [1], and it has become one of the most pressing environmental problems, resulting in, for instance, the melting of glaciers, the rising of sea levels, and the occurrence of heat waves [2,3,4]. In response, a global shift towards the implementation of low-carbon or even zero-carbon strategies has been observed. As one of the largest emitters of carbon dioxide, great importance is attached by China to the issue of climate change caused by GHG emissions. The issue has been placed at the forefront of China’s governance, and a solemn commitment has been made by the country to achieve the “30·60” carbon peak and carbon neutrality goal [5].
Currently, approximately 40% of global methane (CH4) and about 60% of nitrous oxide (N2O) are emitted by agricultural activities. Furthermore, 10–12% of total global anthropogenic GHG emissions are accounted for by agricultural sources of non-CO2 GHG [6], and this proportion is increasing annually [7]. As a significant agricultural country, China’s agricultural sector is a significant contributor to GHG emissions, accounting for approximately 15% of the country’s total emissions in 2021 [8]. At this stage, China’s autonomous contribution targets and carbon intensity binding targets are mainly set for carbon dioxide emissions. Failure to control non-CO2 GHG emissions will offset the reductions in carbon dioxide emissions [9]. Therefore, it is crucial to understand these emissions from agriculture and their driving factors to promote low-carbon agricultural development in China.
Previous literature has examined agricultural GHG at multiple scales and from multiple sources [10,11,12,13]. From the perspective of the study area, several studies have explored GHG emissions from agricultural sources at the national or provincial level. Tian et al. [14] calculated the agricultural carbon emissions of 31 provinces and cities in China from 1995 to 2010. Xiong et al. [15] calculated agricultural carbon emissions in Xinjiang for the period of 1991–2014. Also, agricultural carbon emissions were measured in Shandong [16], Jilin [17], Fujian [18], and Jiangsu provinces [19]. In these studies, GHG generated from agricultural activities was considered as a contributor overall when calculating carbon emissions. Some scholars have also estimated carbon emissions from the perspective of different emission sources. For instance, Tian et al. [20] quantified the emissions from crop production and livestock production from the production perspective and estimated the carbon emissions from agricultural production in Hunan Province, China, from 1998 to 2012. In contrast, Shi et al. [21] have tended to measure fertilizers, pesticides, agricultural films, and the use of fossil fuels in the factor inputs. Chu et al. [12] employed the carbon emission coefficient method to provide a comprehensive evaluation of non-CO2 GHG emissions from agriculture at the provincial level. Some studies have assessed the overall carbon emissions from agricultural sources at the national level and in individual provinces. However, there is a paucity of regional long-term studies. Su et al. [4] demonstrated the existence of strong interprovincial spatial linkages in agricultural carbon emissions; Wu et al. [22] showed that there was interactive evolution among neighboring provinces and that a holistic study of the region could help to achieve a regional low-carbon transition. These prior studies provide a solid foundation for the relationship between emissions and drivers.
The growing literature streams utilize a variety of approaches to uncover the factors driving carbon emissions [23]. Among these, the STIRPAT model [19,24], Dee’s logarithmic metrics decomposition (LMDI) [25], and the Kaya formula [26] have proven to be powerful tools for investigating these effects. The existing literature provides different insights into the drivers of agricultural carbon emissions. Xia et al. [27] found that agricultural economic development and population size in Zhejiang Province had a positive effect, and agricultural structure and technology development played an inhibiting role. However, Zhu et al. [28] confirmed that the level of agricultural economic development, agricultural structure, and technological progress in Jiangxi Province had a strong driving effect. It can be seen that there should be regional differences in each driving effect. The integration of data enables the identification of specific factors influencing carbon emissions, thereby paving the way for the formulation of effective countermeasure recommendations aimed at reducing carbon emissions and promoting the development of low-carbon agriculture within the study area.
As a consequence of the growth in the scale of human production and the improvement of living standards, GHG emissions continue to increase. Academics have begun to investigate the correlation between GHG emissions and economic growth, with the majority of studies employing the Environmental Kuznets Curve (EKC) [29,30,31] and decoupling model. In the application of the decoupling model, the majority of existing studies employ the decoupling factor proposed by the Organization for Economic Cooperation and Development (OECD), directly apply the Tapio decoupling model [32], or integrate it with the LMDI model [33,34] and C-D production function [28]. At the beginning of this century, the decoupling elasticity of agricultural carbon emissions in most domestic provinces was in a state of weak decoupling [35]. In recent years, however, the decoupling characteristics of domestic plantation carbon emissions have generally shown a trend of transition from weak decoupling to strong decoupling. Nevertheless, there are differences among provinces and regions [36].
In conclusion, the current research on agricultural carbon emissions primarily employs time series to investigate agricultural GHG emissions at the national level or within a specific province over a specified period. However, there is a paucity of studies that examine the spatial and temporal evolution of non-CO2 GHG emissions from agricultural sources or that account for regional differences. This may, in turn, limit the applicability of the research findings. Furthermore, research on agricultural GHG emissions in the western region is still in its infancy. Additionally, the decoupling relationship between agricultural non-CO2 GHG emissions and economic development requires further investigation, as does the analysis of driving factors in the southwestern region.
This paper has three main contributions. First, we examine the temporal and spatial evolution characteristics of non-CO2 GHG emission intensity from agricultural activities. Although existing studies have accounted for the total GHG emissions from agricultural sources in terms of different emission sources and times [37], there is a lack of literature that systematically considers the spatial and temporal changes of non-CO2 GHG emissions from agricultural sources. Therefore, this paper enriches the research on non-CO2 GHG emissions from agricultural sources. Second, this study addresses the research gap in the western region regarding non-CO2 GHG from agricultural sources by focusing on non-CO2 GHG emissions from agriculture in Southwest China. As one of the six major grain-producing regions in China, the Southwestern region has a high level of GHG emissions from agricultural sources and a high potential for emission reduction. This provides a framework for the southwestern region to develop emission reduction policies that align with the specific characteristics of the region. Third, this paper employs the STIRPAT model to analyze the influence mechanism of demographic, economic, and technological factors. It determines the importance of drivers in the five provinces of Southwest China and applies the Tapio decoupling model to clarify the relationship between different types of non-CO2 GHG emissions and the agricultural economy. It is noteworthy that the current decoupling theories are primarily applied to secondary and tertiary industries [38] or are often focused on the aggregate or intensity perspective [39]. Consequently, we elucidate the interrelationship between non-CO2 GHG emissions and the agricultural economy across distinct categories.
In light of these considerations, this paper addresses the evolutionary characteristics of the spatio-temporal pattern of total agricultural non-CO2 GHG emissions and the intensity of those emissions in Southwest China from 1995 to 2021. It also explores the driving factors of non-CO2 GHG emissions in the region based on the STIRPAT model. Furthermore, the correlation between agricultural economic growth in the Southwest China region and non-CO2 GHG emissions is analyzed using the Tapio model, with the objective of proposing effective suggestions for Southwest China’s agricultural low carbon development and thus providing a reference for local governments in formulating regional low carbon policies.

2. Study Area and Methodology
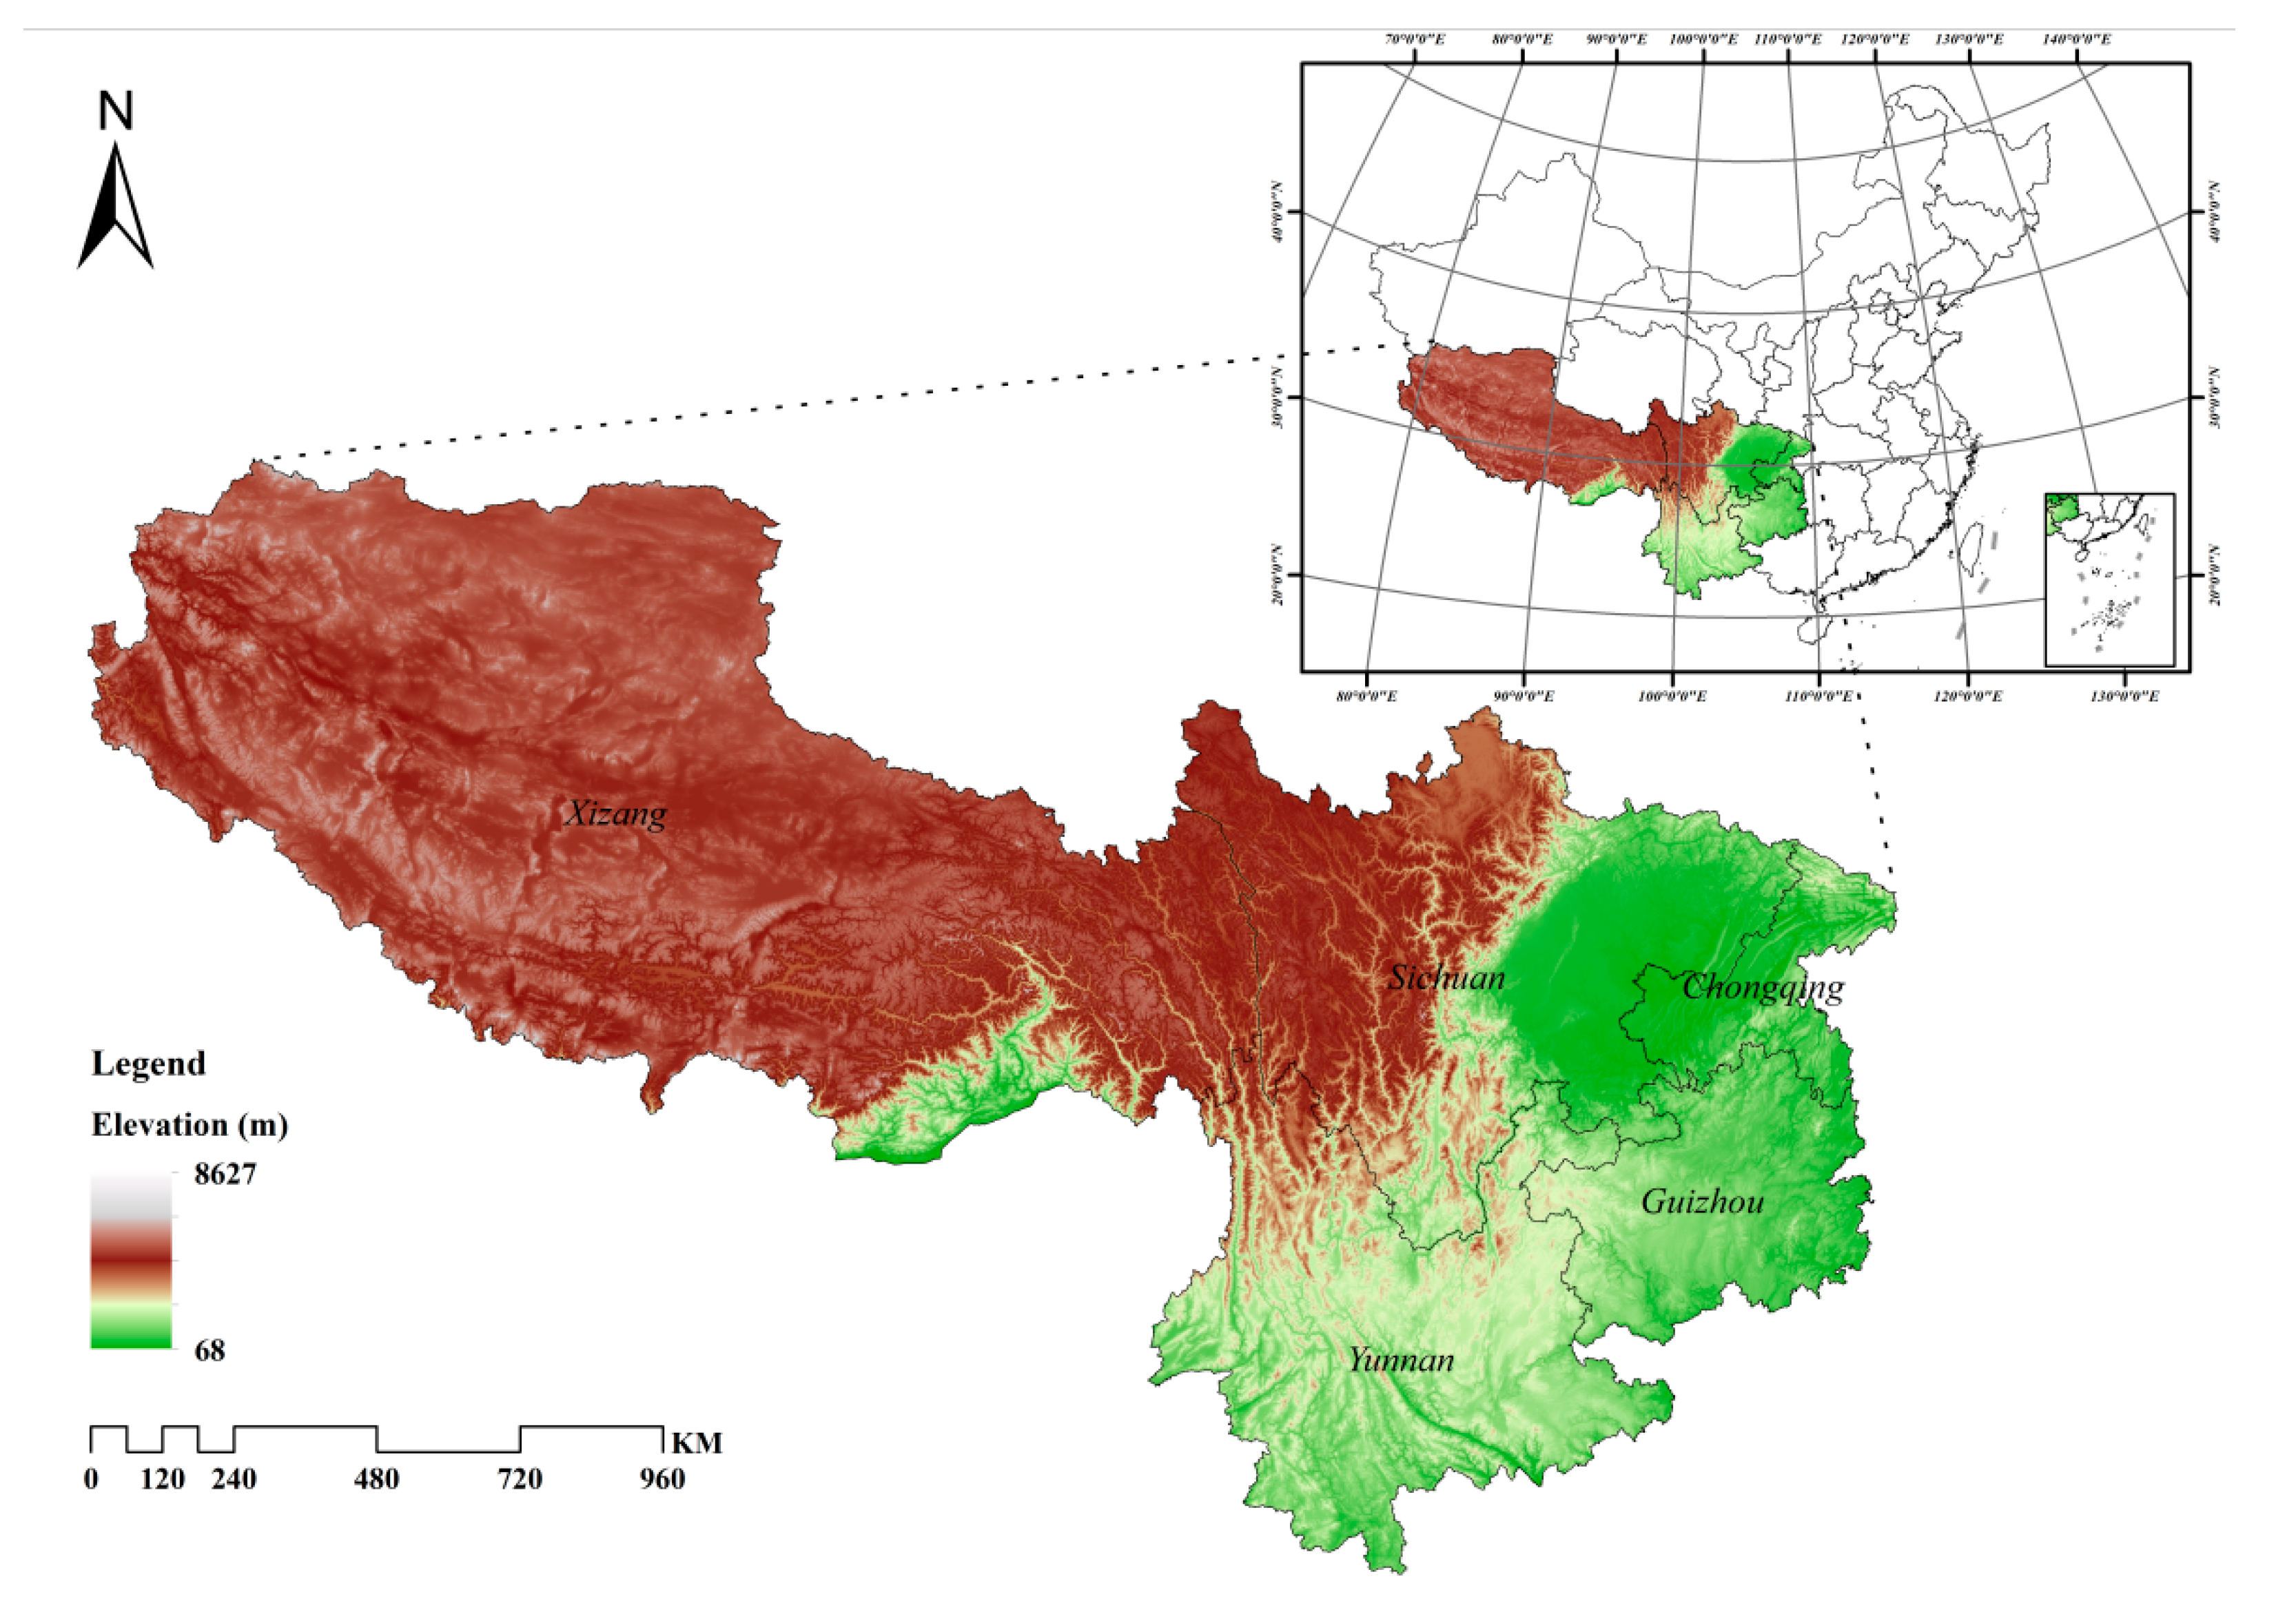
2.1. Study Area

The Southwest Region is one of seven major natural geographic divisions in China, situated between 78°25′ E–110°11′ E and 21°08′ N–36°53′ N, as shown in Figure 1, with administrative division encompasses five provincial and municipal areas, including Chongqing Municipality, Sichuan Province, Yunnan Province, Guizhou Province, and the Xizang Autonomous Region, with a total area of approximately 2.55 million square kilometers. With its rich and varied climate and abundant water resources, Southwest China is the region with the largest number of agricultural development patterns in China, which contributes to the diversity and high productivity of agricultural production in the region. According to the China Rural Statistical Yearbook, the cultivated land area in Southwest China accounted for 15% of the country’s cultivated land area in 2017. Furthermore, the per capita cultivated land area is on par with that of the whole country, and the annual stock of large-sized livestock accounted for 28% of the country’s total stock. As one of the important agricultural production bases in the country, the agricultural activities in the Southwest region not only play a key role in local economic and social development but also have a non-negligible impact on national climate change. In particular, with the advancement of agricultural modernization and the increase in the intensity of agricultural production, the backwardness of the region’s comprehensive agricultural level, the weak foundation of agricultural production, the irrational industrial structure, and the pressure on the utilization of manure resources are becoming increasingly prominent, and they have become important issues that need to be urgently resolved [40].

2.2. Research Methodology

Methods for Measuring Agricultural Non-CO2 GHG Emissions
This paper employs the carbon emission coefficient method to estimate non-CO2 GHG emissions from agriculture in Southwest China by the recommended approach outlined in the Intergovernmental Panel on Climate Change (IPCC) 2006 Guidelines for National Greenhouse Gas Inventories 2019 Revision and the Guidelines for the Preparation of Provincial Greenhouse Gas Inventories of the National Development and Reform Commission (NDRC). This approach encompasses four components: first, methane emissions from rice fields; second, nitrous oxide emissions from agricultural land; third, methane emissions from animal enteric fermentation; and fourth, animal manure management methane and nitrous oxide emissions. The estimation model is shown in Equation (1).
E = E i = E F i × a i × x
where E is the total agricultural non-CO2 GHG emissions; E i represents non-CO2 GHG emissions from agricultural sources by source; E F i and a i represent non-CO2 GHG emission factors and activity amount of agricultural sources, respectively; x is the global warming potential (GWP100) conversion factor of NO2 and CH4, for CH4, x = 28; for N2O, x = 265 [41].
Methane emissions from paddy fields result from the decomposition of organic matter in paddy fields by methanogens during the process of rice cultivation. Nitrous oxide emissions from agricultural land are comprised of two distinct categories: direct emissions and indirect emissions. Direct emissions are caused by the application of nitrogen fertilizers, manure, and straw to the field. Indirect emissions include nitrous oxide emissions resulting from atmospheric nitrogen deposition and nitrogen leaching runoff loss. The values of emission factors for different regions are shown in Table 1, which were obtained by referencing the IPCC 1996 Guidelines, the IPCC 2006 Guidelines, and the Guidelines for the Preparation of Provincial Greenhouse Gas Inventories.
Carbon emissions from livestock farming are animal enteric fermentation methane emissions and manure management methane and nitrous oxide emissions, and the emission factors for each carbon source are shown in Table 2.

2.3. STIRPAT Model

In the early 1970s, Ehrlichg and Hdlden [42] proposed a general formula IPAT model for environmental impacts. However, the model did not adequately reflect the impact of human factors on the environment. York et al. [43] subsequently improved the model and established an extensible stochastic environmental impacts assessment (STIRPAT) model, which can assess the relationship between population, economy, technology, and environment. The model expression is shown in Equation (2).
I = a P b × A c × T d × e
where: I, P, A, and T represent environmental impact, population, affluence, and technical level, respectively; a is the constant term, b, c, and d are the elastic coefficients, and is the model error term. To reduce the fluctuation caused by data instability and eliminate the phenomenon that the data may appear heteroscedasticity, it is usually converted into a logarithmic form:
ln I = ln a + b ln P + c ln A + d ln T + ln e
The STIRPAT model is a widely utilized framework in environmental impact analysis. Its incorporation of stochastic terms enhances the model’s flexibility in examining the influence of factors such as population (P), affluence (A), and technology (T) on environmental impacts (I). Additionally, it allows for the incorporation of other potential variables or interactions. In the context of this paper, the STIRPAT model was employed to analyze the contribution and trends of various factors to non-CO2 GHG impacts in different provinces of the Southwest region, as well as in the entire area. The model was selected for its capacity to assess the roles of factors within a complex system, thereby identifying the key drivers and constraints to low-carbon development in agriculture. Furthermore, it provides a scientific basis for policy formulation.
Expanding population size and rising income levels will change the demand for agricultural products, with significant implications for agricultural production patterns and factor input behaviors, which in turn may lead to changes in agricultural GHG emissions. The application of agricultural mechanization can markedly enhance the efficiency of agricultural production, although this may be accompanied by an increase in energy consumption. This, in turn, may exert a promoting or inhibitory effect on GHG emissions. The term “agricultural industrial structure” is used to describe the proportion of the planting industry in agriculture. As the industrial structure in Southwest China undergoes adjustments, agricultural GHG emissions will also change accordingly. The urbanization rate has the dual effect of reducing agricultural emissions through industrial upgrading and circumventing reductions in agricultural production by increasing the intensity of agricultural material and machinery inputs, which in turn leads to an increase in GHG emissions. Financial support for agricultural research and development facilitates the advancement and implementation of low-carbon agricultural technologies. The advancement of mechanical technologies has the potential to increase agricultural GHG emissions, whereas the development of biological technologies may contribute to a reduction in GHG emissions.
Therefore, the change in non-CO2 GHG emissions from agricultural sources is the result of the combined effect of the number of agricultural employees, the per capita disposable income of rural residents, the total power of agricultural machinery, the structure of the agricultural industry, the urbanization rate, and the funds for agricultural scientific and technological activities [44,45]. The extended form of the STIRPAT model is shown in Equation (4).
ln C E = ln a + b ln A E + c ln D I + d ln T P + f ln A S + g ln U R + h ln A F + ln e
where CE is non-CO2 GHG emissions from agricultural sources; AE represents the number of people employed in agriculture (104) as an indicator of the population; DI represents the per capita disposable income of rural residents (yuan·person−1) as an indicator of wealth; TP represents the total power of agricultural machinery (108 W) as an indicator to measure the technical level; AS represents agricultural industrial structure (%); UR stands for urbanization rate (%), reflecting the level of urbanization; AF indicated agricultural science and technology activities (104 yuan); The elastic coefficients b, c, d, f, g and h indicate that when AE, DI, TP, AS, UR, and AF change by 1%, they cause b%, c%, d%, f%, g%, and h% changes of CE, respectively.

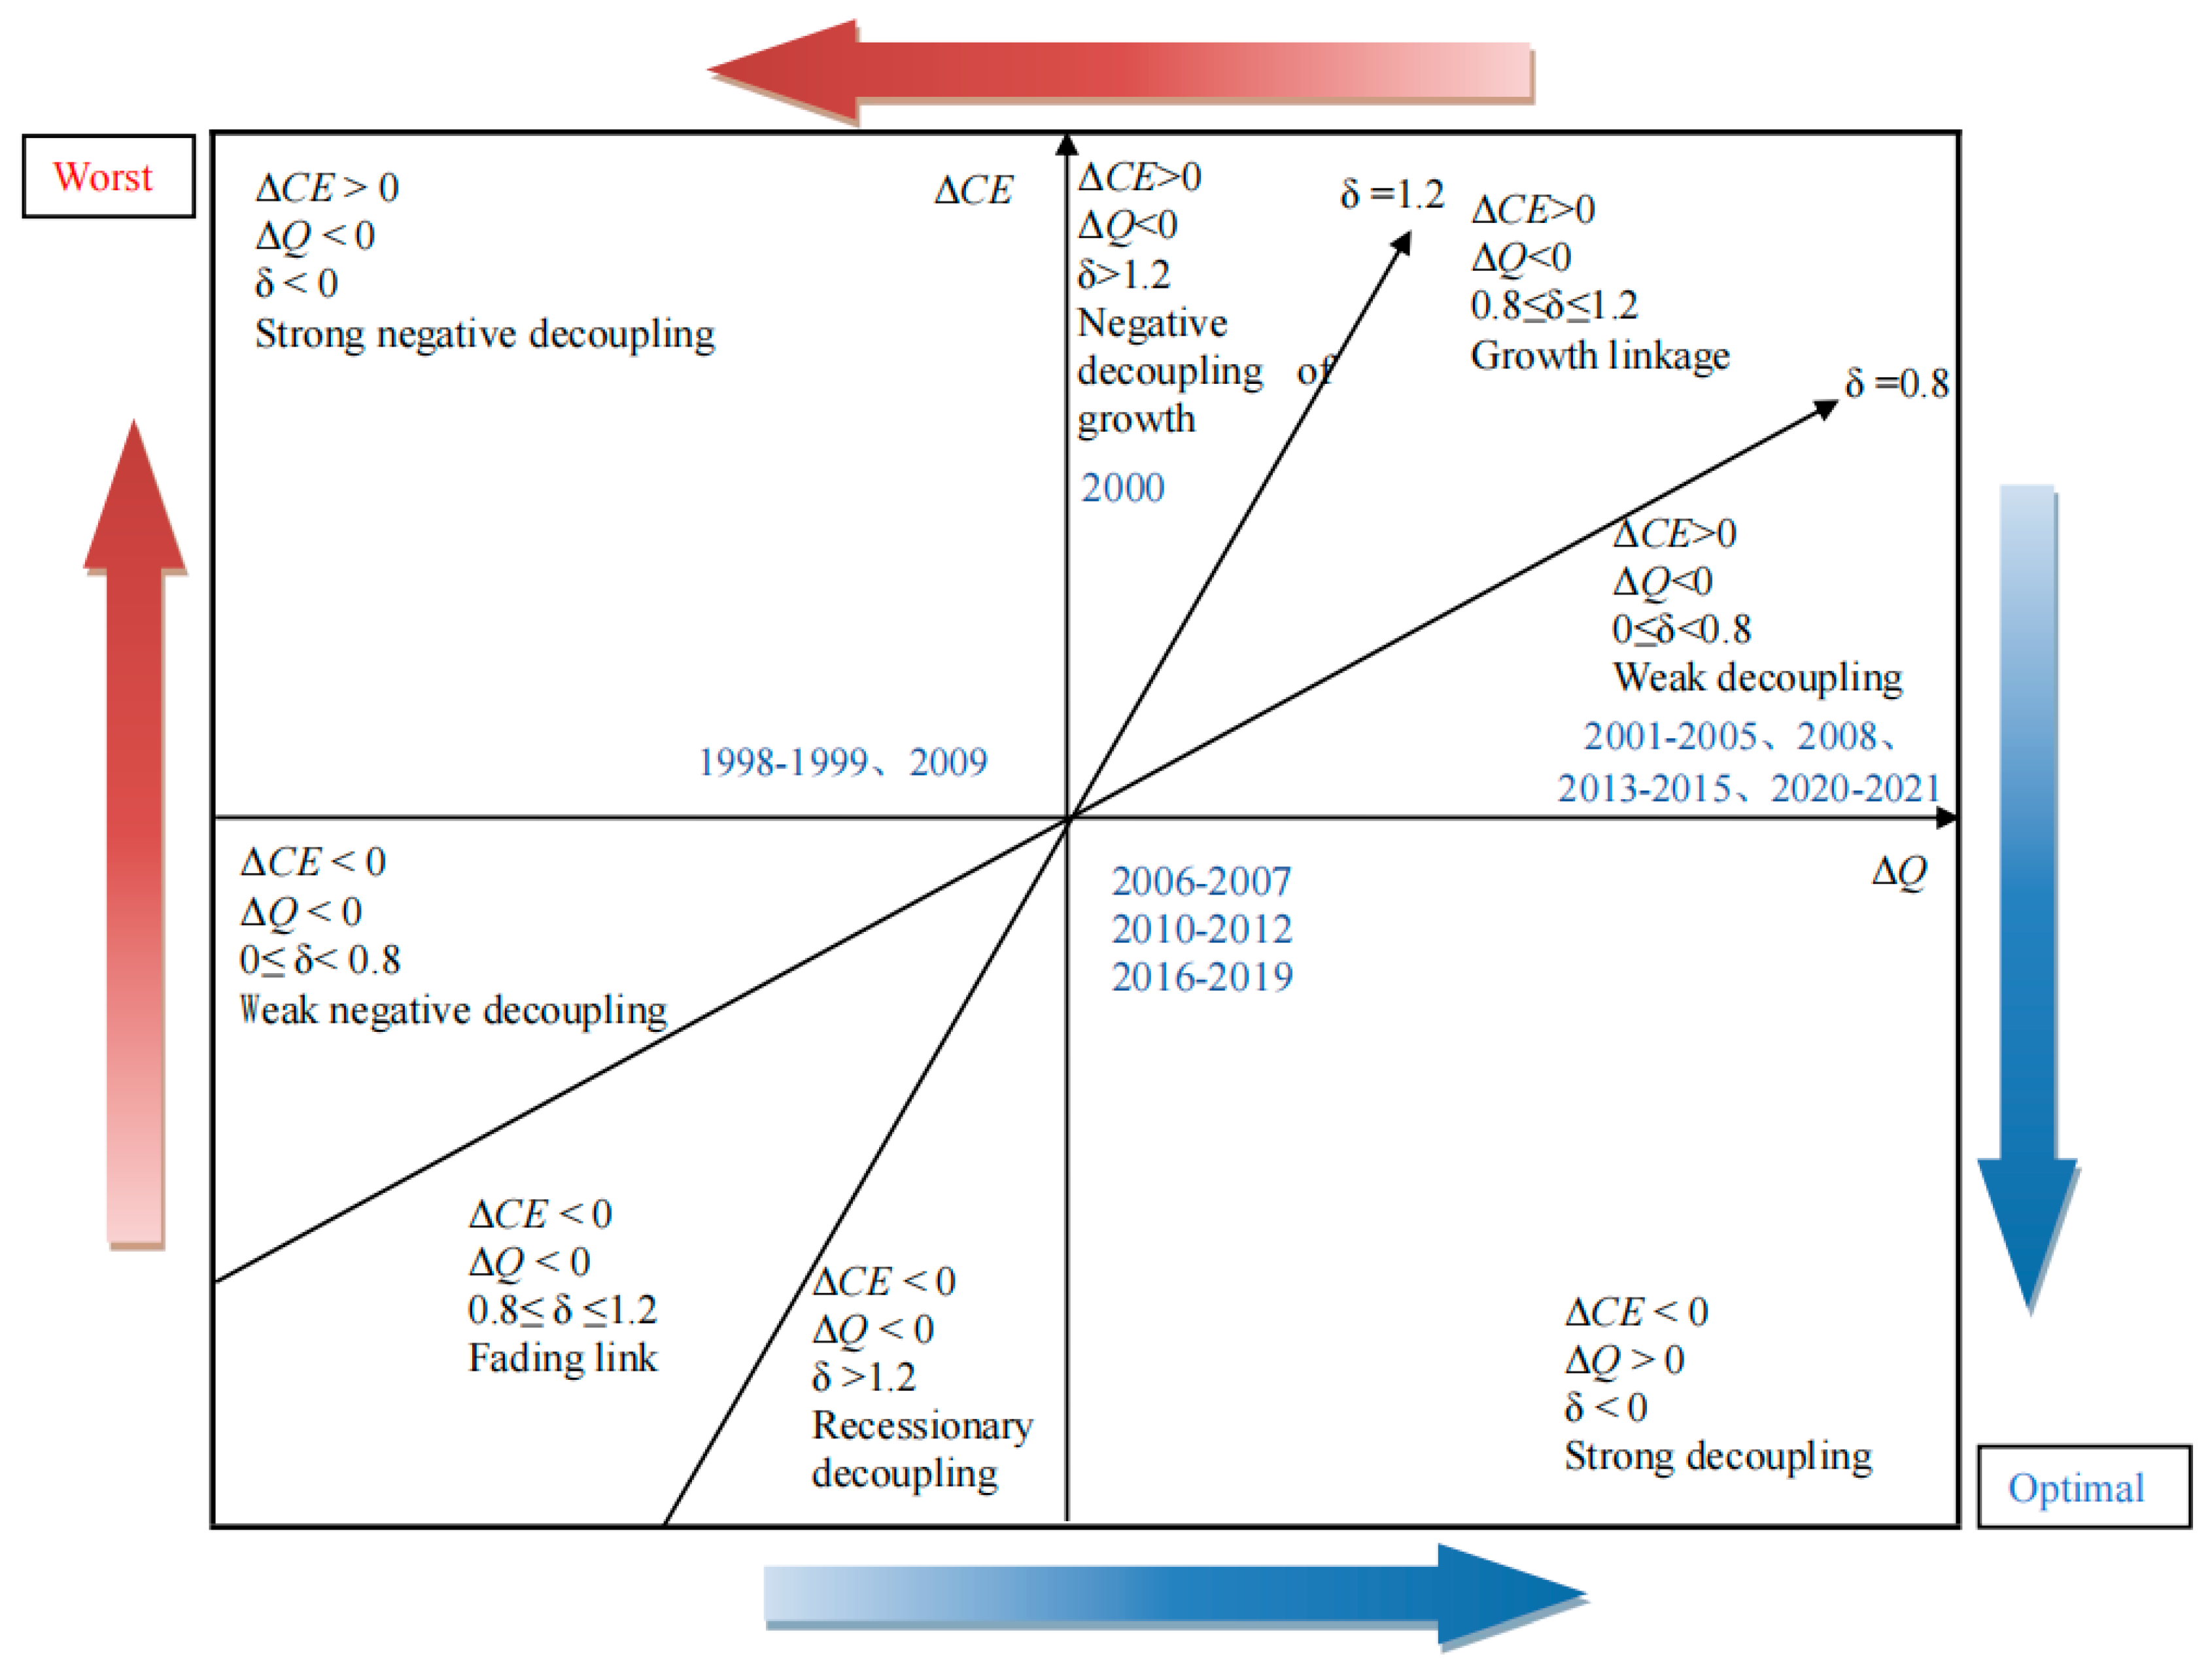
2.4. Tapio Decoupling Model

The Tapio model is a method used to analyze the state of decoupling between variables. It is one of the main methods used to study the decoupling relationship between carbon emissions and economic growth in various industries. The model is based on the concept of elasticity coefficient and subdivides the decoupling relationship into various types (e.g., strong decoupling, weak decoupling, expansion-negative decoupling, etc.). This enables a more accurate description of the dynamic relationship between economic development and resource consumption or environmental pollution [46]. In this paper, the Tapio model is employed for the purpose of analyzing the decoupling between economic development and non-CO2 GHG emissions. The model enables the identification of decoupling trends across different time periods and the analysis of the factors driving these changes. This not only facilitates a more nuanced comprehension of the equilibrium between economic advancement and environmental stewardship but also offers robust evidence for the development of efficacious environmental policies.
The elasticity coefficient (δ) of decoupling carbon emissions from economic growth is calculated as follows:
δ = Δ C E / C E Δ Q / Q
where Q is the agricultural output value, ΔCE and ΔQ respectively represent the changes in non-CO2 emissions and agricultural output value in a certain period.
The decoupling states corresponding to different δ values are shown in Table 3. The Tapio decoupling model can be divided into eight states [47,48] based on non-CO2 emissions (∆CE), output growth (∆Q), and the corresponding decoupling elasticity coefficient (δ). The specific explanation is that strong decoupling is the most ideal state, indicating that economic growth at the same time reduces carbon emissions; strong negative decoupling is the worst condition, indicating that the economic recession is accompanied by an increase in carbon emissions. Weak decoupling means that the growth rate of carbon emissions is slower than that of economic growth. Weak negative decoupling means that the rate of carbon emission reduction is slower than the rate of economic decline. Recession decoupling means that carbon emissions are declining faster than the economy is declining. Negative growth decoupling means that economic growth comes at the cost of the rapid increase in carbon emissions. The growth/recession link state indicates that carbon emissions increase or decrease simultaneously with economic growth (growth link).
To investigate the relationship between various types of non-CO2 GHG and economic growth, the decoupling elasticity is further decomposed into five decoupling elasticity indicators [49], and the extended Tapio decoupling model is shown in Equation (6).
δ = Δ C E / C E Δ Q / Q = Δ C E P M + Δ C E L N + Δ C E F M + Δ C E M M + Δ C E M N C E Δ Q / Q = Δ C E P M C E Δ Q Q + Δ C E L N C E Δ Q Q + Δ C E F M C E Δ Q Q + Δ C E M M C E Δ Q Q + Δ C E M N C E Δ Q Q = δ P M + δ L N + δ F M + δ M M + δ M N
where δ P M , δ L N , δ F M , δ M M , δ M N represents the elastic coefficient of methane decoupling in paddy fields, the elastic coefficient of nitrous oxide decoupling in agricultural land, the elastic coefficient of methane decoupling in animal intestinal fermentation, the elastic coefficient of methane decoupling in animal manure management, and the elastic coefficient of nitrous oxide decoupling in animal manure management, respectively.

2.5. Data Resources

The data sources involved are shown in Table 4. The areas of various crops and the number of livestock and poultry in the provinces involved in the accounting of non-CO2 GHG emissions in Southwest China are all from the China Rural Statistical Yearbook and China Agricultural Yearbook for 1996–2022, and the missing values are supplemented concerning the statistical yearbook of each province. For data related to driving factors, refer to China Statistical Yearbook and China Statistical Yearbook of Science and Technology from 1996 to 2022. The vector data of the research location map and agricultural non-CO2 emission spatial distribution map were obtained from the national basic geographic information database.

3. Results and Discussion

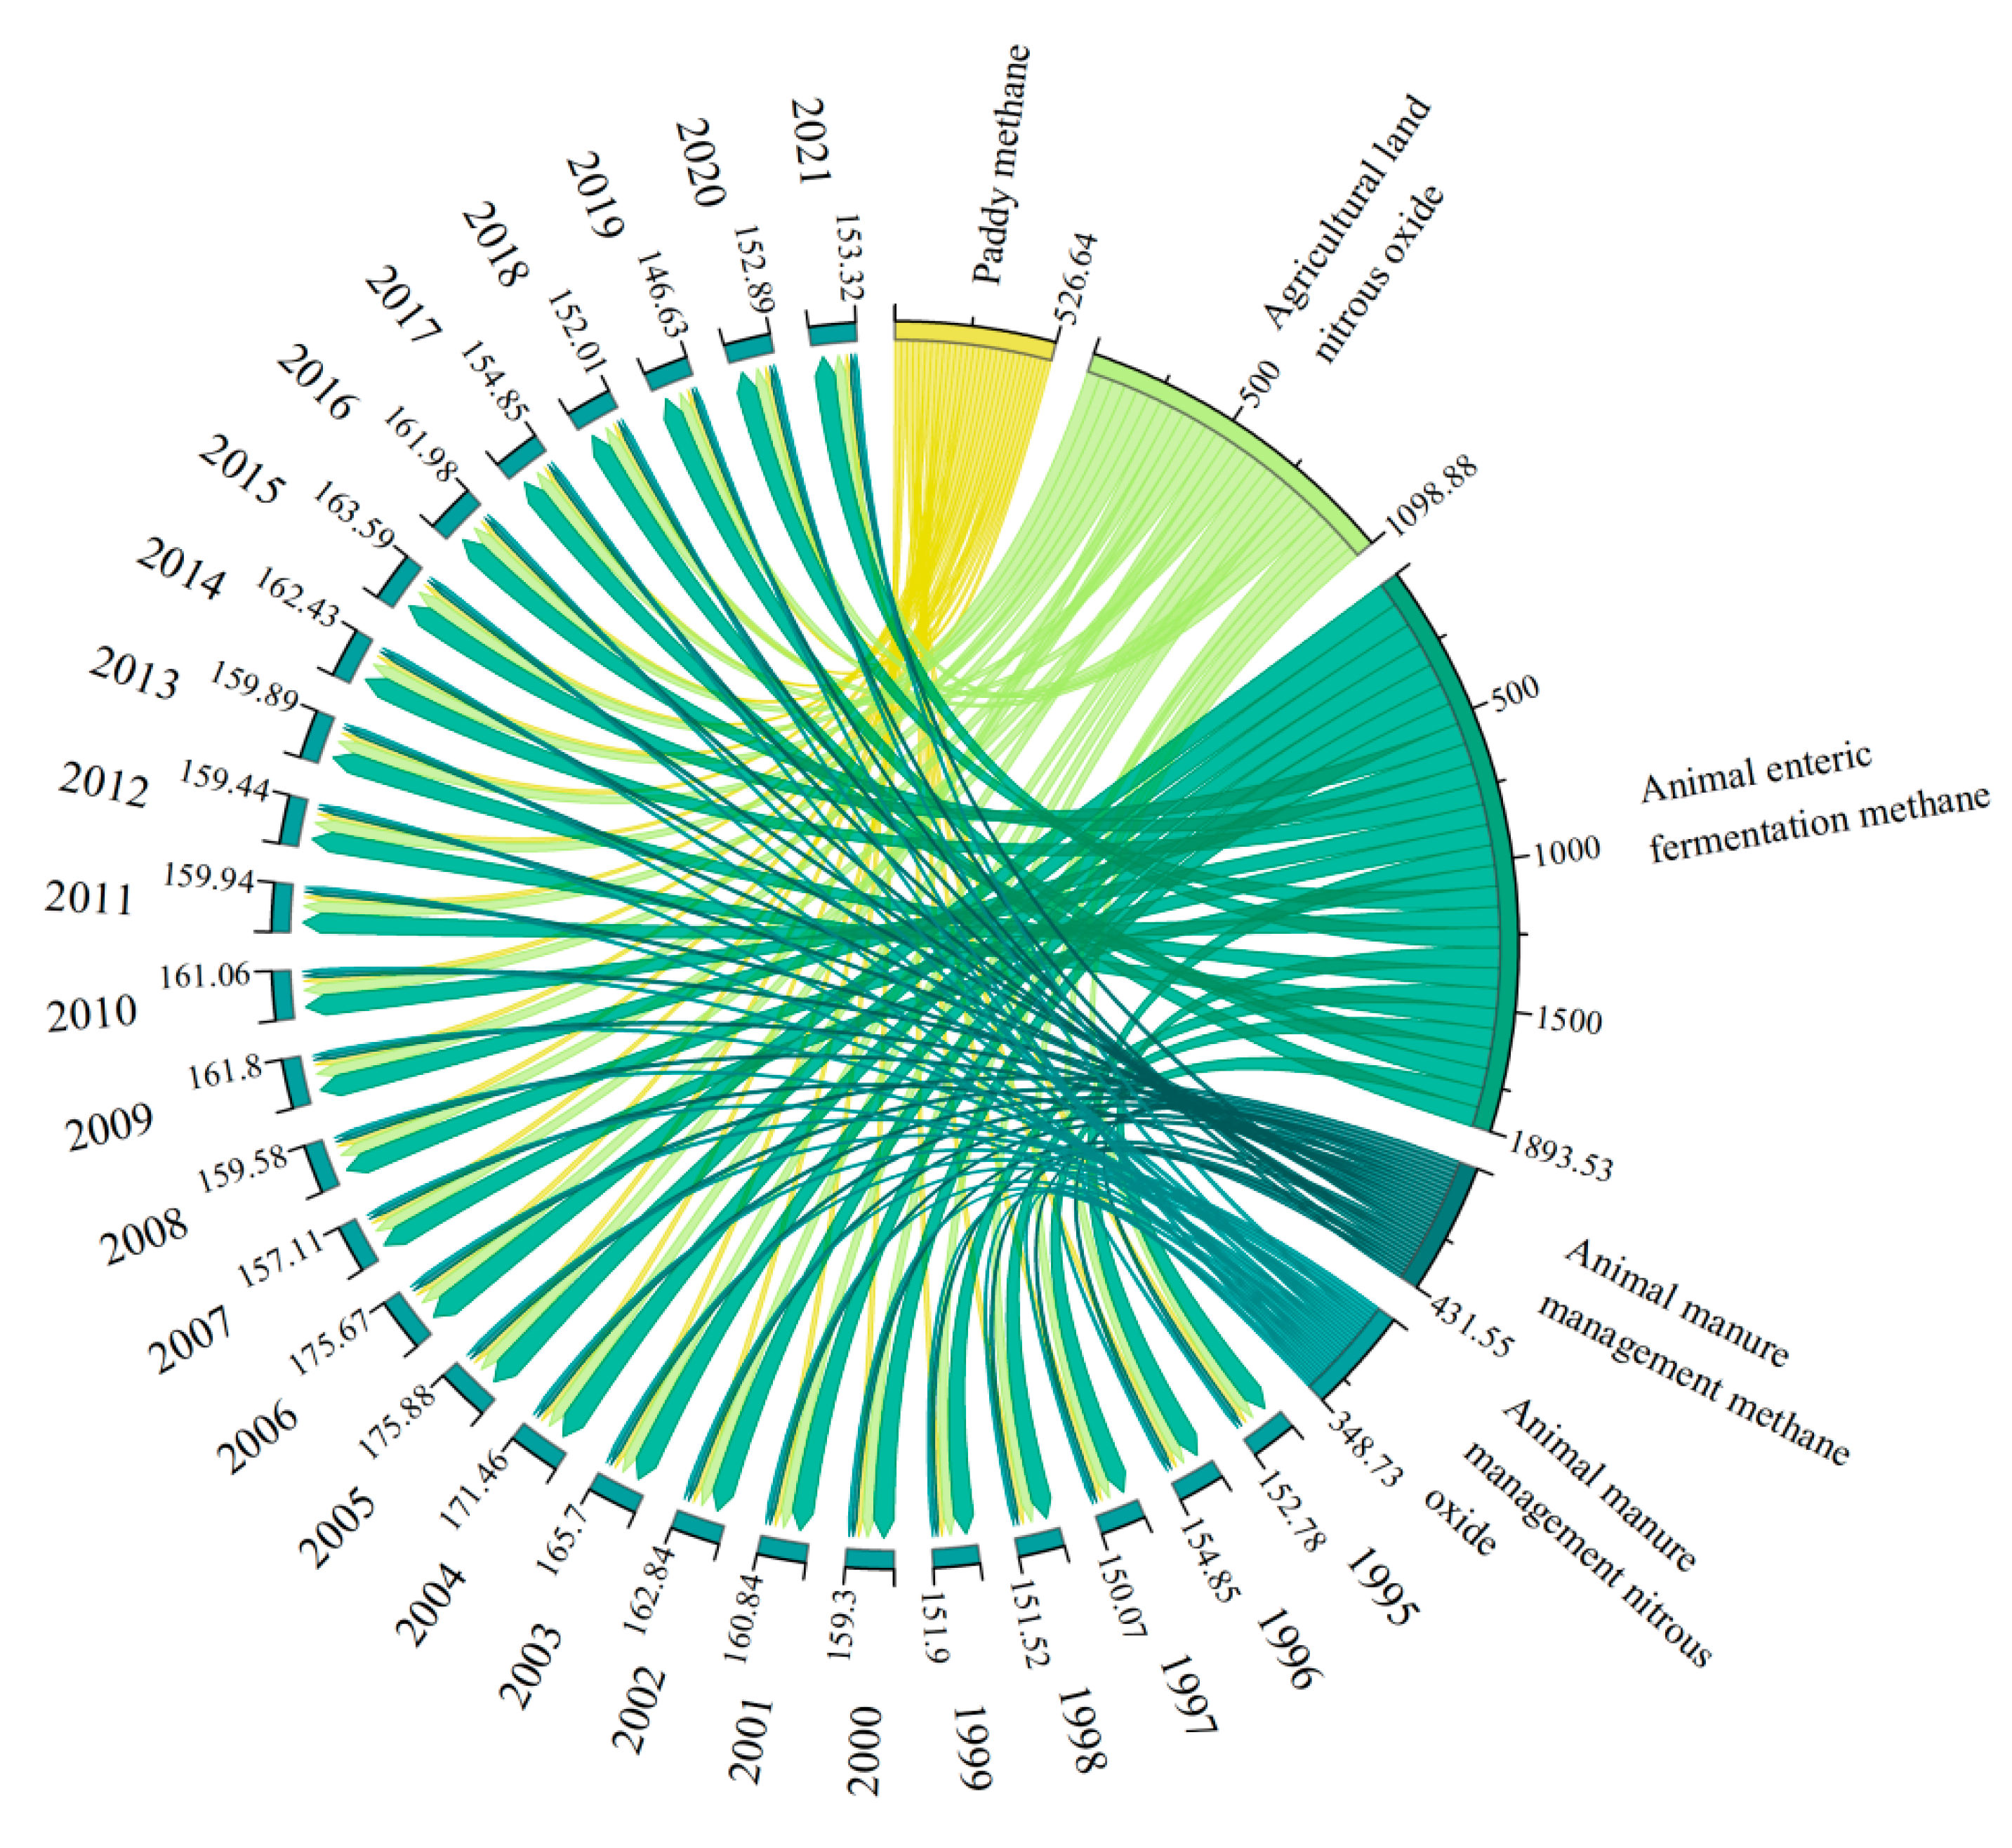
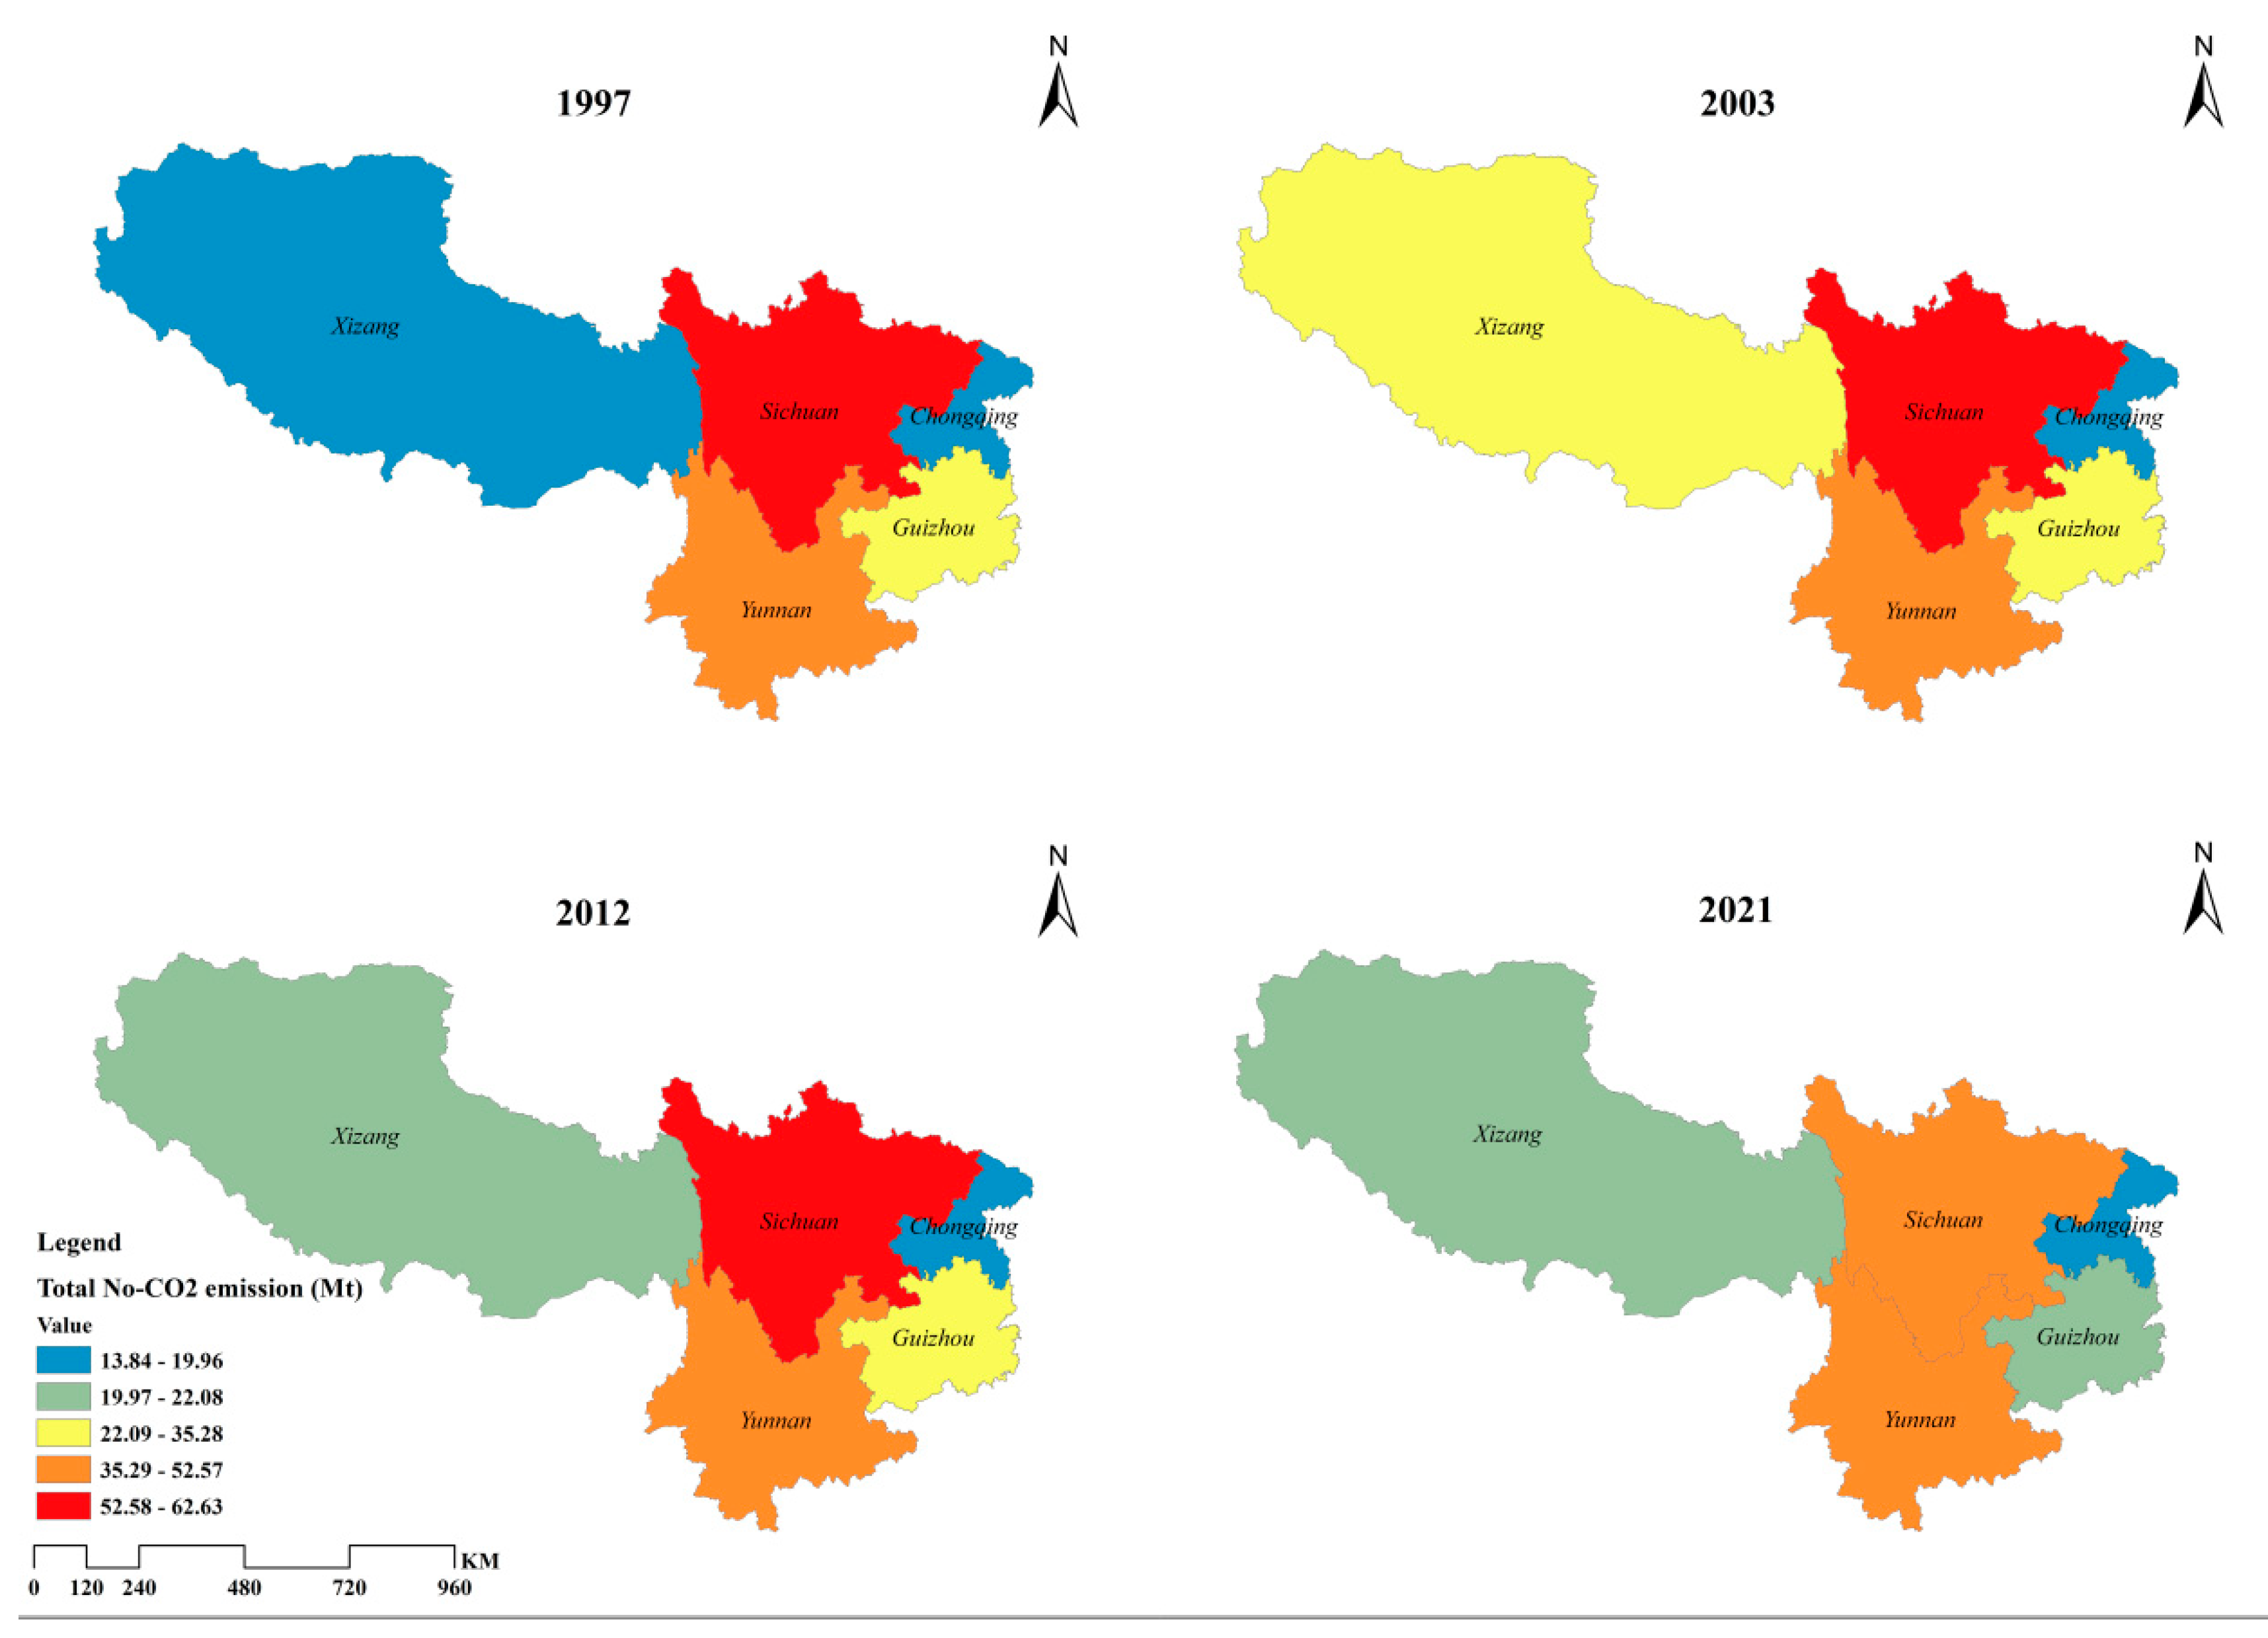
3.1. Spatio-Temporal Distribution of Non-CO2 GHG Emissions in Southwest China

Figure 2 shows the contribution of different sources of non-CO2 GHG emissions in the Southwest region from 1995–2021, as well as the total amount of emissions over the years. It can be observed that emissions from animal husbandry accounted for approximately two-thirds of the total emissions. Furthermore, methane emissions from livestock intestinal fermentation constituted the primary emission source of animal husbandry, accounting for 70.82% of the total emissions from animal husbandry between the years 1995 and 2021. Figure 3 depicts the growth rate and intensity of non-CO2 GHG emissions in the Southwest. About the temporal distribution of emissions, it can be observed that the agricultural non-CO2 GHG emissions of the five provinces in Southwest China exhibit a pronounced fluctuation over the period 1995–2021. From the trend of emission intensity, it can be seen that the emission intensity continues to decline, with obvious differences. This may be attributed to the progressive transition of agriculture in Southwest China from an extensive production model to a high-quality agricultural system, facilitated by the ongoing advancement of science and technology.
The fluctuating period can be divided into five distinct phases: an upward phase (1995–2005), a rapid decline phase (2006–2007), a stabilization phase (2008–2014), a slow decline phase (2015–2019), and a slow growth phase (2020–2021).
The initial phase exhibits a general fluctuating upward trend, reaching a peak of 175.88 Mt in 2005, representing an increase of 15.12% compared to 1995. This is primarily attributable to the implementation of a policy that favored agriculture and the abolition of agricultural taxes, which stimulated the enthusiasm of farmers and herdsmen for increased production, increased the input of agricultural resources, and promoted the recovery of agriculture, this led to an increase in carbon emissions.
The second stage is the rapid decline stage, which occurred from 2005 to 2007. Emissions dropped to 157.11 Mt, representing a 10.67% decrease from 2005. Statistical data show that the reduction in the area under rice cultivation and in the number of livestock farms has led to a reduction in the total amount of emissions, owing to the occupation of arable land for construction, the destruction of land by natural disasters, ecological fallowing and the reduction of arable land as a result of agricultural restructuring [50], and to the outbreak of an epidemic in 2006, which led to a drastic reduction in the production of hogs.
In the third stage, emissions remained relatively stable, at approximately 160.59 Mt. China had introduced a series of policy measures to mitigate sharply declining livestock production and to safeguard the effective supply of food, and in the absence of extreme disasters, agricultural GHG emissions had remained stable.
The fourth stage exhibited a gradual downward trend, reaching its lowest point in 2019, with emissions of 146.63 Mt. This is mainly due to the increase in the utilization rate of agricultural materials and the deepening of the country’s concept of developing green agriculture, with the country continuing to promote high-yield rice varieties with low emissions and research and development of excellent ruminant breed technology and large-scale feeding and management technology, among other measures.
The fifth stage is a period of slow growth, with total emissions in 2021 increasing by only 4.56% over 2019. Non-CO2 GHG emissions caused mainly by livestock farming are on the rise at this stage. With population growth and improved living standards, the demand for livestock and poultry products is increasing, and the scale of modern livestock farming is gradually expanding; however, China’s livestock industry has begun to focus on environmental protection and sustainable development, and to implement modes such as eco-livestock and organic livestock, so that the rise in agricultural GHG has not been significant.
Figure 4 illustrates the distribution of non-CO2 GHG emissions in various provinces and cities of the Southwest region for the years 1997, 2003, 2012, and 2021. It can be seen that the southwest region generally shows the emission pattern of “high in the center and low in the east and west”, with notable inter-provincial variations. The diverse geography and natural resources of the Southwest region directly influence non-CO2 GHG emissions from crop cultivation and animal husbandry. The data indicates that the regions with the highest agricultural emissions in Southwest China are situated in areas experiencing rapid social and economic development and possess relatively flat terrain.
The provinces of Sichuan and Yunnan have been the primary contributors to agricultural non-CO2 GHG emissions in the Southwestern region. These two regions are characterized by abundant water resources and extensive areas of arable land, which are conducive to agricultural production activities. Chongqing and Guizhou provinces are notable for their extensive hilly and mountainous regions, which present challenges for agricultural production activities. It is noteworthy that the gradual implementation of emission reduction technologies in Sichuan and Guizhou Province has resulted in a modest reduction in non-CO2 GHG emissions. Xizang is situated in an alpine region, and the primary source of agricultural carbon emissions is methane produced by animal husbandry, with total emissions comparable to those of Chongqing and Guizhou. However, the low scale of livestock farming, the existence of a large area of free-range farming, a large number of enteric fermentations and livestock manure negligent management, etc. triggered a non-CO2 GHG with an increasing process.

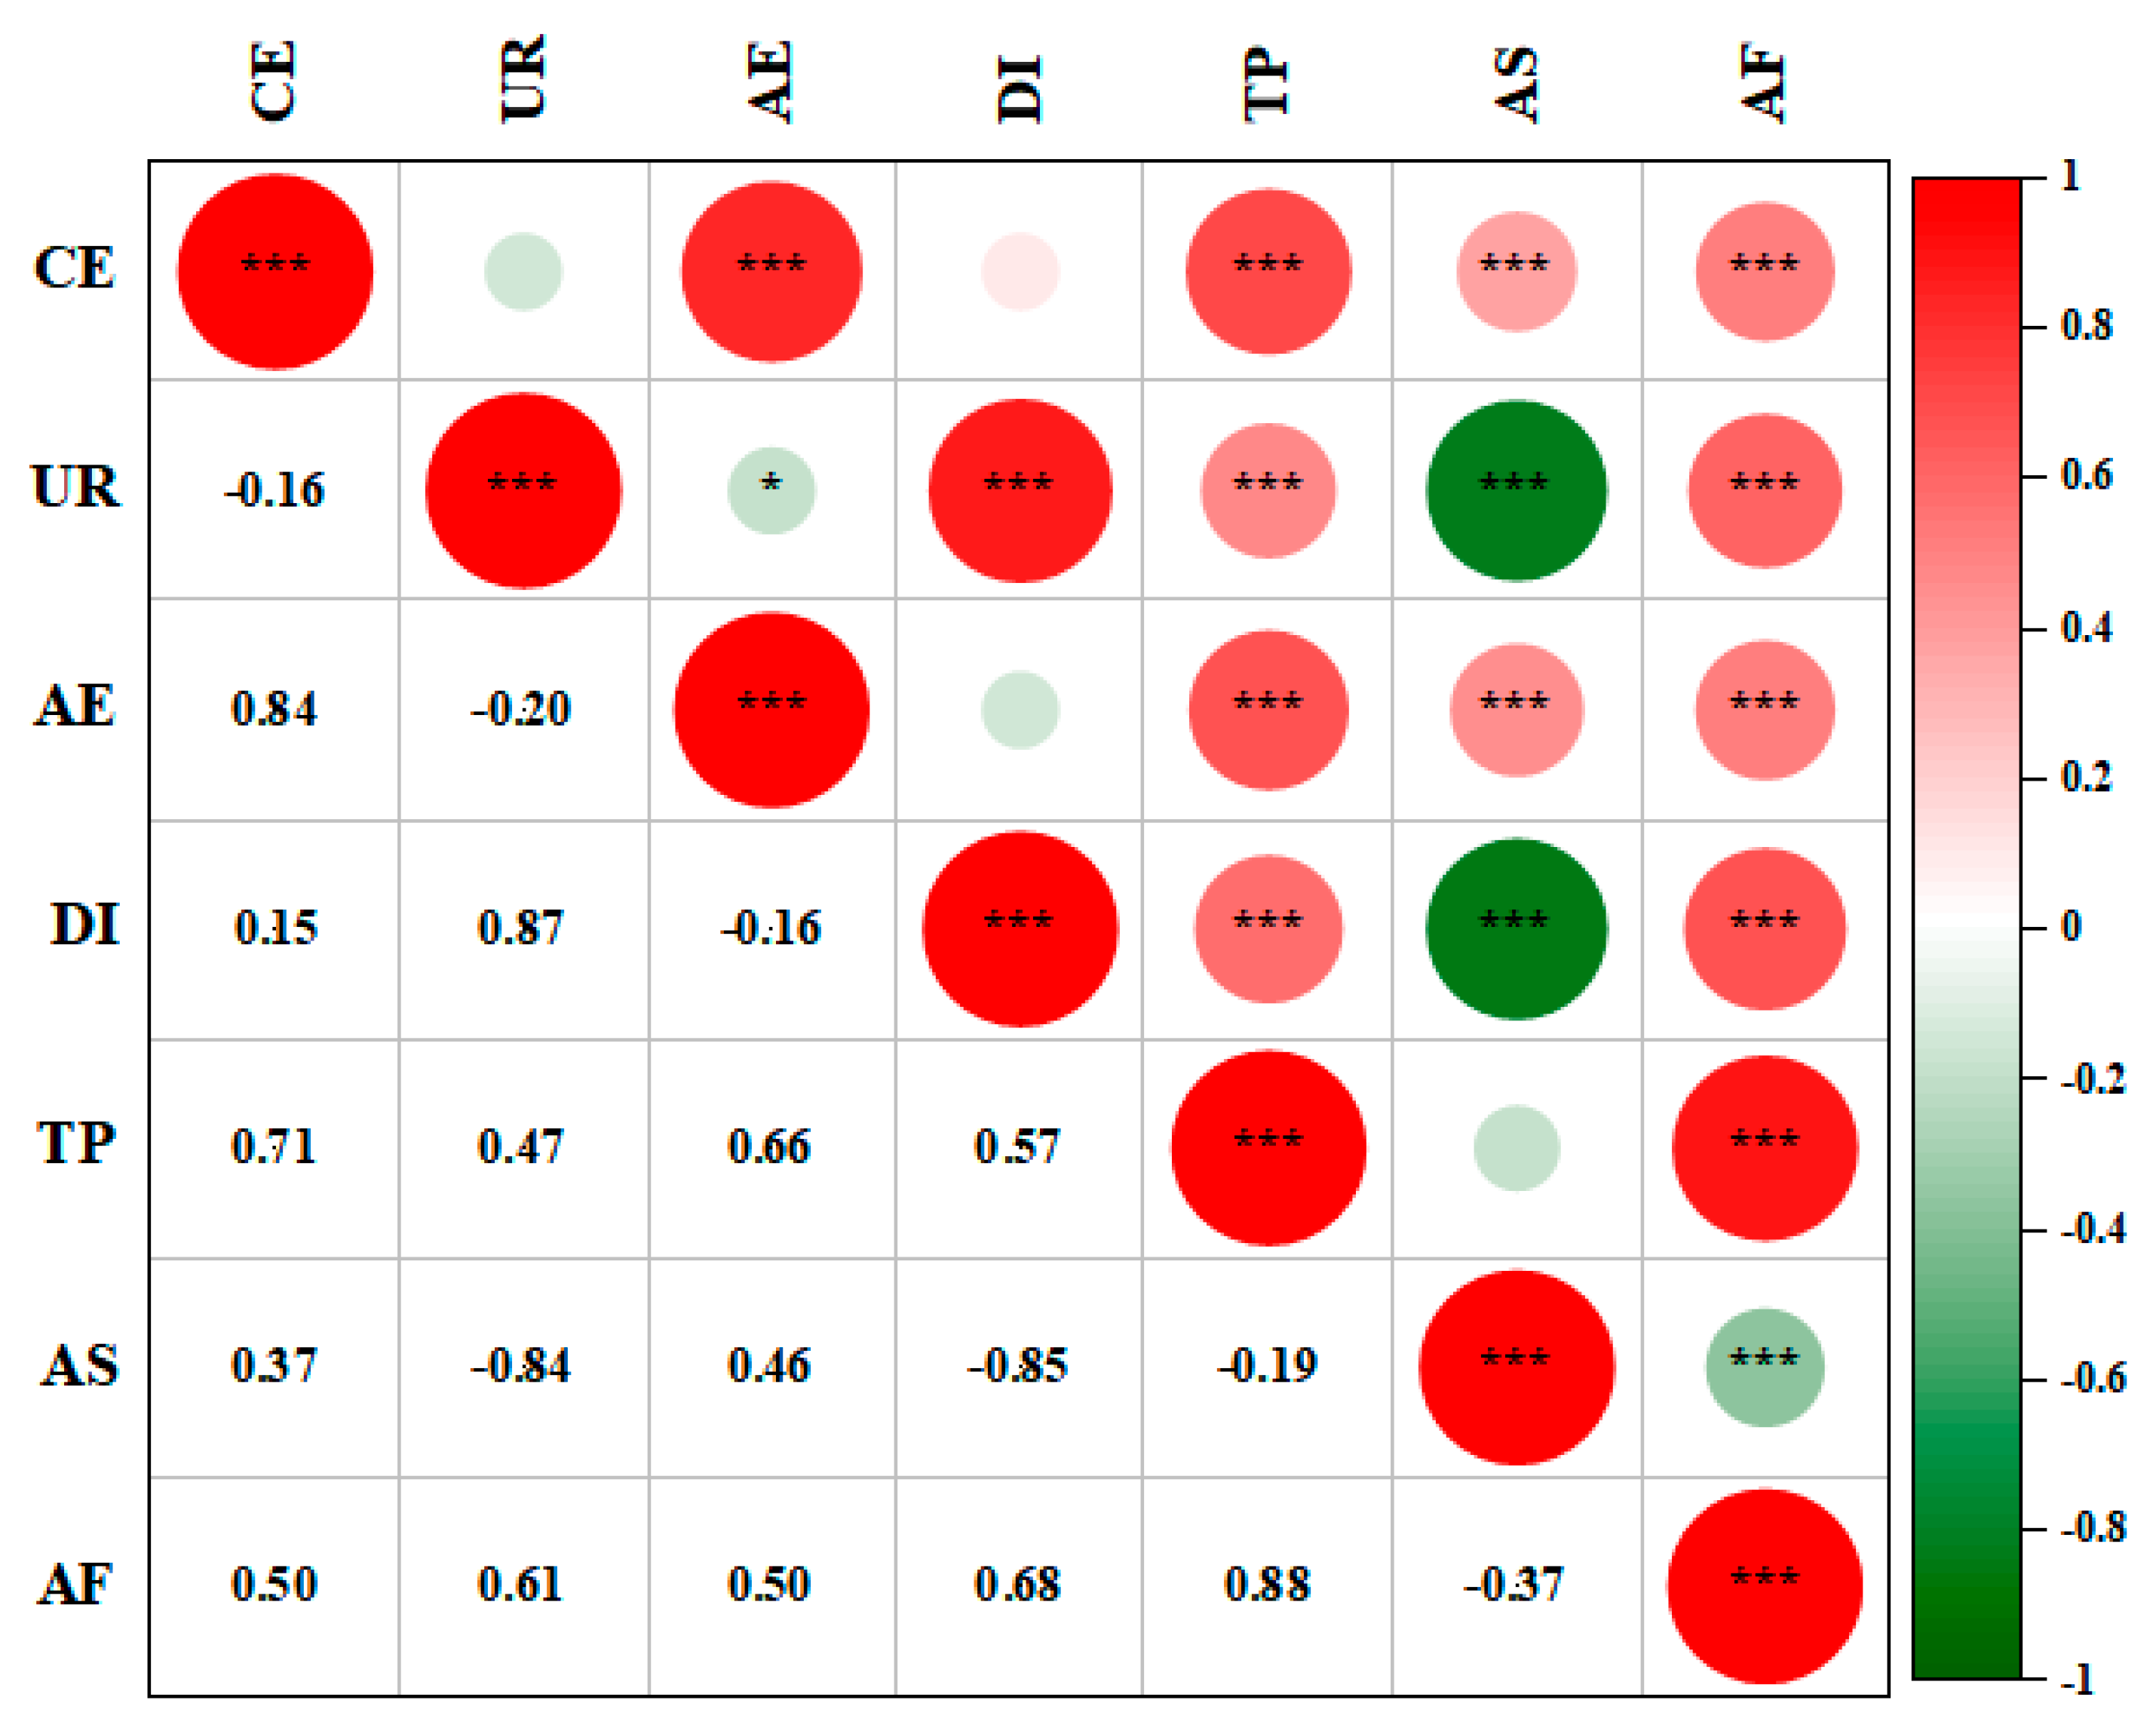
3.2. Drivers of Non-CO2 GHG Emissions from Agriculture in Southwest China

To analyze the relationship between agricultural non-CO2 GHG emissions and driving factors in Southwest China, this study selected six indicators: the number of agricultural employees (AE), the per capita disposable income of rural residents (DI), the total power of agricultural machinery (TP), the agricultural industrial structure (AS), the urbanization rate (UR), and the funds for agricultural science and technology activities (AF). Correlations and significance among the above variables and the agricultural non-CO2 GHG emissions (CE) in the studied years are analyzed using the Spearman rank correlation coefficient.
The Spearman rank correlation coefficient, also known as Spearman’s rho, is a nonparametric (distribution-free) rank statistic proposed by Spearman in 1904 as a measure of the strength of the associations between two variables [51]. Considering the possibility of non-linear relationships or extreme values in the data, the Spearman correlation coefficient gives a more accurate picture of the correlation between the variables. We substituted the statistical data of each driver into the Correlation Plot of Origin to obtain the correlation heat map as shown in Figure 5. Both the Spearman correlation coefficients between CE and driving factors are close to or greater than 0.2, and the correlations are significant [52].
The data for each province from 1995 to 2021 was substituted into Equation (4), and the driving factors for each province and southwest region were obtained by least-square linear regression. A collinearity test was conducted on the model, and the variance inflation factor (VIF) was found to be greater than 10, indicating the presence of multicollinearity in the data.
Ridge regression analysis is a linear regression method used to deal with multicollinearity. In the model, we reduce the variance of the regression coefficients by introducing a ridge parameter to obtain a more stable estimate of the regression coefficients. To eliminate the effect of multicollinearity, we used SPSS to perform ridge regression analysis and obtained the results of the impact of the drivers as shown in Table 5.
As indicated in Table 5, the p-value of the F-statistic is 0.000, thereby substantiating the goodness of fit of the model. The urbanization rate, number of agricultural employees, per capita disposable income of rural residents, total power of agricultural machinery, agricultural industrial structure, and funds for agricultural science and technology activities exert a discernible influence on the growth of agricultural non-CO2 GHG emissions in the five provinces in Southwest China. For each 1% change in the influencing factors, the agricultural non-CO2 GHG emissions exhibited a corresponding change of −0.24%, −0.45%, −0.21%, 0.75%, 1.02%, and 0.13%, respectively.
The expansion of urbanization has had a detrimental impact on agricultural development. Concurrently, there has been a notable improvement in the quality of life for the population, accompanied by a heightened awareness of ecological and environmental concerns. Furthermore, the dissemination of the low-carbon concept has led to a reduction in agricultural carbon emissions. The decline in the number of agricultural employees suggests a shift in employment towards the secondary and tertiary industries over a certain period. As Southwest China is in the transitional period of developing modern agriculture, the construction of agricultural infrastructure has the potential to result in the loss of resources and an increase in agricultural carbon emissions in the short term [53]. The expansion of disposable income among rural residents and the acceleration of economic growth are largely attributable to the enhancement of technological proficiency and operational efficiency, which are conducive to the reduction of carbon emissions. The expansion of agricultural machinery and the advancement of agricultural technology will inevitably increase energy consumption and agricultural carbon emissions. The input of agricultural chemicals, such as fertilizers and pesticides, is concentrated in the field of planting. In the agricultural institutions of the southwest region, the proportion of planting and animal husbandry is higher, resulting in a greater generation of carbon emissions. The expansion of financial resources allocated to agricultural science and technology initiatives, which are designed to facilitate the production of food in an environmentally sustainable manner, has the unintended consequence of increasing the input of agricultural resources and agricultural carbon emissions.
In terms of each driving factor, the increase in the total power of agricultural machinery and agricultural science and technology activities had a positive effect on agricultural non-CO2 GHG emissions, which is different from Yan’s conclusion that changes in the level of technology have a strong mitigating effect on agricultural carbon emissions in Sichuan and Xizang [54]. Conversely, the increase in per capita disposable income of rural residents hurt non-CO2 GHG emissions from agricultural sources in Sichuan, Guizhou, Yunnan, and Xizang. However, this effect was not significant in other regions. The increase in the urbanization rate has a positive effect on agricultural non-CO2 GHG emissions in Xizang, while the other four provinces have the opposite effect. One possible reason for this is that Xizang has not yet undergone the transition from the primary to the intermediate stage of urbanization, and the population transfer from agricultural and pastoral areas is slow, which is not conducive to the rationalization and large-scale production of agriculture. This, in turn, increases other non-CO2 GHG emissions from agriculture. In Chongqing, Sichuan, and Guizhou provinces, the increase in the number of agricultural employees has a significant positive effect on non-CO2 GHG emissions from agricultural sources. The increase in the number of agricultural employees leads to an increase in the consumption of agricultural resources, which in turn leads to an increase in non-CO2 GHG emissions. However, in Yunnan and Xizang provinces, this driving factor has an inhibitory effect. The transfer of agricultural workers over a short period due to the depletion of infrastructure continues to contribute to the increase in GHG emissions. The agricultural industrial structure exerts a profound influence on all provinces in southwest China, with Sichuan and Xizang exhibiting a particularly inhibitory effect. As production efficiency improves and the development of livestock products in pastoral areas progresses, the agricultural structure is gradually optimized. This contributes to a reduction in non-CO2 GHG emissions in agriculture.
About the provinces, the driving factors in Chongqing were ranked as follows: AE > AS > TP > DI > UR > AF. The economic development of Chongqing was relatively rapid, with the secondary and tertiary industries developing at a similarly accelerated pace. Sichuan: TP > DI > AS > AE > AF > UR, Sichuan has a considerable cultivated land area, a high grain output, and the largest total power of agricultural machinery in the region. These factors significantly influence non-CO2 GHG emissions in this area. Guizhou: AE > AF > UR > AS > DI > TP, the existing rural population base in Guizhou is still sizable, yet the rural labor force exhibits a low level of cultural quality, which is insufficient to meet the demand for labor force caused by industrial transformation and upgrading. The number of agricultural employees has the greatest impact on the overall situation. Yunnan: TP > AE > UR > AF > AS > DI. The mechanization level of agricultural planting in Yunnan is constantly improving, yet the mountainous plateau terrain, with its numerous sloping farms and large slopes, presents a significant challenge to the promotion of agricultural machinery. This, in turn, has a detrimental effect on the total power of agricultural machinery. Xizang: DI > AS > TP > UR > AF > AE. As the per capita disposable income of rural residents continues to increase, rural affluence is also on the rise. This, in turn, has led to an enhanced environmental awareness among farmers and herdsmen, who are now more aware of the need to abandon blind expansion, disorderly grazing, and extensive management practices. This has resulted in a reduction in non-CO2 GHG emissions.

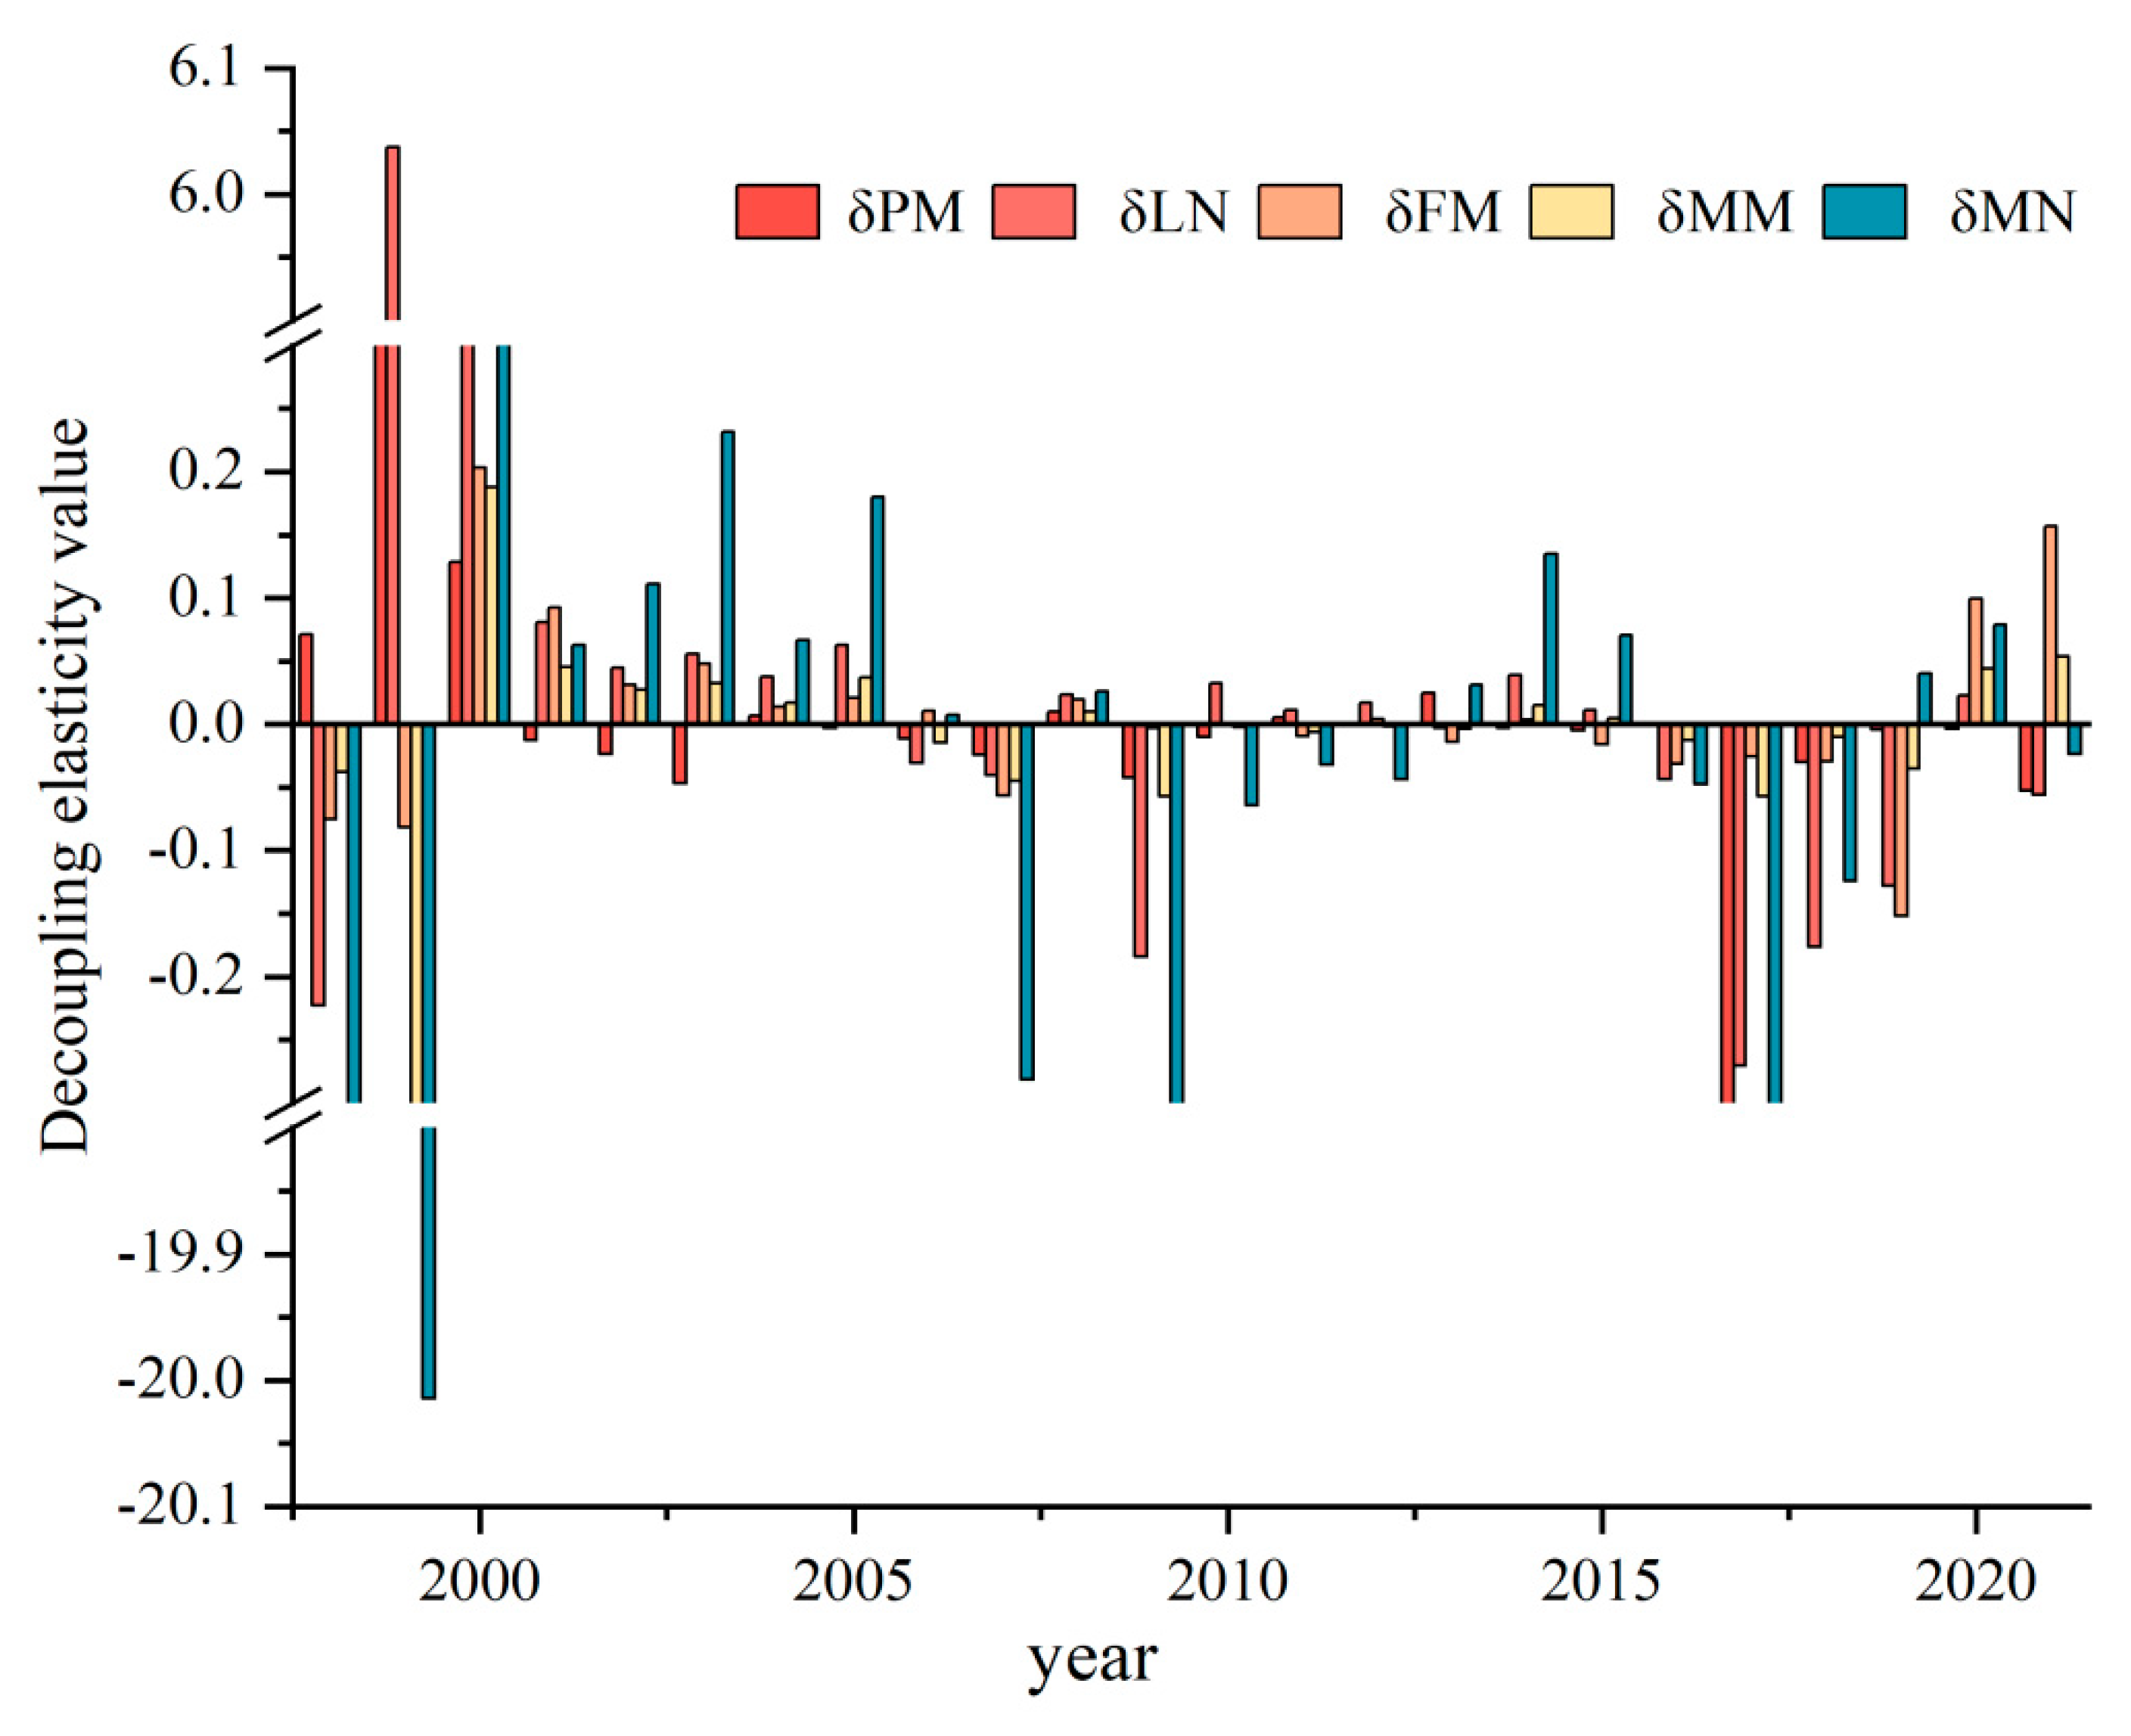
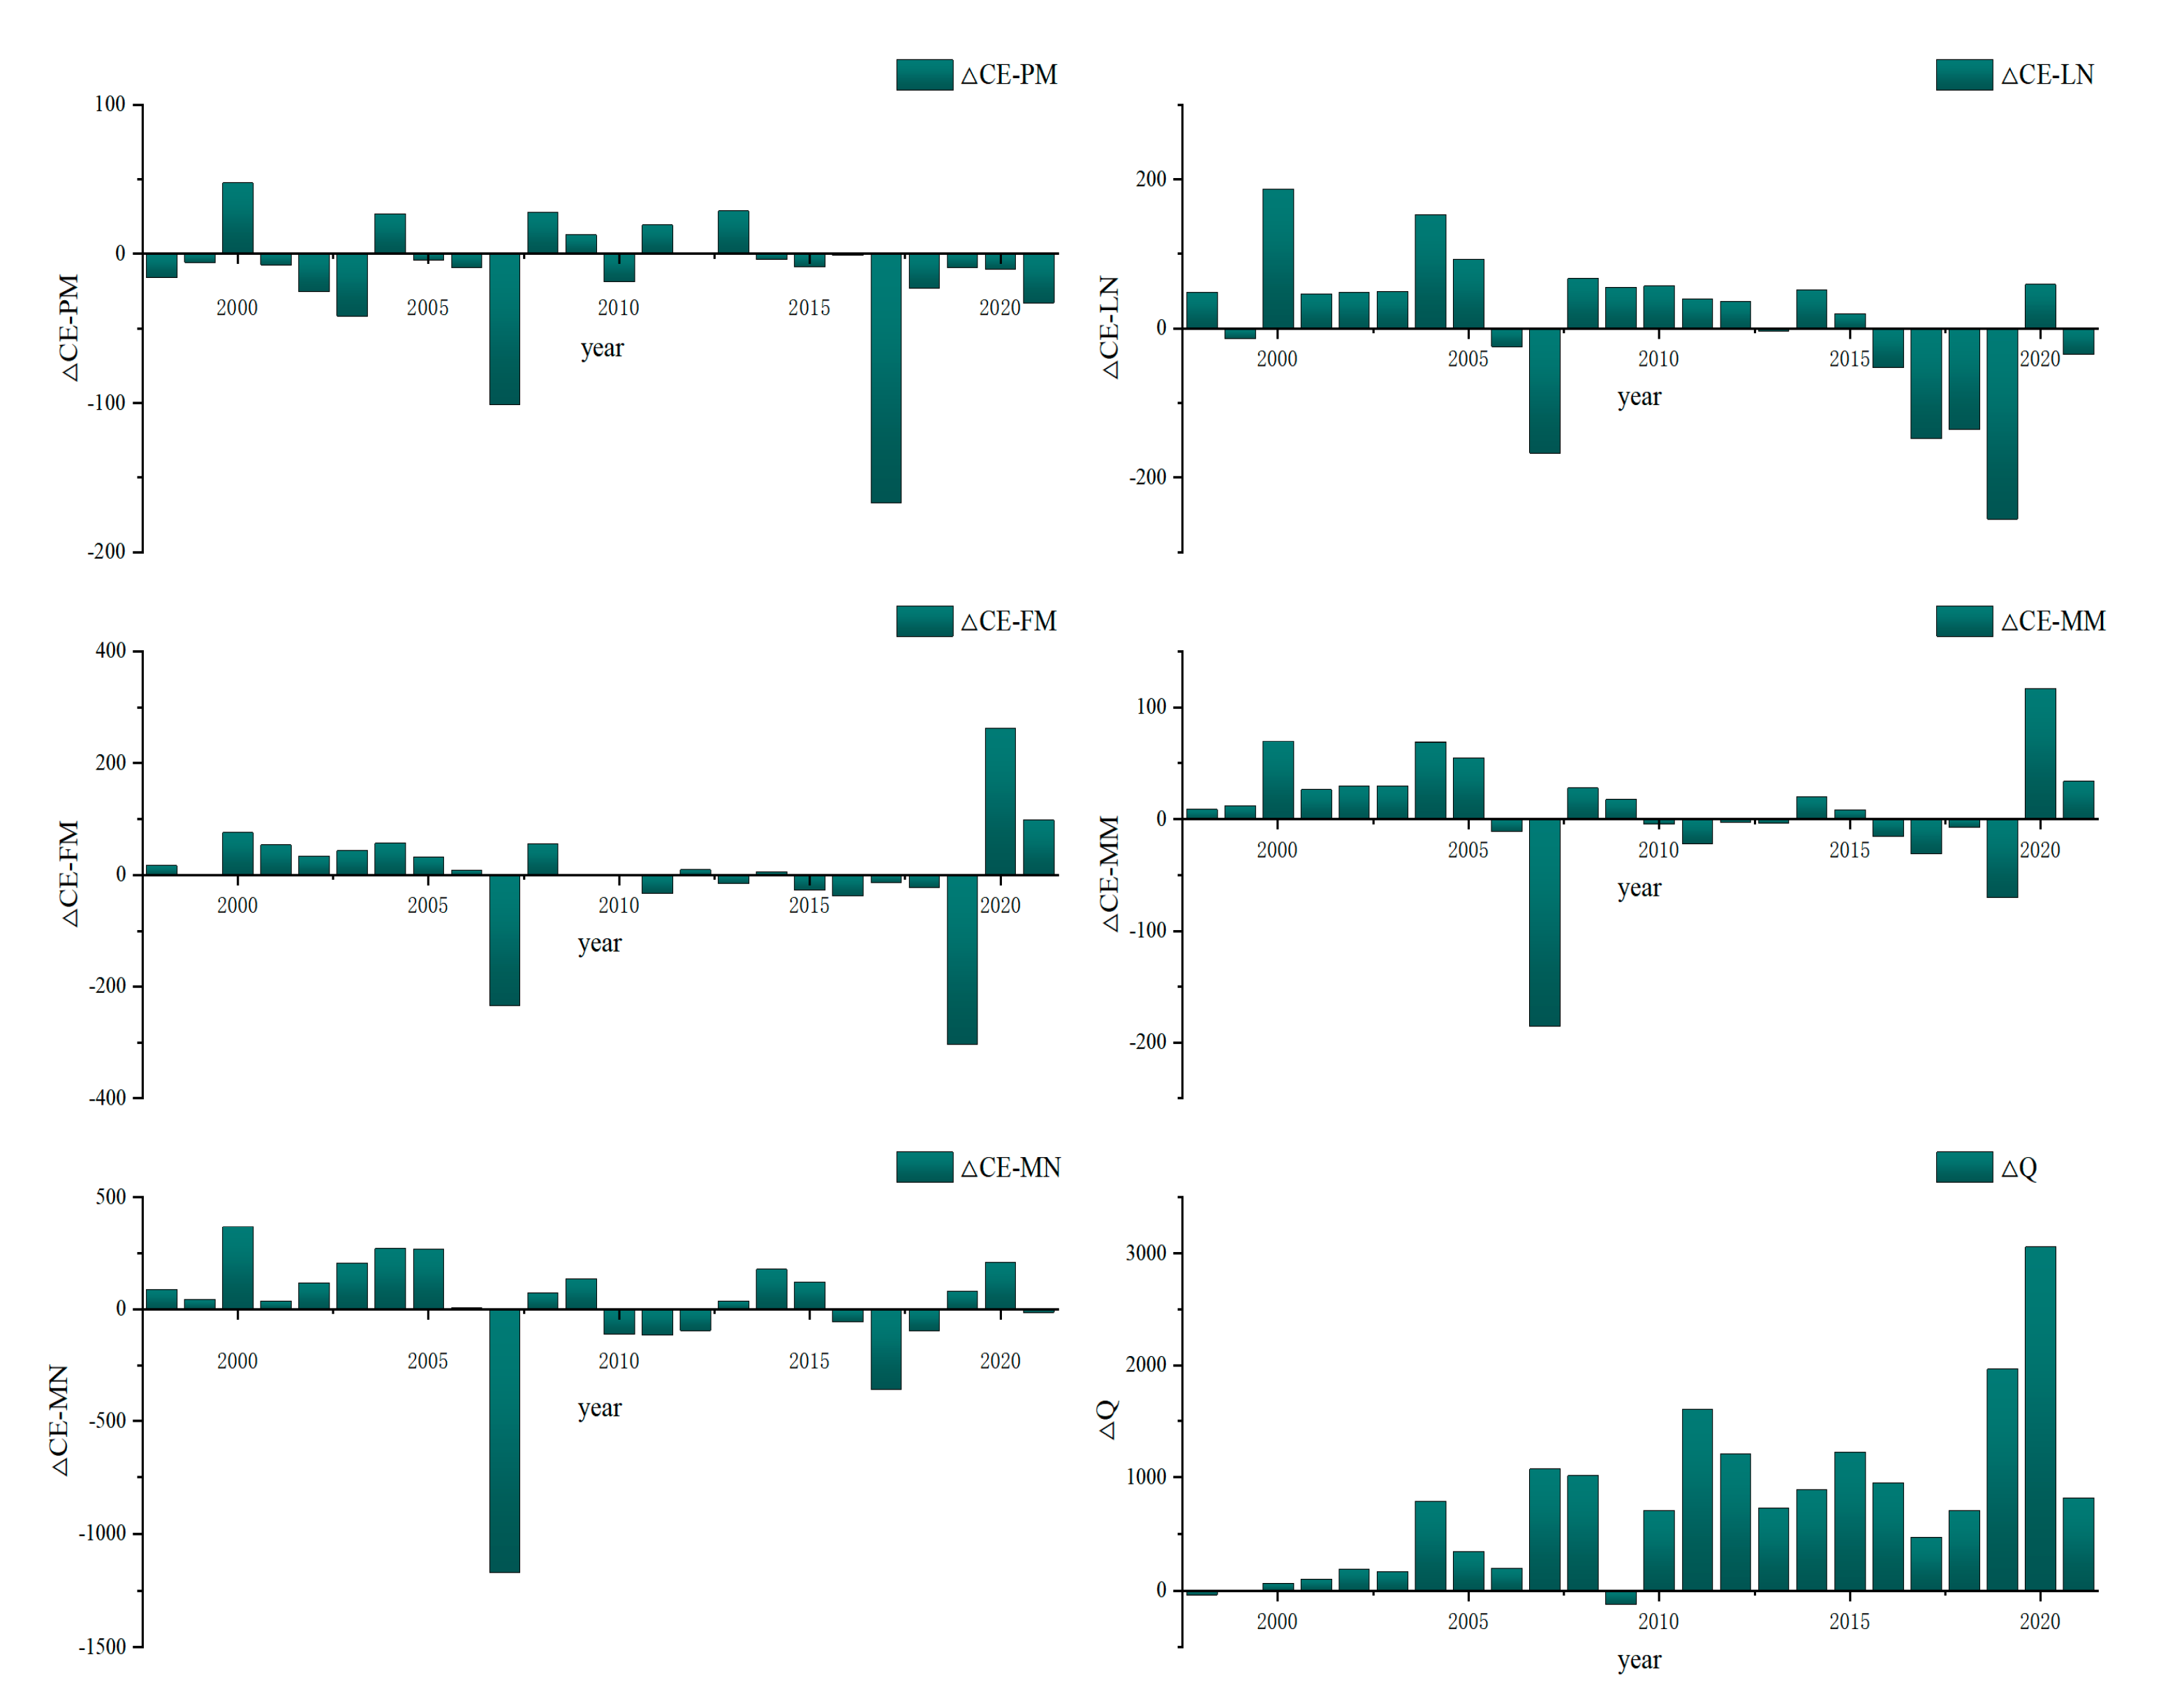
3.3. Analysis of the Decoupling Effect of Agricultural Non-CO2 GHG Emissions from Economic Development

To analyze the relationship between agricultural non-CO2 GHG emissions and agricultural economic development in southwest China, the decoupling state of agricultural non-CO2 GHG emissions and agricultural output value was discussed using the Tapio decoupling model. The decoupling status classification standard presented in Table 3 is employed to analyze the decoupling status of agricultural output and non-CO2 GHG emissions in Southwest China from 1998 to 2021. The resulting data is presented in Figure 6. As illustrated in Figure 6, the decoupling state between agricultural non-CO2 GHG emissions and agricultural economic development in Southwest China can be classified into four states: weak decoupling, strong decoupling, strong negative decoupling, and negative growth decoupling. The overall change process of “weak decoupling—strong decoupling—weak decoupling” is experienced, and the relationship between the two is primarily one of decoupling. This indicates that the growth rate of the agricultural economy in southwest China is faster than the growth rate of agricultural non-CO2 GHG emissions. Consequently, the overall decoupling state is deemed to be positive.
From 1998 to 1999, the State substantially increased its financial investment in agriculture and rural areas from various aspects of finance and credit, which was conducive to mobilizing farmers’ enthusiasm for production, and the non-CO2 GHG emissions from agriculture increased; however, there was localized and structural surplus of agricultural products, and there was a lack of market demand and a sustained decline in prices, which led to the recession of the agricultural economy and the emergence of a state of strong negative decoupling. In 2000, China implemented a series of economic policies in the rural sector and furthered the process of reform. The output of cotton, oil, fruit, and vegetables increased, the aquaculture industry maintained a stable development trend, and the efficiency improved, indicating a negative decoupling state of growth. From 2001 to 2005, 2008, and 2013 to 2015, the agricultural economic output value in Southwest China exhibited an upward trajectory, accompanied by a parallel increase in non-CO2 GHG emissions, largely driven by the consumption of agricultural materials. The decoupling elasticity coefficient of δ < 0.8 indicated a weak decoupling state, indicating that the growth rate of non-CO2 GHG emissions was slower than that of agricultural output value in these periods. During the 2006–2008, 2010–2012, and 2016–2019 periods, agricultural output value exhibited a notable increase, accompanied by a downward trend in agricultural non-CO2 GHG. As the concept of green agriculture developed, the concept of low-carbon agriculture was gradually deepened, and carbon emission reduction and sequestration technology was gradually promoted. This resulted in a reduction in the means of agricultural production in Southwest China. Non-CO2 GHG emissions exhibited a notable decline, indicative of a robust decoupling phenomenon. However, in the 2020–2021 period, non-CO2 GHG emissions from agriculture resumed growth, but at a slower rate than the agricultural economy, indicating a state of weak decoupling.
Generally speaking, agricultural output and non-CO2 GHG emissions in southwest China during 1998–2021 mainly show weak decoupling and strong decoupling states. When the production of agricultural and livestock products grows rapidly, the output of the agricultural economy increases substantially, and non-CO2 GHG emissions also grow rapidly, resulting in a shift from a state of strong decoupling to a state of weak decoupling, in which agricultural output and non-CO2 GHG emissions grow in tandem. Due to the exploration of low-carbon agricultural development models and technical means in recent years, the rate of non-CO2 GHG emissions from agriculture is slower than that of agricultural output. Therefore, the southwest region should further deepen the reform, rationally develop the rural biomass energy industry, optimize the industrial structure, rationally apply agricultural management measures, develop organic agriculture according to local conditions, and fully realize the strong decoupling state of agricultural output growth while reducing non-CO2 GHG emissions.
The above conclusions confirm the relationship between total non-CO2 GHG emissions and agricultural output in Southwest China, but the relationship between various types of non-CO2 GHG and economic growth is still unclear. The decoupling elasticity is decomposed into five decoupling elasticity indicators through Equation (6), as shown in Figure 7 and Figure 8; the decoupling elasticity between various types of non-CO2 GHG and economic growth shows different states.
The decoupling states of rice field methane, agricultural land nitrous oxide, animal intestinal fermentation methane, animal manure management methane, and animal manure management nitrous oxide and agricultural economic development showed weak decoupling, strong decoupling, and strong negative decoupling. In 1998–1999, except for the rice field methane in a weak negative decoupling state, the other four non-CO2 GHG were in a strong negative decoupling state and completed the transition to a weak decoupling state in 2000. The planting industry and agricultural economic development showed a good decoupling state, and from 2016, the paddy methane and agricultural land nitrous oxide showed the best strong decoupling state, indicating that the agricultural economic growth at the same time, the paddy methane emissions and agricultural land nitrous oxide emissions decreased simultaneously. Animal husbandry and agricultural economic development showed an alternating weak decoupling—strong decoupling state, and the decoupling state between animal intestinal fermentation methane, animal manure management methane, and animal manure management nitrous oxide and agricultural economic development was unstable. The elastic state of various types of non-CO2 GHG decoupling from economic growth indicates that controlling non-CO2 GHG emissions from animal husbandry should be the main task of controlling GHG emissions from agriculture in southwest China.

4. Conclusions and Implications

4.1. Conclusions

The conclusions of this paper include 3 main aspects. First, non-CO2 GHG emissions in Southwest China showed strong fluctuations from 1995 to 2021, with the most emissions in 2007 and the least in 2019, with obvious interprovincial differences and livestock as the main source of emissions. Second, AE, AS, TP, DI, UR, and AF are the main factors of non-CO2 GHG emissions in Southwest China, and the influence of each factor varies. Third, most of the decoupling status is good from 1998 to 2021, and the decoupling status of plantations is more stable than that of livestock.

4.2. Policy Implications

The findings of this study indicate that the most effective means of reducing non-CO2 GHG emissions from agricultural sources in southwest China is to control non-CO2 GHG emissions from animal husbandry. To achieve this, it is essential that Western animal husbandry adopts large-scale, scientific, and clean farming laws and encourages residents to develop green eating habits with plant foods as the main source and animal foods as the supplement. This will help to avoid the phenomenon of a large increase in the consumption of livestock products with an increase in income [55]. Furthermore, enhancing feed efficiency by aligning feed protein content with livestock and poultry nutritional requirements will prove instrumental in curbing methane emissions from animal intestinal fermentation [56]. Additionally, the implementation of animal waste recycling initiatives, augmenting support for the recycling of animal waste, and expanding existing animal waste recycling methodologies can effectively diminish non-CO2 GHG emissions from manure management [57].
There are notable spatial and temporal discrepancies in non-CO2 GHG emissions from agricultural sources in Southwest China. Therefore, it is essential to consider the discrepancies between regional resource endowments and technology levels in a comprehensive manner. The initial step is to reinforce scientific and technological innovation and enhance production efficiency. The government has implemented funding for agricultural science and technology activities, encouraged research and development of new types of land input materials, focused on the topographical characteristics of Yunnan and Guizhou, focused on the mechanization of the entire production of major food crops and the weak links in the mechanized production of agricultural products with highland characteristics and advantages, and actively developed energy-saving and environmentally friendly agricultural machinery suited to the topography of hilly and mountainous areas and agronomic measures to improve the efficiency of material input use and agricultural production efficiency.
It is necessary to adjust and optimize the agricultural industry by local conditions to maximize the use of agricultural resources, promote highly efficient and environmentally friendly agricultural planting patterns, and reduce non-CO2 GHG emissions from agricultural production. The primary objective is to reduce GHG emissions from rice paddies in the main rice production areas, such as eastern Sichuan, taking into account the ability of farmland to cope with climate change. Agriculture and animal husbandry represent the foundation of Xizang’s livelihood economy. The development of an agricultural and animal husbandry ecological circular economy extends the ecological chain of agriculture and animal husbandry, thereby enhancing the recycling efficiency of resources.
After understanding the spatial and temporal distribution of non-CO2 GHG from agricultural sources, the impact of drivers, and the decoupling status in Southwest China, we need to further take a more subdivided type of sources with a view to obtaining more accurate conclusions, and investigating the impacts of emerging agricultural technologies or exploring them at the sub-provincial level is also worthy of in-depth inquiry, which will make an important contribution to the realization of low-carbon development in agriculture and the mitigation of climate change.

Author Contributions

Data Curation, R.T., Y.C., Z.Y. and J.Y.; Methodology, R.T.; Validation, R.T.; Writing-Original Draft, R.T.; Writing-Review and Editing, R.T. and X.L.; Conceptualization, Y.C.; Visualization, Y.C.; Supervision, X.L., Z.Y. and J.Y. All authors have read and agreed to the published version of the manuscript.

Funding

This research is supported by the Postdoctoral Fellowship Program of CPSF under Grant Number GZB20240484.

Institutional Review Board Statement

Not applicable.

Informed Consent Statement

Not applicable.

Data Availability Statement

The original contributions presented in the study are included in the article, further inquiries can be directed to the corresponding author.

Conflicts of Interest

Author Yuanyue Chu was employed by the company China Merchants Ecological Environmental Protection Technology Co., Ltd. The remaining authors declare that the research was conducted in the absence of any commercial or financial relationships that could be construed as a potential conflict of interest.

References

  1. Chen, J.; Fei, Y.; Wan, Z. The relationship between the development of global maritime fleets and GHG emission from shipping. J. Environ. Manag. 2019, 242, 31–39. [Google Scholar] [CrossRef] [PubMed]
  2. Han, Y.; Cao, L.; Geng, Z.; Ping, W.; Zuo, X.; Fan, J.; Wan, J.; Lu, G. Novel economy and carbon emissions prediction model of different countries or regions in the world for energy optimization using improved residual neural network. Sci. Total Environ. 2023, 860, 160410. [Google Scholar] [CrossRef] [PubMed]
  3. Liu, X.; Wang, H.; You, C.; Yang, Z.; Yao, J. The impact of sustainable development policy for resource-based cities on green technology innovation: Firm-level evidence from China. J. Clean. Prod. 2024, 469, 143246. [Google Scholar] [CrossRef]
  4. Wang, C.; Wang, L.; Zhao, S.; Yang, C.; Albitar, K. The Impact of Fintech on Corporate Carbon Emissions: Towards Green and Sustainable Development. Bus. Strateg. Environ. 2024, 33, 5776–5796. [Google Scholar] [CrossRef]
  5. Li, K.; Lin, W.; Jiang, T.; Mao, Y.; Shi, W. Driving carbon emission reduction in China through green finance and green innovation: An endogenous growth perspective. Environ. Sci. Pollut. Res. 2024, 31, 14318–14332. [Google Scholar] [CrossRef]
  6. Frank, S.; Havlík, P.; Stehfest, E.; van Meijl, H.; Witzke, P.; Pérez-Domínguez, I.; van Dijk, M.; Doelman, J.C.; Fellmann, T.; Koopman, J.F.L.; et al. Agricultural non-CO2 emission reduction potential in the context of the 1.5 °C target. Nat. Clim. Chang. 2018, 9, 66–72. [Google Scholar] [CrossRef]
  7. USEPA. Global Anthropogenic Non-CO2 Greenhouse Gas Emissions: 1990–2030; USEPA: Washington, DC, USA, 2012. [Google Scholar]
  8. Yu, Z.; Zhang, F.; Gao, C.; Mangi, E.; Ali, C. The potential for bioenergy generated on marginal land to offset agricultural greenhouse gas emissions in China. Renew. Sustain. Energy Rev. 2024, 189, 113924. [Google Scholar] [CrossRef]
  9. Harmsen, J.H.M.; van Vuuren, D.P.; Nayak, D.R.; Hof, A.F.; Höglund-Isaksson, L.; Lucas, P.L.; Nielsen, J.B.; Smith, P.; Stehfest, E. Long-term marginal abatement cost curves of non-CO2 greenhouse gases. Environ. Sci. Policy 2019, 99, 136–149. [Google Scholar] [CrossRef]
  10. Huang, X.; Xu, X.; Wang, Q.; Zhang, L.; Gao, X.; Chen, L. Assessment of agricultural carbon emissions and their spatiotemporal changes in China, 1997–2016. Int. J. Environ. Res. Public Health 2019, 16, 3105. [Google Scholar] [CrossRef]
  11. Zhang, X.; Zhang, J.; Yang, C. Spatio-temporal evolution of agricultural carbon emissions in China, 2000–2020. Sustainability 2023, 15, 3347. [Google Scholar] [CrossRef]
  12. Chu, Y.-Y.; Zhang, X.-L.; Guo, Y.-C.; Tang, L.-J.; Zhong, C.-Y.; Zhang, J.-W.; Li, X.-L.; Qiao, D.-W. Spatial–temporal characteristics and driving factors’ contribution and evolution of agricultural non-CO2 greenhouse gas emissions in China: 1995–2021. Environ. Sci. Pollut. Res. 2024, 31, 19779–19794. [Google Scholar] [CrossRef] [PubMed]
  13. Pan, H.; Zheng, X.; Wu, R.; Liu, X.; Xiao, S.; Sun, L.; Hu, T.; Gao, Z.; Yang, L.; Huang, C.; et al. Agriculture related methane emissions embodied in China’s interprovincial trade. Renew. Sustain. Energy Rev. 2024, 189, 113850. [Google Scholar] [CrossRef]
  14. Tian, Y.; Zhang, J.; He, Y. Research on Spatial-Temporal Characteristics and Driving Factor of Agricultural Carbon Emissions in China. J. Integr. Agric. 2014, 13, 1393–1403. [Google Scholar] [CrossRef]
  15. Xiong, C.; Yang, D.; Xia, F.; Huo, J. Changes in agricultural carbon emissions and factors that influence agricultural carbon emissions based on different stages in Xinjiang, China. Sci. Rep. 2016, 6, 36912. [Google Scholar] [CrossRef]
  16. Liu, Y.; Liu, H. Characteristics, influence factors, and prediction of agricultural carbon emissions in Shandong Province. Chin. J. Eco-Agric. 2022, 30, 558–569. [Google Scholar] [CrossRef]
  17. Guo, H.; Fan, B.; Pan, C. Study on mechanisms underlying changes in agricultural carbon emissions: A case in Jilin Province, China, 1998–2018. Int. J. Environ. Res. Public Health 2021, 18, 919. [Google Scholar] [CrossRef]
  18. Chen, Y.; Li, M.; Su, K.; Li, X. Spatial-temporal characteristics of the driving factors of agricultural carbon emissions: Empirical evidence from Fujian, China. Energies 2019, 12, 3102. [Google Scholar] [CrossRef]
  19. Hu, C.; Fan, J.; Chen, J. Spatial and temporal characteristics and drivers of agricultural carbon emissions in Jiangsu Province, China. Int. J. Environ. Res. Public Health 2022, 19, 12463. [Google Scholar] [CrossRef]
  20. Tian, J.; Yang, H.; Xiang, P.; Liu, D.; Li, L. Drivers of agricultural carbon emissions in Hunan Province, China. Environ. Earth Sci. 2016, 75, 121. [Google Scholar] [CrossRef]
  21. Shi, C.; Guo, Y.; Zhan, P.; Zhu, J. Carbon emission drivers and decoupling effects of agricultural energy consumption in China. China Sci. Technol. Forum 2017, 136–143. [Google Scholar] [CrossRef]
  22. Wu, H.; Huang, H.; He, Y.; Che, W. Measurement, spatial spillover and influencing factors of agricultural carbon emissions efficiency in China. Chin. J. Eco-Agric. 2021, 29, 1762–1773. [Google Scholar] [CrossRef]
  23. Wu, S.; Hu, S.; Frazier, A.E. Spatiotemporal variation and driving factors of carbon emissions in three industrial land spaces in China from 1997 to 2016. Technol. Forecast. Soc. Chang. 2021, 169, 120837. [Google Scholar] [CrossRef]
  24. Xiong, C.; Chen, S.; Xu, L. Driving factors analysis of agricultural carbon emissions based on extended STIRPAT model of Jiangsu Province, China. Growth Chang. 2020, 51, 1401–1416. [Google Scholar] [CrossRef]
  25. Huang, Q.; Zhang, Y. Decoupling and Decomposition Analysis of Agricultural Carbon Emissions: Evidence from Heilongjiang Province, China. Int. J. Environ. Res. Public Health 2022, 19, 198. [Google Scholar] [CrossRef] [PubMed]
  26. Li, G.; Hu, C.; Mei, Y.; Hu, W. Temporal and spatial characteristics and influencing factors of agricultural carbon emission in Hubei Province based on Kaya model. Green Technol. 2020, 4, 217–220. [Google Scholar] [CrossRef]
  27. Xia, Q.; Liao, M.; Xie, X.; Guo, B.; Lu, X.; Qiu, H. Agricultural carbon emissions in Zhejiang Province, China (2001–2020): Changing trends, influencing factors, and has it achieved synergy with food security and economic development? Environ. Monit. Assess. 2023, 195, 1391. [Google Scholar] [CrossRef]
  28. Zhu, J.; Qin, H.; Zhang, M. Driving factors and decoupling effects of agricultural carbon emissions in Jiangxi Province based on time-varying parameter C-D production function. Ying Yong Sheng Tai Xue Bao 2023, 34, 3085–3094. [Google Scholar] [CrossRef]
  29. Gokmenoglu, K.K.; Taspinar, N. Testing the agriculture-induced EKC hypothesis: The case of Pakistan. Environ. Sci. Pollut. Res. 2018, 25, 22829–22841. [Google Scholar] [CrossRef]
  30. Liu, X.; Zhang, S.; Bae, J. The impact of renewable energy and agriculture on carbon dioxide emissions: Investigating the environmental Kuznets curve in four selected ASEAN countries. J. Clean. Prod. 2017, 164, 1239–1247. [Google Scholar] [CrossRef]
  31. Vastola, A.; Viccaro, M.; Grippo, V.; Genovese, F.; Romano, S.; Cozzi, M. The Decoupling Effect in Italian Agricultural Waste: An Empirical Analysis. Sustainability 2023, 15, 16596. [Google Scholar] [CrossRef]
  32. Meng, F.; Tan, Y.; Chen, H. Decoupling relationship between greenhouse gas emissions from cropland utilization and crop yield in China: Implications for green agricultural development. Environ. Sci. Pollut. Res. 2023, 30, 97160–97177. [Google Scholar] [CrossRef] [PubMed]
  33. Yang, J.; Luo, P.; Li, L. Driving factors and decoupling trend analysis between agricultural CO2 emissions and economic development in China based on LMDI and Tapio decoupling. Math. Biosci. Eng. 2022, 19, 13093–13113. [Google Scholar] [CrossRef] [PubMed]
  34. Liu, S.; Li, S. Decoupling elasticity and driving factors of agricultural carbon emissions in Hunan Province–Based on Tapio decoupling model and LMDI analysis. J. Sichuan Agric. Univ. 2023, 41, 952–960. (In Chinese) [Google Scholar]
  35. Han, H.B.; Zhong, Z.Q.; Guo, Y.; Xi, F.; Liu, S. Coupling and decoupling effects of agricultural carbon emissions in China and their driving factors. Environ. Sci. Pollut. Res. 2018, 25, 25280–25293. [Google Scholar] [CrossRef]
  36. Ding, B.; Zhao, Y.; Deng, J. Study on the Measurement, Decoupling Characteristics and Driving Factors of Carbon Emissions from Cultivation in China. China Agric. Resour. Zoning 2022, 43, 1–11. (In Chinese) [Google Scholar]
  37. Wang, G.; Liao, M.; Jiang, J. Research on Agricultural Carbon Emissions and Regional Carbon Emissions Reduction Strategies in China. Sustainability 2020, 12, 2627. [Google Scholar] [CrossRef]
  38. Yuan, R.; Xu, C.; Kong, F. Decoupling agriculture pollution and carbon reduction from economic growth in the Yangtze River Delta, China. PLoS ONE 2023, 18, e0280268. [Google Scholar] [CrossRef]
  39. Wen, L.; Xue, W. Inter-provincial factors decomposition and decoupling analysis of generalized agricultural carbon emissions in China. J. Renew. Sustain. Energy 2024, 16, 015902. [Google Scholar] [CrossRef]
  40. Hang, X.; Luo, J.; Zhang, P.; Li, Z.; Zhang, J.; Hu, L.; Yu, D.; He, W.; Zhou, Y.; Liao, D. Countermeasures and suggestions for developing climate-smart agriculture in southwest China. China Agric. Sci. Technol. Her. 2021, 23, 8–15. [Google Scholar] [CrossRef]
  41. IPCC. Refinement to the 2006 IPCC Guidelines for National Greenhouse Gas Inventories; IPCC: Geneva, Switzerland, 2019. [Google Scholar]
  42. Ehrlich, P.R.; Holdren, J.P. Impact of Population Growth. Science 1971, 171, 1212–1217. [Google Scholar] [CrossRef]
  43. York, R.; Rosa, E.A.; Dietz, T. STIRPAT, IPAT and ImPACT: Analytic tools for unpacking the driving forces of environmental impacts. Ecol. Econ. 2003, 46, 351–365. [Google Scholar] [CrossRef]
  44. Liu, Y.; Han, Y. Impacts of Urbanization and Technology on Carbon Dioxide Emissions of Yangtze River Economic Belt at Two Stages: Based on an Extended STIRPAT Model. Sustainability 2021, 13, 7022. [Google Scholar] [CrossRef]
  45. Lv, T.; Hu, H.; Xie, H.; Zhang, X.; Wang, L.; Shen, X. An empirical relationship between urbanization and carbon emissions in an ecological civilization demonstration area of China based on the STIRPAT model. Environ. Dev. Sustain. 2023, 25, 2465–2486. [Google Scholar] [CrossRef]
  46. Tapio, P. Towards a theory of decoupling: Degrees of decoupling in the EU and the case of road traffic in Finland between 1970 and 2001. Transp. Policy 2005, 12, 137–151. [Google Scholar] [CrossRef]
  47. Vehmas, J.; Kaivo-oja, J.; Luukkanen, J. Global Trends of Linking Environmental Stress and Economic Growth; Finland Futures Research Centre: Turku, Finland, 2003; pp. 6–9. ISBN 951-564-109-8. [Google Scholar]
  48. Vehmas, J.; Luukkanen, J.; Kaivo-oja, J. Linking analyses and environmental Kuznets curves for aggregated material flows in the EU. J. Clean. Prod. 2007, 15, 1662–1673. [Google Scholar] [CrossRef]
  49. Li, J.H.; Pei, X.D.; Yang, G.J.; Shi, G.; Zhang, C.; Zhou, L.H. Decoupling relationship and driving effect between livestock carbon emissions and economic efficiency in Qinghai Province. Acta Ecol. Sin. 2024, 22, 1–16. [Google Scholar] [CrossRef]
  50. National Bureau of Statistics. Statistical Bulletin on National Economic and Social Development; National Bureau of Statistics: Beijing, China, 2007. [Google Scholar]
  51. Lehmann, E.L.; D’Abrera, H.J.M. Nonparametrics: Statistical Methods Based on Ranks; Prentice-Hall: Englewood Cliffs, NJ, USA, 1998; pp. 292, 300+323. [Google Scholar]
  52. Liang, X.; Fan, M.; Xiao, Y.; Yao, J. Temporal-spatial characteristics of energy-based carbon dioxide emissions and driving factors during 2004–2019, China. Energy 2022, 261, 124965. [Google Scholar] [CrossRef]
  53. Li, L.; Yu, R.; Yu, Z.; Qin, Y.; Cao, Y. Temporal and spatial characteristics and influencing factors of agricultural carbon emission in the Yangtze River Economic Belt based on STIRPAT model. J. Anhui Agric. Univ. 2020, 29, 32–37+132. [Google Scholar] [CrossRef]
  54. Yan, X. Spatio-temporal characteristics and influencing factors of agricultural carbon emissions in Southwest China. Guangdong Seric. 2019, 53, 32–36. (In Chinese) [Google Scholar]
  55. Hao, D.; Wang, R.; Gao, C.; Song, X.; Liu, W.; Hu, G. Spatial-Temporal Characteristics and Influence Factors of Carbon Emission from Livestock Industry in China. Int. J. Environ. Res. Public Health 2022, 19, 14837. [Google Scholar] [CrossRef]
  56. Gerber, P.J.; Hristov, A.; Henderson, B.; Makkar, H.; Oh, J.; Lee, C.; Meinen, R.; Montes, F.; Ott, T.; Firkins, J.; et al. Technical options for the mitigation of direct methane and nitrous oxide emissions from livestock: A review. Animal 2013, 7, 220–234. [Google Scholar] [CrossRef] [PubMed]
  57. Zhu, Z.; Wang, Y.; Yan, T.; Zhang, Z.; Wang, S.; Dong, H. Greenhouse gas emissions from livestock in China and mitigation options within the context of carbon neutrality. Front. Agric. Sci. Eng. 2023, 10, 226–233. [Google Scholar] [CrossRef]
Figure 1. Study area.
Atmosphere 15 01084 g001
Figure 2. Contribution of different sources of non-CO2 GHG emissions in Southwest China from 1995 to 2021, and total emissions in previous years (Mt CO2-eqt).
Atmosphere 15 01084 g002
Figure 3. Growth rate and emission intensity of non−CO2 GHG emissions in Southwest China, 1995–2021 (kg/104 yuan).
Atmosphere 15 01084 g003
Figure 4. Spatial distribution of total agricultural non–-CO2 GHG emissions in Southwest China.
Atmosphere 15 01084 g004
Figure 5. Correlation coefficient heat map. Notes: The Spearman rank correlation coefficient is shown in the lower left, and the significant marker correlation heat map is in the upper right. *** and * indicate significance at the 1 and 10% levels.
Atmosphere 15 01084 g005
Figure 6. Decoupling state of agricultural output and non–CO2 GHG emissions in southwest China.
Atmosphere 15 01084 g006
Figure 7. Decoupling elasticity coefficient of various types of non−CO2 GHG in southwest China from 1998 to 2021.
Atmosphere 15 01084 g007
Figure 8. Changes of non−CO2 GHG emissions and agricultural output value in Southwest China from 1998 to 2021.
Atmosphere 15 01084 g008
Table 1. Values of methane emission factors in rice fields and nitrous oxide emission factors in agricultural fields in different regions.
RegionMethane Emission Factors in Rice Field
(kg/ha)
Direct Nitrous Oxide Emission Factors from Agricultural LandIndirect Nitrous Oxide Emission Factors from Agricultural Land
Atmospheric Nitrogen DepositionNitrogen Leaching Runoff Loss
Sichuan, Chongqing156.20.01090.010.0075
Yunnan, Guizhou156.20.01060.010.0075
Xizang156.20.00560.010.0075
Table 2. Emission factors of different carbon sources in livestock and poultry breeding in Southwest China.
SourceIntestinal Fermentation Methane Emission Factor
(kg/head/year)
Fecal Management Methane Emission Factors
(kg/head/year)
Fecal Management Nitrous Oxide Emission Factors
(kg/head/year)
Pig14.180.159
Cow88.16.511.884
Buffalo70.51.531.197
Non-buffalo52.93.210.691
Goat8.90.530.064
Horse181.640.330
Donkey/mule100.900.188
Poultry/0.020.007
Table 3. Tapio decoupling status classification.
CEQδDecoupling State
<0>0(−∞, 0)Strong decoupling
>0>0(0, 0.8)Weak decoupling
<0<0(1.2, +∞)Recessionary decoupling
>0>0(0.8, 1.2)Growth linkage
<0<0(0.8, 1.2)Fading link
<0<0(0, 0.8)Weak negative decoupling
>0>0(1.2, +∞)Negative decoupling of growth
>0<0(−∞, 0)Strong negative decoupling
Table 4. Data sources.
Data R e s o u r c e s
Basic data used to calculate non-CO2 GHG emissions from agricultureChina Rural Statistical Yearbook (1996–2022)
(National Bureau of Statistics of China)
Chinese Agricultural Yearbook (1996–2022)
(Ministry of Agriculture of China)
Provincial Statistical Yearbook (1996–2022)
(Statistics Bureau of provinces in southwest China)
Socio-economic factors (e.g., disposable income of rural residents, funds for agricultural science and technology activities, industrial structure)China Statistical Yearbook (1996–2022)
Statistics Bureau of provinces in southwest China
China Statistical Yearbook of Science and Technology (1996–2022)
(Department of Social Science, Technology, and Cultural Industries Statistics and Department of Strategic Planning, Ministry of Science and Technology, National Bureau of Statistics, China)
Vector data of five provinces in southwest ChinaNational Basic Geographic Information Database
Table 5. Analysis of driving factors of agricultural non-CO2 GHG emissions in southwest China.
VariablesSouthwest ChinaChongqingSichuanGuizhouYunnanXizang
lnUR−0.24 ***
[0.000]
−0.135 ***
[0.000]
−0.074 *
[0.067]
−0.238 **
[0.039]
−0.094
[0.103]
0.069
[0.666]
lnAE−0.454 ***
[0.000]
1.196 ***
[0.000]
0.114
[0.244]
0.449 **
[0.020]
−0.148
[0.445]
−0.014
[0.927]
lnDI−0.214 ***
[0.000]
0.170 ***
[0.006]
−0.362 ***
[0.000]
−0.231
[0.143]
−0.021
[0.809]
−0.277 ***
[0.000]
lnTP0.747 ***
[0.000]
0.277
[0.245]
0.754 ***
[0.000]
0.143
[0.210]
0.164 *
[0.054]
0.177 ***
[0.001]
lnAS1.018 ***
[0.000]
−0.317 **
[0.023]
0.255 **
[0.027]
0.237 **
[0.030]
0.031
[0.755]
−0.217 **
[0.021]
lnAF0.132 ***
[0.000]
0.012
[0.811]
0.078
[0.105]
0.262 ***
[0.001]
0.040
[0.117]
0.016
[0.370]
Ad R-s0.8930.8790.9060.8600.9160.908
Notes: ***, **, and * indicate significance at the 1, 5, and 10% levels. [] is the p-value, which represents the significance level of the F test results.
Disclaimer/Publisher’s Note: The statements, opinions and data contained in all publications are solely those of the individual author(s) and contributor(s) and not of MDPI and/or the editor(s). MDPI and/or the editor(s) disclaim responsibility for any injury to people or property resulting from any ideas, methods, instructions or products referred to in the content.

