Article

The Study of Synergistic Changes in Extreme Cold and Warm Events in the Sanjiang Plain

State Key Laboratory of Simulation and Regulation of Water Cycle in River Basin, Key Laboratory of Roads and Railway Engineering Safety Control (Shijiazhuang Tiedao University), Ministry of Education, Shijiazhuang Tiedao University, Shijiazhuang 050043, China
*
Authors to whom correspondence should be addressed.
Atmosphere 2024, 15(9), 1092; https://doi.org/10.3390/atmos15091092
Submission received: 6 August 2024 / Revised: 1 September 2024 / Accepted: 6 September 2024 / Published: 8 September 2024
(This article belongs to the Section Meteorology)

Abstract

:
Extreme climate events are occurring frequently under global warming. Previous studies primarily focused on isolated extreme climate events, whereas research on the synergistic changes between extreme cold (EC) and extreme warm (EW) events remains limited. This study conducted trend, correlation, and dispersion analyses on EC and EW, as well as their synergistic changes, in the Sanjiang Plain from 1960 to 2019, using inverse distance weighting, statistical methods, and the Mann–Kendall test. The results indicated that cold-to-warm (C2W) and warm-to-cold (W2C) events were significantly and positively correlated with elevation, with correlation coefficients (r) of 0.76 and 0.84, respectively. Meanwhile, C2W showed a significant negative correlation with latitude (r = −0.55), while W2C also exhibited a significant negative correlation with latitude (r = −0.71). However, there was a significant positive correlation between (EC) and latitude (r = 0.65). After 1980, both the declining trend of EC and the increasing trend of EW slowed down, and the trends in C2W and W2C changed from decline to increase. The dispersion of EC and EW shows an increasing trend, while the dispersion of C2W and W2C exhibits a decreasing trend. This study provides important references for studying temperature fluctuations and addressing extreme climate changes.

1. Introduction

The Sixth Assessment Report of the Intergovernmental Panel on Climate Change (IPCC) indicates that the global near-surface air temperature rose by approximately 1.1 °C between 1850 and 2019 due to human activities, and the trend of warming continues [1]. China is sensitive to global climate change [2,3]. Under the trend of global warming, the warming rate of China was 0.24 °C per decade from 1951 to 2018. Northeast China, as one of the most susceptible regions to climate change in China, experienced particularly significant warming [4]. In recent years, the frequency and duration of extreme temperature events in China have increased [5], and these events have had a significant impact on population health and food security in China. According to statistics, for every 1% increase in the number of days of extremely high and low temperatures in China, agricultural economic output decreases by 0.112% and 0.031% respectively, due to crop yield reductions and damage [6]. A time-series study has found that extreme low temperatures significantly increase the risk of premature birth [7]. Furthermore, extreme cold is responsible for 2.21–2.40% of congenital heart disease cases, and this trend is continuing to rise [8]. Therefore, studying the spatiotemporal trends of extreme temperature events is crucial for ensuring human health and social stability.
Although EW has been increasing in China under the trend of rising temperatures [9,10], climate warming has not restricted the occurrence of EC [11]. China has long suffered from EC [12]: the occurrence of EC in the mid-to-high latitudes of China has been increasing and becoming more frequent since 1990, manifesting as sudden sharp turns in temperature [13]. According to monitoring by the National Climate Center, there were 381 days of extreme cold waves in China from 2001 to 2021, significantly higher than the 311 days in the period from 1981 to 2000 [14]. A historical record-level extreme cold wave, popularly called the ”boss-level” cold wave, attacked China in January 2016, which brought unprecedented rapid cooling to vast areas [15,16]. The increase in EC raises a question: “Has temperature variability become stronger in recent years?”.
As research on extreme temperatures continues to grow, studies have found that EC and EW are increasing globally [17,18,19]. The frequent occurrence of EC and EW makes temperatures more unstable, and this temperature instability may manifest in the complex form of “temperature whiplash“, [18,20], which poses greater risks to human health and the natural environment compared to isolated EC and EW [21].
However, current research on extreme climate events in China largely focuses on case studies of individual extreme climate events and the spatiotemporal variation characteristics of extreme climate indices. There is a lack of quantitative research on the synergistic trends of extreme cold and warm events, as well as the high-frequency regions and periods of extreme climate events in China across continuous spatiotemporal scales. This insufficiency hinders the ability to effectively support research on the impacts of extreme climate events on the state of China’s ecosystems and changes in social environments. The Sanjiang Plain, as an important commodity grain base in China [22], is also one of the most sensitive regions to climate change in the country [4,23]. Over the past 50 years, the average surface temperature in the study area has increased by 0.38 °C every 10 years, which is approximately 1.7 times the rate of warming in China during the same period [24]. Therefore, the Sanjiang Plain serves as a typical representative region for analyzing extreme temperature events.
Most efforts in climate change studies have focused on the global scale, although regional-scale analysis is important for mitigating its negative effects and the development of adaptation plans [25]. This study analyzes the frequency and trends of EW, EC, C2W, and W2C events in the Sanjiang Plain region of China from 1960 to 2019, with a focus on the trends of these extreme events themselves. The objective is to elucidate the spatiotemporal distribution characteristics of extreme warm and cold events as well as sudden sharp turns in temperature events. The research findings can provide important references for further investigating the impacts of extreme climate events on ecosystem processes, functions, and service changes, as well as for conducting extreme climate risk assessments and disaster warnings. Although this study considers the concurrent changes of extreme warm and cold events, the reasons behind these changes remain unclear. Further exploration from multiple perspectives is needed to identify the underlying causes of the fluctuating changes in extreme events in the future.

2. Materials and Methods

2.1. Relevant Definitions of Extreme Events

In this study, a temperature method based on percentile thresholds is adopted, which is a widely recognized practice in the field of climate extreme events [26]. Specifically, when the daily maximum or minimum temperature in a given year is lower (higher) than its corresponding 10th (90th) percentile threshold, it is classified as an EC (EW) event. For each calendar day, the 10th (90th) percentile of the daily maximum or minimum temperature is determined by ranking a 15-day multi-year sample (i.e., a total sample of 15 × 30 = 450 days [27]) from the period of 1961–1990, which includes 7 days before and after the specific date. This period is less influenced by anthropogenic warming [13].
Sudden sharp turns in temperature are defined as ‘sudden’ shifts from one extreme state to another [28,29]. Here, ‘sudden’ refers to a time span of no more than one week. Therefore, C2W is defined as the transition from EC to EW within seven days, while W2C is defined as the transition from EW to EC within the same time frame. Both are collectively referred to as sudden sharp turns in temperature [30]. We monitor temperature fluctuations, including changes in the frequency and dispersion of EW, EC, C2W, and W2C events.

2.2. Overview of the Study Area

As shown in Figure 1, this study selects the Sanjiang Plain as its research area. This region is one of the northernmost parts of China [31], located between 43.83° N and 48.47° N. Despite its high latitude, with an annual average temperature ranging from 1 °C to 4 °C, the area experiences warm summers, with the hottest month’s average temperature exceeding 22 °C. The rainfall and temperature are suitable for agricultural growth, especially for high-quality rice and high-oil soybeans. The Northeast region plays a crucial role in ensuring China’s grain production [32]. The research area is abundant in land resources, with per capita cultivated land roughly equivalent to five times the national average. The soil is fertile and suitable for cultivating various crops. Therefore, the Sanjiang Plain is not only one of the regions with the greatest potential for grain production increase in the Northeast but also one of China’s important commercial grain production bases. Extreme climate events can cause considerable losses to the agricultural sector, especially in mid-latitude regions [33]. With a total population of approximately 8.6 million, the Sanjiang Plain is primarily engaged in agricultural production, making it an economically agricultural-dominated region [34]. This means that the Sanjiang Plain is more susceptible to the impacts of climate change. In the face of climate change challenges, the Sanjiang Plain needs to fully leverage its land resource advantages and address the impacts they bring.

2.3. Source of Research Data

This study examines the daily maximum and minimum temperature observation data from eight national meteorological stations (Figure 1) in the Sanjiang Plain region, spanning from January 1961 to December 2019. The stations are located within the latitude range of 44.38° N to 47.23° N and the longitude range of 129.58° E to 132.97° E, with elevations ranging from 66.40m to 569.80m (Table 1). These data are sourced from the China Meteorological Science Data Sharing Service Network (http://data.cma.cn accessed on 17 December 2023) and have undergone rigorous quality control procedures, including extreme value and temporal consistency tests. They are maintained in accordance with the standards of the World Meteorological Organization (WMO), the China Meteorological Administration, and technical regulations for weather observations [35]. These data have been widely used in climate change research in China [2].

2.4. Methods of Analysis

This study utilizes the inverse distance weighting (IDW) interpolation method from the geostatistical module in ArcGIS 10.7 to assess spatial variations in the quantity and trends of extreme climate events [2]. The IDW method is one of the most commonly used precise interpolation methods for spatial data [36]. It calculates a weighted average, using the distance between the interpolation point and the sample points as weights, and assigns greater weights to sample points that are closer to the interpolation point.
To investigate the response of extreme events to spatial factors such as elevation, latitude, and longitude, we employ the Pearson correlation coefficient to reflect the pairwise correlations between them. Additionally, we utilize linear regression analysis to examine the trends of extreme events themselves, as well as their standard deviation, range, and coefficient of variation. Furthermore, we apply the Mann–Kendall test (M-K test), a non-parametric test method widely used to identify characteristics of meteorological element time series and recommended by the World Meteorological Organization [37], to examine whether these trends are significant. The detailed expression of the M-K test can be found in the literature [38,39].

3. Results

3.1. Spatial Distribution of the Number of Extreme Events

As shown in Figure 2a,b, the spatial distribution of EC and EW exhibits significant variability. Figure 2a illustrates that the multi-year average occurrence of EC in the Sanjiang Plain during the period from 1960 to 2019 ranges between 48.90 and 55.20 times, showing a decreasing trend from north to south. Figure 2b displays the distribution of EW in the study area during the same period, which is generally opposite to the distribution pattern of EC. EW shows an increasing trend from north to south, with a multi-year average occurrence ranging between 76.42 and 85.80 times. The spatial distribution trends of cold and warm spell events are shown in Figure 2c,d. During the period from 1960 to 2019, the occurrences of W2C and C2W are relatively less frequent compared to extreme cold and warm events, with multi-year average occurrences ranging between 7.07–8.46 and 7.95–9.84, respectively.
In Figure 3, the Pearson correlation coefficient matrix between extreme events and spatial factors such as elevation, longitude, and latitude is presented. The data in the figure reveal notable differences in the response of extreme events to spatial factors such as elevation, longitude, and latitude. Specifically, C2W (r = 0.76) and W2C (r = 0.84) both show significant positive correlations with elevation, while EC exhibits a weak negative correlation with elevation (r = −0.24), and the correlation between EW and elevation is negligible. C2W (r = −0.55) and W2C (r = −0.71) both have significant negative correlations with latitude; conversely, EC shows a significant positive correlation with latitude (r = 0.65), while EW has a moderate negative correlation with latitude (r = −0.47). Furthermore, C2W (r = −0.45) and W2C (r = −0.47) both have moderate associations with longitude, while EC (r = 0.44) shows a moderate positive correlation, and there is a weak association between EW (r = −0.32) and longitude.

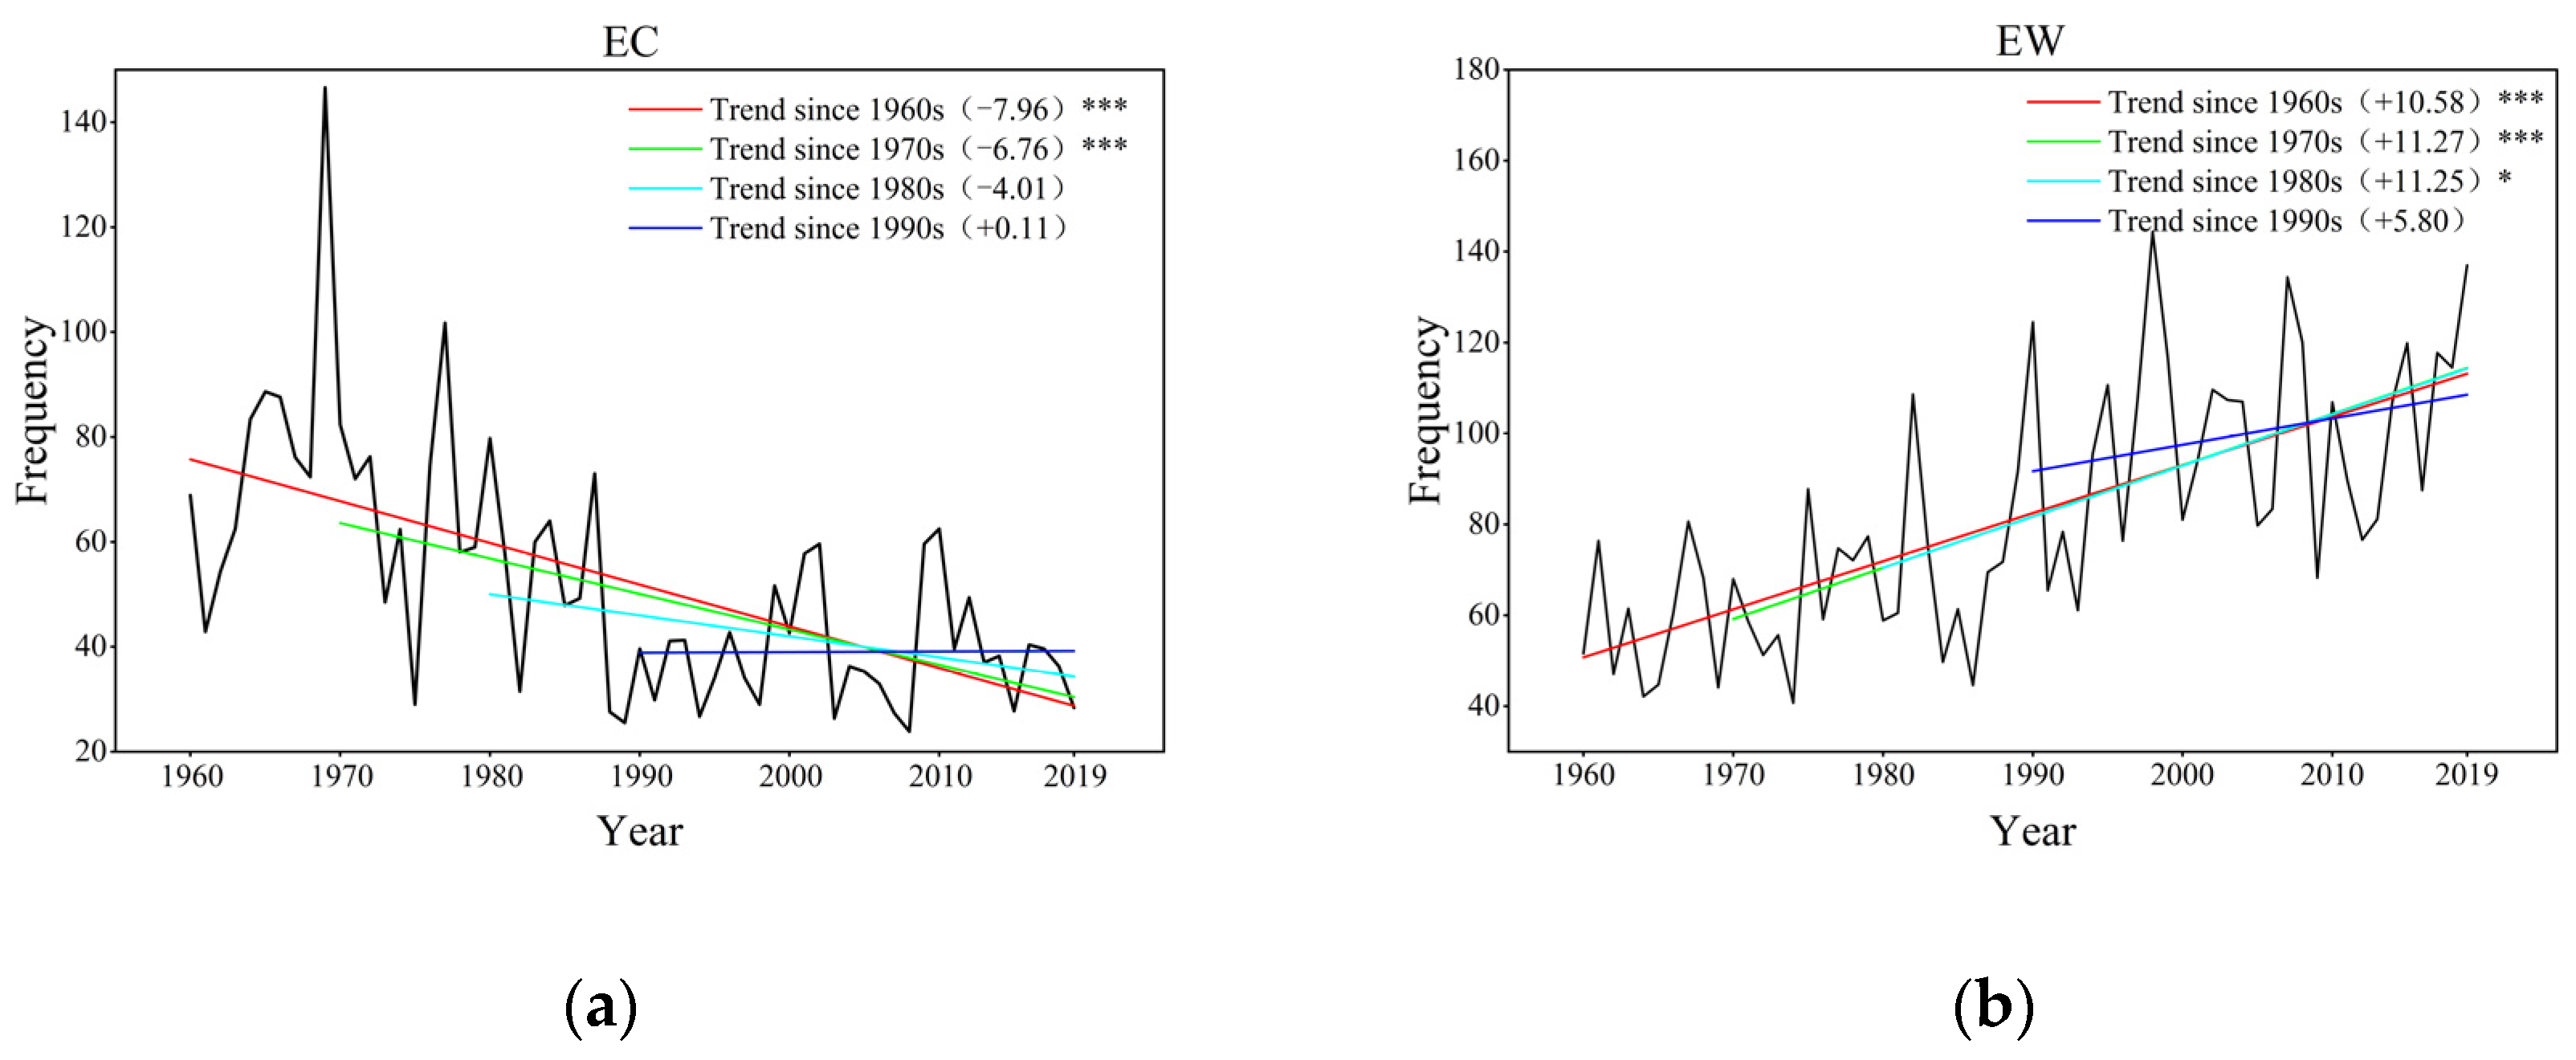
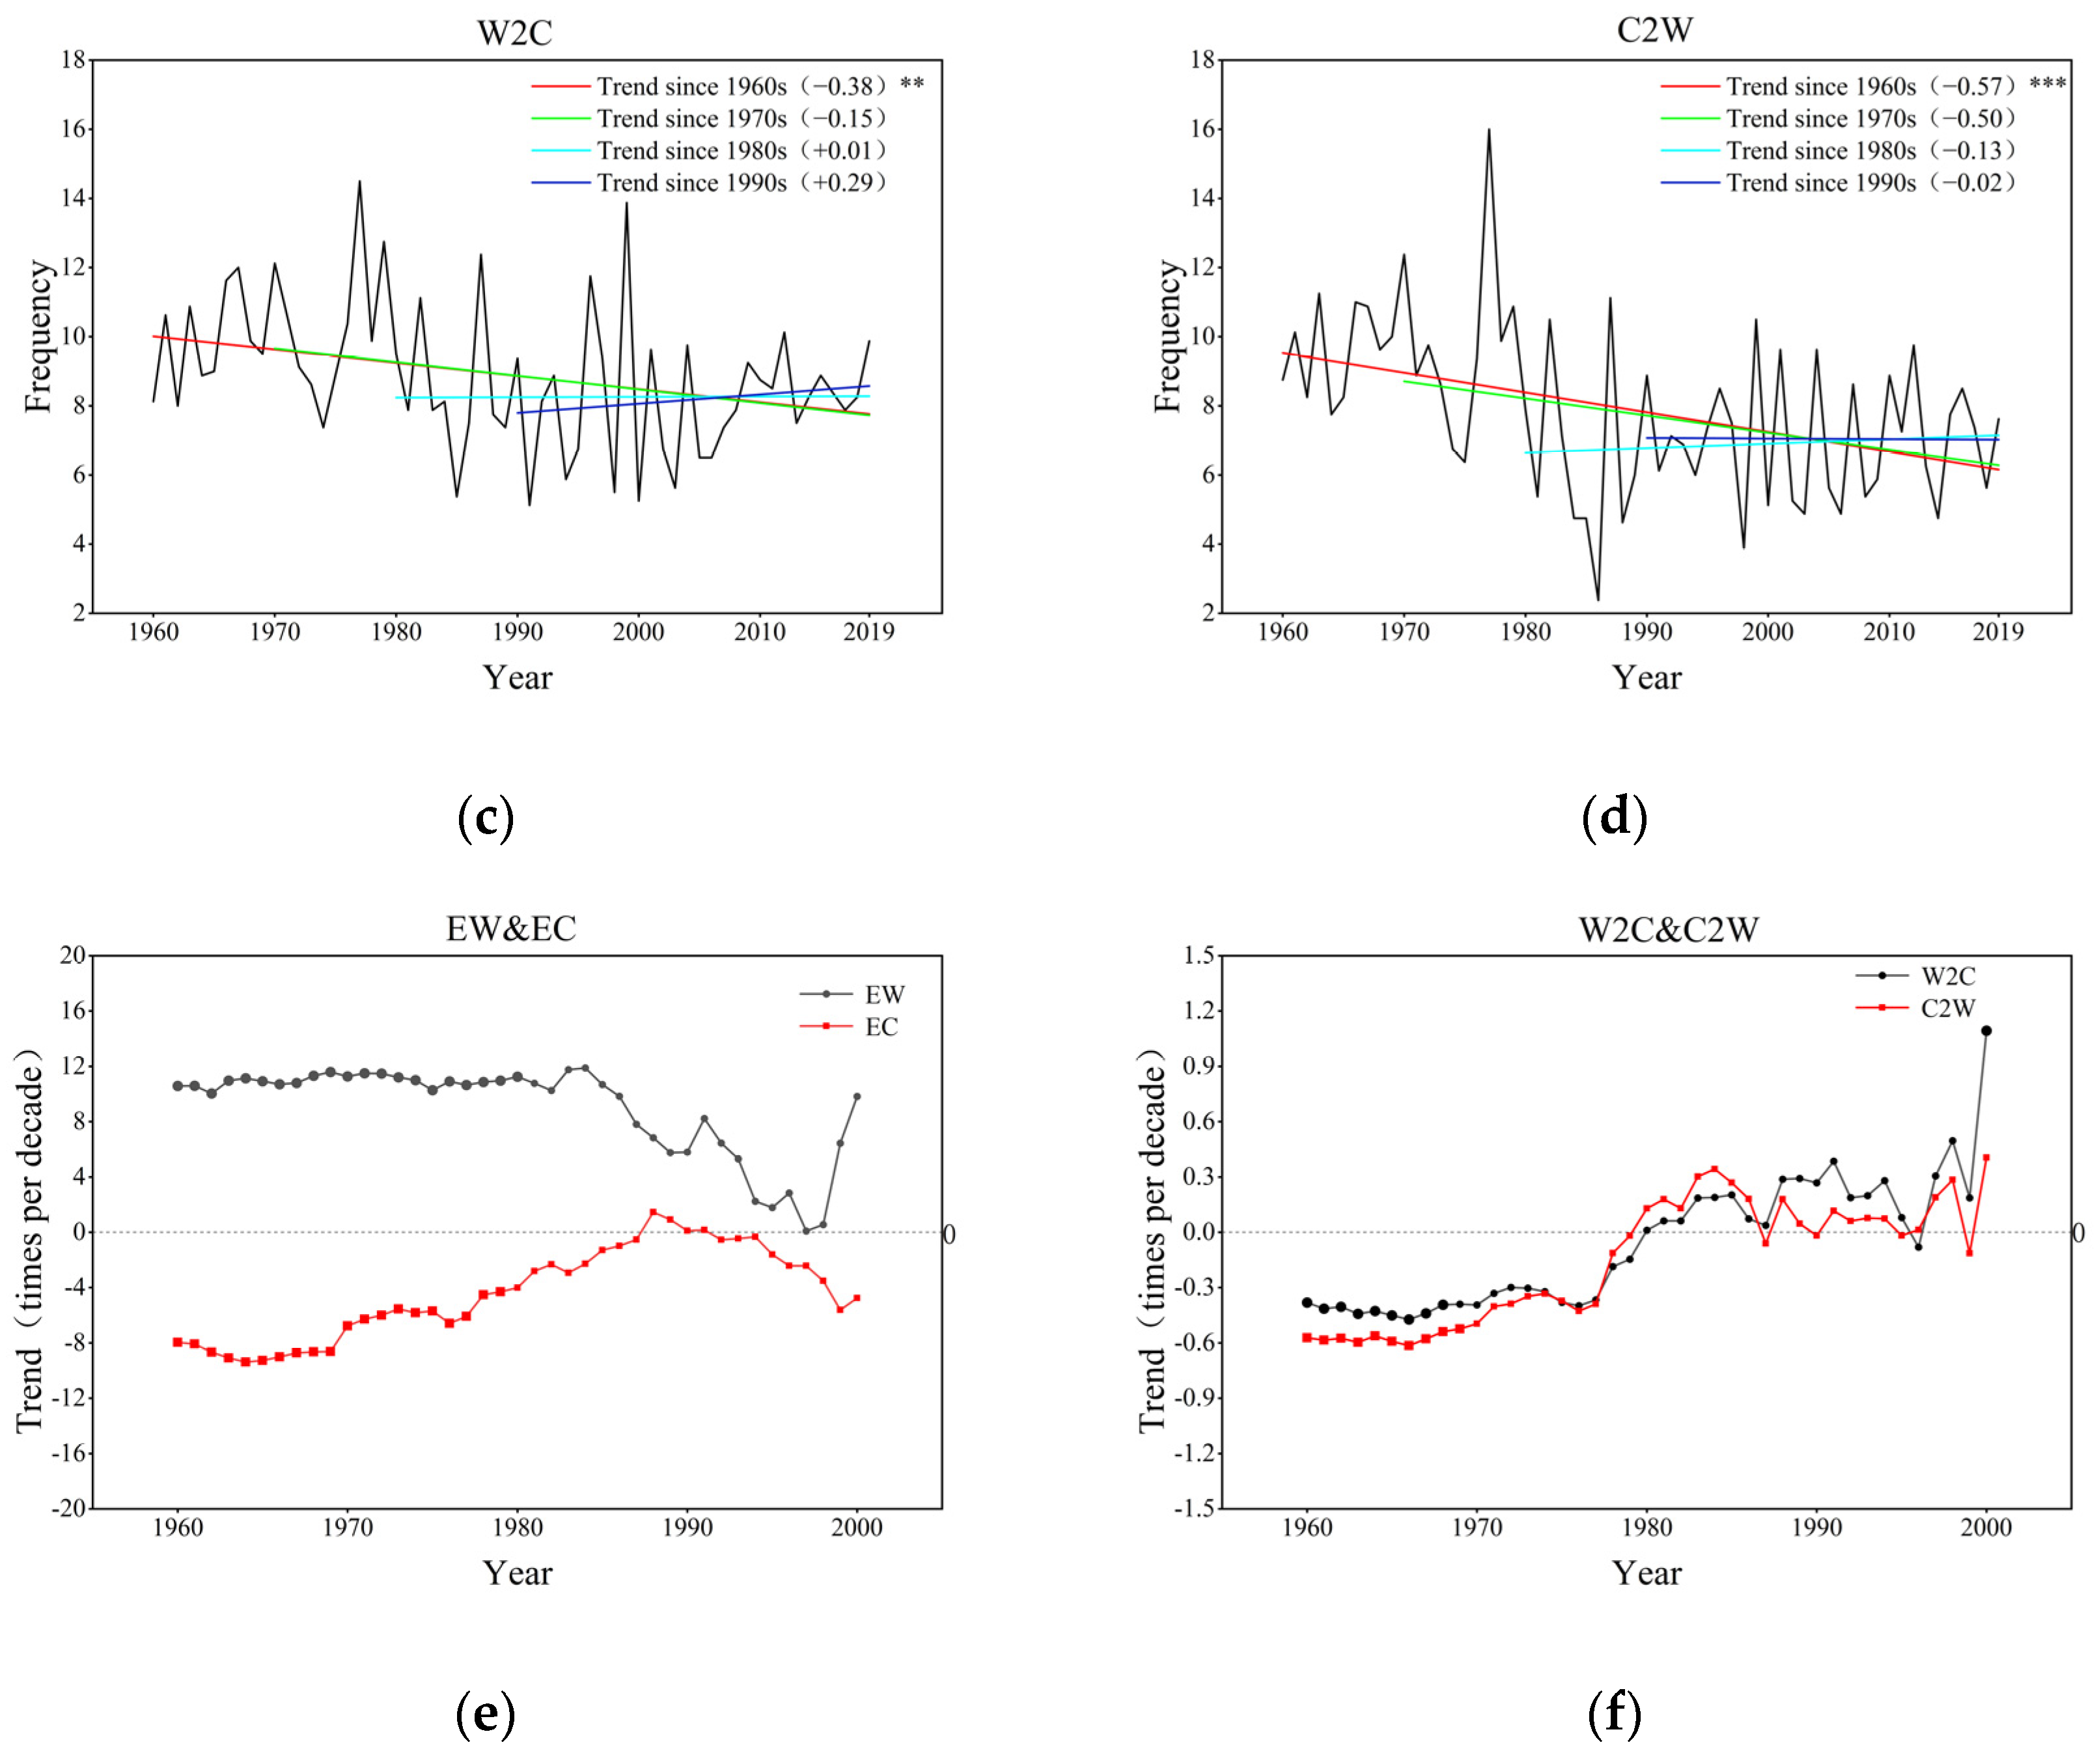
3.2. Inter-Annual Variation in the Number of Extreme Events

To investigate the temporal changes in the occurrence of extreme events, this study conducted trend analyses for EC, EW, W2C, and C2W from 1960, 1970, 1980, and 1990 to 2019, respectively, as shown in Figure 4a–d. Additionally, trend analyses starting from different years were also tested, and the results are presented in Figure 4e,f. Furthermore, due to the limited data interval of only 20 years from 2000 to 2019, which is not sufficient for a robust assessment of climate change [40], the trend analyses and tests starting from different years were terminated in 2000, meaning the data in the charts in Figure 4e,f were cut off in 2000.
As shown in Figure 4a, the trend analysis starting from 1960 and 1970 indicates a significant decreasing trend in EC in the Sanjiang Plain region. In the trend starting from 1980, the rate of decrease in EC began to slow down, and in the trend starting from 1990, the EC trend shifted from decreasing to increasing, specifically increasing by 0.11 times per decade. Compared with the analysis starting from 1980, the rate of decrease in EC decreased by 6.87 times per decade, with a change amplitude reaching 97.26%. This is consistent with previous research indicating that EC generally increased in China after the mid-1980s [38].
In the trend analysis of EW in the Sanjiang Plain region starting from 1960, 1970, and 1980, the growth rate of EW remained stable, at approximately 10.58–11.25 times per decade, as shown in Figure 4b. However, in the trend starting from 1981, the growth rate of EW began to decline. Compared with the trend starting from 1980, the trend starting from 1990 showed a decrease of 48.44%.
As shown in Figure 4c,d, in the trend analysis of abrupt C2W and W2C events starting from 1960 and 1970, the change rate of C2W was relatively stable, decreasing by approximately 0.5 times per decade (while W2C decreased by approximately 0.35 times per decade). This trend began to weaken in 1977. In the trend analysis starting from 1990, the change trend of C2W decreased by 0.02 times per decade (while the change rate of W2C increased by 0.29 times per decade).
This also partially explains why the temperature in China’s middle- and high-latitude regions showed an insignificant gradual upward trend from 1986 to 2015, and the temperature changes became more gradual after the 1990s [19,41]. This led to a decrease in the growth rate of EW in the Sanjiang Plain region and a slowdown in the decreasing trend of EC. Even in the trend analysis starting from 1988 to 1991, there was a simultaneous increase in both EW and EC (as shown in Figure 4e). Figure 5f shows that during the same period, there was also an increase in C2W and W2C abrupt events. That is to say, the simultaneous increase in EC and EW may have led to more frequent occurrences of C2W and W2C.

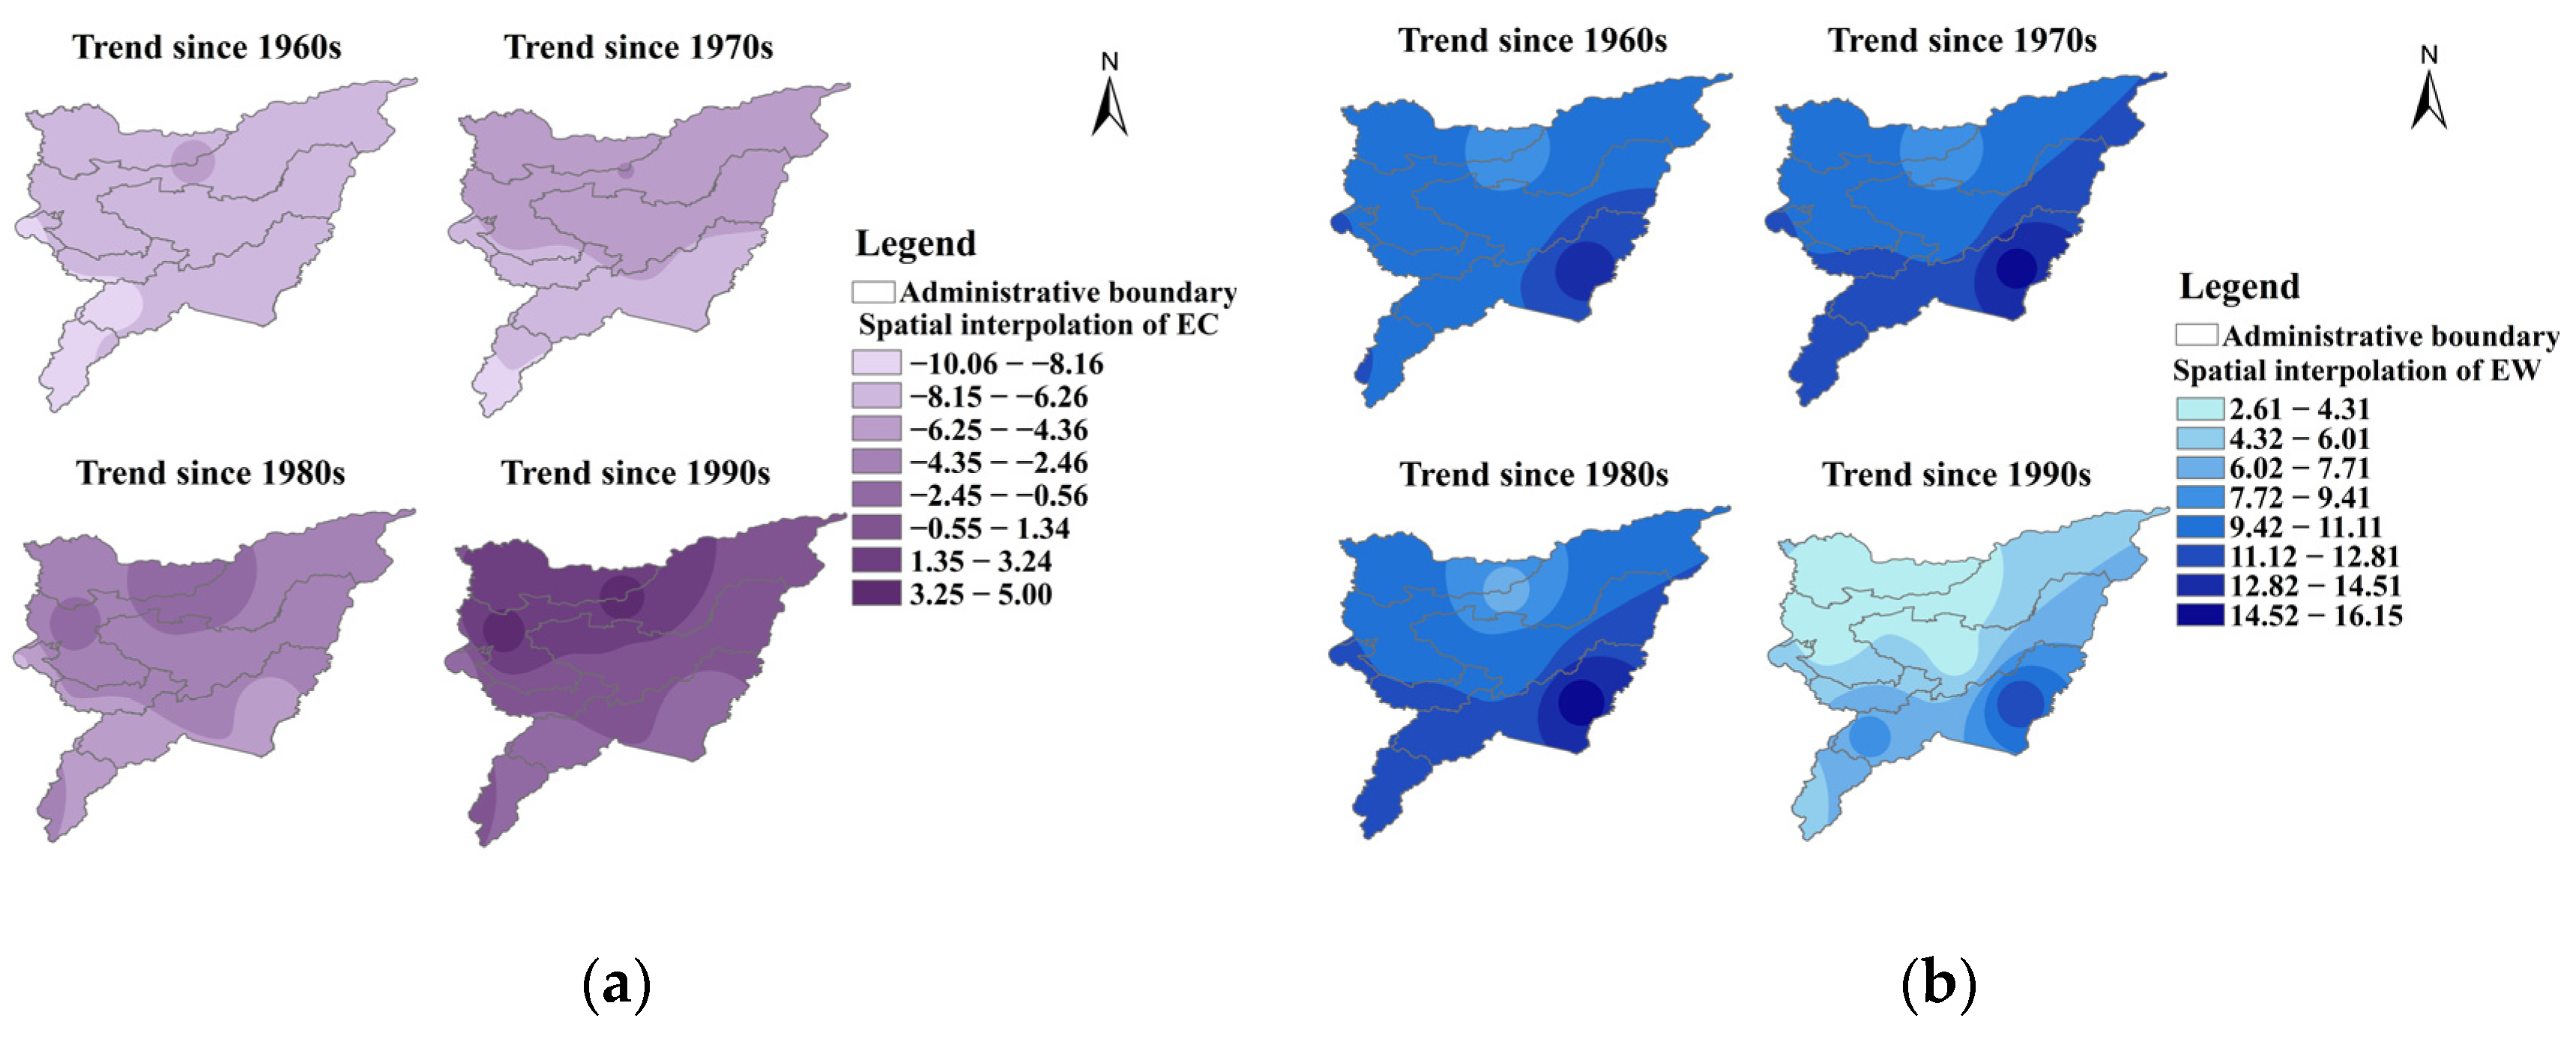
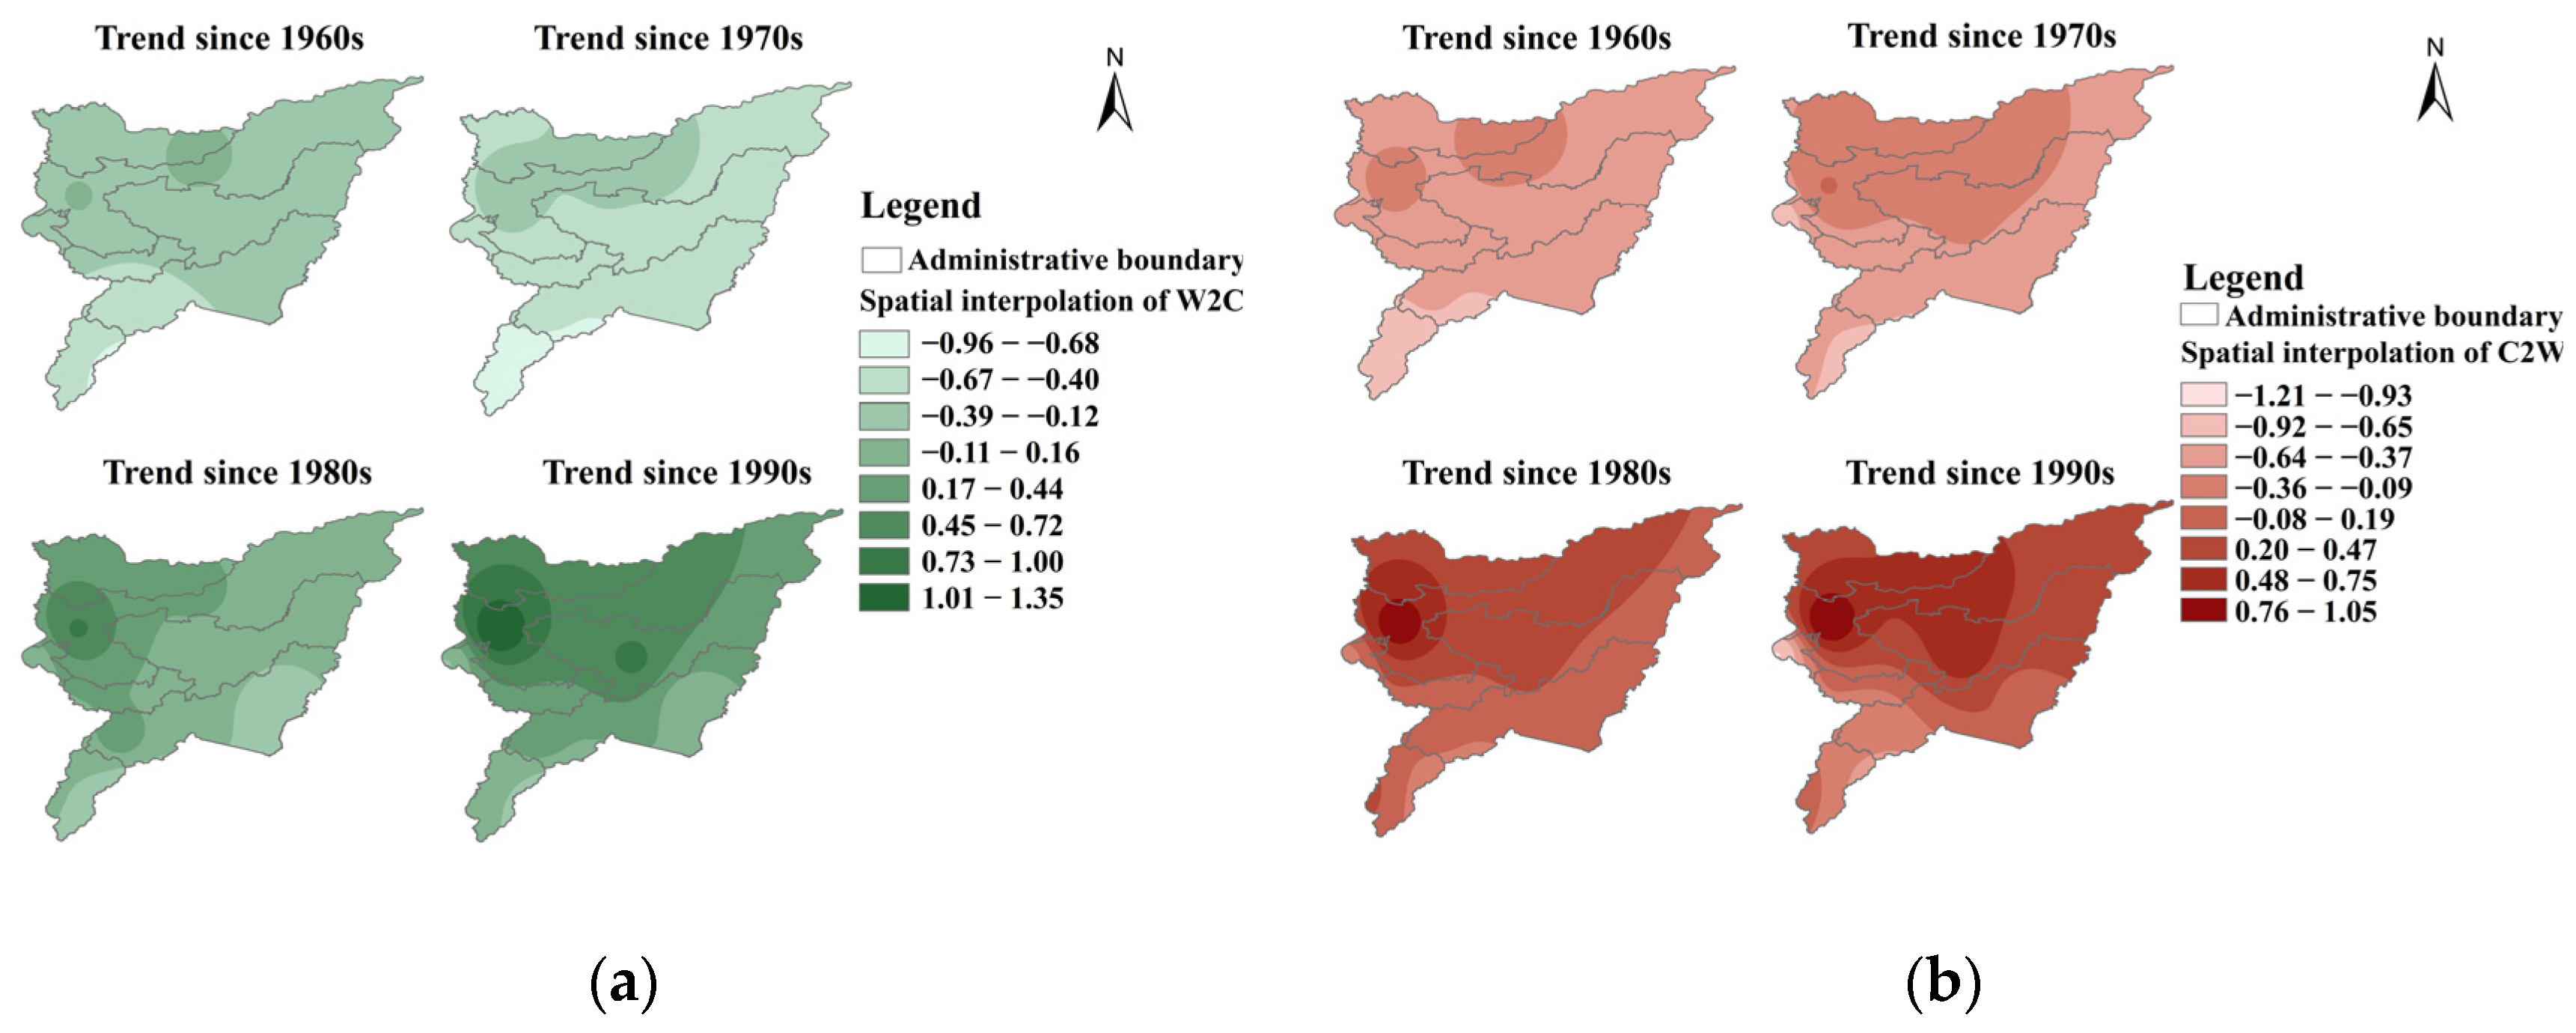
3.3. The Spatiotemporal Distribution of the Rate of Change in Extreme Events

As shown in Figure 5a, the analysis starting from 1960 and 1970 indicates that the EC in the entire Sanjiang Plain region exhibits a significant downward trend. However, the trend analysis starting from 1980 reveals that a slight upward trend in EC has emerged in a small part of the Sanjiang Plain. The trend analysis starting from 1990 shows that most areas of the Sanjiang Plain have exhibited an upward trend in EC. The most significant trend change occurs in Jiamusi City of the Sanjiang Plain. From the trend analysis starting from 1960 to the one starting from 1990, the rate of change in EC shifts from a decrease of 7.49 times per decade to an increase of 4.19 times per decade, with a magnitude of change reaching 155.94%. Correspondingly, Figure 5b indicates that the EW starting from 1960, 1970, and 1980 maintains a very significant growth pattern. However, in the trend analysis starting from 1990, the growth rate of EW events in most areas slows down. The trend change in EW is also most significant in Jiamusi City.
In addition, we also analyzed the sudden sharp turns in temperature events in the Sanjiang Plain. As shown in Figure 6a, the trend analysis starting from 1960 and 1970 indicates that the W2C in the Sanjiang Plain exhibits a downward trend. However, when conducting a trend analysis starting from 1980, a slight upward trend in W2C emerges in some areas. In the trend analysis starting from 1990, most areas show an upward trend in W2C. As shown in Figure 6b, the decreasing rate of C2W (cooling to warming) continues to decrease in the trend analyses starting from 1960, 1970, 1980, and 1990. In the trend analysis starting from 1990, the trend of C2W in most areas has begun to rise. The most significant trend change in sudden sharp turns in temperature events also occurs in Jiamusi City of the Sanjiang Plain.
Figure 5 and Figure 6 show the spatiotemporal distribution of the rates of change in EC, EW, C2W, and W2C for four sub-periods: 1960–2019, 1970–2019, 1980–2019, and 1990–2019. Overall, the trends in extreme events did not exhibit significant changes before 1980, but notable changes occurred in the trend analysis starting from 1980. Some research findings indicate that this may be related to the slowdown of global warming during this period [42,43]. This also illustrates that during the rapid loss of Arctic sea ice from 1980 to 2018, not only did extreme temperature changes occur in winter in China [30], but extreme temperatures also changed when observed on an annual scale. The location with the most significant trend changes in extreme events in the Sanjiang Plain is Jiamusi City, which may be related to the large spatial span and relatively pronounced elevation gradient in this area.

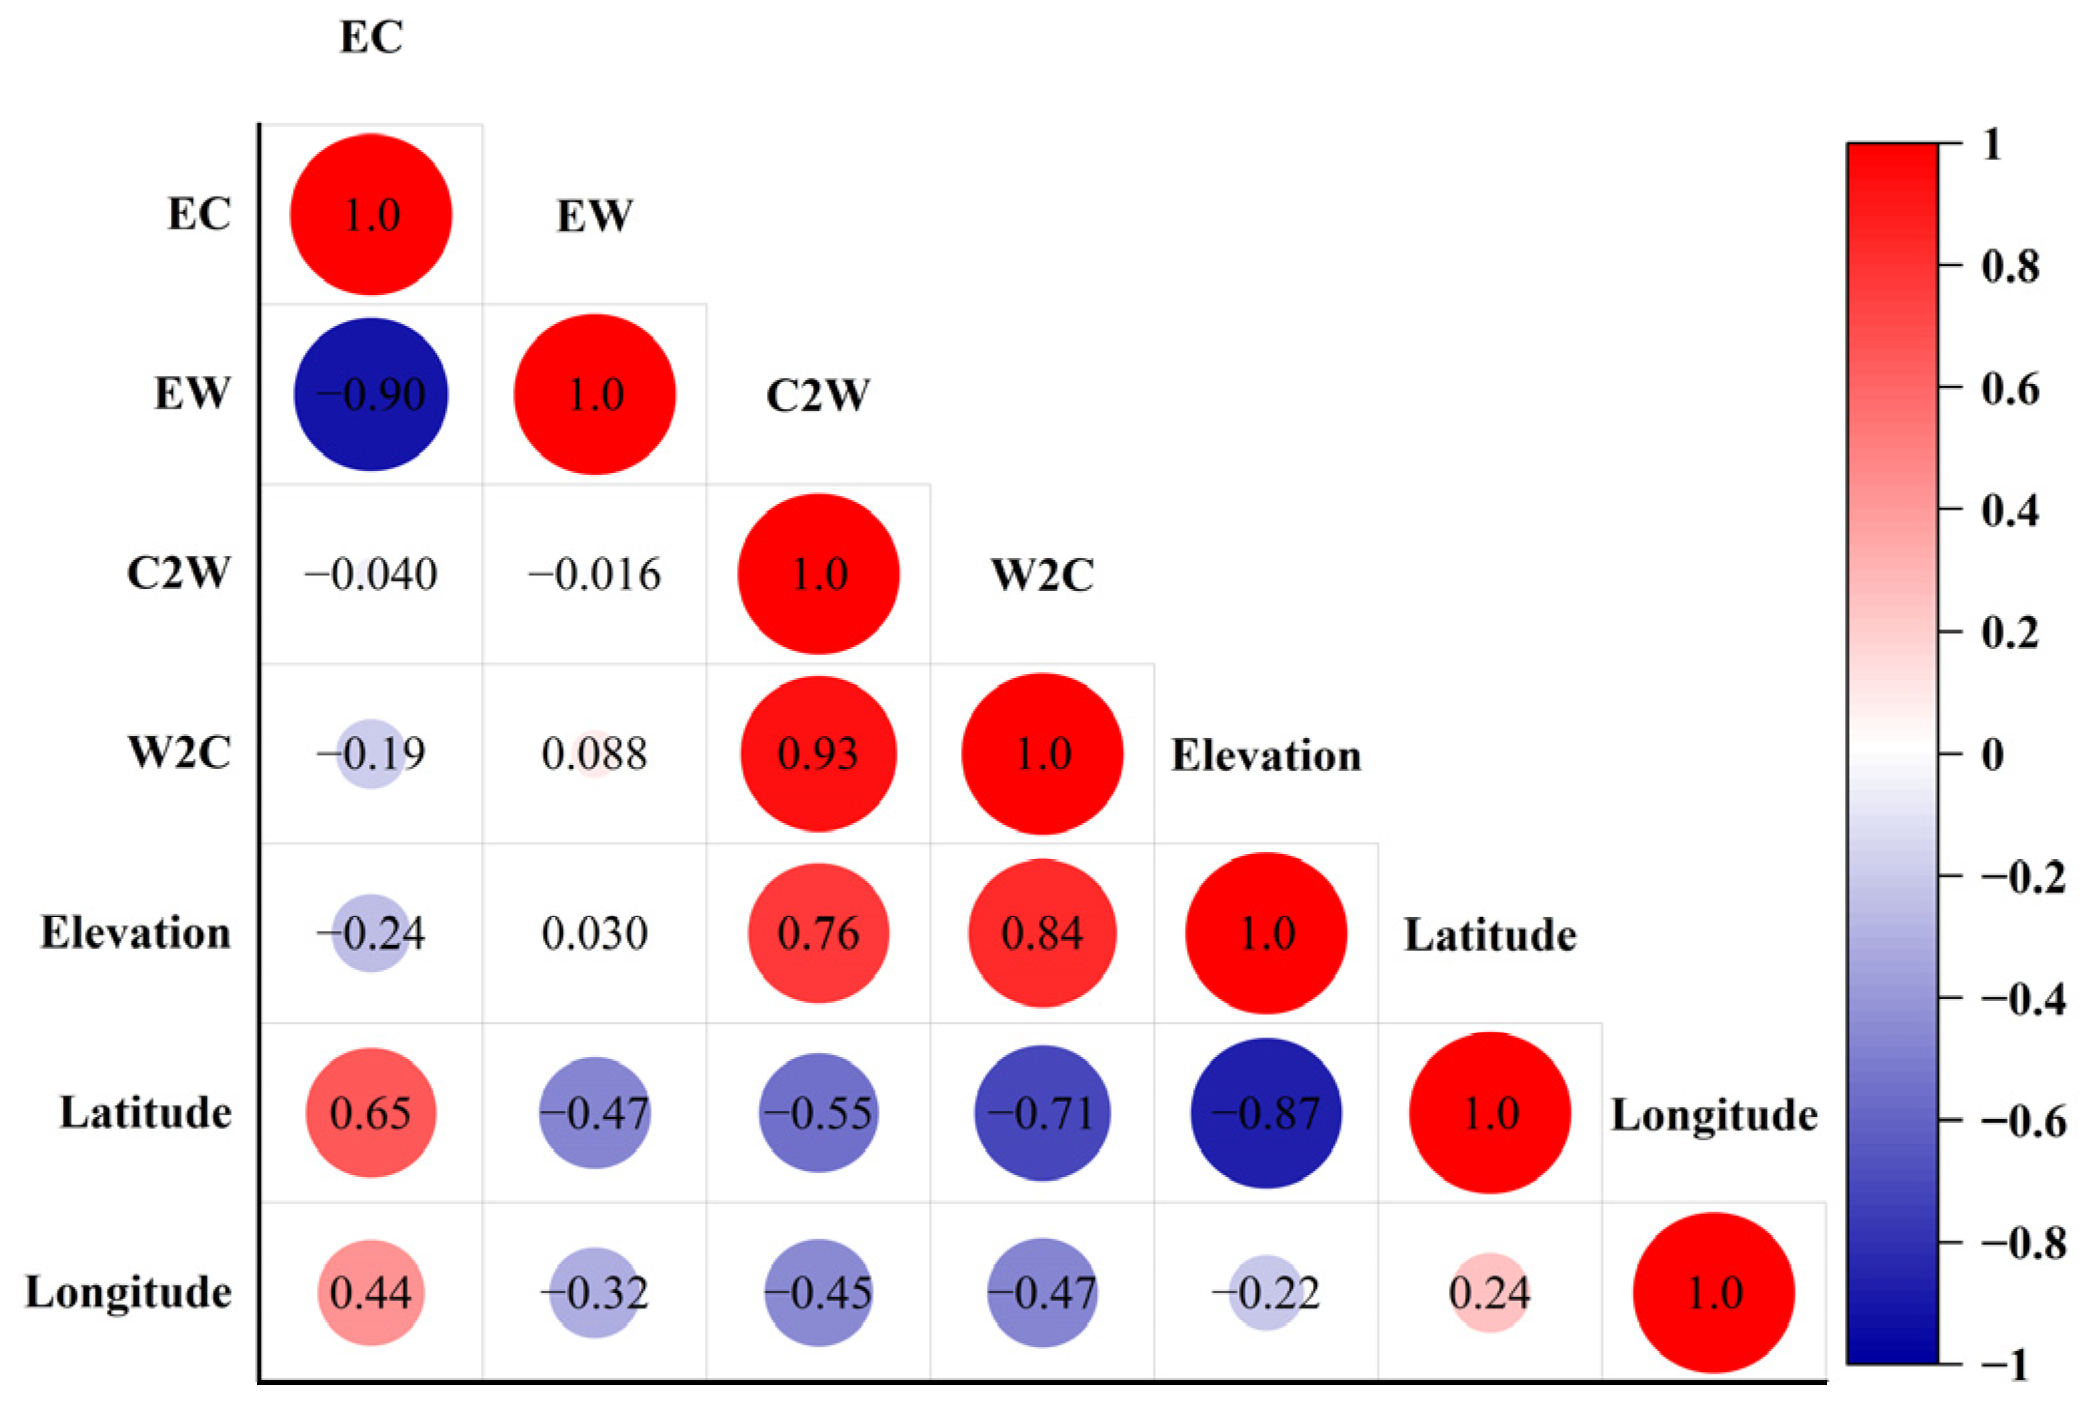
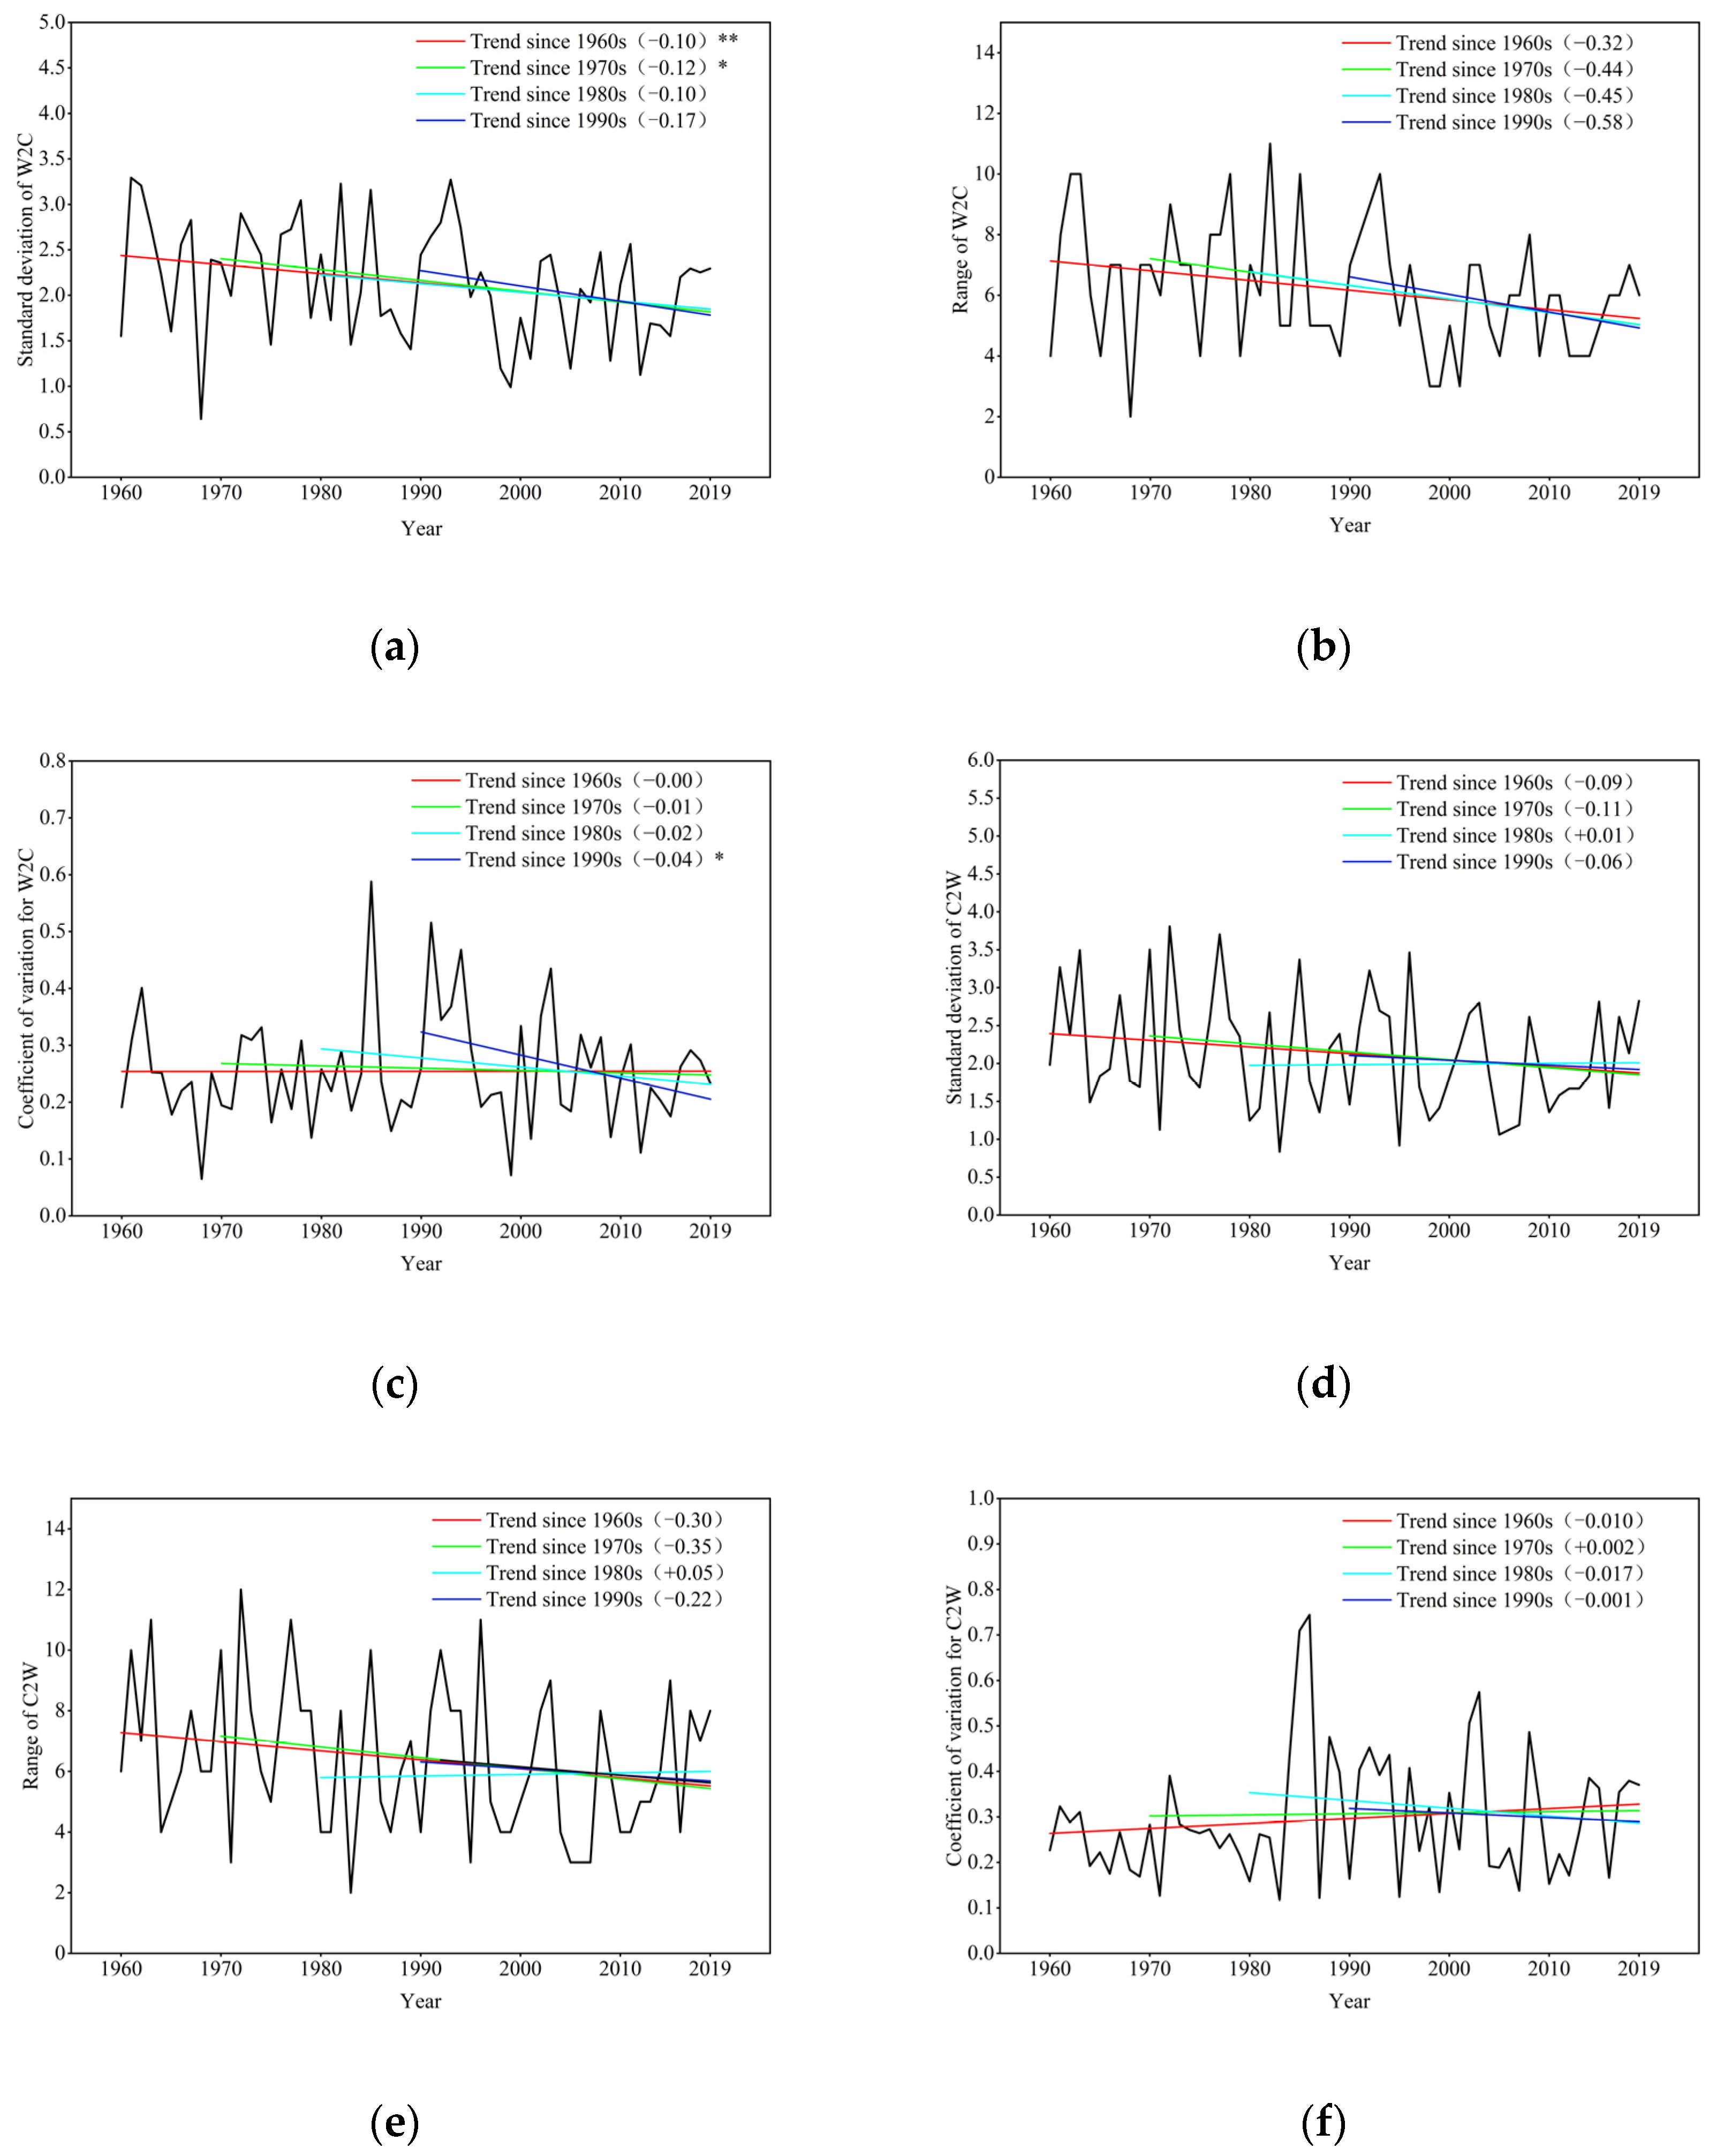
3.4. Discrete Degree Analysis of Extreme Events

Although the frequency of EC occurrences has gradually decreased, the dispersion of this type of event has consistently shown an upward trend from 1970 to 2019. As illustrated in Figure 7a–c, during the period from 1990 to 2019, the standard deviation, range, and coefficient of variation of EC events all exhibited significant growth trends, with specific increases of 1.27, 3.82, and 0.34, respectively, every ten years. On the other hand, the frequency of EW occurrences has continued to rise, and its dispersion has also shown a significant upward trend. According to the data in Figure 7d–f, during the period from 1990 to 2019, the standard deviation, range, and coefficient of variation of EW all experienced varying degrees of growth.
Regardless of the definition of dispersion used, it can be observed that in the past few decades, EC and EW in the Sanjiang Plain have exhibited more regional characteristics. In other words, extreme cold and warm weather events may be more prone to occurring in concentrated areas. The increase in temperature in the Northeast region is regional [44], which may be one of the reasons contributing to the more regional characteristics of EW and EC.
During the periods from 1960 to 2019 and from 1980 to 2019, the standard deviation and range of W2C showed significant decreasing trends (Figure 8a–c). The standard deviation decreased by 0.10 and 0.12 every ten years, respectively, and the range decreased by 0.32 and 0.44 every ten years, respectively. At the same time, between 1990 and 2019, the coefficient of variation of W2C also exhibited a significant decreasing trend, with a reduction of approximately 0.04 every ten years. On the other hand, as shown in Figure 8d–f, although the standard deviation and range of C2W did not show significant decreases, the overall trend was also downward. Meanwhile, after 1980, its coefficient of variation began to show a decreasing trend as well.
Based on the data in Figure 8, although the standard deviation, range, and coefficient of variation of W2C and C2W sometimes show an upward trend, they are still decreasing overall. Therefore, we can conclude that the regional characteristics of extreme temperature transition events in the Sanjiang Plain have gradually weakened over the past few decades. This suggests that extreme temperature transition events may occur more uniformly across the Sanjiang Plain region.

4. Discussion

In the context of global warming, extreme cold and warm events are occurring frequently. While research on EC and EW has been increasing [45,46,47,48], studies on the synergistic changes between EC and EW are relatively scarce. In recent years, China has experienced frequent sudden sharp turns in temperature transitions [49,50,51], with the Northeast region showing particularly intense responses. When a region is repeatedly affected by extreme events, especially those with significant impacts like sudden sharp turns in temperature transitions, quantitative research on their high-frequency areas and time periods becomes necessary [21]. In this study, we focused on the trend changes of EC, EW, C2W, and W2C in the Sanjiang Plain region. However, linear trend estimation is highly sensitive to the length of the analysis period and the choice of start/end years. Therefore, this study employed different starting points for linear trend analysis.
Spatially, the distribution of extreme cold and warm events exhibits significant variability. Sudden sharp turns in temperature occur more frequently in high-altitude areas, and their frequency decreases as latitude increases. There is a significant positive correlation between EC and latitude (r = 0.65), while EW shows a moderate negative correlation with latitude (r = −0.47). This spatial variability may be related to differences in land use/land cover in the study area, as they play a crucial role in regulating extreme temperature events [52,53]. To better understand extreme cold and warm events and their synergistic changes, it is necessary to conduct in-depth research on the spatial variability mechanisms of the occurrence frequency of these events at different scales.
Temporally, research indicates that over the extended period from 1960 to 2019, the Sanjiang Plain region generally experienced a trend towards warmer temperatures, consistent with previous findings [19], and both C2W and W2C transitions have shown a decreasing trend. However, trend analyses starting from different points reveal that since 1979, the trend in EC has shifted, with the rate of decrease gradually slowing down. Starting from 1981, the rate of increase in EW has also decreased, and trend analyses initiated in 1990 show a concurrent increase in both EC and EW. This synergistic change in the frequency of extreme cold and warm events may also contribute to the frequent occurrence of sudden sharp turns in temperature transitions. Studies have shown that after the late 1980s, there was an increase in both EC and EW weather conditions, accompanied by frequent sudden sharp turns in temperature transitions [49,54]. In other words, the changes in extreme temperature events in the Sanjiang Plain have deviated from the typical pattern of ‘increasing EW and decreasing EC’, which characterizes a warming climate [55,56,57].
During this period, parts of North America [58], the UK [59], and the mid-latitude Eurasian continent [54] also experienced a trend of surface cooling. In reality, the cooling trend represents only one aspect of the matter. These regions also experienced more unstable weather patterns, with a sharp increase in the frequency of sudden sharp turns in temperature transitions [60,61,62,63]. In the Sanjiang Plain region, similar to the trend changes in EC, the trends of C2W and W2C themselves underwent significant changes in the late 1970s. These changes coincided with the period of Arctic sea ice decline. Some studies attribute the increase in EC to the forced dynamic response of rapid Arctic sea ice disappearance [58,64,65], but the impact of sea ice loss on C2W and W2C is still undetectable [30]. However, our research results indicate that these coincidental correlations ceased to be as clear and stable as before, starting from the 1990s. Although the trends of EC and EW themselves are still changing, the trends of C2W and W2C do not exhibit significant variations. Given the current lack of accurate explanations for the causes of sudden sharp turns in temperature transitions, further research is needed to identify and attribute these extreme temperature fluctuations from multiple perspectives.
In terms of dispersion, the analysis of dispersion reflects the consistency or variability of extreme temperature events. Long-term trend analysis from 1960 to 2019 indicates that overall, EC events have decreased in the Sanjiang Plain region, while EW events have increased, showing opposite trends in their quantities. However, in the analysis of dispersion, both EC and EW exhibit similar upward trends in dispersion. In other words, the consistency of EC and EW changes across different regions is gradually weakening, suggesting that extreme cold and warm events may become concentrated in certain areas in the future. Conversely, the consistency of C2W and W2C changes across different regions is gradually strengthening, indicating that sudden sharp turns in temperature may occur more uniformly across various regions.
While this study conducted a multi-angle analysis of extreme events in the Sanjiang Plain region, the discussion on the possible causes and mechanisms behind these changes was not fully adequate. Compared to extreme temperature events at the global scale, which are primarily driven by thermal factors, extreme temperature events at the regional scale are mainly dominated by circulation patterns [12,66]. Therefore, further analysis is needed to investigate the causes of extreme event changes in the Sanjiang Plain region under the backdrop of global warming, focusing on the weather systems and circulation anomalies related to extreme climate in China. This will provide important references for studying the impacts of extreme climate events on the state of China’s ecosystems and changes in the socio-environmental context, and for addressing the challenges posed by climate change.

5. Conclusions

Based on the daily maximum and minimum temperature observation data from eight national meteorological stations in the Sanjiang Plain region from January 1961 to December 2019, this paper analyzes the temporal and spatial variation characteristics of C2E, W2C, EC, and EW in the Sanjiang Plain region, and draws the following main conclusions:
Extreme climate events exhibit significant spatial variability. Specifically, W2C shows a significant positive correlation with altitude (r = 0.84) and a significant negative correlation with latitude (r = −0.71), while there is no obvious correlation with longitude. On the other hand, C2W only exhibits a positive relationship with altitude, with an r value of 0.76, and there are no significant negative correlations with latitude or longitude. EC shows a negative correlation with both longitude and latitude, while EW exhibits a positive correlation with both. Neither of them displays a significant impact from altitude.
This study conducted a long-term trend analysis of extreme climate events at multiple time breakpoints and drew the following conclusions: W2C and C2W shifted from a decreasing trend to a weak increasing trend after the 1980s, and this trend change was particularly evident in the northern part of the Sanjiang Plain; EW gradually slowed down its past growth trend in the mid-1980s, while EC showed an overall decreasing trend, but the rate of decrease gradually slowed down, and in the trend analysis starting from 1990, there was a simultaneous increase in both EW and EC.
The analysis of the dispersion of extreme events indicates that the regionality of W2C and C2W has weakened, and C2W events and W2C may occur more uniformly in the Sanjiang Plain region, while the regionality of EC and EW continues to strengthen, making EC and EW more prone to occurring in concentrated areas.
Furthermore, there was a relatively significant change in the trend of extreme climate events in the Sanjiang Plain region in the mid-1990s. It is suggested that at least thirty to forty years are needed to effectively assess the changes in extreme climate events. These results provide important reference information for studying the synergistic changes of extreme hot and cold events and taking measures to reduce the losses caused by extreme events.

Author Contributions

Data curation, H.Z.; formal analysis, Y.C.; funding acquisition, S.Z.; drawing, Y.L.; methodology, H.Z.; resources, S.Z.; supervision, B.L.; writing—original draft, Y.C.; writing—review and editing, B.L. All authors have read and agreed to the published version of the manuscript.

Funding

This research was funded by the Open Research Fund of State Key Laboratory of Simulation and Regulation of Water Cycle in River Basin (China Institute of Water Resources and Hydropower Research), grant number [IWHR-SKL-KF202316], and Hebei Provincial Department of Education Youth Fund Project, grant number [QN2023158].

Institutional Review Board Statement

Not applicable.

Informed Consent Statement

Informed consent was obtained from all the participants involved in the study.

Data Availability Statement

The data for this study were obtained from the China Meteorological Science Data Sharing Network (http://data.cma.cn, accessed on 17 December 2023).

Acknowledgments

The authors extend their appreciation to anonymous reviewers for their thoughtful comments and valuable advice. We also thank the organizers of the sites of the China Meteorological Science Data Sharing Network for the opportunity to use important information.

Conflicts of Interest

The authors declare no conflicts of interest.

References

  1. Michelozzi, P.; Donato, D.F. IPCC Sixth Assessment Report: Stopping climate change to save our planet. Epidemiol. Prev. 2021, 45, 227–229. [Google Scholar] [CrossRef] [PubMed]
  2. Sun, J.; Liu, T.; Xie, S.; Xiao, J.; Huang, L.; Wan, Z.; Zhong, K. Will extreme temperature events emerge earlier under global warming? Atmos. Res. 2023, 288, 106745. [Google Scholar] [CrossRef]
  3. Zeng, N.; Ding, Y.; Pan, J.; Wang, H.; Gregg, J. Climate Change—The Chinese Challenge. Science 2008, 319, 730–731. [Google Scholar] [CrossRef] [PubMed]
  4. Liu, Z.; Yang, X.; Chen, F.; Wang, E. The effects of past climate change on the northern limits of maize planting in Northeast China. Clim. Chang. 2013, 117, 891–902. [Google Scholar] [CrossRef]
  5. Huang, J.; Jiang, J.; Wang, J.; Hou, L. Crop Diversification in Coping with Extreme Weather Events in China. J. Integr. Agric. 2013, 13, 677–686. [Google Scholar] [CrossRef]
  6. Jie, L.; Xiaofeng, X.; Hui, L. An empirical study on the impact of extreme weather and climate events on agricultural economic output in China. Chin. Sci. Earth Sci. 2012, 42, 1076–1082. [Google Scholar]
  7. Cheng, P.; Peng, L.; Hao, J.; Li, S.; Zhang, C.; Dou, L.; Fu, W.; Yang, F.; Hao, J. Short-term effects of ambient temperature on preterm birth: A time-series analysis in Xuzhou, China. Environ. Sci. Pollut. Res. Int. 2020, 28, 12406–12413. [Google Scholar] [CrossRef]
  8. Guo, J.; Ruan, Y.; Wang, Y.; Wang, H.; Ma, S.; Wan, X.; Zhou, X.; Tang, Z.; He, Y.; Zou, Z.; et al. Maternal Exposure to Extreme Cold Events and Risk of Congenital Heart Defects: A Large Multicenter Study in China. Environ. Sci. Technol. 2024, 58, 3737–3746. [Google Scholar] [CrossRef]
  9. Zhai, P.; Pan, X. Trends in temperature extremes during 1951–1999 in China. Geophys. Res. Lett. 2003, 30, 1913. [Google Scholar] [CrossRef]
  10. You, Q.; Jiang, Z.; Kong, L.; Wu, Z.; Bao, Y.; Kang, S.; Pepin, N. A comparison of heat wave climatologies and trends in China based on multiple definitions. Clim. Dyn. 2017, 48, 3975–3989. [Google Scholar] [CrossRef]
  11. Gao, W.; Duan, K.; Li, S. Spatial-temporal variations in cold surge events in northern China during the period 1960–2016. J. Geogr. Sci. 2019, 29, 971–983. [Google Scholar] [CrossRef]
  12. Zhu, Y.; Song, F.; Guo, D. Interdecadal changes in the frequency of winter extreme cold events in North China during 1989–2021. Atmos. Ocean. Sci. Lett. 2024, 17, 100468. [Google Scholar] [CrossRef]
  13. Zhen, L. Extreme Cold Events and Interdiural Temperature Variation at the Regional Scale in China under Global Warming Background. Ph.D. Thesis, University of Chinese Academy of Sciences, Beijing, China, June 2020. [Google Scholar]
  14. Li, X.; Zhang, Y.-J.; Gao, H.; Ding, T. Extreme cold wave in early November 2021 in China and the influences from the meridional pressure gradient over East Asia. Adv. Clim. Chang. Res. 2022, 13, 797–802. [Google Scholar] [CrossRef]
  15. Liao, Z.; Zhai, P.; Chen, Y.; Lu, H. Differing mechanisms for the 2008 and 2016 wintertime cold events in southern China. Int. J. Clim. 2020, 40, 4944–4955. [Google Scholar] [CrossRef]
  16. Ma, S.; Zhu, C. Extreme Cold Wave over East Asia in January 2016: A Possible Response to the Larger Internal Atmospheric Variability Induced by Arctic Warming. J. Clim. 2019, 32, 1203–1216. [Google Scholar] [CrossRef]
  17. Zhu, R.; Wu, X.; Zhang, W.; He, J.; Qin, Y.; Li, Z.; Shen, Y. Seasonally extreme temperature events accelerate in arid northwestern China during 1979-2018. Atmos. Res. 2024, 300, 107230. [Google Scholar] [CrossRef]
  18. Lin, X.; Wang, Y.; Song, L. Variation of temperature extremes in wintertime over Beijing-Tianjin-Hebei region in the era of sharp decline of Arctic sea ice. Atmos. Res. 2024, 297, 107113. [Google Scholar] [CrossRef]
  19. Johnson, N.C.; Xie, S.-P.; Kosaka, Y.; Li, X. Increasing occurrence of cold and warm extremes during the recent global warming slowdown. Nat. Commun. 2018, 9, 1724. [Google Scholar] [CrossRef]
  20. Casson, N.J.; Contosta, A.R.; Burakowski, E.A.; Campbell, J.L.; Crandall, M.S.; Creed, I.F.; Eimers, M.C.; Garlick, S.; Lutz, D.A.; Morison, M.Q.; et al. Winter Weather Whiplash: Impacts of Meteorological Events Misaligned with Natural and Human Systems in Seasonally Snow-Covered Regions. Earth’s Future 2019, 7, 1434–1450. [Google Scholar] [CrossRef]
  21. Liu, J.; Dietz, T.; Carpenter, S.R.; Alberti, M.; Folke, C.; Moran, E.; Pell, A.N.; Deadman, P.; Kratz, T.; Lubchenco, J.; et al. Complexity of Coupled Human and Natural Systems. Science 2007, 317, 1513–1516. [Google Scholar] [CrossRef]
  22. Yang, Z. Study on the Evolution and Prediction of Cultivated Land Productivity in Sanjiang Plain. Master’s Thesis, Northeast Agricultural University, Harbin, China, 2020. [Google Scholar]
  23. Ge, Q.; Wang, H.; Dai, J. Shifts in spring phenophases, frost events and frost risk for woody plants in temperate China. Clim. Res. 2013, 57, 249–258. [Google Scholar] [CrossRef]
  24. Liu, Z.; Yang, X.; Wang, W.; Li, K.; Zhang, X. Characteristics of agricultural climate resources in three provinces of Northeast China under global climate change. Chin. J. Appl. Ecol. 2009, 20, 2199–2206. [Google Scholar]
  25. Lu, N.; Wilske, B.; Ni, J.; John, R.; Chen, J. Climate change in Inner Mongolia from 1955 to 2005—Trends at regional, biome and local scales. Environ. Res. Lett. 2009, 4, 045006. [Google Scholar] [CrossRef]
  26. Wanyama, D.; Bunting, E.L.; Weil, N.; Keellings, D. Delineating and characterizing changes in heat wave events across the United States climate regions. Clim. Chang. 2023, 176, 6. [Google Scholar] [CrossRef]
  27. Della-Marta, P.M.; Haylock, M.R.; Luterbacher, J.; Wanner, H. Doubled length of western European summer heat waves since 1880. J. Geophys. Res. Atmos. 2007, 112, D15103. [Google Scholar] [CrossRef]
  28. Asia faces weather whiplash as Earth warms. Nature 2023, 614, 198. [CrossRef] [PubMed]
  29. Francis, J.A.; Skific, N.; Zobel, Z. Weather whiplash events in Europe and North Atlantic assessed as continental-scale atmospheric regime shifts. npj Clim. Atmos. Sci. 2023, 6, 216. [Google Scholar] [CrossRef]
  30. Chen, Y.; Liao, Z.; Zhai, P. Coincidence of increasingly volatile winters in China with Arctic seaice loss during 1980–2018. Environ. Res. Lett. 2019, 14, 124076. [Google Scholar] [CrossRef]
  31. Baoqi, L. The Law of Runoff Evoluton in Sanjiang Plain under Freezing-Thawing Soil Conditions. Ph.D. Thesis, China Institude of Water Resource &Hydropower Reseach(IWHR), Beijing, China, June 2020. [Google Scholar]
  32. Ma, S.; Wang, Q.; Wang, C.; Huo, Z. The risk division on climate and economic loss of maize chilling damage in Northeast China. Geogr. Res. 2008, 27, 1169–1177. [Google Scholar] [CrossRef]
  33. Moore, T.R.; Matthews, H.D.; Simmons, C.; Leduc, M. Quantifying Changes in Extreme Weather Events in Response to Warmer Global Temperature. Atmos. Ocean 2015, 53, 412–425. [Google Scholar] [CrossRef]
  34. Liu, J.; Du, B.; Sheng, L.; Tian, X. Dynamic patterns of change in marshes in the Sanjiang Plain and their influential factors. Adv. Water Sci. 2017, 28, 22–31. [Google Scholar] [CrossRef]
  35. Xu, M.; Chang, C.P.; Fu, C.; Qi, Y.; Robock, A.; Robinson, D.; Zhang, H. Steady decline of east Asian monsoon winds, 1969–2000: Evidence from direct ground measurements of wind speed. J. Geophys. Res. Atmos. 2006, 111, 24111. [Google Scholar] [CrossRef]
  36. Bartier, P.M.; Keller, C. Multivariate interpolation to incorporate thematic surface data using inverse distance weighting (IDW). Comput. Geosci. 1996, 22, 795–799. [Google Scholar] [CrossRef]
  37. Xueliang, W.; Hongyuan, L.; Rensheng, C.; Junfeng, L.; Guohua, L.; Chuntan, H. Runoff Evolution Characteristics and Driving Factors of Yellow River Above Lanzhou Station from 1956 to 2020 under Changing Environment. Adv. Earth Sci. 2022, 37, 726–741. [Google Scholar]
  38. Ding, T.; Gao, H.; Yuan, Y. The dominant invading paths of extreme cold surges and the invasion probabilities in China. Atmos. Sci. Lett. 2020, 21. [Google Scholar] [CrossRef]
  39. Liu, F.; Chen, S.; Dong, P.; Peng, J. Spatial and temporal variability of water discharge in the Yellow River Basin over the past 60 years. J. Geogr. Sci. 2012, 22, 1013–1033. [Google Scholar] [CrossRef]
  40. Ning, G.; Luo, M.; Zhang, W.; Liu, Z.; Wang, S.; Gao, T. Rising risks of compound extreme heat-precipitation events in China. Int. J. Clim. 2022, 42, 5785–5795. [Google Scholar] [CrossRef]
  41. Dai, H.; Chen, G.; Wu, J.; Yang, L.; Du, W. The rate of warming is slowing and temperature is showing sharp changes in middle and high latitude regions. Arid. Zone Res. 2020, 37, 275–281. [Google Scholar] [CrossRef]
  42. Santer, B.D.; Bonfils, C.; Painter, J.F.; Zelinka, M.D.; Mears, C.; Solomon, S.; Schmidt, G.A.; Fyfe, J.C.; Cole, J.N.S.; Nazarenko, L.; et al. Volcanic contribution to decadal changes in tropospheric temperature. Nat. Geosci. 2014, 7, 185–189. [Google Scholar] [CrossRef]
  43. Drijfhout, S.S.; Blaker, A.T.; Josey, S.A.; Nurser, A.J.G.; Sinha, B.; Balmaseda, M.A. Surface warming hiatus caused by increased heat uptake across multiple ocean basins. Geophys. Res. Lett. 2014, 41, 7868–7874. [Google Scholar] [CrossRef]
  44. Haibo, D. Research on the Extreme Climate Events over Northeast China under Global Climate Change. Ph.D. Thesis, Northeast Normal University, Changchun, China, May 2015. [Google Scholar]
  45. Khan, M.; Bhattarai, R.; Chen, L. Assessment of Deadly Heat Stress and Extreme Cold Events in the Upper Midwestern United States. Atmosphere 2024, 15, 614. [Google Scholar] [CrossRef]
  46. Shang, Z.; Chen, G.; Tang, X. Characteristics of cold events in the eastern China: Perspective from five metropolitan regions. Int. J. Clim. 2024, 44, 2505–2518. [Google Scholar] [CrossRef]
  47. GarcíaBurgos, M.; Ayarzagüena, B.; Barriopedro, D.; GarcíaHerrera, R. Jet Configurations Leading to Extreme Winter Temperatures Over Europe. J. Geophys. Res. Atmos. 2023, 128, e2023JD039304. [Google Scholar] [CrossRef]
  48. Ladwig, L.M.; Chandler, J.L.; Guiden, P.W.; Henn, J.J. Extreme winter warm event causes exceptionally early bud break for many woody species. Ecosphere 2019, 10, e02542. [Google Scholar] [CrossRef]
  49. Yao, Y.; Zhuo, W.; Gong, Z.; Luo, B.; Luo, D.; Zheng, F.; Zhong, L.; Huang, F.; Ma, S.; Zhu, C.; et al. Extreme Cold Events in North America and Eurasia in November–December 2022: A Potential Vorticity Gradient Perspective. Adv. Atmos. Sci. 2023, 40, 953–962. [Google Scholar] [CrossRef]
  50. Zhang, X.; Fu, Y.; Han, Z.; Overland, J.E.; Rinke, A.; Tang, H.; Vihma, T.; Wang, M. Extreme Cold Events from East Asia to North America in Winter 2020/21: Comparisons, Causes, and Future Implications. Adv. Atmos. Sci. 2021, 39, 553–565. [Google Scholar] [CrossRef]
  51. Zheng, F.; Yuan, Y.; Ding, Y.; Li, K.; Fang, X.; Zhao, Y.; Sun, Y.; Zhu, J.; Ke, Z.; Wang, J.; et al. The 2020/21 Extremely Cold Winter in China Influenced by the Synergistic Effect of La Niña and Warm Arctic. Adv. Atmos. Sci. 2021, 39, 546–552. [Google Scholar] [CrossRef]
  52. Yu, L.; Liu, Y.; Liu, T.; Yan, F. Impact of recent vegetation greening on temperature and precipitation over China. Agric. For. Meteorol. 2020, 295, 108197. [Google Scholar] [CrossRef]
  53. Luo, M.; Lau, N. Increasing Human-Perceived Heat Stress Risks Exacerbated by Urbanization in China: A Comparative Study Based on Multiple Metrics. Earth’s Future 2021, 9, e2020EF001848. [Google Scholar] [CrossRef]
  54. McCusker, K.E.; Fyfe, J.C.; Sigmond, M. Twenty-five winters of unexpected Eurasian cooling unlikely due to Arctic sea-ice loss. Nat. Geosci. 2016, 9, 838–842. [Google Scholar] [CrossRef]
  55. Gulev, S.K.; Thorne, P.W.; Ahn, J.; Dentener, F.J.; Domingues, C.M.; Gerland, S.; Gong, D.; Kaufman, D.S.; Nnamchi, H.C.; Quaas, J.; et al. Changing state of the climate system. In Climate Change 2021: The Physical Science Basis; Contribution of Working Group I to the Sixth Assessment Report of the Intergovernmental Panel on Climate Change; Masson-Delmotte, V., Zhai, P., Pirani, A., Connors, S.L., Péan, C., Berger, S., Caud, N., Chen, Y., Goldfarb, L., Gomis, M.I., et al., Eds.; Cambridge University Press: Cambridge, UK; New York, NY, USA, 2021; pp. 287–422. [Google Scholar] [CrossRef]
  56. Keellings, D.; Moradkhani, H. Spatiotemporal Evolution of Heat Wave Severity and Coverage Across the United States. Geophys. Res. Lett. 2020, 47, e2020GL087097. [Google Scholar] [CrossRef]
  57. Hu, W.; Zhang, G.; Zeng, G.; Li, Z. Changes in Extreme Low Temperature Events over Northern China under 1.5 °C and 2.0 °C Warmer Future Scenarios. Atmosphere 2018, 10, 1. [Google Scholar] [CrossRef]
  58. Kug, J.-S.; Jeong, J.-H.; Jang, Y.-S.; Kim, B.-M.; Folland, C.K.; Min, S.-K.; Son, S.-W. Two distinct influences of Arctic warming on cold winters over North America and East Asia. Nat. Geosci. 2015, 8, 759–762. [Google Scholar] [CrossRef]
  59. Hanna, E.; Hall, R.J.; Overland, J.E. Can Arctic warming influence UK extreme weather? Weather 2017, 72, 346–352. [Google Scholar] [CrossRef]
  60. Cohen, J. An observational analysis: Tropical relative to Arctic influence on midlatitude weather in the era of Arctic amplification. Geophys. Res. Lett. 2016, 43, 5287–5294. [Google Scholar] [CrossRef]
  61. Cohen, J.; Pfeiffer, K.; Francis, J.A. Warm Arctic episodes linked with increased frequency of extreme winter weather in the United States. Nat. Commun. 2018, 9, 869. [Google Scholar] [CrossRef]
  62. Overland, J.E.; Dethloff, K.; Francis, J.A.; Hall, R.J.; Hanna, E.; Kim, S.-J.; Screen, J.A.; Shepherd, T.G.; Vihma, T. Nonlinear response of mid-latitude weather to the changing Arctic. Nat. Clim. Chang. 2016, 6, 992–999. [Google Scholar] [CrossRef]
  63. Zarzycki, C.M. Projecting Changes in Societally Impactful Northeastern, U.S. Snowstorms. Geophys. Res. Lett. 2018, 45, 12067–12075. [Google Scholar] [CrossRef]
  64. Warner, J.L.; Screen, J.A.; Scaife, A.A. Links between Barents-Kara Sea Ice and the Extratropical Atmospheric Circulation Explained by Internal Variability and Tropical Forcing. Geophys. Res. Lett. 2020, 47, e2019GL085679. [Google Scholar] [CrossRef]
  65. Ma, S.; Zhu, C.; Liu, B.; Zhou, T.; Ding, Y.; Orsolini, Y.J. Polarized Response of East Asian Winter Temperature Extremes in the Era of Arctic Warming. J. Clim. 2018, 31, 5543–5557. [Google Scholar] [CrossRef]
  66. Shepherd, T.G. Atmospheric circulation as a source of uncertainty in climate change projections. Nat. Geosci. 2014, 7, 703–708. [Google Scholar] [CrossRef]
Figure 1. Location map of the study area and distribution of meteorological stations in the study area.
Atmosphere 15 01092 g001
Figure 2. The figure displays the spatial distribution of the occurrence of extreme events in the Sanjiang Plain from 1960 to 2019. Specifically, panels (a,b) reflect the spatial distribution of EC and EW occurrences, respectively, while panels (c,d) show the spatial distribution of W2C and C2W occurrences, respectively. In each panel, the color gradient from light to dark indicates an increase in the occurrence of extreme events.
Atmosphere 15 01092 g002
Figure 3. Correlation matrix diagram between extreme events (EC, EW, C2W, W2C) and spatial factors such as elevation, longitude, and latitude. The color and size of the circles indicate the strength of the relationship between each pair of events and factors, with red representing a positive correlation and blue representing a negative correlation.
Atmosphere 15 01092 g003
Figure 4. In the figure, (ad) show the trend analyses for EC, EW, W2C, and C2W, respectively, from 1960 to 2019, with starting points in 1960, 1970, 1980, and 1990, respectively, and an endpoint in 2019. The symbols *, **, and *** indicate significance levels of 0.1, 0.05, and 0.01, respectively. (e,f) display the slopes of the trend lines for EW and EC, respectively, as well as W2C and C2W, starting from different years between 1960 and 2019 and ending in 2019. The significant points indicate a significance level of 0.1.
Atmosphere 15 01092 g004aAtmosphere 15 01092 g004b
Figure 5. Figure (a,b) show the spatial distribution of the change rates of EC and EW, respectively, from the starting points of 1960, 1970, 1980, and 1990 to the endpoint of 2019. The colors in the figure, from light to dark, indicate that the change rates of extreme cold and warm events in the study area range from negative to positive or from small to large.
Atmosphere 15 01092 g005
Figure 6. Figure (a,b) showcase the spatial distribution of the change rates of W2C and C2W, respectively, spanning from the starting points of 1960, 1970, 1980, and 1990 to the endpoint of 2019. The colors in the figure, transitioning from light to dark, represent the frequency of sudden sharp turns in temperature events in the study area, ranging from negative to positive or from small to large.
Atmosphere 15 01092 g006
Figure 7. Figure (ac) and (df) present the trend analysis of standard deviation, range, and coefficient of variation for EC and EW, respectively, with starting points in 1960, 1970, 1980, and 1990, and an endpoint in 2019. Here, *, **, and *** indicate significance at the 0.1, 0.05, and 0.01 levels, respectively.
Atmosphere 15 01092 g007
Figure 8. Figure (ac) and (df) present the trend analysis of standard deviation, range, and coefficient of variation for W2C and C2W, respectively, with starting points in 1960, 1970, 1980, and 1990, and an endpoint in 2019. Here, * and ** indicate significance at the 0.1 and 0.05 levels, respectively.
Atmosphere 15 01092 g008
Table 1. Basic information about the study area site.
StationStation CodeLongitude (°)Latitude (°)Elevation (m)Date Series (Year)
Fujin50,788131.9847.2366.401960–2019
Jiamusi50,873130.3046.7882.001960–2019
Yilan50,877129.5846.30100.101960–2019
Baoqing50,888132.1746.3879.601960–2019
Jixi50,978130.9245.30272.501960–2019
Hulin50,983132.9745.77102.201960–2019
Mudanjiang54,094129.6744.50307.701960–2019
Suifenhe54,096131.1744.38569.801960–2019
Disclaimer/Publisher’s Note: The statements, opinions and data contained in all publications are solely those of the individual author(s) and contributor(s) and not of MDPI and/or the editor(s). MDPI and/or the editor(s) disclaim responsibility for any injury to people or property resulting from any ideas, methods, instructions or products referred to in the content.

