Review

Evolution and Control of Air Pollution in China over the Past 75 Years: An Analytical Framework Based on the Multi-Dimensional Urbanization

by
Zhaopeng Li
1,
Kai Zhao
2,*,
Xiaoling Yuan
2,*,
Yinan Zhou
3,
Li Yang
4 and
Hanyu Geng
2
1
School of Marxism, Xi’an Jiaotong University, Xi’an 710049, China
2
School of Economics and Finance, Xi’an Jiaotong University, Xi’an 710049, China
3
Insititue of Economics, Xi’an Academy of Social Sciences, Xi’an 710018, China
4
School of Economics and Management, XinJiang University, Urumqi 830046, China
*
Authors to whom correspondence should be addressed.
Atmosphere 2024, 15(9), 1093; https://doi.org/10.3390/atmos15091093
Submission received: 8 August 2024 / Revised: 3 September 2024 / Accepted: 5 September 2024 / Published: 8 September 2024
(This article belongs to the Special Issue Novel Insights into Air Pollution over East Asia)

Abstract

:
China’s approach to air pollution control has been shown successful in East Asian countries and even elsewhere in the world. The analysis of the evolution and control of air pollution in China over the past 75 years can be used as a reference for developing countries suffering from air pollution resulting from urbanization. Based on the sorting and mining of relevant indicators, data and policy texts from the areas of population, economy, space and social urbanization, the findings suggest that the presence of air pollution and its changing forms indeed have complex interactive relationships with the process of urbanization. Specifically: (1) the feature of air pollution has changed from “single pollutant and pollution source to multiple pollutants and pollution source, local pollution to regional pollution, light pollution to heavy compound pollution” as a result of urbanization, the emphasizing of construction and the neglect of governance, the emphasizing of economics and the neglect of ecology, and the emphasizing of immediate interests over long-term interests; (2) the interactive relationship between air pollution and urbanization has also gone through three stages from being irrelevant each other to “urbanization determines air pollution” and then “air pollution restricts urbanization”; (3) this has forced air pollution control to shift from the traditional “treating symptoms” to “high-quality urbanization”, thus promoting air pollution and urbanization to move “from confrontation to unification”. Therefore, air pollution control is not a simple technical issue; one of the keys lies in exploring how to adjust the urbanization model, so as to achieve the “win–win” of urbanization and air pollution control.

1. Introduction

As the basic host of people’s production and life, the city is essential to realizing high-quality socio-economic development. Since the founding of P.R. China 75 years ago, a series of world-renowned achievements have been made in urban construction and development. For instance, the urbanization rate of P.R. China’s permanent resident population increased from 10.64% in 1949 to 66.1% in 2023, along with the enlarging of city scale. The number of prefecture-level cities rose from 65 in 1949 to 297 in 2023, and the number of large cities with a population of over one million went up from 5 in the 1950s to 168 in 2023. After the completion of China’s “three great reconstructions” in 1952, China’s gross domestic product (GDP) was only CNY 67.91 billion. However, the GDPs of only 297 cities above the prefecture level reached CNY 121.2 trillion at the end of 2023. Under this dominant milieu, the growth of the megalopolis has become a major trend in China’s high-quality economic development in the most recent decade. Beijing–Tianjin–Hebei (BTH), Yangtze River Delta (YRD) and Pearl River Delta (PRD) have occupied more than 75% of the population, 88% of the GDP, and 25% of the national territory. Therefore, the urbanization process of China in the past 75 years and in years to come can be deemed as an overwhelmingly crucial event that cannot be ignored, and will significantly affect the global socio-economic development process in the future.
The great feat of urbanization is inevitably accompanied with numerous persistent “urban diseases”, such as low development efficiency, backward governance, and resource supply constraints, among which the most serious and far-reaching puzzle is air pollution [1]. Given the short-sighted strategic planning that only prioritized economic construction in the early stage of urbanization, urban air pollution was not taken into consideration seriously until the unprecedented problem of haze pollution swept across China. In 2013, the days with haze pollution in BTH, YRD and PRD accounted for more than 1/3 of the whole year. Above 100 large and medium-sized cities and at least 20 provinces in China suffered from haze pollution to varying degrees. The annual average PM10 (respirable particulate matter) concentration compliance rate in 74 key environmental monitoring cities in China is 14.9%, while the PM2.5 (fine particulate matter) concentration compliance rate is only 4.1%. The most severe haze pollution period, lasting two weeks in January, gave rise to 677 heavy pollution weather events in 74 key monitoring cities [2]. The report <Towards an Environmentally Sustainable Future: National Environmental Analysis of the People’s Republic of China> pointed out that 7 of the 10 cities with the most serious air pollution in the world were in China; moreover, less than 1% of China’s large cities meet the air quality standards proposed by the World Health Organization (WHO) [3]. According to conservative estimations, the number of premature deaths caused by air pollution in China was 1.24 to 2.23 million each year [4,5], leading to economic losses as high as 1% to 2.73% of the total GDP [6,7]. However, after intensive investment in environmental protection from the Chinese government, China’s air quality has been significantly improved. In 2023, the number of days with good air quality in prefecture-levels cities reached 86.8%, and the number of days with heavy pollution decreased by 93% compared with 2013. The average annual concentration of PM2.5 also dropped to 30 μg/m3, down nearly 60% from 2013. Since 2018, no Chinese city has been listed within the 20 cities with the most serious air pollution in the world. China has become one of the most successful countries in air pollution control in East Asia and even the world.
The global urbanization process is still advancing. In addition to China, there are still a large number of developing countries around the world suffering from air pollution resulting from the process of urbanization. About 9 million people worldwide die from pollution every year, and air pollution is the leading cause of premature death [8]. According to the <State of Global Air 2024> released by the American Health Effects Institute in 2021, air pollution rose from being the fifth leading risk factor for death globally since 2015 to the second, having already caused 8.1 million premature deaths worldwide and contributing to the premature deaths of more than 700,000 children under five years of age. Currently, 99% of the world’s population is exposed to unhealthy levels of PM2.5 [9], and the different characteristics of smog pollution in different countries also show a variety of complex effects. For example, “Polish haze” has had a very complex effect on the cardiovascular mortality resulting from green lung in Poland in recent years [10]. As one of the largest developing countries in the world, China has made a series of achievements in urbanization, but also suffered from severe air pollution. In the long-term struggle against air pollution, the Chinese government has achieved remarkable results in air pollution control and urbanization in recent years. Therefore, a retrospective review of the course of China’s air pollution control along with the developing tendency of urbanization is expected to provide meaningful references and materials for policymakers to understand the “present and past lives” of air pollution in China, and how it can be effectively treated in the future. Moreover, it will also provide a reference for the formulation of air pollution control strategies in many developing countries suffering from air pollution and the realization of global sustainable development goals.

2. Literature Review

By combing and analyzing the existing literature, it is found that although some scholars have reviewed single issues within China’s urbanization, air pollution or governance processes in the past, they have not reviewed the process of air pollution and its governance from the perspective of urbanization. For example, Feng and Liao helped the overall system for prevention and control of air pollution in China to be understood by a broader audience by providing an overview of the pertinent legislation, plans, and policies [11]; Lu et al. analyzed the three-decade-long progress of air pollution controls in China, highlighting a strategic transformation from emission control toward air quality management [12]. Moreover, most of the research is policy analysis rather than data analysis. Due to the lack of data, very few scholars have looked at the dynamic evolution of China’s urbanization and air pollution and its governance over a long period of time, and only the development of air pollution control policies from the 1980s and onwards was examined by Jin et al. [13]. Most scholars’ studies only use relevant mathematical models to study the impacts of urbanization in China, especially population urbanization, on air pollution after 2000 [14]. Of course, some scholars use spatial expansion [15], economic growth [16] and environmental regulation [17] to represent urbanization and study its impacts on air pollution, which also leads to different conclusions about the impact of urbanization on air pollution.
With the gradual deepening of research, some scholars have come to realize that urbanization is a systematic whole involving multi-dimensional content, and it is no longer realistic to approach urbanization from a single perspective, such as population urbanization or economic growth [18]. On the one hand, there is a mismatch between population agglomeration and spatial expansion in China’s urbanization, and the vacancy rate in the construction of new urban areas is extremely high, so cities with low lighting levels at night are also called “ghost cities” [19]. On the other hand, China’s urbanization is based on the household registration system, and the inconsistency between household registration and population mobility leads to urbanization that is often lower than the real level [20].
Although some scholars have been aware of this problem, few scholars have studied the impact of urbanization on air pollution from the perspective of the totality of urbanization. Only Du et al. [21], Xu et al. [22] and Yang et al. [23] have studied the impacts of urbanization on air pollution from multiple dimensions, such as population, economy, and space. In addition, limited by the evolution of China’s air pollution problems and the availability of indicator data, there are great differences in the selections of air pollution indicators made by scholars in different periods. From the end of the last century to the beginning of this century, as the problem of acid rain pollution became more and more serious, the relationship between urbanization and SO2 became the focus of research. After the outbreak of haze pollution in 2013, the relationship between urbanization and PM2.5 pollution has become the focus of scholars’ research [24]. In recent years, as the problem of O3 pollution has become prominent, some scholars have begun to study the relationship between urbanization and O3 pollution [25]. However, few scholars have studied the interaction between urbanization and various types of air pollution from a macro perspective.
Overall, urbanization is a multi-dimensional system involving population, industry, space and social development. Most of the existing studies only consider the impact of a single dimension of urbanization on a single type of air pollution, which not only leads to extremely controversial research conclusions, but also typically produces the dilemma of “seeing only the trees but not the forest”. At the same time, various air pollutants originate from the development of urbanity in different dimensions, and different types of air pollution show different responses to different dimensions of urbanization. A single pollutant cannot reflect the whole picture of urban air pollution. The focus of academic research is mainly on PM2.5 pollution, ignoring the heterogeneous interaction between other types of air pollution and urbanization, and the relevant research conclusions are often not convincing. Thirdly, the relevant studies on urbanization and air pollution and their governance processes are mostly based on the relevant data after 2000. It has not been found that scholars have macroscopically grasped the interaction process between urbanization and air pollution over a long period of time. It is of great significance for the country to draw development experience from China’s urbanization and air pollution and its governance processes.
In view of the above research shortcomings, the contribution of this paper mainly includes the following three aspects: (1) Compared to most of studies that discuss the air pollution and its governance through the perspective of population urbanization or economic development, we propose a more comprehensive analytical framework incorporating population, economy, space and society to depict development features related to the presence of air pollution in different historical stages in China. (2) This paper considers the evolution of the dynamic relationship between a variety of air pollutants and air pollution rather than one type of air pollutant, which helps to grasp the evolution characteristics of the dynamic relationship between different types of air pollutants and urbanization. (3) In terms of pollution produced, the emission trends of eight major pollutants, including CO2 (carbon dioxide) (strictly speaking, CO2 is not an air pollutant, but its associated issues such as climate change have led to massive socioeconomic losses; for the sake of unification, this paper does not intend to make a strict distinction here), CO (carbon monoxide), PM2.5, O3 (ozone), PM10, TSP (total suspension), SO2 (sulfur dioxide) and NOx (nitrogen oxides), in the past 75 years are discussed. This paper focuses on grasping the characteristics and laws of dynamic evolution in this long-term process, making up for the lack of long-term research shortcomings, which will make it easier for developing countries to learn from this experience.

3. Research Design and Methodology

3.1. Data Description of Air Pollution

Air pollution emission is typically assumed to be affiliated with urbanization [26]. When air pollutants emitted by urbanization exceed the air self-purification capacity of a city, an air pollution problem emerges [27]. Unfortunately, urban air pollution monitoring began relatively late in China. In the 1980s, only a few provincial capitals such as Beijing established air quality monitoring systems, while the capacity for pollutant monitoring was extremely incomplete. Before 2013, only approximately 74 cities had set up a supervision and control mechanism, and six types of air pollutants could be observed, including PM2.5 and O3. Accordingly, consistent and complete official statistics for urban air pollution monitoring are difficult to obtain in China.
For the issues listed above, this study adopts a global high-resolution emission inventory for major air pollutants based on combustion sources and non-combustion industrial sources, published by the School of Urban and Environmental Sciences, Peking University—“PKU Series Emission Inventory (Second Edition)” (data source: Department of Environmental Science, School of Urban and Environmental Sciences, Peking University. http://inventory.pku.edu.cn/home, Accessed on 1 December 2021). The inventory data were established by a “bottom-up” method, with a spatial resolution of 0.1° × 0.1° and a temporal resolution of months, covering a total of 16 air pollutants from 1960 to 2014 (since the collection of this set of data began in 1960, air pollution data from 1949 to 1959 cannot be obtained, but the air pollution problem at this stage was not prominent, and the pollutant emissions were relatively low, and so do not affect the analysis of this study) such as CO2 [28,29], CO [30], PM2.5 [31], PM10 [32], TSP [31], SO2 [30] and NOx [32], etc. The spatial interpolation part of the inventory uses sub-national data, and the intra-year variations in living sources are obtained by applying the spatial–temporal replacement method. Due to the outbreak of haze pollution in China since 2013, China’s General Station for Environmental Pollution Monitoring has started monitoring PM2.5, PM10, NO2, CO and SO2 in 74 key environmental monitoring cities (the number of monitored cities increased to 113 in 2014 and 151 in 2017) in China based on the requirements of the “Ambient Air Quality Standard” (GB3095-2012) [33]. Thus, we utilize the average concentration of urban air pollution published by China Environmental Monitoring Station as the air pollution data after 2013, and the data source is “China Environmental Monitoring Station”. In addition, the CO2 emission data for China published by the BP energy company are used as the CO2 emission data after 2013, taking the average values of cities based on the Wind database. The time span of each air pollution indicator lies between 1960 and approximately 2023 (There is no publicly accessible data after 2019).

3.2. Data Description of Urbanization

Since the important characteristics of urbanization are population agglomeration and a modern economic system, scholars have favored population urbanization or economic growth to measure urbanization in the past. However, as the Chinese government has put more emphasis on high-quality development in recent years, scholars have not been limited to using population urbanization or economic growth as indicators of urbanization, but have begun to explore the connotation of urbanization from a more systematic perspective [34]. Most scholars believe that the features of urbanization include population agglomeration, economic growth, spatial expansion and social progress, which respectively reflect urbanization in four dimensions, including population, economy, space and social development [35,36]. In the past, most scholars have mainly studied the impacts of urbanization on air pollution from the dimensions of population, economy, space and social development [21,22,23]. Therefore, this paper will select the indicators of urbanization from the dimensions of population, economy, space and social development.
It should be noted here that population urbanization usually refers to issues related to urban population agglomeration, economic urbanization usually refers to various modern economic activities in the city, spatial urbanization emphasizes urban space construction, and social urbanization emphasizes the modern life of residents. Following the well-accepted standards that discuss quality or developing inclination through the dimensions of population, economy, space and social urbanization, this study selects six indicators to show population development including the number of prefecture-level cities, number of cities with different sizes, total population, population density, and population urbanization rate long with its growth rate. In the economic dimension, total economic output value, industrial added value and proportion, tertiary industry output value and proportion, and per capita disposable income are selected, as well as five energy consumption indicators including total energy consumption, coal consumption proportion and oil consumption proportion. As far as the space dimension is concerned, we select seven indicators including urban built-up areas, industrial construction land, urban construction and public green space area to represent spatial development. Finally, living energy, central heating area, road area and car ownership are chosen to represent a level of social development. The data sources were “Compilation of Statistical Data for 60 Years of New China”, “China Statistical Yearbook” and “China City Statistical Yearbook”. More details are given in Appendix A. Table 1 shows notable features regarding air pollution and urbanization in the past 75 years. Since the concentrations of CO, PM2.5, PM10, SO2, NO2, and O3 are relatively small in magnitude, it is difficult to display them in the same graph as emission indicators. Therefore, this paper adjusts the magnitude of the above-mentioned atmospheric pollutants. Among them, the data magnitude of PM2.5, PM10, SO2, NO2 and O3 concentration is expanded 10 times, and the data magnitude of CO concentration is expanded 100 times. The adjustment of indicator scale does not affect the interpretation of air pollution concentration patterns.

3.3. Methodology for the Division of Interactive Stages

Interpreting the summarized features of urbanization and air pollution changes presented in Table 1, and combining with major events in socio-economic development and air pollution control, this paper matches the evolutionary trajectory of urbanization with air pollution in a temporal order in the context of China. The criteria and interactive features are given in Table 2. In general, the interaction between the presence of air pollution and the progress of urbanization can be categorized into five stages: The first stage was from 1949 to 1978 before the reform and opening-up (R&O). The urbanization was slow and the emission of air pollutants was low, and the pollution forms were smoke and dust represented by TSP. Therefore, the interactive feature can be summarized as “a difficult exploration of urbanization path with smoke pollution”. The second stage was from 1979 to 1990 in the early period of reform and opening up. Due to the strict control of the sizes of large and medium cities, the number of small cities with a population of less than 0.5 million increased from 159 in 1979 to 502 in 1990. The emergence of high-energy and high-polluting small- and medium-sized enterprises (SMEs) has led to an increase in the pollution of composite coal soot, thus showing the characteristics of “urbanization on the track and coal-smoke pollution”. The third stage was based on the process of “land urbanization” from 1991 to 1999. Due to the emergence of the “political performance championship” and the “land finance” system, the urban space began to expand on a large scale and promoted the process of industrialization. Mass combustion has led to a rapid increase in SO2 emissions, thus presenting the characteristics of “accelerating urbanization and full-blown acid rain”. The fourth stage is the “golden period” of China’s urbanization from 2000 to 2012. The new millennium, accession to the WTO and the hosting of the 2008 Olympic Games have all promoted the overall development of Chinese cities. As a result, the emission of various air pollutants has soared, thus showing the characteristics of “the ‘golden period’ of urbanization and the full outbreak of air pollution”. The fifth stage is 2013~2023, after urbanization had entered the “cooling-off period”. The full-scale outbreak of air pollution guided the government to shift attention from the control of total pollutant emissions only to flexibly adjusting the urbanization model for seeking “the improvement of air quality”, thus the characteristic is “urbanization model adjustment and air pollution control”. Detailed discussions are given in the following sections.

4. Air Pollution and Urbanization in China: Dilemma and Twilight

4.1. Initializing Urbanization Path and Dust Pollution (1949~1978)

In the1950s, the number of prefecture-level cities was only 56 in China; meanwhile, the total urban population was merely 57.65 million (except for special instructions and citations, all data analysis in the following manuscript is based on figures a to g in Table 1). There were only 27 cities with public transport infrastructure and fewer than 100 buses in each city. In 1952, the industrial added value only accounted for 17.64% of GDP, the per capita GDP was only CNY 119. Moreover, the total energy consumption was barely 54.11 million tons of standard coal (except for special indications, all energy consumption units in the following are standard coal, and no special instructions will be given), while the proportion of coal consumption was as high as 94.33%.

4.1.1. The “Soviet Model” of Urbanization and a Light Dust Pollution

The Chinese government directly intervened in urban construction and development through highly concentrated planned economic methods for speeding up the construction of socialist industrialization, such as giving priority to the development of heavy industry, driving urbanization by industrial development, and turning consumer cities into production cities. By the end of the 1960s, the urban population had reached 131 million, and the population urbanization rate of permanent residents had risen from 10.64% in 1949 to 19.75%. As a result, heavy industries such as iron, cement and traditional energy production have been built up. During this period, not only the urban industrial production activities but also the intensity of social activities were comparatively low, thus air pollution was primarily caused by the dust produced by coal combustion, TSP and other soot-type pollutions or PM in dusty weather. The spatial extent of pollution is mainly concentrated on in urban industrial areas. Given the low intensity of air pollution, the strong self-cleaning capacity of the atmosphere and the lack of attention to environmental issues, urban regulators had hardly taken any measures to control the soot-type pollution caused by industrial combustion.

4.1.2. A Decade of Divergent Urbanization and the Initial Advancement of Air Pollution Control

The movement of “Up to the Mountains and Down to the Countryside” in the 1960s and the “Cultural Revolution” in the 1970s directly led to the complete cessation of urbanization. However, China started to give attention to negative consequences caused by air pollution challenges such as acid rain and photochemical smog, which were frequently observed in developed countries. Hence, in 1973, China promulgated the first “Trial Standard for Industrial ‘Three Wastes’ Emissions (GBJ4-1973)”, which initialized the monitoring and prevention of urban SO2 and dust pollution emissions, and set out a number of preliminary benchmarks to control air pollution. For instance, the height of a chimney is restricted to a certain limit, while dust and SO2 emission rates and capacity in urban thermal power plants were also placed under surveillance. Nevertheless, this system lacks monitoring methods and instruments for NOx, O3 and other PM emissions. It was not until the Chinese General Environmental Monitoring Station was founded in 1978 that a relatively adequate air quality monitoring system was established.
For this period, China’s per capita GDP was CNY 385, and the population urbanization rate had dropped to 17.92%, while the proportion of industrial output value had reached 43.68%, and the proportion of coal consumption had declined to 70.7% owing to the development of the crude oil industry. Therefore, the slight dust pollution resulting from the production of heavy industry and coal burning in autumn and winter was the most notable feature among cities.

4.2. Urbanization on Track and Compound Coal-Smoke Pollution (1979~1990)

The 3rd National Urban Work Conference (NUWC) held in 1978 emphasized the essential role of cities in national economic development, and required local governments to shift their focus from rural areas to urban planning, construction, management, and control. It was a historic turning point in China’s urbanization. The main focus of urbanization was accordingly placed on the construction of new productive industrial areas, while public infrastructure in traditional urban areas was only partially renovated or expanded. Here, urban air pollution control was mainly about source control, partial governance and related system construction, and the focus of control was on coal-smoke pollution.

4.2.1. The Rise of SMEs and the Prevalence of Low-End Processing Industries Caused Coal-Smoke Pollution

After the R&O of China, urban population agglomeration began to accelerate. On the one hand, urbanization policies in the planned economic period were still being implemented, and the urban and rural household registration system was loosened to a certain extent. On the other hand, due to the cognition that “the excessive scale of cities in developed countries and over-concentration of urban population lead to air pollution problems”, China implemented an urbanization policy of “strictly controlling the scale of big cities, reasonably developing medium-sized cities and actively developing small towns”. A large amount of rural surplus labor can only be transferred to non-agricultural industries through the construction of township enterprises, and China’s unique small town industrialization model of “leave a land without leaving the country” and “enter a factory without entering the city” was formed, which indirectly contributed to the unprecedented prosperity of the development of small cities. The number of cities with a population of less than 500,000 increased from 159 in 1979 to 502 in 1990, and China’s population urbanization rate reached 26.41%, with an average annual growth rate of 0.71%.
With the influx of labor, capital, technology and other production factors into small- and medium-sized cities, individual workshops with high energy consumption and high pollution, such as paper-making, electroplating and coking, began to proliferate. Because of the chaotic layout, unreasonable product structure, and basically no pollution prevention measures, the emission of air pollution was more random. The total energy consumption increased from 586 million tons to 987 million tons, increasing nearly twice, and the proportion of coal consumption increased from 71.3% to 76.2% from 1979 and 1990. The associated benefit was that the per capita GDP increased from CNY 423 to 1663. Although the proportion of industrial added value decreased from 43.68% to 36.34%, the total output value increased from CNY 176.97 billion to 685.8 billion, an increase of nearly four times. At the same time, the improvement of economic development level also promoted the government’s investment in urban infrastructure construction, but the proportion of infrastructure construction investment in air pollution control continued to decline from 28.75% in the early 1980s to 23.63% in 1990 [37].
As a result, the large concentration of urban population and the rapid development of small- and medium-sized processing industries have promoted the expansion of urban space. In the absence of efficient countermeasures to reduce emissions, individual workshop production with high energy consumption, and high pollution and the combustion of low-quality, high-sulfur coal, produced massive dust (TSP) and SO2 emissions. Since 1980, China has become the third largest acid rain area in the world after Europe and North America, where more than 3 million km2 of land in the southern and southwestern regions has suffered from widespread acid rain pollution [38]. However, the first “Air Environmental Quality Standard (GB3095-1982)” issued by the State Council in 1982 only paid attention to dust and TSP emissions from industrial sources. Facing the huge environmental challenge of a nationwide acid rain outbreak, the average dust per square kilometer started to dramatically decrease, and the average concentration of TSP in key cities also dropped from 560 μg/m3 in 1986 to 387 μg/m3 in 1990, a decrease rate of 30.9% [37].

4.2.2. Infrastructure Construction and Gradually Improved Overall Appearance of City

In the early stage of R&O, the slow growth of urban space area cannot keep up with the rapid concentration of urban population. And the urban space has changed from the stage of “filling and absorbing” to the stage of “saturation and crowding” for the population. With the launch of land market reform, the real sense of urban space expansion also officially started from that time.
From 1981 to 1990 (After 1981, China began to have more systematic urban spatial statistics), China’s urban construction land area expanded from 6720 km2 to 11,608.3 km2, with an average annual growth rate of 7.27%. With economic development becoming the center of all attention, urban spatial planning, which has not been carried out since 1950s, has been valued. During the period, the coverage area of urban central heating and road space increased from 11.67 km2 to 212.63 km2 and from 240.69 km2 to 1017.21 km2, respectively. In addition, attention was also paid to greening coverage. In 1990, the urban landscaping area reached 1963 km2, and the greening coverage rate of built-up areas was close to 20%, which improved the urban investment and living environment to a certain degree.
Overall, from 1979 to 1990, the urbanization that had almost stopped before the R&O restarted. Small- and medium-sized enterprises dominated by processing and manufacturing industries sprang up. The large concentration of the urban population and the rapid development of small- and medium-sized processing industries also facilitated the expansion of urban space. At the same time, with the expansion of the urban population and the acceleration of economic growth, the modern urban outline has basically taken shape. However, in the absence of any protective measures to reduce emissions, individual workshop production with high energy consumption and pollution, as well as the combustion of low-quality, high-sulfur coal, directly led to huge amounts of TSP and SO2 emissions. Hence, the frequency of haze and acid rain pollution began to increase.

4.3. Accelerating Urbanization and Acid Rain Pollution Outbreak (1991~1999)

Under the pressure of performance appraisal and promotion, local governments endeavored to attract investment and to promote large-scale industrial development for the purpose of economic growth. With the further implementation of land system reform in 1987, industrial construction led by the rapid expansion of “economic development zone” has been legitimized, thus it is not surprising that a multitude of cities building up various sizes of economic development zones in turn became factors contributing to acid rain and SO2 outbreak. Therefore, from 1991 to 1999, China’s air pollution control mainly focused on watershed management and intensive law enforcement, in terms of acid rain and SO2 emission.

4.3.1. Land Urbanization Promotes Industrialization

Since the 1990s, urban spatial industrial agglomeration has been commonly observed, and this has directly promoted China’s industrialization process to become dominated by processing and manufacturing industries. The increase in industrial land area was the main factor in urban spatial expansion at that time. Moreover, the “urban planning law”, promulgated in 1989, proposed that urban planning needs to be rationally formulated to meet the demands of socialist modernization construction. The urban renewal period marked by “retreat from the second to the third” also resulted in a sea of traditional industrial bases located within cities moving to outer suburbs. Here, the secondary industry retreats from the urban area in order to develop the tertiary industry. “Retreat to the second” refers to the relocation, transformation or shutting down of industrial enterprises with heavy pollution, high energy consumption, and poor efficiency within and near inner ring roads. Later, adjusting the urban land structure, reducing the proportion of land used by industrial enterprises, and increasing the proportion of land used by the service industry were also called “retreat from the second to the third”. This tendency has not only left room for the development of tertiary industries, but also transferred the location of pollution sources. As a result, the area of urban construction land in China increased from 12,900 km2 to 20,900 km2 over the period 1991~1999.
The “extensive” spatial expansion method that constructed industrial parks in suburbs also led to the rapid evolution of urban spatial structure. Urban space began to manifest the characteristics of “multi-center” and “multi-axis”, especially the evolution of “multi-center” [39]. Conversely, this outward expansion in urban construction focuses too much on “scale and speed”, leading to the blind and disorderly expansion and construction of “vanity projects”. There were some limitations in the development of real estate, such as the excessive pursuit of high-end housing, large shopping malls and man-made scenic spots. The low efficiency of urban space utilization and the serious waste of idle land also led to a contradiction between agriculture and urban construction land uses. Therefore, even though the urban space area expanded, the population size did not accordingly increase. The population urbanization rate only increased from 26.37% in 1991 to 30.89% in 1999, with an average annual growth rate of less than 0.5%. The population density only increased from 302 people/km2 to 462 people/km2.

4.3.2. Accelerated Industrialization and Aggravated Coal-Smoke Pollution

Driven by land urbanization, the urban industrial structure was also improved; the proportion of heavy industry began to be significantly higher than that of light industry, and it became the core driving force of urban economic growth. However, due to the inefficiency of energy use, urban energy consumption increased sharply from 1.038 billion tons in 1991 to 1.455 billion tons in 1999, including coal consumption, with a sharp rise from 790 million tons to 992 million tons. During this period, urban air pollution control was in a stage of low investment, low technology, and slow project construction, thus the associated emission reduction effect was also insignificant, which in turn led to the expansion of air pollution from local to region levels. Coal-smoke and acid rain pollution began to erupt in an all-round way, and some cities even suffered from compound air pollution. Although the intensity of TSP and SO2 emissions declined, the overall level of emissions has continued to rise. In comparison, the only positive change in air pollution control is that dust was basically eliminated from the category of air pollutants, as the installation of dust-cleaning equipment is compulsory for heavily polluting enterprises. Additionally, the implementation of the “retreat from the second to the third” project also ensured a substantial reduction in industrial pollution sources within cities.
Even though urban dust emissions were controlled, traditional soot-type air pollution was still very serious. In particular, the acid rain area continued to expand and the frequency of occurrence increased rapidly. In 1995, SO2 emissions reached 9.04 million tons, ranking first in the world, and the issue of acid rain pollution became non-negligible, associated with a further development of the power industry. The generator capacity increased from 57.12 million kw in 1978 to nearly 300 million kw in 1999, and the proportion of thermal power units was up to 75%. However, it was not until 1991 that desulfurization units were installed in thermal power plants, and by the end of the 20th century, less than 1% of thermal power plants had installed desulfurization facilities [37]. Therefore, China began to attach great importance to acid rain and SO2 pollution. In 1996, the division plan for acid rain and SO2 pollution control areas (referred to as “two control areas”) was approved, covering a total area of about 1.09 million km2, involving 176 cities, and accounting for 11.4% of the land area in China [40]. The “two control zones” made strict regulations on the sulfur content limits for coal combustion, and implemented strict control of industrial pollution sources. The total emission control system also became one of the major measures to control air pollution. Since then, the intensity of acid rain pollution in China has begun to weaken.

4.3.3. Urban Infrastructure Improvement and Motor Vehicle Exhaust Emission

From 1991 to 1999, China’s land urbanization, to a large extent, promoted the urban economic development level. The economic improvement also promoted the continuous increase in investment in urban infrastructure construction, and resulted in a substantial increase in the consumption level of urban residents and the preference for high-end durable consumer goods. On the one hand, the improvement of urban transportation systems, such as subways, elevated highways and overpasses, has completely changed the spatial location of the populations and industries of a city, leading to the efficient use of land. On the other hand, some cities also began to adjust the structure of energy production for production and living, e.g., higher usage rates of natural gas, artificial coal or central heating. Over the period 1991~1999, the urban gas penetration rate increased from 23.7% to 43.8%, the usage amount of artificial gas increased from 12.58 km3 to 132.09 km3, and the consumption of liquefied petroleum gas increased from 2.244 million tons to 7.613 million tons. Large-scale central heating systems were also set up in urban areas, with a 3.5-fold growth from 276.51 km2 to 967.75 km2. These measures alleviated coal-smoke pollution and SO2 emissions to a certain extent, and improved the air quality.
As far as consumption goods are concerned, car ownership increased from 6.061 million in 1991 to 14.5294 million in 1999. However, the increase in exhaust emissions triggered by the soaring car ownership also raised widespread concern in society. Especially in the eastern cities with rapid economic growth, the substantial increase in car ownership prompted NOx to become one of the main air pollutants. Furthermore, PM10 and PM2.5 emissions have also risen rapidly [37]. Therefore, the former State Environmental Protection Administration put forward environmental protection requirements for automobiles and corresponding engine products. In 1995, the revised “Air Pollution Prevention and Control Law” proposed that the state should encourage and support the use of high-grade unleaded gasoline, and restrict the production and use of leaded gasoline.

4.3.4. Preventing the Overheating of the Urban Economy and the Drastic Drop in Pollution Emissions in 1997

However, as the major cities blindly expanded investment and kept up with the economic growth rate, the economic growth of China became overheated. GDP increased from CNY 2.20 trillion in 1991 to 6.13 trillion in 1995, and the total economic volume increased nearly three times in five years. Therefore, the Chinese government adopted a series of macro-control measures to adjust the industrial structure and support the investment of fixed assets in basic industries in 1996. At the same time, the reform of state-owned enterprises in 1997 also yielded many rewards. Many state-owned enterprises with excess capacity and low operating efficiency, as well as SMEs left over from the 1980s, were shut down and banned. In addition, when the global financial crisis broke out in 1997, China was faced with challenges such as insufficient demand, slowing economic growth, and deflation. Therefore, a series of macro-expansion policies were proposed to expand and change domestic demand. Changes in the demand structure eliminated and compressed excess capacity and accelerated the development of industries with high technology content and large market demand. Structural optimization had become a paramount trend of China’s industrial development. From 1996 to 1998, the urban industrial and domestic energy consumption only increased from 1.352 billion tons to 1.362 billion tons, and the coal consumption even decreased from 994 million tons to 965 million tons. With the popularization and improvement of clean coal utilization technology, all kinds of air pollutant emissions, for the first time, demonstrated a significant downward trend, especially for TSP and SO2 emissions.
The period over 1991~1999 was the most prominent 9 years of urbanization in China since the R&O. Urbanization shifted from the “step by step” approach in the 1980s to the “big step” seen in the 1990s. Land urbanization accelerated the process of industrialization and provided necessary guarantees for its development, which directly prompted the major cities to quickly establish a better and more modern industrial system and join the global industrial value chain. However, the subsequent sharp increase in energy consumption and backward governance technology again led to high-intensity, large-scale and sustained acid rain pollution.

4.4. The “Golden Period” of Urbanization and the Full Outbreak of Air Pollution (2000~2012)

Since entering the 21st century, as the reform of market economy systems continues to deepen, the agglomeration and radiation-driven role of China’s large cities has attracted unprecedented attention, and governments at all levels have realized the necessity and urgency of the transformation of urbanization path, then determined the path of “coordinated development of large, medium and small cities”. The size of cities has been changed from “strict control” to “prevention of blind expansion”, the constraints on the development of large cities have been gradually removed, and the status of the market economy system has become increasingly vital. With a further relaxation of China’s urban household registration system, the siphoning effect of cities on rural populations and large cities on small cities increased dramatically, indicating that China’s socio-economic development has truly entered the era of urbanization. From 2000 to 2012, the population urbanization rate increased from 36.22% to 52.57%, with an average annual growth rate of 1.67%, and the proportion of urban population began to be higher than that in rural areas. This is the period during urban expansion increased at the highest rate since the founding of P.R. China. Accordingly, the number of large cities with a population of 2 to 4 million increased from 12 to 31, the number of megacities with a population of over 4 million increased from 8 to 14, and the urban population density increased from 442 to 2307 people/km2. During this period, the problem of air pollution in China’s cities attracted the most attention from all areas, and the government began to consciously optimize the growth structure. The total SO2 emissions were mitigated, but paradoxically, NOx and PM pollution became more and more prominent.

4.4.1. The Establishment of a Modern Industrial System and the Full-Scale Outbreak of Acid Rain Pollution

After 2000, the modern industrial system had basically been established in China, and tertiary industries such as the service industry developed rapidly. Unlike the 1990s, investments began to be oriented toward capital and technology-intensive industries. This optimized the urban industrial structure to a certain degree, besides which high-pollution and high-energy-consuming enterprises began to be phased out. However, in 2000, widespread high-intensity dust storms swept across China, and as urbanization entered its “golden period”, SO2 emissions overtook TSP, becoming the most significant pollutant, and air pollution emissions, which had been declining at the end of the 1990s, began to show a rapid growth trend. In 2002, China’s urban SO2 emissions were 22 times higher than Japan’s [37], and urban SO2 emissions peaked in 2006 with emissions increasing to 11.83 million tons, an increase of 29.8% over 2000. About 1/3 of the country’s cities went through acid rain pollution, the severity of which was comparable to that in the 1980s in central Europe. Moreover, the expansion of the overall industrial scale has led to a rapid increase in total energy consumption, from 1.455 billion tons in 2000 to 4.021 billion tons in 2012, with an average annual growth rate almost 3 times more than that from the period 1980~1990. Although China started to control SO2 emissions in the “two control zones” in 1996, many new thermal power plants built afterwards were located outside this restricted area. Moreover, a host of coal-fired power plants were put into operation after 2000, but only 2% of them were installed with desulfurization facilities in 2001, and even 4 years later, this figure was still only 12% [37].
In addressing these issues, China issued a catalog of eight heavily polluting industries over the period 2001~2004. Accordingly, more than 30,000 seriously polluting enterprises were shut down [41]. Moreover, as China’s installed thermal power generation capacity continued to grow rapidly, the air pollution emission standards for thermal power generation in China were becoming increasingly stringent. In 2011, the former MEP of China required coal-fired power plants to not only desulfurize but also denitrify flue gas, and set more stringent emission limits for key cities. The arrival of the 2008 Olympic Games was also a great opportunity for the central government to set up stricter regulations to control air pollution. As a result, urban SO2 emissions in China decreased by 4.66% in 2007 compared to those in 2006, and continued to decline after 2008. Compared with 2008, in 2012, the number of acid rain cities decreased by 37, the areas where the annual average precipitation pH was lower than 5.6 dropped by 7.3%, and the area wherein acid rain was occurring decreased by 0.3% [42].

4.4.2. Greenhouse Gas (GHG) Emission Reduction and Energy Structure Optimization

The rapid expansion of industry, the rise in installed thermal power capacity and the continued increase in ferrous energy consumption have led to a rapid increase in China’s CO2 emissions, which were essentially equal to TSP and SO2 emissions in 2008, and surpassed TSP as China’s highest-emitting air pollutant in 2010. In 2011, China even surpassed the US to become the world’s largest emitter of CO2 emissions [43]. Facing the huge pressure of emission reduction, China ratified and signed the “Kyoto Protocol” in 2002, and formulated the “China’s National Program to Address Climate Change” in 2007. Likewise, at the Copenhagen Climate Change Conference in 2009, China announced the ambitious goal of reducing carbon intensity by 40~45% in 2020 compared with 2005.
As a result, all major cities in China have begun to include energy consumption per unit of GDP as a binding indicator in economic development plans, accelerating reductions in the proportion of black energy and vigorously developing clean energy sources such as natural gas. For instance, from 2000 to 2012, the proportion of coal consumption in China decreased from 69.2% to 66.6%, the proportion of crude oil consumption decreased from 22% to 17%, and the proportion of clean energy such as natural gas increased from 9.5% to 14.5%. The trend of using cleaner energy for urban residents also became increasingly obvious, achieving progress and transformation from traditional biomass energy combustion to primary fossil energy combustion such as coal, and then from artificial gas to natural gas after the R&O. Among them, the use of artificial gas soared from 152.36 km3 in 2000 to 396.45 km3 in 2006, and then dropped to 7.70 km3 in 2012; liquefied petroleum gas consumption also declined to 11.148 million tons after increasing from 10.5371 million tons in 2000 to 13.403 million tons in 2009. The main reason for the decrease in fuel consumption of both gases is that China has continued to promote the “West–East Gas Transmission” project to improve urban air quality and reduce GHG emissions, and natural gas began to enter the lives of ordinary urban residents. Although natural gas consumption is relatively low in both quantity and proportion, it showing a continuous growth trend, with total consumption increasing from 8.21 km3 in 2000 to 79.50 km3 in 2012, a rise of nearly 10 times.

4.4.3. Soaring Consumption of Housing and Automobiles and the Prominence of Haze Pollution

The improvement of the modern industrial system and the continuous expansion of the scale also directly contributed to the rapid growth in the level of economic development and income of residents. From 2000 to 2012, China’s total GDP grew from CNY 10.03 trillion to 53.86 trillion, with an average annual growth rate of 10.12%. Per capita GDP increased from CNY 7942 to 39,874, and urban per capita disposable income increased from CNY 6280 to 24,564.72. The total economic volume and per capital income level both expanded by nearly 4~5 times, and residents’ consumption ability was greatly enhanced.
In 2009, China became the world’s largest producer and seller of automobiles for the first time, and the number of civilian automobiles increased 56 times compared to that in the beginning of R&O. In 2012, car ownership increased from 16.09 million to 12.089 million. However, the speed of urban road infrastructure construction has not kept pace with the car ownership surge. The length of urban roads only increased from 159,600 km to 327,100 km, the road space increased from 2378.49 km2 to 6074.49 km2, and the road space per capita increased from 6.13 m2/person to 14.39 m2/person, resulting in a significant increase in road traffic congestion in cities, and a continuous rise in air pollution caused by vehicle emissions. In 2009, quite a few cities even had more than 200 days of haze in a year, caused by NOx and PM emissions from automobile exhaust. At this stage, the impacts of vehicle emissions on urban air pollution surpassed those of industry to become the first major source of pollution, and urban air pollution changed from “soot-type” pollution to a “composite” pollution of soot and vehicle exhaust, which greatly increased the difficulty of urban air pollution management. Therefore, China began to put vehicle exhaust pollution control on the agenda and kept pushing to upgrade vehicle pollutant emission standards until they could be benchmarked with developed countries. To relieve the pressure of urban traffic and automobile emissions, the construction of urban public transportation infrastructure was also rapidly enhanced. For instance, the provision of public transit facilities was purposely increased, with the number of buses owned per 10,000 people growing from 5.3 to 12.15, and also more and more cities started to build rail transit system.
With the increase in urban population size and housing demand, the functional attributes of urban living were strengthened, and urban greening construction soared. Over the period 2000~2012, the area of urban housing land increased from 1516.9 km2 to 10,617.2 km2, an increase of nearly 7 times, and the proportion of urban built-up area also increased from 6.86% to 23.21%. Similarly, the per capita public green area rose from 3.69 m2/person to 12.26 m2/person, with an increase of 3.3 times, and the green coverage rate rose from 28.15% to 39.6%, with an average annual increase of 0.88%. Due to the excessive heat and speed of urbanization during this period, urban construction lacked scientific long-term planning or urban construction, and did not strictly follow the urban planning scheme. Thus, urban construction was in a chaotic and disorderly state of “big demolition and big construction” for a long time. On the one hand, this led to an increase in urban TSP and PM10 emissions and an increase in the occurrence of hazy weather. On the other hand, the high-intensity construction of houses and infrastructure also led to the expansion of high-energy, high-polluting basic raw material supply industries, such as iron and steel, cement and aluminum production [44].
Unlike the increasing acid rain pollution caused by coal combustion, the soaring consumption of two high-grade durable goods, houses and cars, led to the emergence of haze pollution at regional levels, which was mainly caused by the significant rise in NOx, PM2.5 and PM10 emissions from motor vehicle exhausts and house construction dust. The rising TSP emissions in Chinese cities simultaneously led to PM10 and PM2.5 emissions of up to 5.26 million tons and 3.21 million tons in 2011, respectively. As early as 2000, China’s second revision of the Air Pollution Prevention and Control Law defined that a local government is the main body responsible for air pollution in its jurisdiction. Driven by performance assessments, the investment in urban environmental infrastructure has increased from CNY 51.55 billion to 506.265 billion, with a rise of nearly 10 times within 13 years. Particularly, the completed investment in urban treatment of exhaust gas rose from CNY 9.1 billion to 25.77 billion, and the total investment in industrial pollution treatment rose from CNY 23.48 billion to 50.045 billion [45]. Since 2006, China has also centralized heating in the suburbs of northern cities and begun conducting dust removal measures, such as using high-efficiency dust removal technologies, phasing out small- and medium-sized generating units, and encouraging ultra-low emissions from coal-fired power plants, in addition to subsidies to gradually renovating and terminating coal-fired boilers, old motor vehicles, taxis, and yellow-label vehicles within urban areas. Installing new coal-fired power plants was also strictly controlled within cities and suburban areas.

4.4.4. The Early Stage of Coordinating Urbanization and Haze Pollution Control

With the development of rapid transportation and modern communication technology, the increasing inter-city industrial linkages and the establishment of industrial chains have led to the prominence of industry clustering. As a result, urban agglomeration and metropolitan area planning were put on the agenda, and the regionalization of cities and the urbanization of regions became one of the most important features of urbanization at this stage.
However, the spillover effect of haze pollution has led to its spread within urban agglomerations; simultaneously, the vigorous development of urban agglomerations and metropolitan areas has exacerbated such an effect. In this context, pollution control measures carried out by any single city alone will no longer be effective. They must be a joint effort of multiple sectors and regions to achieve significant reductions in a variety of pollutants. Therefore, China’s urban air pollution control urgently needs to move towards the era of “joint prevention and control” (JPC). In 2010, the State Council required the establishment of JPC mechanisms for air pollution by 2015. The JPC mechanisms with city clusters as the main body began to become the main mode of air pollution governance. In 2012, the MEP officially divided the 13 key regions into three types, including “complex pollution severe”, “complex pollution visible” and “traditional soot”. In addition to SO2 pollution control, the NOx treatment project, official PM2.5 concentration limits, VOCs concentration limits and O3 8-h average concentration limits were also incorporated into the prevention and control system. Therefore, the goal of air pollution control in China, for the first time, is inclined towards coordinating the total amount of pollution and environmental quality improvement, focusing on a variety of pollution sources, a variety of pollutants and multiple cities.
In summary, the period over 2000~2012 was the “golden period” of China’s urbanization. The population scale of cities continued to expand, the modern industrial system was basically established and infrastructure construction was also improved. However, the air pollution problems that emerged in different stages during the urbanization and industrialization process in developed countries in the last hundred years were also concentrated in this period, showing that urbanization began to enter a period of multi-source air pollution that is in fact contradictory to the aim and scope of urbanization. The root cause of the serious air pollution problem lies in the unbalanced and insufficient naure of urbanization, that is, the achievements made in urban construction covered up the seriousness and urgency of the air pollution problem while ignoring the people’s urgent need for a better living environment after solving their material and cultural needs. The ineffectiveness of the previous “treating the symptoms” air pollution control measures has directly forced the end of urban growthism in China. In 2012, China proposed taking a “new urbanization path that is people-oriented, with an equal emphasis on scale and quality”, which states that, henceforth, China’s urbanization will embark on the road of “from quantity to quality” transformation.

4.5. The Adjustment of Urbanization Model and Entering the Crucial Period of Air Pollution Control (2013~2023)

After more than 30 years of repeated sulfur pollution control since the 1980s, SO2 emissions and concentrations in Chinese cities declined significantly after 2013, and acid rain pollution was largely resolved in 2015. However, haze pollution broke out in full force in 2013. More than 100 cities in more than 20 provinces have experienced different levels of haze pollution. Only 3 of the 74 key air pollution monitoring cities meet the PM2.5 concentration limit, and the haze pollution days in BTH, YRD and PRD account for more than 1/3 of the year, affecting more than 600 million people [45]. In response, the State Council issued the “Action Plan for the Prevention and Control of Air Pollution” (also known as “Atmospheric Ten”), which proposed 10 articles and 35 air pollution control measures. The objectives, targets, and modes of air pollution governance in China have undergone a major shift, and the issue of air pollution governance has been elevated to a national strategic level. Especially after entering the 13th Five-Year Plan, China stepped into the stage of air pollution control from “total pollutant control” to “air quality improvement”, and focused on the implementation of an inter-city air pollution JPC mechanism, which signifies that China’s urban air pollution control was being gradually coordinated with the adjustment of its urbanization model.

4.5.1. The Guiding Ideology of “People-Oriented” and the All-Round Structural Adjustment of Urbanization

The major conferences on urban development after 2013 basically conveyed one central idea—that the future development of China’s cities will begin to take the road of “slowing down the growth rate, digesting the stock, resolving conflicts and focusing on quality improvement”. As a result, the overall number of Chinese cities grew minimally between 2013 and 2023, but the number of large cities and mega-cities grew rapidly, further increasing the population-siphoning capacity. The number of cities with more than 4 million people increased from 14 to 23, and the number of cities with 2 to 4 million people increased from 33 to 49. By the end of 2023, China’s population urbanization rate reached 66.1%, which can be defined as the second turning point of the “Northam S-curve”—an urbanization rate of 60%. Compared to the previous “golden period”, the growth rate of urbanization and population density were slowed down.
At the same time, the economic structure was also improving, with the proportion of tertiary industries such as services rising from 46.88% to 52.07%, while the proportion of industrial output declined from 35.23% to 34.10%. The city’s economic growth drivers began to emphasize the shift from factor- and investment-driven to innovation-driven, leveraging the painful period of economic growth to achieve a major shift in the economic development model. However, industries, especially those with high energy consumption and pollution, still occupied an absolute scale in the economic structure, and the transformation of the urban economic growth model still needs them as support to achieve a smooth transition. Therefore, for quite some time in the future, the reality of high-energy-consuming and high-polluting industries supporting the medium-to-high growth of urban economies will remain a difficult issue to resolve.
Although high-polluting, energy-intensive industries still account for a significant proportion of the size of the urban economy, China pledged to the world at the 2015 Paris Climate Change Conference to achieve peak carbon emissions by 2030. Therefore, driven by the double pressure of carbon emission reduction and air pollution control, China’s energy production and consumption intensity have been decreasing, and the trend of structural cleanliness is becoming more and more obvious. From 2013 to 2023, on the one hand, China’s total energy consumption fell from 4.17 billion tons to 5.72 billion tons, an average annual increase of only 3.37%, while the average annual increase during the “golden period” reached 13.56%. On the other hand, the amount and proportion of black energy consumption also began to show a downward trend. Among them, the total coal consumption increased from 2.751 billion tons to 3.146 billion tons, while the average annual growth rate of the “golden period” was 12.76%, and the proportion of total energy consumption dropped from 66% to 55%, while the proportion of crude oil consumption only rose from 17.1% in 2013 to 19.0% in 2019. In addition, the proportion of natural gas and other clean energy consumption also increased significantly, from 15.5% to 23.3%, gradually reversing the pattern of energy consumption dominated by coal. Although both the total amount and proportion of coal consumption showed a downward trend, the scale of coal consumption still cannot be ignored. China’s total coal consumption in 2013 was 6.9 times higher than that of 1978 and 2.9 times higher than that of 1998. As one of the major sources of air pollution, most notably being the “culprit” of acid rain pollution, China introduced the most stringent emission standards ever for coal-fired power generation, stricter than those of developed countries such as the US in 2014.
As China’s urban economic growth no longer emphasizes absolute speed and the concept of “people-oriented” development has become the guiding ideology of urban planning and construction, urban infrastructure construction began to rapidly improve in the direction of modernization, the most prominent example of which is urban rail transit construction. However, the growth rate of civilian car ownership did not slow down; car ownership increased from 12.67 million units in 2013 to 31.18 million units in 2023, and the increase in just 11 years is comparable to the increase in the last phase of the previous 13 years. Chinese cities have begun to adopt measures such as license plate controls or traffic restrictions to reduce car use, for reasons such as relieving traffic pressure and combating air pollution. At the same time, investment in air pollution control was enhanced, with a total investment in environmental pollution infrastructure growing from CNY 522.299 billion to 608.575 billion, but this cannot alleviate the contradiction between urbanization and air pollution, which remains at the stage of repaying the historical “debt”.

4.5.2. Structural Adjustment of Urbanization and Effectiveness of Air Pollution Control

With the gradual adjustment of China’s urbanization pattern and increasing air pollution control, air pollutant emissions such as SO2, NOx and PM began to decline after 2014. In 2023, China’s urban PM2.5, PM10, SO2, CO and NO2 concentrations decreased by 58%, 55%, 78%, 60% and 50%, respectively, compared to those of 2013. Moreover, the carbon emission intensity in 2018 was reduced by 45.8% compared to that of 2005, fulfilling the goal of reducing carbon emission intensity by 40~45% in 2020 ahead of schedule, which has also laid a solid foundation for achieving carbon emission peak in 2030. However, although air pollution concentration and carbon emission intensity have decreased significantly, PM2.5 concentration in most cities in autumn and winter and carbon emissions continued to rise. The total cost of implementation of the “Atmospheric Ten” is CNY 1.6511 trillion. The benefits of air quality improvement were determined to be CNY 2.4691 trillion. The net benefit related to the implementation of the “Atmospheric Ten” was CNY 818 billion. The public health benefit of air quality improvement was 1.5 times the cost of the nationwide implementation of the “Atmospheric Ten” [46].
Despite the remarkable results of urban air pollution control in China, O3, NOx and VOCs pollution in some large and medium-sized cities have shown an increasing trend of aggravation, and have become important pollutants affecting the improvement of urban air quality [47]. On the one hand, the decline in NOx concentrations has been relatively small, mainly due to the rapid increase in residential vehicle consumption owing to the rising living standards of the population. Therefore, in the future transformation process of China’s urbanization, there is a need for air pollution control to focus on cultivating the environmental awareness of urban residents, so as to realize the urbanization of population quality. On the other hand, in recent years, as PM concentration decreased while O3 concentration increased, the percentage of days exceeding the standard increased from 4.6% in 2015 to 40.1% in 2023 [48], which indicates that relying only on single or certain air pollutant emission reduction can no longer meet the requirements of urban air pollution management, and in the future, urban air pollution management in China needs to not only aspire to cross-regional synergistic management, but also to further promote the synergistic management approach among different air pollutants.
After 2013, China’s urban economy is in transition from high- to medium-speed growth, and spatial planning has begun to emphasize “stock” and “reduction” planning, with the improvement of human living environment and vitality as the core. Urban infrastructure was built in the direction of modernization and intelligence, the population was encouraged to gather in big cities and mega-cities, and urbanization changed from “pursuit of speed” to “pursuit of quality”. However, air pollution has not been completely managed by the change in urbanization patterns. At the same time, the development of urban agglomerations has become the key mode of urbanization in recent years, which means that economic flows of greater scale and intensity are rapidly accumulating within the effective spatial scale, and urban agglomerations face higher risks and pressures of air pollution spillover internally, forcing the JPC mechanism to become the mainstream mode of air pollution management in Chinese cities. With changing meteorological conditions caused by the increasingly serious issue of global warming, reductions in one or several air pollution emissions such as PM have led to the aggravation of other air pollution forms, such as O3. The drawbacks of the lack of synergy in urban air pollution control measures are becoming increasingly apparent. In the face of urban air pollution, which is characterized by “compression, superposition, compounding and coupling”, how to completely change the future urbanization path to achieve air pollution control and high-quality economic growth has become a major issue for in-depth consideration by the Chinese government.

5. Discussion: The Interactive Features between Urbanization and Air Pollution Control in the Past 75 Years in China

Since the founding of P.R. China, urban development has been plagued by “urbanization lags behind industrialization”, “infrastructure development lags behind air pollution control”, and “old pollution problems remain unsolved while new pollution problems keep emerging”. The main factor causing urban air pollution to arise, change and keep intensifying is evidently related to the process of rapid and disorderly urbanization, particularly in the last 40 years since the R&O. Rapid urban socio-economic development has led to massive coal consumption, with the proportion of coal in primary energy production and consumption reaching over 70% for a long time. On the other hand, China’s urbanization has long been focused on “construction over governance”, “economy over ecology”, and “immediate interests over long-term interests”, and urban planning and construction are often driven by short-term interests and lack foresight and implementation. The governance method is mainly “empirical”, “campaign”, “problematic” and “surprise” governance, lacking modern management means and long-term effectiveness of the governance mechanism. Nevertheless, the continuous optimization of urban industrial structure, successive adjustments in spatial layout, and the continuous increase in the intensity of environmental regulations have already reduced the possibility that Chinese cities suffer from the vicious air pollution disasters. Even though the issues of urban air pollution in China still exist, the emissions and concentrations of major air pollutants have dropped significantly, soot-type air pollution and acid rain pollution have been basically solved, the intensity of GHG emissions has been controlled, and photochemical smog has been eliminated in some cities. Therefore, it is believed that the overall air quality has started to show an improving trend.
Figure 1 shows the interaction characteristics of air pollution and urbanization in four stages in the past 75 years in China. Considering all the above features, the interaction between urbanization and air pollution is characterized by four stages. Among them, between 1949 and 1978, China’s urban air pollution was in the “low pollution without control” stage. The low intensity of urbanization led to only a little soot pollution caused by dust and TSP emissions in some cities. The type, intensity and scope of pollutants were relatively low, and the guiding concept of the socialist industrialization of cities led to almost no control measures in this period, thus urbanization and air pollution were basically in a “mutually exclusive” stage. Between 1979 and 1990, China’s urban air pollution was at the stage of “pollution before treatment”. Urbanization began to be on track, leading to the emergence of processing- and manufacturing-oriented SMEs, while the burning of large amounts of high-sulfur coal and the misalignment of treatment measures caused widespread acid rain pollution, and urbanization began to influence air pollution. Between 1991 and 1999, China’s urban air pollution was still in the stage of “pollution before treatment”. Urbanization began to accelerate, which in turn accelerated the industrialization process. During this period, SO2 emissions led to the full outbreak of acid rain pollution, and related management measures can only, to a certain extent, alleviate pollution, but not achieve pollution governance and prevention. However, the degree of impact of urbanization on air pollution increased significantly. Between 2000 and 2012, China’s urban air pollution entered a phase of “control while polluting”. Urban growthism promoted the free flow of population and urbanization in all aspects, and although the intensity of air pollution control increased, the construction of a governance system lagged behind the urbanization. Given the lack of proactive institutional design and urbanization response programs, the situation was only “when pollution appears and then when to govern”. As a result, air pollution is characterized by “high intensity, large scale and persistence”. Diversified sources of pollutants, multiple pollutant emissions exceeding the standards, and the contradictions between urbanization and air pollution reached an irreconcilable stage. Over the period 2013–2023, urban air pollution in China entered a new phase of “pollution control and prevention”. In this period, the long-accumulated air pollution problems led to the full outbreak of haze pollution, and air pollution showed “compression, superposition, compound and coupling” characteristics. Then, the government not only introduced various measures to achieve haze pollution control, but also began to promulgate various measures to prevent other air pollution problems, so as to further improve the quality of the air environment. Thus, urban air pollution management began to transition from the “governance” to the “prevention” stage, and air pollution started to influence the process of urbanization. In brief, urbanization and air pollution entered a new stage of “interactive coupling”.
In general, the interaction between urbanization and air pollution appeared to be at the stage of “urbanization affects air pollution” most of the time before 2013. After 2013, air pollution started to influence urbanization, and urbanization and air pollution in China entered a new stage of “interactive coupling”. However, the transformation of the urbanization model is a gradual and slow process, which cannot be achieved overnight. It needs to be adjusted slowly under the premise of ensuring certain growth targets, so as not to lead to big ups and downs of economic growth and to ensure a smooth transition of social and economic development. It should be noted here that China’s air pollution control approach is very different from the thinking of European countries. European countries basically rely on energy substitution, total reduction control and other governance strategies to control air pollution after realizing modernization. Therefore, compared with European countries, China’s air pollution control experience is of more reference significance for the vast number of developing countries that are undergoing urbanization.

6. Conclusions and Implications

In the past 75 years, the contradiction between air pollution and urbanization has been very acute in China. This paper excavated and analyzed relevant data and policy texts on urbanization, air pollution and its governance processes since the founding of China 75 years ago. The findings reveal that:
(1)
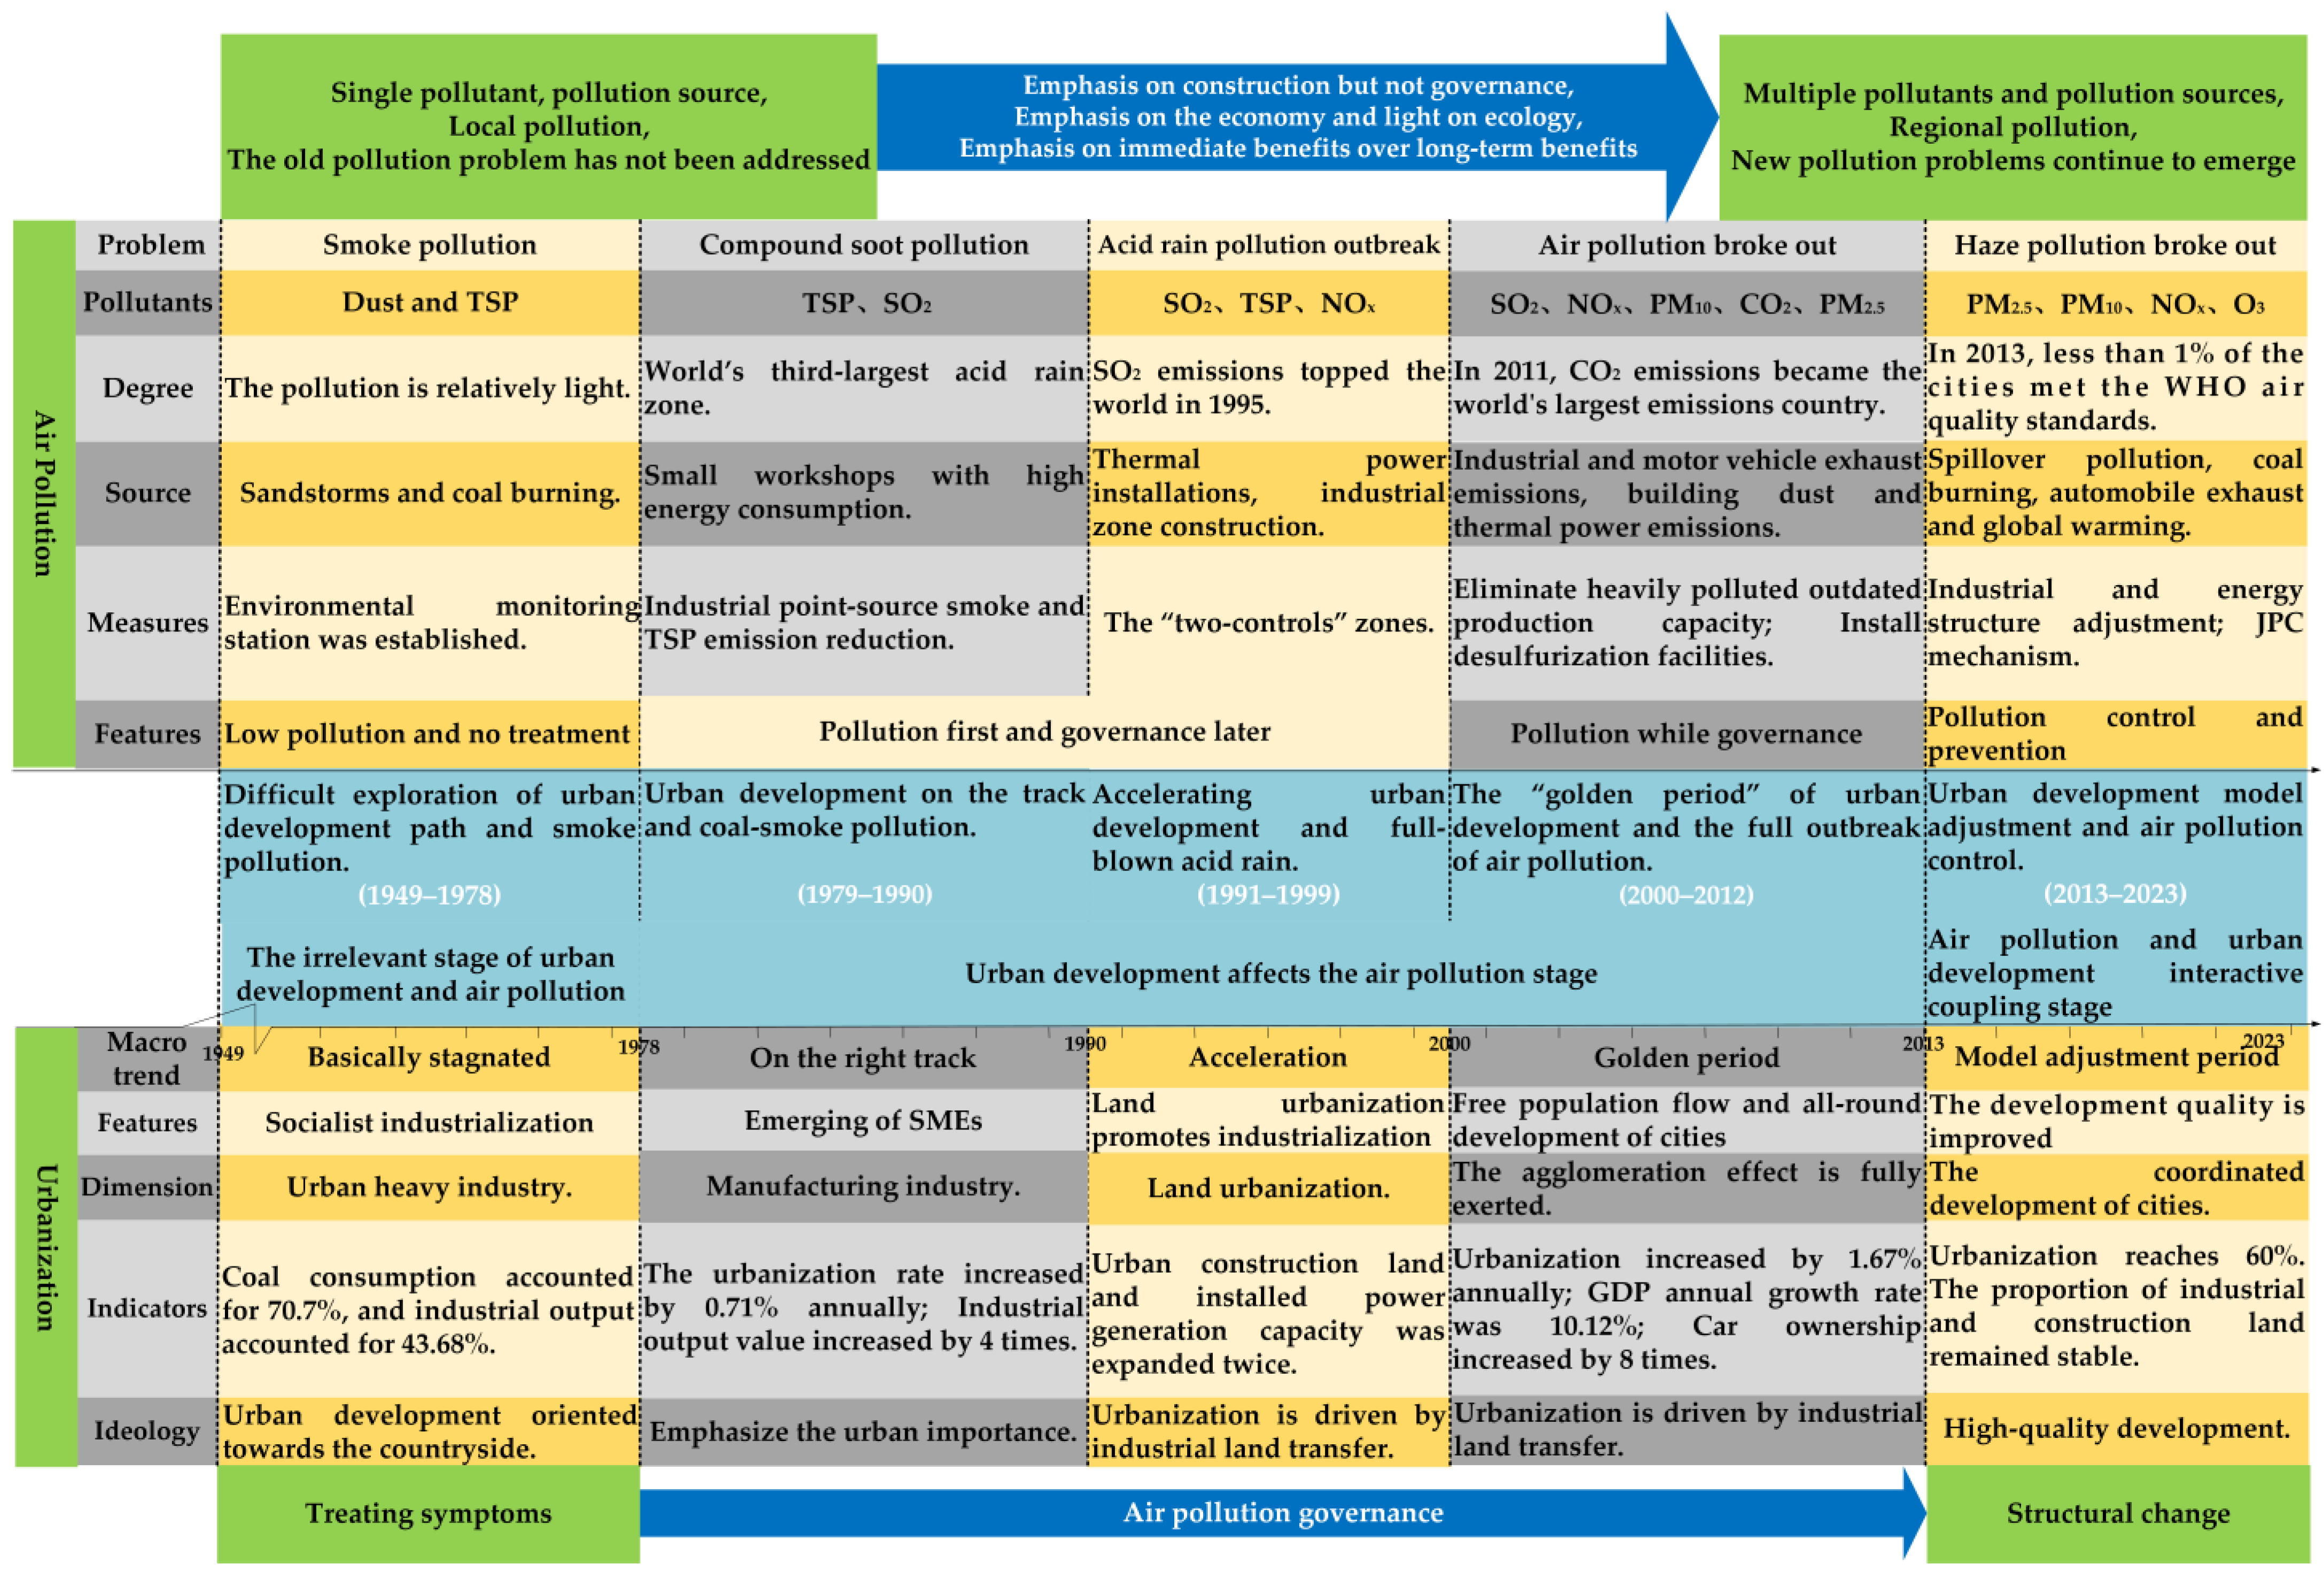
The notable features of air pollution are discussed in association with the vigorous process of urbanization in China, which can be further divided into five stages including “hard exploration of urbanization path relative to smog dust pollution” (1949~1978), “urbanization on track with compound coal combustion pollution” (1979~1990), “accelerated urbanization with acid rain pollution outbreak” (1991~1999), “the golden period of urbanization in the full-scale explosion of air pollution” (2000~2012) and “synchronizing urbanization model adjustment and air pollution control” (2013~2023);
(2)
Among them, the first stage belongs to “low pollution without treatment”, where urbanization and air pollution are basically irrelevant to each other. The second to third stages belong to “pollution first and then treatment”, the fourth stage belongs to “pollution while treatment”, and the fifth stage belongs to “pollution control and prevention”. Air pollution drove urbanization to adjust, and urbanization and air pollution entered into an interactive coupling phase;
(3)
Due to a series of problems in China’s urbanization process, such as “urbanization lags behind industrialization”, “infrastructure construction lags behind air pollution control”, “emphasis on construction rather than governance, economy rather than ecology”, and “immediate benefits rather than long-term benefits”, air pollution has shown the characteristics of “from single-pollutant pollution sources to various-pollutant pollution sources”, “local pollution to regional pollution change”, “light pollution to heavy composite pollution change” and “old pollution problems have not been solved while new pollution problems continue to appear”;
(4)
As the contradiction between urbanization and air pollution becomes more and more irreconcilable, China’s urban air pollution governance approach began to transition from the previous “treating the symptoms” to “structural adjustment of urbanization and high-quality urbanization”, and entered into the new stage of “urbanization model adjustment and air pollution governance unification”.
At present, China’s urbanization adjustment and air pollution control approach has entered a “deep water” area, and needs to promote the unification of high-quality urbanization and air pollution control at both theoretical and practical levels.
(1)
At the theoretical level, academics need to further clarify whether air pollution is a “stage” or a “structural” problem in the process of urbanization; that is, according to the environmental Kuznets curve theory, whether air pollution is a stage product of urbanization and whether air pollution will be cured when urbanization crosses a certain threshold, or whether air pollution is caused by a specific urbanization structure. If the problem of a specific urbanization structure cannot be fully solved, an air pollution problem will still accompany the whole process of urbanization, which is an important theoretical basis for China and other developing countries to correctly view the relationship between urbanization and air pollution governance and to formulate governance measures in the future.
(2)
Moreover, regardless of whether air pollution is a phase or structural problem of urbanization, in the process of adjusting the model of high-quality urbanization in the future, academics need to further clarify how to optimally adjust the dozens of indicators of urbanization in the demographic, industrial, spatial and social development dimensions in order to ensure the achievement of economic growth goals, while ensuring that air pollution is controlled within a certain range, and trying to propose multiple scenarios for achieving multiple goals (e.g., air pollution control goals, economic growth goals, etc.). This is an imperative for China and other developing countries to achieve the “triple win” of urbanization, air pollution control and economic growth.
(3)
In addition, from the perspective of government policymaking, the government needs to further introduce various preventive legal policy documents to prevent potential air pollution problems such as O3, VOCs (Volatile Organic Compounds) and CO during the transition phase of urbanization pattern adjustment in the future. Based on the experience of air pollution collaborative governance in urban clusters, how to promulgate relevant documents to promote the collaborative governance of various types of air pollution will be a major practical issue that China needs to deeply think about in the name of achieving its air pollution governance efforts, and the goals of carbon emission peaking by 2030 and carbon neutrality by 2060. This requires joint efforts of academia and governmental departments, combining theory and practical decisions so as to truly achieve the thorough governance of air pollution in the process of high-quality urbanization.
The limitation of this study is that it only sorts out the interaction features between China’s urbanization and air pollution in the past 75 years from the “feature facts” level, but fails to verify their relationship from the level of “mathematical models”. Therefore, we will also consider building a rigorous mathematical model to further demonstrate the interaction between urbanization and air pollution in China. At the same time, the interaction mechanism between air pollution and urbanization is an interdisciplinary frontier issue. Limited by the academic background of the authors, it is necessary to cooperate with scholars in the fields of environmental science, urban planning and public policy to conduct more in-depth research on this issue in the future.

Author Contributions

The individual contributions of authors to this work are listed as follows: Z.L., writing—review and editing, design of the work; K.Z., writing—review and editing, design of the work; X.Y., writing—review and editing, conceptualization, funding support; Y.Z., writing—review and editing; L.Y., writing—review and editing; H.G., writing—review and editing. All authors have read and agreed to the published version of the manuscript.

Funding

This work was funded by the National Social Science Foundation of China, grant number 23CTJ008; National Statistical Science Foundation of China, grant number 2023LY029; The National Planned Projects for Postdoctoral Research Funds, grant number GZB20230583; The Shaanxi Soft Science Foundation Project (2024ZC-YBXM-030); The Shaanxi Planned Projects for Postdoctoral Research Funds (2023BSHEDZZ92).

Institutional Review Board Statement

Not applicable.

Informed Consent Statement

Not applicable.

Data Availability Statement

The datasets used and/or analyzed during the current study are available from the corresponding author on reasonable request. The data are not publicly available due to Economic costs of data collection.

Conflicts of Interest

The authors declare that they have no competing interests.

Appendix A. The List of Air Pollution and Urbanization Indicators

DimensionsIndicatorsConnotationUnitTime IntervalData Source
Air pollutionCO2One of the main components of GHG, the data over the period 1960–1964 are from PKU data, and the data over the period 1965–2019 are calculated by BP.million tons1960~2023PKU Series Emission Inventory (PKU),
Wind database
COPollutants emitted by inadequate combustion of fossil fuels and car exhausts.ten thousand tons, μg/m31960~2012,
2013~2023
PKU,
China Environmental Monitoring Station (CEMS)
PM2.5The main components of haze pollution, and the main source is industrial production.
PM10The main component of haze pollution, and the main sources are sand and dust.
SO2The main component of acid rain, and the main source is the combustion of high-sulfur coal.
NOx
(NO2)
The main components of acid rain and photochemical smog, and the main sources are automobile exhaust and industrial production.
TSPThe sum of all types of particulate matter suspended in the air.ten thousand tons1960~2012
O3Harmful to human respiratory system, the source is automobile exhausts and chemical reaction.μg/m32013~2023CEMS
Population
Development
City sizeThe number of prefecture-level citiesThe number of prefecture-level and above cities in China including prefecture-level cities, provincial capitals, and municipalities directly under the central government.units1949~2023Compilation of Statistical Data for 60 Years of China,
China Statistical Yearbook,
China City Statistical Yearbook
Population of more than 2 million (in 1986, the caliber of urban population statistics changed, from registered population to non-agricultural population)The number of cities with a population of more than 2 million, which was the threshold defining mega-cities before 2000.1953~1999
Population of more than 4 million (in 2000, the caliber of urban population statistics changed again, from non-agricultural population to permanent resident population)The number of cities with a population of more than 4 million, which is the threshold defining mega-cities after 2000.2000~2023
Population of 2 to 4 millionThe number of cities with a population of more than 2 million to 4 million, which is the threshold defining mega-cities after 2000.
Population of 1 to 2 millionThe number of cities with a population of 1 million to 2 million. Before 2000, it was the threshold for mega-cities, and it was the threshold for large cities after 2000.1953~2023
Population under 1 millionThe number of cities with a population of less than 1 million, including all small- and medium-sized cities.
Population sizeUrban populationTotal population within a city.ten million people1949~2023
Urban population density The number of residents within unit area of urban area.people/km21981~2023
Population urbanizationThe urbanization rate of registered population, which is estimated by urban registered population divided by total population.%1949~2023
Urbanization growth rate The rate of increase in urbanization compared to that of previous year.%1950~2023
Economic developmentEconomic GrowthGDPCity GDP.CNY billion 1952~2023
GDP per capitaCity GDP per capitaCNY
Industrial valueUrban industrial value.CNY billion yuan
Proportion of industrial valueThe proportion of industrial value in the city’s GDP.%
Tertiary industry output valueGDP of the city’s tertiary industry.CNY billion
Proportion of tertiary industry output valueThe proportion of the tertiary industry’s GDP in a city’s GDP.%
Disposable income per capitaUrban disposable income per capita.CNY1978~2023
Energy consumptionTotal energy consumptionThe total consumption of various types of energy in a city is equivalent to standard coal consumption.ten thousand tons1953~2023
Coal consumption ratioCoal consumption as a proportion of total energy consumption.%
Crude oil consumption ratioCrude oil consumption as a proportion of total energy consumption.%
Natural gas consumption ratioThe proportion of natural gas consumption in total energy consumption.%
Other energy consumption ratioThe proportion of water and nuclear energy consumption in total energy consumption.%
Space developmentUrban built-up areaTotal area of urban built-up area.ten thousand km21981~2023
Industrial land areaUrban industrial land area.thousand km22001~2023
Building construction areaUrban construction land area.thousand km21995~2023
Public green area per capitaPer capita public green area in a city.m21981~2023
Proportion of land used for housing The proportion of urban construction land in built-up area.%1995~2023
Proportion of industrial landThe proportion of urban industrial land in built-up area.%2001~2023
Green coverage rate in built-up areaThe proportion of urban gardens and green areas in the built-up area.%1986~2023
Social developmentNatural gasNatural gas consumption of urban residents.million m31972~2023
Liquefied petroleum gasConsumption of liquefied petroleum gas by urban residents.100 t
Artificial gasArtificial gas consumption of urban residents.ten thousand m3
Civilian car ownershipUrban civilian car ownership.thousand units1949~2023
Heating areaHeating area for urban residents.ten thousand m21981~2023
Road areaCity road area.ten thousand m21972~2023
Road area per capitaUrban road area per capita.m21981~2023
The number of buses owned per 10,000 peopleThe number of buses per 10,000 people in a city.units1986~2023

References

  1. Dong, F.; Wang, Y.; Su, B.; Hua, Y.; Zhang, Y. The process of peak CO2 emissions in developed economies: A perspective of industrialization and urbanization. Resour. Conserv. Recycl. 2019, 141, 61–75. [Google Scholar] [CrossRef]
  2. Ministry of Environmental Protection of the People’s Republic of China. Bulletin of the State of the Environment in China. 2013. Available online: http://www.mee.gov.cn/hjzl/sthjzk/zghjzkgb/201605/P020160526564151497131.pdf (accessed on 27 May 2020).
  3. Zhang, Q.; Robert, C. Toward an Environmentally Sustainable Future: Country Environmental Analysis of the People’s Republic of China; Asian Development Bank: Mandaluyong City, Philippines, 2012; Available online: https://ccus.nwu.edu.cn/__local/E/DC/54/EA2217116CC1501278DB7A42B29_EB5BE3B7_29457A.pdf (accessed on 1 December 2020).
  4. World Health Organization. 9 out of 10 People Worldwide Breathe Polluted Air, but More Countries Are Taking Action; World Health Organization: Geneva, Switzerland, 2018. Available online: https://www.who.int/news/item/02-05-2018-9-out-of-10-people-worldwide-breathe-polluted-air-but-more-countries-are-taking-action (accessed on 1 December 2020).
  5. Yin, P.; Brauer, M.; Cohen, A.J.; Wang, H.; Li, J.; Burnett, R.T.; Stanaway, J.D.; Causey, K.; Larson, S.; Godwin, W.; et al. The effect of air pollution on deaths, disease burden, and life expectancy across China and its provinces, 1990–2017: An analysis for the Global Burden of Disease Study 2017. Lancet Planet. Health 2020, 4, e386–e398. [Google Scholar] [CrossRef]
  6. Diao, B.; Ding, L.; Zhang, Q.; Na, J.; Cheng, J. Impact of urbanization on PM2.5-related health and economic loss in China 338 cities. Int. J. Environ. Res. Public Health. 2020, 17, 990. [Google Scholar] [CrossRef]
  7. Li, H.; Zhou, D.; Wei, Y. Dynamic Assessment of PM2.5 Health Damage Value in China from 2015 to 2018. Environ. Sci. 2020, 41, 5225–5235. [Google Scholar]
  8. Fuller, R.; Landrigan, P.J.; Balakrishnan, K.; Bathan, G.; Bose-O’Reilly, S.; Brauer, M.; Caravanos, J.; Chiles, T.; Cohen, A.; Corra, L.; et al. Pollution and health: A progress update. Lancet Planet. Health 2022, 6, 535–547. [Google Scholar] [CrossRef]
  9. Health Effects Institute. State of Global Air 2024; Special Report; Health Effects Institute: Boston, MA, USA, 2024; Available online: https://www.stateofglobalair.org/sites/default/files/documents/2024-06/soga-2024-report_0.pdf (accessed on 1 July 2024).
  10. Kuźma, Ł.; Kurasz, A.; Dąbrowski, E.J.; Dobrzycki, S.; Bachórzewska-Gajewska, H. Short-Term Effects of “Polish Smog” on Cardiovascular Mortality in the Green Lungs of Poland: A Case-Crossover Study with 4,500,000 Person-Years (PL-PARTICLES Study). Atmosphere 2021, 12, 1270. [Google Scholar] [CrossRef]
  11. Feng, L.; Liao, W. Legislation, plans, and policies for prevention and control of air pollution in China: Achievements, challenges, and improvements. J. Clean. Prod. 2016, 112, 1549–1558. [Google Scholar] [CrossRef]
  12. Lu, X.; Zhang, S.; Xing, J.; Wang, Y.; Chen, W.; Ding, D.; Wu, Y.; Wang, S.; Duan, L.; Hao, J. Progress of air pollution control in China and its challenges and opportunities in the ecological civilization era. Engineering 2020, 6, 1423–1431. [Google Scholar] [CrossRef]
  13. Jin, Y.; Andersson, H.; Zhang, S. Air pollution control policies in China: A retrospective and prospects. Int. J. Environ. Res. Public Health 2016, 13, 1219. [Google Scholar] [CrossRef]
  14. Yuan, X.L.; Li, Z.P.; Fang, K. Retrospect and Prospect of Research on Air Pollution in the China’s Urbanization. Econ. Perspect. 2019, 05, 88–103. [Google Scholar]
  15. Tu, M.; Liu, Z.; He, C.; Fang, Z.; Lu, W. The relationships between urban landscape patterns and fine particulate pollution in China: A multiscale investigation using a geographically weighted regression model. J. Clean. Prod. 2019, 237, 117744. [Google Scholar] [CrossRef]
  16. Liu, Y.; Wu, J.; Yu, D. Characterizing spatiotemporal patterns of air pollution in China: A multiscale landscape approach. Ecol. Indic. 2017, 76, 344–356. [Google Scholar] [CrossRef]
  17. Zhou, Q.; Zhong, S.; Shi, T.; Zhang, X. Environmental regulation and haze pollution: Neighbor-companion or neighbor-beggar? Energy Policy 2021, 151, 112183. [Google Scholar] [CrossRef]
  18. Shao, S.; Li, X.; Cao, J. Urbanization promotion and smog control in China. Econ. Res. J. 2019, 54, 148–165. [Google Scholar]
  19. Long, Y.; Wu, K. Several realistic problems of urbanization in China: Spatial expansion, population shrinking, low-density human activity and urban defining. Urban Plan. Forum 2016, 2, 72–77. [Google Scholar]
  20. Liu, R.; Shi, L. The ownership basis of delayed urbanization in China: Theoretical and empirical evidence. Econ. Res. J. 2015, 50, 107–121. [Google Scholar]
  21. Du, Y.; Sun, T.; Peng, J.; Fang, K.; Liu, Y.; Yang, Y.; Wang, Y. Direct and spillover effects of urbanization on PM2.5 concentrations in China’s top three urban agglomerations. J. Clean. Prod. 2018, 190, 72–83. [Google Scholar]
  22. Xu, S.C.; Miao, Y.; Gao, C.; Long, R.-Y.; Chen, H.; Zhao, B.; Wang, S.-X. Regional differences in impacts of economic growth and urbanization on air pollutants in China based on provincial panel estimation. J. Clean. Prod. 2019, 208, 340–352. [Google Scholar] [CrossRef]
  23. Yang, Y.; Tang, D.; Yang, X. Investigating the spatio-temporal variations of the impact of urbanization on haze pollution using multiple indicators. Stoch. Environ. Res. Risk Assess. 2021, 35, 703–717. [Google Scholar] [CrossRef]
  24. Song, W.; Wang, C.; Chen, W.; Zhang, X.; Li, H.; Li, J. Unlocking the spatial heterogeneous relationship between Per Capita GDP and nearby air quality using bivariate local indicator of spatial association. Resour. Conserv. Recycl. 2020, 160, 104880. [Google Scholar] [CrossRef]
  25. Li, Z.; Yuan, X.; Xi, J.; Yang, L. The objects, agents, and tools of Chinese co-governance on air pollution: A review. Environ. Sci. Pollut. Res. 2021, 28, 24972–24991. [Google Scholar] [CrossRef] [PubMed]
  26. Sun, L.; Zhang, T.; Liu, S.; Wang, K.; Rogers, T.; Yao, L.; Zhao, P. Reducing Energy Consumption and Pollution in the Urban Transportation Sector: A Review of Policies and Regulations in Beijing. J. Clean. Prod. 2020, 285, 125339. [Google Scholar] [CrossRef]
  27. Fang, L.; Li, P.; Song, S. China’s urban development policies and city growth dynamics: An analysis based on the Gibrat’s Law. Int. Rev. Econ. Financ. 2017, 52, 322–329. [Google Scholar] [CrossRef]
  28. Wang, R.; Tao, S.; Ciais, P.; Shen, H.Z.; Huang, Y.; Chen, H.; Shen, G.F.; Wang, B.; Li, W.; Zhang, Y.Y.; et al. High-resolution mapping of combustion processes and implications for CO2 emissions. Atmos. Chem. Phys. 2013, 13, 5189–5203. [Google Scholar] [CrossRef]
  29. Liu, Z.; Guan, D.; Wei, W.; Davis, S.J.; Ciais, P.; Bai, J.; Peng, S.; Zhang, Q.; Hubacek, K.; Marland, G.; et al. Reduced carbon emission estimates from fossil fuel combustion and cement production in China. Nature 2015, 524, 335–338. [Google Scholar] [CrossRef]
  30. Zhong, Q.; Huang, Y.; Shen, H.; Chen, Y.; Chen, H.; Huang, T.; Zeng, E.Y.; Tao, S. Global estimates of carbon monoxide emissions from 1960 to 2013. Environ. Sci. Pollut. Res. 2017, 24, 864–873. [Google Scholar] [CrossRef]
  31. Huang, Y.; Shen, H.Z.; Chen, H.; Wang, R.; Zhang, Y.; Su, S.; Chen, Y.; Lin, N.; Zhuo, S.; Zhong, Q.; et al. Quantification of global primary emissions of PM2.5, PM10, and tsp from combustion and industrial process sources. Environ. Sci. Technol. 2014, 48, 13834–13843. [Google Scholar] [CrossRef]
  32. Huang, T.; Zhu, X.; Zhong, Q.; Yun, X.; Meng, W.; Li, B.; Ma, J.; Zeng, E.Y.; Tao, S. Spatial and Temporal Trends in Global Emissions of Nitrogen Oxides from 1960 to 2014. Environ. Sci. Technol. 2017, 51, 7992–8000. [Google Scholar] [CrossRef]
  33. Tan, X.; Han, L.; Zhang, X.; Zhou, W.; Li, W.; Qian, Y. A review of current air quality indexes and improvements under the multi-contaminant air pollution exposure. J. Environ. Manag. 2021, 279, 11681. [Google Scholar] [CrossRef]
  34. Wang, Y.; Chen, J.; Peng, X. International trends in academic research on urbanization in 2012–2013. Econ. Perspect. 2014, 2, 106–116. [Google Scholar]
  35. Rosenthal, S.; Strange, W. The determinants of agglomeration. J. Urban Econ. 2001, 50, 191–229. [Google Scholar] [CrossRef]
  36. Gaigné, C.; Riou, S.; Thisse, J. Are compact cities environmentally friendly? J. Urban Econ. 2012, 72, 123–136. [Google Scholar] [CrossRef]
  37. Chinese Academy of Engineering (CAE); Ministry of Environmental Protection. China Environmental Macro Strategy Research: Comprehensive Report Volume; China Environmental Science Press: Beijing, China, 2011. [Google Scholar]
  38. Larssen, T.; Lydersen, E.; Tang, D.; He, Y.; Gao, J.; Liu, H.; Duan, L.; Seip, H.M.; Vogt, R.D.; MuLder, J.; et al. Acid Rain in China. Environ. Sci. Technol. 2006, 40, 418–425. [Google Scholar] [CrossRef] [PubMed]
  39. Zhao, S.; Zhou, D.; Zhu, C.; Qu, W.; Zhao, J.; Sun, Y.; Huang, D.; Wu, W.; Liu, S. Rates and patterns of urban expansion in China’s 32 major cities over the past three decades. Landsc. Ecol. 2015, 30, 1541–1559. [Google Scholar] [CrossRef]
  40. Hu, H.; Yang, Q.; Lu, X.; Wang, W.; Wang, S.; Fan, M. Air pollution and control in different areas of China. Crit. Rev. Environ. Sci. Technol. 2010. 40, 452–518. [CrossRef]
  41. Information Office of the State Council of the People’s Republic of China. Environmental Protection in China, 1996–2005; Foreign Languages Press: Beijing, China, 2006. Available online: http://www.gov.cn/zwgk/2006-06/05/content_300288.htm (accessed on 1 December 2020).
  42. Wang, S.; Xing, J.; Zhao, B.; Jang, C.; Hao, J. Effectiveness of national air pollution control policies on the air quality in metropolitan areas of China. J. Environ. Sci. 2014, 26, 13–22. [Google Scholar] [CrossRef]
  43. Ye, Q.; Wu, T. The politics of climate change in China. Wiley Interdiscip. Rev. 2013, 44, 301–313. [Google Scholar]
  44. Liu, S.; Zhu, Y.; Du, K. The impact of industrial agglomeration on industrial pollutant emission: Evidence from China under New Normal. Clean Technol. Environ. Policy. 2017, 19, 2327–2334. [Google Scholar] [CrossRef]
  45. Rohde, R.A.; Muller, R.A. Air Pollution in China: Mapping of Concentrations and Sources. PLoS ONE 2015, 10, e0135749. [Google Scholar] [CrossRef]
  46. Zhang, J.; Jiang, H.; Zhang, W.; Ma, G.; Wang, Y.; Lu, Y.; Hu, X.; Zhou, J.; Peng, F.; Bi, J.; et al. Cost-benefit analysis of China’s Action Plan for Air Pollution Prevention and Control. Front. Eng. Manag. 2019, 6, 524–537. [Google Scholar] [CrossRef]
  47. Yin, S. Decadal trends of MERRA-estimated PM2.5 concentrations in East Asia and potential exposure from 1990 to 2019. Atmos. Environ. 2021, 264, 118690. [Google Scholar] [CrossRef]
  48. Ministry of Environmental Protection of the People’s Republic of China. Bulletin of the State of the Environment in China. 2024. Available online: http://www.mee.gov.cn/hjzl/sthjzk/zghjzkgb/ (accessed on 1 July 2024).
Figure 1. The interaction between air pollution and urbanization in the last 75 years in China.
Atmosphere 15 01093 g001
Table 1. China’s air pollution and urbanization in the past 75 years.
DimensionFeatureTrend
Air Pollution1949~1978: Lighter air pollution, dominated by smoke and dust from TSP emissions
1979~1995: Increased air pollution and a rapid rise in emissions of various pollutants, especially TSP and SO2
1996~1999: The emission of various pollutants fell, and the problem of CO2 emissions began to emerge
2000~2012: The emission volumes of various pollutants increased rapidly, with some of them peaking, while TSP, SO2 and NOx decreased, and CO2 was the highest
2013~2023: The growth of CO2 emission slowed down, O3 increased, PM2.5, PM10, SO2 dropped, and NOx and CO increased in some cities
Atmosphere 15 01093 i001
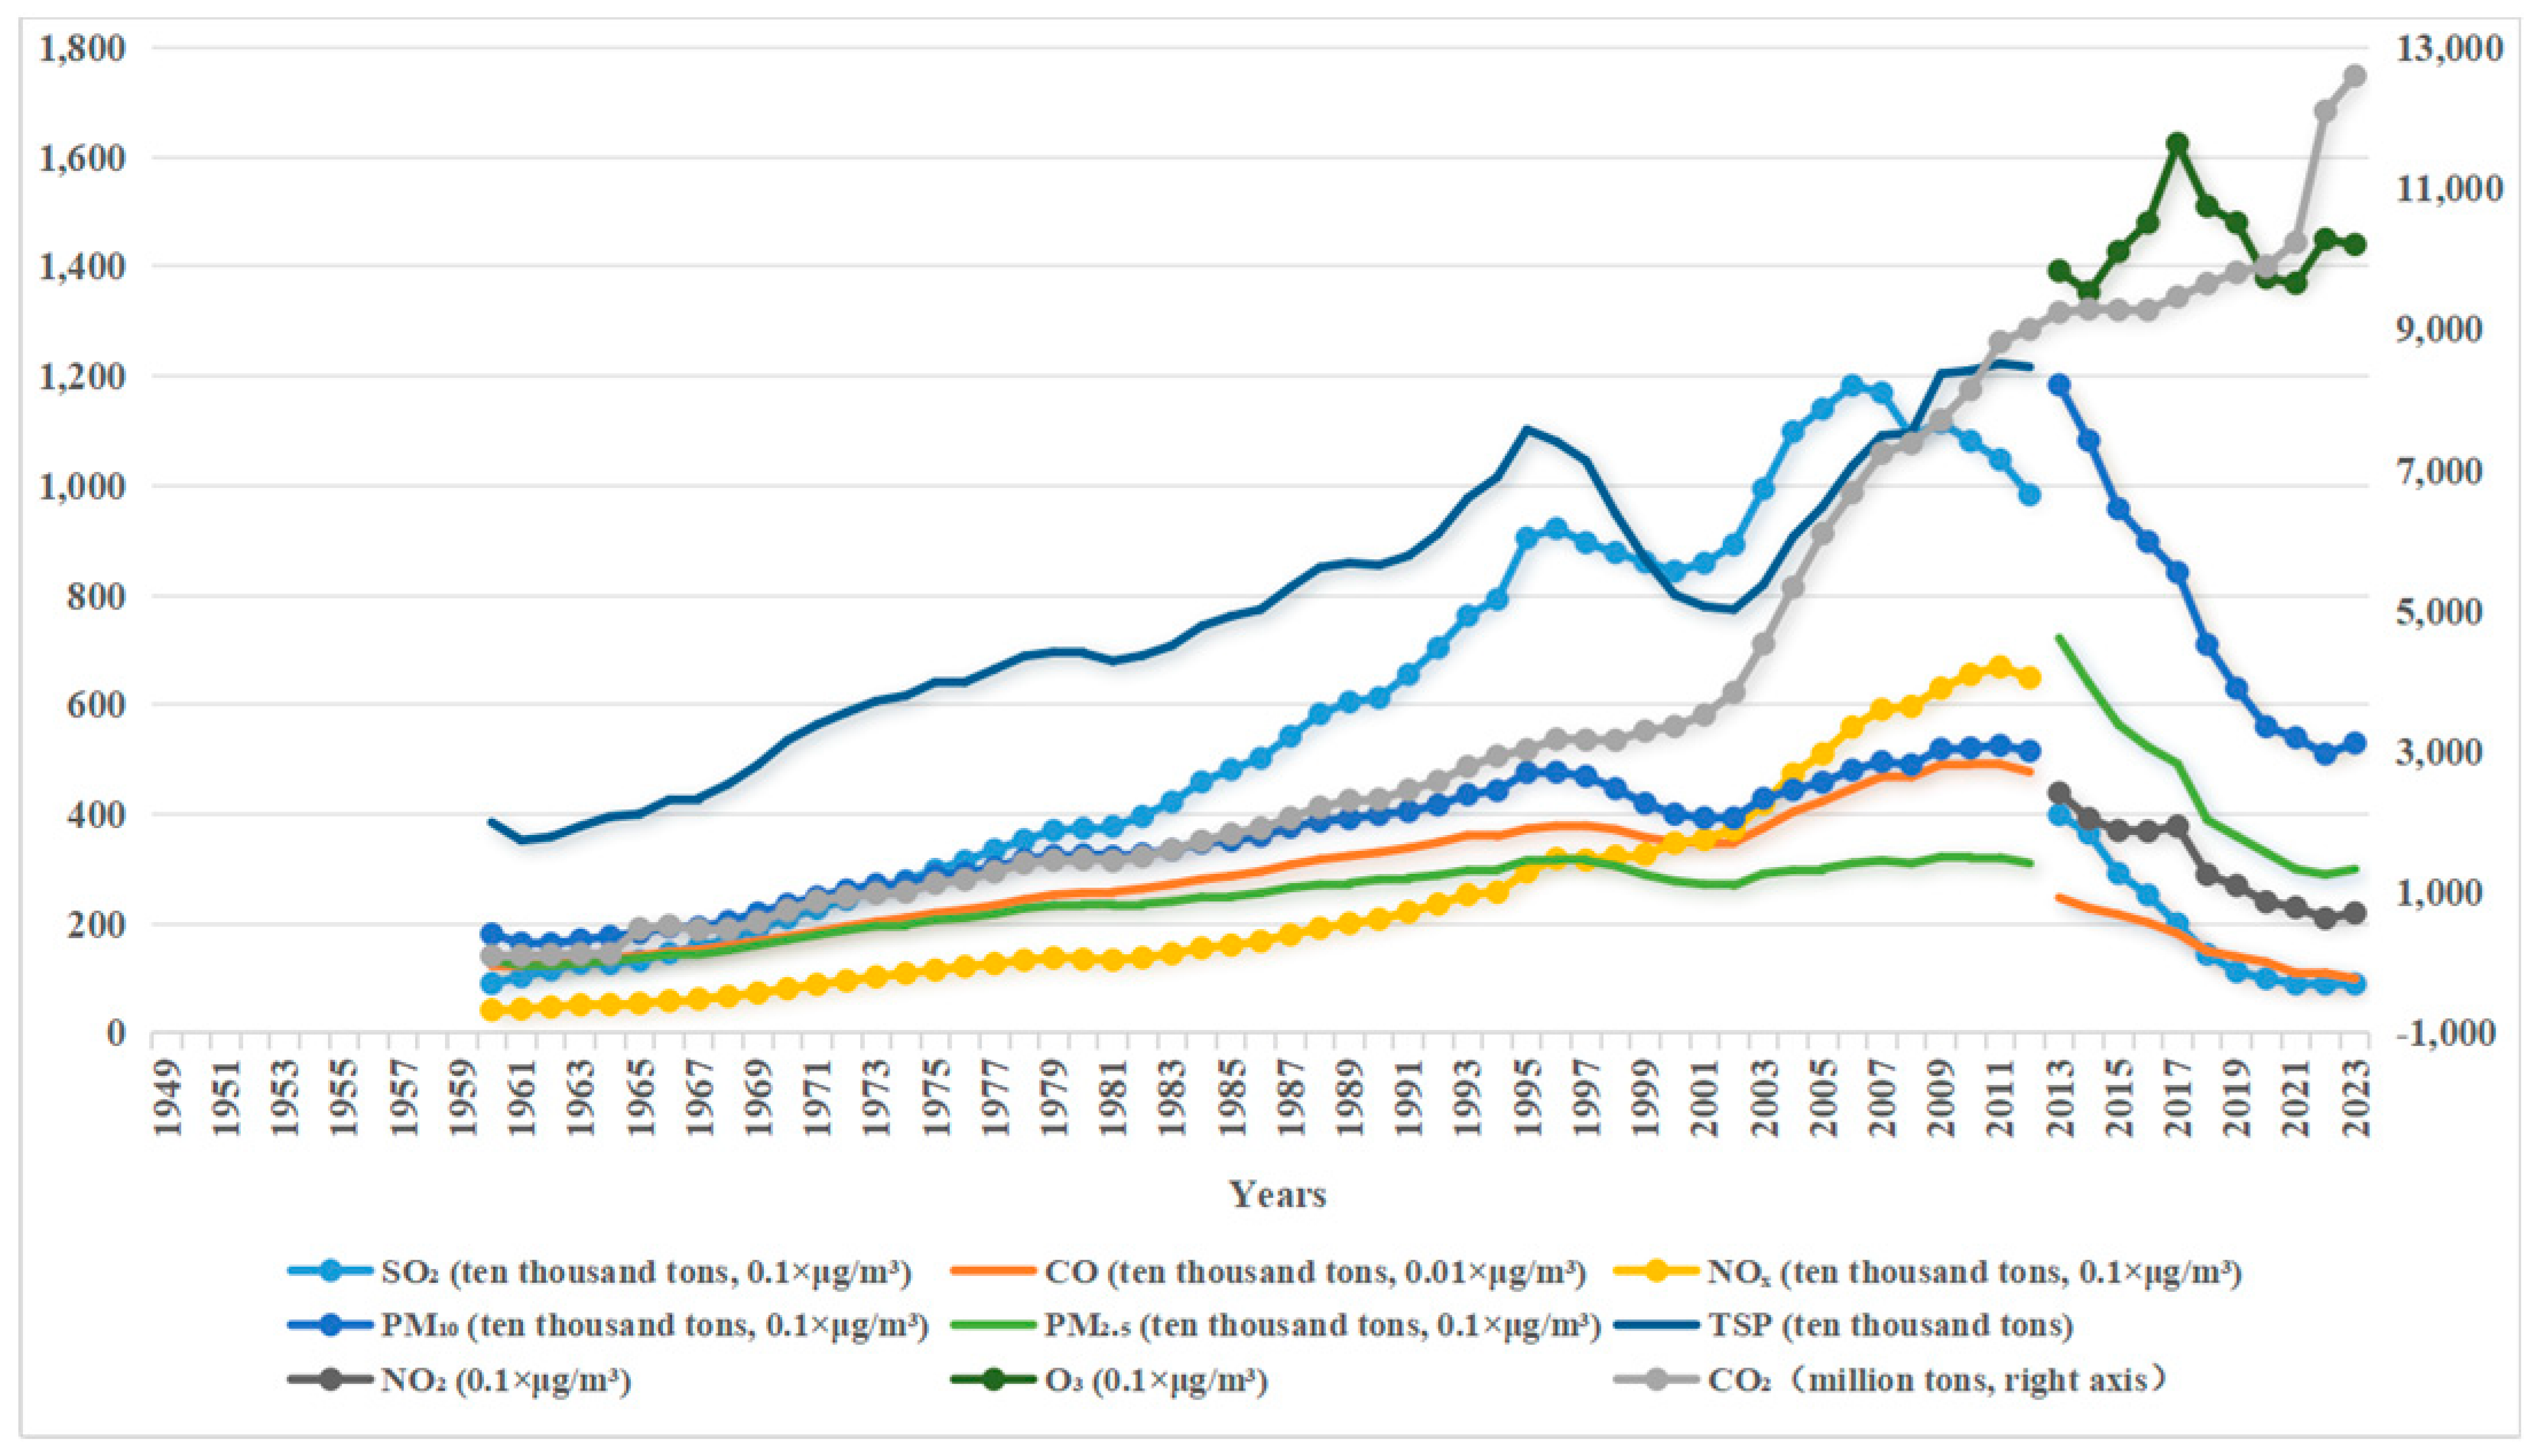
(a) China’s urban air pollution in the past 70 years
Population developmentCity size1949~1982: The number and size of cities were strictly controlled
1983~1999: Rising number of cities and population, especially for small- and medium-sized cities
2000~2023: The total number of cities was fixed, the number of small cities decreased, and the number of large- and medium-sized cities increased
Atmosphere 15 01093 i002
(b) China’s city number and size in the past 70 years
Population size1949~1978: The urban population was small and mounted slowly
1979~1999: The urban population ascended significantly, and the population urbanization rate increased rapidly
2000~2023: The population urbanization rate was accelerating, the urban population was accelerating, and the population density was on the rise
Atmosphere 15 01093 i003
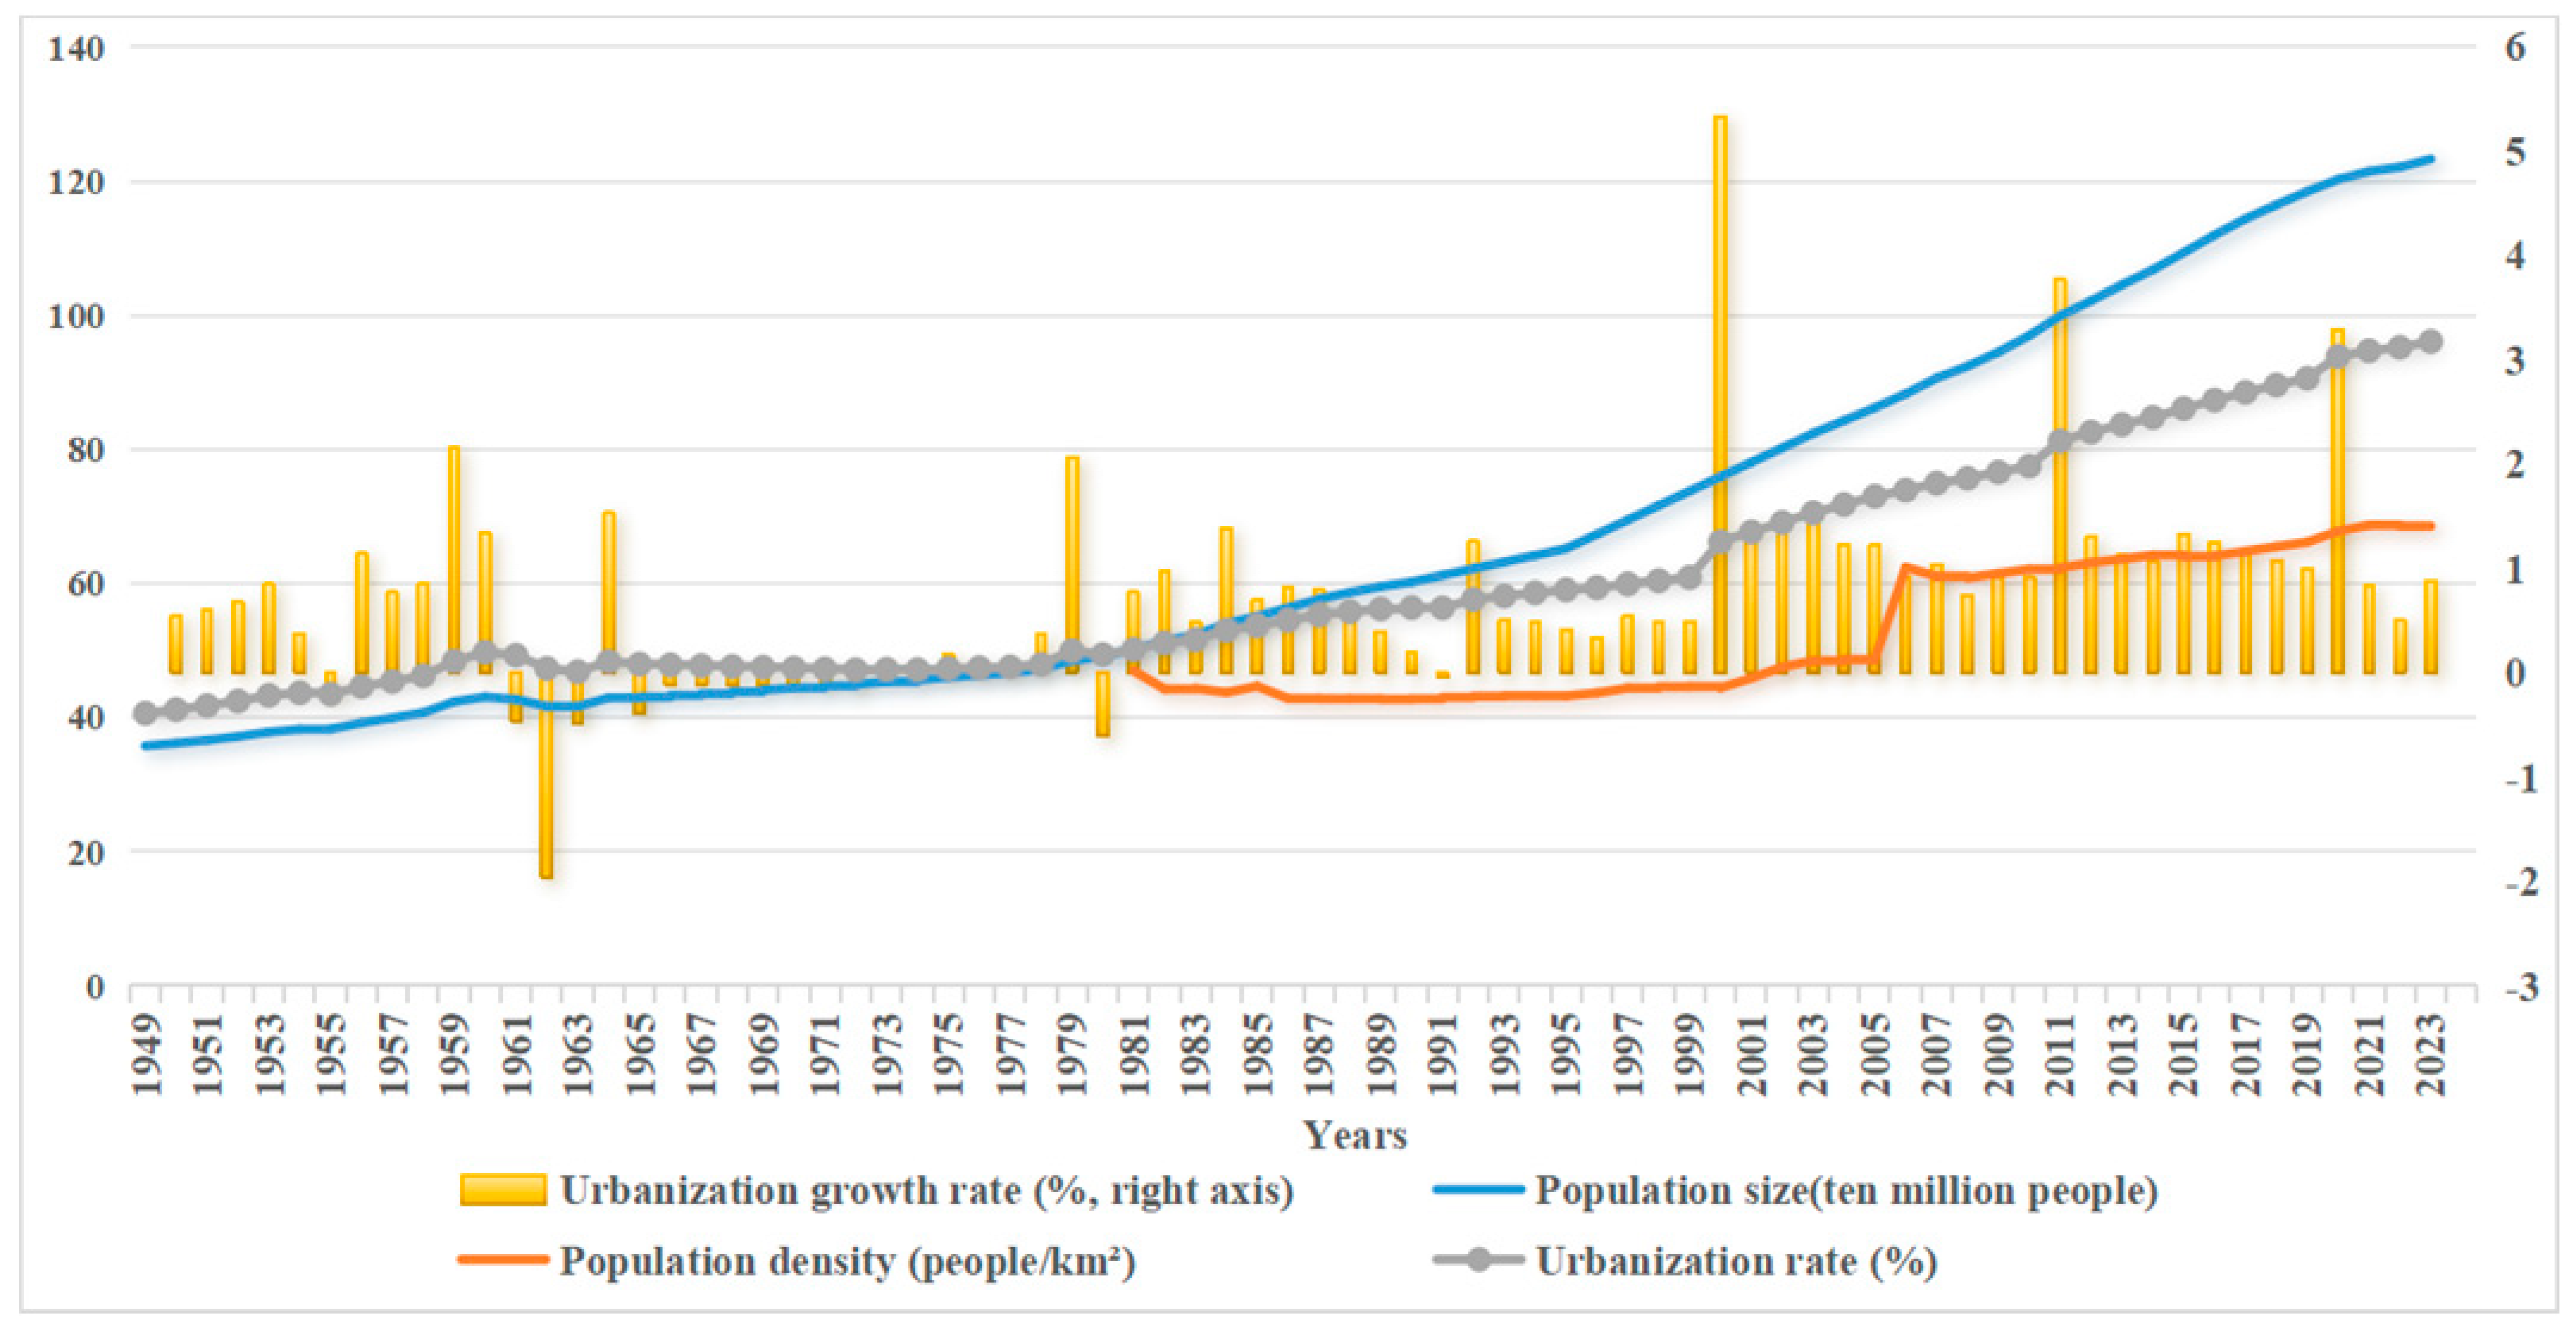
(c) China’s urban population development in the past 70 years
Economic developmentEconomic growth1949~1978: The level of economic development was low, the proportion of tertiary industry was low
1979~2005: The level of economic development soared, the proportion of tertiary industries started to increase
2006~2023: The economic growth rate increased rapidly, the proportion of tertiary industry surpassed secondary industry, and the wealth of residents rocketed upwards
Atmosphere 15 01093 i004
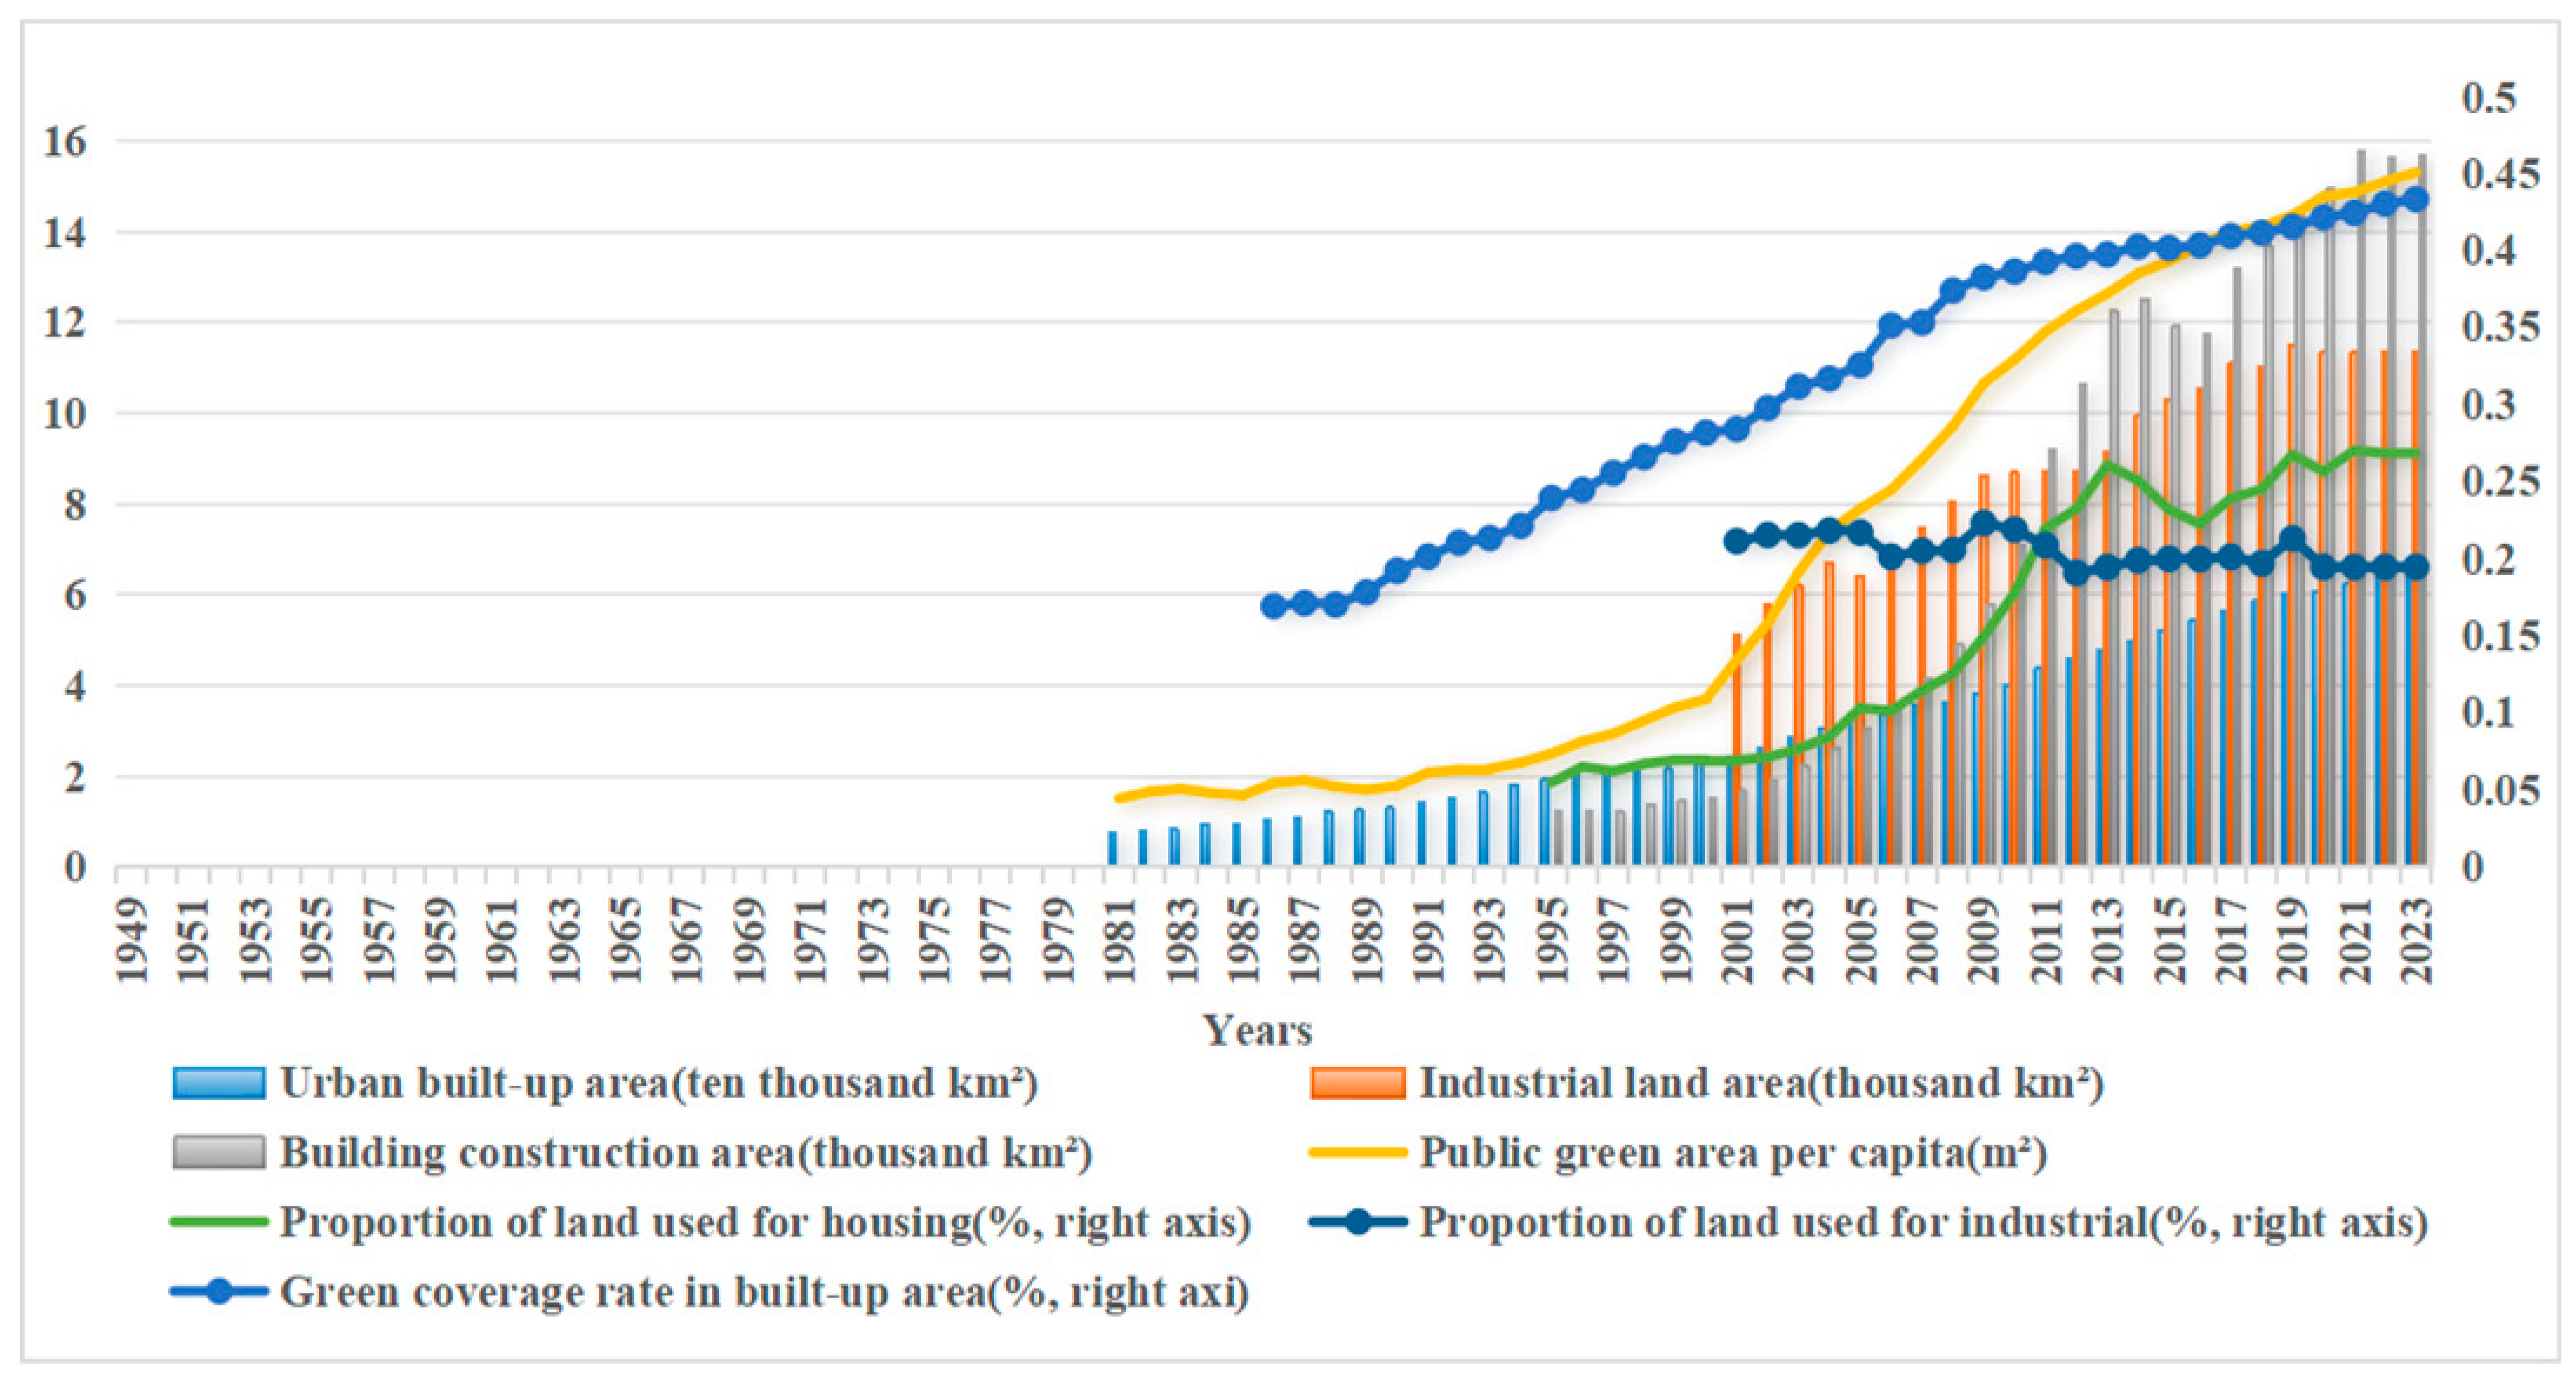
(d) China’s urban economic growth in the past 70 years
Energy consumption1949~1978: Total energy consumption increased, coal consumption increased slightly, and crude oil consumption went down slightly
1979~1999: Total energy consumption increased, coal consumption increased slightly, and crude oil consumption slid slightly
2000~2023: The total energy consumption increased rapidly, coal consumption decreased rapidly, and the proportion of clean energy consumption increased.
Atmosphere 15 01093 i005
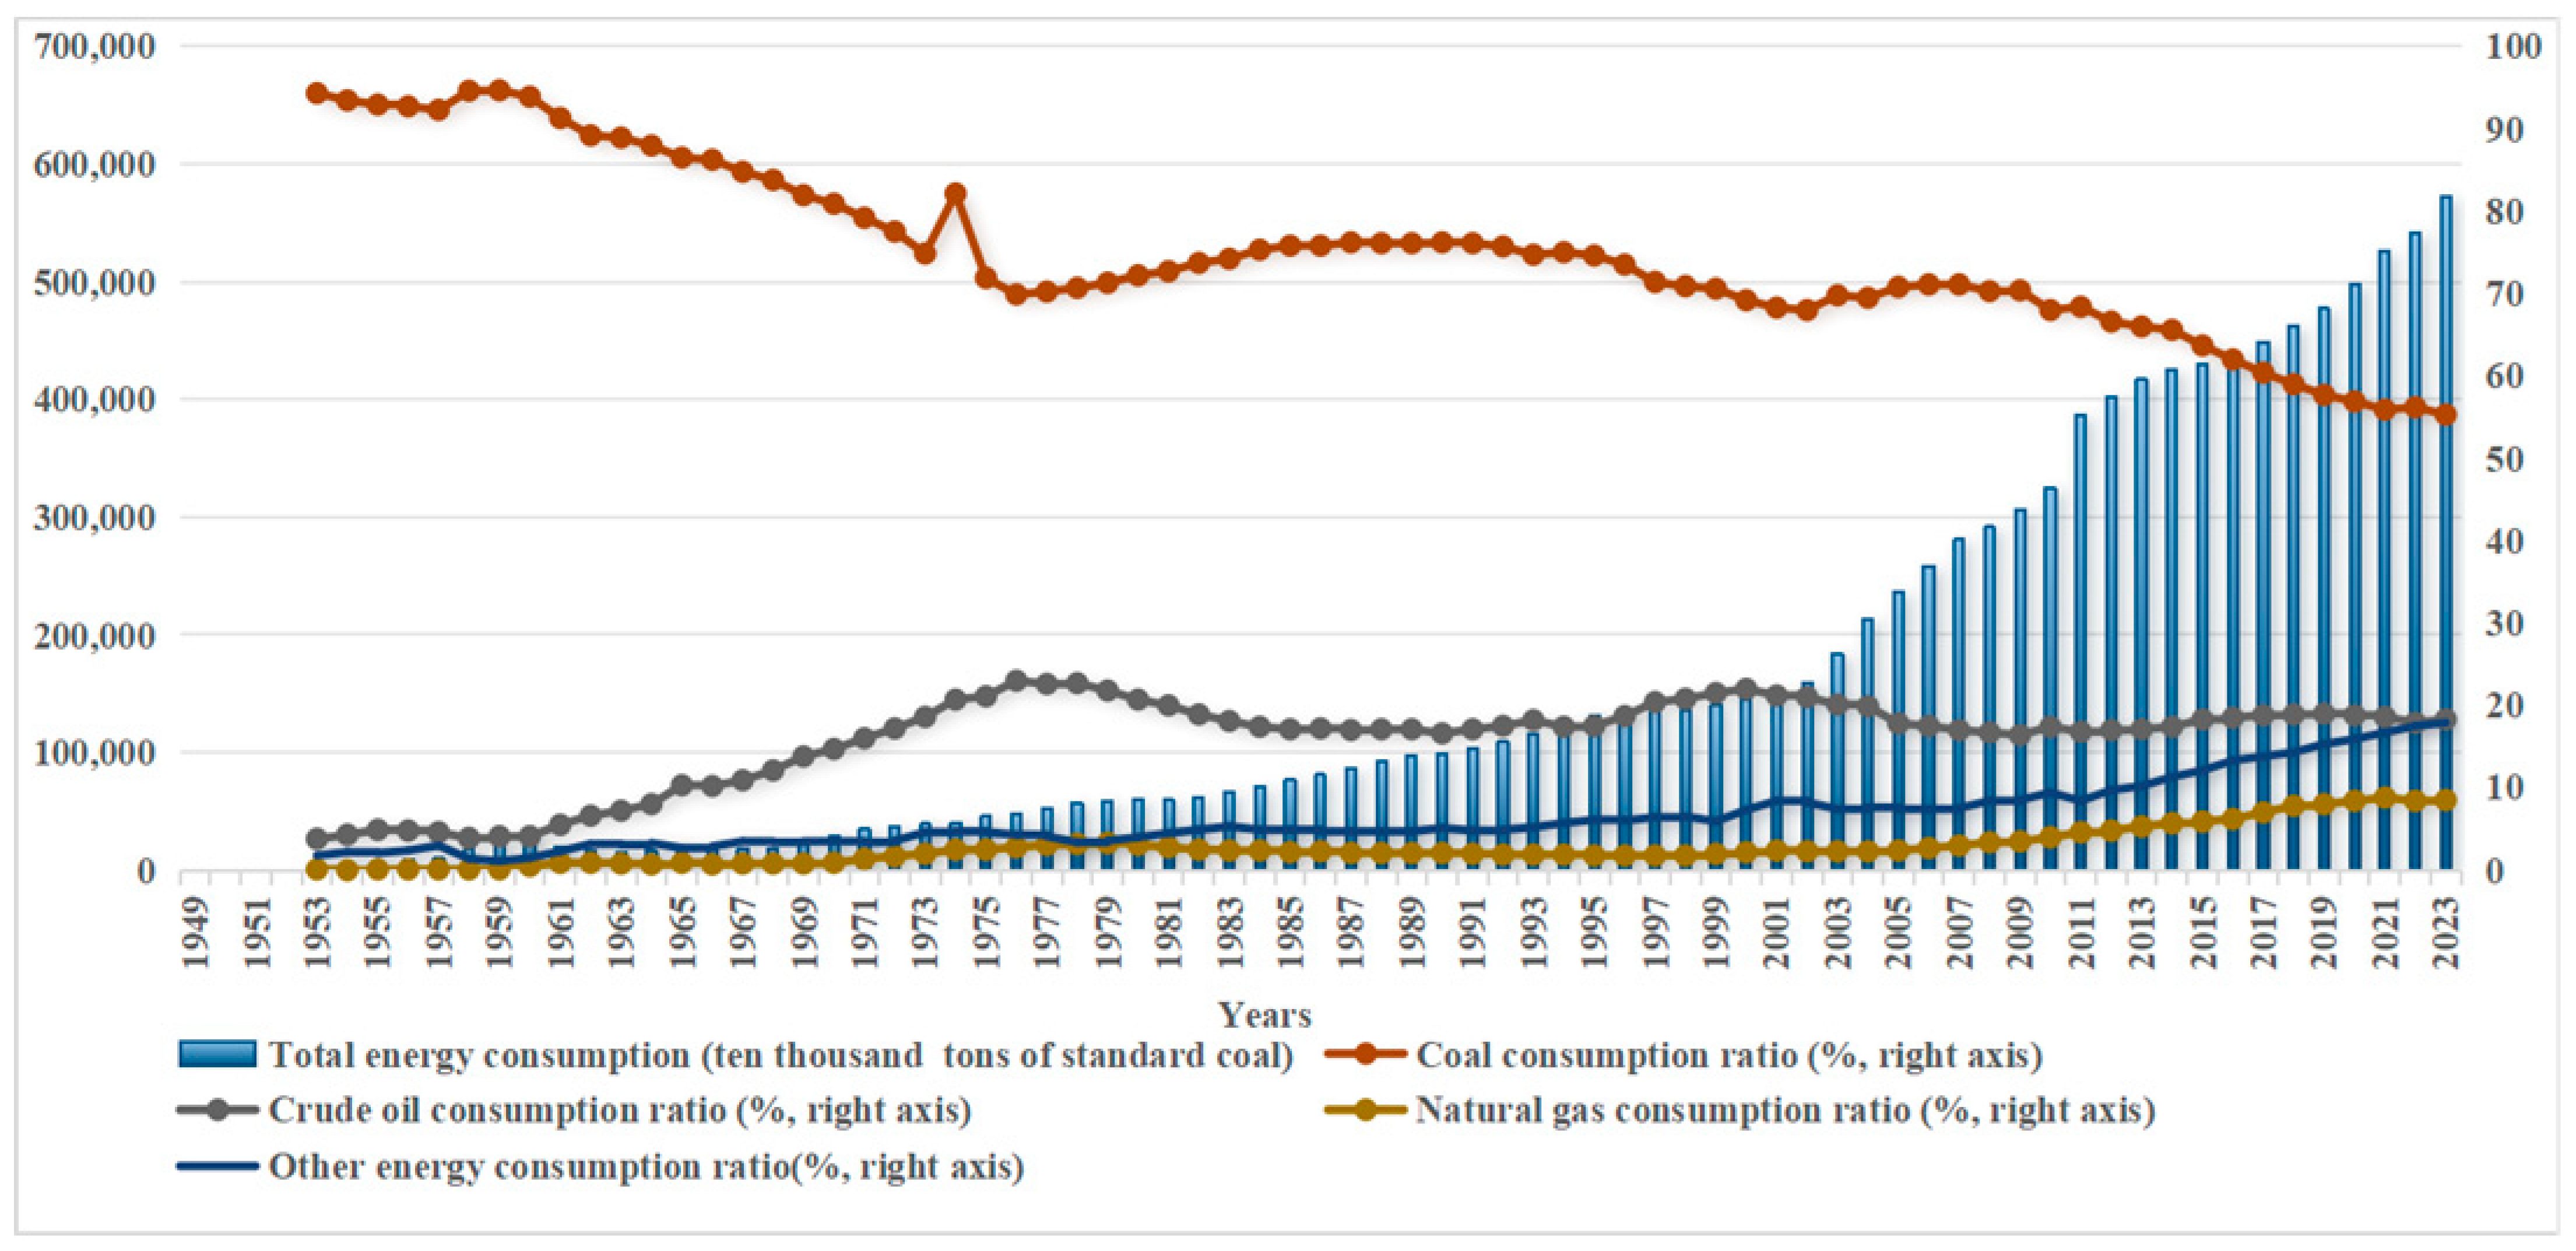
(e) China’s urban energy consumption in the past 70 years
Space development1949~1980: Statistics were missing
1981~1999: The built-up area was small, with more industrial land, less residential land and low greening coverage rate
2000~2012: The urban construction area expanded rapidly, the proportion of housing construction land increased sharply, the proportion of industrial land showed a small fluctuation in decline, and the greening coverage rate continued to rise
2013~2023: The proportion of housing construction land decreased, the proportion of industrial land and the greening coverage rate of built-up area were basically fixed
Atmosphere 15 01093 i006
(f) China’s urban space development in the past 70 years
Social development1949~1971: Statistics were missing
1972~1985: The infrastructure construction, such as household energy and public transport, was backward, and car ownership was extremely low
1986~2000: The household energy consumption continued to increase, the public transportation continued to improve, and car ownership surged
2001~2023: The construction of public transportation was improved rapidly, car ownership soared, and the household energy consumption declined
Atmosphere 15 01093 i007
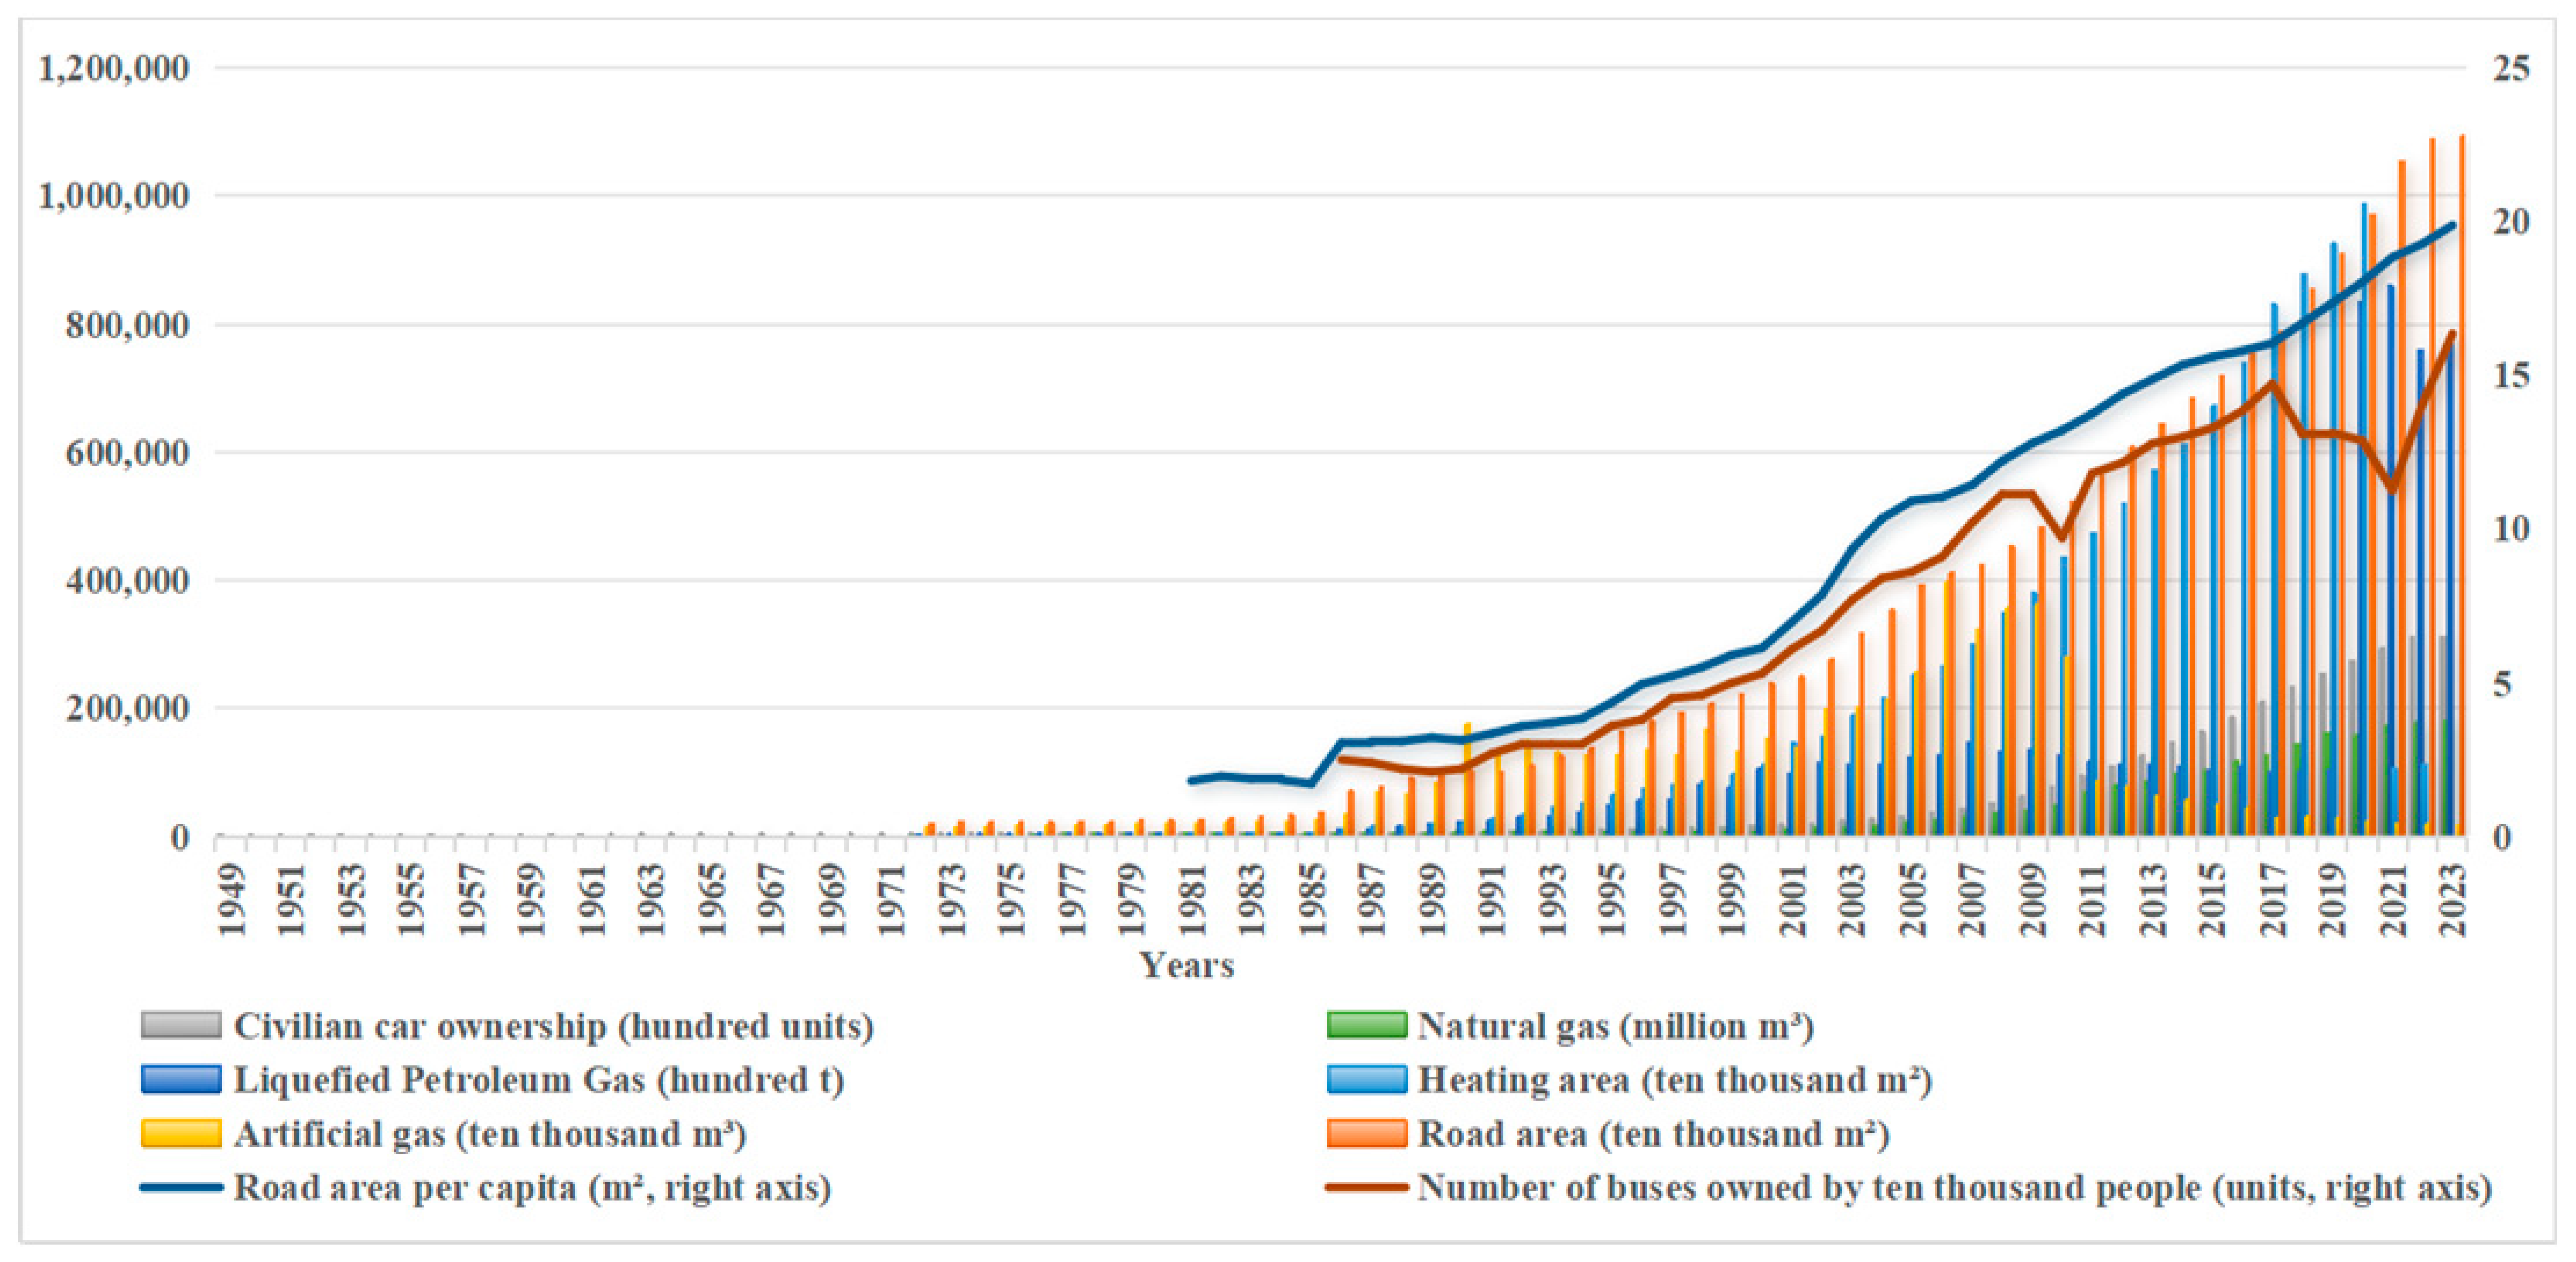
(g) China’s urban social development in the past 70 years
Table 2. Critical criteria defining the interaction between air pollution and urbanization in China.
Interactive StageInteractive FeaturesUrbanizationAir PollutionPolicy Considerations
1949~1978Difficult exploration of urbanization path and smoke pollution.The population urbanization rate was around 17%. The per capita GDP was below CNY 400 for a long time. The average annual emission of other pollutants was below 2 million tons; the average annual emission of TSP was above 5 million tons.The R&O (1978).
1979~1990Urbanization on the track and coal-smoke pollution.The population urbanization rate increased by 0.71% annually; the per capita GDP increased by 4 times; the built-up area increased by 72.83% annually; the area of central heating increased by 2 times.The annual average SO2 emissions increased by 216,200 tons, the fastest growth; the average annual emissions of TSP were 7.6 million tons, the largest emissions.The rapid development of small cities and SMEs.
1991~1999Accelerating urbanization and full-blown acid rain.The population urbanization rate increased to more than 30%; the GDP scale increased by 4 times; the urban construction land increased by 2 times; the number of motor vehicles s increased by 2.35 times.SO2 emissions increased by an average of 275,400 tons per year. In 1999, it surpassed TSP and became the largest pollutant in China.Accelerating spatial urbanization.
2000~2012The “golden period” of urbanization and the full outbreak of air pollution.The average annual growth rate of urbanization was 1.67%; the average annual GDP growth rate was 10.12%; the area of urban housing construction land increased by nearly 7 times; the number of motor vehicles increased by 8 times.In 2006, SO2 emissions peaked; In 2011, China’s CO2 emissions surpassed that of the US; the annual growth rate of NOx, PM10 and CO emissions reached the historical maximum.Urbanization in the new millennium began to accelerate in an all-round way.
2013~2023Urbanization model adjustment and air pollution control.The population growth rate slowed down; the built-up area growth rate was only 22.15%; the GDP growth rate entered the 6-digit era; the consumption of domestic energy and natural gas increased by 7.76% annually.China’s urban PM2.5, PM10, SO2, CO and NO2 concentrations decreased by 50%, 47%, 72%, 44% and 39%, respectively, compared to those of in 2013. China stepped into the stage of “improvement of air quality”.
Disclaimer/Publisher’s Note: The statements, opinions and data contained in all publications are solely those of the individual author(s) and contributor(s) and not of MDPI and/or the editor(s). MDPI and/or the editor(s) disclaim responsibility for any injury to people or property resulting from any ideas, methods, instructions or products referred to in the content.

