Article

A Stepwise Multifactor Regression Analysis of the Interactive Effects of Multiple Climate Factors on the Response of Vegetation Recovery to Drought

1
Hebei Key Laboratory of Intelligent Water Conservancy, College of Water Resources and Hydropower, Hebei University of Engineering, Handan 056038, China
2
State Key Joint Laboratory of Environmental Simulation and Pollution Control, China-Canada Center for Energy, Environment and Ecology Research, University of Regina-Beijing Normal University, School of Environment, Beijing Normal University, Beijing 100875, China
3
Faculty of Engineering and Applied Science, University of Regina, Regina, SK S4S 0A2, Canada
4
College of Resources and Environmental Engineering, Mianyang Teachers College, Mianyang 621000, China
*
Author to whom correspondence should be addressed.
Atmosphere 2024, 15(9), 1094; https://doi.org/10.3390/atmos15091094
Submission received: 31 July 2024 / Revised: 30 August 2024 / Accepted: 6 September 2024 / Published: 8 September 2024
(This article belongs to the Section Climatology)

Abstract

:
In this study, a stepwise multifactor vegetation regression analysis (SMVRA) approach was proposed to investigate the interaction of multiple climate factors on vegetative growth in the study area from 2000 to 2020. It was developed by integrating the stepwise linear regression method, Standardized Precipitation Evapotranspiration Index (SPEI), Normalized Difference Vegetation Index (NDVI), and Pearson correlation coefficient. SMVRA can be used to intuitively understand the interactive effects of multiple correlated factors (e.g., temperature, precipitation, potential evapotranspiration, and the drought index) upon vegetation. The results show that the resilience of vegetation in the BLR basin is influenced by the severity of drought. Annual changes in SPEI over the BLR basin show an increasing trend, with rates of 3.12 × 10⁻². Precipitation and NDVI had a strong positive correlation (p < 0.05), found for 34.93% of the total pixels in the study area. In the BLR basin, vegetation growth is inhibited in the 4 years following a drought event. The area near 800 m is most sensitive to drought events. It provides a theoretical basis for future drought response and effective vegetation restoration in the region.

1. Introduction

Vegetation, the mainstay of terrestrial ecosystems, is an indicator of global climate change [1,2]. The increase in the frequency of climatic droughts has been one of the main features of global climate change in recent years. Severe drought is a climate event that has a large impact and causes serious losses to human beings. Severe drought can cause serious water imbalance in plants. It directly affects physiological processes such as photosynthesis and respiration, inhibits plant growth and development, and even causes death. It may also have a more serious, lasting, or even unrecoverable impact on the composition, structure, and function of terrestrial ecosystems [3]. Linking vegetation and climate is key to understanding global change [4,5]. Primary climate factors affecting vegetation growth have been identified as the temperature, precipitation, potential evapotranspiration, and the drought index [6,7]. Plant growth and distribution are influenced by elements such as effective plant temperature and soil moisture. Vegetation with different spatial distributions responds differently to precipitation. Therefore, investigation of the interaction of multiple factors on vegetation under climate change can be helpful for us to better understand vegetation–climate relationships. According to Warter et al. [8], temperature variations in autumn and spring have the greatest effect on vegetation changes in South America. Investigating the effects of drought on vegetation recovery using relationships between the fraction of absorbed photosynthetically active radiation (FPAR) and canopy density in Australia, Jiao et al. [9] found that vegetation recovery was strongly controlled by drought duration, drought return interval, and post-drought wet and dry conditions. In their study of NDVI in the Qinling Mountains during the growing season, Wang et al. [10] found that vegetation growth was inhibited when precipitation was low.
Correlation analysis [11], geographically weighted regression analysis [12], and residual analysis [13] have been widely utilized to explore the influence of meteorological factors on vegetation cover in past studies [14]. For example, by utilizing a geographically weighted regression model, Yang et al. [15] quantified spatiotemporal changes in vegetation cover in the Loess Plateau. They found that temperature and humidity had a greater effect on crops. Using correlation and residual trend analyses, Leroux et al. [16] found vegetation degradation in some areas of the Sahr region due to anthropogenic impacts and predicted areas of potential future degradation. Barbosa et al. [17] used residual analysis to investigate the drivers of NDVI change in South America and found that human activity had a greater impact on vegetation changes than temperature. Yao et al. [18] defined a new drought resistance index by an exponential fitting curve to characterize the relationships between drought intensity and the corresponding recovery time (the time required for the vegetation to recover to its pre-drought functional state) and showed that the vegetation resilience under drought increased from arid areas to sub-humid areas, with grassland having higher resilience and lower resistance than forested land.
Although the above traditional methods can quantitatively solve the problem of the spatial and temporal characteristics of vegetation, they lack quantitative data analysis for quantitative studies covering multiple influencing factors (e.g., temperature, precipitation, potential evapotranspiration, and the drought index), as well as for studies on the interaction between factors. These factors may be correlated with each other, making it difficult to identify independent variables. These autocorrelated factors could have significant effects on vegetation growth, such as increasing canopy disturbance [19], changing the density of trees of different sizes [20], and making ecosystems more fragile. Zhu et al. [21] found that many studies of drought focused on a single aspect, such as precipitation or temperature, and failed to fully capture the relationship between vegetation activity and integrated drought. In the Loess Plateau, vegetation growth could also have a significant impact on soil and water conservation.
Therefore, this study is aimed at developing a stepwise multifactor vegetation regression analysis (SMVRA) approach by integrating the stepwise linear regression method [22], Standardized Precipitation Evapotranspiration Index (SPEI), Normalized Difference Vegetation Index (NDVI), and Pearson correlation coefficient to investigate the interaction of multiple climate factors on vegetation growth. The novelty of this study is mainly the development of a stepwise multifactor vegetation regression analysis approach based on the method of stepwise regression analysis and the probability distribution of NDVI changes during drought events. Different levels of vegetation loss due to drought and vegetation recovery time after drought were quantified. The results of the research will provide an effective scientific basis for the construction of an ecological environment in the BLR basin. It provides important information for environmental protection and climate change adaptation in the BLR basin. It helps to formulate more precise policies and measures to reduce the potential environmental and economic impacts of drought and to promote sustainable development. The SMVRA approach can be used for investigating the interactive effects of multiple factors upon vegetation. Specifically, the objective entails the following: (i) The SPEI index on various time scales will be computed, and the years with different levels of drought will be selected; (ii) Stepwise regression analysis will be used to identify climatic factors which are significantly associated with NDVI; (iii) The climatic factors used as predictors of NDVI will be determined from regionally averaged Pearson correlation coefficients; (iv) The drought legacy effect will be quantified by calculating the deviation value (i.e., ∆NDVI); (v) The spatiotemporal distribution of multiple factors (e.g., temperature, precipitation, potential evapotranspiration, the drought index and ∆NDVI) will be analyzed to explore the underlying mechanism for the recovery process of vegetation after drought. The aim of this is to inform ecological restoration and conservation efforts in the Northwest Territories under the increasingly frequent occurrence of global extreme climate.

2. Materials and Methods
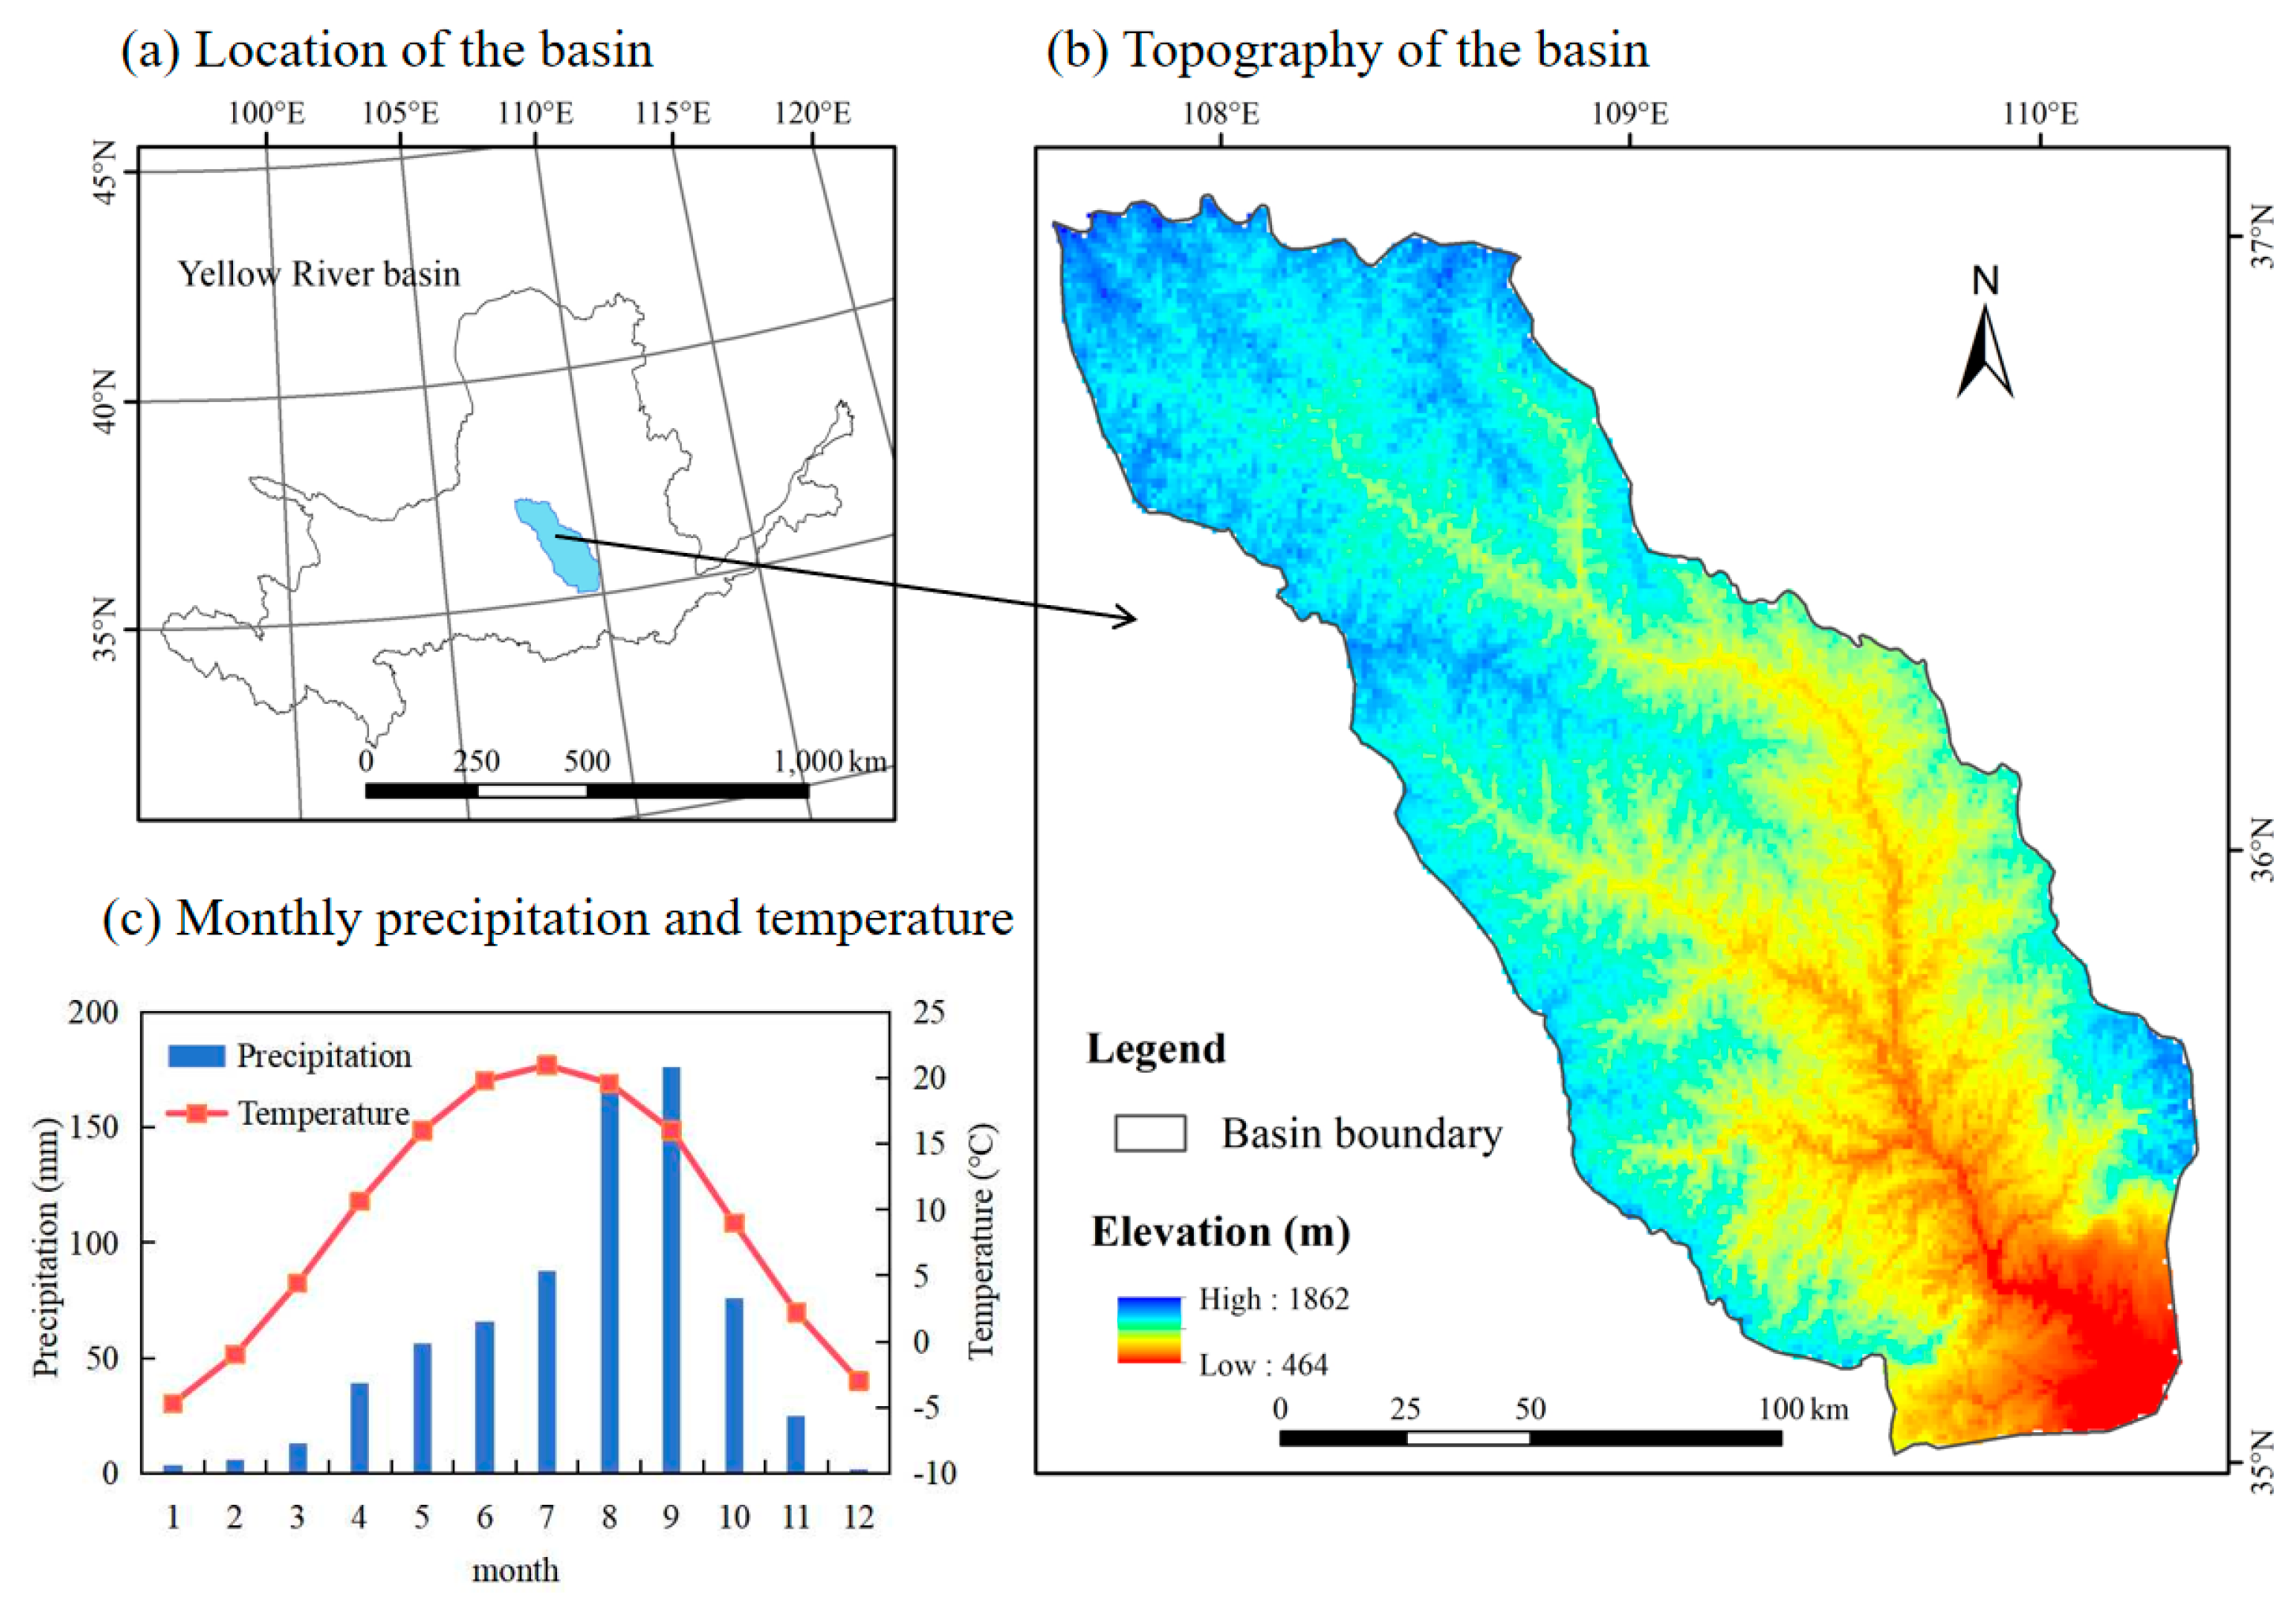
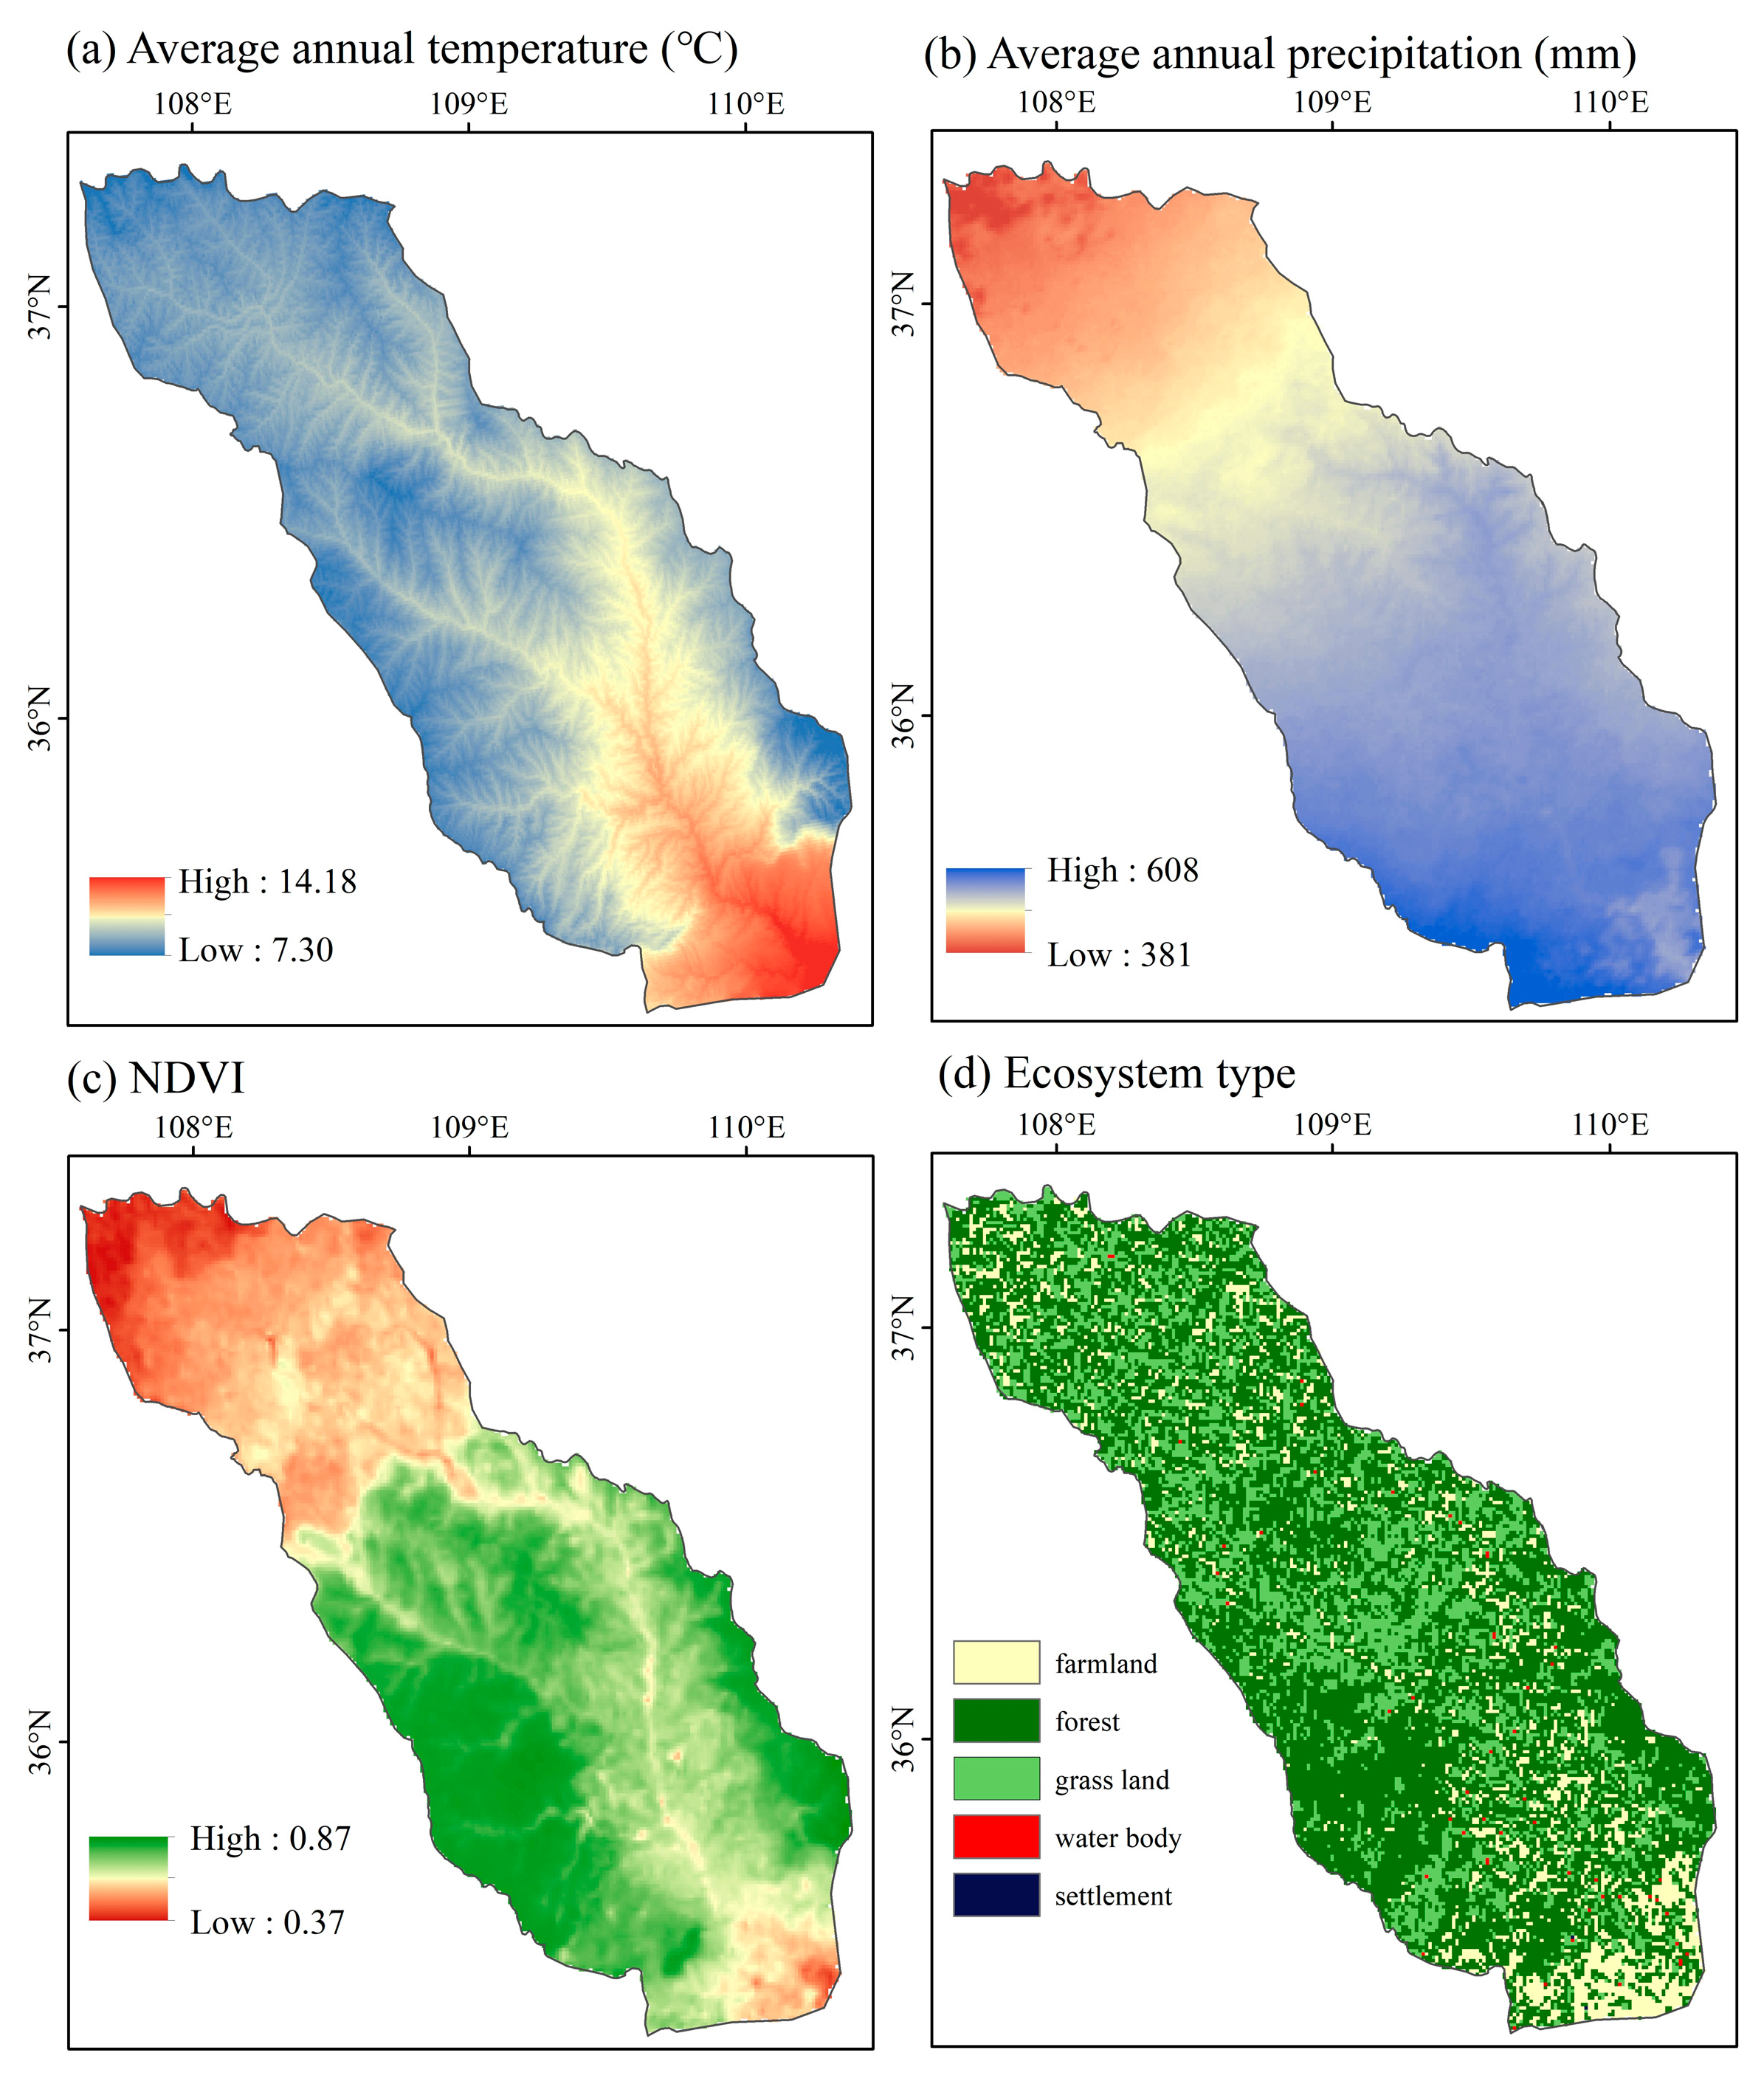
2.1. Study Area

As shown in Figure 1b, the BLR basin is a primary tributary of the Wei River, which is the tributary of the Yellow River. It is 680 km long [23]. Within the basin, the ridges and valleys are undulating, covering a variety of geomorphological zones from the upper reaches to the lower reaches [24]. The continental monsoon climate of the BLR basin is remarkable. Its annual mean temperature is 9.6 °C. Its annual mean precipitation ranges from 510 to 540 mm, mainly from July to September. Water resources in this basin are scarce and unevenly distributed in space and time, with most of the flow coming from the midstream of this river [25,26]. The complex topography, geomorphology and nature of the water resources make the BLR vulnerable to drought. Therefore, it is of great importance for the quality development of agricultural production and society to identify the interactive effects of multiple factors of vegetation under meteorological drought.
The BLR basin is an area prone to drought in northwest China. Enormous impacts have been brought about by drought disasters [27,28]. The impact on the ecosystems of the basin, on agriculture, and on social development in the basin is far-reaching [29]. The climate of the basin became progressively drier between 1960 and 2019. Droughts occurred mainly between 1997 and 2019. The magnitude, extent, frequency, and incidence of droughts in the northwest region increased. Mild and moderate droughts predominated. The effects of the moderate drought of 2000 and the mild drought of 2015 on vegetation cover have been extensively studied. There was relatively high agreement that drought significantly reduced vegetation indices and productivity in the Northwest Territories. Drought responses vary widely between vegetation types. Although some of the results suggested that the vegetation indices and productivity of most vegetation in the Northwest Territories recovered rapidly after this drought event, these conclusions were generally lacking in studies of vegetation growth and ecosystem resilience over longer time scales [30].
Figure 2a,b show the spatial distribution of the multi-year mean precipitation and temperature. They vary considerably for the basin, but both show a spatial pattern of “high in southeast and low in northwest”. High temperatures are accompanied by high precipitation, which is conducive to drought suppression, and in terms of regional distribution, with relatively low precipitation in the upstream zone and relatively high temperatures in the downstream zone. Figure 2c shows that the BLR is rich in vegetation, with more than 50% vegetation cover. The multi-year average NDVI presents a high-to-low distribution pattern from southeast to northwest. Figure 2d shows various kinds of ecosystems in the BLR basin [31,32].

2.2. Data

The data of NDVI, ecosystem types, and the digital elevation model (DEM) were from the website of the Resource and Environment Science and Data Centers, Chinese Academy of Sciences (CAS) (http://www.resdc.cn) (accessed on 14 April 2021). Meteorological data came from the National Tibetan Plateau Data Centre (http://data.tpdc.ac.cn) (accessed on 11 October 2023). As shown in Table 1. All have a spatial resolution of 1 km.
Quarterly NDVI data for Yunnan Province from 2000 to 2020 were synthesized using April–June as the 2nd quarter and July–September as the 3rd quarter [33]. Elements were considered “unvegetated” and not used in the study if their annual mean NDVI value was less than 0.1. To classify the vegetation of the study area, three kinds of vegetation were extracted from ecosystem-type spatial distribution data, namely forest, grassland, and cropland. The downloaded data of the monthly mean precipitation and temperature from the National Tibetan Plateau Data Centre platform are in units of 0.1 °C and 0.1 mm. The data format is the network common data form (NetCDF), and the format is converted to raster (.tiff) format to produce a raster dataset with a spatial resolution of 1 km.

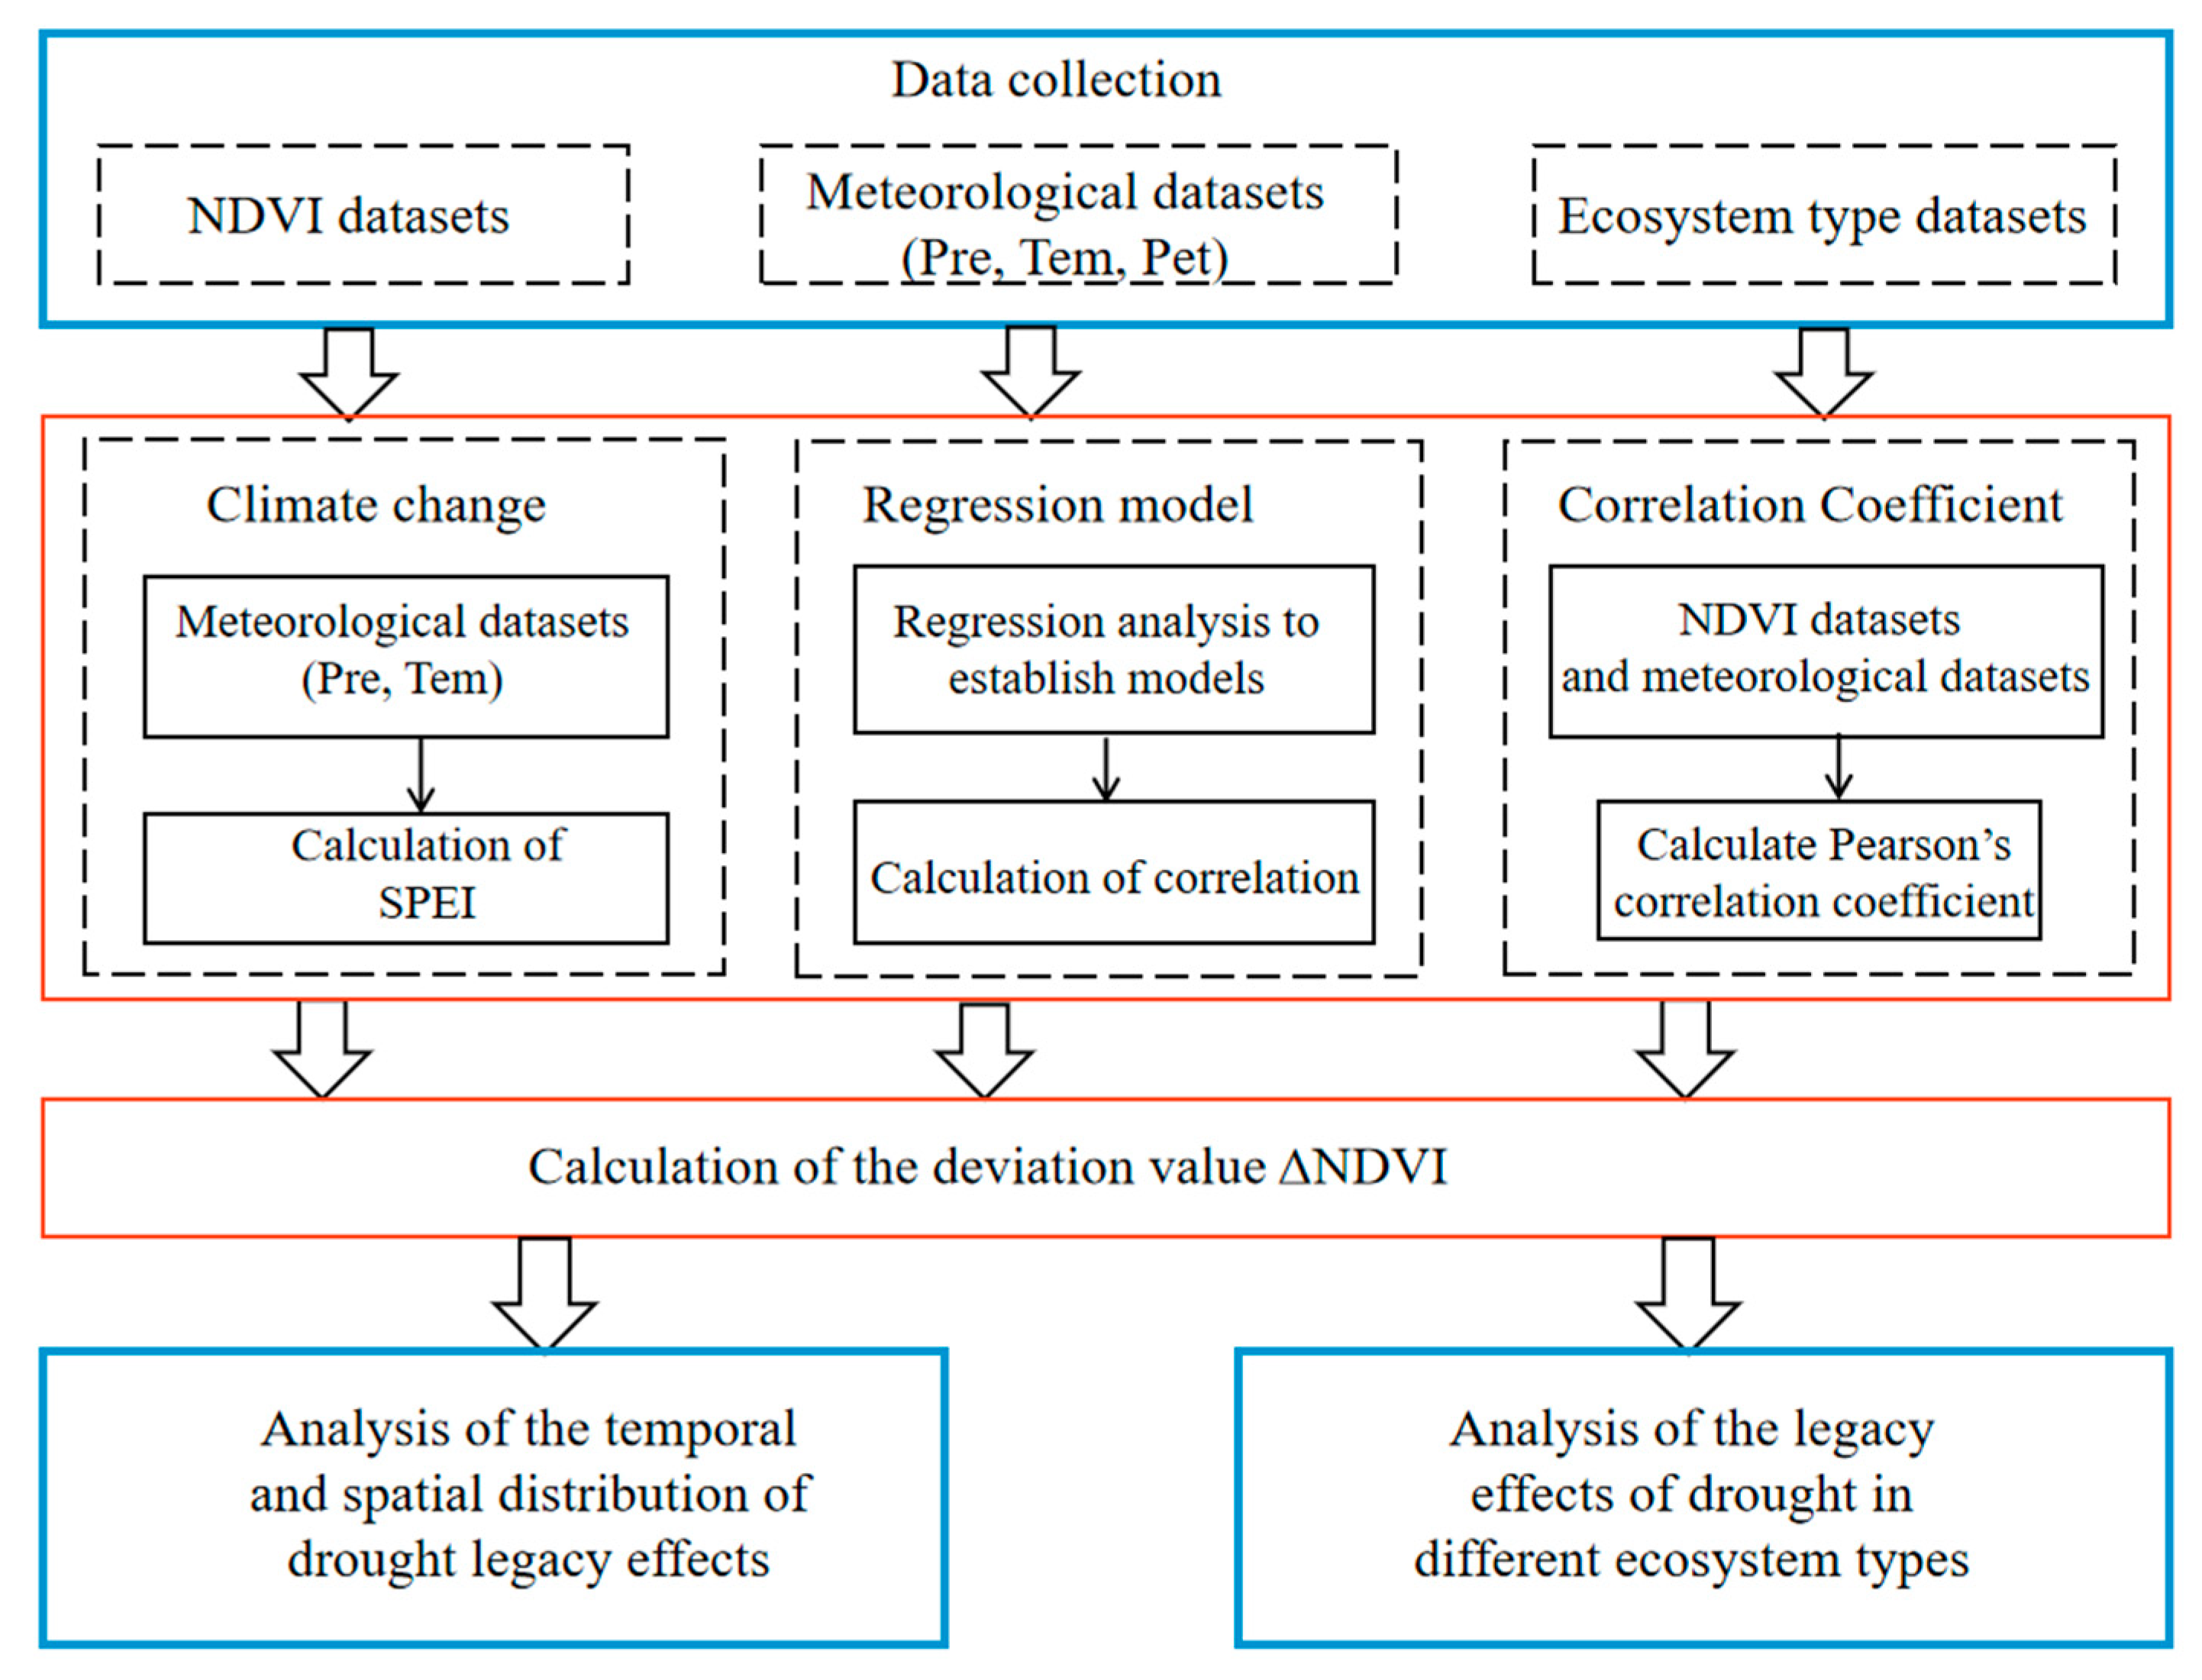
2.3. Stepwise Multifactor Vegetation Regression Analysis (SMVRA) Approach

With global warming, it is now generally agreed that the global hydrological cycle will intensify and that the extremes of drought will become more common and become even more serious, especially since the 21st century. Therefore, a stepwise multifactor vegetation regression analysis (SMVRA) approach was proposed to investigate the interaction of multiple climate factors on vegetative growth in the study area from 2000 to 2020, to provide an effective scientific basis for ecological environment construction in the BLR basin. It provides important information for ecological protection and climate change adaptation in the BLR basin.
A stepwise multifactor vegetation regression analysis (SMVRA) approach is developed after considering the problems encountered in practice. The stepwise linear regression method, SPEI, NDVI, and Pearson correlation coefficient are integrated into the framework of SMVRA. It has advantages in investigating the interaction of multiple climate factors on vegetation growth. Specifically, there are four components. First, the degree of climatic aridity was determined by calculating the SPEI. Second, stepwise regression was used to derive climatic factors that correlated well with NDVI. Third, the climatic factors most highly correlated with NDVI were identified using Pearson’s correlation coefficient. Fourth, to quantify the drought legacy effect, the deviation value ∆NDVI, which characterizes the drought legacy effect, is calculated. By applying the methodology, the study’s calculation process can be successfully implemented to obtain calculation results used to analyze drought legacy impacts. Figure 3 below shows the flowchart of the method.
First, SPEI is an index characterizing the wet and dry states that can be calculated using Pre and PET data on multiple time scales (e.g., 1, 3, 12 months). It was developed from the Standardized Precipitation Index (SPI) by incorporating the effect of PET, making it more suitable than SPI for monitoring drought under climate change [34]. In this study, PET is calculated using the FAO−56 Penman–Monteith equation [35]:
P E T = 0.408 Δ ( R n G ) + γ 900 T + 273 u 2 ( e s e a ) Δ + γ ( 1 + 0.34 u 2 )
where Δ is the slope of the saturated water vapor pressure curve (KPa·°C−1); γ is the psychrometer coefficient (KPa·°C−1); Rn is the net solar radiation [MJ·(m2·d)−1]; G is the soil heat flux [MJ·(m2·d)−1]; T is the daily average temperature (°C); u2 is the average wind speed at 2 m above the surface (m·s−1); es is the saturated water vapor pressure (KPa); ea is the actual water vapor pressure (KPa).
The difference (d) between Pre and PET at month i can be expressed as follows:
d i = P r e i P E T i
According to Vicente-Serrano et al. [36], the three-parameter loglogistic distribution was used for normalizing the d monthly series to obtain SPEI. The cumulative distribution function (CDF) of the three parameters’ logistic distribution is as follows:
F ( x ) = [ 1 + ( α X γ ) β ] 1
where α, β, and γ are the scale, shape, and origin parameters, respectively.
Different kinds of drought conditions are reflected by SPEIs at different time scales. In this study, the SPEI was calculated on a three-month and a twelve-month timescale to obtain SPEI3 and SPEI12. SPEIs in May, August, November, and the next February were utilized to assess spring, summer, fall, and winter drought conditions, respectively. SPEI12 was used to assess interannual changes in drought. The annual changes in the SPEI were relatively stable, which better reflected the interannual evolution of the drought situation. This paper focused on the seasonal and annual evolution of drought in the BLR basin. It is classified according to Table 2 [37].
The stepwise regression method was used to remove several insignificant variables based on the p-value test. The final stepwise regression equation with each variable significant is obtained. The stepwise regression equation is listed as follows [38].
{ y 1 = β 0 + β 1 x 11 + β 2 x 12 + + β p x 1 p + e 1 y 2 = β 0 + β 1 x 21 + β 2 x 22 + + β p x 2 p + e 2 y 3 = β 0 + β 1 x n 1 + β 2 x n 2 + + β p x n p + e n
where β 0 , β 1 ,   ,   and   β n are p + 1 parameters to be estimated, x 0 , x 1 ,   ,   and   x n are p general variables, and where e 0 , e 1 ,   ,   and   e n are set to be n random variables that are independent of each other and follow the same normal distribution n (0, δ). For simplicity, this model is written in matrix form:
y = X β + e
where y, β, and e are vectors, and these vectors are formulated as follows:
y = ( y 1 y 2 y n ) , β = ( β 1 β 2 β n ) , e = ( e 1 e 2 e n )
In the results of the stepwise regression analysis, the significance of each index is as follows. B is a non-standardized regression coefficient; Beta is the standardized regression coefficient; t is used to determine whether X is meaningful to Y. If the corresponding p value is less than 0.05, X has an effect on Y; if the p value corresponding to the t-test is less than 0.05, this indicates that the corresponding X has a significant effect on Y; VIF is a collinearity index, which if less than 10 shows that the model has no multi-collinearity problem; R2 is the explanatory power of the model; if the D-W value is near 2, there is no autocorrelation, and the model is well constructed.
Third, the correlation between climatic factors and NDVI was examined for each pixel in the study area using Pearson’s correlation analysis. Quarterly data of precipitation (PRE), potential evapotranspiration (PET), and the meteorological drought index (D) were selected and correlated with NDVI data for the same period. The correlations were tested for significance. The D index is the difference of precipitation with potential evapotranspiration (D = PREPET) [39]. Considering that the accuracy of vegetation growth prediction will be affected directly by the correlation of climate factors with NDVI, the study will select climatic factors with higher correlation coefficients with NDVI for vegetation growth prediction.
Fourth, the drought legacy effect is quantified using the deviation ∆NDVI between the observed vegetation growth (based on NDVI remote-sensing data) and predicted vegetation growth (according to the linear relationship of climatic factors with NDVI) within one to five years following an extreme drought [40].
Δ N D V I = N D V I o b s e r v e d N D V I p r e d i c t e d
where NDVIobserved and NDVIpredicted are observed and predicted NDVI values, respectively. NDVI was predicted using the linear regression prediction method. According to the univariate linear regression equations constructed from NDVI and climatic factors between 2004 and 2013, the measured climate factors of each pixel for the years 1999–2004 and 2014–2018 are included in the following equation:
N D V I p r e d i c t e d = A × F a c t o r c l i m a t e + B
where Factorclimate is the measured climate factor after the extreme drought. A and B refer to the linear fit coefficients of time series of NDVI and climate factors before and after the extreme drought.
If ΔNDVI < 0, it means that the vegetation is negatively inhibited from growing. If ΔNDVI > 0, it means vegetation growth is not influenced by the drought. Mean values of ΔNDVI were calculated for all pixels and pixels with a remarkable positive correlation (p < 0.05) of NDVI with climate factors in the area of study. In addition, differences in vegetation heritage effects in various ecosystems were analyzed comparatively.

3. Results

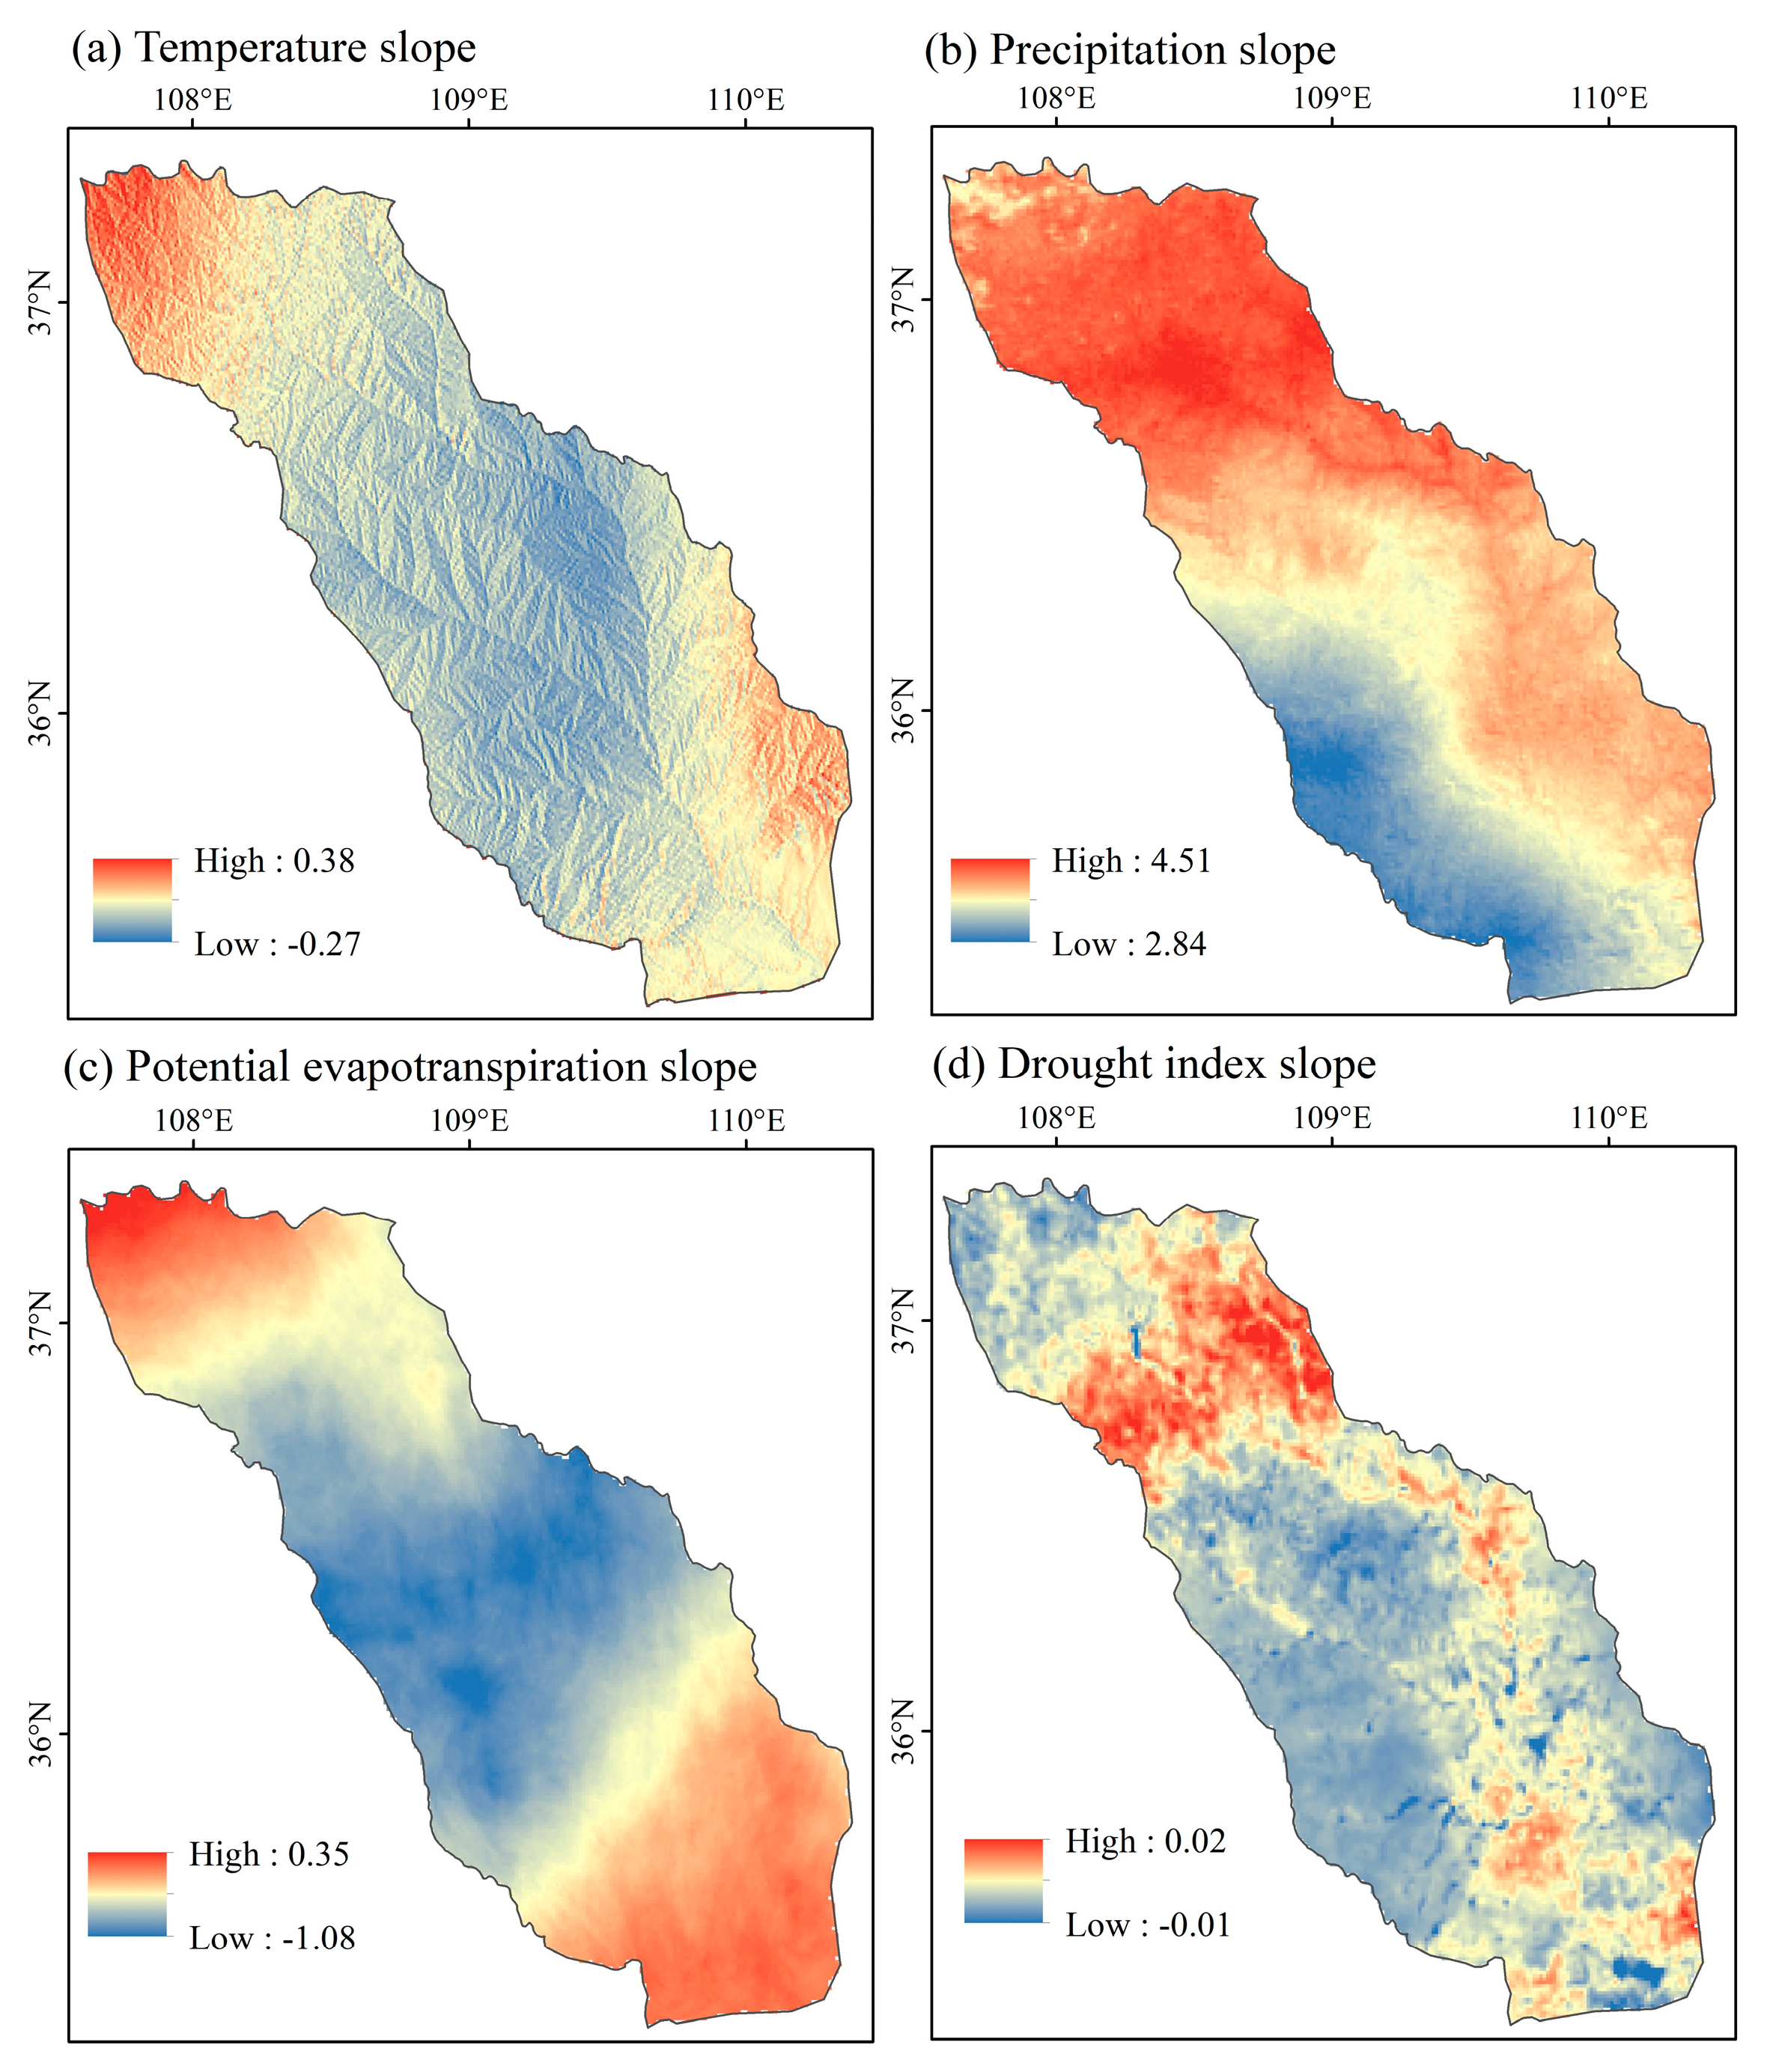
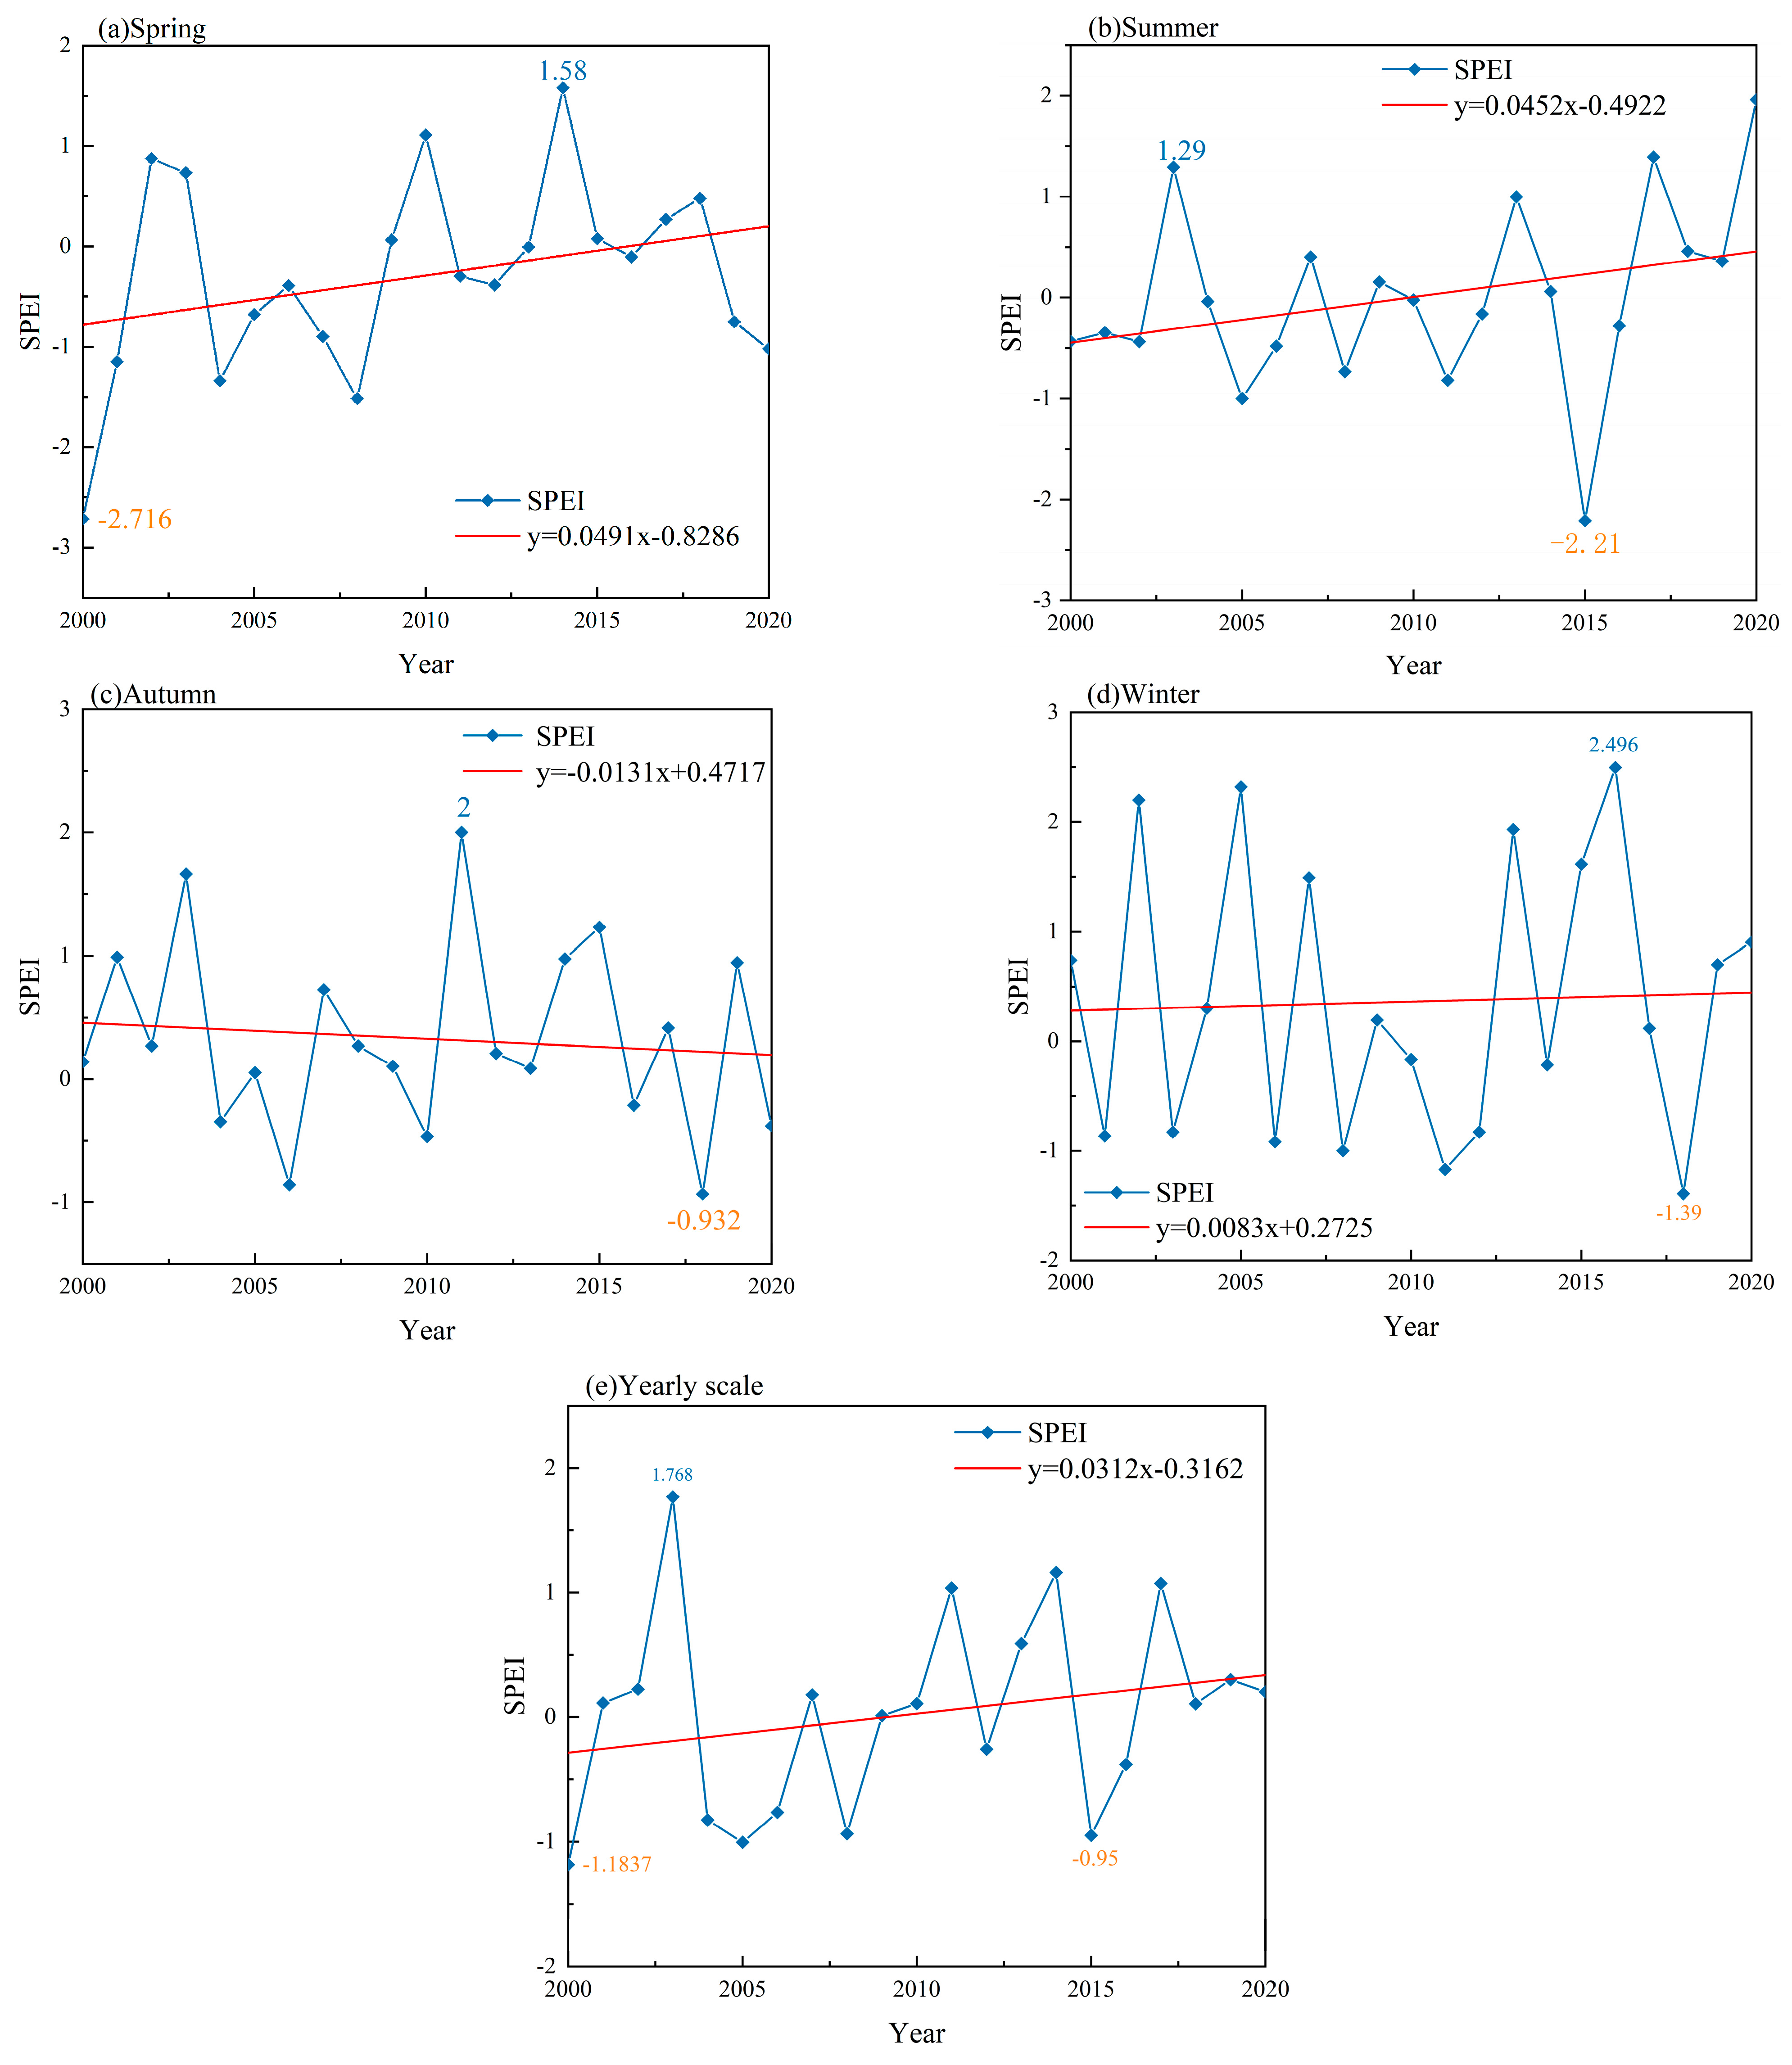
3.1. Spatiotemporal Variability of Climatic Conditions in the BLR Basin

Between 2000 and 2020, the BLR basin generally shows an increase in annual mean temperature, annual precipitation, and annual aridity index and a decrease in annual potential evapotranspiration. The multiannual mean temperature varied between 9 and 11 ℃, with an overall trend towards a significant increase in temperature (Figure 4a). In contrast, the trend in precipitation is relatively smooth, with an overall non-significant increasing trend. The mean annual precipitation fluctuates smoothly in the range from 400 to 800 mm (Figure 4b). In the study area, the potential evapotranspiration displays a downtrend, fluctuating above and below 1050 mm, contrary to the trend of the temperature and precipitation elements (Figure 4c). The drought index has largely stabilized (Figure 4d).
Trend analysis of temperature, precipitation, potential evapotranspiration, and the drought index from 2000 to 2020 in the BLR basin. Spatially, as shown in Figure 5, the climatic elements increase more significantly in the upstream zone, with a decreasing trend in the mid-stream zone and a more gradual decrease in the downstream zone.
The SPEI index on various timescales was computed, and the years with different levels of drought were selected. The SPEI magnitude reflects the drought class and the drought severity. The SPEI change trend reflects the trend of drought development. The figures show the variation in the SPEI time series on various scales in the BLR basin between 2000 and 2020.
To provide a more precise description of the drought situation in the BLR basin, we present an example of SPEI3 analysis. This allows for the study of changes in seasonal meteorological drought characteristics within the BLR basin. From Figure 6, the minimum SPEI value in spring occurred in 2000, with a value of −2.716. The minimum SPEI value in summer occurred in 2015, with value of −2.21. The minimum SPEI value in autumn occurred in 2016, with a value of −0.932. The minimum SPEI value in winter occurred in 2016, with a value of −1.39. SPEI at the seasonal scale shows that the most severe drought occurred in the spring of 2000 with an SPEI of −2.716. The spring of 2000 and the summer of 2015 experienced extreme droughts. A severe drought took place in the spring of 2008. There were moderate droughts in the spring of 2001, 2004, and 2020, in the summer of 2005, and in the winter of 2008, 2011, and 2018. Mild, moderate, severe, and extreme droughts accounted for 13.1%, 8.3%, 1.2%, and 2.4%, respectively.
The annual SPEI (Figure 6e) shows that the overall trend of drought in the BLR basin is upward with a propensity rate of 3.12 × 10⁻². Moderate drought occurred in 2000 and 2005, and mild drought occurred in 2004, 2006, 2008, and 2015, with the percentage of mild and moderate drought events being 9.5% and 19%, respectively.
To choose the representative years and prepare for the next phase of resilience calculation, we assessed the SPI12 value and percentage of areas affected by mild and moderate droughts. The remaining years with mild and moderate droughts were determined based on the SPI12 value. The years of moderate drought in the BLR basin were 2000 and 2005, with SPI12 values of −1.18 and −0.95, respectively. In those years, the proportion of the moderate drought zone to the total zone was 59% and 27%, respectively. Therefore, 2000 was selected as the representative year of moderate drought in the BLR basin. Similarly, 2015 was selected as a mild drought year.

3.2. Stepwise Multifactor Vegetation Regression Analysis

Stepwise regression analysis will be used to identify climatic factors, which are significantly associated with NDVI. Stepwise regression was used for predictive analysis and the model passed the F-test, indicating that the model is valid. The regression results show that precipitation, temperature, and the drought index have a significant positive relationship with NDVI. As shown in Table 3.
The results of the average Pearson correlation coefficient in the region are shown in Table 4. There is a comparison of the results of the mean Pearson correlation coefficients of climatic factors with NDVI of each image element in the study area for the years 2000–2020. The correlations of different climatic factors with NDVI varied considerably over time. Precipitation (PRE) has a higher positive correlation (0.517) with NDVI in spring (April–June) than in autumn (July–September). This indicates that the trends of April–June precipitation and NDVI are consistent. The higher the correlation coefficient, the higher the consistency.
Figure 7a shows the spatial distribution of the correlation coefficients of the April–June PRE with NDVI at the pixel level for the BLR basin in the study area from 2000 to 2020. Positive correlations were mostly concentrated in the midstream and upstream zones. The downstream zone showed mostly insignificant and significant negative correlations. In the study area, 34.93% of the total elements presented a strong positive relationship (p < 0.05).
Figure 7b shows a spatial distribution map of precipitation anomalies during the occurrence of moderate drought. By comparison, regions with severely reduced precipitation are the same as those with higher correlation coefficients. Because positively correlated pixels are widely distributed within the moderate drought zone, precipitation can be used as a predictor of NDVI.
The spatial distribution of the correlation coefficients between the April–June drought index and NDVI at the pixel level for the BLR basin of the study area from 2000 to 2020 is shown in Figure 7c. Figure 7d shows a spatial distribution map of drought index anomalies during the occurrence of moderate drought.
The spatial distribution of correlation coefficients between the April–June temperature and NDVI at the pixel level for the BLR basin of the study area from 2000 to 2020 is shown in Figure 7e. Figure 7f shows a spatial distribution map of temperature anomalies during the occurrence of moderate drought.

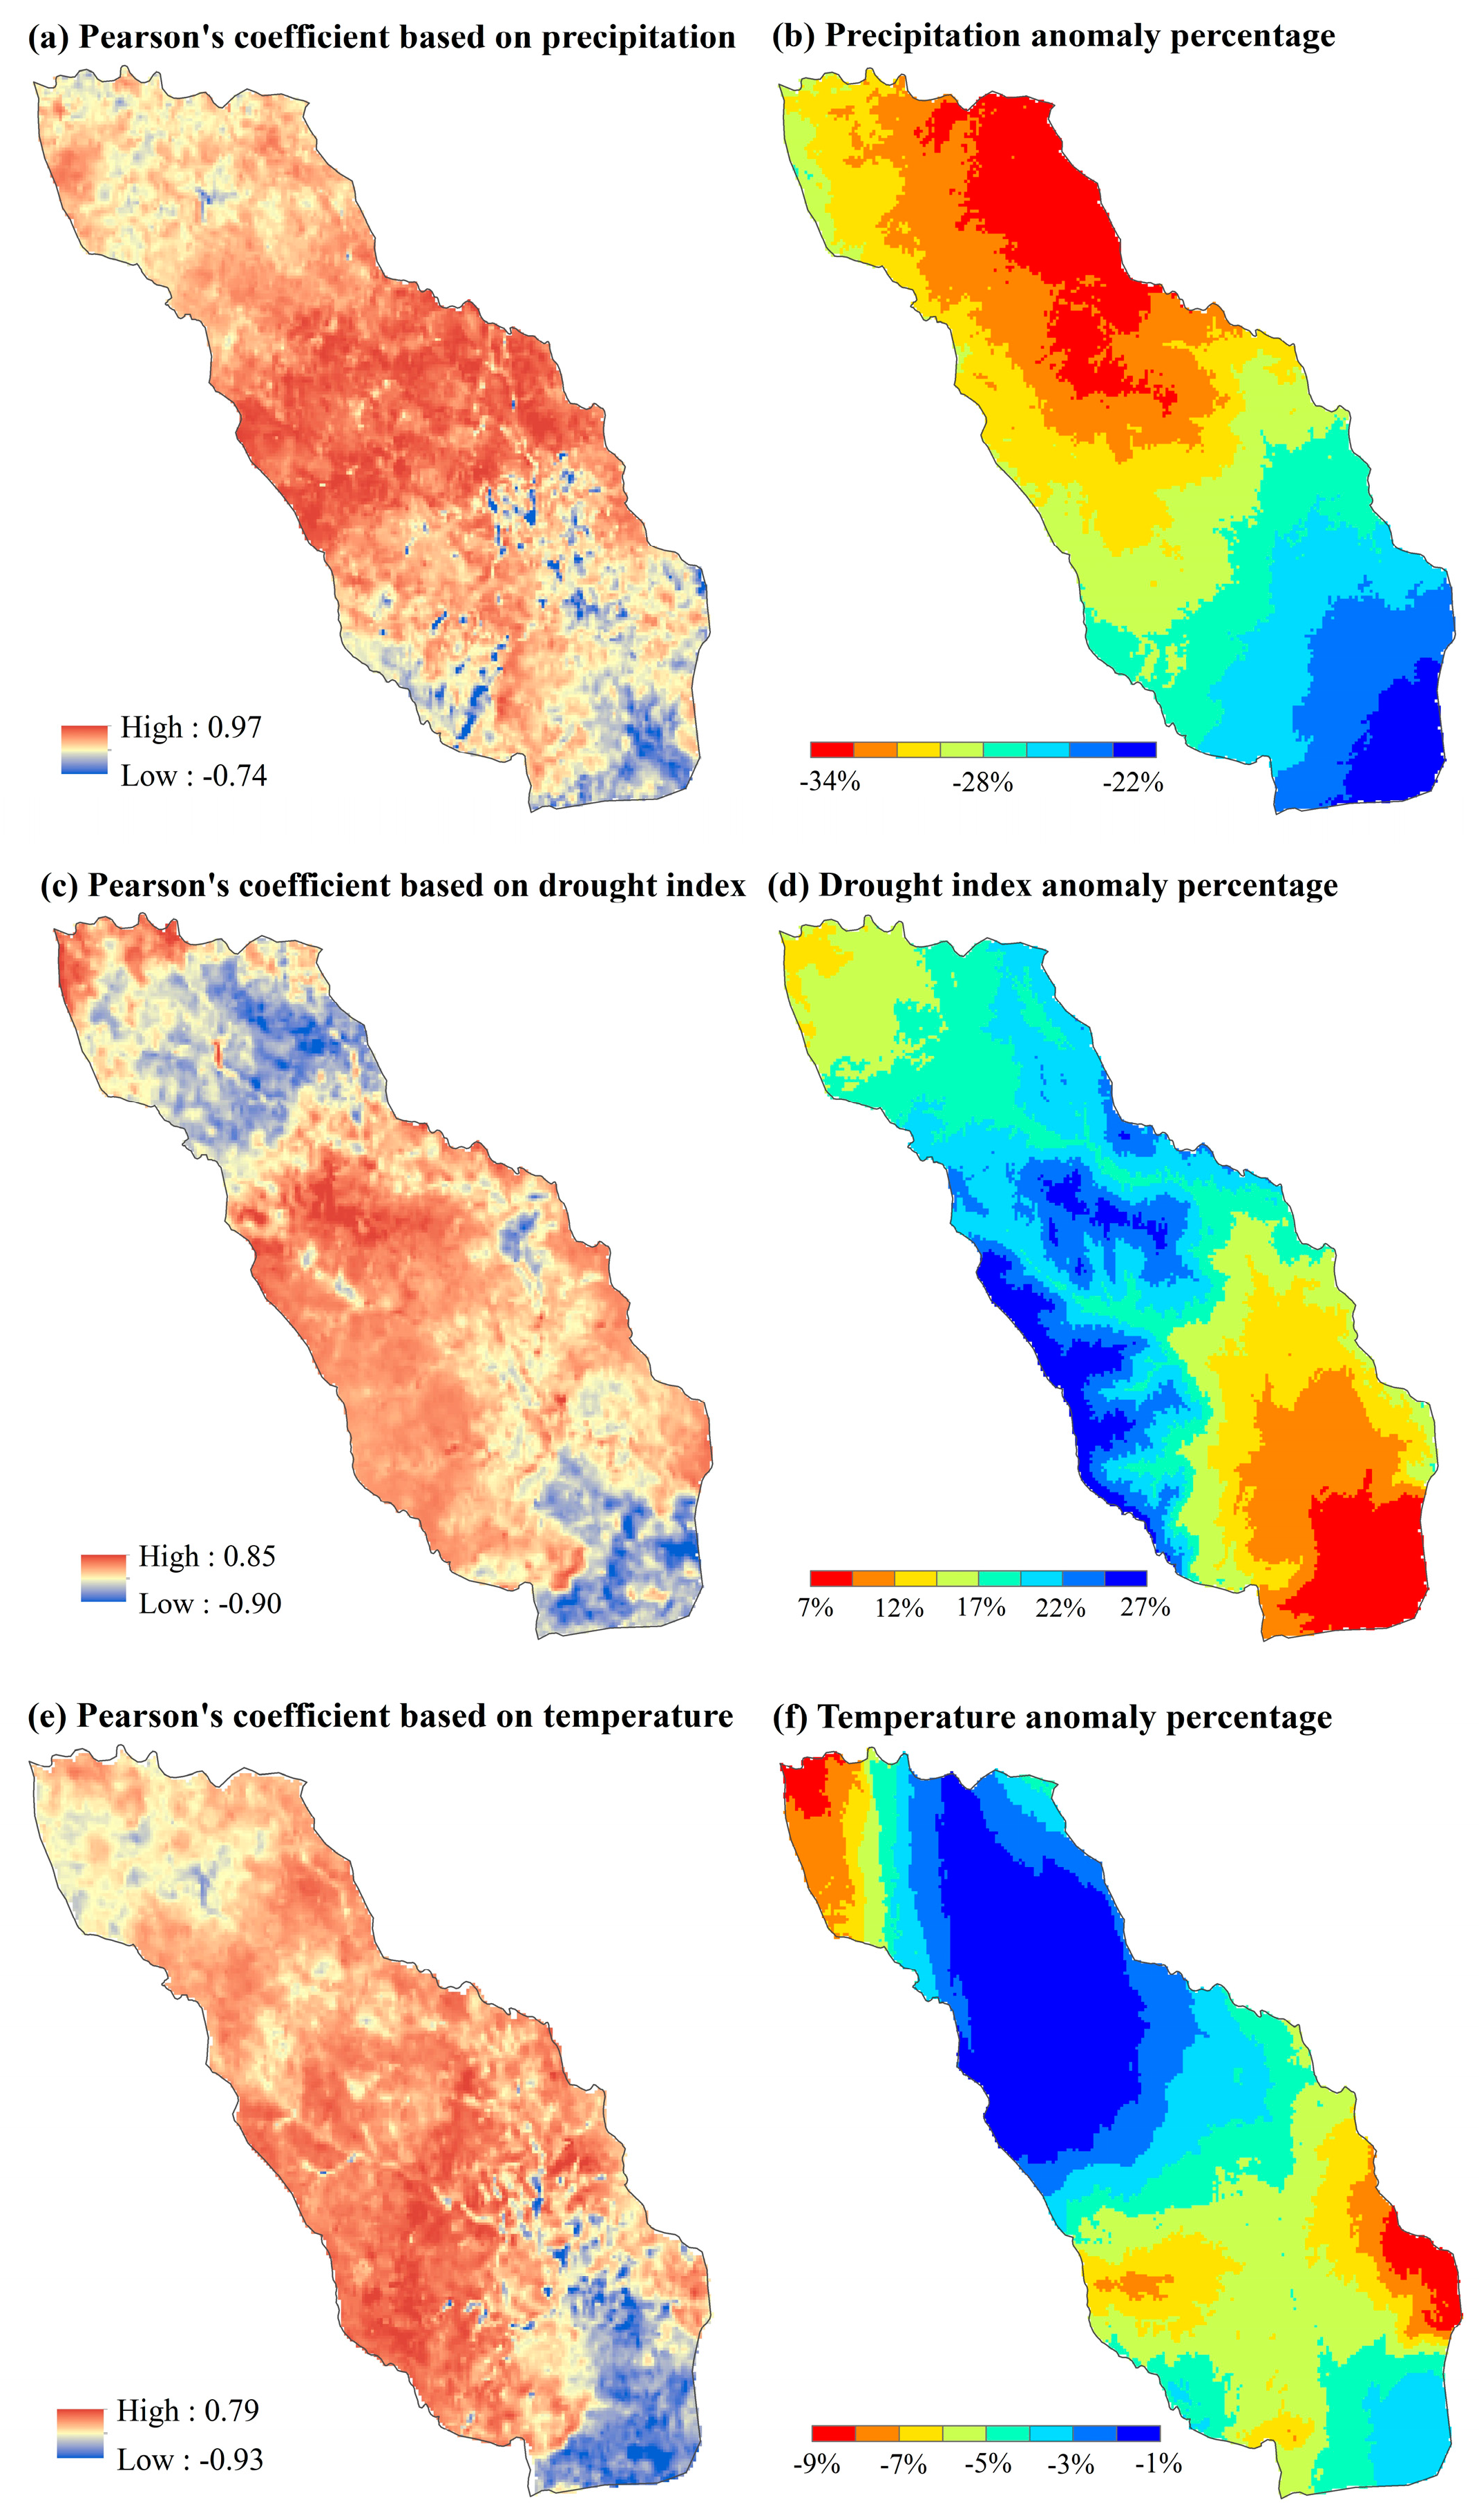
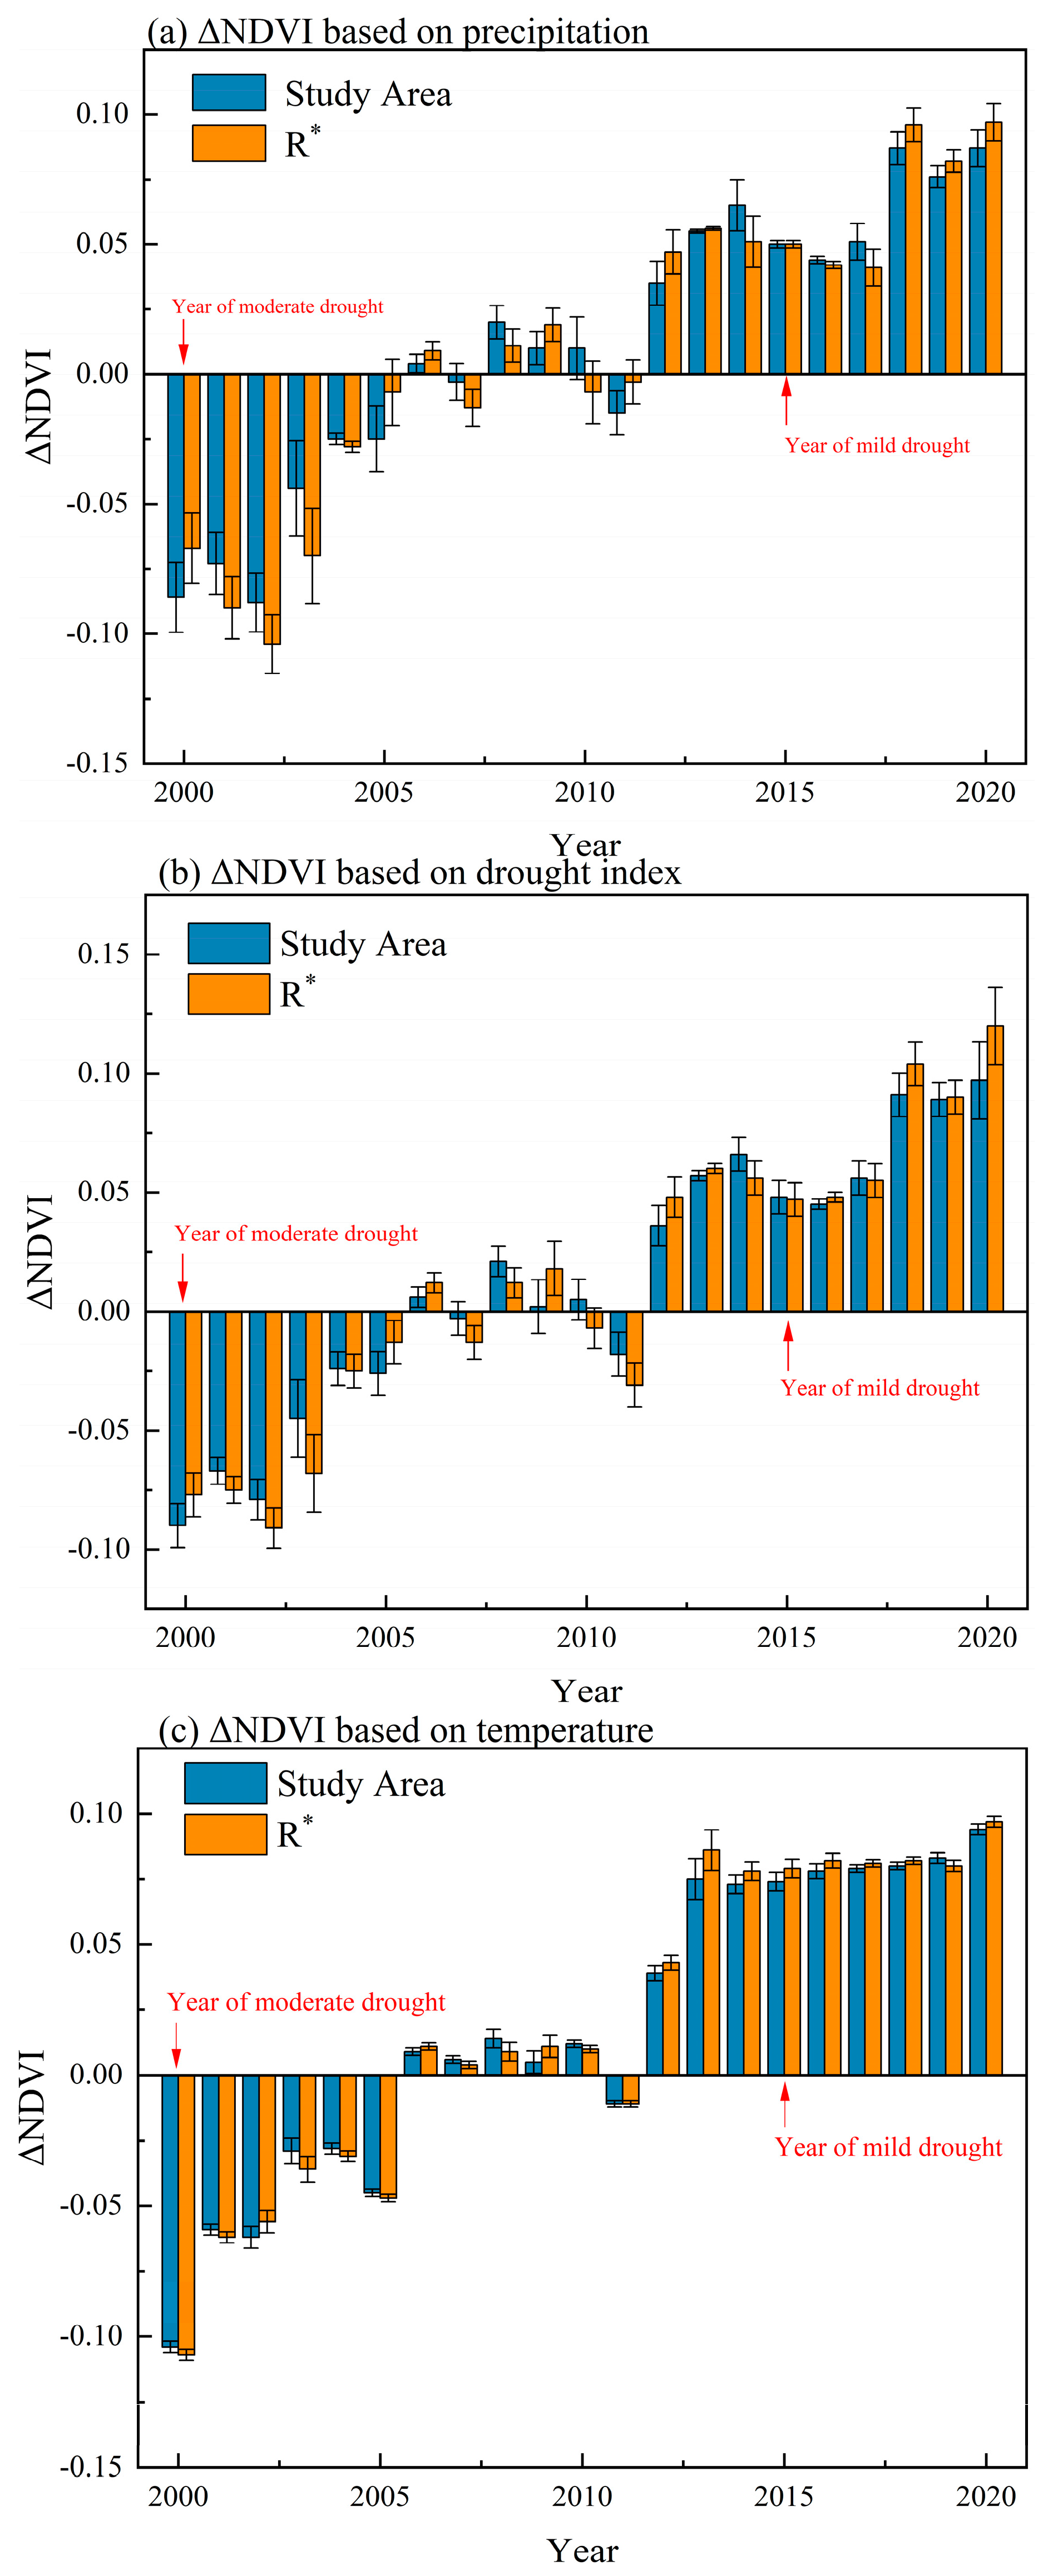
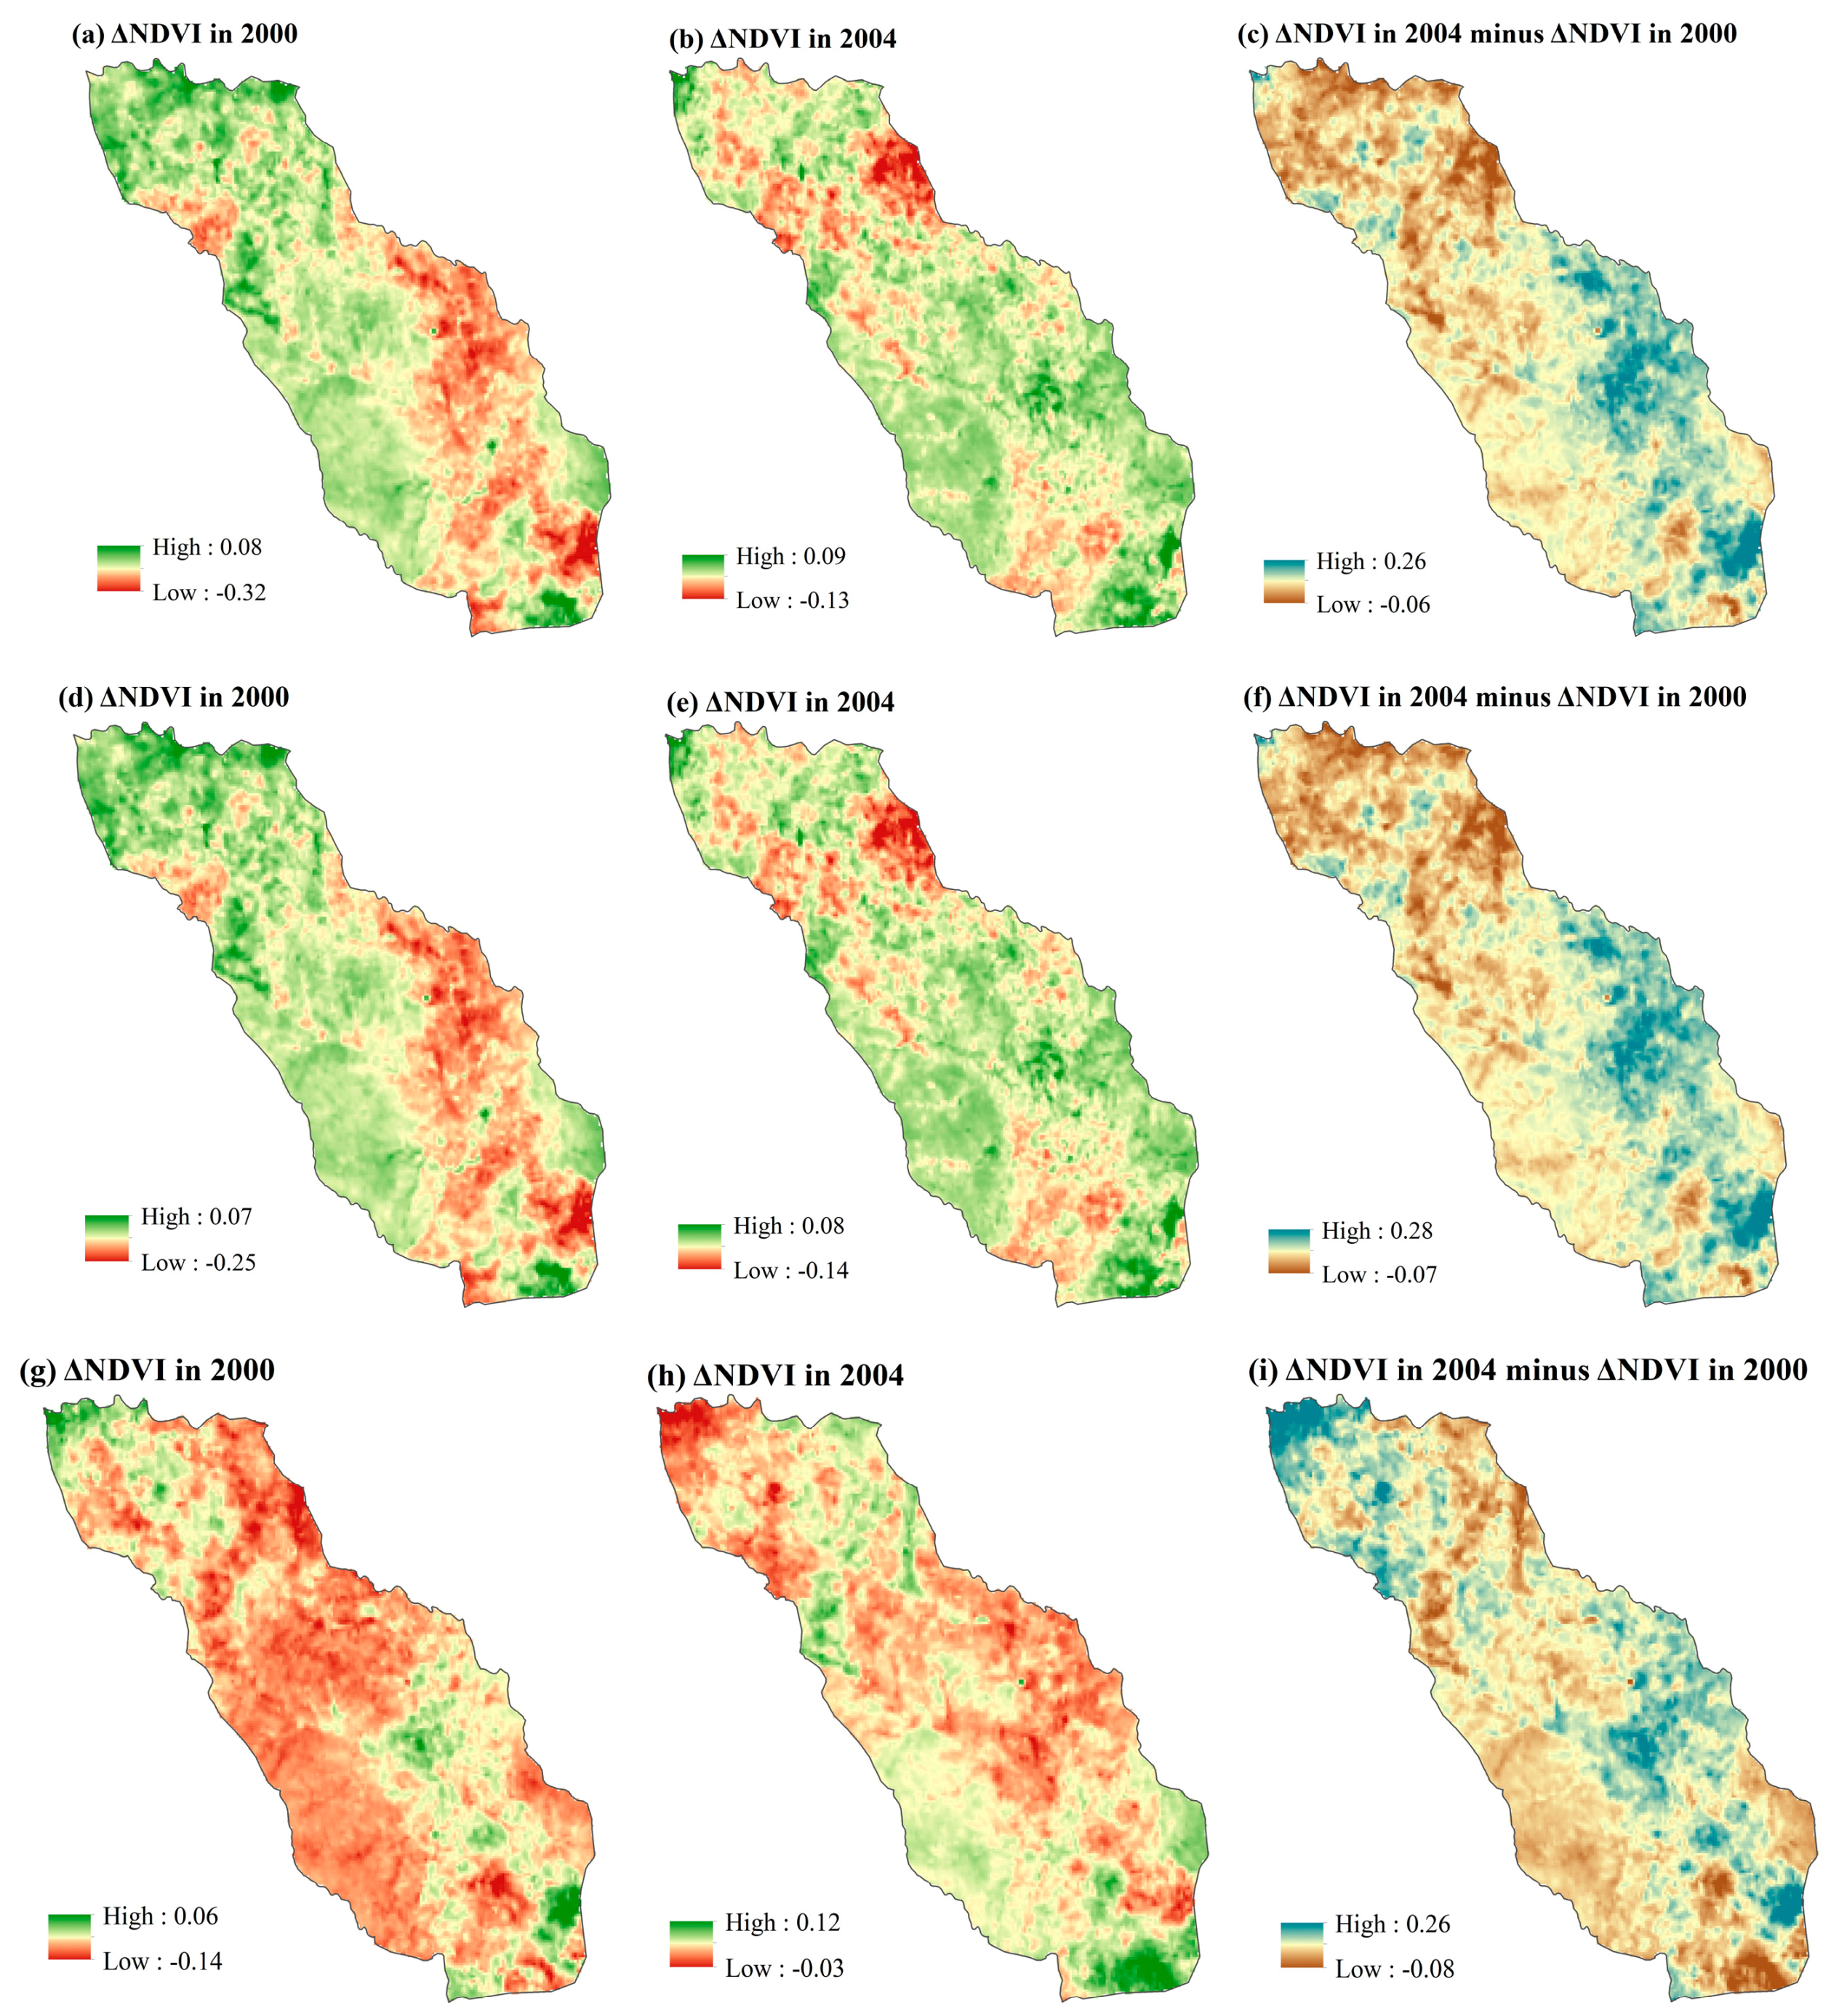
3.3. Spatiotemporal Distributions of Interactive Effects on Vegetation Recovery

The results analyzed from SMVRA showed that precipitation and the drought index were significantly and positively correlated with NDVI. Precipitation and drought indices can be used as predictors of NDVI. To examine the overall situation of vegetation growth in the BLR basin affected by different degrees of drought, mean values of ΔNDVI were calculated for all pixels in the research area and for pixels with a remarkable positive correlation of NDVI with precipitation (R* and p < 0.05). When calculating ΔNDVI projections for 2000–2004 and 2015–2018, the more significant the correlation between precipitation and NDVI, the more accurate the prediction of NDVI and the more accurate the results of legacy effects.
A comparison of the mean values of pixels with different correlations in Figure 8a shows that in the years following the moderate drought of 2000, the actual NDVI values were lower than predictions for the vast majority of pixels of the research area (69% and 66% of the total pixels quantity, respectively). This indicates that vegetation growth was inhibited from meeting normal expectations. The more significant the positive correlation, the greater the inhibition of vegetation growth. By the fifth year after the onset of the moderate drought, the mean predicted values of vegetation growth were almost identical to the actual values. It shows that the vegetation had shown signs of recovery from the inhibitory effects of the moderate drought. In year 6, the actual NDVI values for the region as a whole were higher than predicted. It shows that the suppression of vegetation growth is no longer continuing. Overall, the legacy effects of the moderate drought event of 2000 persisted for about four years in the BLR basin and negatively affected the native vegetation.
Figure 8a also shows that in the years following the onset of the mild drought in 2015, the vast majority of pixels in the study area had higher actual than predicted NDVI values. This suggests that following a mild drought in the BLR basin, vegetation growth was not inhibited. In the third year, ΔNDVI increased significantly compared to the previous two years, indicating the rapid growth of vegetation in this period. The same trend can be seen from the results calculated using the drought index and temperature as predictors, as shown in Figure 8b,c.
Figure 9 shows the spatial distribution of the legacy effect of the moderate drought in 2000. It can be seen that the main area where vegetation growth was inhibited in 2000 was the southeastern region. The effect on the upstream region is small. The main area where vegetation growth was inhibited in 2004 was the upstream area. The recovery of vegetation growth was spatially heterogeneous, and vegetation growth was basically recovered in 2004. The results calculated using the drought index and temperature as predictors also showed that plant growth was basically restored in 2004. The recovery process of vegetation after mild drought in 2015, as shown in Figure 10, showed that plant growth was basically restored in 2018.
The vertical spatial distribution of drought legacy effects is described, extracting the pixels of NDVI with significant positive correlation (R*) with precipitation. The statistical results of ΔNDVI for each elevation section in the range of 0–1800 m with 200 m as the interval segment are shown in Figure 11a. As can be seen in Figure 11, the trends in vegetation growth with elevation gradient were basically the same in 2000 and 2001. Vegetation growth is most affected by drought around 800 m above sea level. Inhibition decreases with increasing altitude. This altitude range is characterized by river valleys and low-lying areas, which are areas with a high concentration of human activity. This altitude range is characterized by river valleys and low-lying areas, which are areas of a high concentration of human activity. Figure 11b shows that no drought legacy effect was observed. The same trend is seen in the results calculated using the drought index as a predictor in Figure 11c,d.
The results analyzed from SMVRA showed that precipitation and the drought index can be used as predictors of NDVI. The region studied consisted of forest, grassland, agricultural, and other habitats, which accounted for 44%, 41%, 9.8%, and 5.2% of the total pixels, respectively. Calculation of the mean ΔNDVI values for each vegetation type showed that vegetation was suppressed in all three ecosystem types during the first years after drought. The differences in drought legacy values between ecosystem types were small. However, in the first few years, the ΔNDVI values of forest vegetation in the R* quadrant were lower than those of grassland and cropland, suggesting to some extent that the growth of forest vegetation was more inhibited and its legacy would last for a relatively longer time. As shown in Figure 12.

4. Discussions

Other studies of the effects of the drought legacy have been carried out in parts of China. Among them, Li et al. found a 1-year drought legacy effect on the Qinghai-Tibet Plateau [41,42]. Ma et al. observed a 3-year drought legacy effect in north China [43,44]. In northeast China, Yu et al [45]. found that the effects of drought on forests lasted at least 4 years. The specific manifestation of the drought legacy effect (suppressed vegetation growth) found in the BLR basin in this study is consistent with previous findings. There are differences in duration. Differences in the duration of drought legacies indicate that vegetation’s reaction in terms of its growth toward droughts varies on the regional scale.
The response of vegetation to drought includes the recovery rate of vegetation after drought, that is, resilience [46]. The rate of vegetation recovery after drought is affected by the severity of the drought, hydrological characteristics, and climatic conditions [47]. The results of this study show that there are obvious spatial differences in the recovery of vegetation after drought. The recovery time is longer at higher elevations due to changes in environmental conditions at small spatial scales (e.g., reduced soil water-holding capacity) [48]. For example, the results of this study show that forest vegetation has the longest recovery time after drought, and related studies have also confirmed that forest ecosystems are more affected by drought. There are many factors that influence the vegetation recovery time after drought, including the severity and duration of drought, human intervention during severe drought, vegetation types, and changes in environmental conditions [49]. These factors affect the resilience of vegetation to drought stress. This influences the sensitivity of vegetation to drought. The results of this study show that forest vegetation has the longest recovery time after drought, and related studies have also confirmed that forest ecosystems are more affected by drought. This is because the drought period leads to the slower growth of woody plants, and the recovery time is longer after the vegetation has been severely damaged. It also suggests that carbon allocation takes precedence over the recovery of photosynthesis rather than the growth of plant stem and leaf biomass. The recovery rate and growth capacity of grassland are faster than those of forest vegetation [30]. Grassland and farmland are more resistant to drought than forests [50]. However, after severe drought, the recovery time of grassland and farmland is close to that of forest vegetation.
The limitations of this study are that the change in total NDVI before and after drought is caused by drought factors and non-drought factors. Changes in NDVI caused by non-drought factors should be taken into account [51]. During severe drought, soil moisture is supplemented by irrigation, drainage, and other forms of human intervention [52]. These measures could mitigate the adverse effects of drought on the growing season. In this case, the impact of human activities has been included in the changes in total NDVI before and after the drought [53]. In future works, we should identify the effects of human activities (e.g., using drought indices that include human impacts) to quantify the dynamic changes of vegetation after drought.
Differences in data quality can also have an impact on the results. There is a gap in spatial resolution between meteorological data and NDVI. All data are interpolated to a relatively coarse resolution, which cannot reflect the problem of drought and vegetation heterogeneity in the local grids [54]. The NDVI obtained from remote-sensing data can be affected by the atmosphere, clouds, and sun-angle. Although the maximum synthesis method is used to eliminate these errors to some extent, data accuracy still has an impact [55]. To ensure the reliability of future studies, multiple meteorological datasets should be collected or data collection equipment should be upgraded to improve spatial resolution and reduce uncertainty. The differences in the response of different vegetation types to drought can also be compared since different types of droughts could spread between different hydrological and climatic zones.

5. Conclusions

An analysis of stepwise multifactorial vegetation regression (SMVRA) was developed to investigate drought’s impact on vegetation. By utilizing meteorological and NDVI data from 2000 to 2019, the duration of the drought legacy effect in the North Loch Basin was analyzed, as well as how different vegetation types responded. Specifically, we classified drought classes in the North Loch Basin by year and season according to Standardized Precipitation Evapotranspiration Index (SPEI). Stepwise regression analysis, together with the Pearson correlation coefficient, was applied to identify the meteorological factors used as predictors. The drought legacy effect was quantified by calculating the NDVI deviation from multiple climatic factors ΔNDVI to investigate the spatial and temporal distribution of ΔNDVI in the BLR basin.
The results analyzed from the SMVRA show that in the BLR basin, SPEI3 shows a non-significant decreasing trend in autumn and a non-significant increasing trend in other seasons. In addition, SPEI12 shows that the overall trend of drought in the BLR basin is increasing with a propensity rate of 3.12 × 10⁻². Moderate drought occurred in 2000 and 2005, and mild drought in 2004, 2006, 2008, and 2015, with the percentage of mild and moderate drought events being 9.5% and 19%, respectively.
Precipitation, temperature, and the drought index have a significant positive relationship with NDVI. Precipitation and NDVI had a strong positive correlation (p < 0.05) found for 34.93% of the total pixels in the study area. The distribution of pixels with high correlation coefficients is generally consistent with areas affected by drought. It can be used to predict NDVI after drought events. Vegetation growth in the BLR basin is inhibited in the 4 years following a drought event. The affected areas are concentrated geographically and horizontally in the middle and higher parts of the region, where precipitation is greatly diminished. The area near 800 m is where vegetation is most sensitive to drought events.
This paper focused on precipitation, temperature, and humidity as drivers of vegetation cover change, with insufficient quantitative research and analysis on human activity. This research just focused on the impacts of multiple climatic factors on vegetation, without analyzing soil drought. However, plants can grow normally during periods of low rainfall, as the soil may not be lacking in water. The role of soil drought on vegetation growth will be explored in further studies. In addition, the impacts of soil, topography, geology, and socio-economic development on drought need to be further investigated.

Author Contributions

J.F.: formal analysis, supervision, and writing—original draft. Y.Z.: data curation, formal analysis, and writing—original draft. X.Z. and D.W.: conceptualization, methodology, and supervision. Y.L., W.Z., F.X. and S.W.: investigation and validation. All authors have read and agreed to the published version of the manuscript.

Funding

This study was collectively supported by the National Natural Science Foundation of China (Grant No. 52209013), the Department of Education of Hebei Province (Grant No. ZD2022085), and the Fundamental Research Funds for the Central Universities (Grant No. 300102293508).

Institutional Review Board Statement

Not applicable.

Informed Consent Statement

Not applicable.

Data Availability Statement

The datasets analyzed during the current study are available from the corresponding author upon reasonable request.

Conflicts of Interest

The authors declare no conflict of interest.

References

  1. Yan, J.; Zhang, G.; Deng, X.; Ling, H.; Xu, H.; Guo, B. Does climate change or human activity lead to the degradation in the grassland ecosystem in a mountain-basin system in an arid region of China. Sustainability 2019, 11, 2618. [Google Scholar] [CrossRef]
  2. Lei, H.; Yang, D.; Huang, M. Impacts of climate change and vegetation dynamics on runoff in the mountainous region of the Haihe River basin in the past five decades. J. Hydrol. 2014, 511, 786–799. [Google Scholar] [CrossRef]
  3. Abu Arra, A.; Birpınar, M.E.; Gazioğlu, Ş.A.; Şişman, E. Critical Drought Characteristics: A New Concept Based on Dynamic Time Period Scenarios. Atmosphere 2024, 15, 768. [Google Scholar] [CrossRef]
  4. Lin, C.; He, Y.; Wang, Z. Sensitivity of Vegetation Productivity to Extreme Droughts across the Yunnan Plateau, China. Atmosphere 2023, 14, 1026. [Google Scholar] [CrossRef]
  5. Proutsos, N.; Tigkas, D. Growth response of endemic black pine trees to meteorological variations and drought episodes in a Mediterranean region. Atmosphere 2020, 11, 554. [Google Scholar] [CrossRef]
  6. Li, Z.; Qu, H.; Li, L.; Zheng, J.; Wei, D.; Wang, F. Effects of climate change on vegetation dynamics of the Qinghai-Tibet Plateau, a causality analysis using empirical dynamic modeling. Heliyon 2023, 9, e16001. [Google Scholar] [CrossRef] [PubMed]
  7. Jiang, L.; Bao, A.; Guo, H.; Ndayisaba, F. Vegetation dynamics and responses to climate change and human activities in Central Asia. Sci. Total Environ. 2017, 599, 967–980. [Google Scholar] [CrossRef]
  8. Warter, M.M.; Singer, M.B.; Cuthbert, M.O.; Roberts, D.; Caylor, K.K.; Sabathier, R.; Stella, J. Modeling seasonal vegetation phenology from hydroclimatic drivers for contrasting plant functional groups within drylands of the Southwestern USA. Environ. Res. Ecol. 2023, 2, 025001. [Google Scholar] [CrossRef]
  9. Jiao, T.; Williams, C.A.; De Kauwe, M.G.; Schwalm, C.R.; Medlyn, B.E. Patterns of post-drought recovery are strongly influenced by drought duration, frequency, post-drought wetness, and bioclimatic setting. Glob. Chang. Biol. 2021, 27, 4630–4643. [Google Scholar] [CrossRef]
  10. Wang, C.; Zhang, H.; Wu, X.; Yang, W.; Shen, Y.; Lu, B.; Wang, J. AUTS: A Novel Approach to Mapping Winter Wheat by Automatically Updating Training Samples Based on NDVI Time Series. Agriculture 2022, 12, 817. [Google Scholar] [CrossRef]
  11. Gong, Z.; Zhao, S.; Gu, J. Correlation analysis between vegetation coverage and climate drought conditions in North China during 2001–2013. J. Geogr. Sci. 2017, 27, 143–160. [Google Scholar] [CrossRef]
  12. Yang, C.; Fu, M.; Feng, D.; Sun, Y.; Zhai, G. Spatiotemporal changes in vegetation cover and its influencing factors in the loess Plateau of China based on the geographically weighted regression model. Forests 2021, 12, 673. [Google Scholar] [CrossRef]
  13. Zhao, C.; Yan, Y.; Ma, W.; Shang, X.; Chen, J.; Rong, Y.; Quan, Y. RESTREND-based assessment of factors affecting vegetation dynamics on the Mongolian Plateau. Ecol. Model. 2021, 440, 109415. [Google Scholar] [CrossRef]
  14. Wang, W.; Ma, X.; Moazzam Nizami, S.; Tian, C.; Guo, F. Anthropogenic and biophysical factors associated with vegetation restoration in Changting, China. Forests 2018, 9, 306. [Google Scholar] [CrossRef]
  15. Yang, J.Y.; Qin, L.; Mei, X.R.; Yan, C.R.; Hui, J.U.; Xu, J.W. Spatiotemporal characteristics of reference evapotranspiration and its sensitivity coefficients to climate factors in Huang-Huai-Hai Plain, China. J. Integr. Agric. 2013, 12, 2280–2291. [Google Scholar] [CrossRef]
  16. Leroux, L.; Bégué, A.; Seen, D.L.; Jolivot, A.; Kayitakire, F. Driving forces of recent vegetation changes in the Sahel: Lessons learned from regional and local level analyses. Remote Sens. Environ. 2017, 191, 38–54. [Google Scholar] [CrossRef]
  17. Barbosa, H.A.; Lakshmi Kumar, T.V.; Silva, L.R.M. Recent trends in vegetation dynamics in the South America and their relationship to rainfall. Nat. Hazards 2015, 77, 883–899. [Google Scholar] [CrossRef]
  18. Yao, Y.; Fu, B.; Liu, Y.; Li, Y.; Wang, S.; Zhan, T.; Gao, D. Evaluation of ecosystem resilience to drought based on drought intensity and recovery time. Agric. For. Meteorol. 2022, 314, 108809. [Google Scholar] [CrossRef]
  19. Jinghua, Z.; Luguang, J.; Zhiming, F.; Peng, L. Detecting effects of the recent drought on vegetation in southwestern China. J. Resour. Ecol. 2012, 3, 43–49. [Google Scholar] [CrossRef]
  20. McIntyre, P.J.; Thorne, J.H.; Dolanc, C.R.; Flint, A.L.; Flint, L.E.; Kelly, M.; Ackerly, D.D. Twentieth-century shifts in forest structure in California: Denser forests, smaller trees, and increased dominance of oaks. Proc. Natl. Acad. Sci. USA 2015, 112, 1458–1463. [Google Scholar] [CrossRef]
  21. Zhu, Y.; Zhang, H.; Ding, M.; Li, L.; Zhang, Y. The multiple perspective response of vegetation to drought on the Qinghai-Tibetan Plateau. Remote Sens. 2023, 15, 902. [Google Scholar] [CrossRef]
  22. Dutta, D.; Kundu, A.; Patel, N.R. Predicting agricultural drought in eastern Rajasthan of India using NDVI and standardized precipitation index. Geocarto Int. 2013, 28, 192–209. [Google Scholar] [CrossRef]
  23. Xie, Z.; Mu, X.; Gao, P.; Wu, C.; Qiu, D. Impacts of climate and anthropogenic activities on streamflow regimes in the Beiluo river, China. Water 2021, 13, 2892. [Google Scholar] [CrossRef]
  24. He, Y.; Song, J.; Hu, Y.; Tu, X.; Zhao, Y. Impacts of different weather conditions and landuse change on runoff variations in the Beiluo River Watershed, China. Sustain. Cities Soc. 2019, 50, 101674. [Google Scholar] [CrossRef]
  25. Zheng, S.; Huang, G.; Zhou, X.; Zhu, X. Climate-change impacts on electricity demands at a metropolitan scale: A case study of Guangzhou, China. Appl. Energy 2020, 261, 114295. [Google Scholar] [CrossRef]
  26. Fan, J.; Xu, F.; Sun, X.; Dong, W.; Ma, X.; Liu, G.; Wang, H. Construction and application of hydrometeorological comprehensive drought index in Weihe River. Atmosphere 2022, 13, 610. [Google Scholar] [CrossRef]
  27. Cao, S.; He, Y.; Zhang, L.; Chen, Y.; Yang, W.; Yao, S.; Sun, Q. Spatiotemporal characteristics of drought and its impact on vegetation in the vegetation region of Northwest China. Ecol. Indic. 2021, 133, 108420. [Google Scholar] [CrossRef]
  28. Zhan, C.; Liang, C.; Zhao, L.; Jiang, S.; Niu, K.; Zhang, Y. Drought-related cumulative and time-lag effects on vegetation dynamics across the Yellow River Basin, China. Ecol. Indic. 2022, 143, 109409. [Google Scholar] [CrossRef]
  29. Shi, X.; Ding, H.; Wu, M.; Zhang, N.; Shi, M.; Chen, F.; Li, Y. Effects of different types of droughts on vegetation in Huang-Huai-Hai River Basin, China. Ecol. Indic. 2022, 144, 109428. [Google Scholar] [CrossRef]
  30. Wu, X.; Liu, H.; Li, X.; Ciais, P.; Babst, F.; Guo, W.; Ma, Y. Differentiating drought legacy effects on vegetation growth over the temperate Northern Hemisphere. Glob. Chang. Biol. 2018, 24, 504–516. [Google Scholar] [CrossRef]
  31. Xie, M.; Zhang, X.M.; Zhao, Y.; Wang, Z.Y. The mechanism of response of runoff and sediment yield to precipitation and LUCC in Beiluohe River basin. J. China Inst. Water Resour. Hydropower Res. 2019, 17, 39–44. [Google Scholar]
  32. Liu, B.; Pan, L.; Qi, Y.; Guan, X.; Li, J. Land use and land cover change in the Yellow River Basin from 1980 to 2015 and its impact on the ecosystem services. Land 2021, 10, 1080. [Google Scholar] [CrossRef]
  33. Abu Arra, A.; Şişman, E. Innovative Drought Classification Matrix and Acceptable Time Period for Temporal Drought Evaluation. Water Resour. Manag. 2024, 38, 2811–2833. [Google Scholar] [CrossRef]
  34. Wu, C.; Zhong, L.; Yeh, P.J.F.; Gong, Z.; Lv, W.; Chen, B.; Wang, S. An evaluation framework for quantifying vegetation loss and recovery in response to meteorological drought based on SPEI and NDVI. Sci. Total Environ. 2024, 906, 167632. [Google Scholar] [CrossRef]
  35. Allen, R.G.; Pereira, L.S.; Raes, D.; Smith, M. Crop Evapotranspiration-Guidelines for Computing Crop Water Requirements-FAO Irrigation and Drainage Paper 56; FAO: Rome, Italy, 1998; Volume 300, p. D05109. [Google Scholar]
  36. Vicente-Serrano, S.M.; Beguería, S.; López-Moreno, J.I. A multiscalar drought index sensitive to global warming: The standardized precipitation evapotranspiration index. J. Clim. 2010, 23, 1696–1718. [Google Scholar] [CrossRef]
  37. Suroso; Nadhilah, D.; Ardiansyah; Aldrian, E. Drought detection in java island based on standardized precipitation and evapotranspiration index (SPEI). J. Water Clim. Chang. 2021, 12, 2734–2752. [Google Scholar] [CrossRef]
  38. Ren, J.; Huang, G.; Li, Y.; Zhou, X.; Xu, J.; Yang, Z.; Wang, F. A stepwise-clustered simulation approach for projecting future heat wave over Guangdong province. Front. Ecol. Evol. 2021, 9, 761251. [Google Scholar] [CrossRef]
  39. Di, L.; Rundquist, D.C.; Han, L. Modelling relationships between NDVI and precipitation during vegetative growth cycles. Int. J. Remote Sens. 1994, 15, 2121–2136. [Google Scholar] [CrossRef]
  40. Anderegg, W.R.; Schwalm, C.; Biondi, F.; Camarero, J.J.; Koch, G.; Litvak, M.; Pacala, S. Pervasive drought legacies in forest ecosystems and their implications for carbon cycle models. Science 2015, 349, 528–532. [Google Scholar] [CrossRef]
  41. Li, P.; Zhu, D.; Wang, Y.; Liu, D. Elevation dependence of drought legacy effects on vegetation greenness over the Tibetan Plateau. Agric. For. Meteorol. 2020, 295, 108190. [Google Scholar] [CrossRef]
  42. Griffin-Nolan, R.J.; Carroll, C.J.; Denton, E.M.; Johnston, M.K.; Collins, S.L.; Smith, M.D.; Knapp, A.K. Legacy effects of a regional drought on aboveground net primary production in six central US grasslands. Plant Ecol. 2018, 219, 505–515. [Google Scholar] [CrossRef]
  43. Ma, J.; Jia, X.; Zha, T.; Bourque, C.P.A.; Tian, Y.; Bai, Y.; Zhou, C. Ecosystem water use efficiency in a young plantation in Northern China and its relationship to drought. Agric. For. Meteorol. 2019, 275, 1–10. [Google Scholar] [CrossRef]
  44. Szejner, P.; Belmecheri, S.; Ehleringer, J.R.; Monson, R.K. Recent increases in drought frequency cause observed multi-year drought legacies in the tree rings of semi-arid forests. Oecologia 2020, 192, 241–259. [Google Scholar] [CrossRef]
  45. Yu, X.; Orth, R.; Reichstein, M.; Bahn, M.; Klosterhalfen, A.; Knohl, A.; Bastos, A. Contrasting drought legacy effects on gross primary productivity in a mixed versus pure beech forest. Biogeosciences 2022, 19, 4315–4329. [Google Scholar] [CrossRef]
  46. Fan, J.; Wei, S.; Liu, G.; Zhou, X.; Li, Y.; Wu, C.; Xu, F. Response Time of Vegetation to Drought in Weihe River Basin, China. Atmosphere 2023, 14, 938. [Google Scholar] [CrossRef]
  47. Fan, J.; Zhang, W.; Xu, F.; Zhou, X.; Dong, W.; Wu, C.; Wang, D. Multilevel Drought-Induced Resistance and Resilience Analysis for Vegetation in the Yellow River Basin. Atmosphere 2024, 15, 979. [Google Scholar] [CrossRef]
  48. Yang, X.; Li, Y.P.; Huang, G.H.; Li, Y.F.; Liu, Y.R.; Zhou, X. Development of a multi-GCMs Bayesian copula method for assessing multivariate drought risk under climate change: A case study of the Aral Sea basin. Catena 2022, 212, 106048. [Google Scholar] [CrossRef]
  49. Duan, R.; Huang, G.; Li, Y.; Zhou, X.; Ren, J.; Tian, C. Stepwise clustering future meteorological drought projection and multi-level factorial analysis under climate change: A case study of the Pearl River Basin, China. Environ. Res. 2021, 196, 110368. [Google Scholar] [CrossRef] [PubMed]
  50. Sun, C.X.; Huang, G.H.; Fan, Y.; Zhou, X.; Lu, C.; Wang, X.Q. Drought occurring with hot extremes: Changes under future climate change on Loess Plateau, China. Earth’s Future 2019, 7, 587–604. [Google Scholar] [CrossRef]
  51. Dai, Z.; Du, J.; Li, J.; Li, W.; Chen, J. Runoff characteristics of the Changjiang River during 2006: Effect of extreme drought and the impounding of the Three Gorges Dam. Geophys. Res. Lett. 2008, 35, L07406. [Google Scholar] [CrossRef]
  52. Li, Y.; Zhang, W.; Schwalm, C.R.; Gentine, P.; Smith, W.K.; Ciais, P.; Wu, X. Widespread spring phenology effects on drought recovery of Northern Hemisphere ecosystems. Nat. Clim. Chang. 2023, 13, 182–188. [Google Scholar] [CrossRef]
  53. Liu, M.; Xu, X.; Xu, C.; Sun, A.Y.; Wang, K.; Scanlon, B.R.; Zhang, L. A new drought index that considers the joint effects of climate and land surface change. Water Resour. Res. 2017, 53, 3262–3278. [Google Scholar] [CrossRef]
  54. Hoover, D.L.; Knapp, A.K.; Smith, M.D. Resistance and resilience of a grassland ecosystem to climate extremes. Ecology 2014, 95, 2646–2656. [Google Scholar] [CrossRef]
  55. Kannenberg, S.A.; Novick, K.A.; Alexander, M.R.; Maxwell, J.T.; Moore, D.J.; Phillips, R.P.; Anderegg, W.R. Linking drought legacy effects across scales: From leaves to tree rings to ecosystems. Glob. Chang. Biol. 2019, 25, 2978–2992. [Google Scholar] [CrossRef] [PubMed]
Figure 1. Geographical environment of the Beiluo river basin: (a) location of the basin in the Yellow River basin; (b) topography of the basin; (c) monthly average precipitation and temperature of the basin.
Atmosphere 15 01094 g001
Figure 2. Spatial variation in (a) annual average temperature, (b) annual average precipitation, (c) annual average NDVI distribution, (d) ecosystem types in the Beiluo River basin.
Atmosphere 15 01094 g002
Figure 3. Methodological process for the stepwise multifactor vegetation regression analysis (SMVRA) approach. Red represents the important step, and the arrow represents the progressive order.
Atmosphere 15 01094 g003
Figure 4. Temporal variations in climatic elements in the Beiluo River basin from 2000 to 2020.
Atmosphere 15 01094 g004
Figure 5. Spatial variation in climatic elements in the Beiluo River basin from 2000 to 2020.
Atmosphere 15 01094 g005
Figure 6. Variation trend of SPEI3 and SPEI12 in the Beiluo River basin from 2000 to 2020. (a) Spring, (b) summer, (c) autumn, (d) winter, (e) yearly scale.
Atmosphere 15 01094 g006
Figure 7. (a) Correlation between NDVI and precipitation from April to June in 2000–2020. (b) Percentage of precipitation anomaly in 2000. (c) Correlation between NDVI and the drought index from April to June in 2000–2020. (d) Percentage of drought index anomaly in 2000. (e) Correlation between NDVI and temperature from April to June in 2000–2020. (f) Percentage of temperature anomaly in 2000.
Atmosphere 15 01094 g007
Figure 8. Statistical results of ΔNDVI from 2000 to 2020. (a) ΔNDVI based on precipitation; (b) ΔNDVI based on the drought index; (c) ΔNDVI based on temperature. “*” means regions with significant positive correlation between climate factors and NDVI.
Atmosphere 15 01094 g008
Figure 9. Vegetation restoration after moderate drought.
Atmosphere 15 01094 g009
Figure 10. Vegetation restoration after mild drought.
Atmosphere 15 01094 g010
Figure 11. Vertical distribution of ΔNDVI comparison of different droughts.
Atmosphere 15 01094 g011
Figure 12. Statistical results of ΔNDVI of different vegetation from 2000 to 2004. “*” means regions with significant positive correlation between climate factors and NDVI.
Atmosphere 15 01094 g012
Table 1. Datasets.
Table 1. Datasets.
Data TypeData Sources
Normalized Differential Vegetation Index (NDVI)Resource and Environment Science and Data Centers, Chinese Academy of Sciences (CAS) (accessed on http://www.resdc.cn)
Ecosystem type
Digital elevation model (DEM)
Meteorological datasets
(precipitation, temperature, potential evapotranspiration)
National Tibetan Plateau Data Centre (accessed on http://data.tpdc.ac.cn)
Table 2. Drought classification.
ClassificationDrought GradeValue of SPEI
1No drought−0.5 < SPEI
2Mild drought−1.0 < SPEI ≤ −0.5
3Moderate drought−1.5 < SPEI ≤ −1.0
4Severe drought−2.0 < SPEI ≤ −1.5
5Extreme droughtSPEI ≤ −2.0
Table 3. Stepwise regression analysis results (n = 37).
Non-Standardized Coefficient (B)Standardized Coefficient (Beta)tpVIF
Constant1.242-2.9070.011-
independent variable (pre)0.0000.4523.7470.0020.567
independent variable (D)0.0270.3472.9860.0090.612
independent variable (tem)0.0410.3363.1550.0070.728
R20.876
D−W1.736
Table 4. Regional mean Pearson correlation coefficients between climate factors and NDVI, 2000–2020.
TimesClimatic Factors
PREPETDtem
April–June0.517−0.0740.10040.092
July–September−0.0934−0.0690.0890.072
Disclaimer/Publisher’s Note: The statements, opinions and data contained in all publications are solely those of the individual author(s) and contributor(s) and not of MDPI and/or the editor(s). MDPI and/or the editor(s) disclaim responsibility for any injury to people or property resulting from any ideas, methods, instructions or products referred to in the content.

