Article

New Makeup Air Method through Ceiling for Kitchen Ventilation in Severely Cold Regions and Its Effect on Air Environment

1
School of Municipal and Environmental Engineering, Shenyang Jianzhu University, Shenyang 110168, China
2
College of Petroleum and Natural Gas Engineering, Liaoning Petrochemical University, Fushun 113001, China
3
Department of Energy and Process Engineering, Norwegian University of Science and Technology, 7491 Trondheim, Norway
*
Author to whom correspondence should be addressed.
Atmosphere 2024, 15(9), 1109; https://doi.org/10.3390/atmos15091109
Submission received: 7 August 2024 / Revised: 6 September 2024 / Accepted: 9 September 2024 / Published: 12 September 2024
(This article belongs to the Section Biometeorology and Bioclimatology)

Abstract

:
Severely cold weather reduces the willingness of residents to open windows while cooking. This results in an insufficient replenishment of makeup air and a reduction in the range hood discharge capacity. For an effective trade-off between indoor air temperature maintenance and air quality aggravation in winter, a new makeup air supply method (ceiling makeup air) was proposed and established both experimentally and numerically. The improvements in the kitchen air environment during cooking were studied through experimental tests and CFD simulations, considering different makeup air arrangements. The results reveal that the ceiling makeup air scheme can significantly reduce the concentration of PM2.5 compared with the cracks makeup air scheme (wherein the kitchen window and door are closed). Moreover, it increased the indoor temperature by over 11.9 °C compared with the open window makeup air scheme. The average relative error between the experimental and simulated data was within 6.1%. Among the considered factors, the size of the air inlet had the largest impact. This was followed by the layout, size, and shape of the ceiling inlets. The ceiling makeup air scheme demonstrated the potential for improving residential kitchen air environments in severely cold regions.

1. Introduction

Indoor air pollution of fine particle matter (PM) causes more than one million people worldwide to lose their lives every year [1]. There are strong links between exposure to PM and respiratory infections and cardiovascular diseases [2,3]. Indoor PM2.5 concentrations are greatly affected by cooking activities. Effective ventilation can reduce the concentration of indoor PM2.5 and improve the pollutant discharge efficiency of range hoods [4]. During winter, outdoor temperatures are significantly low in severely cold regions. Opening windows for ventilation causes the temperature inside a kitchen to decrease rapidly. Consequently, individuals are less willing to open windows while cooking. During cooking, doors and windows remain closed, and range hoods operate under a large negative pressure. This results in a decrease in exhaust capacity, whereby indoor pollutants cannot be removed effectively [5]. In severely cold regions of China, issues related to the kitchen air environment are more complex. This may result in significant potential financial loads on households if kitchen air makeup is not handled effectively.
Surveys on kitchen environments reveal that residents in Northern China are significantly more likely to close kitchen doors and windows while cooking than those in the south. Additionally, they spend more time cooking [6,7]. Zeng et al. conducted household tests on 30 residential kitchens in Shanghai, China. The results showed that the peak concentrations of PM2.5 during cooking reached 800–1000 μg/m3. Moreover, the air change volume was in the range of 200–300 m3/h [8], which is lower than the requirement specified by Chinese standards [9,10,11] (see Table 1). We conducted household tests on 33 residential kitchens in Northeastern China. We observed that kitchen air pollution is a common phenomenon that poses a risk to the health of residents during cooking. Furthermore, the air exhaust effect in kitchens is ineffective, and the average air change volume is 102.14 m3/h [2]. Oil fumes cannot be discharged in a timely manner. This causes air quality issues in other rooms. Cooking activities are the primary source of indoor particulate matter [12] and can increase concentrations by over 5–90 times, particularly the concentration of PM2.5 [13,14]. From our kitchen test results in Northeastern China and the difference between air supplies in the north and south, it is necessary to determine a reasonable fresh-air supply and appropriate kitchen ventilation methods for winter in severely cold winter areas.
Many scholars have conducted research on methods for removing PM2.5 from cooking. Strategies for the mitigation of cooking emissions include stove hoods [15,16,17], portable air cleaners [15,18], increased air supply, exhaust or extraction ventilation, or a combination of several [15]. The impact of using extractors on PM removal rates ranged between 10.5% and 63% [19]. Cooking-emitted pollution was effectively controlled by activating a stove hood or a combination of a stove hood and other interventions [20]. Catherine et al. found, through model predictions, that over 98% of English homes cannot dilute PM2.5 emissions solely by infiltration [21]. Liu et al. found that cooking-emitted PM2.5 was most effectively removed by a combination of ventilation and portable air cleaners [15]. Introducing fresh air from the space below a stove is an effective approach to improving the efficiency of range hoods. Zhou et al. introduced fresh air around a gas stove to form an air barrier that effectively prevented the overflow of pollutants [22]. Variations in the blowing angle and speed of an air curtain have significant impacts on the pollutant capture efficiency [23]. To address this issue, Huang et al. developed an inclined air-curtain range hood [24,25]. It can enhance the performance of range hoods and reduce the impact of human interference. With a jet velocity of Vb = 1.0 m/s and an outflow angle of 15°, it was almost completely unaffected by human interference. To enhance thermal comfort, Liu et al. recommend introducing air treated by air conditioning into the cabinet under the furnace and adding an upward air curtain. This can effectively control pollution and improve thermal comfort, with a capture efficiency of over 96.2%, and the predicted dissatisfied percentage around a cook is lower than 20% [26]. Kun et al. proposed a concurrent supply and exhaust ventilation (CSEV) system for the kitchen. It captures and exhausts pollutants in the area near the ceiling and supplies fresh air to the ventilation hood horizontally from the ceiling. The results demonstrated that the optimal supply flow rate for the ceiling nozzle of the CSEV system was 100 m3/h, thereby achieving the highest efficiency [27]. All the above air supply and smoke exhaust systems can effectively maintain indoor air quality. Herein, the air supply from the ceiling does not occupy the space of the lower cabinet and incurs lower construction and maintenance costs. Fresh air supply from the ceiling could result in better public approval than fresh air supply from under the stove and opening windows. However, previous research focused on mechanical ventilation with pipes. They did not consider the more common natural ventilation situation (including the positions and parameters of the air inlet on the exterior walls and ceiling) or the heating effect of the ceiling [6,28].
For an effective trade-off between indoor air temperature maintenance and air quality aggravation in severely cold regions, this paper proposes a new ceiling makeup air system that utilizes an fresh air inlet on the outer wall and ceiling inlets to compensate for the exhaust air, rather than fresh air supply from under the stove or opening windows (which cause a severe indoor temperature reduction and furnace flame deviation). The new ventilation method carries fresh air into the ceiling space from the air inlet on the outer wall, mixes it with the air above the ceiling, heats it marginally, and then enters the kitchen space under the negative pressure created by the range hood.
In this study, experimental and simulation systems for ceiling makeup air (CMA), open window makeup air (WMA), and cracked makeup air (GMA) (the kitchen window and door are closed) were established. The indoor air velocity, temperature, and PM2.5 concentration in a kitchen under the ventilation systems with GMA scheme, WMA scheme, and CMA scheme were measured during winter in severely cold regions of China. In addition, we also compared and analyzed the results of experiments and simulation calculations under different operating conditions. The goal is to propose a suitable makeup air system for an effective trade-off between indoor air temperature maintenance and air quality aggravation under severely cold conditions and optimize the design parameters of the proposed system.

2. Experimental Measurements

2.1. Development of CMA System for Severely Cold Region

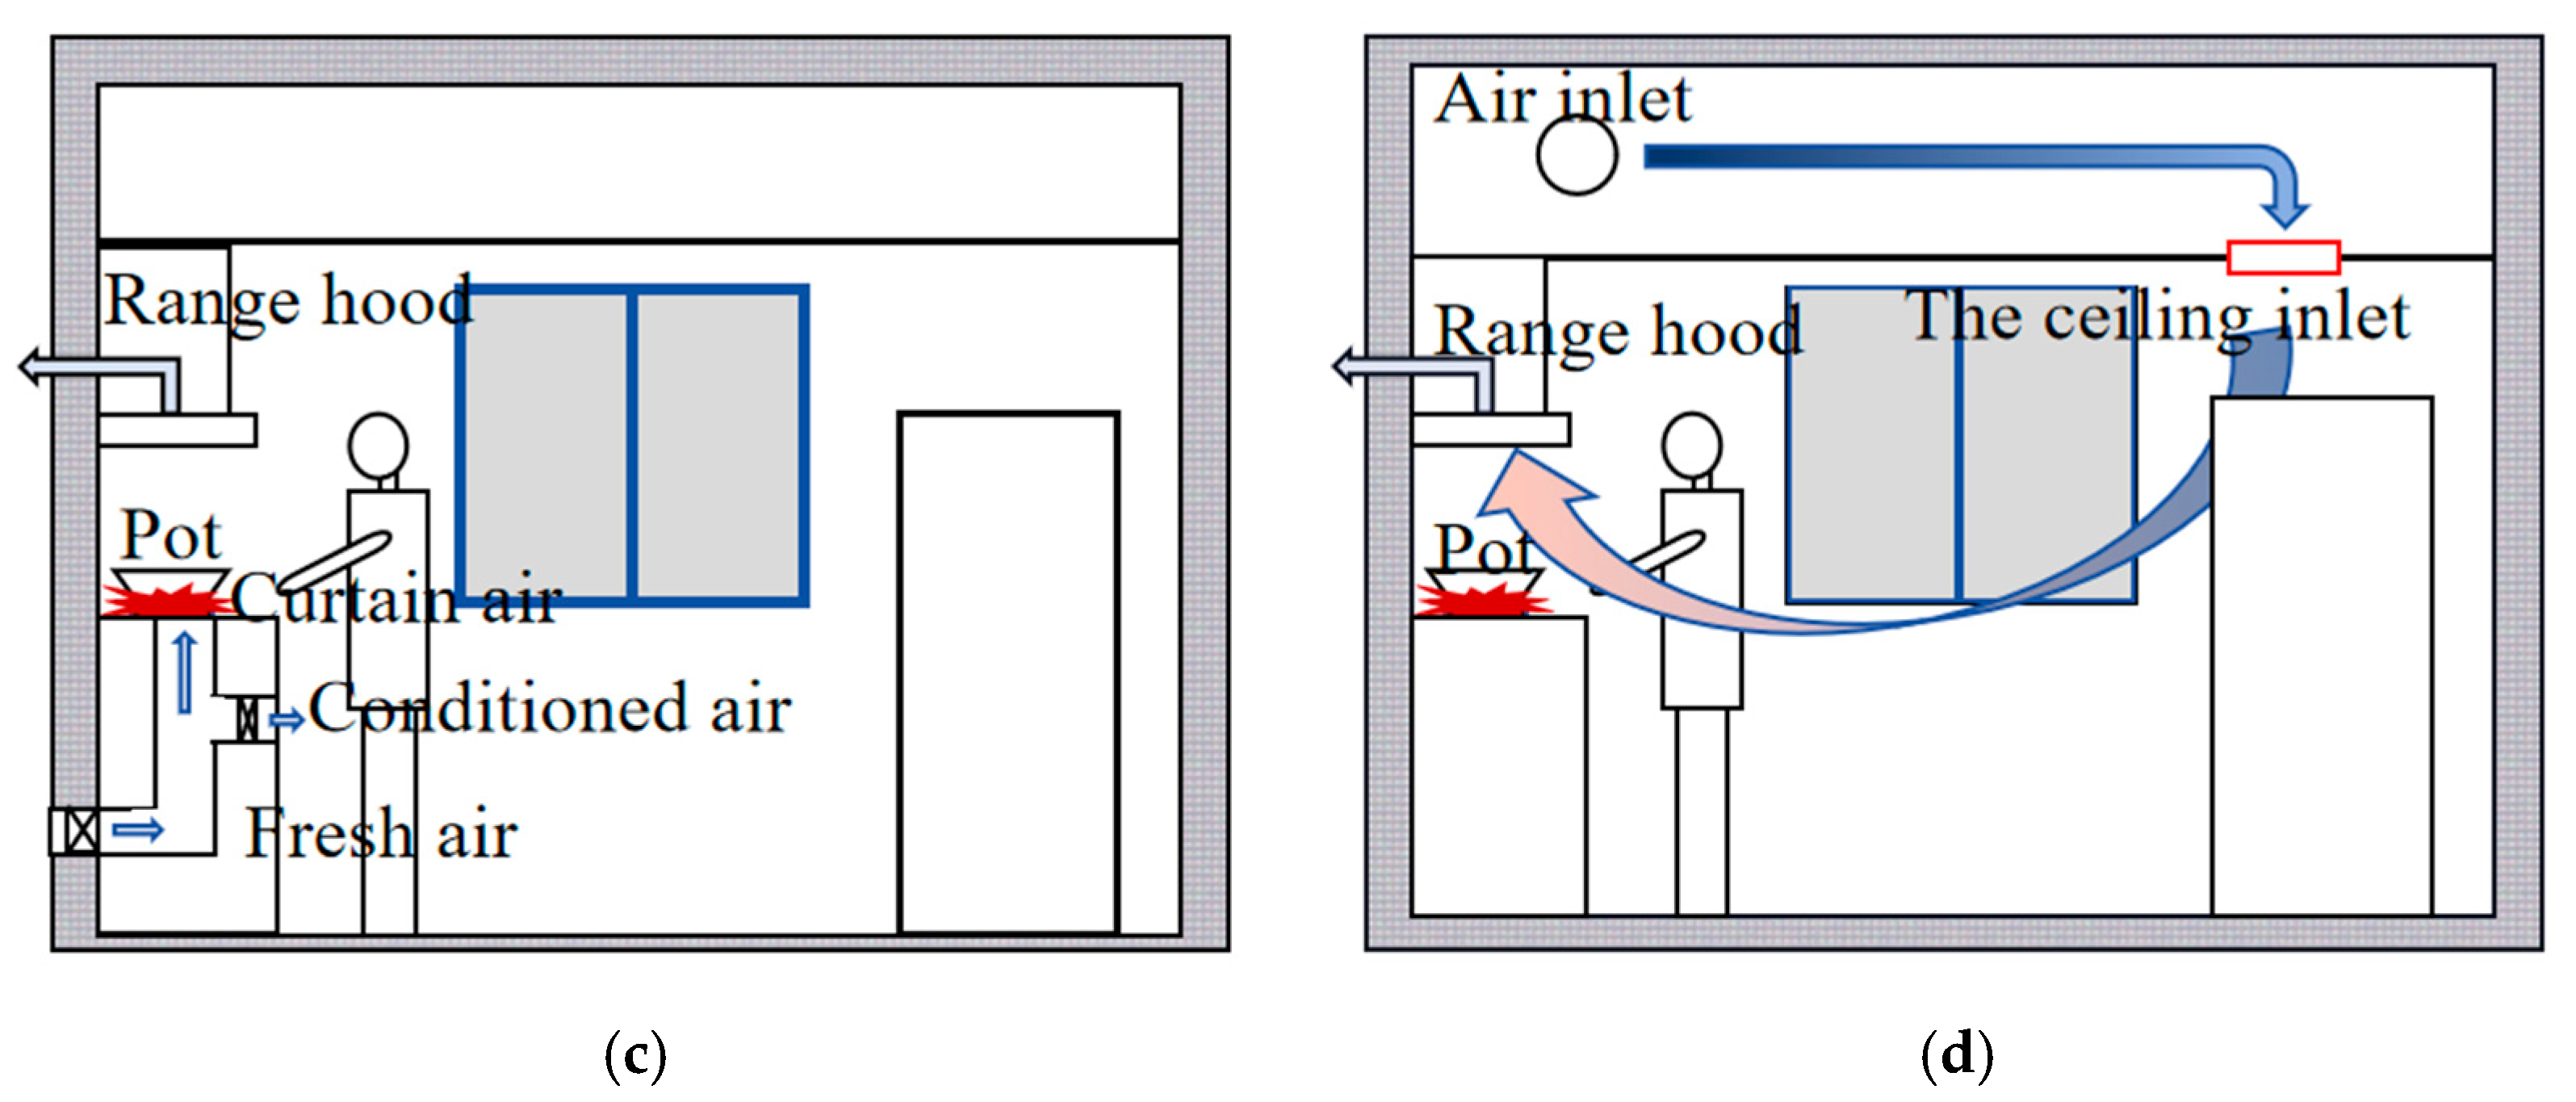
Owing to severely cold weather, opening the kitchen windows during cooking can result in an abrupt reduction in indoor temperature and cause the stove flame to shift, as shown in Figure 1a. This severely affects thermal comfort and the cooking process. People tend to close doors and windows during cooking, as shown in Figure 1b. This is likely to cause an evident decrease in the exhaust capacity of the range hood and severe indoor air pollution. The proposed CMA can achieve smoke exhaust effects similar to those of fresh air supply below the stove (shown in Figure 1c) [26]. However, it does not occupy the storage space and incurs lower construction and maintenance costs. Furthermore, fresh air can be heated marginally by the ceiling. This can potentially increase the indoor air temperature.
The new CMA system is mainly composed of an air inlet on the outer wall of the ceiling layer, a gravity air valve, and an indoor ceiling inlet. The gravity air valve is located at the inlet of the outer wall. It regulates the opening and closing of the air inlet. A schematic of the operational principle of the CMA air system is shown in Figure 1d. During cooking in winter, the range hood is turned on to create a negative-pressure environment within the indoor and ceiling spaces connected by openings. This induces the gravity air valve in the outer wall to open and, thereby, enables the external cold air to enter the ceiling space and marginally warm up. Subsequently, the airflow flows downwards into the indoor space through the ceiling air inlets, where it compensates for the exhaust air and creates a balance of indoor air volume without creating excessive negative pressure.
A preferable kitchen air supply system should have a reasonable air supply volume. The process of airflow organization should not affect the cooking flame (which is common when the window is opened) or the heat plume on the top of the iron pot, because it is conducive to the discharge of oil fumes. This requires a reasonable selection of the positions of the ceiling inlets in the ventilation system with CMA to maximize the thermal comfort of the area surrounding the human body without affecting the thermal plume.

2.2. Experimental Setup

2.2.1. Experimental System

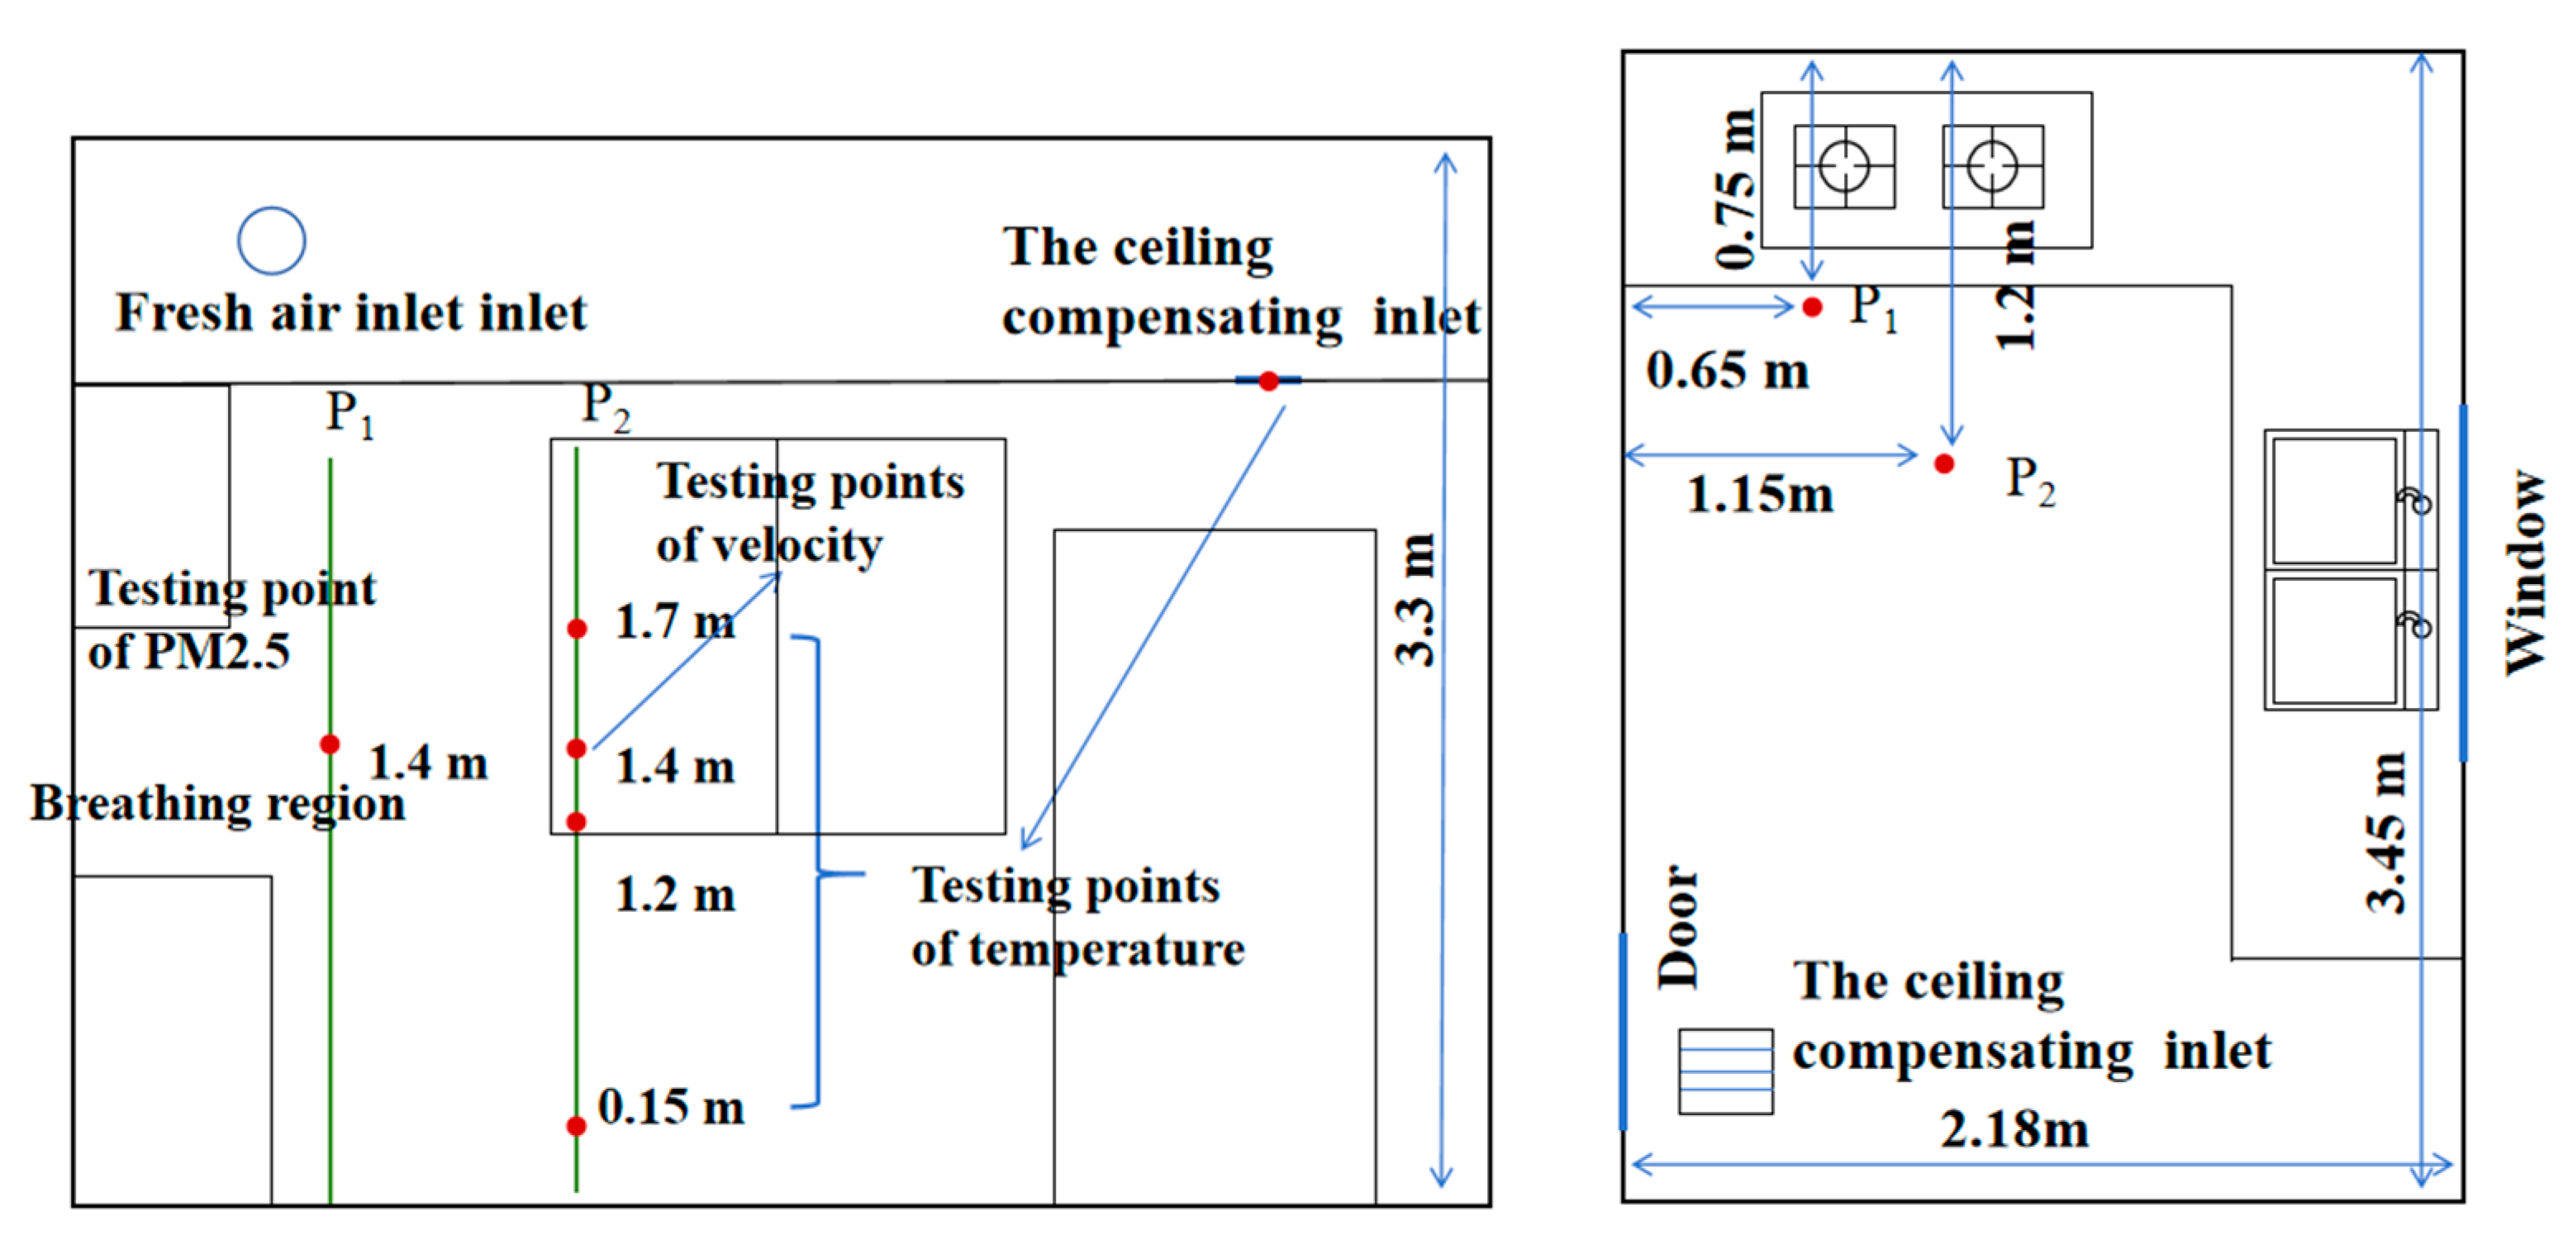
A kitchen experimental system was established, as shown in Figure 2, to understand the indoor temperature, velocity, and PM2.5 concentration under the ventilation system with CMA scheme during cooking. It was installed in a residential building in Liaoning, China. The experimental tests were conducted in November 2022. The kitchen has a length of 3.45 m, width of 2.18 m, and height of 3.3 m (the ceiling space is 0.9 m high). Two openings were created in the ventilation system using the CMA. An opening with a diameter of 160 mm was created on the outer wall of the ceiling space as an inlet for fresh air. Another opening with dimensions of 300 × 300 mm was created on the ceiling floor as the ceiling compensating air inlet. Fresh air entered the room through the two openings while the range hood was operating. The cooking method is the most significant factor influencing cooking pollutant emissions [29]. Furthermore, stir-firing releases the most cooking pollutants and is also the most popular cooking method for the Chinese [30]. To ensure the accuracy of the results, it is necessary to produce representative northeastern dish, stir-fried potato shreds, as the experimental object.
The sampling points for each parameter in this test were established according to the Chinese testing standard “Public Health Testing Methods—Part 1: Physical Factors” [31]. The parameters of the experimental equipment are shown in Table 2. The air temperature at heights of 0.15 m, 1.2 m, 1.4 m, and 1.7 m on the line P2 in the kitchen plan was measured by four RS485 recorders. In addition, the temperature of the outdoor air and ceiling inlets was recorded by temperature recorder. The measurement accuracy of the temperature recorder is ±0.5 °C. The test frequency was set to 0.1 Hz. The air velocity was recorded by Testo (405 i). It has a measuring accuracy of ±0.1 m/s. It was placed 1.4 m above the ground on the line P2. The test frequency was 10 s. The temperature and air velocity were recorded before the experiment, and the data were collected after the experiment. The computer initiated all the instruments. This ensured synchronized recording. This study also assessed the kitchen concentration of PM2.5 during cooking. A DUST-TRAK-II aerosol monitor (model 8534) with an accuracy of 0.001 mg/m3 and a measurement frequency of 10 s was employed. It was located in the breathing area of the subjects, i.e., line P1 at 1.4 m from the ground.
Before the experimental testing, the temperature recorders (RS485), air velocity recorder (Testo (405 i)), and PM2.5 measuring instrument (DUST-TRAK-II aerosol monitor (model 8534)) were calibrated at a professional calibration unit.

2.2.2. The Test Procedure

In this study, the indoor ambient temperature and PM2.5 concentrations in the breathing zone during cooking under the ventilation systems with CMA scheme, WMA scheme, and GMA scheme were measured. To ensure effective ventilation, the portable vertical fan and range hood in the kitchen were turned on for approximately 300 s. Then, the kitchen door and window were closed for 600 s to ensure that the initial conditions for the kitchen cooking experiment were consistent with those of most home kitchens. The fundamental cooking process remained consistent under all the ventilation conditions. To prevent the influence of the quantity of vegetables and seasonings on the intensity of pollutant emissions, the shredded potatoes (270 g) were weighed each time, and the amount of various seasonings was determined in a measuring cup. During the experiment, the range hood and stove were opened and closed simultaneously. Each step of the cooking process was timed: the cooking oil was added to the hot pot at 40 s after the stove was turned on, and the shredded potatoes were added at 70 s. Under the ventilation system with GMA scheme, the door and window were closed, and the air inlet and ceiling inlet were sealed. In the ventilation system with WMA scheme, the outer window was opened, the door was closed, and the ceiling inlet was sealed. Under the ventilation system with CMA scheme, the doors and windows were closed, and the ceiling inlet was opened.
To investigate the variations in indoor air volume under the ventilation system with CMA scheme and supply the data for the subsequent simulation calculations of boundary conditions, this study conducted air change volume experiments and measured the airflow velocity inside the smoke exhaust duct. CO2 was used as a tracer gas. A HT-2000 CO2 tester with an accuracy of ±50 ppm was used. The test point was 1.4 m above the ground, and the measured frequency was 1 Hz. Before starting the measurements, the air was ventilated for 30 min to determine the initial concentration of CO2. Then, the indoor doors and windows were closed, and CO2 was released and mixed with the indoor air. When the indoor CO2 concentration reached 3000 ppm, the release was discontinued. The range hood was turned on, run for 180 s, and then turned off. Then, the fan was used to fully mix the indoor air. The mixed CO2 concentration was recorded. During the experimental testing process, the probe of the anemometer penetrated deep into the center of the smoke exhaust duct cross-section to measure the variations in the airflow velocity in the smoke exhaust duct. The experiment was repeated three times to ensure accuracy.
The volume of air change in the kitchen under a ventilation system with CMA scheme was calculated. The formula for calculating the air change rate N is shown in Equation (1) [2] as follows:
N = l n C 1 C 0 l n C t C 0 / t
where C0 is the initial concentration of CO2 in the kitchen, C1 indicates the initial mass concentration of CO2 in the kitchen (ppm), Ct is the mass concentration of CO2 at time t (ppm), and t is the measurement time (h).
The air supply quantity V is given by Equation (2) [2], as follows:
V = N × V R
where VR represents the kitchen room volume, m3, and N is the air change rate.

3. Numerical Simulation

3.1. Governing Equations

Owing to the cold winter conditions, the cooking process in a residential kitchen involves a high temperature produced by cooking, low-temperature air entering the room, and a complex convection heat-exchange process with the indoor air. A turbulence model was applied to understand the flow-field distribution of each parameter in an indoor environment. The main controlling equations used in this study are as follows:
As the simulated ventilation process was a transient calculation, the realizable k-ԑ turbulence model was used.
ρ u / t + ρ uu = p + μ + μ t u + u T + F
ρ h / t + ρ h u = λ + λ t T + F h
Equations (3) and (4) are the momentum and energy equations, respectively. Here, u is the velocity vector, p is the pressure, μ is the dynamic viscosity coefficient, μ t is turbulence viscosity, F is the volume force vector, ρ is the density of air, h is the enthalpy, λ is the thermal conductivity, λ t is the turbulence thermal conductivity, and F h is the source term.
For the simulation calculation of particulate matter PM2.5, because of its small concentration in the kitchen and its high density, this study omitted its collision effect [6] and the effects of the pressure gradient force and virtual mass force [27]. The particle model was determined using Equations (5) and (6), as follows:
d u i / d t = F D u 0 u i + g ρ i ρ 0 / ρ i + F x
F D = 18 μ 0 / ρ i d i 2 C D R e / 24
where u 0 is the viscosity of the fluid, d i is the diameter of the particles, u i is the velocity of the particles, g is the gravitational acceleration, ρ i is the density of the particles, ρ 0 is the density of the fluid, and F x is the Brownian motion force. F D is inverse of relaxation time, μ 0 is air viscosity, d i is particle diameter, and CD is the drag coefficient [23,24,25,26,27,28,29,30,31,32,33]. This paper divided these particles with a diameter of 2.5 microns or less into 10 size groups from 1 to 2.5 μm and assumed they have uniform density in the simplification, which is consistent with the research of other scholars [33,34,35,36,37,38,39,40].

3.2. Geometry Model and Grid Generation

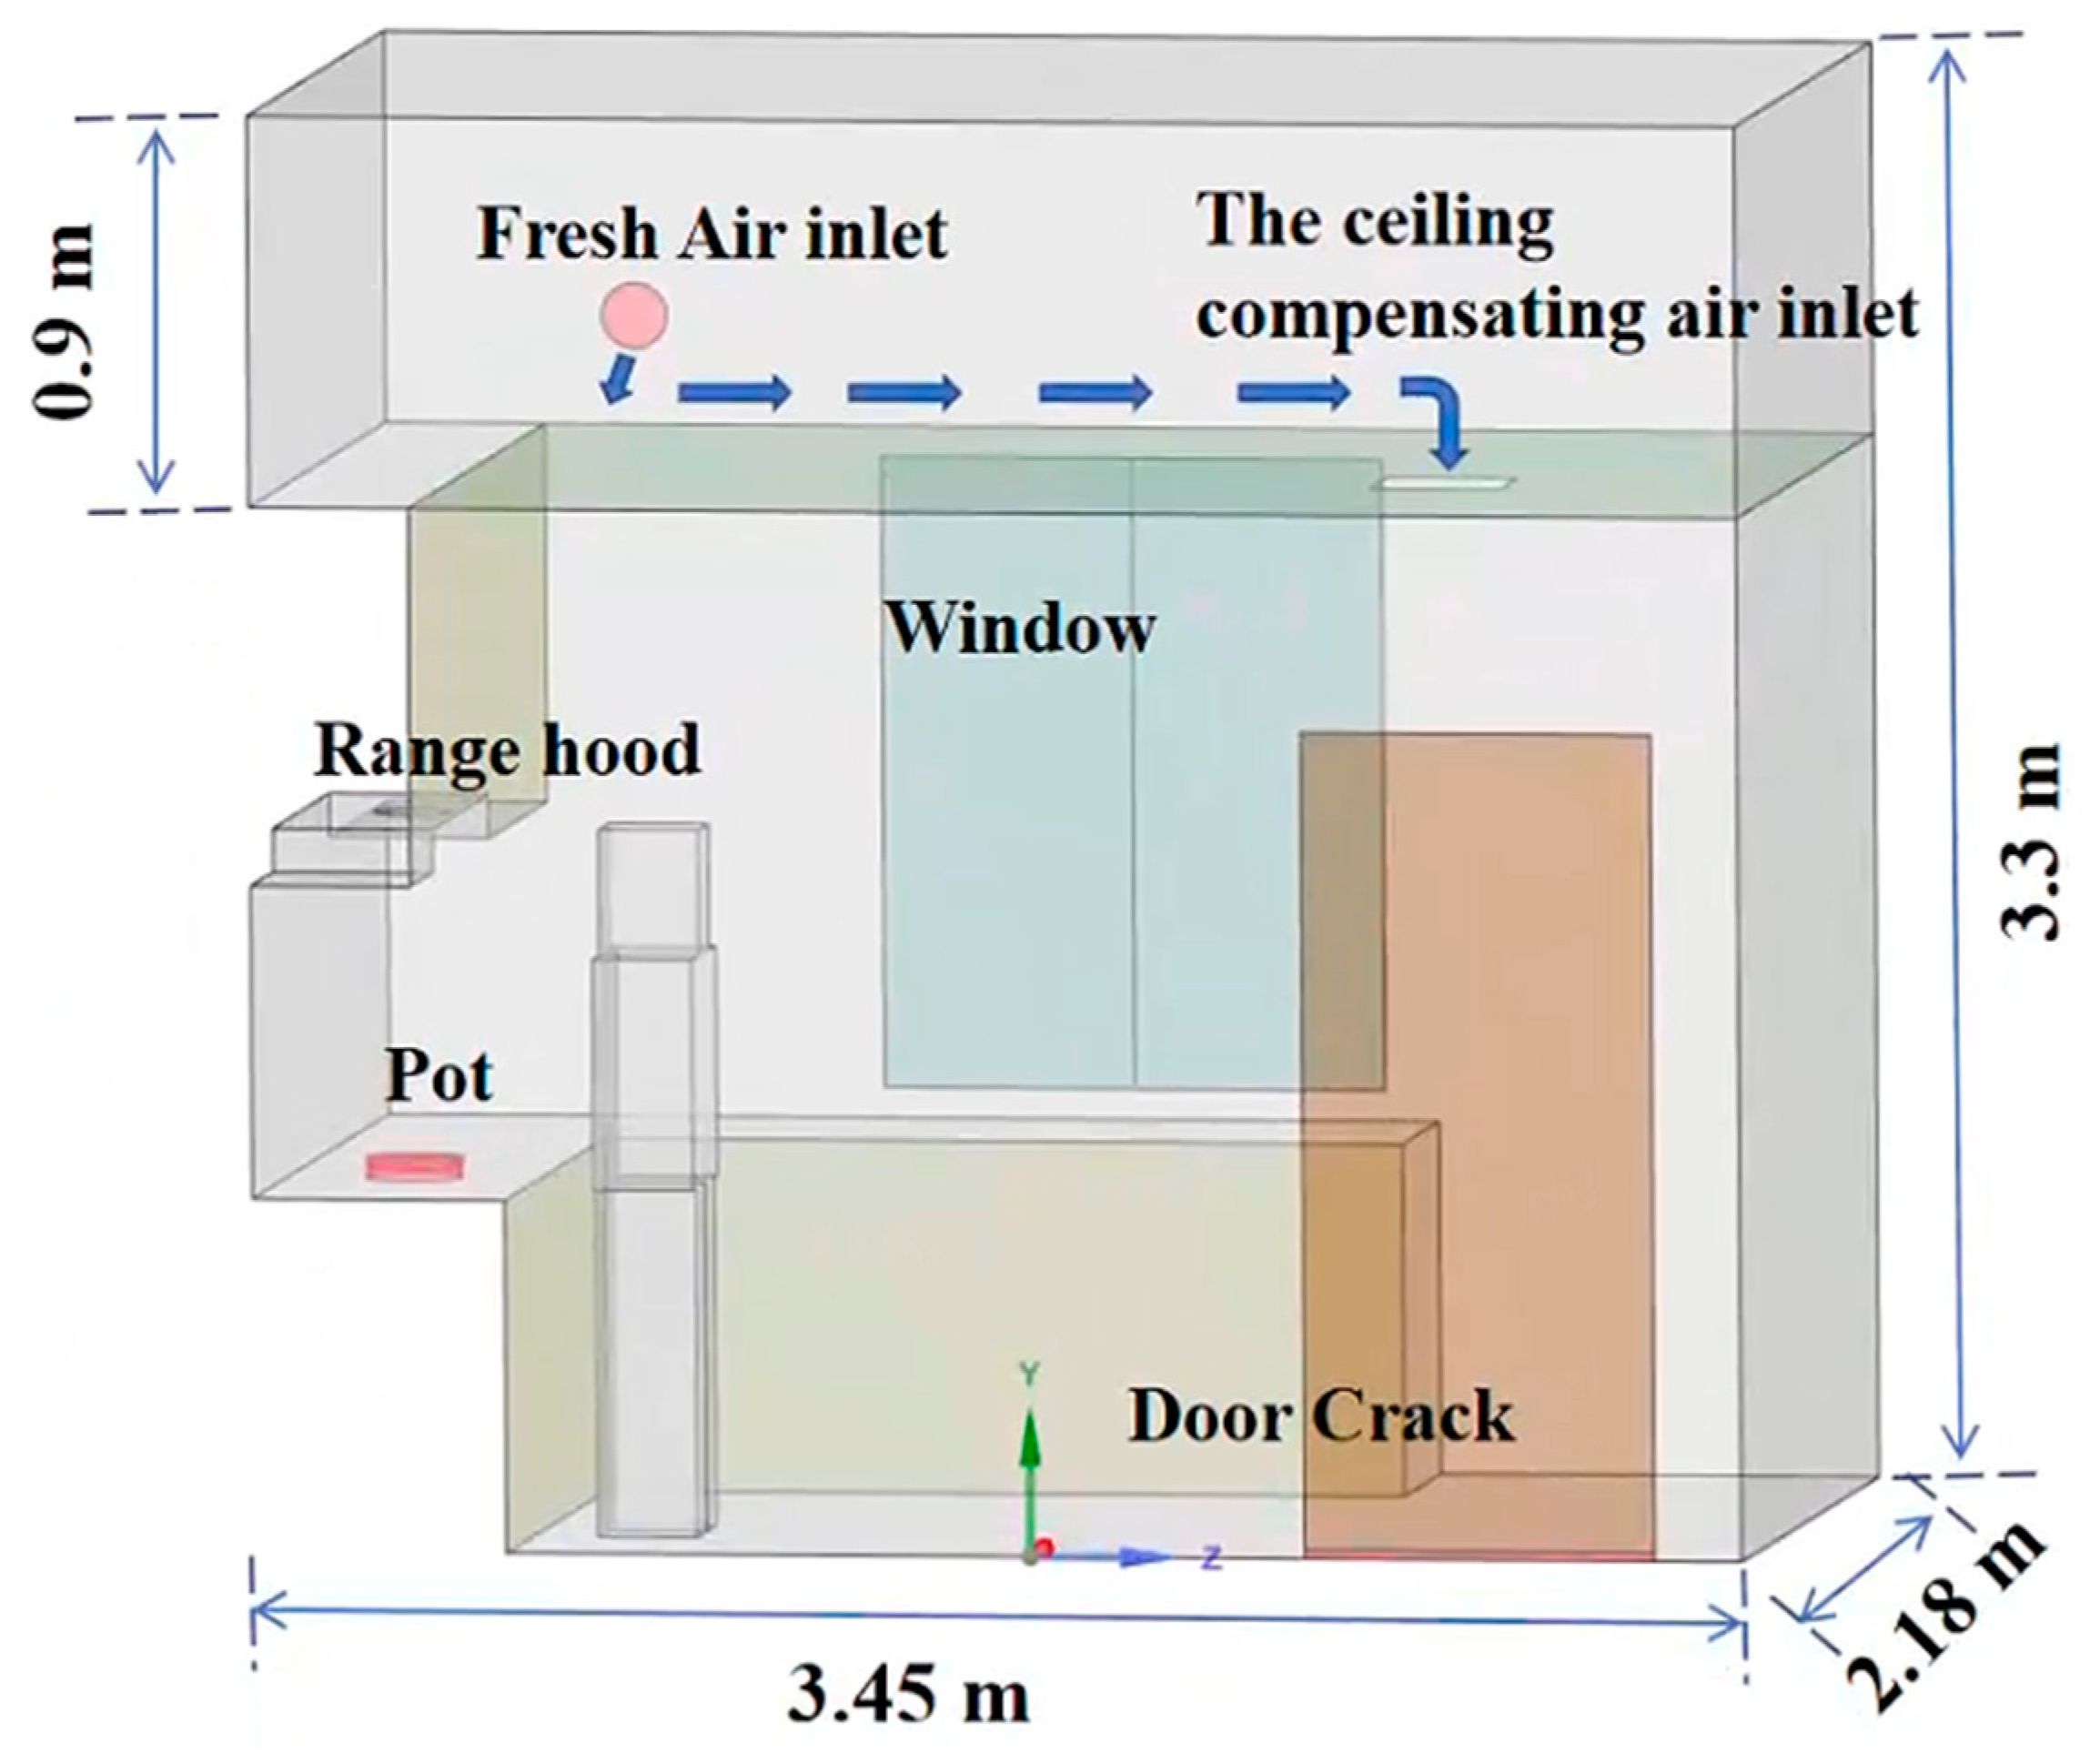
The performances of CMA, WMA, and GMA were studied, and the ventilation system with CMA was optimized. This study used the method of computational fluid dynamics (CFD) to simulate the changes in multiple parameters in the kitchen during cooking for 300 s. The step size of 0.1 s was used for simulation calculations by comparing and analyzing the effects of cooking on kitchen temperature, velocity, and PM2.5 concentration at different times. In terms of modeling, the turbulence numerical simulation method adopts the transient Reynolds-averaged Navier–Stokes (RANS) equations [41], and the achievable k-ԑ turbulence model combined with the Discrete Phase Model (DPM) discrete phase model is used to capture PM2.5 particles. The SIMPLE (Semi-Implicit Method for Pressure Linked Equations) algorithm was employed in the numerical method to couple the pressure and velocity equations [26]. The model was simplified to achieve computational fluency, as shown in Figure 3. The room size was 3.45 × 2.18 × 3.3 m (including the ceiling space height of 0.9 m). Using the floor radiation heating form, the kitchen cabinet and hood structure were considered as walls, the exhaust outlet size of the range hood was φ 180 mm, the door seam size was simplified to 0.81 × 0.02 m, the size of the ceiling air inlet hole was φ 160 mm, and the human body was simplified to 0.25 × 0.35 × 1.6 m. The simplification of an overall model can improve the grid quality, reduce the calculation cycle, and satisfy the simulation requirements [42].
The accuracy of the calculation results was directly affected by the quality of the grids. This study utilized the octree method to divide various numbers of unstructured grids. For locations with significant temperature gradients, such as exhaust vents, air inlets, ceiling inlets, pot surfaces, and door cracks, the grid was locally encrypted and refined.

3.3. Boundary Conditions and Calculation Cases

The cracks on the door and window, air inlet, and ceiling inlet were set as pressure inlets. The range hood was set as a velocity outlet, and a specific value was set according to the results of the air volume test. The assumed human surface temperature was 30 °C [43], and the distance from the human surface to the stove was 0.15 m. Based on the experimental results for the temperature variation in the pot body during the heating process [44], the temperature of the pot surface was 246 °C, and that of the outer wall was set at 65 °C. According to experimental data and standards, the ground temperature was assumed to be 25 °C [45], and the initial indoor temperature was assumed to be 20 °C. The pot surface was assumed to be a PM2.5 emission surface. Zhao et al. found that the PM2.5 mass velocity range of Chinese cooking is 5.3 × 10⁻⁸ kg/s–1.34 × 10−7 kg/s [10]. After the experimental analysis, this study set the mass flow rate of PM2.5 to 9 × 10⁻⁸ kg/s and the flow velocity to 0.1 m/s. For the performance evaluation and scheme optimization of the ventilation system with CMA, various structural model schemes were designed (Figure 4).
According to the household survey results [2], in the ventilation system with the WMA scheme, the window was opened at 30°. The optimal ventilation effect was achieved at this angle. The average outdoor temperature in Shenyang in winter is −9.1 °C [46]. Thus, the outdoor air intake temperature was set to −9.1 °C without special instructions. Cases 1–16, 17–20, and 21–24 were designed to study different sizes of air and ceiling inlets, different arrangements of ceiling inlets, and different uniform arrangements of circular ceiling inlets. The details of the simulation case setups are presented in Table 3. The superior performance of the ventilation system with the CMA scheme was compared with those of the ventilation systems with the WMA scheme and GMA scheme.

3.4. Grid Independence Verification

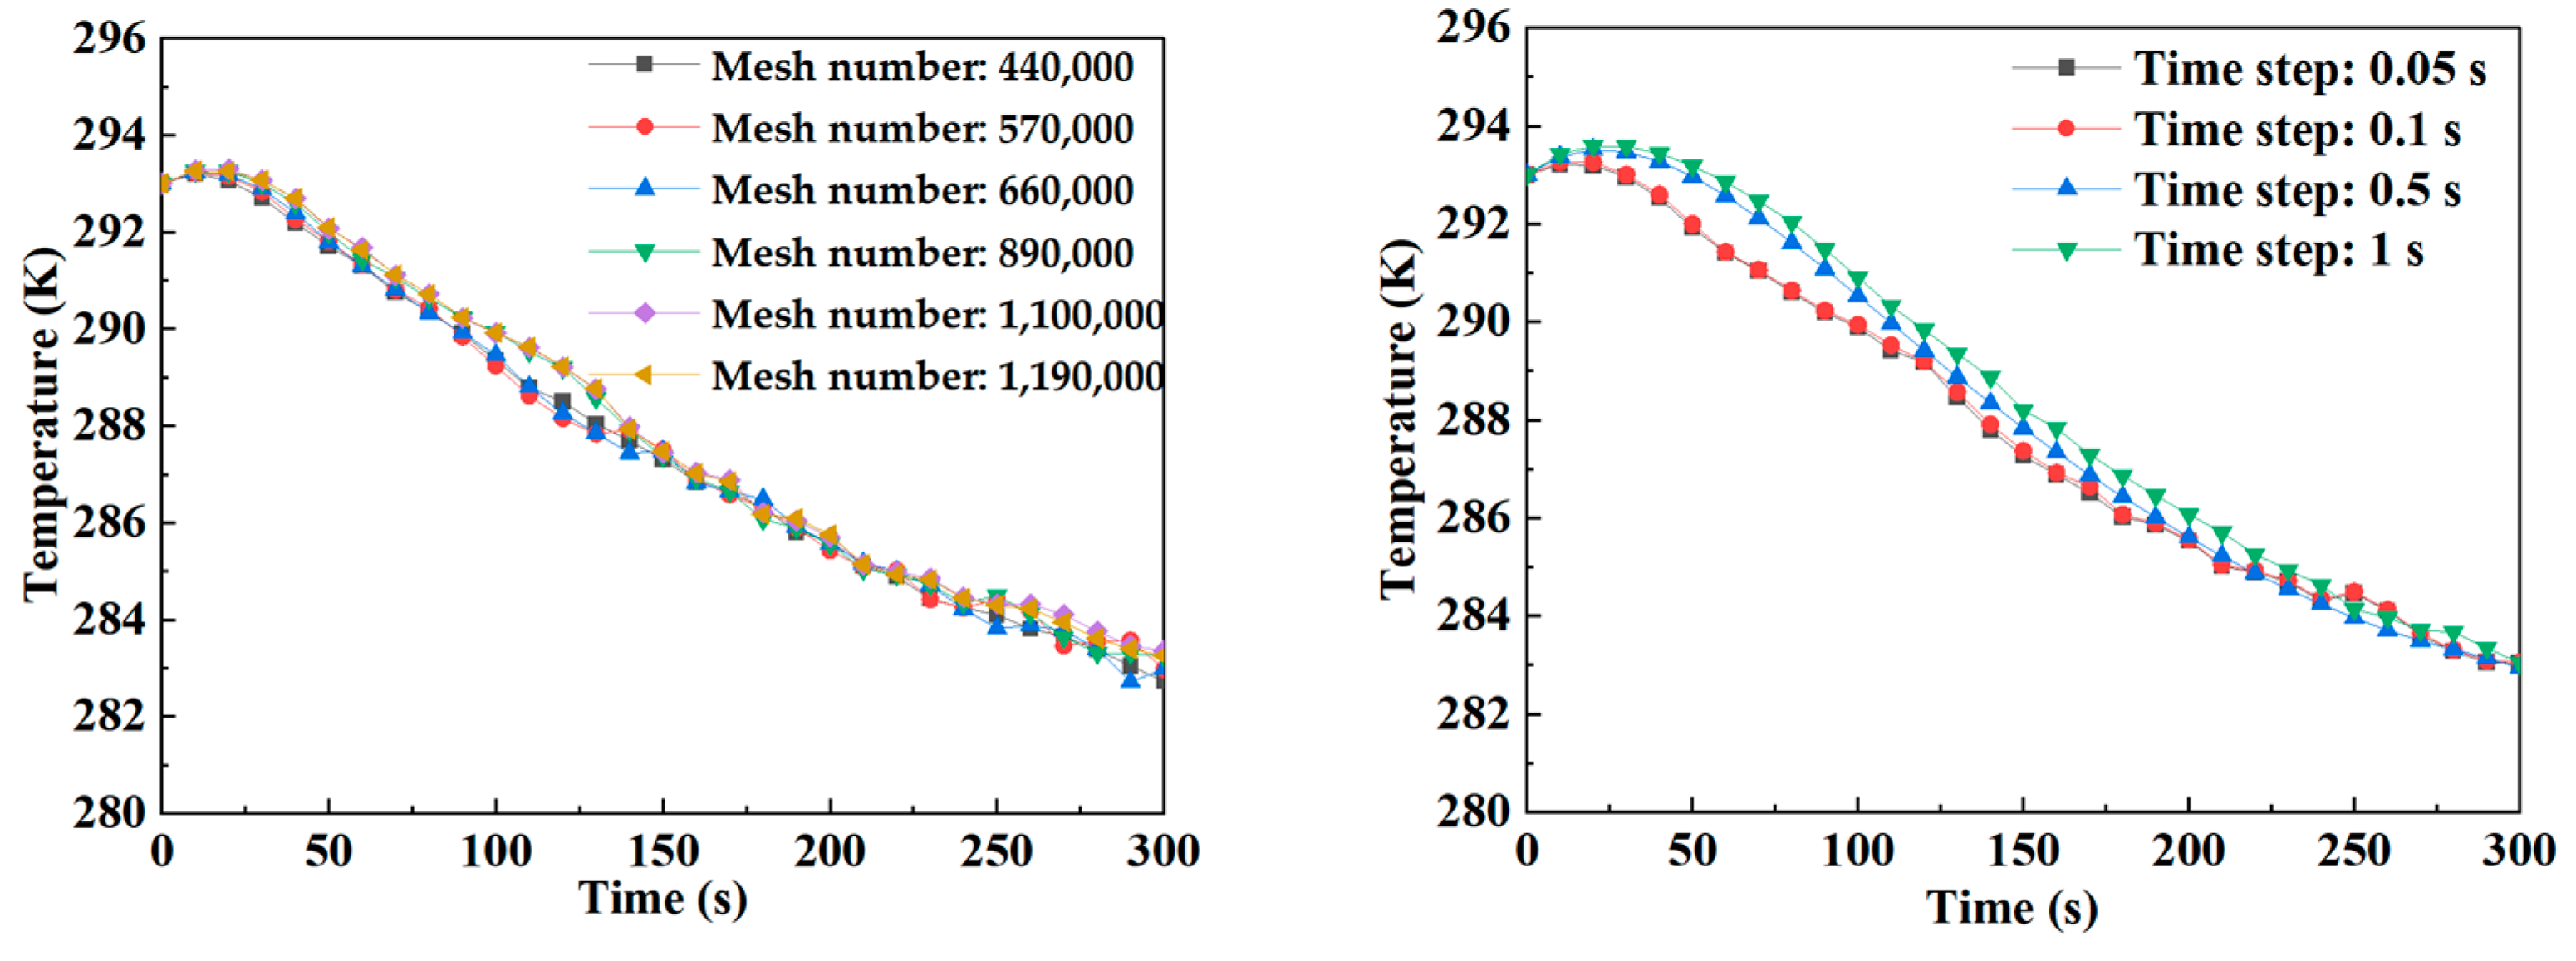
To verify the independence of the grid, the number of divided grids was increased from 440,000 to 1,190,000, and steps were set at 0.05 s, 0.1 s, 0.5 s, and 1 s. No significant differences were observed in the simulation results of the average indoor temperature shown in Figure 5. This indicates that the grid independence verification validated the number of grids and time steps. The final number of selected grids was 890,000, and the step size of 0.1 s was used for simulation calculations. The maximum dimension was 35 mm in the X, Y, and Z directions, and the minimum dimension was 2 mm.

4. Results and Discussion

4.1. Experimental Results under Ventilation Systems with CMA Scheme, WMA Scheme, and GMA Scheme

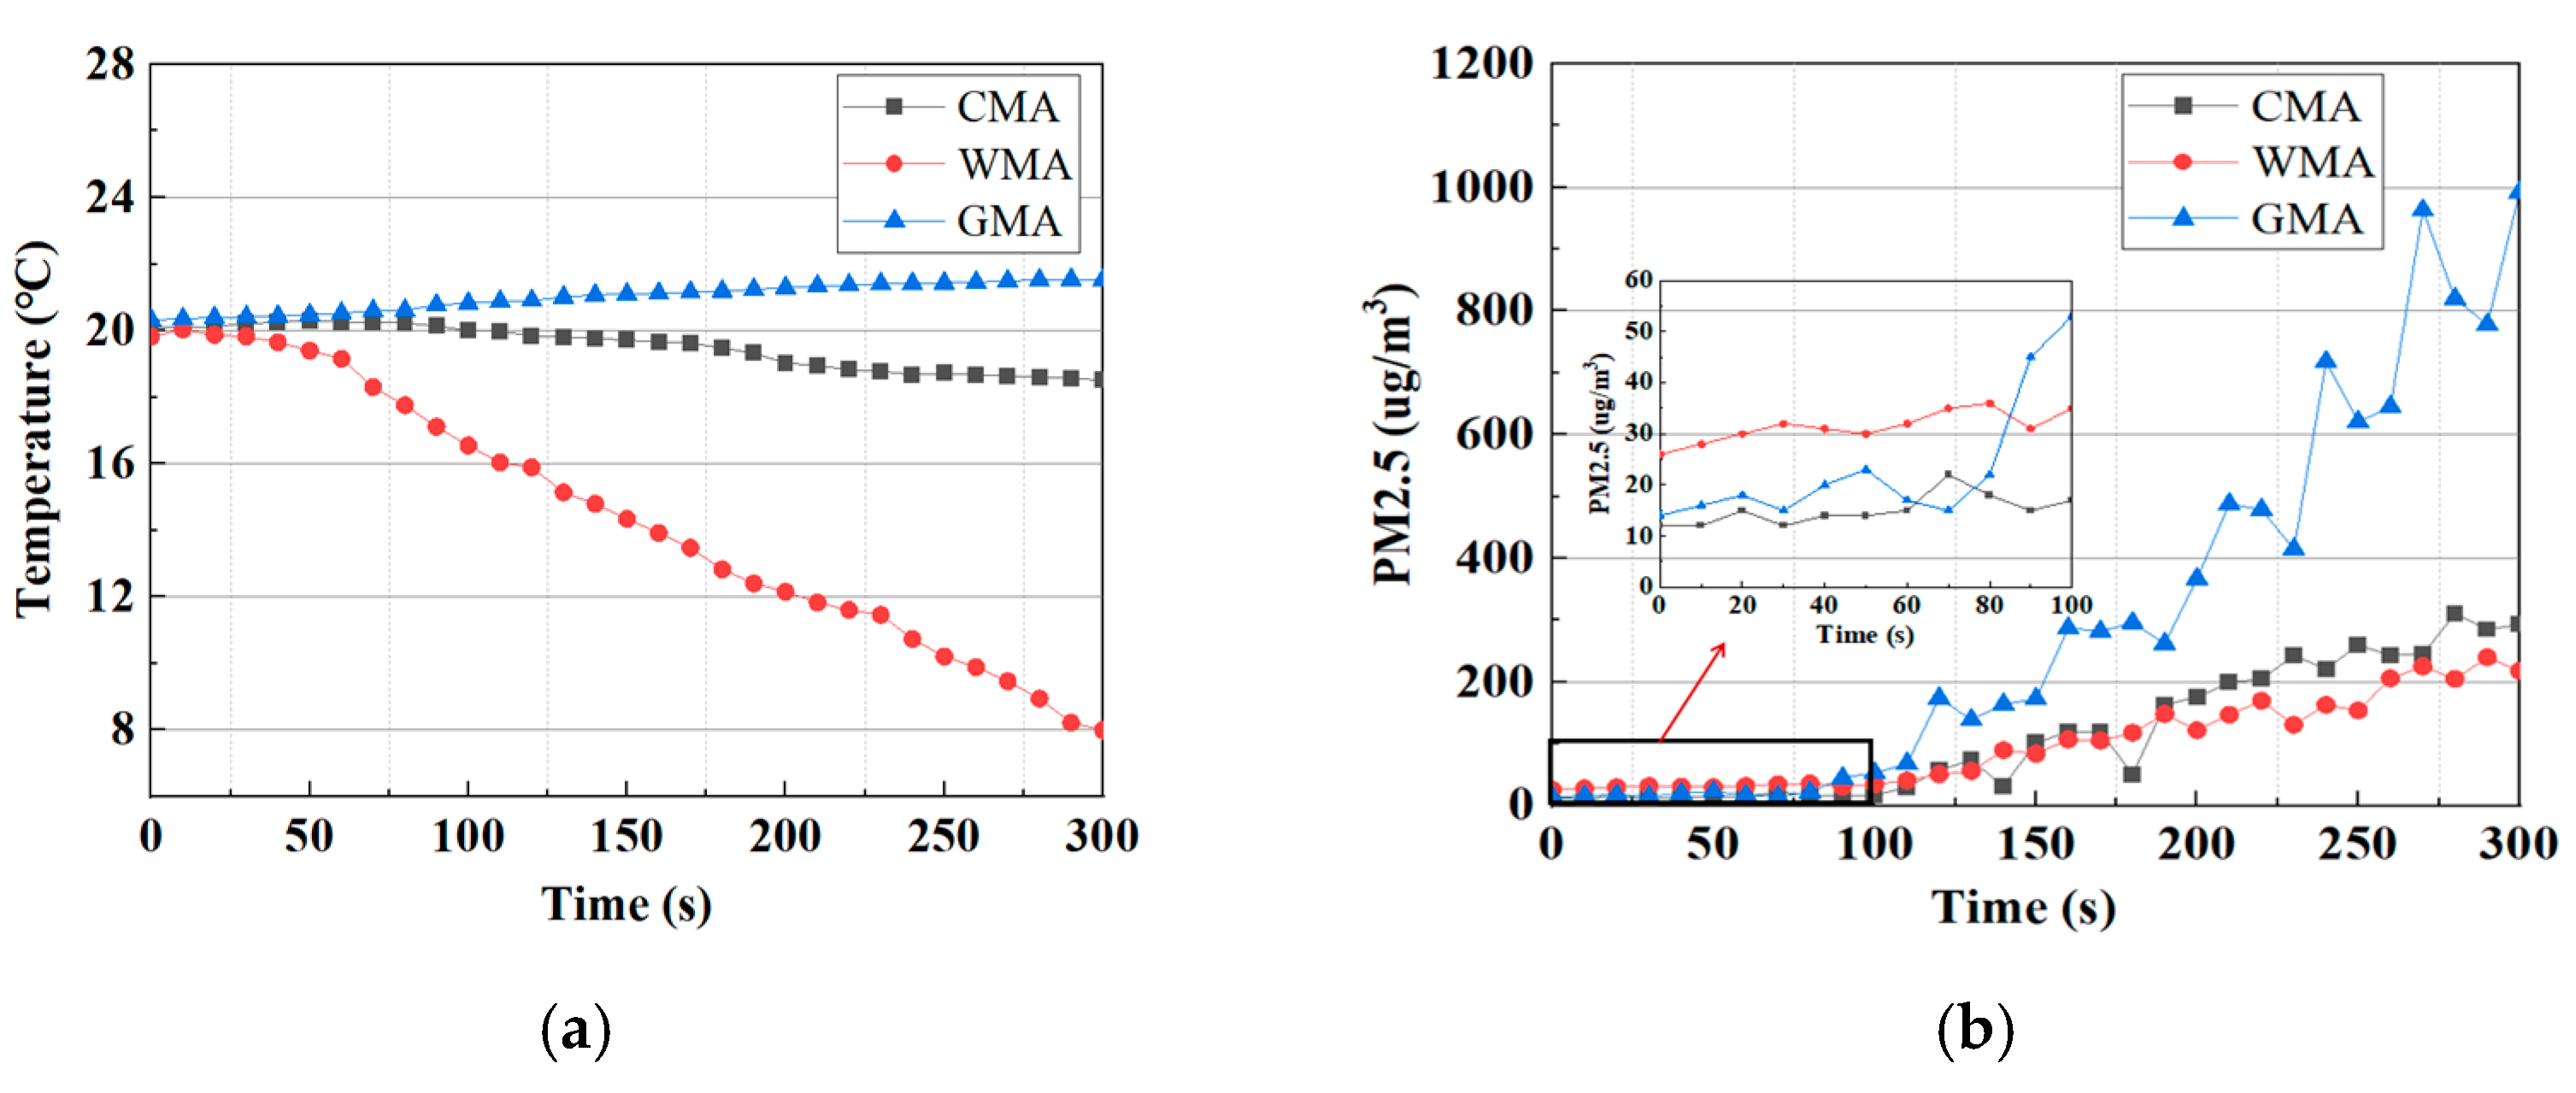
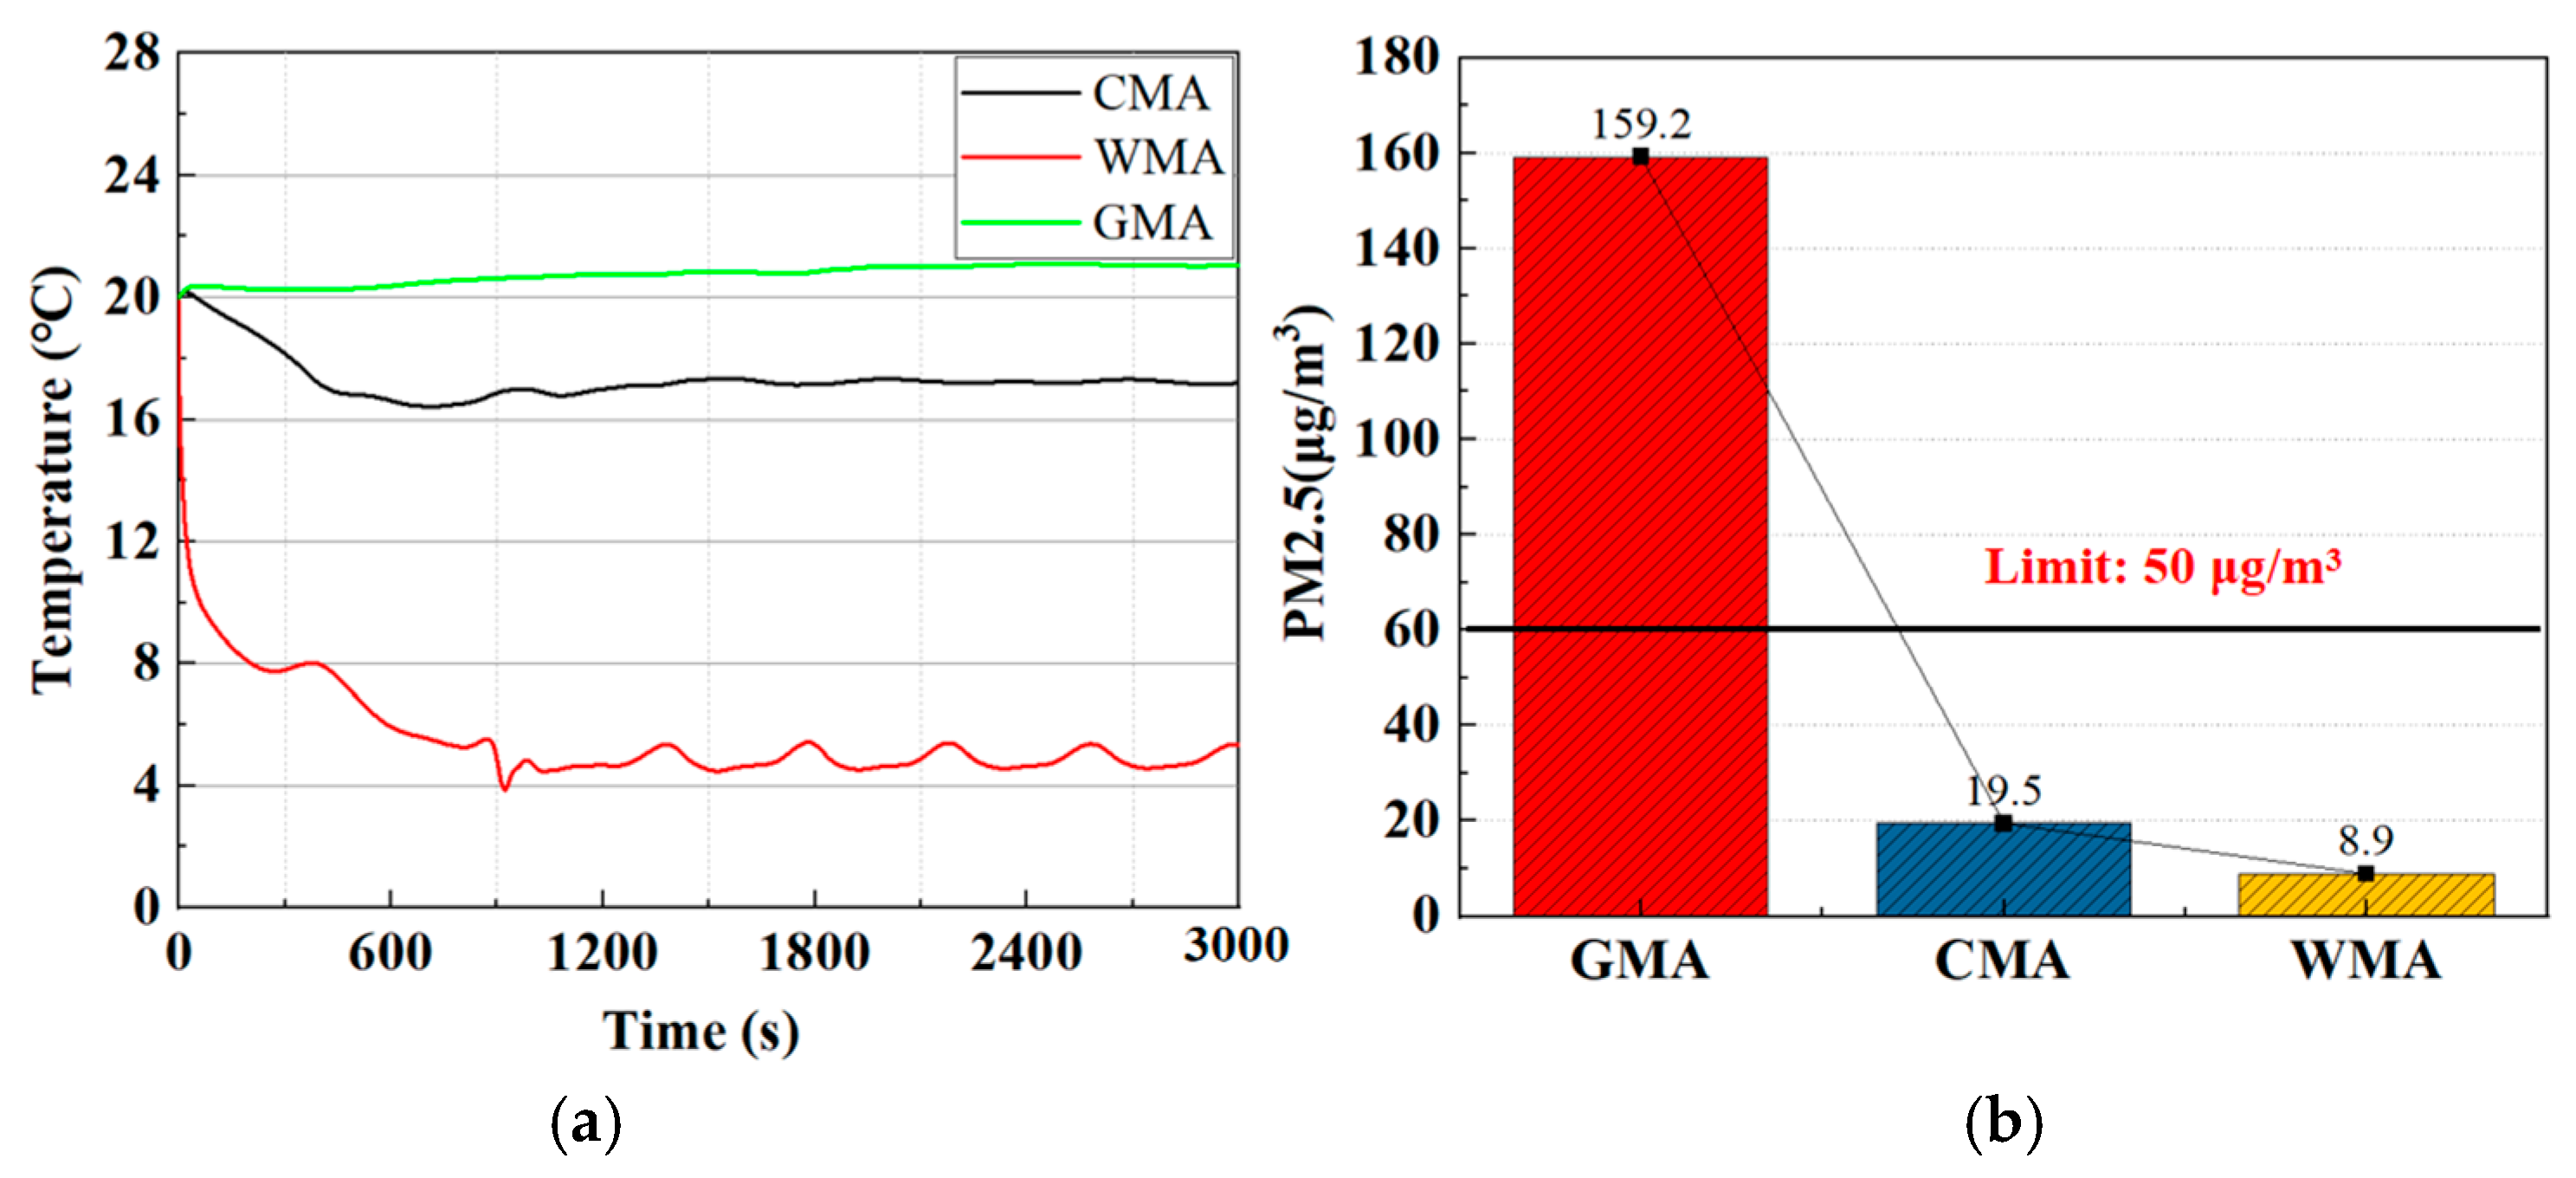
To minimize the impact of differences in experimental environmental parameters on the effectiveness of the ventilation systems, three time periods with similar outdoor and indoor temperatures were selected. During the test period, the outdoor temperatures under the ventilation systems with the CMA scheme, WMA scheme, and GMA scheme were −1.6 °C, −1.8 °C and −1.3 °C, respectively. The initial indoor temperatures were 20.1 °C, 19.8 °C, and 20.3 °C, respectively. The variations in the indoor temperature at a height of 1.4 m and PM2.5 concentration in the respiratory zone under the ventilation systems with the CMA scheme, WMA scheme, and GMA scheme are depicted in Figure 6. Under the ventilation system with a GMA scheme, the indoor temperature variation was minimal, and the concentration of PM2.5 was the highest. The concentration of PM2.5 under the ventilation system with the WMA scheme was the lowest; the indoor temperature decreased gradually by 11.9 °C. Under the ventilation system with the CMA scheme, the indoor temperature was reduced by 1.5 °C. The CMA scheme reduced the concentration of PM2.5 by 61.6% compared with the crack makeup air scheme. However, conventional ventilation methods are incapable of handling both temperature and PM2.5, whereas the ventilation system with the CMA scheme is capable of this. The indoor temperature field distribution and the control effect of pollutants under the ventilation system with the CMA scheme were similar to those of the ventilation system studied by Li and Liu et al. [7,26]. The ambient temperature was maintained within a comfortable range for the human body. This effectively reduced the concentration of pollutants.
To understand the impact of different outdoor climates on the CMA scheme, this study tested the indoor temperature (Tn) variations at the ceiling air inlet at average outdoor temperatures (Tw) of 2.5 °C, −10.2 °C, and −18.5 °C, as shown in Figure 7. Introducing fresh air into the suspended ceiling space and extending the route of the fresh air flow can increase the temperature at which fresh air enters the room. Under three outdoor temperature conditions, the temperature at the ceiling air inlet after 10 min of cooking was 14.2 °C, 6.1 °C, and 2.2 °C, respectively. That is, the temperature of outdoor fresh air entering the kitchen increased effectively. The ventilation system with CMA scheme can alleviate the discomfort caused by the rapid temperature reduction when fresh air enters the room directly.

4.2. Model Validation

The results of the makeup air change tests were 405.5 m3/h, 416.7 m3/h, and 409.3 m3/h, respectively. The fluctuation range of the results was small, with a mean value of 410.5 m3/h. The airflow velocity inside the pipeline varied significantly during the initial operation of the range hood. After 30 s, the value tended to stabilize. The results of the anemometer test were consistent with those of the tracer gas exchange method after calculation. The experimental results provide a basis for setting the boundary conditions of the range hood under the ventilation system with the CMA scheme in the simulation calculation.
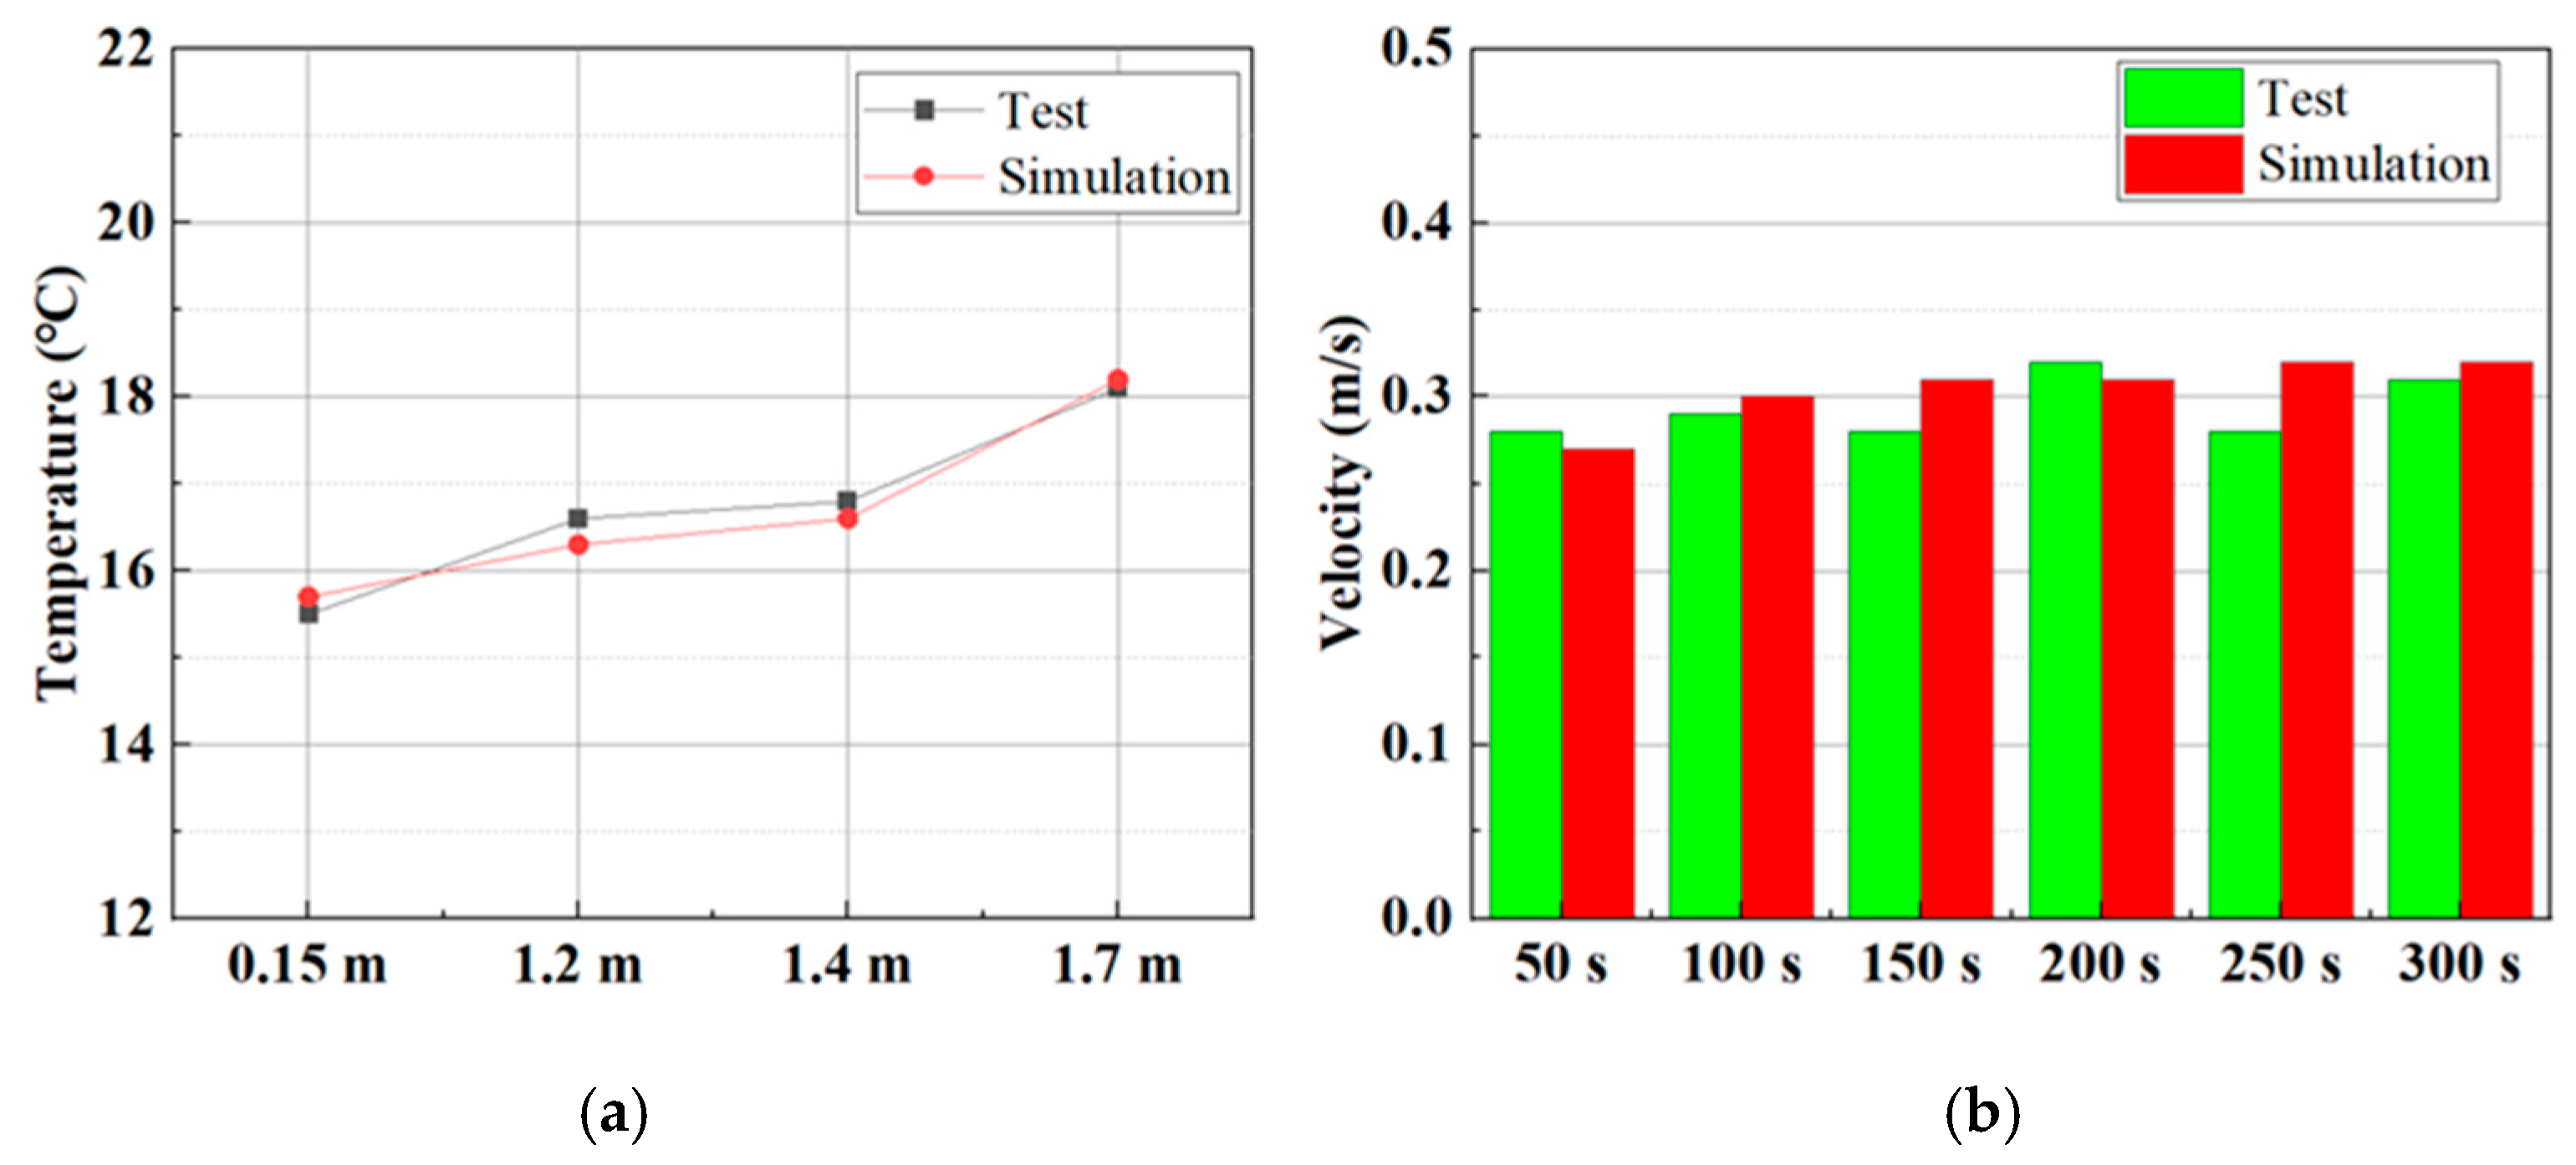
To verify the accuracy of the model, the experimental results were compared with the data from the simulation. The temperature diagram for the P2 points at 0.15 m, 1.2 m, 1.4 m, and 1.7 m above the ground in the experiment and simulation is shown in Figure 8a. It can be observed that the temperature difference between adjacent points is very small, with a maximum temperature difference of 0.3 ° C. The vertical difference is 2.6 °C. The graph of the velocity at point P2 (which is 1.4 m above the ground height) in the experiment and simulation is shown in Figure 8b. It can be observed that the amplitude of the velocity of this point with respect to time was small and that the maximum difference was 0.04 m/s. The root mean square error of velocity between the experiment and simulation was 0.02 m/s, and the average relative error was 6.1%. The root mean square error of linear temperature distribution between the experimental and simulated data was 0.2 °C. The activity of the human body could cause local changes in the flow field, and the instantaneous changes in outdoor air velocity also could cause changes in the makeup air velocity. Therefore, during the experiment, the range of the chef’s movements was limited as much as possible, and windless time periods were chosen for the experiments. However, these differences are inevitable. Thus, the inconsistency of boundary conditions between experiments and simulations is the main cause of errors.

4.3. Simulation Results

4.3.1. The Influence of the Size of Air Inlet and Ceiling Inlets

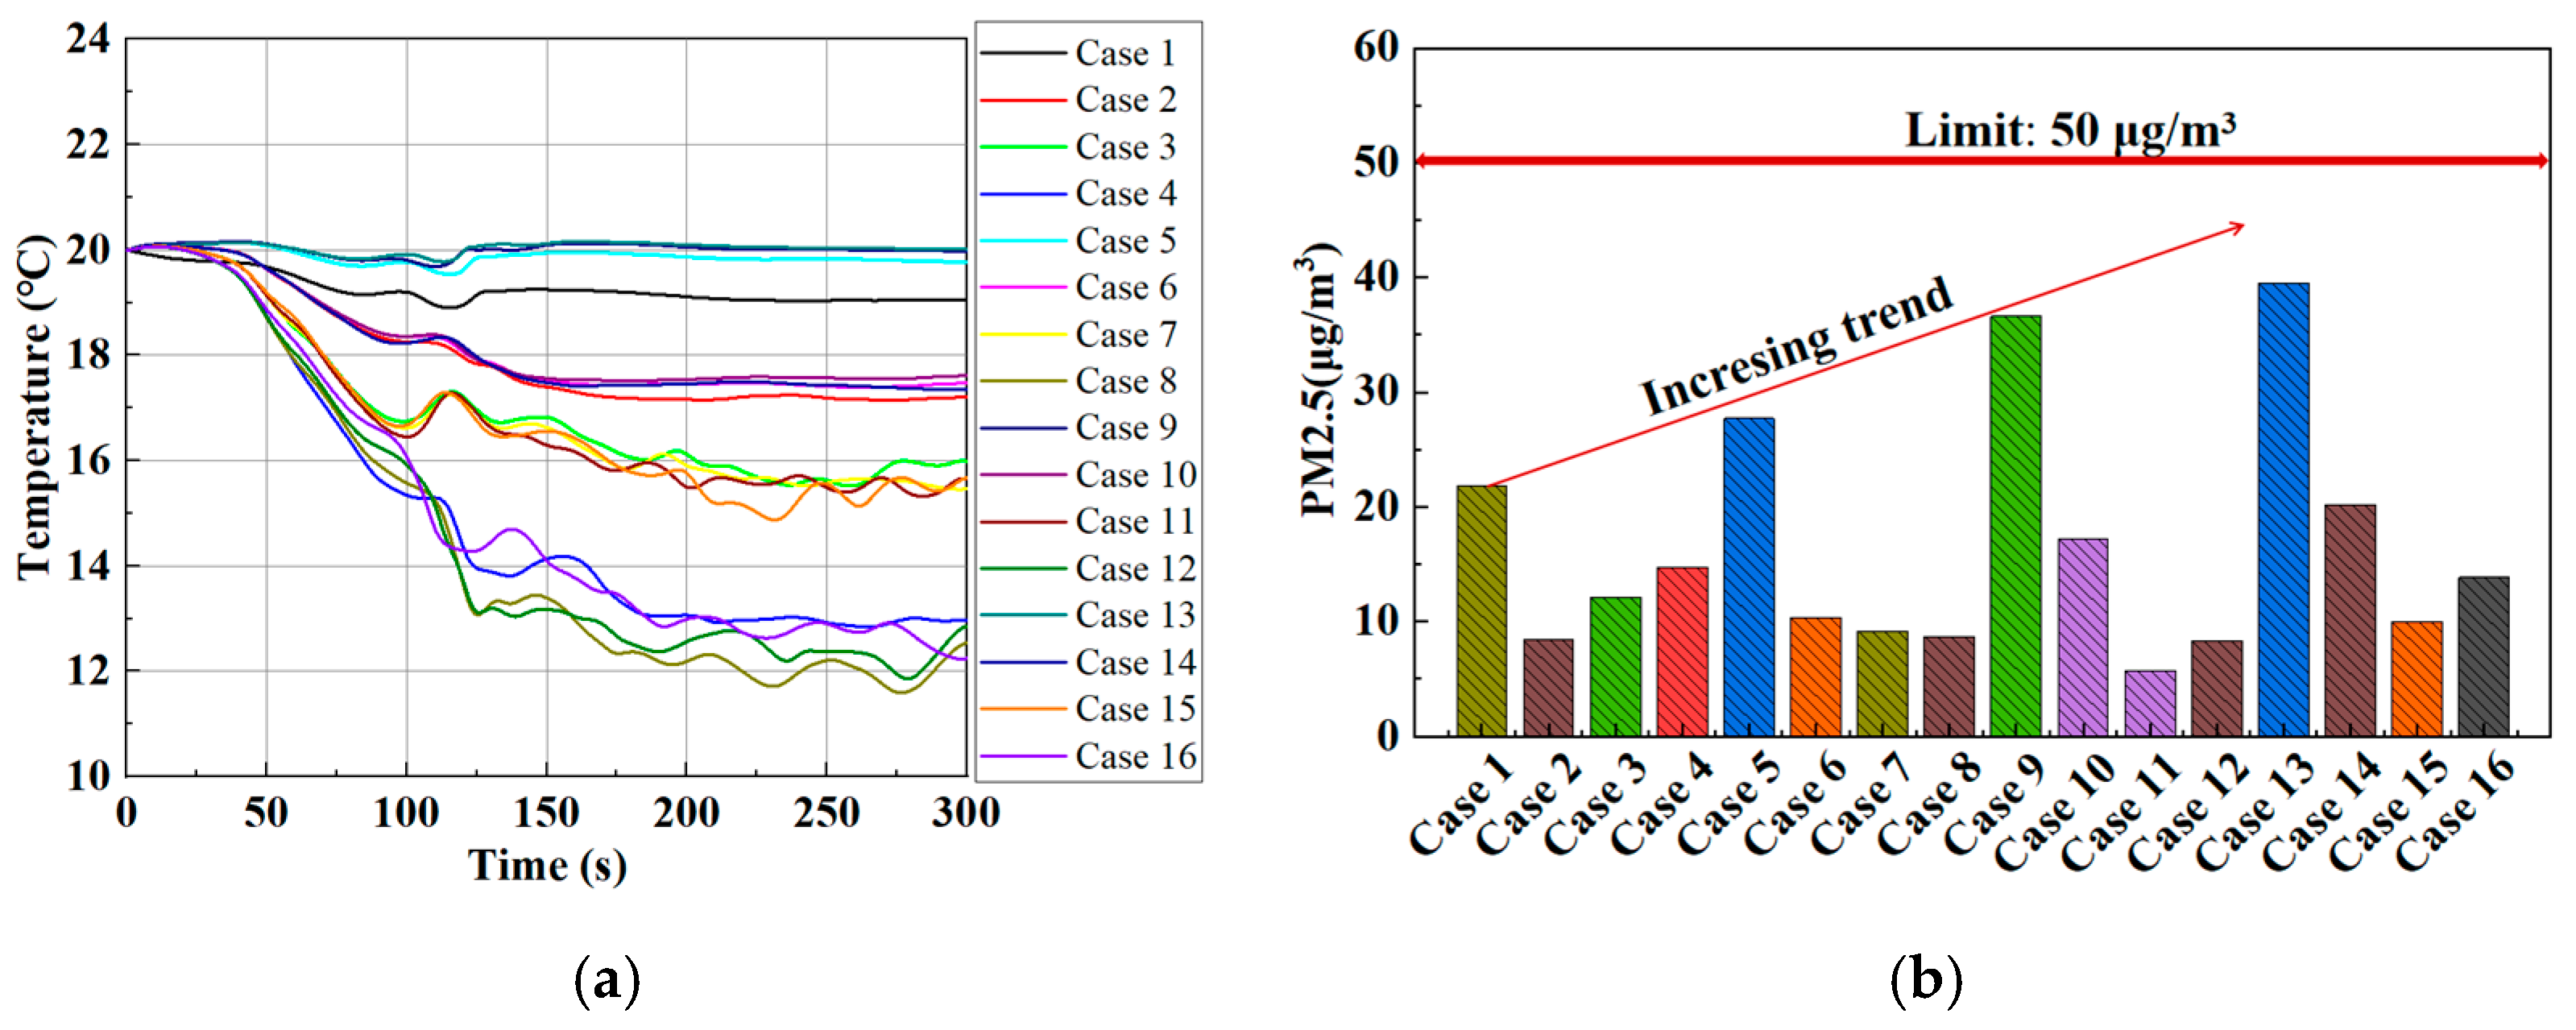
The simulation results calculated for different air inlet sizes and ceiling inlet sizes are shown in Figure 9. The temperature curves at a height of 1.4 m for Cases 1–16 are shown in Figure 9a. The indoor temperature decreased as the size of the air inlet increased. The size of the air inlet had a significant impact on the indoor temperature, with the maximum difference being 7.8 °C. The size of the ceiling inlets affects the indoor temperature, with a maximum difference of 0.9 °C. Figure 9b shows the average concentration of PM2.5 in the respiratory zone of Cases 1–16. In the cases of a ceiling air inlet with a diameter of φ 80 mm, the average concentration of PM2.5 in the respiratory zone was higher than in other cases. Compared to the impact on indoor temperature, the size of the ceiling inlets has a greater impact on the PM2.5 concentration, with a maximum difference of 17.7 μg/m3. Similar to the impact on indoor temperature, the size of the air inlet also has a significant impact on PM2.5 concentration, with a maximum difference of 30.9 μg/m3. The concentration of PM2.5 did not decrease with the increase in the size of the air inlet and ceiling inlet. In Cases 1–16, the indoor comprehensive environment in Case 2 was better than in other cases. The indoor temperature only decreased by 2.5 °C, and the PM2.5 concentration in the respiratory zone was 8.4 μg/m3, which can effectively balance the indoor temperature and PM2.5 concentration. The control effect of pollutants was consistent with the results of the study by Liu et al. [26]. Both were below the standard requirement limit of 50 μg/m3 [47].

4.3.2. The Influence of the Layout and Shape of the Ceiling Inlets

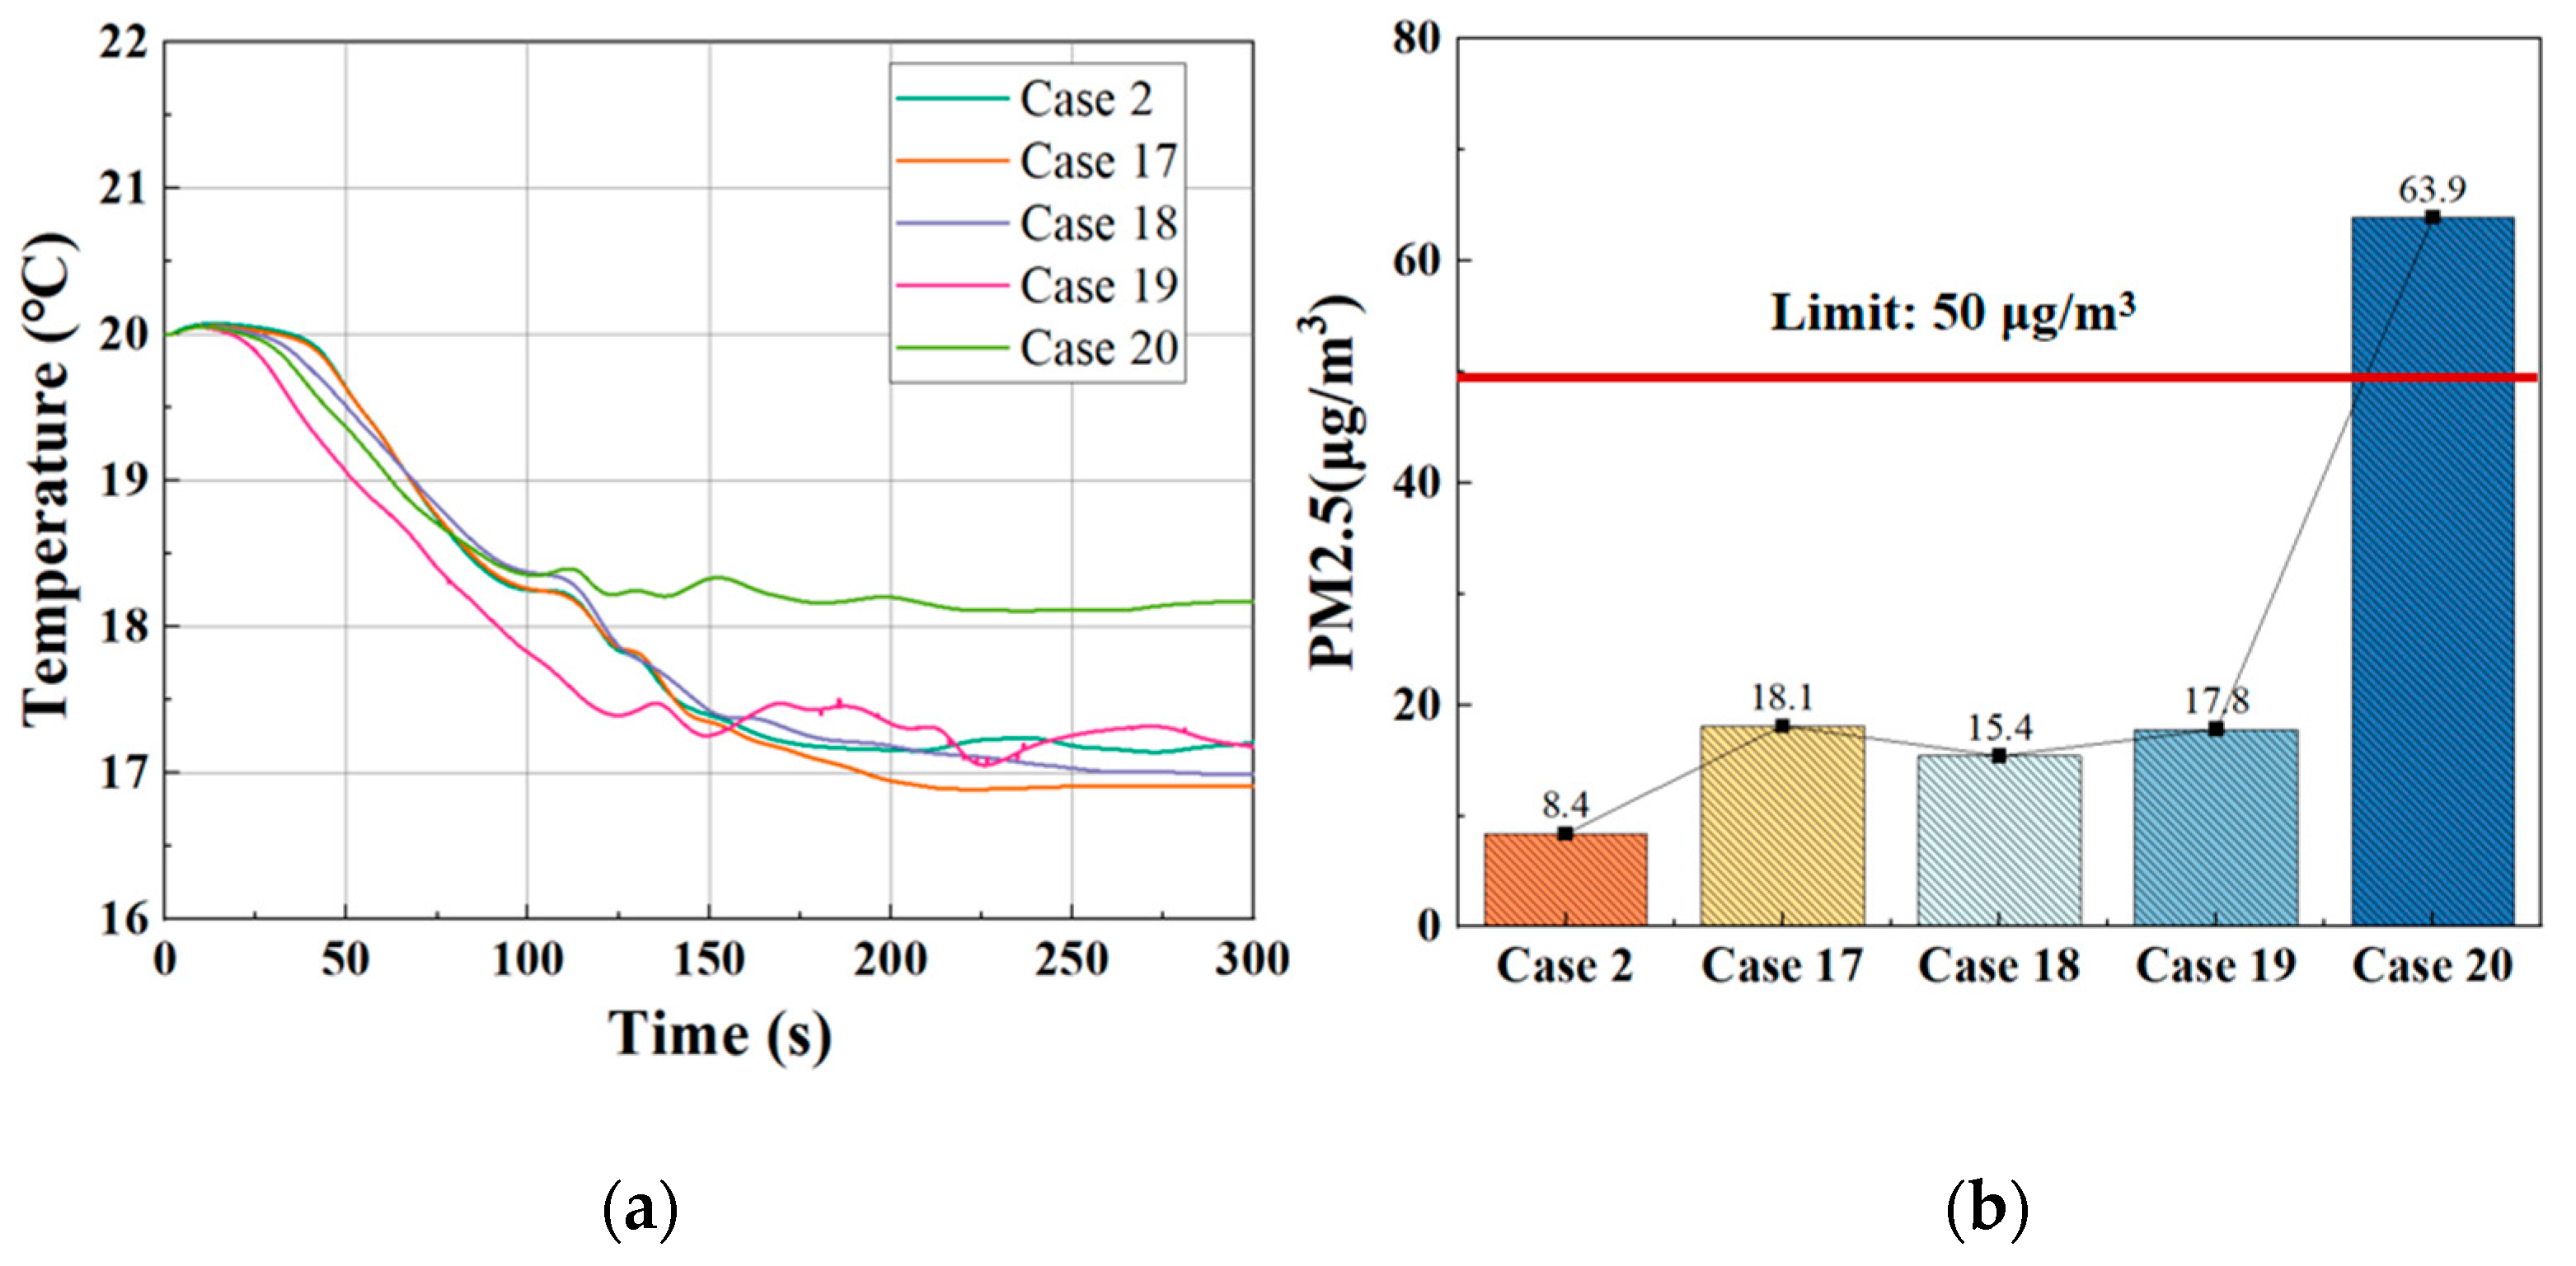
The calculation results for the various ceiling inlet layouts are shown in Figure 10. Figure 10a shows the variation in the temperature curve for Case 2 and Cases 17–20. The indoor temperature was highest in Case 20 and lowest in Case 17, with a difference of 1.3 °C. The average concentrations of PM2.5 in the respiratory zone of Case 2 and Cases 17–20 are shown in Figure 10b. The average PM2.5 concentration in the respiratory zone was highest in Case 20 and lowest in Case 2, with a difference of 55.5 μg/m3. The configuration of the ceiling inlets in Case 20 generated a reflux zone around the human body unlike that in the other cases. This leads to an increase in the temperature around the human body, as well as an increase in the concentration of PM2.5 in the respiratory zone. The layout of ceiling inlets has a relatively small impact on the indoor temperature and PM2.5 concentration, except for in Case 20.
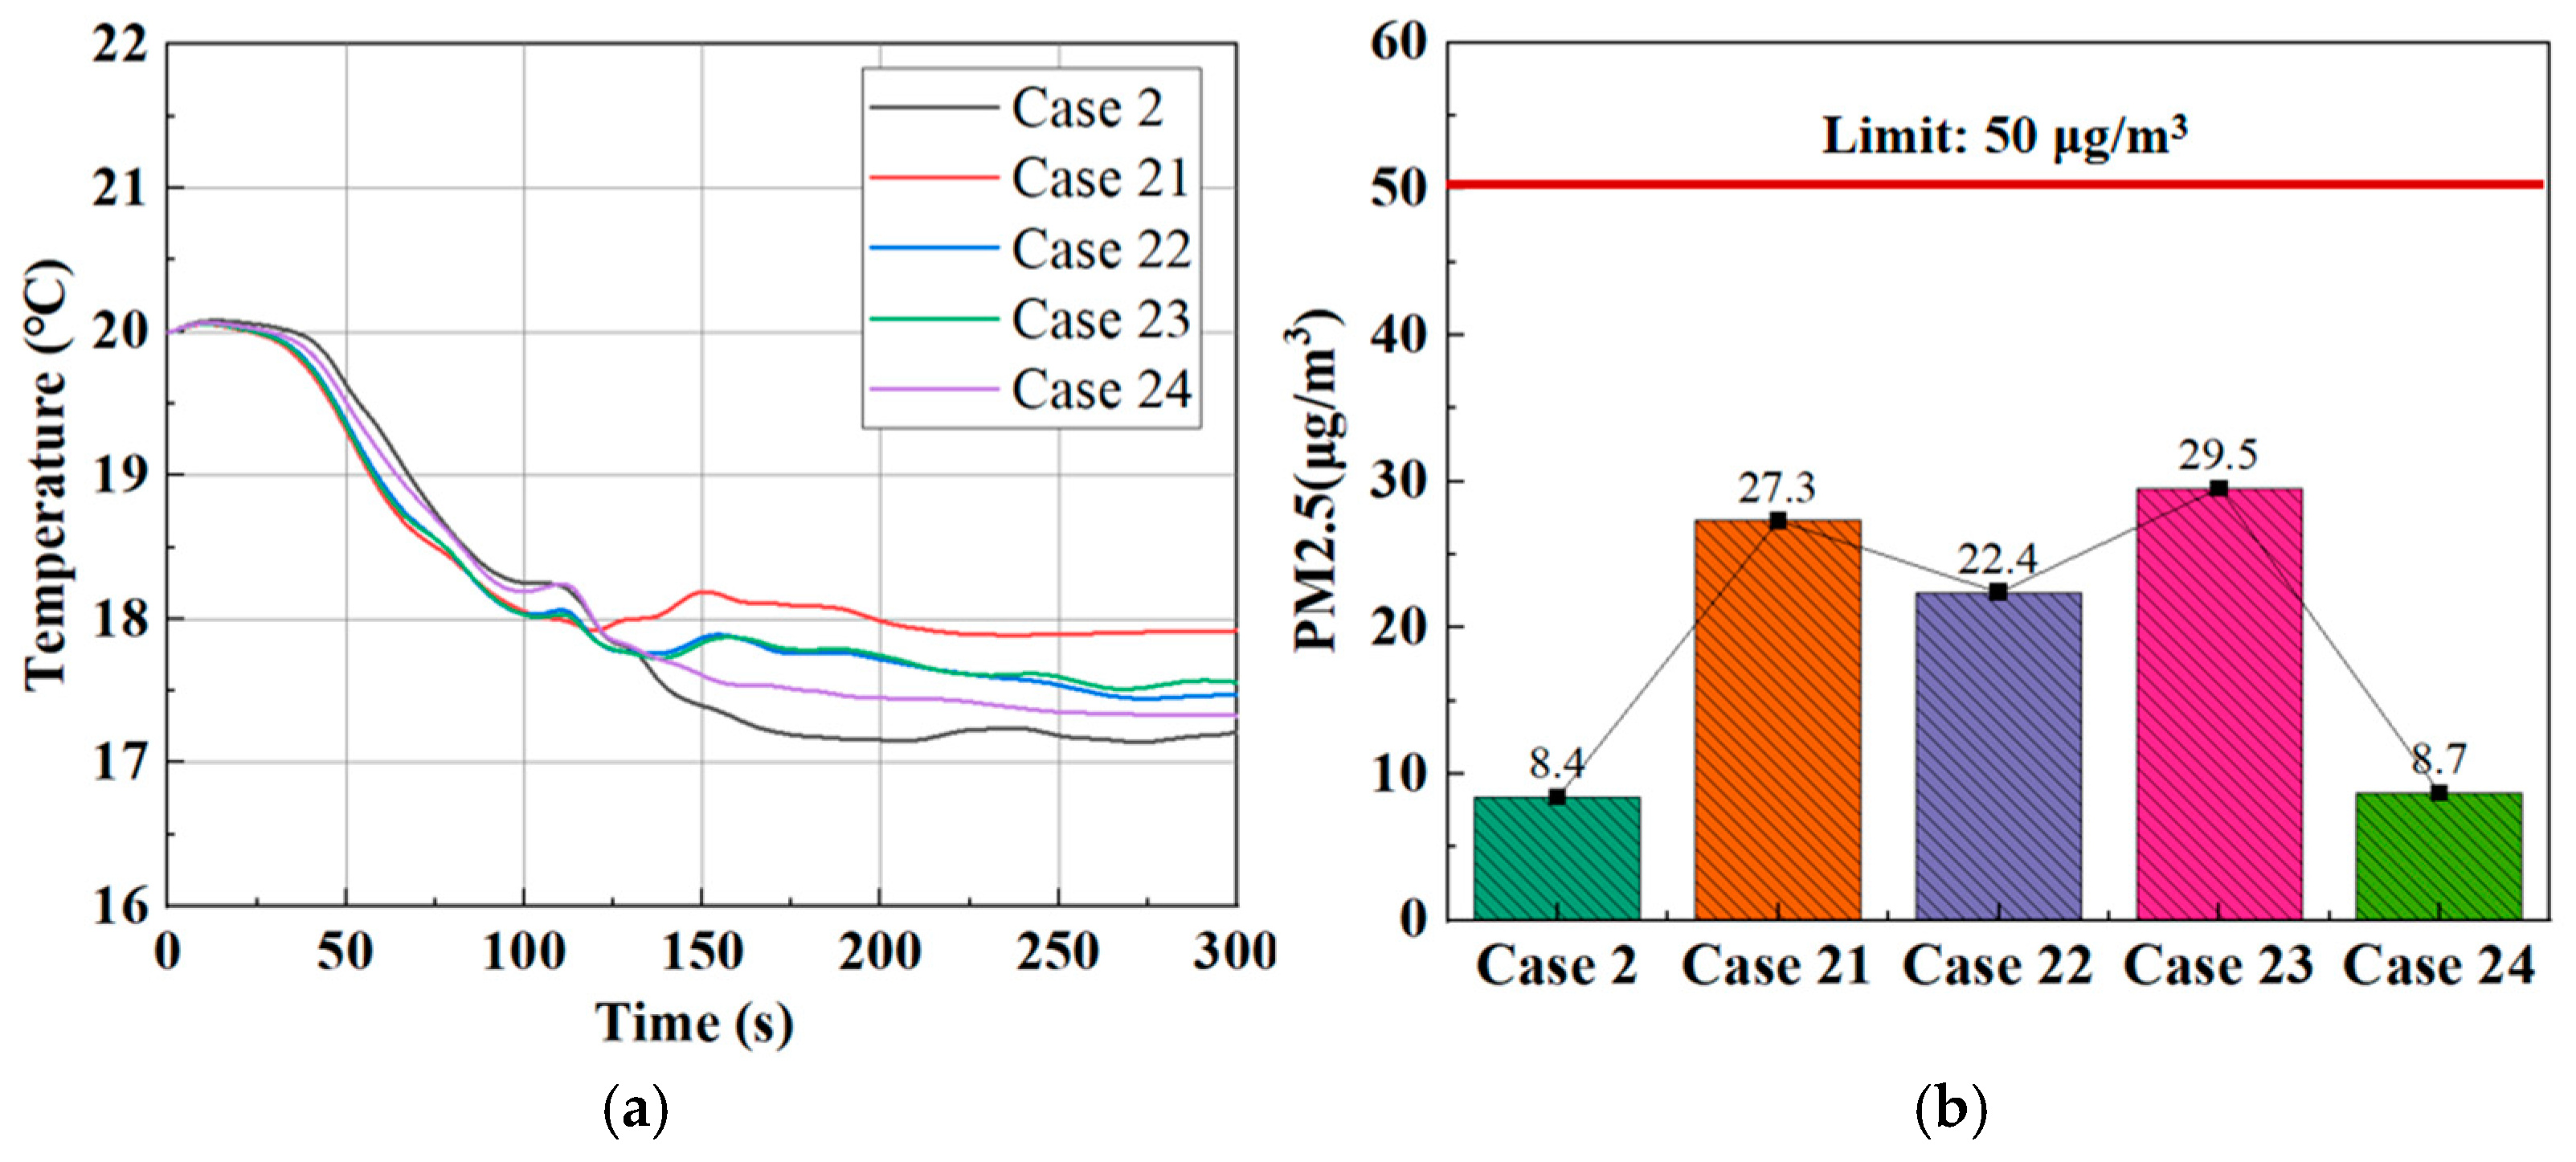
The calculation results for the square ceiling hole and uniformly arranged circular ceiling inlets are shown in Figure 11. Under the uniformly arranged circular ceiling inlets, the indoor temperature was highest in Case 21 and lowest in Case 24, with a difference of 0.6 °C. The average PM2.5 concentration in the respiratory zone was highest in Case 23 and lowest in Case 24, with a difference of 20.8 μg/m3. Compared with Case 2, the indoor temperature increased by a maximum of 1.1 °C, and the concentration of PM2.5 in the respiratory zone also increased by a maximum of 21.1 μg/m3. The shape of the ceiling inlets and the size of the single opening influenced the indoor temperature and PM2.5 concentration in the respiratory zone. However, this effect was relatively marginal.

4.3.3. Respiratory Zone Parameters under Kitchen Ventilation System with CMA, WMA, and GMA

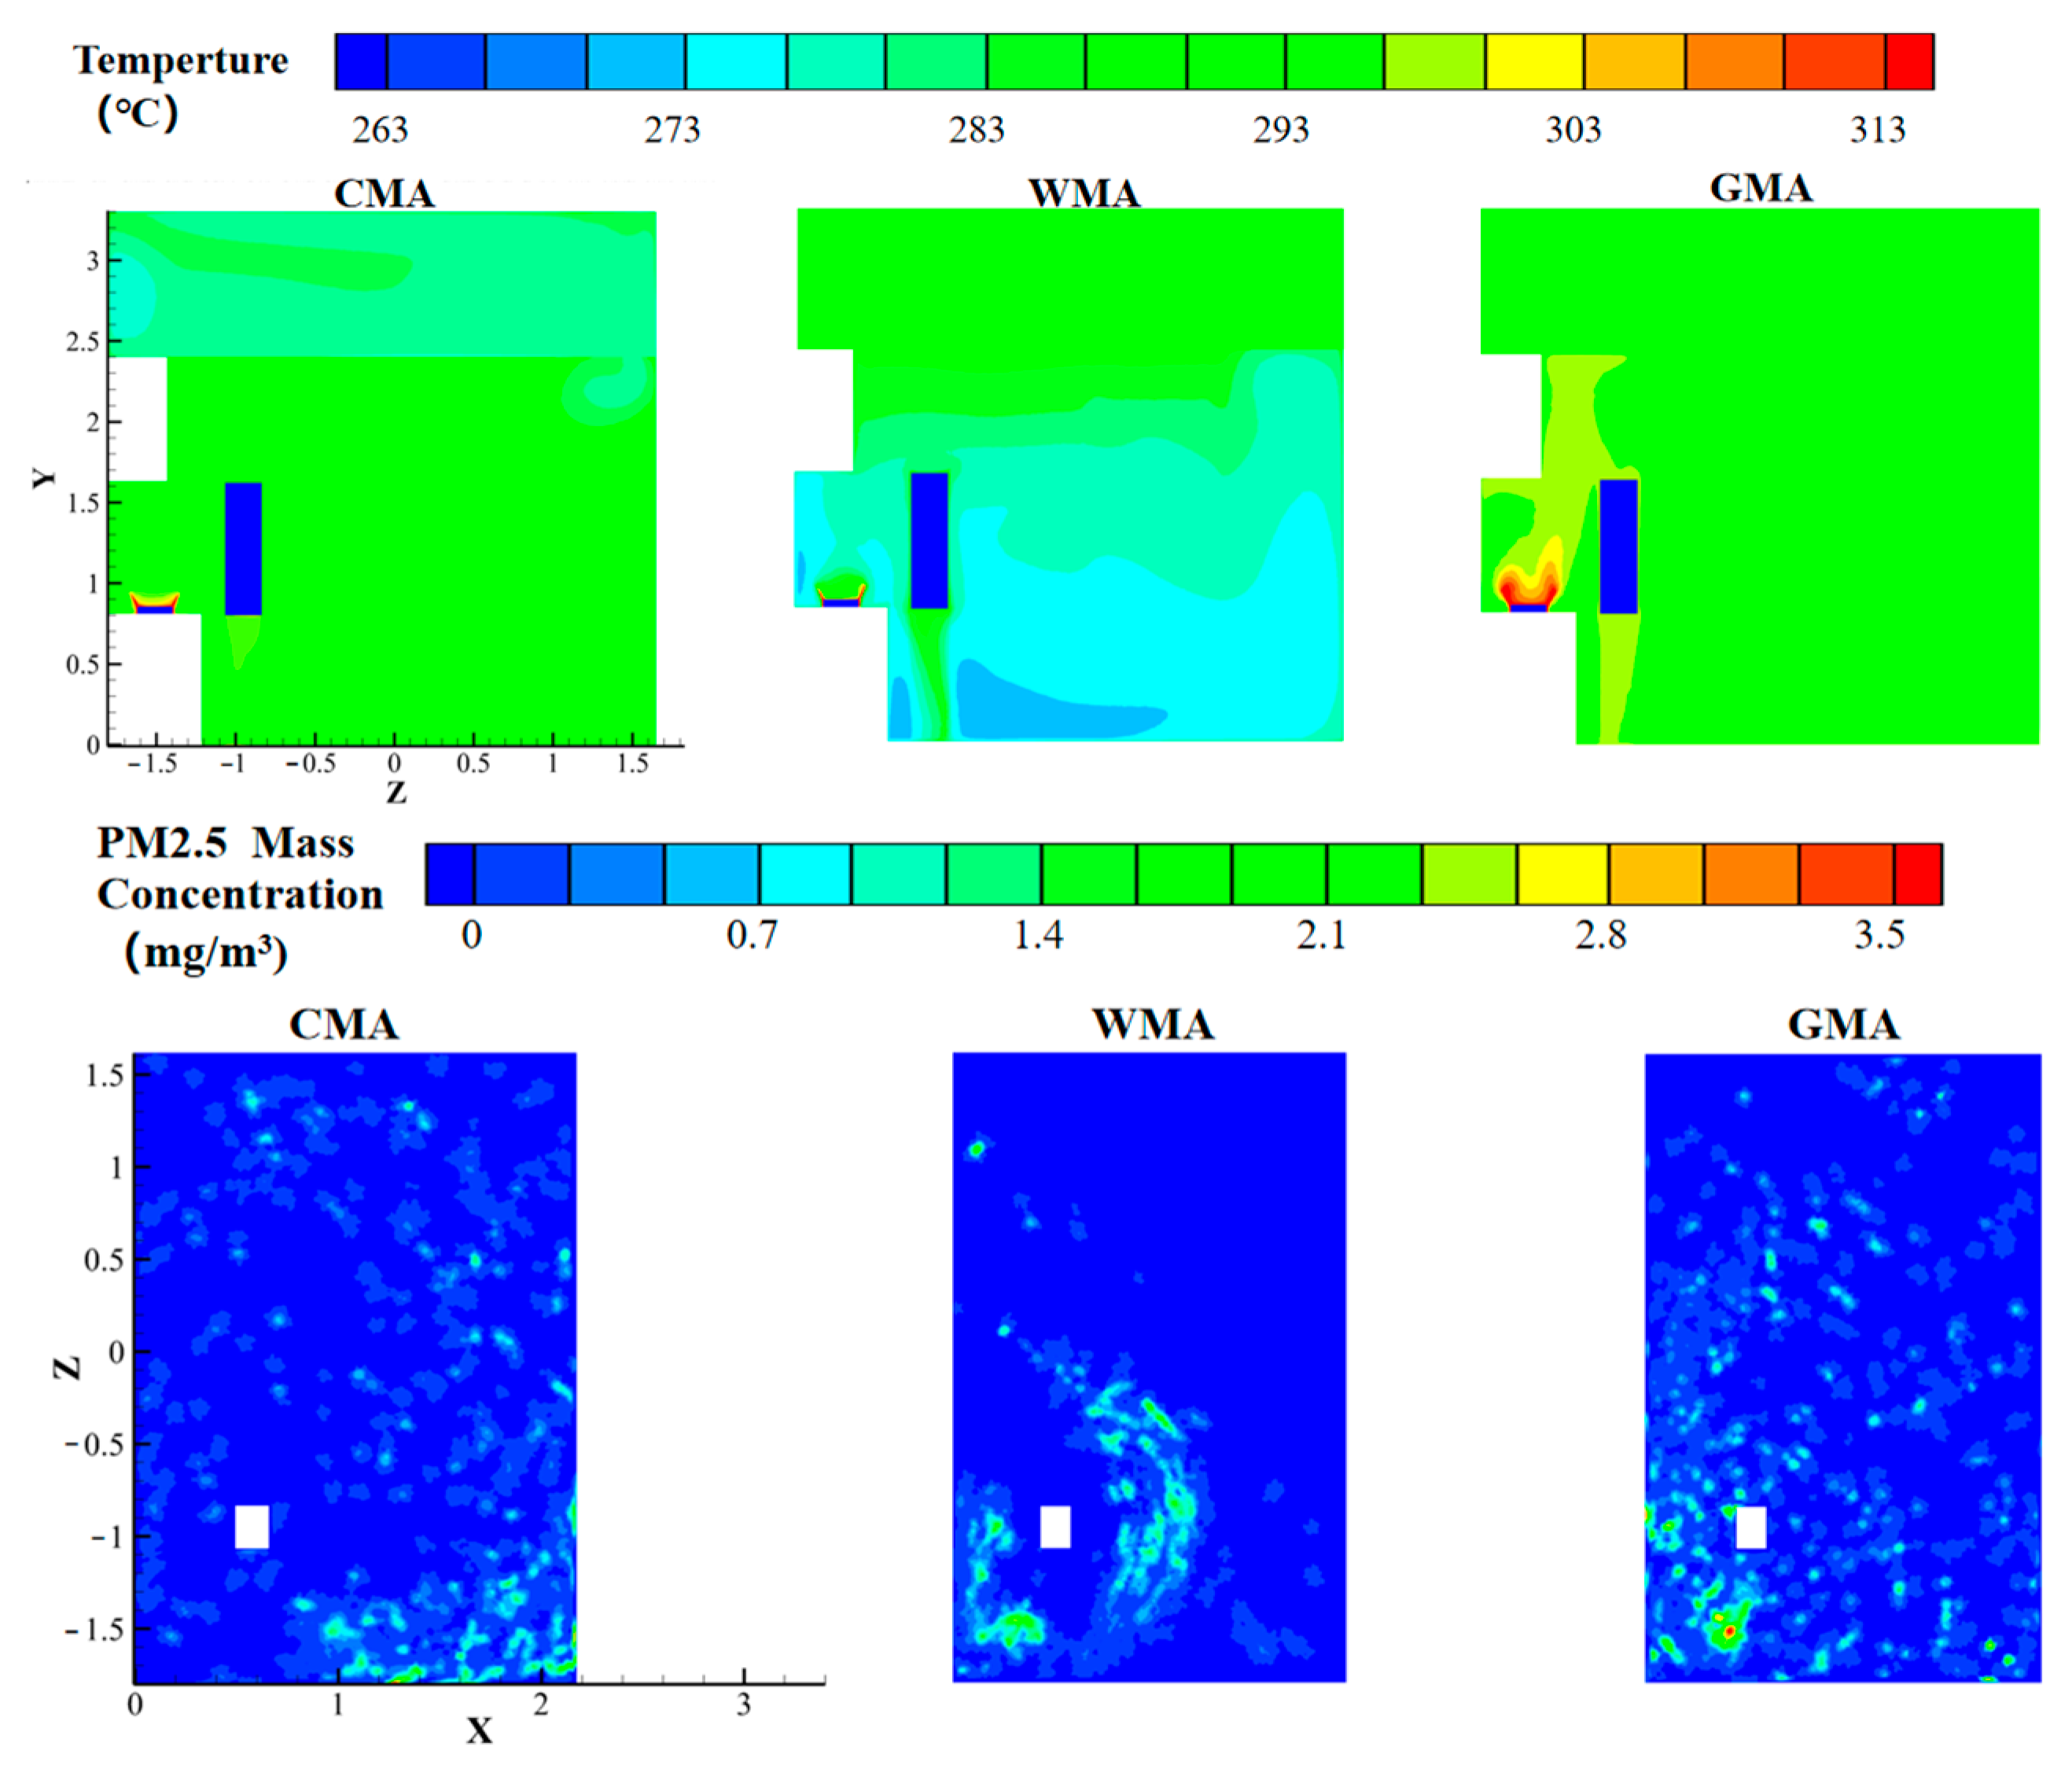
The limitation of this experiment is its capability to test only a few selected points. To comprehensively understand the distribution of monitoring parameters in the kitchen area, simulation methods were used to calculate the distribution of the indoor temperature and PM2.5 concentration in the respiratory zone under the ventilation system with the CMA scheme (Case 2), WMA scheme, and GMA scheme. The distributions of the indoor temperature at X = 0.56 m and PM2.5 concentration at Y = 1.4 m under three ventilation schemes are presented in Figure 12. Under the ventilation system with the WMA scheme, the indoor temperature distribution underwent significant variations. Additionally, the PM2.5 concentration in the breathing area of the human body was maintained at a low level, owing to the adequate ventilation volume. Although the overall concentration of indoor PM2.5 was low, due to the unreasonable airflow organization, the concentration of PM2.5 on the left side of the body was relatively high. Under the ventilation system with the CMA scheme, the indoor temperature distribution demonstrated less variation and a lower PM2.5 concentration in the human respiratory zone. Under the ventilation system with the GMA scheme, the indoor temperature distribution varied less. However, the PM2.5 concentration in the human respiratory zone was also higher owing to the small ventilation volume.
The variation curves of the average temperature around the human body and the average PM2.5 concentration in the human respiratory area under the ventilation systems with the CMA scheme, WMA scheme, and GMA scheme are shown in Figure 13. The overall variation trends of the parameters were consistent with the experimental results. Under the ventilation system with the WMA scheme, the average temperature decreased rapidly by 14.8 °C. In addition, the average concentration of PM2.5 in the respiratory zone was the lowest, which was consistent with the experimental results. Under the ventilation system with the CMA scheme, the indoor temperature reduced by 2.9 °C. Under the GMA scheme, the indoor temperature distribution varied the least (by 1.4 °C), and the average PM2.5 concentration in the human respiratory zone was the highest. The CMA scheme reduced the concentration of PM2.5 by 87% compared with the GMA scheme. The results of the experiment and simulation show that the ventilation system with the CMA scheme can achieve an effective trade-off between indoor air temperature maintenance and air quality aggravation.
This study found that the size of the air inlet and the position of the ceiling have a significant impact on indoor environmental parameters, whereas the size and shape of the ceiling have a relatively small impact on the indoor environment. This conclusion can guide future research on ceiling ventilation systems to focus on optimizing the design of the air inlet size and ceiling inlet position. Based on the research presented in this article, it was found that under the CMA scheme, the indoor PM2.5 concentration and the values of temperature are better in the range of 120–160 mm for the air inlet size. When the ceiling air inlet is symmetrically placed, the indoor PM2.5 concentration value is the highest. Therefore, this article suggests avoiding the use of symmetrically arranged suspended ceiling air inlets in practical application design and prioritizing the size of the external wall air inlet in the range of 120–160 mm.
The ventilation system with the CMA scheme significantly improves air quality by slightly reducing the indoor temperature. Under the CMA scheme, the PM2.5 concentration in the human respiratory zone was less than 50 μg/m3, and the indoor temperature was only reduced by 2–3 °C. The vertical temperature difference between the head and feet was less than 3 °C, which meets the requirements of ASHRAE55 standards [48]. However, there are individual differences in human thermal comfort, so there are limitations to the evaluation of this part. The structure and layout of the kitchen are diverse, while the kitchen model studied in this article is relatively single. Therefore, the applicability and suggestions of the proposed ventilation system with the CMA scheme had limitations. In order to better study the applicability of the ventilation system with the CMA scheme, machine learning and other methods could be employed to collect a large amount of kitchen data in the later stage to predict the applicability of ceiling ventilation methods in various kitchens.

5. Conclusions

For an effective trade-off between indoor air temperature maintenance and air quality aggravation in severely cold regions, this paper proposed a ventilation system with a new ceiling makeup air scheme. The improvement in the indoor air environment in the kitchen was studied through experimental tests and CFD simulations. This study reached the following conclusions:
  • The CMA scheme effectively balanced indoor temperature maintenance and air quality aggravation during winter in a severely cold region. Under the representative outdoor cold condition of −9.1 °C in Shenyang, China, the CMA scheme reduced the concentration of PM2.5 by 87% compared with the GMA scheme. Moreover, it increased the indoor temperature by over 11.9 °C compared with the WMA scheme. Under the CMA scheme, the indoor temperature remains above 17 °C, and the PM2.5 concentration is below 50 μg/m3.
  • The average relative error between the experimental and simulated data is within 6.1%. The experimental results showed that there was a minimal difference in the PM2.5 concentration and indoor temperature changes in the kitchen under the ventilation systems with the CMA scheme, WMA scheme, and GMA scheme during the initial cooking stage. The difference appears and increases after cooking for 50 s and 100 s, respectively. The vertical temperature difference between the head and feet was 2.6 °C under the ventilation system with the CMA scheme.
  • In the CMA scheme, the size of the air inlet had the largest impact. This was followed by the layout of the ceiling inlets and the size and shape of the ceiling inlets. Considering the temperature around the human body and the concentration of PM2.5 in the breathing zone, this article recommends using the CMA scheme with the air inlet diameter range of 120–160 mm, which achieves good performance in balancing the two environmental parameters.
  • The layout of the ceiling inlets had a significant impact on the PM2.5 concentration in the respiratory zone. However, it had a relatively minor impact on the temperature around the human body. When the ceiling inlets are symmetrically arranged, the PM2.5 concentration in the breathing zone is the highest, reaching 63.9 μg/m3. Therefore, this article does not recommend a symmetrical arrangement of ceiling inlets.

Author Contributions

Conceptualization, X.L., K.H. and G.F.; Data curation, X.L. and A.L.; Formal analysis, X.L. and G.C.; Funding acquisition, X.L. and K.H.; Investigation, X.L. and A.L.; Methodology, X.L. and K.H.; Project administration, K.H. and G.F.; Resources, X.L., K.H. and G.F.; Software, X.L. and X.T.; Supervision, K.H. and G.F.; Validation, X.L., K.H. and G.F.; Visualization, X.L.; Writing—original draft, X.L.; Writing—review and editing, X.L., K.H. and G.C. All authors have read and agreed to the published version of the manuscript.

Funding

The research was supported by the National Natural Science Foundation of China (Grant No. 52178082), the Liaoning Province “Xingliao Talent Plan” Project (XLYC2203184), and the Youth Project of the Education Department of Liaoning Province in 2022 (LJKQZ20222323).

Institutional Review Board Statement

Not applicable.

Informed Consent Statement

Informed consent was obtained from all subjects involved in the study.

Data Availability Statement

The data presented in this study are available upon request from the corresponding author. The data are not publicly available due to the requirement of the funding project.

Conflicts of Interest

The authors declare no conflicts of interest.

References

  1. Huang, K.L.; Song, J.S.; Feng, G.H.; Chang, Q.P.; Jiang, B.; Wang, J.; Sun, W.; Li, H.X.; Wang, J.M.; Fang, X.S. Indoor air quality analysis of residential buildings in northeast China based on field measurements and longtime monitoring. Build. Environ. 2018, 144, 171–183. [Google Scholar] [CrossRef]
  2. Wag, J.; Huang, K.L.; Feng, G.H.; Song, J.S. Analysis of winter formaldehyde and volatile organic compound pollution characteristics of residential kitchens in severe cold regions of northeast China. Indoor Built Environ. 2021, 30, 1226–1243. [Google Scholar] [CrossRef]
  3. Huang, K.L.; Sun, W.; Feng, G.H.; Wag, J.; Song, J.S. Indoor air quality analysis of 8 mechanically ventilated residential buildings in northeast China based on long-term monitoring. Sustain. Cities Soc. 2020, 54, 101947. [Google Scholar] [CrossRef]
  4. Zhao, Y.J.; Zhao, B. Reducing human exposure to PM2.5 generated while cooking typical Chinese cuisine. Build. Environ. 2020, 168, 106522. [Google Scholar] [CrossRef]
  5. Wang, M. Simulation Study on the Influence of Kitchen Structure and Layout on Kitchen Air Quality. Master’s Thesis, Xi’an University of Architecture and Technology, Xi’an, China, 2015. [Google Scholar]
  6. Wang, J. Analysis of Winter Formaldehyde and VOCs Pollution Characteristics of Residential Kitchens in Severe Cold Regions and the Optimization of Make-Up Air. Master’s Thesis, Shenyang Jianzhu University, Shenyang, China, 2019. [Google Scholar]
  7. Li, J. Simulation Study on Environment of Residential Kitchen Based on Novel Ventilation System. Master’s Thesis, Harbin Institute of Technology, Harbin, China, 2019. [Google Scholar]
  8. Zeng, L.J.; Du, B.W.; Lv, L.P.; Gao, J.; Zhang, C.Q.; Tong, L.Q.; Liu, G.D. Occupant exposure and ventilation conditions in Chinese residential kitchens: Site survey and measurement for an old residential community in Shanghai. J. Build. Eng. 2020, 31, 101406. [Google Scholar] [CrossRef]
  9. GB 50736-2012; Design Code for Heating Ventilation and Air Conditioning of Civil Buildings. China Architecture & Building Press: Beijing, China, 2012.
  10. GB 17713-2022; Range Hoods and Other Cooking Fume Extractors. China Quality Inspection Press: Beijing, China, 2022.
  11. T/CECS850-2021; Design Standard of Air Pollution Control via Ventilation for Residential Kitchens. China Architecture & Building Press: Beijing, China, 2021.
  12. Zhao, Y.J.; Zhao, B. Emissions of air pollutants from Chinese cooking: A literature review. Build. Simul. 2018, 11, 977–995. [Google Scholar] [CrossRef]
  13. Hussein, T.; Glytsos, T.; Ondráček, J.; Zdimal, V.; Hameri, K.; Lazaridis, M.; Smolik, J.; Kulmala, M. Particle size characterization and emission rates during indoor activities in a house. Atmos. Environ. 2006, 40, 4285–4307. [Google Scholar] [CrossRef]
  14. He, L.Y.; Hu, M.; Huang, X.F.; Yu, B.D.; Zhang, Y.H.; Liu, D.Q. Measurement of emissions of fine particulate organic matter from Chinese cooking. Atmos. Environ. 2004, 38, 6557–6564. [Google Scholar] [CrossRef]
  15. Liu, Q.Y.; Son, Y.J.; Li, L.H.; Wood, N.D.; Senerat, A.M.; Jovan, P. Healthy home interventions: Distribution of PM2.5 emitted during cooking in residential settings. Build. Environ. 2022, 207, 108448. [Google Scholar] [CrossRef]
  16. Singer, B.C.; Pass, R.Z.; Delp, W.W.; Lorenzetti, D.M.; Maddalena, R.L. Pollutant concentrations and emission rates from natural gas cooking burners without and with range hood exhaust in nine California homes. Build. Environ. 2017, 122, 215–229. [Google Scholar] [CrossRef]
  17. Torkmahalleh, M.A.; Gorjinezhad, S.; Unluevcek, H.S.; Hopke, P.K. Review of factors impacting emission/concentration of cooking generated particulate matter. Sci. Total Environ. 2017, 586, 1046–1056. [Google Scholar] [CrossRef] [PubMed]
  18. Sharma, R.; Balasubramanian, R. Evaluation of the effectiveness of a portable air cleaner in mitigating indoor human exposure to cooking-derived airborne particles. Environ. Res. 2020, 183, 109192. [Google Scholar] [CrossRef] [PubMed]
  19. Tang, R.J.; Pfrang, C. Indoor particulate matter (PM) from cooking in UK students’ studio flats and associated intervention strategies: Evaluation of cooking methods, PM concentrations and personal exposures using low-cost sensors. Environ. Sci. Atmos. 2023, 3, 537–551. [Google Scholar] [CrossRef]
  20. Jovan, P.; Young, J.S.; Brant, S.; Liu, Q. Cooking emission control with IoT sensors and connected air quality interventions for smart and healthy homes: Evaluation of effectiveness and energy consumption. Energy Build. 2023, 286, 112932. [Google Scholar]
  21. O’Leary, C.; Jones, B.J.; Sani, D.; Hall, I.P. Setting the standard: The acceptability of kitchen ventilation for the English housing stock. Build. Environ. 2019, 166, 106417. [Google Scholar] [CrossRef]
  22. Zhou, B.; Chen, F.; Dong, Z.; Nielsen, P.V. Study on pollution control in residential kitchen based on the push-pull ventilation system. Build. Environ. 2016, 107, 99–112. [Google Scholar] [CrossRef]
  23. Zhao, Y.; Li, A.; Tao, P.; Gao, R. The impact of various hood shapes, and side panel and exhaust duct arrangements, on the performance of typical Chinese style cooking hoods. Build. Simul. 2013, 6, 139–149. [Google Scholar] [CrossRef]
  24. Huang, R.F.; Nian, Y.C.; Chen, J.K.; Peng, K.L. Improving flow and spillage characteristics of range hoods by using an inclined air-curtain technique. Ann. Occup. Hyg. 2011, 55, 164–179. [Google Scholar]
  25. Huang, R.F.; Nian, Y.C.; Chen, J.K. Static condition differences in conventional and inclined air-curtain range hood flow and spillage characteristics. Environ. Eng. Sci. 2010, 27, 513–522. [Google Scholar] [CrossRef]
  26. Liu, S.; Cao, Q.; Zhao, X.; Lu, Z.; Deng, Z.; Dong, J.; Lin, X.; Qing, K.; Zhang, W.; Chen, Q. Improving indoor air quality and thermal comfort in residential kitchens with a new ventilation system. Build. Environ. 2020, 180, 107016. [Google Scholar] [CrossRef]
  27. Yi, K.W.; Kim, Y.I.; Bae, G.N. Effect of air flow rates on concurrent supply and exhaust kitchen ventilation system. Indoor Built Environ. 2016, 25, 180–190. [Google Scholar] [CrossRef]
  28. Wang, R.S. Simulation and Optimization of Air Distribution in Residential Kitchen in Winter in Severe Cold Area. Master’s Thesis, Shenyang Jianzhu University, Shenyang, China, 2021. [Google Scholar]
  29. Chen, C.; Zhao, Y.; Zhao, B. Emission rates of multiple air pollutants generated from Chinese residential cooking. Environ. Sci. Technol. 2018, 52, 1081–1087. [Google Scholar] [CrossRef] [PubMed]
  30. Huang, K.L.; Wang, R.S.; Feng, G.H.; Wang, J.; Yu, M.; He, N. Ventilation status of the residential kitchens in severe cold region and improvement based on simulation: A case of Shenyang, China. J. Air Waste Manag. Assoc. 2022, 72, 935–950. [Google Scholar] [CrossRef]
  31. GB/T 18204.18-2013; Public Health Testing Methods—Part 1: Physical Factors. China Standards Press: Beijing, China, 2013.
  32. Elghobashi, S. On predicting particle-laden turbulent flows. Appl. Sci. Res. 1994, 52, 309–329. [Google Scholar] [CrossRef]
  33. Zhao, B.; Zhang, Y.; Li, X.; Yang, X.; Huang, D. Comparison of indoor aerosol particle concentration and deposition in different ventilated rooms by numerical method. Build. Environ. 2004, 39, 1–8. [Google Scholar] [CrossRef]
  34. Zhang, Z.; Chen, Q. Experimental measurements and numerical simulations of particle transport and distribution in ventilated rooms. Atmos. Environ. 2006, 40, 3396–3408. [Google Scholar] [CrossRef]
  35. Chen, C.; Liu, W.; Lin, C.H.; Chen, Q. Comparing the Markov Chain Model with the Eulerian and Lagrangian Models for Indoor Transient Particle Transport Simulations. Aerosol. Sci. Technol. 2015, 49, 857–871. [Google Scholar] [CrossRef]
  36. Shi, S.; Yang, J.; Liang, Y. Indoor distribution and personal exposure of cooking-generated PM2.5 in rural residences of China: A multizone model study. Build. Simul. 2023, 16, 1299–1315. [Google Scholar] [CrossRef]
  37. Xiang, J.; Hu, L.; Hao, J.; Wu, S.; Cao, J.; Seto, E. Characterization of time- and size-dependent particle emissions and decay from cooking oil fumes in residence: Impacts of various intervention measures. Build. Simul. 2023, 16, 1149–1158. [Google Scholar] [CrossRef]
  38. Yu, L.; Jiankai, D.; Yu, W.; Zheng, W.; Jiang, Y. Numerical investigation on the influence of natural make-up air in Chinese-style residential kitchen on indoor environment in a partitioned household. Sustain. Energy Technol. Assess. 2021, 46, 101244. [Google Scholar]
  39. Lumin, C.; Ke, Y.; Fuping, Q.; Zheng, Z.; Lu, J.; Han, Y. Numerical investigation of non-spherical particle deposition characteristics on filter media. Build. Simul. 2023, 16, 1331–1343. [Google Scholar]
  40. Xu, G.P.; Wang, J.G. CFD modeling of particle dispersion and deposition coupled with particle dynamical models in a ventilated room. Atmos. Environ. 2017, 166, 300–314. [Google Scholar] [CrossRef]
  41. Shih, T.H.; Liou, W.W.; Shabbir, A.; Yang, Z.A.; Zhu, J. A new k-ԑ eddy viscosity model for high reynolds number turbulent flows. Comput. Fluids 1995, 24, 227–238. [Google Scholar] [CrossRef]
  42. Bjørn, E.; Nielsen, P.V. Dispersal of exhaled air and personal exposure in displacement ventilated rooms. Indoor Air 2002, 12, 147–164. [Google Scholar] [CrossRef]
  43. Gao, N.; Niu, J. CFD study on micro-environment around human body and personalized ventilation. Build. Environ. 2004, 39, 795–805. [Google Scholar] [CrossRef]
  44. Jie, C.; Jun, G.; Bowen, D. Experimental Research on Emission Profile of Oil Fume Particle Sources in the Oil Heating Process. Build. Energy Environ. 2018, 37, 33–36. [Google Scholar]
  45. GB 50019-2003; Code for Design of Heating Ventilation and Air Conditioning. China Standards Press: Beijing, China, 2003.
  46. Zhao, M.; Xu, F.Z.; Ming, H.Q.; Xi, T.; Hou, Y.H.; Guan, J.H. Analysis of winter temperature change in Shenyang from 1951 to 2010. In Proceedings of the 33rd Annual Meeting of the Chinese Meteorological Society S5: Addressing Climate Change, Low Carbon Development, and Ecological Civilization Construction, Xi’an, China, 2 November 2016; pp. 397–402. [Google Scholar]
  47. GB/T 18883-2022; Standards of Indoor Air Quality. China Standards Press: Beijing, China, 2022.
  48. ANSI/ASHARE 55; Thermal Environmental Conditions for Human Occupancy. American Society of Heating, Refrigerating and AirConditioning Engineers (ASHARE): Atlanta, GA, USA, 2013.
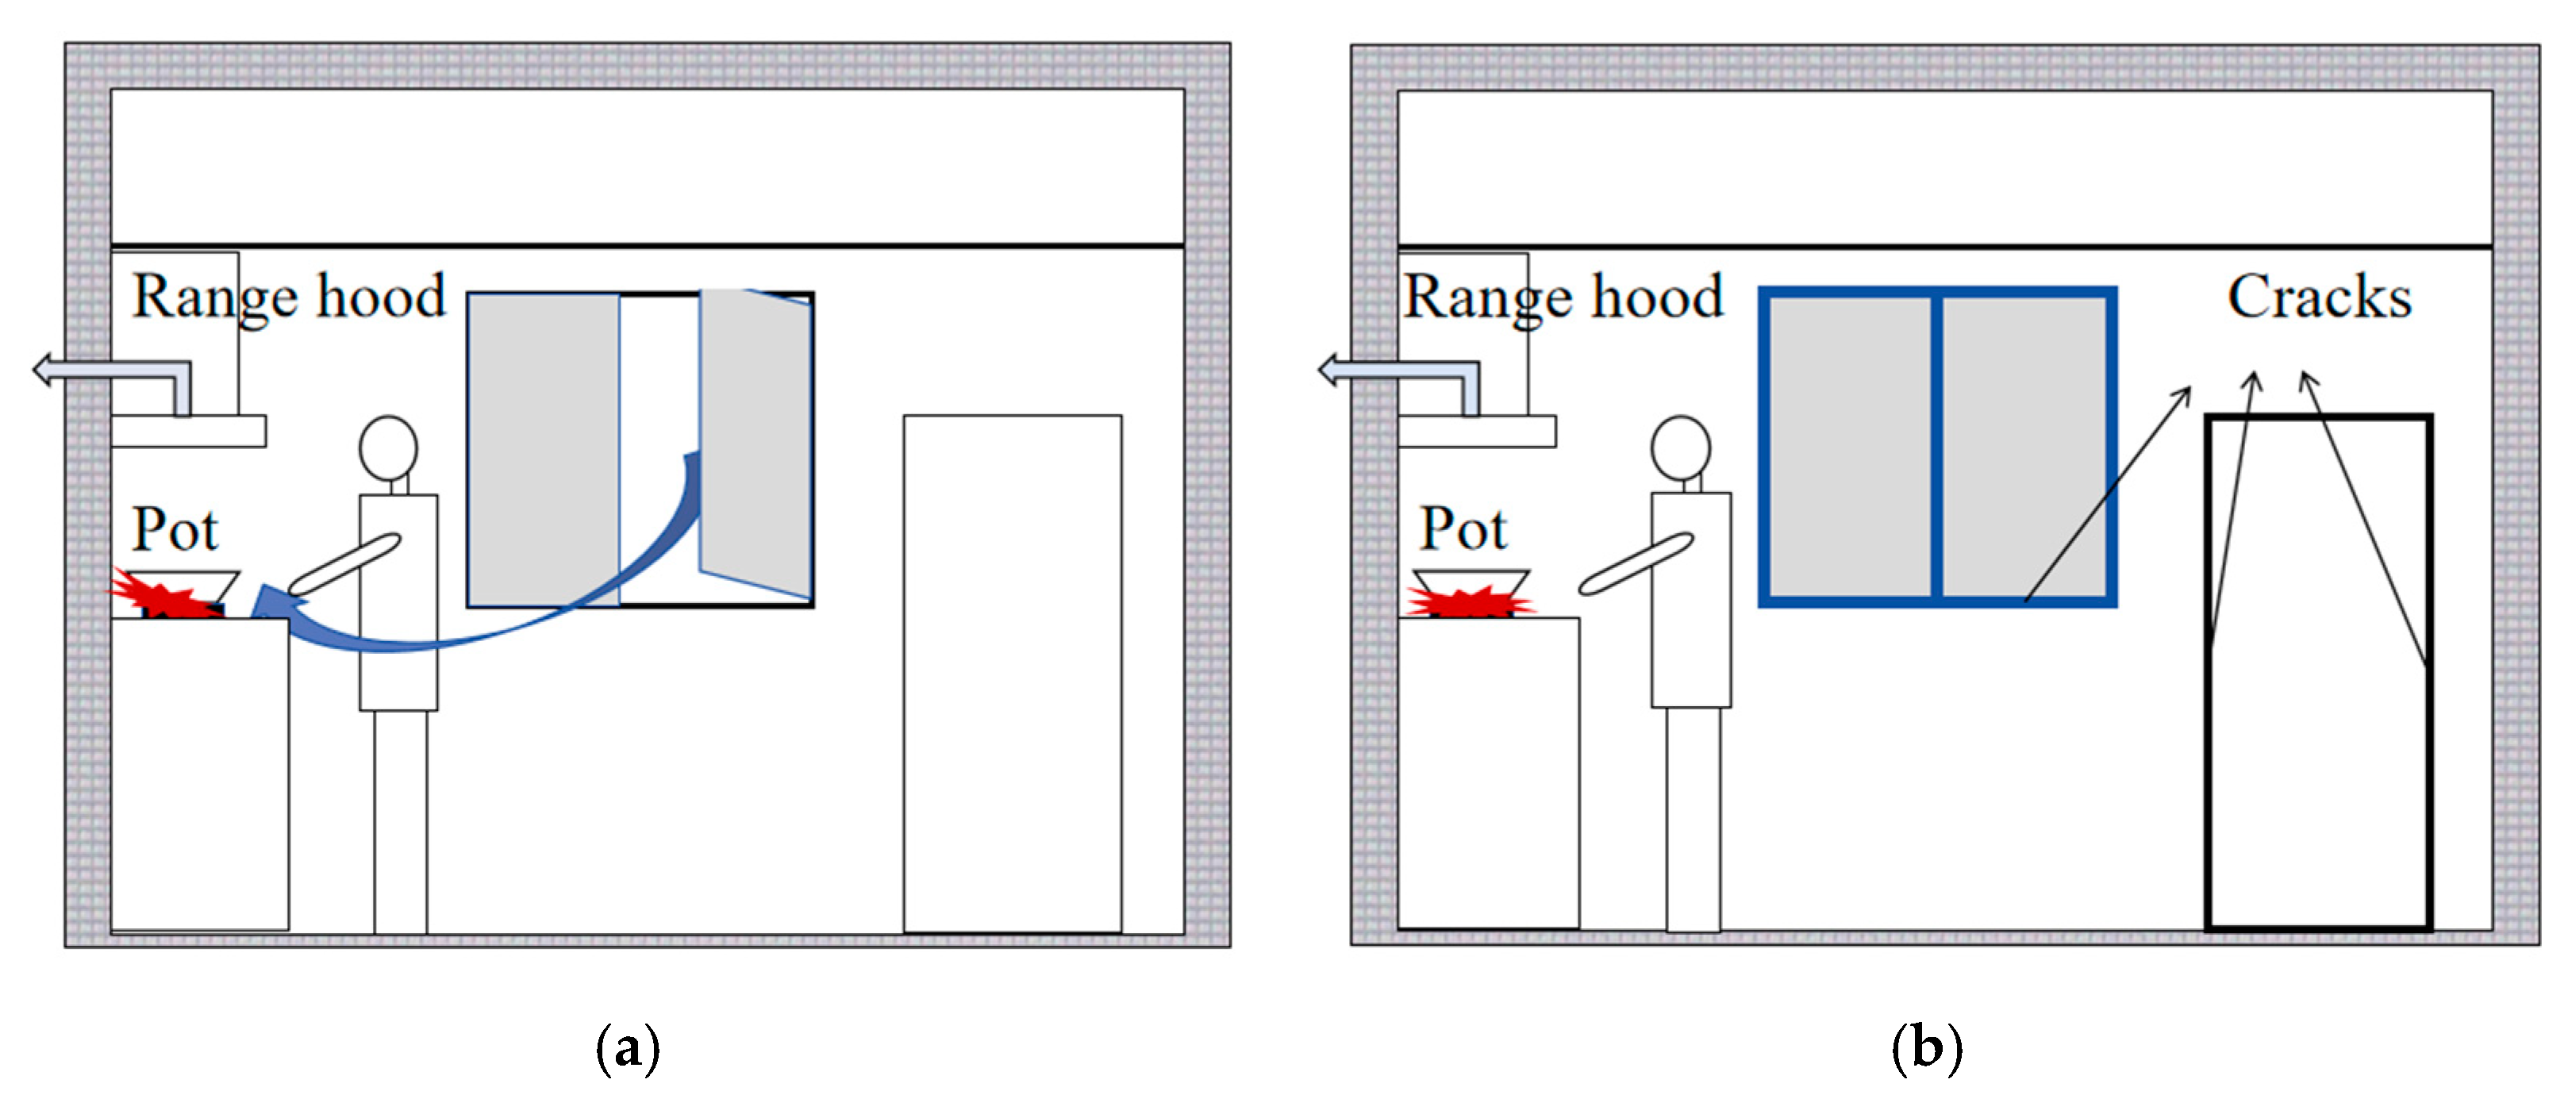
Figure 1. System diagrams and working principles of the different ventilation systems. (a) WMA; (b) GMA; (c) other research [26]; (d) CMA.
Atmosphere 15 01109 g001aAtmosphere 15 01109 g001b
Figure 2. Experimental system in the kitchen.
Atmosphere 15 01109 g002
Figure 3. The model of the residential kitchen.
Atmosphere 15 01109 g003
Figure 4. The calculation cases.
Atmosphere 15 01109 g004
Figure 5. The temperature for different meshes and time steps.
Atmosphere 15 01109 g005
Figure 6. Variation in indoor temperature and PM2.5 concentration in the respiratory zone under ventilation systems with CMA scheme, WMA scheme, and GMA scheme. (a) Temperature; (b) PM2.5 concentration.
Atmosphere 15 01109 g006
Figure 7. Variation in air temperature at the ceiling inlet under ventilation system with CMA scheme.
Atmosphere 15 01109 g007
Figure 8. Comparison of the experimental data with the simulation data. (a) Temperature; (b) Velocity.
Atmosphere 15 01109 g008
Figure 9. The indoor temperature and average PM2.5 concentration in the respiratory zone in Cases 1–16. (a) Temperature; (b) PM2.5 concentration.
Atmosphere 15 01109 g009
Figure 10. The indoor temperature and average PM 2.5 concentration in the respiratory zone under different ceiling inlet layouts. (a) Temperature; (b) PM2.5 concentration.
Atmosphere 15 01109 g010
Figure 11. The indoor temperature and average PM 2.5 concentration in the respiratory zone for square ceiling inlet and uniformly arranged circular ceiling inlets. (a) Temperature; (b) PM2.5 concentration.
Atmosphere 15 01109 g011
Figure 12. The indoor temperature at X = 0.56 m and PM2.5 concentration at Y = 1.4 m under ventilation systems with CMA scheme, WMA scheme, and GMA scheme.
Atmosphere 15 01109 g012
Figure 13. The average temperature around the human body and average PM2.5 concentration in the respiratory zone. (a) Temperature; (b) PM2.5 concentration.
Atmosphere 15 01109 g013
Table 1. Relevant standards for kitchen air change volume in China.
Standard NumberTitle of Standard Air Change Volume
GB 50736-2012 [9]Design code for heating ventilation and air conditioning of civil buildings300–500 m3/h and ≥3 times/h
GB 17713-2022 [10]Range hoods and other cooking fume extractors≥7 m3/min
T/CECS 850-2021 [11]Design standard for air pollution control via ventilation of residential kitchens300–500 m3/h
Table 2. The parameters of the experimental equipment.
EquipmentRangeAccuracy
RS485−40 °C~60 °C±0.5 °C
Testo (405 i)1~10 m/s±0.1 m/s
DUST-TRAK-II (8534)0.001~150 mg/m30.001 mg/m3
Table 3. Design details of Cases 1–24.
CaseAir Inlet Ceiling Inlet
DiameterNumberSize/DiameterNumber
Case 180 mm1100 mm × 1800 mm 1
Case 2120 mm1100 mm × 1800 mm 1
Case 3160 mm1100 mm × 1800 mm 1
Case 4200 mm1100 mm × 1800 mm 1
Case 580 mm1100 mm × 1500 mm 1
Case 6120 mm1100 mm × 1500 mm1
Case 7160 mm1100 mm × 1500 mm1
Case 8200 mm1100 mm × 1500 mm1
Case 980 mm1100 mm × 1200 mm1
Case 10120 mm1100 mm × 1200 mm1
Case 11160 mm1100 mm × 1200 mm1
Case 12200 mm1100 mm × 1200 mm1
Case 1380 mm1100 mm × 900 mm1
Case 14120 mm1100 mm × 900 mm1
Case 15160 mm1100 mm × 900 mm1
Case 16200 mm1100 mm × 900 mm1
Case 17120 mm1100 mm × 600 mm3
Case 18120 mm1100 mm × 600 mm3
Case 19120 mm1100 mm × 600 mm3
Case 20120 mm1100 mm × 900 mm2
Case 21120 mm120 mm572
Case 22120 mm140 mm144
Case 23120 mm160 mm64
Case 24120 mm180 mm36
Disclaimer/Publisher’s Note: The statements, opinions and data contained in all publications are solely those of the individual author(s) and contributor(s) and not of MDPI and/or the editor(s). MDPI and/or the editor(s) disclaim responsibility for any injury to people or property resulting from any ideas, methods, instructions or products referred to in the content.