Article

Risk Assessment of Community-Scale High-Temperature and Rainstorm Waterlogging Disasters: A Case Study of the Dongsi Community in Beijing

1
Beijing Municipal Climate Center, Beijing 100089, China
2
Beijing Municipal Institute of City Planning and Design, Beijing 100045, China
*
Author to whom correspondence should be addressed.
Atmosphere 2024, 15(9), 1132; https://doi.org/10.3390/atmos15091132
Submission received: 2 August 2024 / Revised: 9 September 2024 / Accepted: 10 September 2024 / Published: 18 September 2024
(This article belongs to the Special Issue Climate Change and Extreme Weather Disaster Risks)

Abstract

:
With the advancement of urbanization and acceleration of global warming, extreme weather and climate events are becoming increasingly frequent and severe, and climate risk continues to rise. Each community is irreplaceable and important in coping with extreme climate risk and improving urban resilience. In this study, the Dongsi Community in the functional core area of Beijing was explored, and the risk assessment of high temperatures and rainstorm waterlogging was implemented at the community scale. Local navigation observations were integrated into a theoretical framework for traditional disaster risk assessment. The risk assessment indicator system for community-scale high-temperature and rainstorm waterlogging disasters was established and improved from a microscopic perspective (a total of 22 indicators were selected from the three dimensions of hazard, exposure, and vulnerability). Geographic Information Systems (GIS) technology was used to integrate geographic information, meteorological, planning, municipal, socioeconomic and other multisource information layers, thus enabling more detailed spatial distribution characteristics of the hazard, exposure, vulnerability, and risk levels of community-scale high temperatures and rainstorm waterlogging to be obtained. The results revealed that the high-risk area and slightly high-risk area of high-temperature disasters accounted for 13.5% and 15.1%, respectively. The high-risk area and slightly high-risk area of rainstorm waterlogging disasters accounted for 9.8% and 31.6%, respectively. The high-risk areas common to high temperatures and waterlogging accounted for 3.9%. In general, the risk of high-temperature and rainstorm waterlogging disasters at the community scale showed obvious spatial imbalances; that is, the risk in the area around the middle section of Dongsi Santiao was the lowest, while a degree of high temperatures or rainstorm waterlogging was found in other areas. In particular, the risk of high-temperature and rainstorm waterlogging disasters along Dongsi North Street, the surrounding areas of Dongsi Liutiao, and some areas along the Dongsi Jiutiao route was relatively high. These spatial differences were affected to a greater extent by land cover (buildings, vegetation, etc.) and population density within the community. This study is a useful exploration of climate risk research for resilient community construction, and provides scientific support for the planning of climate-adaptive communities, as well as the proposal of overall adaptation goals, action frameworks, and specific planning strategies at the community level.

1. Introduction

The current global climate is undergoing a significant change characterized by warming, and the frequency and intensity of extreme weather and climate events are on the rise. The impact on natural ecosystems and the economy and society is becoming increasingly severe, and the global climate risk continues to rise [1,2]. Therefore, addressing the risk of climate change is urgent for human society. Moreover, there is an urgent need to identify the climate change responses and adaptations at different scales (such as the global scale, national scale, and local scale) and at different levels (such as the government, enterprises, and the public) [3,4,5,6]. As emphasized in the report United in Science [7] released by the World Meteorological Organization, adaptation is the key to reducing the risk of climate impacts.
Affected by the superimposition of climate warming and rapid urbanization, the increasing trend of temperature in Beijing over the past 60 years has become more pronounced, and extreme weather and climate events such as heat waves and heavy precipitation have occurred frequently, such as the “7.21” rainstorm in Beijing and the “23.7” rainstorm in the Beijing–Tianjin–Hebei region. The total amount of precipitation during the flood season in 2021 was the greatest in the past 60 years, and the number of high-temperature days in 2023 was a record high. Extreme weather and climate events have become the “new normal”, prompting people to pay more attention to climate and disaster risk assessments to identify programs for adaptation, mitigation, and disaster risk reduction. However, researchers mostly focus on the macro and meso levels, such as the country or city level; thus, disaster risk assessments at the community unit level are lacking [6].
The community is a basic unit of a city and the most extensive participation unit in disaster risk management; it bears the most impacts of climate extremes and directly determines the overall adaptation level of the city. Therefore, the community is important and irreplaceable in coping with extreme climate risk and improving urban resilience. Studies show that climate adaptation plans formulated by large cities are unlikely to be effective, and many suggested measures are difficult to implement [8]; however, climate adaptation planning formulated with the community as the basic unit will be more conducive to communities and cities in coping with the threat of climate change [9,10]. Community-level climate adaptation planning has become a research hotspot for scholars in China and abroad [11]; it has required, and will continue to require, improvements in the resolution of risk assessments [4]. Therefore, refined disaster risk assessments at the community scale urgently need to be developed.
Increased research shows that high temperatures are typical meteorological disasters caused by the joint action of climate change and urbanization [12,13]. Rainstorm waterlogging events are also becoming frequent meteorological disasters in urban areas [4,14]. In this study, taking the Dongsi Community in Beijing as an example, we attempted to explore the risk of meteorological disasters at the community scale. The two most common and important disaster types, high temperatures and rainstorm waterlogging, were selected as the research subjects. Our research objectives specifically included (1) establishing a community-scale risk assessment index system for high-temperature and rainstorm waterlogging disasters, respectively; (2) quantifying and grading the hazard, exposure, vulnerability, and risk of high-temperature and rainstorm waterlogging disasters in Dongsi Community, and (3) checking the detailed spatial distribution characteristics of the community-scale disasters risk, and identifying which areas require attention to adaptive planning measures. The research results help to further objectively understand the more refined climate risk characteristics at the community scale and can help develop climate risk response measures based on local conditions, thus providing an important foundation for the enhancement of community climate risk governance capability, and the improvement in community quality and livability [15].

2. Materials and Methods

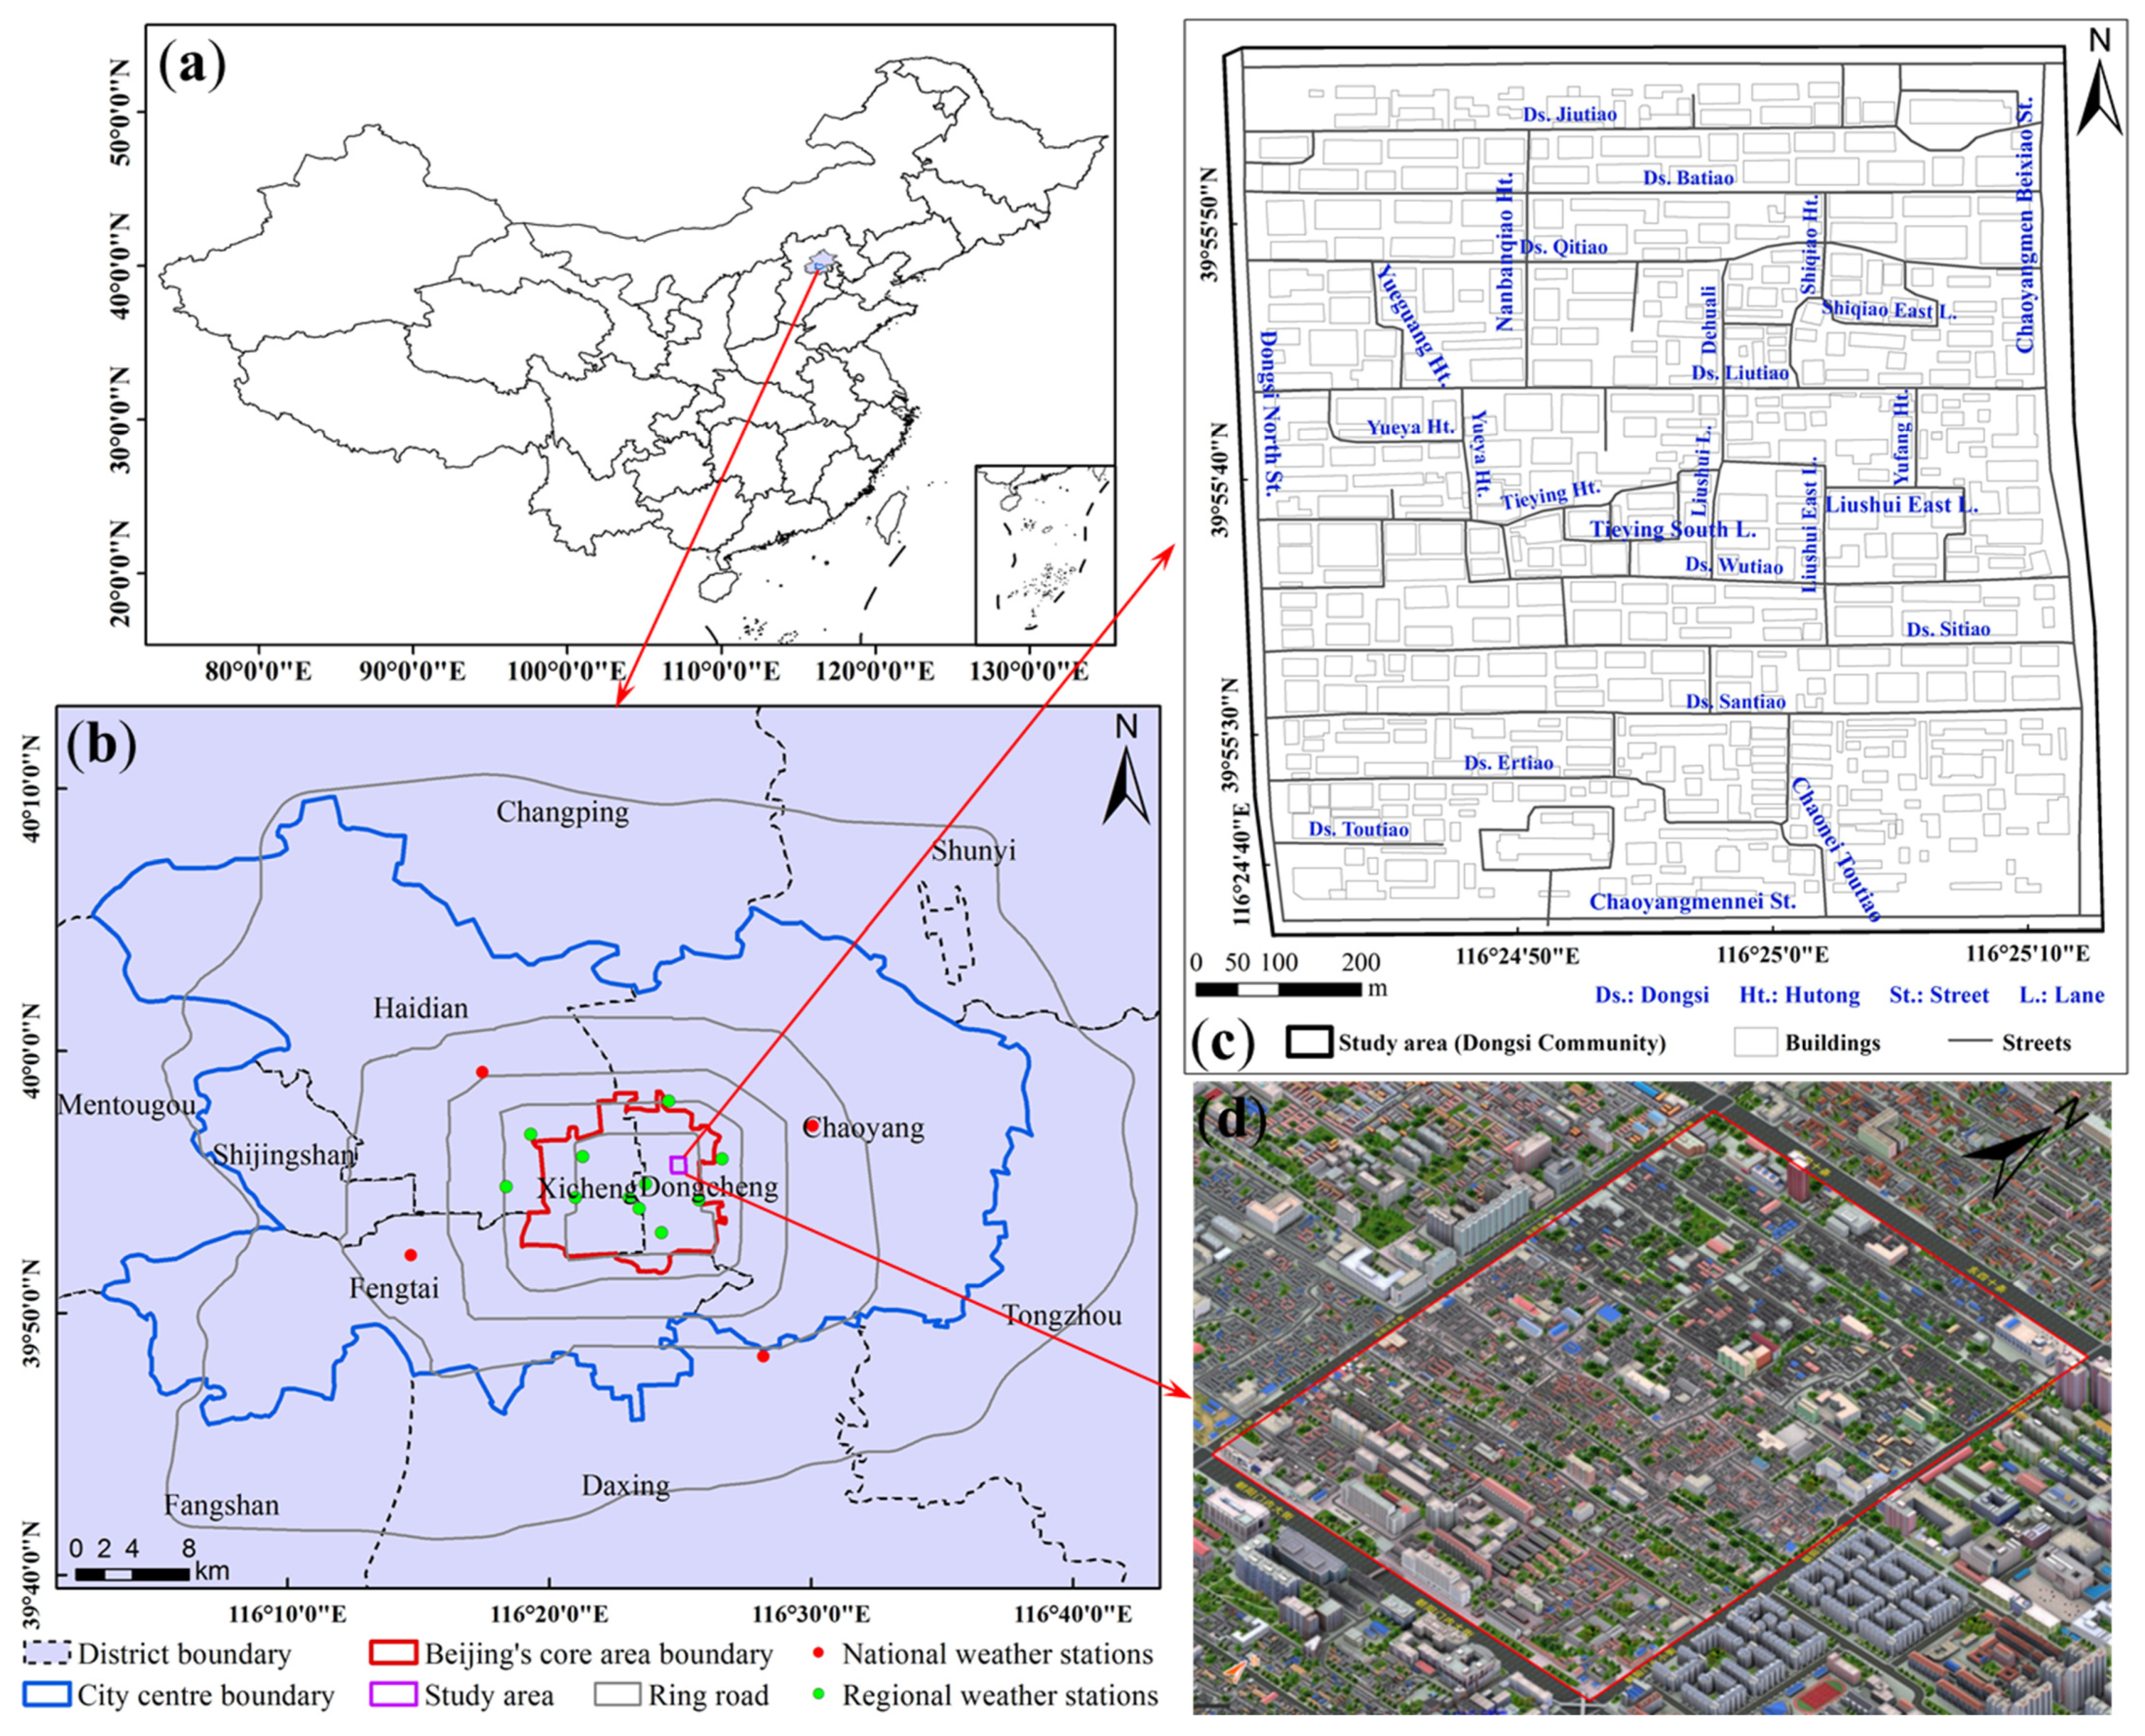
2.1. Overview of the Study Area

In this study, Dongsi Community in Beijing was taken as an example to explore the risk assessments of high-temperature and rainstorm waterlogging disasters at the community scale. The study area is in the functional core area of the capital (Figure 1), extending from Chaoyangmen Beixiao Street to the east, Dongsi North Street to the west, Chaoyangmennei Street to the south, and Dongsi Shitiao to the north. As a comprehensive community with mainly residential functions, some administrative offices, and commercial and cultural functions, Dongsi Community has retained a large area of typical traditional quadrangle courtyards and is the most complete and largest Hutong (alley) neighborhood in the old city of Beijing. There are many cultural relic protection units and historical buildings such as “Chongli Residence”, “Fuwang’s Mansion”, “Jingzheng House”, or “The Former Site of Songyun Mansion”. Dongsi Santiao to Batiao were selected as the first batch of “Chinese Historic and Cultural Blocks”. Therefore, using the Dongsi Street District to explore community-scale climate adaptability planning has important application and demonstration value.

2.2. Data Information

To better reflect the characteristics of hazard factors in Dongsi Community and the surrounding areas, daily temperature and precipitation data from 13 meteorological stations around the study area were collected (the locations of the stations are shown in Figure 1). There were 4 national-level meteorological stations (Chaoyang, Haidian, Fengtai and Observatory stations) and 9 regional meteorological stations (Tiananmen, Workers’ Stadium, Guanyuan, Ancient Observatory, Temple of Heaven, Yuyuantan, Hepingqiao West, Fuxingmen, and Forbidden City stations); the data period used for analysis was 2012–2020.
The local temperature data of the community came from navigation observations. Using a hand-held digital spectrometer with a thermohygrometer (accuracy: ±0.1 °C), four navigation observations were carried out during a clear and rainless summer afternoon, morning and evening (Figure 2). Pedestrian-height temperatures were collected in real time along roads within the community. In the community fixed routes were defined using sidewalks or the right hand side of the road. The hand-held instrument was placed in an open backpack. The average walking speed for the entire route was approximately 0.5 m/s, and each navigation observation took about 1.5 h. The circles in Figure 2 represent the positions every 30 s. In addition, the hand-held instrument was placed at the Yuyuantan site (nearby regional meteorological station) to compare the consistency with the stationary place. The correlation between the two instruments was as high as 0.98.
The community-relevant data included administrative division base maps, building and street vector data, land use data, DEM data, population and per capita income distribution data, distributions of low-lying courtyards with ponded water, various surface roughness coefficients, depression water storage indices, and drainage pipe indices. Table 1 lists the specific sources and data characteristics of the relevant indicators.

2.3. Research Methods

With reference to the IPCC AR6 risk framework and meteorological disaster risk assessment methods, disaster risk is viewed as the result of the joint action of hazards factors, disaster-bearing body exposure, and the vulnerability of the underlying surface [14,16]. In this study, a community-scale disaster risk assessment model for high temperatures and rainstorm waterlogging was established, and the weighted quadrature method was used [17,18,19]. The primary indicators were calculated using multiplication, and the secondary indicators were calculated using addition; the formula is:
R = 1 n H n × W n W h × 1 i E n × W i W e × 1 j ( V n × W j ) W v
where R is the disaster risk index; H, E, and V are the hazard index, the exposure index, and the vulnerability index, respectively; and W is the corresponding weight of each evaluation factor.
Based on the information for the Dongsi Community, such as the functional positioning and the status distribution, risk assessment indicator systems for high-temperature and rainstorm waterlogging disasters at the community scale were established (Table 2 and Table 3). The weights of each evaluation factor were determined by the analytic hierarchy process and the expert scoring method. In this process, experts were invited to score the factors, and then the qualitative and quantitative results were attained by comparing the factors at each level and then performing pairwise comparisons on them; they passed the consistency test [20].
The hazard factors represented the anomaly level of meteorological factors that may cause danger to the disaster risk area and was positively proportional to the disaster risk. The indicators used to assess high-temperature hazards included the extreme maximum temperature, average maximum temperature, number of high-temperature days, and number of consecutive days above 38 °C during the high-temperature process. High-temperature processes were screened by daily maximum temperatures ≥35 °C for more than 3 consecutive days or ≥38 °C for more than 2 consecutive days. The number of high-temperature days in the process, that is, the number of consecutive days with the daily maximum temperature ≥35 °C, characterized the duration of each high-temperature process; the average maximum temperature in the process referred to the average value of the daily highest temperature of each high-temperature process, which characterized the mean intensity of the high-temperature process. The extreme maximum temperature referred to the maximum value of the daily maximum temperature for each high-temperature process; this indicator and the number of consecutive days above 38 °C characterized the extreme state of the high-temperature process. The indicators for assessing the hazard of rainstorm waterlogging included the extreme precipitation index (R95p), the maximum precipitation for five consecutive days (Rx5day), and rainstorm days (R25). The extreme precipitation indicator (R95p) referred to the climatic standard period (1991–2020). All precipitation value series with daily precipitation ≥0.1 mm were sorted from small to large, and the precipitation value at the 95th percentile was defined as the threshold value of extreme precipitation events; the sum of annual precipitation exceeding the threshold was used as the extreme precipitation for that year. The maximum precipitation for five consecutive days (Rx5day) was the maximum value of the sum of precipitation for 5 sliding days in a year. The indicator of rainstorm days (R25) was the sum of days with a daily precipitation ≥25.0 mm.
Exposure reflected the severity of the adverse effects of climate disasters on the population, economy, and property. The indicators for assessing rainstorm waterlogging exposure included the distribution, type, use, and height of buildings in the streets in the study area, the total population of the community, and the proportions of disadvantaged groups such as elderly people and women [21] and community per capita income. To assess high-temperature exposure, in addition to population and economic value factors, historical and cultural heritage factors, i.e., the distribution of ancient trees and historic buildings, were included to reflect the characteristics of the study area.
Vulnerability referred to the promoting or delaying ability of the disaster-pregnant environment to potentially harm the research objects. The indicators used to assess high-temperature vulnerability mainly included the distribution of trees and the related attributes of buildings in the study area, because trees can effectively mitigate high-temperature disasters, while areas with dense or high buildings or high human heat emissions can aggravate high-temperature disasters. The indicators used to assess vulnerability to rainstorm waterlogging included mainly the Manning roughness coefficient of different underlying surfaces, the depression water storage index, drainage indicators, the topographic effect factor, tree distribution, and the distribution of key low-lying areas.
The indicators used for hazard assessment were all quantitative, while the exposure and vulnerability assessment involved some nonquantitative indicators. These nonquantitative indicators were evaluated based on the sensitivity or contribution of each indicator to the exposure or vulnerability of corresponding meteorological disasters, and then were graded and assigned values ranging from 0–1. Before calculating between different indicators, the following formula was used for normalization:
x = x x m i n x m a x x m i n
where x’ is the normalized data and x, xmin, and xmax are the true value, minimum value, and maximum value in the sample data of the evaluation indicator, respectively.
Spatial analysis and mapping were performed using geographic information system (GIS) software (ver. 10.2). The spatial grading of disaster hazard, exposure, vulnerability, and risk indices utilized the natural break point method and was divided into five levels: low, slightly low, fair, slightly high, and high. The inverse distance weighting (IDW) spatial interpolation method in GIS was used to obtain the spatial distribution of high-temperature and rainstorm waterlogging hazards and population-related indicators.

3. Results

3.1. Characteristics of the Refined Community Risk Assessment Indicators

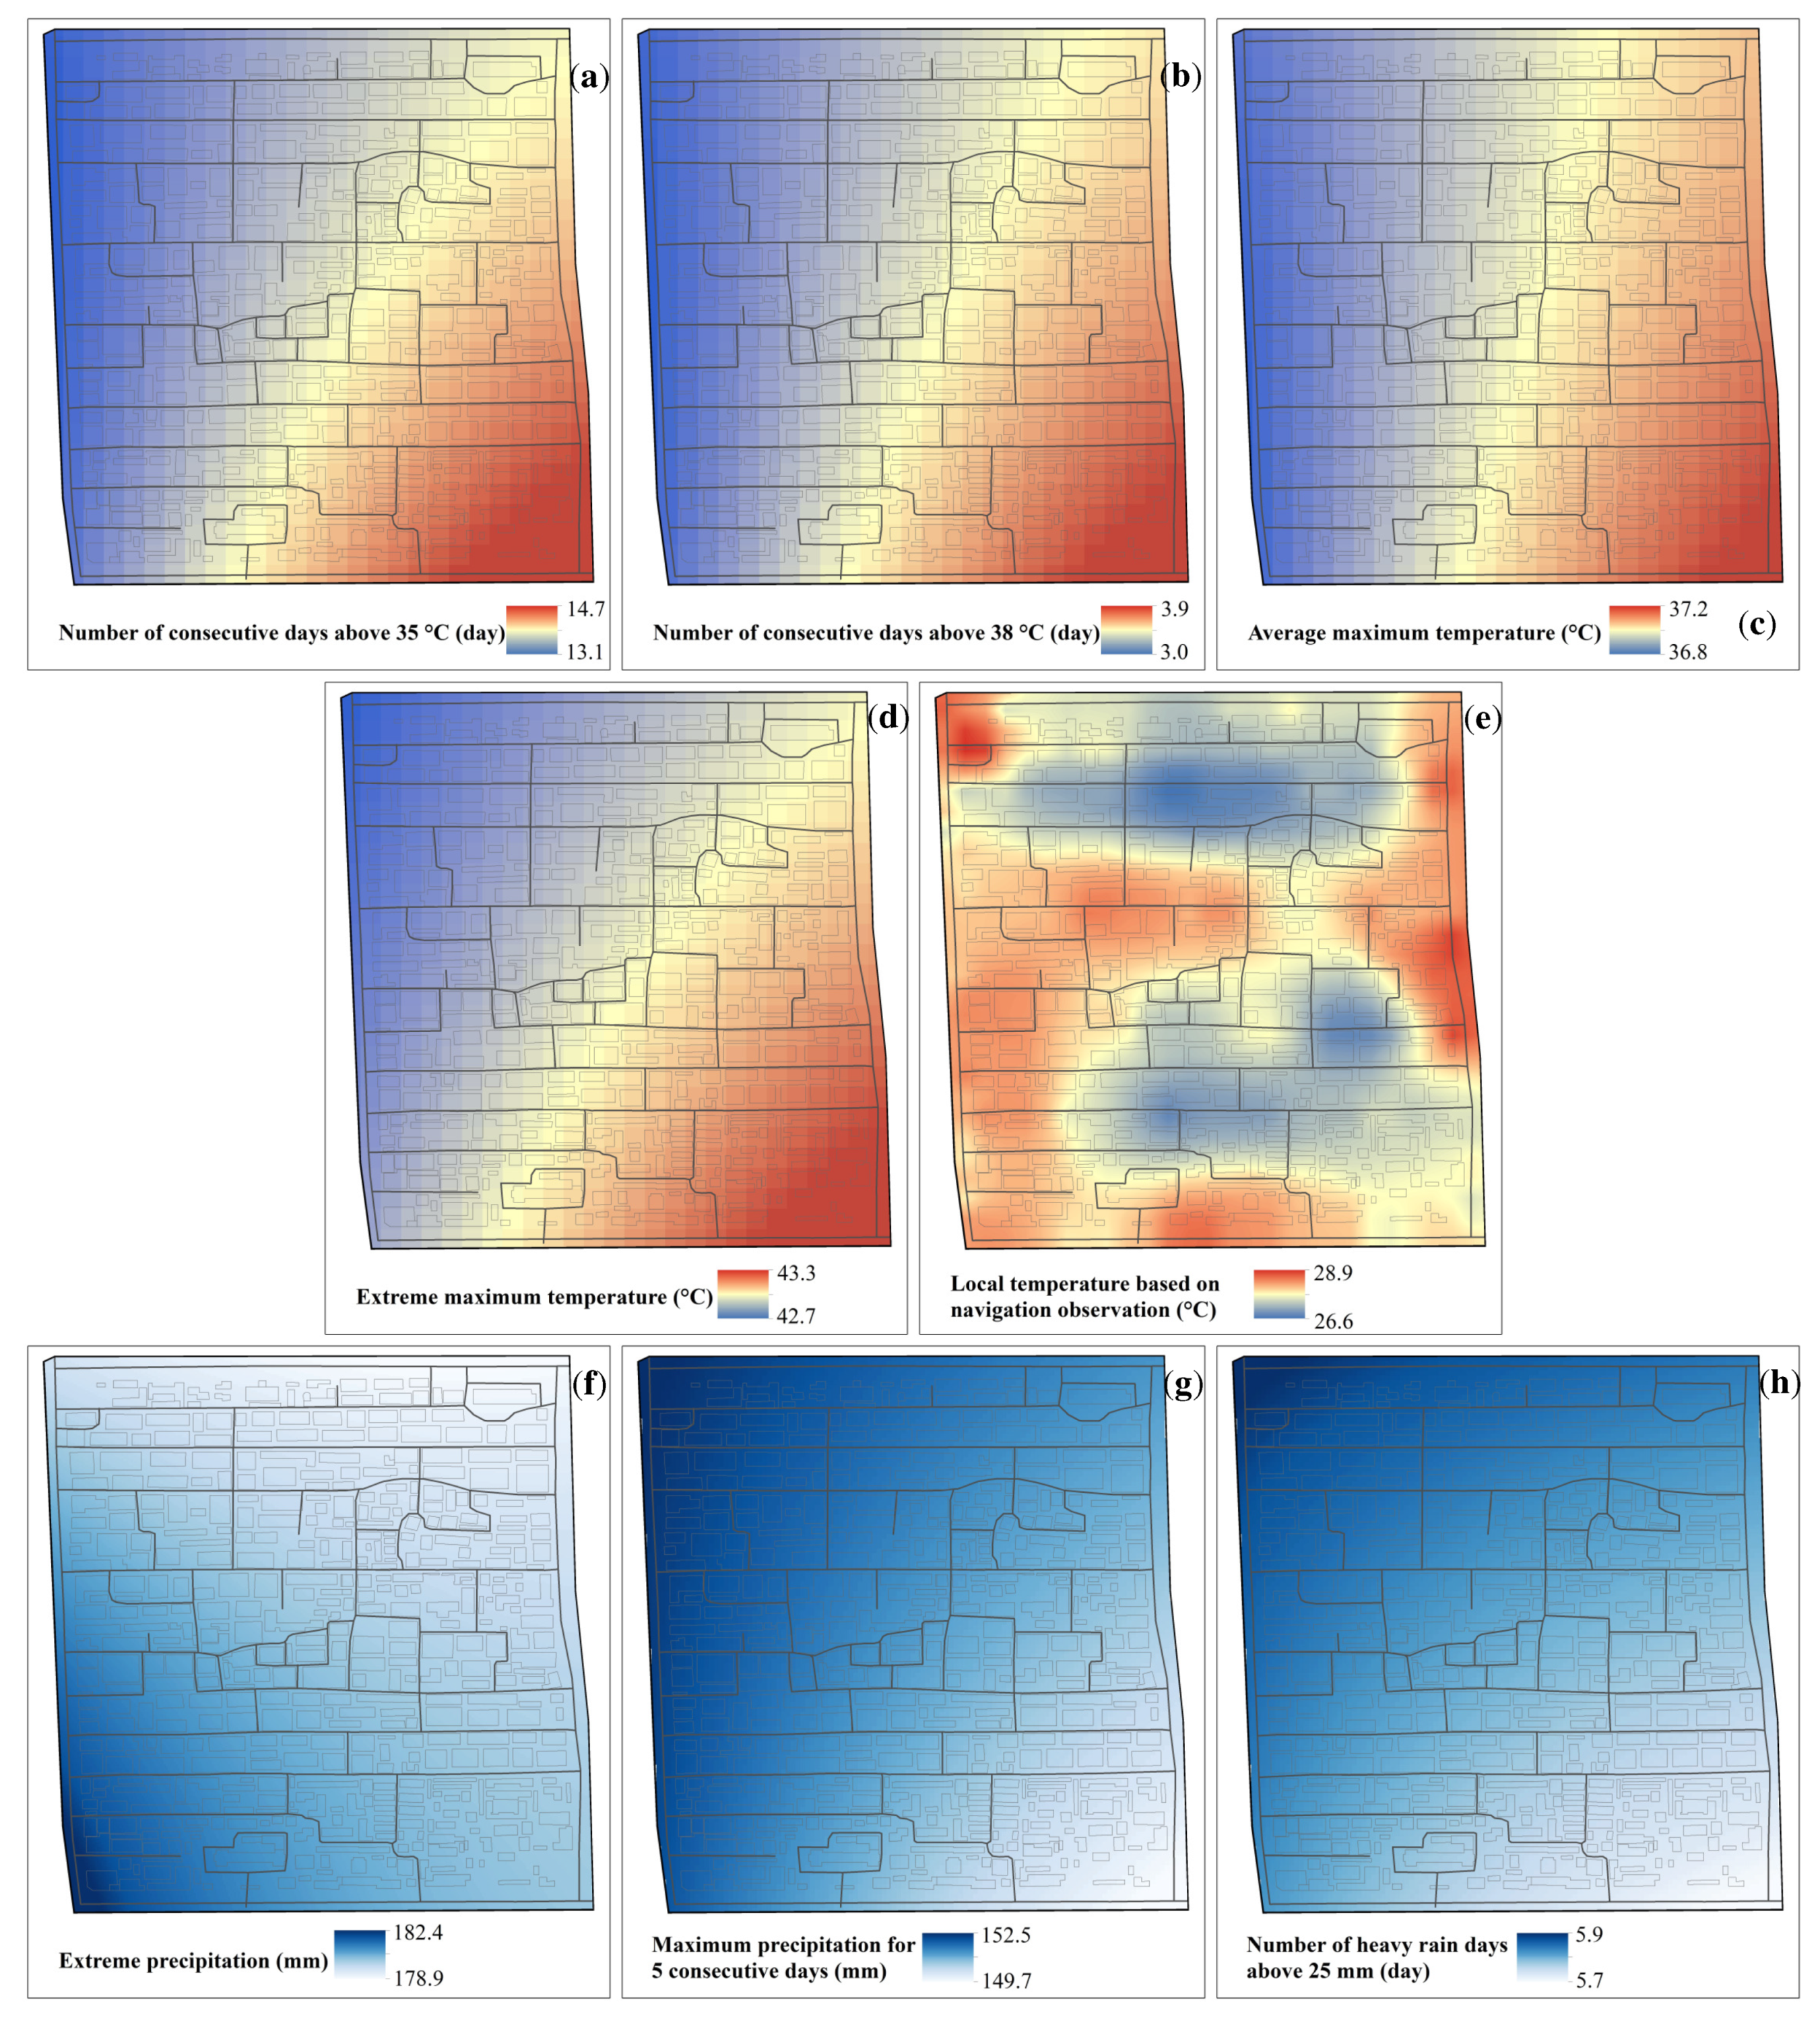
3.1.1. Characteristics of Meteorological Assessment Indicators

The spatial distribution characteristics of each high-temperature hazard factor at the community scale are shown in Figure 3a–d. The large-value areas were in the southeastern part of the community. Overall, there was a decreasing trend from southeast to northwest. Since temperature observations at traditional meteorological stations could only reflect the overall background characteristics of the area where the community was located, local temperature differences also needed to be considered when performing community-scale hazard estimations of high temperature. The observation results of four navigation observations were comprehensively considered in this study. As shown in Figure 3e, the temperature of Dongsi Batiao was relatively low because there were more tall trees distributed in this area. Furthermore, the temperatures of the central areas of Santiao and Sitiao were relatively low. This may be because the buildings in this area were not densely populated, and there were certain open spaces. The temperature of the peripheral arterial roads was relatively high, as was the temperature of Liutiao, probably because there were hotels, a traffic management detachment, a subdistrict office, and middle schools distributed in Liutiao Hutong. The flow of people and vehicles was great, and the influence of anthropogenic heat was relatively obvious.
The spatial distribution characteristics of each hazard factor of rainstorm waterlogging at the community scale are shown in Figure 3f–h. The amount of extreme precipitation was greater in the southwest and less in the northeast, and the areas with large values were mainly concentrated in Dongsi Toutiao, Ertiao, and Santiao. The spatial distribution characteristics of both the maximum precipitation for 5 consecutive days and the number of rainstorm days were greater in the northwest and less in the southeast, and the areas with large values were mostly concentrated in Dongsi Jiutiao, Batiao, and Qitiao. The spatial distribution of each precipitation indicator showed that the areas with relatively large amounts of precipitation were mainly distributed in the northwestern region of the study area, and the areas with relatively high precipitation intensities were mainly distributed in the southwestern region of the study area.

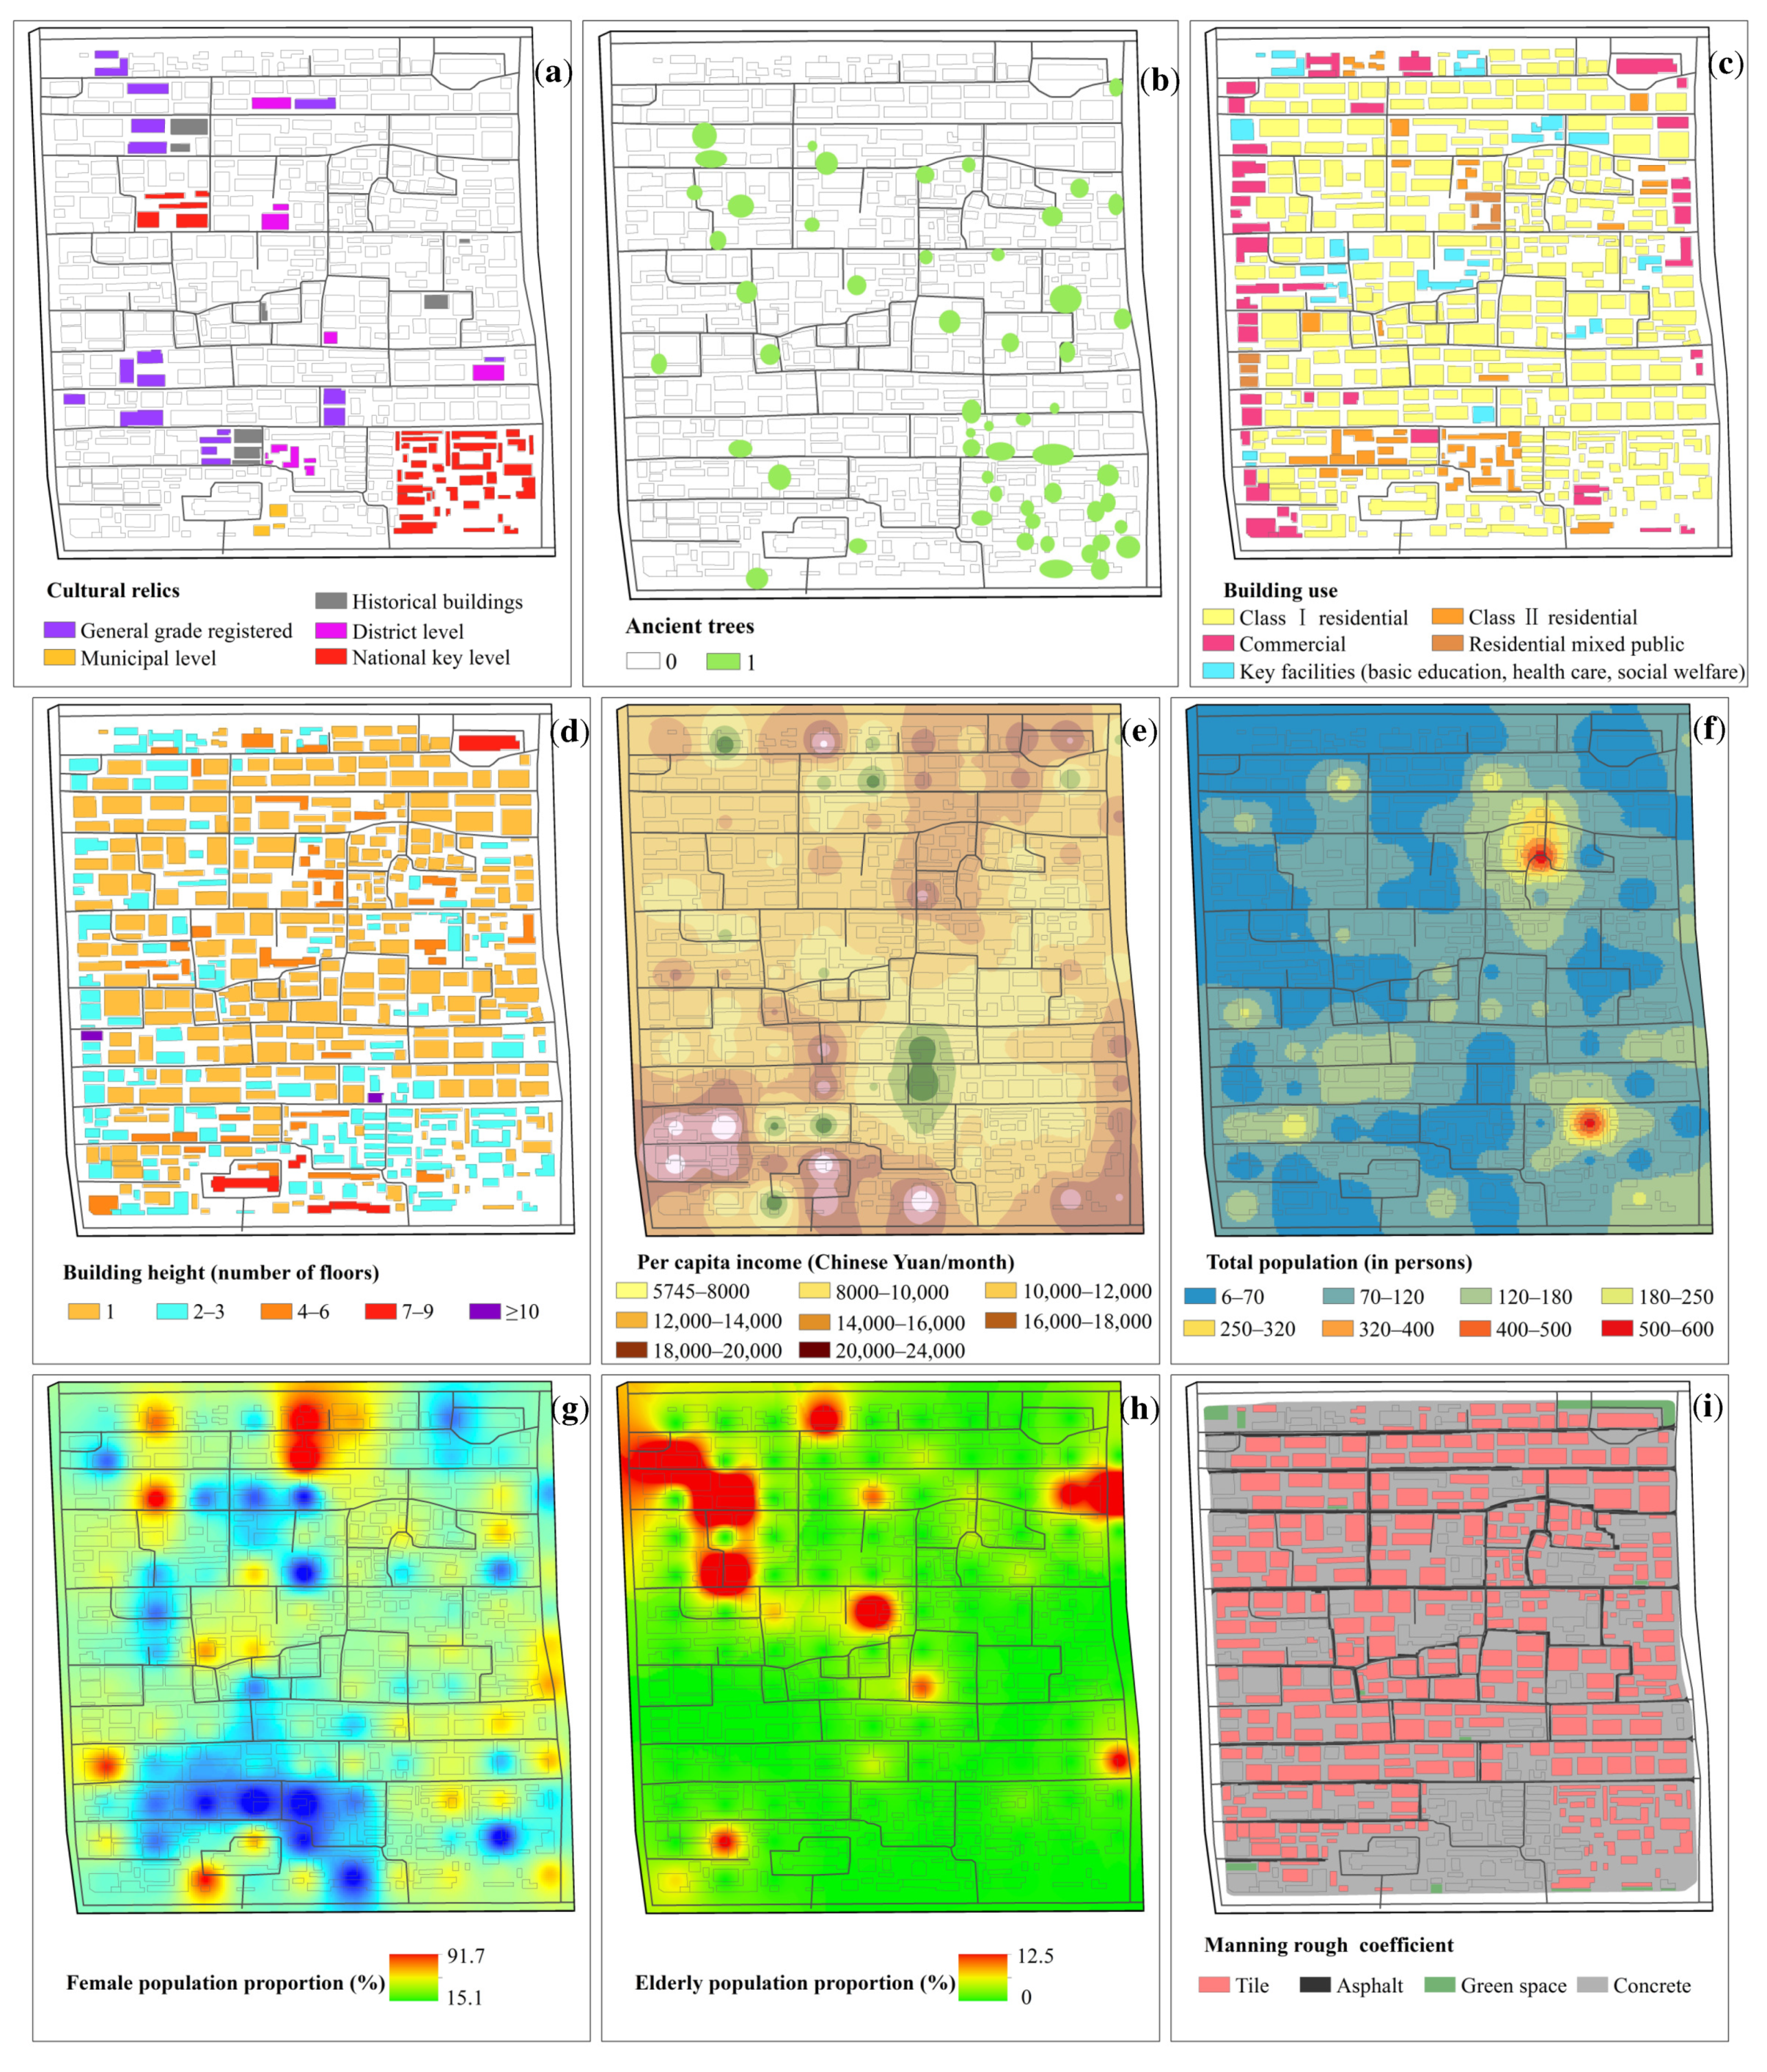
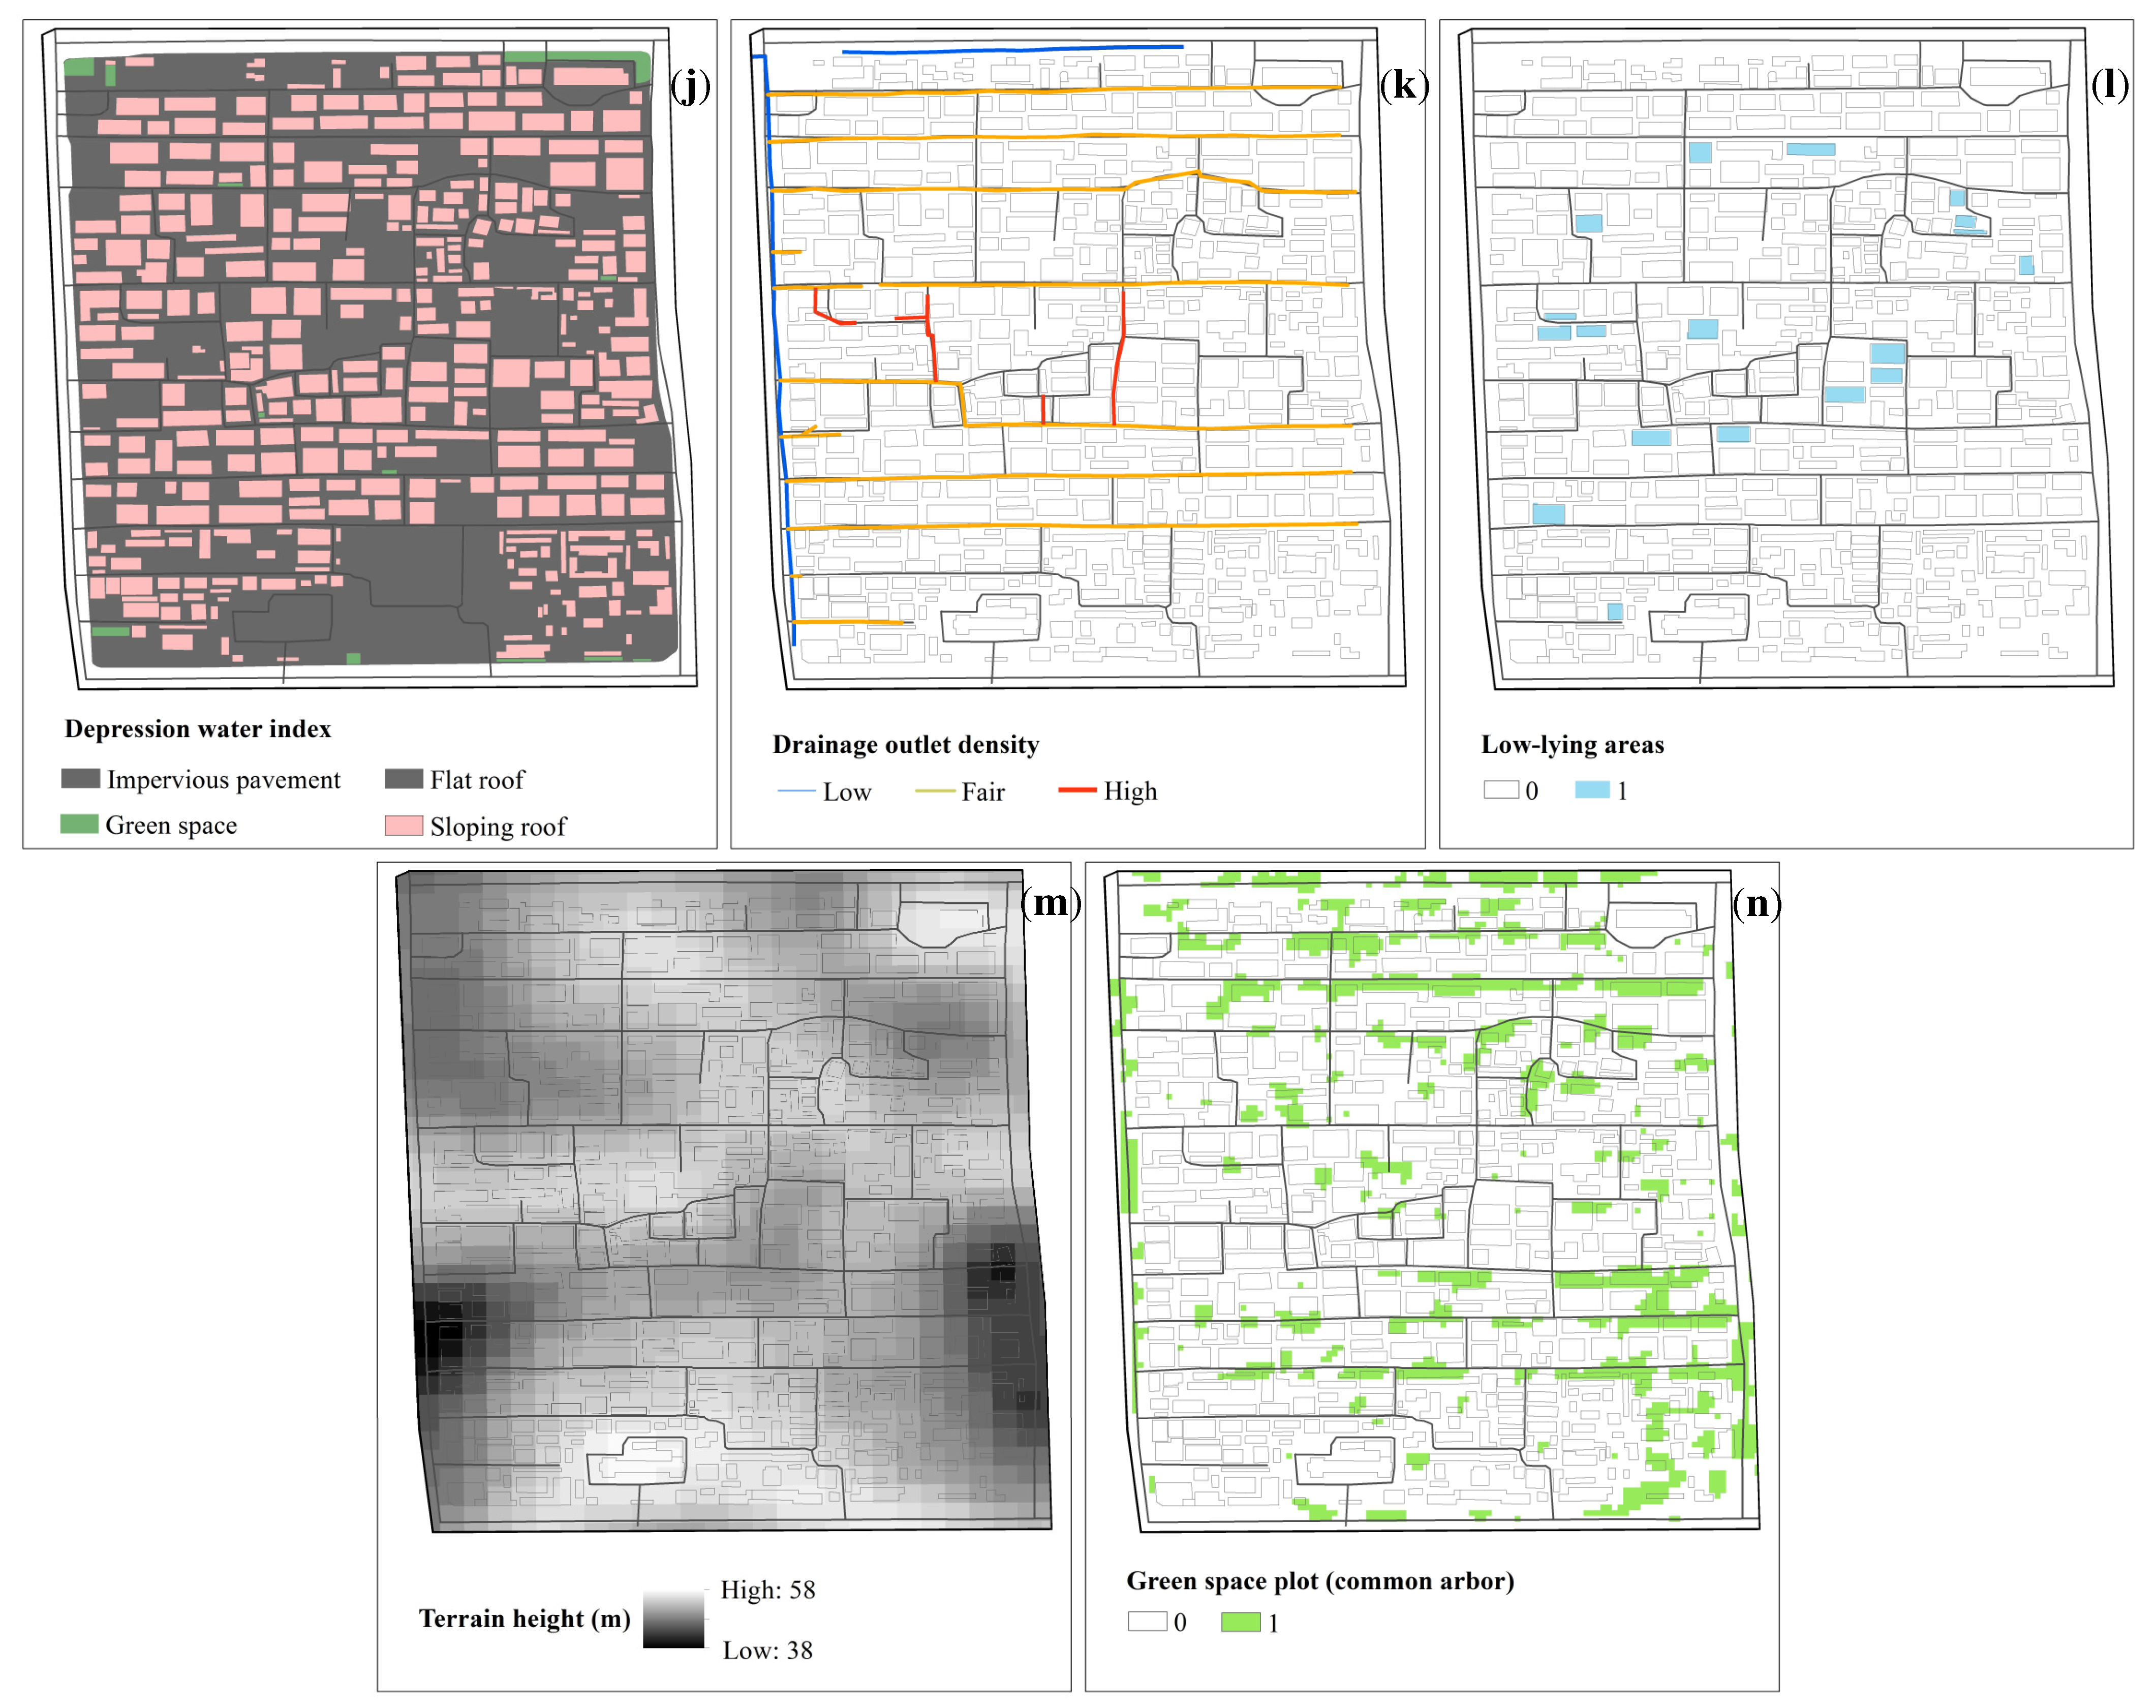
3.1.2. Characteristics of Other Nonmeteorological Assessment Indicators

Figure 4 shows the spatial distribution characteristics of other nonmeteorological assessment indicators of Dongsi Community.
The historical and cultural heritage in the study area included immovable cultural relics, historic buildings, and ancient trees. The distribution is shown in Figure 4a,b. There were two key national cultural relic protection units, namely, Fuwang’s Mansion in the southeast corner of the study area and the Chongli Residence in the western section of Dongsi Liutiao.
Building-related indicators (Figure 4c,d) included building use (e.g., residential, commercial, public buildings), key facilities (e.g., basic education, medical and health, and social welfare facilities) and building height. The west side of the Dongsi neighborhood was dominated by traditional one-story buildings; a small number of modern office and residential buildings with 4–6 floors were distributed along Dongsi Ertiao, Liutiao, and Batiao; commercial buildings with 2–3 floors were the majority along Dongsi North Street; and there were another 22 key facilities with scattered distributions.
The indicators of life and property (Figure 4e–h) mainly included per capita income, population distribution, elderly people distribution, and the female population distribution in the study area. The areas with higher per capita income were mostly distributed in the north and south of the community near the area along the arterial roads. The population was larger in Shiqiao East Lane and on the east side of Dongsi Santiao. The areas with a high proportion of the female population were mainly concentrated in and around the middle section of Dongsi Jiutiao and Batiao, and the areas with a high proportion of elderly people over 65 years old were concentrated mainly in the middle section of Dongsi Qitiao and Yueguang Hutong.
The indicators of the underlying surface (Figure 4i–n) mostly included the surface Manning roughness coefficient of different land uses (tile, asphalt, green space, concrete, etc.), depression water storage index (impermeable pavement, flat roof, sloping roof, green space, etc.), density of drainage nozzles, terrain height, and distribution of low-lying land and green space parcels. The impervious rate of underlying surfaces in Dongsi Community was very high (up to 99%), which was mainly the impermeable surface composed of roads and buildings with materials of tiles, asphalt, and concrete, and the green spaces were very few. Historical statistics of low-lying courtyards were mainly distributed in the central part of the study area between Dongsi Sitiao and Dongsi Liutiao (Figure 4l). In the central study area, the density of drainage pipes in Yueguang Hutong and Liushui Lane was the highest, and the density of drainage pipe along Dongsi Shitiao in the north and Dongsi North Street in the west was the lowest (Figure 4k). The topographic height distribution (Figure 4m) showed that the deviation of Dongsi Toutiao and Ertiao in the southern part of the study area was relatively low. The eastern area had relatively high terrain, followed by Dongsi Jiutiao and part of Yufang Hutong in the northeastern part of the study area, and the area with the lowest terrain was distributed in the southern area of Dongsi North Street and Chaoyangmen Beixiao Street.

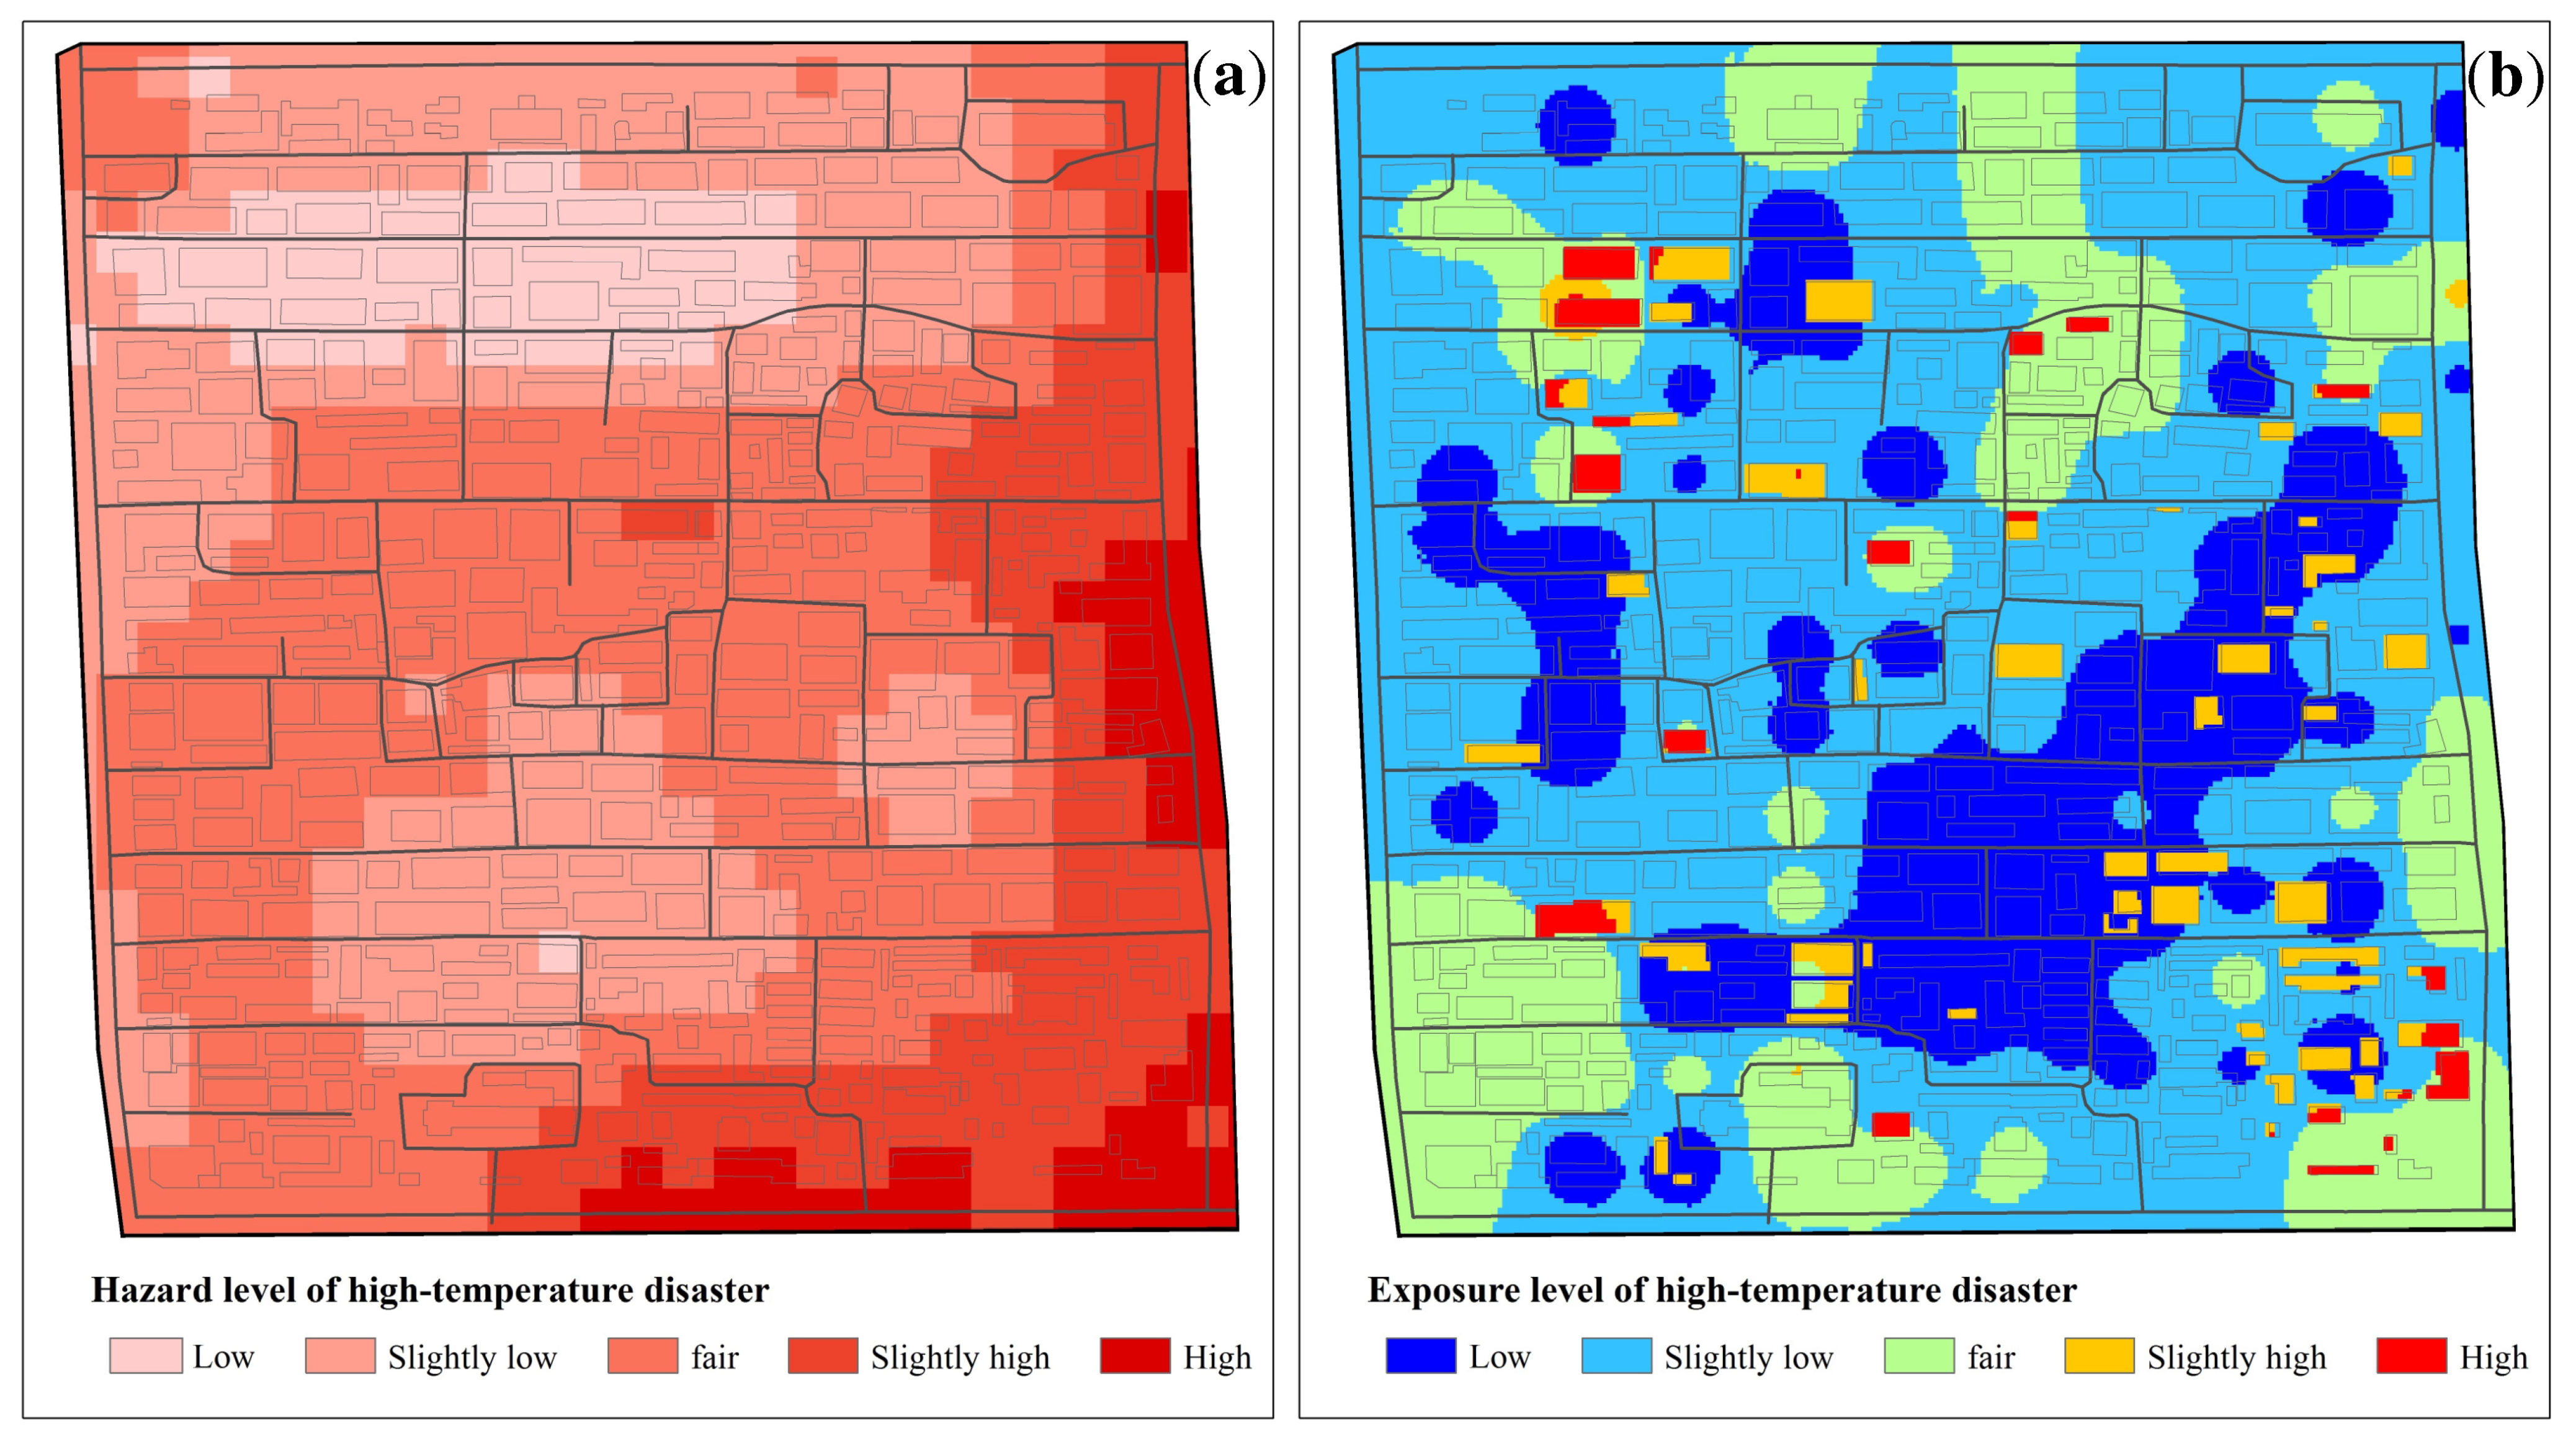
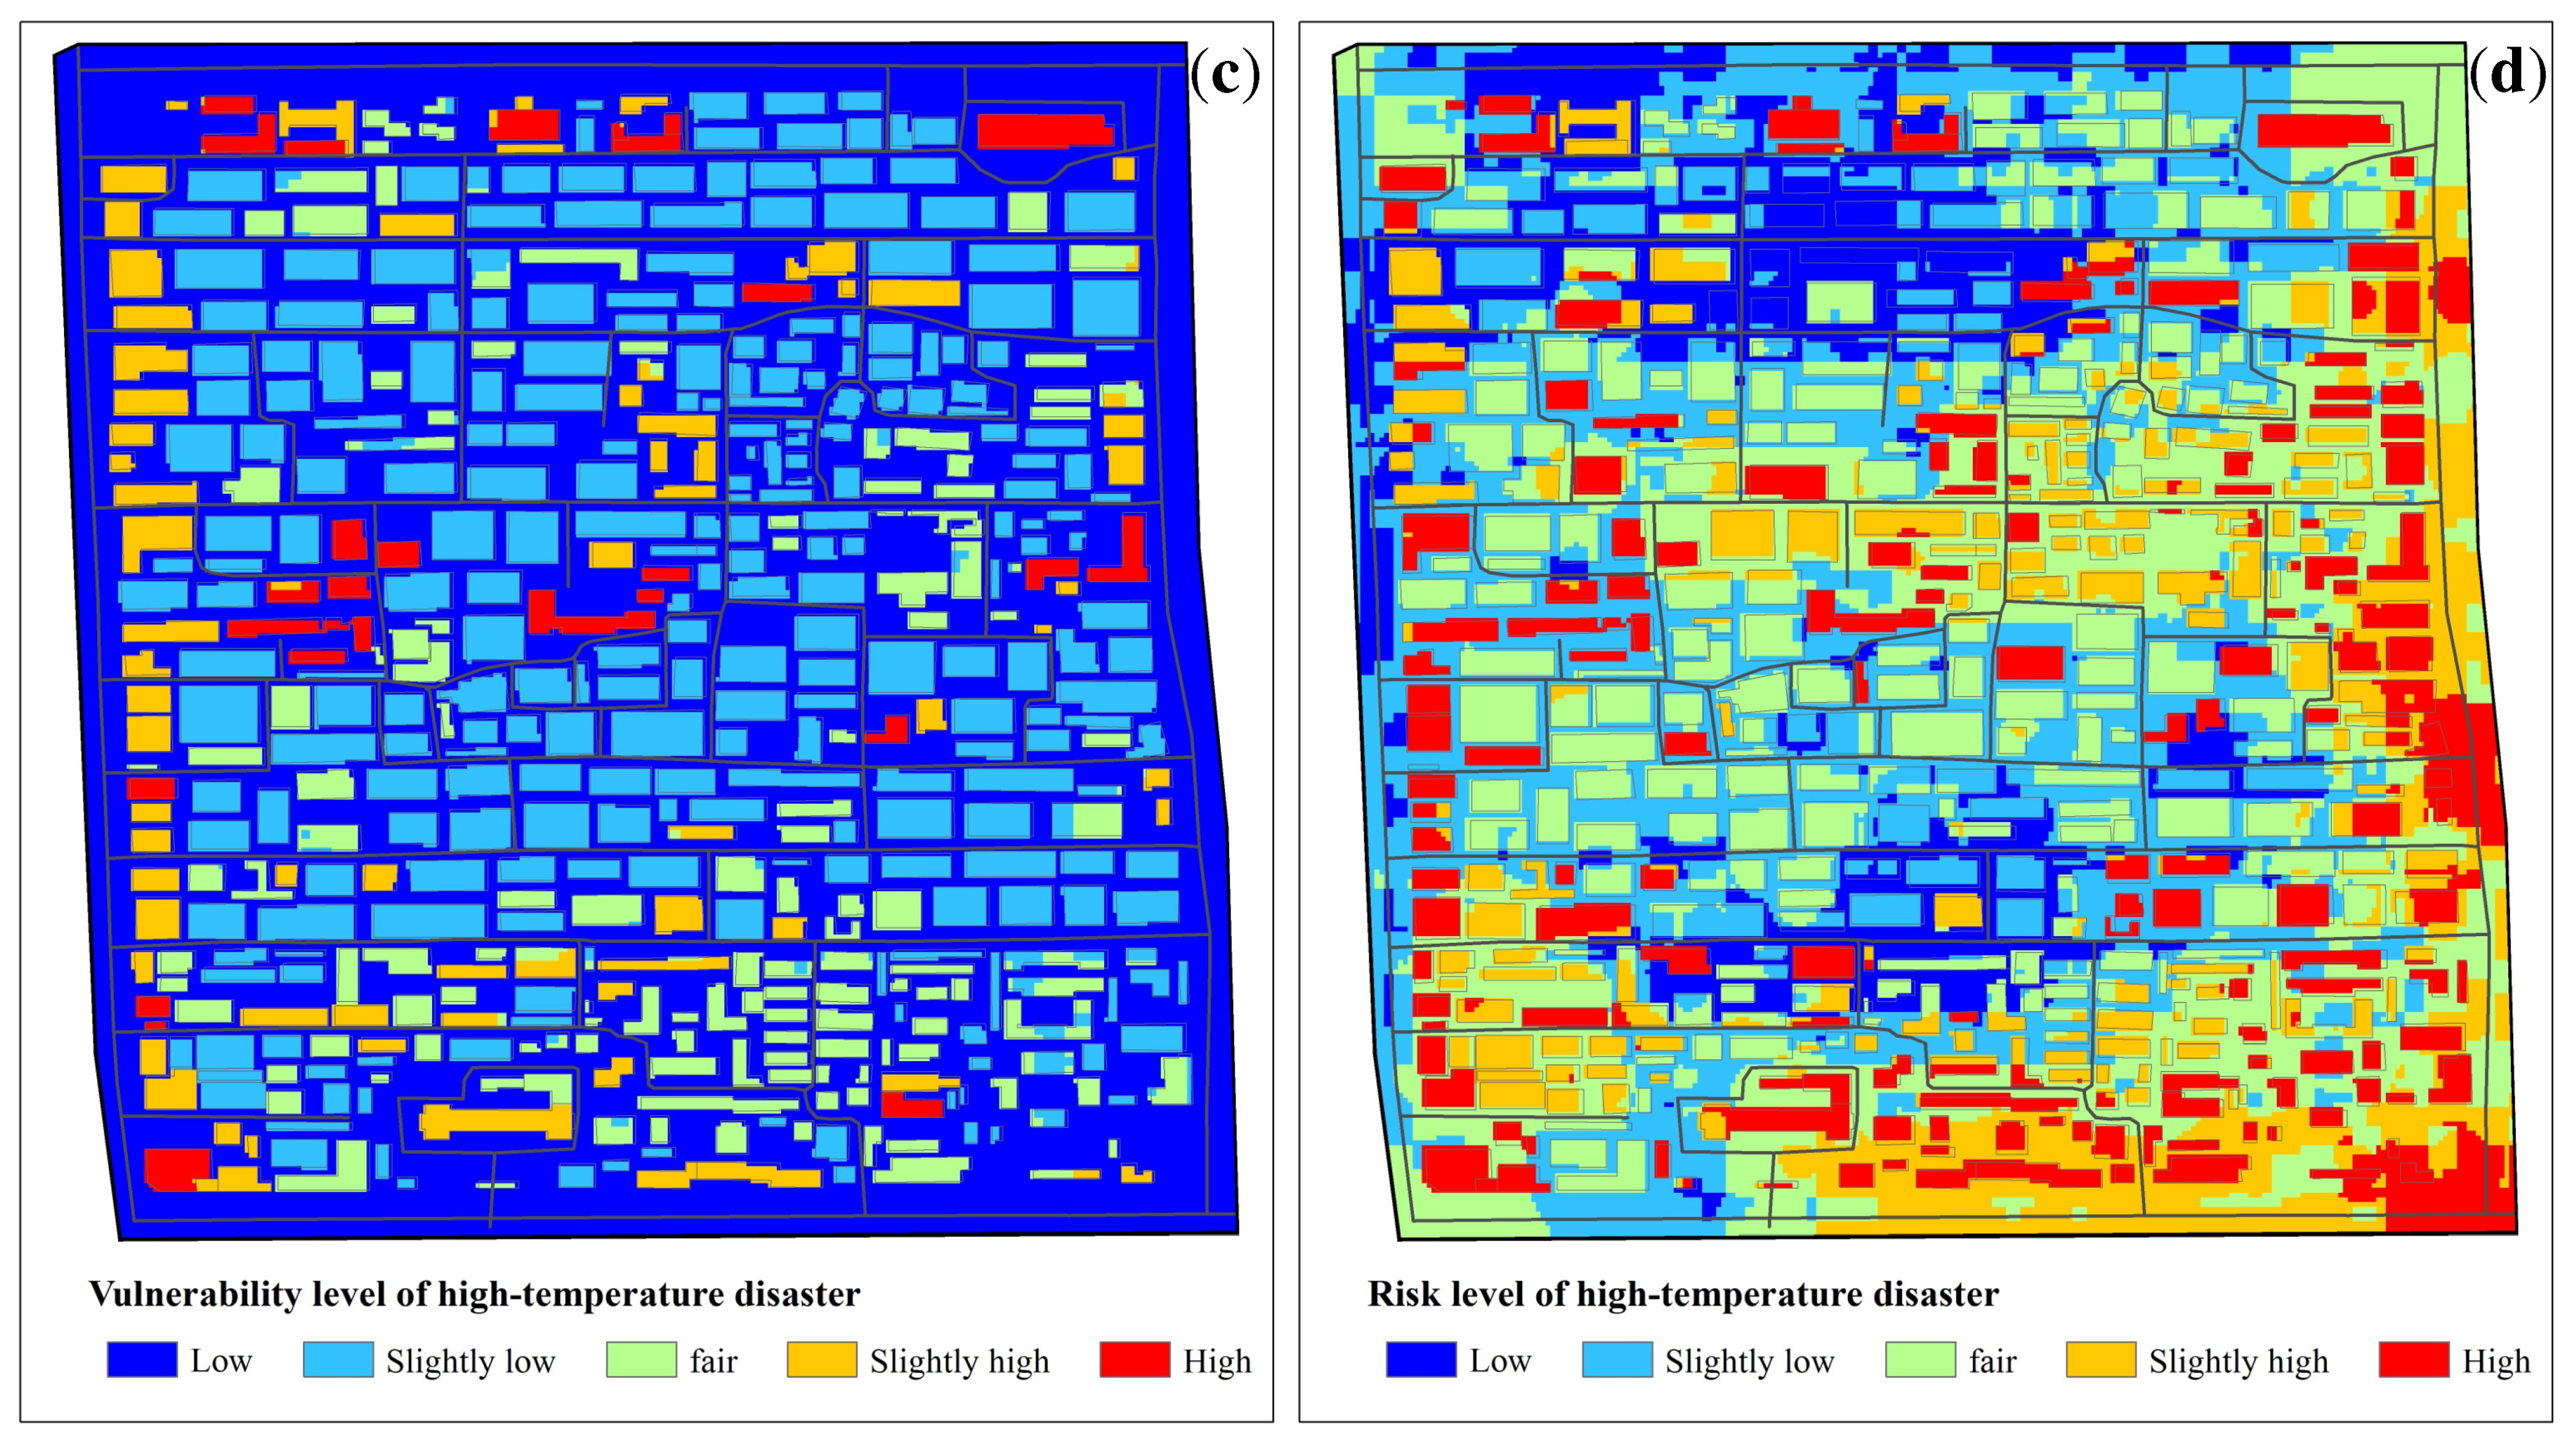
3.2. Risk Assessment of Community High-Temperature Disasters

In this study, the local temperature spatial characteristics of the community based on navigational observations and the high-temperature factors based on meteorological station observations were fused to calculate a community-scale high-temperature hazard index according to equal weight, and the natural break point method was used for classification. The spatial distribution of the high-temperature hazard levels is shown in Figure 5a. Batiao had the lowest high-temperature hazard, followed by the central areas of Santiao and Sitiao, while Chaoyangmen Beixiao Street (middle and southern sections) and Chaoyangmennei Street (middle and eastern section) area had the highest hazard.
According to Formula (1) and the weight coefficient in Table 2, and by comprehensively considering the indicators of population, economy, and historical and cultural heritage, the distribution map of high-temperature disaster exposure levels was obtained (Figure 5b). The areas with high and slightly high exposure levels in the Dongsi Community were mostly concentrated in Yueguang Hutong, the western section of Dongsi Qitiao, the eastern section of Dongsi Wutiao, the route along Dongsi Santiao, and Fuwang’s Mansion in the southeastern corner of the study area.
Similarly, based on green space, buildings and other relevant indicators, the calculated spatial distribution of the vulnerability level of high-temperature disasters is shown in Figure 5c. The areas with high and slightly high vulnerability levels were mainly concentrated in Yueya Hutong, Tieying Hutong, the areas along Dongsi Jiutiao and Dongsi North Street, and some areas in the southwestern part of the community. They were mostly distributed over key facilities and commercial lands and lacked centralized green spaces.
After normalization, the hazard, exposure, and vulnerability of high-temperature disasters were integrated according to Equation (1) with weights of 0.20, 0.40, and 0.40, respectively. The community-scale risk distribution of high-temperature disasters was obtained and is shown in Figure 5d. The percentages of low-risk, slightly lower-risk, slightly high-risk, and high-risk areas were 12.2%, 28.3%, 15.1%, and 13.5%, respectively. The high-risk areas were concentrated mostly along Chaoyangmen Beixiao Street, Fuwang’s Mansion, the west side of Chaonei Toutiao, Dongsi North Street (southern section), and certain areas along Dongsi Liutiao and Dongsi Jiutiao. The low-risk areas were distributed mainly along the Dongsi Shitiao, the surrounding area of Dongsi Batiao (middle section), Dongsi Santiao (middle section), and Dongsi North Street (northern section).

3.3. Risk Assessment of Community Rainstorm Waterlogging Disasters

As shown in Figure 6a, the area with the highest rainstorm waterlogging hazard at the community scale was concentrated in the intersection of the northwestern part of the study area and Dongsi North Street. The distribution area with the highest hazard was mainly in the western part of the study area, which was strongly influenced by the maximum precipitation for five consecutive days and the number of rainstorm days. The hazards of rainstorm waterlogging in the central and eastern parts of the study area were at normal and low levels.
The Dongsi Community was mainly composed of traditional one-story courtyard buildings, which did not have good rainwater adaptability. The spatial distribution map of the exposure levels of rainstorm waterlogging in the study area (Figure 6b) showed that the areas with high and slightly high exposure were mostly concentrated in the middle sections of Dongsi Jiutiao, Dongsi Batiao, Tieying Hutong, the middle section of Dongsi Wutiao, Dongsi Toutiao, Dongsi North Street, and Fuwang’s Mansion in the southeast corner of the study area, which had large populations or proportions of vulnerable populations and high economic property values.
The spatial distribution of the vulnerability level of rainstorm waterlogging disasters in the study area is shown in Figure 6c. The areas with high and slightly high vulnerability were concentrated mostly along Dongsi North Street and some areas inside the community, and the areas with greater densities of green spaces, drainage pipes, or greater topographic heights had lower vulnerability.
After normalization, the hazard, exposure, and vulnerability of the rainstorm waterlogging disasters was integrated according to Equation (1) with weights of 0.20, 0.40, and 0.40, respectively. The community-scale risk distribution of rainstorm waterlogging disasters was obtained and is shown in Figure 6d. The risk of rainstorm waterlogging disasters in the study area was characterized by a high risk in the northwestern region and a low risk in the southeastern region. The percentages of low-risk, slightly low-risk, slightly high-risk, and high-risk areas were 11.1%, 10.1%, 31.6%, and 9.8%, respectively. The high-risk areas were mainly concentrated along Dongsi North Street, the western sections of Dongsi Jiutiao, Batiao, and Qitiao, and some areas of Yueguang Hutong; the low-risk areas were mostly concentrated along Chaoyangmen Street (eastern section), Fuwang’s Mansion, places along the Dongsi Santiao (middle section and east section), and the places along Dongsi Sitiao (middle section and east section).

4. Discussion

4.1. Necessity of Conducting Community-Scale Risk Assessment

The assessment results showed that the risk of high-temperature and rainstorm waterlogging disasters at the community scale exhibit obvious spatial imbalances. This spatial difference not only depended on the frequency and intensity of the disasters themselves, but was also affected by factors such as surface cover (buildings, vegetation, etc.) and population density within the community [22,23,24,25]. Identifying areas at different risk levels at the community scale will facilitate corresponding adaptive planning measures for different types of spaces to be implemented. For old communities in city centers, special attention should be given to the creation of vegetation spaces and the regularity of building forms to improve the internal microclimate of the community [6,26]. In addition, by comparing Figure 5d and Figure 6d, it can be seen that in some regions (e.g., the northwest part and southeast part of Dongsi Community), the risks caused by high-temperature events and rainstorm waterlogging events were broadly opposite to each other. This characteristic points directly to management choices and work to improve the issue with the higher risk of occurrence.
Relevant results have shown that, due to urbanization, urban heat islands, rain islands, and other factors, the high-temperature and rainstorm disaster risk levels of core areas of the capital, where the Dongsi Community is located, are the highest in the entire Beijing Municipality [17,27]. Therefore, as a traditional old block, the Dongsi Community faces more severe climate risk from high temperatures and rainstorm waterlogging, and climate adaptation actions are urgent. It is necessary to proactively consider meteorological disaster risk and adopt adaptive measures based on local conditions in the planning and construction of resilient communities [28,29]. In October 2021, Beijing took the lead in printing and distributing the “Guiding Opinions on Accelerating the Construction of Resilient Cities”, which stipulated that “by 2025, build 50 resilient communities, resilient blocks or projects and to form a scalable and reproducible pattern of resilient city construction”. In this study, a helpful exploration of refined meteorological disaster risk assessments at the community level was carried out, providing scientific support for the planning and construction of resilient communities, as well as the formulation of overall adaptation goals, action frameworks and specific planning strategies at the community level from the climate perspective.

4.2. Limitations and Prospects

Due to data constraints, there were still certain limitations, including the lack of indicators for flood control and waterlogging relief, and the generalization of the community drainage network. In addition, the disaster risk assessment in this study was conducted separately for a single type of disaster, without considering the composite or cascading effects between different types of disasters. The assessment of multi hazard composite risks has not been addressed in this study. To focus on the risk assessment of high-temperature and rainstorm waterlogging disasters at the community scale, the following research should be conducted in the future:
(1) Additional normative and continuous community-scale local meteorological observation experiments (combinations of fixed-point observations and navigation observations) should be carried out. Through multi-sectoral cooperation, more complete and refined multisource data (such as planning, socioeconomic, and municipal data) should be integrated to further enhance the sophistication and accuracy of community-scale meteorological disaster risk assessments.
(2) For typical blocks, computational fluid dynamics technology and storm water management models can be used to carry out refined climatic environment simulation and urban waterlogging simulation under climatic conditions or extreme high-temperature/heavy precipitation events, thus helping to further identify the high-risk areas and their dominant influencing factors.
(3) In this study, the community-scale risk assessments were only aimed at the current situation. Risk sensitivity assessments can be carried out on different renovation design schemes developed for the community. Furthermore, risk prediction can be conducted for longer time scales based on future climate change scenarios combined with population, economic, and spatial development in the future.

5. Conclusions

In this study, the observation data of meteorological stations, local navigation observation experiments, and multisource data such as refined land use, municipal administration, and socioeconomic data were integrated to carry out risk assessments of community-scale high-temperature and rainstorm waterlogging disasters by taking the Dongsi Community in Beijing as an example. A community-scale risk assessment index system was established to quantify the hazard, exposure, and vulnerability of the high-temperature and rainstorm waterlogging disasters in the Dongsi Community, and more detailed spatial distribution characteristics of the community-scale disaster risk were obtained. The main research results are as follows:
(1) It was found that high-risk areas and slightly high-risk areas of high-temperature disasters accounted for 13.5% and 15.1%, respectively. The high-risk areas and slightly high-risk areas of rainstorm waterlogging disasters accounted for 9.8% and 31.6%, respectively. The high-risk areas common to high temperatures and waterlogging accounted for 3.9%.
(2) The risk in the surrounding area of the middle section of Dongsi Santiao was the lowest, while other areas had a certain degree of high-temperature or rainstorm waterlogging disaster risk, especially the area along Dongsi North Street, the surrounding area of Dongsi Liutiao (Yueya Hutong, Yueguang Hutong, Tieying Hutong, Liushui Alley, Dehuali, etc.) and some areas along the Dongsi Jiutiao were at great risk.
(3) The risk of high-temperature and rainstorm waterlogging disasters at the community scale showed obvious spatial imbalances. These spatial differences were affected to a greater extent by land cover (buildings, vegetation, etc.) and population density within the community, but the specific quantitative analysis of their relationship needs to be further explored.

Author Contributions

Conceptualization, P.X. and W.D.; data curation, P.X., J.Z., and F.X.; formal analysis, P.X., R.Y., J.Z., J.W., and M.B.; investigation, P.X., Y.G., J.W., and B.D.; methodology, P.X., W.D., Y.G., and C.X.; software, P.X., R.Y., and M.B.; writing—original draft, P.X. and R.Y.; writing—review and editing, P.X., W.D., Y.G., and C.X. All authors have read and agreed to the published version of the manuscript.

Funding

This research was funded by the youth innovation team of China Meteorological Administration (No. CMA2024QN12), the National Natural Science Foundation of China projects (No. 41901017), and the urban adaptive planning project from Beijing Municipal Institute of City Planning and Design.

Institutional Review Board Statement

Not applicable.

Informed Consent Statement

Not applicable.

Data Availability Statement

The data presented in this study are available on request from the corresponding author. The data are not publicly available due to privacy.

Conflicts of Interest

The authors declare no conflicts of interest.

References

  1. Li, C.; Lu, T.; Fu, B.; Wang, S.; Holden, J. Sustainable city development challenged by extreme weather in a warming world. Geogr. Sustain. 2022, 3, 114–118. [Google Scholar] [CrossRef]
  2. IPCC (Intergovernmental Panel on Climate Change). Climate Change 2022: Impacts, Adaptation, and Vulnerability; Cambridge University Press: Cambridge, UK, 2022; Available online: https://www.ipcc.ch/report/ar6/wg2/ (accessed on 12 August 2022).
  3. Chan, F.K.S.; Yang, L.E.; Scheffran, J.; Mitchell, G.; Mcdonald, A. Urban flood risks and emerging challenges in a Chinese delta: The case of the Pearl River Delta. Environ. Sci. Policy 2021, 122, 101–115. [Google Scholar] [CrossRef]
  4. Hemmati, M.; Kornhuber, K.; Kruczkiewicz, A. Enhanced urban adaptation efforts needed to counter rising extreme rainfall risks. NPJ Urban Sustain. 2022, 2, 16. [Google Scholar] [CrossRef]
  5. Ouyang, H.; Tang, X.; Zhang, R.; Baklanov, A.; Brasseur, G.; Kumar, R.; Han, Q.; Luo, Y. Resilience building and collaborative governance for climate change adaptation in response to a new state of more frequent and intense extreme weather events. Int. J. Disast. Risk Sc. 2023, 14, 162–169. [Google Scholar] [CrossRef]
  6. Shan, Z.; An, Y.; Xu, L.; Yuan, M. High-temperature disaster risk Assessment for Urban Communities: A Case Study in Wuhan, China. Int. J. Environ. Res. Public Health 2022, 19, 183. [Google Scholar] [CrossRef] [PubMed]
  7. WMO (World Meteorological Organization). United in Science 2022: A Multi-Organization High-Level Compilation of the Most Recent Science Related to Climate Change, Impacts and Responses. Available online: https://wmo.int/publication-series/united-science-2022 (accessed on 23 January 2023).
  8. Olazabal, M.; Gopegui, M.R.D. Adaptation planning in large cities is unlikely to be effective. Landsc. Urban Plan. 2021, 206, 103974. [Google Scholar] [CrossRef]
  9. Liu, J.; Shen, Y. Research on community resilience oriented to risk governance. Urban Dev. Stud. 2017, 24, 83–91. [Google Scholar] [CrossRef]
  10. Peng, C.; Guo, Z.; Peng, Z. Research progress on the theory and practice of foreign community resilience. Urban Plan. Int. 2017, 32, 60–66. [Google Scholar] [CrossRef]
  11. Yang, L.; Chen, W.; Wu, J.; Sun, W.; Li, Y. Spatial planning adapting to climate change: Progress in the content and methodology. Urban Plan. Int. 2020, 35, 96–100+3701–3703. [Google Scholar] [CrossRef]
  12. Kong, D.; Gu, X.; Li, J.; Ren, G.; Liu, J. Contributions of global warming and urbanization to the intensification of human-perceived heatwaves over China. J. Geophys. Res. Atmos. 2020, 125, e2019JD032175. [Google Scholar] [CrossRef]
  13. Zheng, Y.; Wang, M.; Li, J.; Xia, D. Risk assessment of high temperature and adaptive planning strategies: Shenzhen example. Planners 2021, 37, 13–19. [Google Scholar]
  14. Leis, J.L.; Kienberger, S. Climate risk and vulnerability assessment of floods in Austria: Mapping homogenous regions, hotspots and typologies. Sustainability 2020, 12, 6458. [Google Scholar] [CrossRef]
  15. Chen, K.; Tang, Y. Identification of urban areas vulnerable to heat waves and coping strategies: A case study of Beijing central city. City Plan. Rev. 2019, 43, 37–44. [Google Scholar]
  16. Jiang, T.; Wang, Y.; Su, B. Meteorological Disaster Risk Assessment and Management; Science Press: Beijing, China, 2023; pp. 12–15. [Google Scholar]
  17. Cheng, C.; Fang, X.; Li, M.; Yang, Y.; Gao, Y.; Zhang, S.; Yu, Y.; Liu, Y.; Du, W. Rainstorm and high-temperature disaster risk assessment of territorial space in Beijing, China. Meteorol. Appl. 2023, 30, e2140. [Google Scholar] [CrossRef]
  18. Wang, Y.; Zhai, J.; Gao, G.; Liu, Q.; Song, L. Risk assessment of rainstorm disasters in the Guangdong–Hong Kong–Macao greater Bay area of China during 1990–2018. Geomat. Nat. Haz. Risk 2022, 13, 267–288. [Google Scholar] [CrossRef]
  19. Zhao, K.; Wang, J.; Yan, Q.; Huang, X. Urban waterlogging simulation and its risk assessment in the old area of Xi’an. J. Nat. Disasters 2023, 32, 1–12. [Google Scholar] [CrossRef]
  20. Jiang, T.; Wang, Y.; Zhai, J. Technical Guide for Meteorological Disaster Risk Assessment; China Meteorological Press: Beijing, China, 2018; pp. 135–138. [Google Scholar]
  21. Li, J.; Xu, X.; Yang, J.; Liu, Z. Ambient high temperature and mortality in Jinan, China: A study of heat thresholds and vulnerable populations. Environ. Res. 2017, 156, 657–664. [Google Scholar] [CrossRef]
  22. Krstic, N.; Yuchi, W.; Ho, H.C.; Walker, B.B.; Knudby, A.J.; Henderson, S.B. The heat exposure integrated deprivation index (HEIDI): A data-driven approach to quantifying neighborhood risk during extreme hot weather. Environ. Int. 2017, 109, 42–52. [Google Scholar] [CrossRef]
  23. Li, W.; Xu, B.; Wen, J. Scenario-based community flood risk assessment: A case study of Taining county town, Fujian province, China. Nat. Hazards 2016, 82, 193–208. [Google Scholar] [CrossRef]
  24. Liu, F.; Liu, X.; Xu, T.; Yang, G.; Zhao, Y. Driving factors and risk assessment of rainstorm waterlogging in urban agglomeration areas: A case study of the Guangdong-Hong Kong-Macao greater Bay Area, China. Water 2021, 13, 770. [Google Scholar] [CrossRef]
  25. Uejio, C.K.; Wilhelmi, O.V.; Golden, J.S.; Mills, D.M.; Gulino, S.P.; Samenow, J.P. Intra-urban societal vulnerability to extreme heat: The role of heat exposure and the built environment, socioeconomics, and neighborhood stability. Health Place 2011, 17, 498–507. [Google Scholar] [CrossRef] [PubMed]
  26. Xiao, H.; Guo, Y.; Wang, Y.; Xu, Y.; Shi, J. Mitigation and adaptation approach in neighborhood scale to cope with health risks under extreme heat stress: Experience and implications of cool neighborhoods NYC. Planners 2022, 38, 151–158. [Google Scholar]
  27. Xuan, C.; Liu, Y.; Yang, X.; Shu, W.; Wu, C.; Hu, Y.; Du, W. Risk zoning of Beijing rainstorm disasters based on 1 km resolution grids. Meteorol. Sci. Technol. 2020, 48, 579–589. [Google Scholar] [CrossRef]
  28. Song, L. Climate risk and adaptation strategies in metropolis dense areas: A case study of Shanghai. China Popul. Resour. Environ. 2012, 22, 6–12. [Google Scholar]
  29. Zhu, C.; Liu, M.; Xu, J. The development strategy of Boston’s climate resilient city and its implications. Innov. Sci. Technol. 2021, 21, 29–37. [Google Scholar] [CrossRef]
Figure 1. Overview of the study area located in the context of the Chinese territory (a) and Beijing (b); and schematic diagram of the distribution of the major streets and buildings within the study area (c) and its 3D map (d).
Atmosphere 15 01132 g001
Figure 2. Schematic diagram of the navigation observation path of the temperature in the community.
Atmosphere 15 01132 g002
Figure 3. Spatial distribution of meteorological-related indicators used in the refined risk assessment of the Dongsi Community: (a) number of consecutive days with daily maximum temperature above 35 °C; (b) number of consecutive days above 38 °C; (c) average maximum temperature; (d) extreme maximum temperature; (e) local temperature based on navigation observation; (f) extreme precipitation; (g) maximum precipitation for 5 consecutive days; and (h) number of heavy rain days with daily precipitation above 25 mm.
Atmosphere 15 01132 g003
Figure 4. Spatial distribution of nonmeteorological indicators used in the refined risk assessment of the Dongsi Community: (a) cultural relics and historic buildings; (b) ancient trees; (c) building use; (d) building height; (e) per capita income; (f) total population; (g) female population proportion; (h) elderly population proportion; (i) Manning rough coefficient; (j) depression water storage index; (k) drainage outlet density; (l) low-lying areas; (m) terrain height; and (n) green space plot (common arbor).
Atmosphere 15 01132 g004aAtmosphere 15 01132 g004b
Figure 5. Spatial distribution of the hazard (a), exposure (b), vulnerability (c), and risk (d) levels of high-temperature disasters in the Dongsi Community.
Atmosphere 15 01132 g005aAtmosphere 15 01132 g005b
Figure 6. Spatial distributions of the hazard (a), exposure (b), vulnerability (c), and risk (d) levels of rainstorm waterlogging disasters in the Dongsi Community.
Atmosphere 15 01132 g006
Table 1. Data types and sources.
Data TypeData Characteristics and Sources
Temperature and precipitation dataMeteorological observation station data from Beijing Meteorological Data Center for the period 2012–2020.
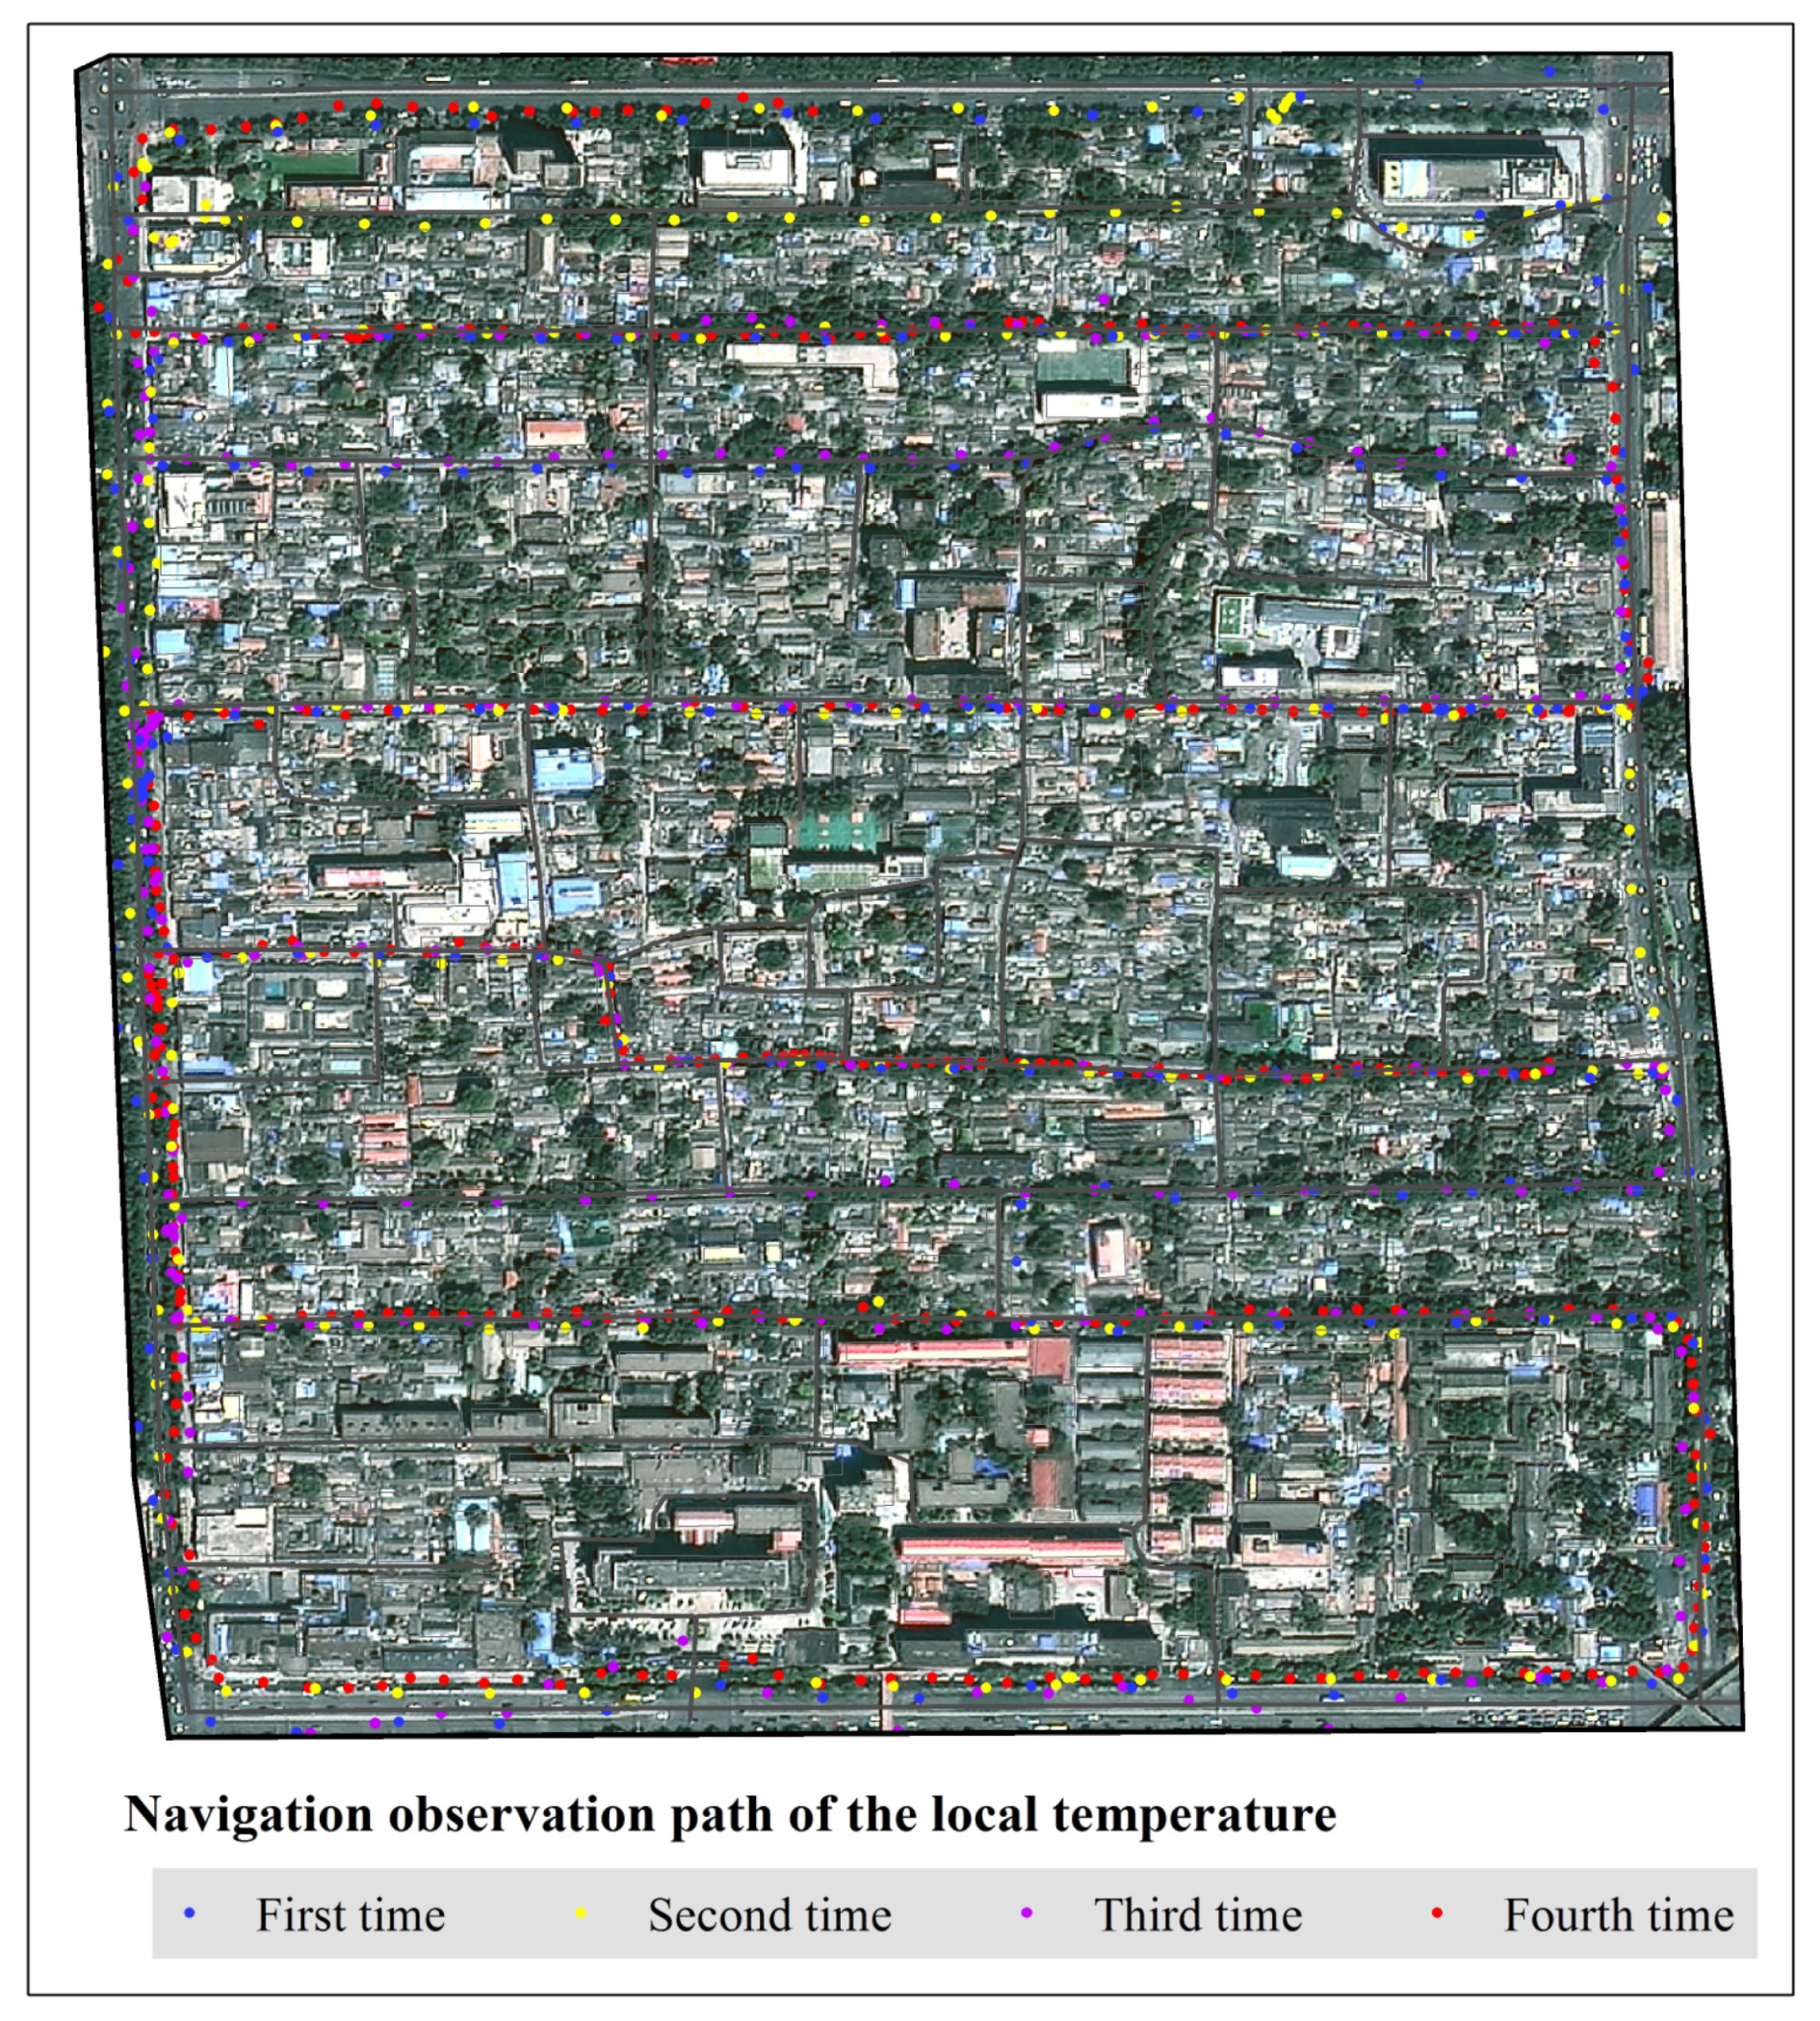
Local temperature in the communitySourced from navigation observations on 25 August 2021, late afternoon; 26 August 2021, evening; 30 August 2021, late afternoon; and 1 September 2021, morning.
Range, building, street, drainage network vector dataThe information on the scope of the study area, building height, building type, distribution of historical and cultural heritage, road grade, locations and diameters of drainage pipes were sourced from the “Regulation Rules and Explanation Guidelines for Dongsi Street”, dated 2020.
Land use dataBased on Landsat satellite remote sensing retrieval, with a spatial resolution of 10 m, dated 2020.
DEM dataSRTM DEM terrain data with a spatial resolution of 30 m released by the National Aeronautics and Space Administration (NASA) (https://dwtkns.com/srtm30m/ or https://earthexplorer.usgs.gov/, both accessd on 9 January 2022).
Population and per capita income dataAccuracy of 70 m × 80 m, from Baidu Huiyan resident population data in 2020 (https://huiyan.baidu.com/, accessed on 25 November 2021). The data introduction states that all stages of data processing are anonymized, and each stage and output do not involve individual privacy.
Distribution data of courtyards with low-lying ponded waterSourced from the Dongsi Street Office in 2021.
Surface roughness coefficient and depression water storage indexThe surface type was determined based on the land use, and the coefficient and index values were queried in the “Storm Water Management Model (SWMMH) User’s Manual (version 5.0)”.
Table 2. Indicator system for risk assessment of community-scale high-temperature disasters.
Primary Indicators and WeightsSecondary Indicators and Weights
Primary
Indicators
Weight
Coefficient
TypeSecondary IndicatorsWeight
Coefficient
Role
Hazard0.30Observed temperature from meteorological stationsExtreme maximum temperature0.20+
Average maximum temperature0.15+
Number of consecutive days above 35 °C0.05+
Number of consecutive days above 38 °C0.10+
Navigation observation of local temperatureLocal temperature in community0.50+
Exposure0.40Historical and cultural heritage relatedAncient tree0.21+
Historic building0.21+
Demographic relatedTotal population0.07+
Proportion of female population 0.13+
Proportion of ≥65 year old population0.19+
Economic valuePer capita income0.19+
Vulnerability0.30Construction relatedKey facilities0.30+
Construction use0.28+
Building height0.28+
Green spaceCommon trees0.14
Table 3. Indicator system for risk assessment of community-scale rainstorm waterlogging disasters.
Primary Indicators and WeightsSecondary Indicators and Weights
Primary
Indicators
Weight
Coefficient
TypeSecondary IndicatorsWeight
Coefficient
Role
Hazard0.20Related to precipitation elementExtreme precipitation0.20+
Maximum precipitation for 5 consecutive days0.31+
Number of rainstorm days0.49+
Exposure0.40Construction relatedKey facilities0.10+
Construction use0.26+
Building height0.06+
Demographic relatedTotal population0.07+
Proportion of female population 0.13+
Proportion of ≥65 year old population0.19+
Economic valuePer capita income0.19+
Vulnerability0.40Manning rough
coefficient
Manning roughness coefficient of tile, asphalt and concrete0.20+
Green space Manning coefficient0.04+
Depression water storage indexWater accumulation in impervious pavement and flat roof depressions0.16+
Water accumulation in depressions on sloping roof0.12+
Water accumulation in green space depressions0.03+
Low-lying areasLow-lying courtyard0.17+
Drainage indexDrain nozzle density0.08
Terrain influenceDEM elevation0.16
Green spaceCommon trees0.04
Disclaimer/Publisher’s Note: The statements, opinions and data contained in all publications are solely those of the individual author(s) and contributor(s) and not of MDPI and/or the editor(s). MDPI and/or the editor(s) disclaim responsibility for any injury to people or property resulting from any ideas, methods, instructions or products referred to in the content.

