Abstract
Previous research has shown that people use a benchmark hurricane as part of their preparation and evacuation decision-making process. While hurricanes are a common occurrence along the Gulf Coast, research on personal memories of past storms is lacking. Particularly, how well do people remember the track and geophysical hazards (wind speed, storm surge, and total rainfall) of past storms? The accurate or inaccurate recollection and perception of previous storm details can influence personal responses to future storms, such as the decision to evacuate or take other life-saving actions. Survey responses of residents in Alabama and Mississippi were studied to determine if people were accurately able to recall a notable storm’s name when seeing an image of the storm’s track. Those who were able to identify the storm by its track were also asked if they could remember the storm’s maximum reported rainfall, maximum sustained winds, and storm surge at landfall. Results showed that there were statistically significant differences between the levels of accurate recall for different storms, with Hurricanes Katrina and Michael having the most correct responses. Regardless of the storm, most people struggled to remember geophysical hazards. The results of this study are important as they can inform broadcast meteorologists and emergency managers on forecast elements of the storm to better emphasize in future communication in comparison to the actual values from historical benchmark storms.
1. Introduction
Despite the lack of incontrovertible evidence of a clear link between hurricanes and climate change, there are multiple lines of evidence suggesting worsening impacts from tropical cyclones. There has been an increase in intense tropical cyclones in recent decades [1], which will become more destructive especially as populations continue to grow near coastal areas [2]. There has been a significant increase in offshore rapid intensification events within 400 km of the coastline between 1980 and 2020 [3], and elevated potential for more intense tropical cyclones impacting North America with increasing sea surface temperature [4]. Additionally, Gori et al. [5] show escalating vulnerability on the U.S. East Coast from a combined storm surge and rainfall joint hazard as the translational speed of tropical cyclones and storm intensity coincide. Balaguru et al. [6] found that there may be up to a 47% median increase in storm surge from future hurricanes, along with a mean intensity increase between 1.8 and 4.2%. These findings are forming a consensus toward greater confidence in worsening tropical cyclone impacts compared to the greater uncertainty from published articles prior to 2015. It is important that meteorologists and other public safety personnel effectively communicate hurricane risk so the public can make informed decisions on actions to take when facing an approaching hurricane.
Many studies within the past decade have tried to assess how individuals threatened by hurricanes perceive these storms. One paper, published after Hurricanes Isaac and Sandy (2012), concluded that many of those surveyed did not fully comprehend the threats they faced from the impending storms [7]. Similarly, Senkbeil et al. [8] found that people often misunderstand risk from wind speeds on the Saffir Simpson Hurricane Wind Scale (SSHWS) and may overestimate the wind speeds observed over land after landfall. Conversely, interviews of Alabama and Florida residents facing Hurricane Michael showed that a significant portion did not evacuate as many underestimated the potential wind severity prior to the storm rapidly intensifying in the last 18 h before landfall. Preceding Michael, many people had taken preparatory action for storms that either weakened and/or had a track which changed course, resulting in them evacuating for conditions that were less severe than what they expected. For Hurricane Michael, by the time many residents decided to evacuate, the rapidly deteriorating conditions made it unsafe to do so. Furthermore, the benchmark storm in this region from many interview comments was Hurricane Opal (1995), an SSHWS Category 3 storm that made landfall well to the west of Michael (2018) [9]. Even though Opal (1995) was the strongest hurricane to affect the Florida Panhandle in recent times, using Opal as a benchmark for the much stronger and more devastating Michael (2018) was a poor comparison and expectation. Location in relation to the Michael (2018) storm track also influenced the type of hazard they were most concerned about (e.g., wind, storm surge, rainfall, and downed trees) [9].
With Florida being a major travel destination, it is also important to understand the perception of those who may be unfamiliar with tropical cyclones and the hazards they bring. It was found that tourists were vulnerable due to their lack of understanding about hurricane hazards, which likely impacted their decisions to evacuate in the event of a storm [10]. Whether a long-time resident or tourist of a hurricane-prone area, people are often at risk, meaning that the decisions they make in the event of a disaster could lead to a positive or negative outcome.
There are several studies regarding the perception of hurricane risk as well as memory recall; however, in combining the two, there is a noticeable lack of research regarding people’s memory of hurricane forecast details, especially in a more recent context. Hyatt et al. [11] attempted to identify the types of information that people could recall from weather forecasts. Over 200 people from the Twin Cities Area in Minnesota were asked to recall the evening forecast information from the broadcast. It was found that most people could not accurately recall or simply did not know the local weather conditions, much less national weather conditions. As this study was carried out in the 1970s, it can be assumed that broadcast methods (television, radio, etc.) were not as robust as they are now, especially with the usage of social media by the public. Research performed on a mixture of younger and older adults gave the participants roughly two minutes to study the details of a weekly weather forecast. The forecast information included precipitation, minimum and maximum temperatures, and other likely weather conditions that may occur that week. The study tested their standard (exact details) and gist memory, in which they were asked questions such as “Which days of the week would it be best to have a picnic or bring an umbrella?” Researchers from this study found that younger adults were able to recall exact details of the forecasts whether they were instructed to try to remember these or not [12]. Even visual aids such as the extended forecast graphic may not be enough to effectively communicate important details from a weather forecast that would resonate with the audience. Reed and Senkbeil [13] found that the public may interpret things such as probability of precipitation differently than a broadcast meteorologist would. Notably, 86% of the study’s survey respondents were still unclear on how much rain would fall after viewing an extended forecast graphic sample.
The significance of memory extends from the general public to public officials, as Colten and Giancarlo [14] note that the social memories from the occurrence of Hurricane Camille (1969) on the Mississippi Gulf Coast faded over time. Although this area has frequent hurricane experiences, those living in the area impacted by Hurricane Katrina (2005) seemingly incorporated little to none of the adaptation and resilience lessons in their planning and preparation efforts. This was a factor in the high fatality rate that occurred when Katrina (2005) hit almost four decades later [14]. Although the two hurricanes made landfall in the same place, people did not understand the different hazard potential. Katrina was a large, slower moving Category 3, with higher rainfall and storm surge volume that flooded a larger section of the coastline. Camille (1969) was a smaller Category 5 with lower storm surge volume and less rainfall [15,16]. Camille has always been the established benchmark storm for the Mississippi coast and when Katrina was downgraded to an SSHWS Category 3, too many people expected less serious conditions. Such distinctions are important to accurately recall when making preparation and evacuation decisions about future storms.
Though not directly related to hurricanes, Demnitz and Joslyn [17] found that the availability of information, or events that can be easier to recall, made people more cautious when making decisions. In regard to hurricanes, it was found that respondents who experienced Hurricanes Ike and Sandy were better able to recall wind speeds in comparison to storm surge, possibly due to the mental image of wind damage being easier to conjure than flood damage [7]. Adolescents and adults surveyed on their memory of a tornado years after it occurred were able to recall tornadic events that day and produce narratives of the events that took place [18]. However, it was found that older age groups often struggled to recall negative stimuli in a controlled study in comparison to younger age groups. This is believed to be due to the older age group not processing the negative stimuli as intensely as did younger groups [19]. Overall, with the exception of age, the literature regarding memory in relation to severe weather events generally does not show significant relationships.
The objective of our research was to understand the aspects of storm information that people typically retain after a major hurricane landfall. It was hypothesized that this study’s results would be related to the concept of distance decay, which states that there is a decrease in interaction or familiarity between two entities as the distance between them grows [20]. Essentially, the farther a person is away from the hurricane’s landfall point, the fewer details they will remember about the storm. The same result should also be expected when looking at time since landfall. More recent storms will be easier for participants to recall than older storms. There is a possibility that storms such as Katrina (2005) which had intense national media coverage may lead to more accurate recall than even more recent storms such as Irma (2017) [21]. This research could be of use not only to public officials and emergency management personnel, but, more importantly, broadcast meteorologists who are responsible for distributing this information to the public. Because people use past storms and benchmark storms as a major factor for making decisions regarding evacuation and protective actions [22], it is imperative to study the information that is retained by the public to aid and/or improve future hurricane warnings and advisories.
This study attempted to analyze the amount of information retained after major hurricanes have made landfall. Residents of Mississippi and Alabama were asked about their memory and perception of notable or famous hurricanes in their region. The major research questions for this study were the following:
- Were survey participants able to correctly identify past storms by viewing a map of their storm tracks?
- Those who correctly identified the storm were asked to remember details at landfall about wind, storm surge, and rainfall.
- ○
- Were participant memories accurate?
- ○
- What influenced memory accuracy?
2. Methods
2.1. Survey Structure, Design, and Distribution
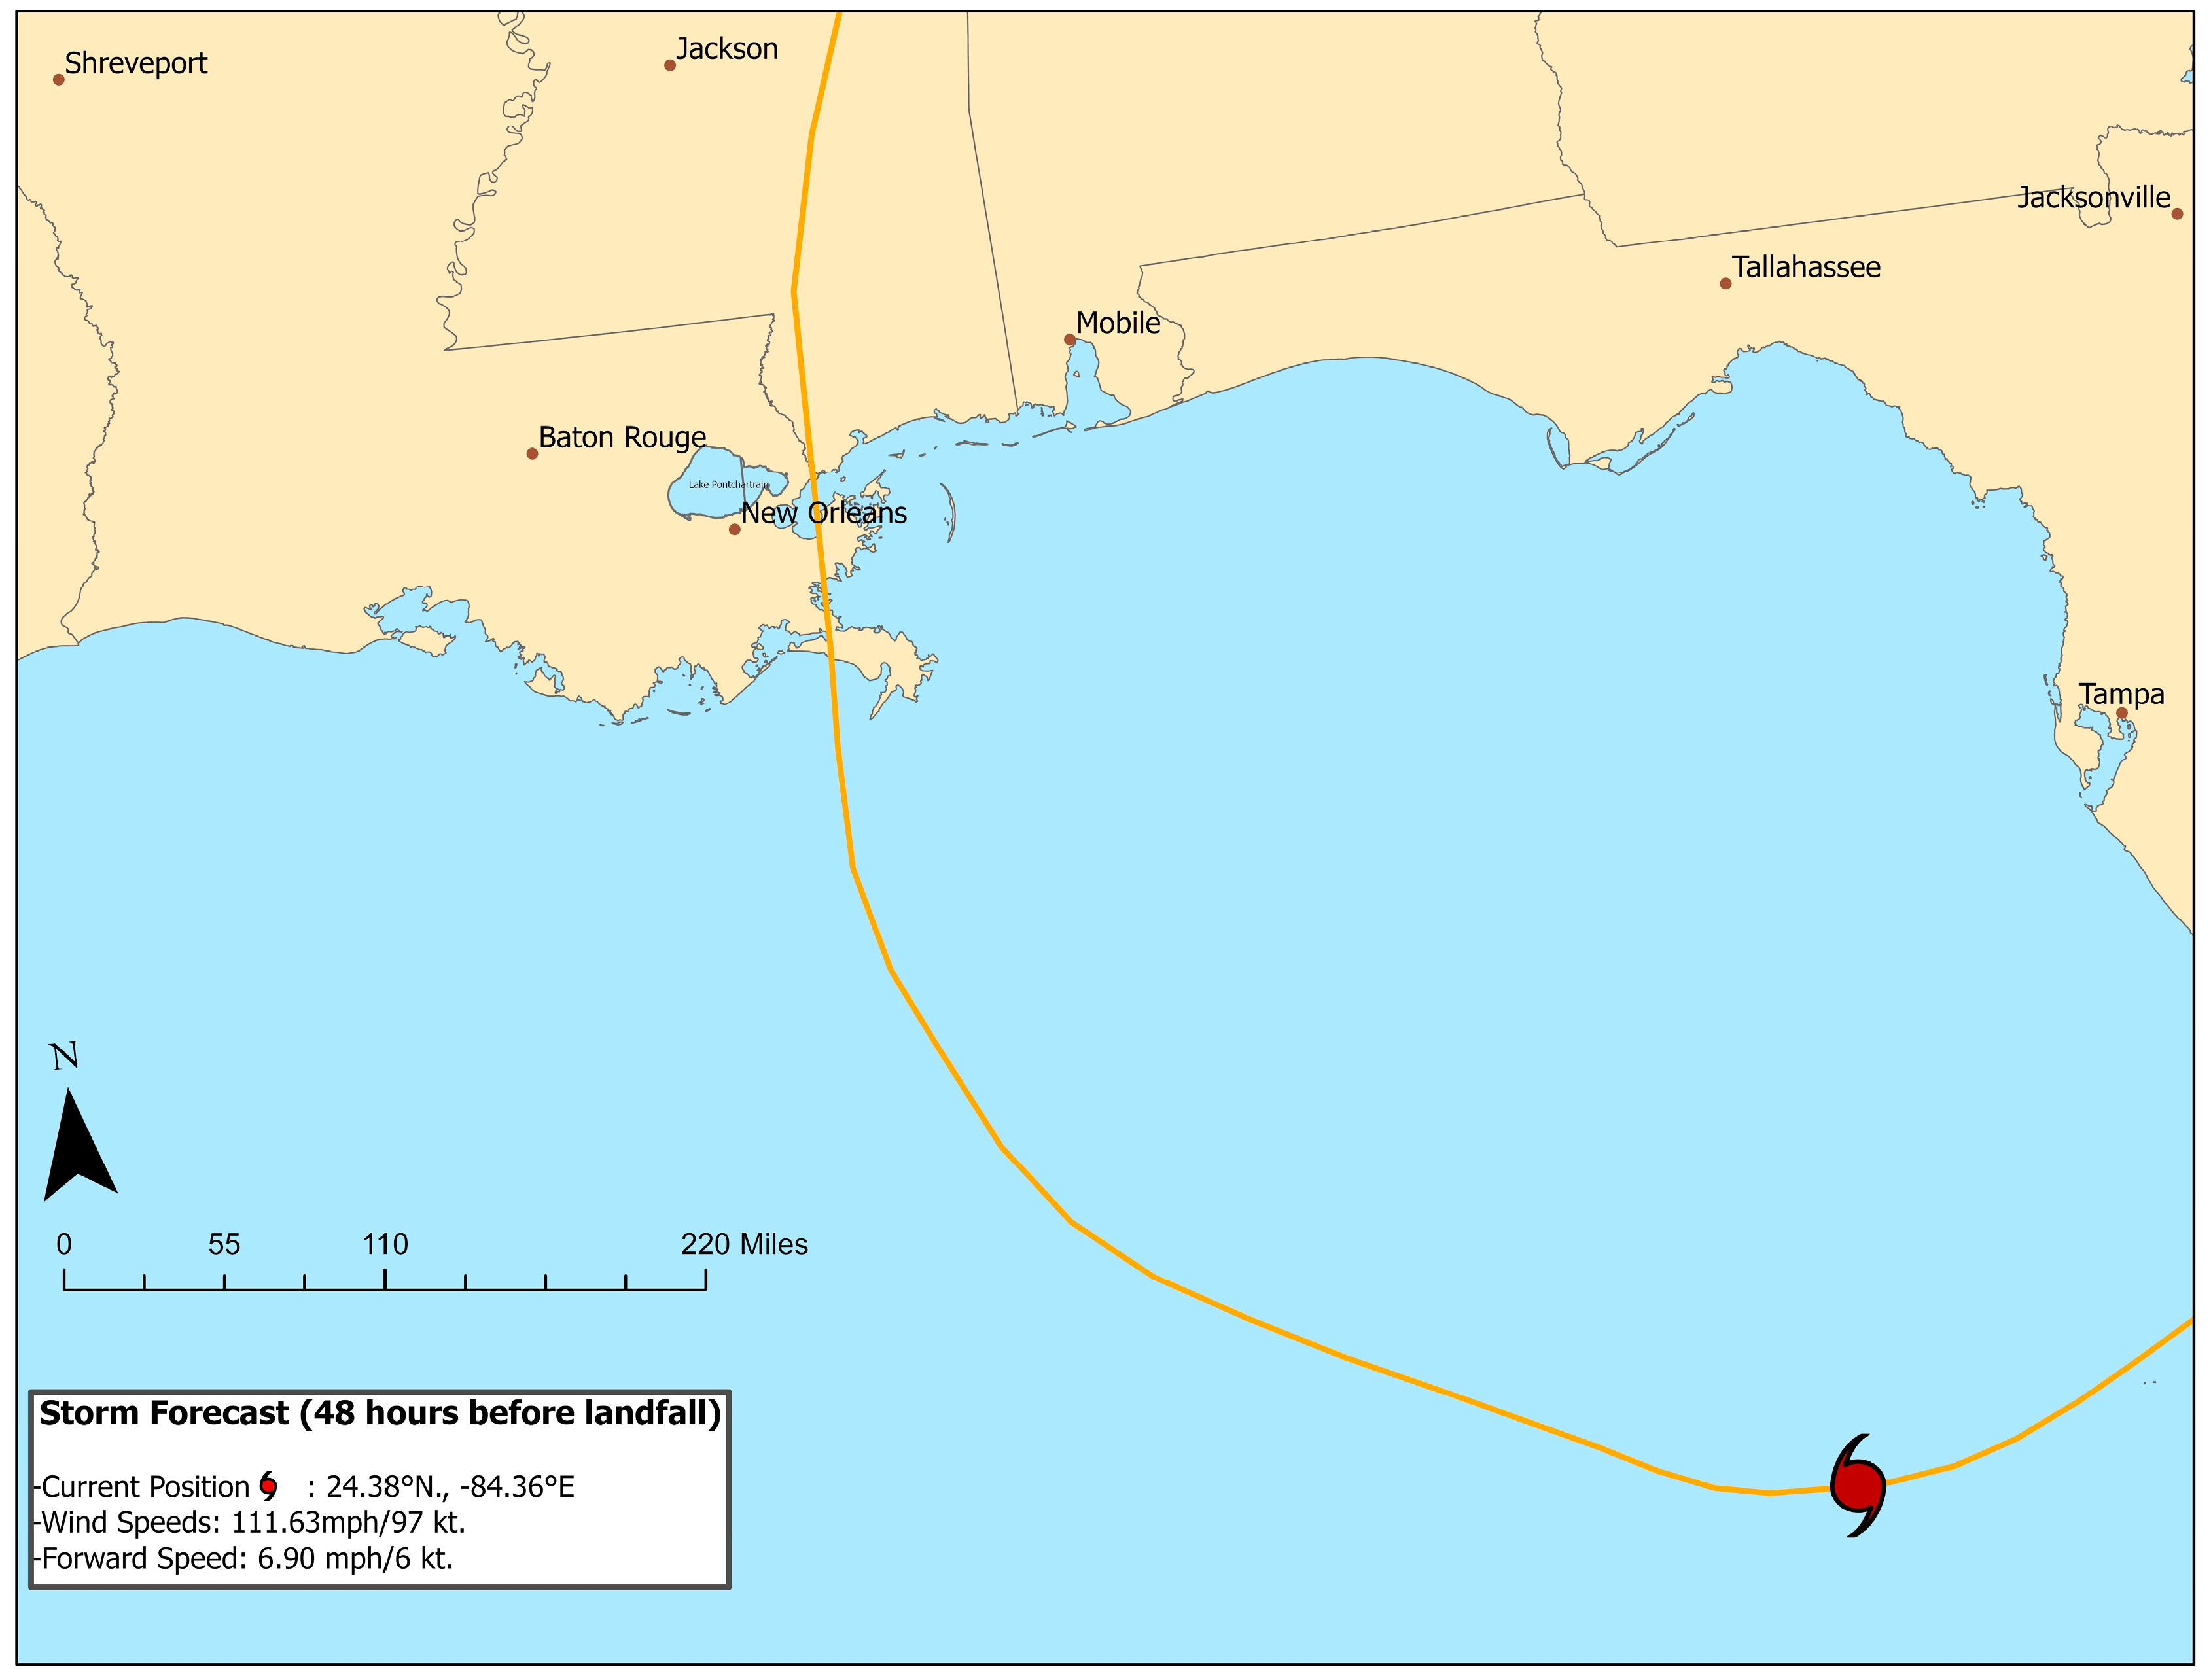
The survey was open from July to September 2021, and it consisted of three parts. A Demographics section was used to collect data on who the participants were, including age, race and/or ethnicity, gender identity, home zip code, and educational attainment. These questions were a blend of open response and multiple-choice lists. The Past Hurricane Experience section asked about previous hurricane experience (what storm? when? where?) and to rate on a Likert scale how familiar they were with the SSHWS. The parts of the survey used for answering the research questions involved questions about storm memory and storm detail recollection. In this third section, participants were shown a series of maps containing eight storms (four used for statistical analysis) in no chronological order. Using an open response format, participants were asked to identify the storm name 48 h prior to landfall based on the track map and the storm details (Figure 1). A lead time of 48 h is common for issuing the first set of evacuation orders from larger metropolitan areas, so 48 h was selected as the time at which participants possibly were discussing their evacuation decisions. Follow-up questions asked about maximum reported rainfall, maximum storm surge, and maximum wind speeds at landfall. These questions were in multiple choice format (Table 1). Only those participants who correctly named the storm had answers eligible for assessing the accuracy of remembering storm details.
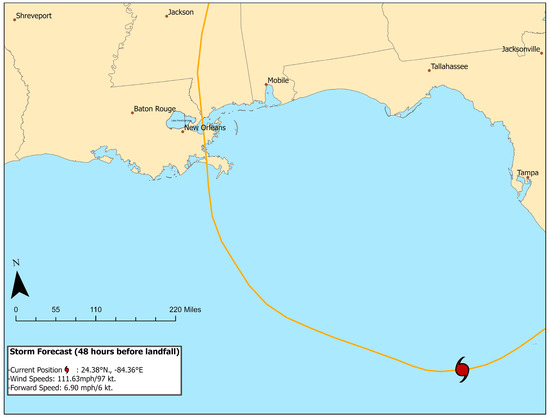
Figure 1.
Example of Hurricane Katrina. Participants were asked to name the storm by viewing its track and characteristics 48 h prior to landfall.

Table 1.
Response categories for selecting wind, rainfall, or storm surge. Only storms that were correctly identified were used for analysis for the hazards in Table 1.
A sample of weather-interested Gulf Coast residents was desired because of their assumed greater diligence in paying attention to forecast details and interest in hurricane characteristics when compared to people who are not interested in the weather. The Gulf Coast was chosen since it was a more active coastline and region for major hurricane landfalls compared to the East Coast of the U.S. A region with numerous hurricane landfalls was targeted to determine if people could correctly identify distinct storm tracks and their geophysical characteristics.
Broadcast meteorologists at ten television markets across the Gulf of Mexico were solicited about survey distribution. The three broadcast meteorologists who chose to participate by sharing the survey on their social media platforms were located in New Orleans, LA, Mobile, AL, and Fort Myers, FL. All participants were required to read an informed consent document, which stated the estimated length of time and nature of the survey activities before agreeing to participate. There was no compensation.
Of the ten participants from Fort Myers, FL, zip codes, none attempted any of the storm identification questions, and there were five negative comments about the length and purpose of the survey after stopping at the first storm identification question. Likewise, of the nine participants with zip codes from the New Orleans metropolitan area, only one attempted the first storm identification question and then stopped the survey. A high number of complete responses were generated from the social media followers of a prominent Mobile, AL, broadcast meteorologist, who is now retired. This limited the original research plans and restricted the analysis with data from only the region surrounding Mobile, AL. Thus, the four storms that made landfall closest to the centroid location of our participants were used for analysis. Initially, eight storms were intended for use, and broadcasters were contacted across cities from Texas to Florida, but there were not enough correctly identified storms away from the Northern Gulf Coast for additional analysis. If a hurricane never threatened or impacted a region, then it was rarely identified correctly.
The questions were designed within Qualtrics, which has been used in atmospheric hazards research to collect data from the public regarding their communication preferences or perception of risk. For instance, Billman et al. [23] used the software to assess residents of Sarasota County, Florida, on topics ranging from perceived susceptibility to planning and preparedness pre- and post-Hurricane Irma. The mixed response survey in this research was distributed via the social media accounts of broadcast meteorologists within their respective markets throughout the study area. The advantages of distributing surveys via broadcast meteorology social media are rapid response rates, high response rates, high total numbers of responses, and high cost-effectiveness since it is free. Qualtrics, with or without broadcast meteorology distribution, has been used successfully in recent research [24,25,26].
There are limitations to data collection using these methods. The first limitation is the data quality and characteristics of the sample. The sample is not representative of the population of these states. If this project were a study with different objectives, then this limitation would be greater. For this research, a sample was desired that was more weather-interested and knowledgeable about the weather than the general population. Social media followers of broadcast meteorologists often develop parasocial relationships with the broadcaster [27] and therefore often pay closer attention to the weather than the rest of the population. Therefore, it was very likely that this sample knew more about famous hurricanes of the past 20 years than the general population, especially since high-impact weather events are what people tend to remember better than ordinary weather events. This notion was explored by Kanhabua et al. [28], who found that factors such as distance in time and location, as well as the overall impact of an event, influence how well the event is remembered. In the case of hurricanes, impacts would be defined as the physical storm hazards (wind, surge, rain, flooding, and falling trees), fatalities, and overall damage.
Other minor limitations involved accessibility. The study was distributed via electronic methods, so there was likely bias toward those who had access to smartphones, mobile devices, or internet connections. In addition, the pool of survey participants had a higher mean income level than the U.S. national median. This statistic reflects the finding from one study that showed that those from higher-income households were more likely to use social media [29].
2.2. Storm Selection and Storm Background
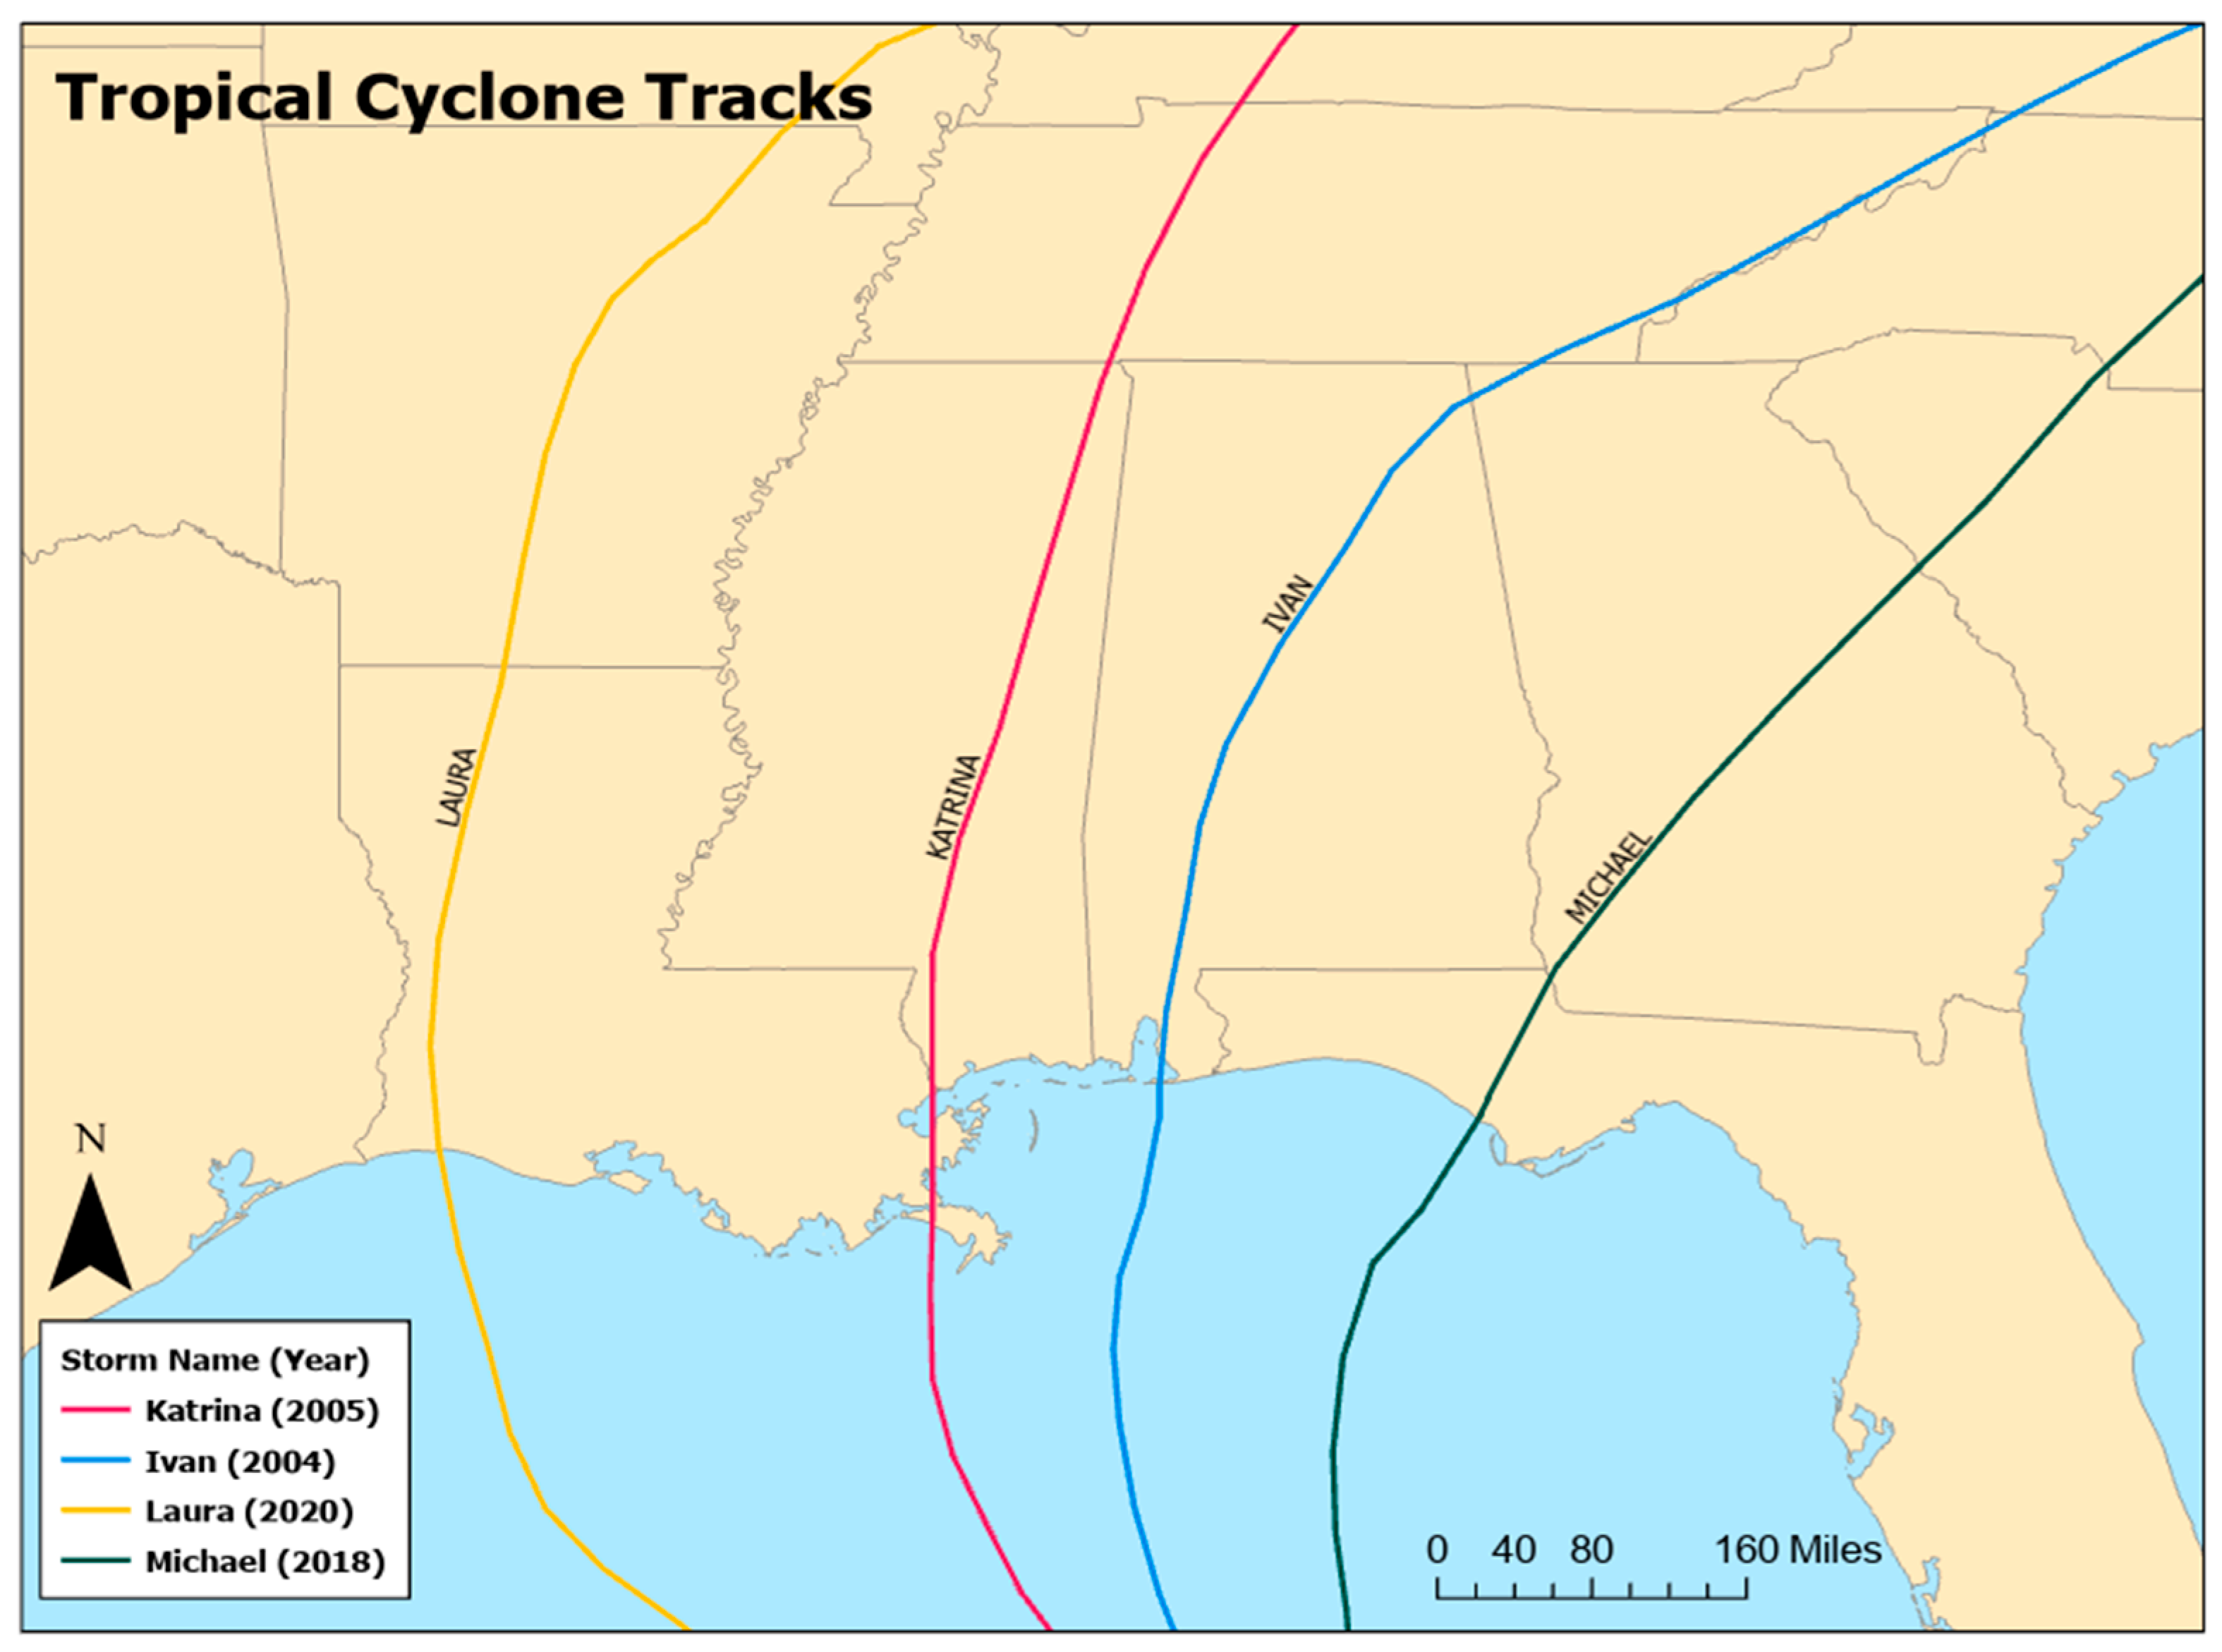
This study utilized four different tropical cyclones that occurred in the years 2004–2020, (Figure 2). Storms were chosen based on the assumption of familiarity to the general public aged 19 and above. All storms chosen were classified as at least a Category 3 major hurricane on the SSHWS at landfall. Major hurricanes were chosen because they have a wider spatial footprint when people search for information about those storms prior to landfall compared to weaker hurricanes [21]. Thus, major hurricanes are thought to have a wider memory footprint, but that has not been researched. Minor hurricanes can sometimes have catastrophic rainfall and produce more damage than major hurricanes. The four storms used represented two older storms from 2004 and 2005 and two more recent storms from 2018 and 2020 (Figure 2).
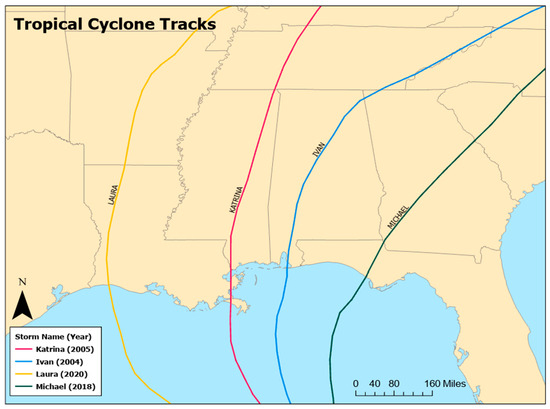
Figure 2.
The best tracks of the four major (SSHWS Category 3 or higher) hurricanes used in this research.
Hurricane Ivan was (at peak intensity) a Category 5 hurricane that occurred in September 2004. Notably, the storm intensified within a matter of days after forming. By the time it made landfall in the U.S. along the Alabama coast, it had weakened to a Category 3 hurricane with a pressure of 946 mb at landfall and maximum sustained winds of 121 mph (54.1 m/s) [30]. There were no official weather stations in the narrow zone of highest winds near the coastal AL/FL border. Storm surge was recorded as 10–15 feet (3.05–4.57 m) along much of the Gulf Coast (Mobile Bay, Alabama, to Florida Panhandle) with localized examples of 14+ feet from open water storm surge. A surge of 18 feet with some wave runup was found southwest of Pensacola near Perdido Key where the strongest winds were located. High water marks of over 16 feet were found at the top of Pensacola Bay from estuarine surge. Rainfall estimates place a maximum amount of over 15 inches (38.1 cm) east of the point of landfall in Pensacola. Its impacts were felt over a widespread area, encompassing Mississippi and the Florida Panhandle. Nearly 100 deaths occurred from Hurricane Ivan (2004) in the United States, the Caribbean, and Venezuela. The storm was estimated to have caused nearly USD 19 billion due to disrupted operations, property damage, insurance losses, beach erosion, and power losses [30].
Hurricane Katrina was a Category 3 hurricane which made landfall on the Louisiana coast near Plaquemines Parish in August 2005 [31]. Wind speeds were reported to be approximately 125 mph (56 m/s) with a pressure of 920 mb. At landfall in Louisiana, over 10 inches (25.4 cm) of rain were reported. Katrina (2005) made its last landfall close to the mouth of Pearl River on the border of Louisiana and Mississippi with a slightly lower intensity than the previous landfall. Storm surge was reported to be up to 28 feet (8.5 m) in some instances, which caused significant damage to property, especially in Louisiana and Mississippi [32]. Katrina (2005) was responsible for 1,833 fatalities [33].
Hurricane Michael occurred in October 2018 when it made landfall at Tyndall Air Force Base near Panama City, Florida, as a Category 5 hurricane. Following landfall, Michael (2018) maintained a powerful intensity as it moved inland. At landfall, the storm had an estimated 160 mph (72 m/s) wind speed. Storm surge was estimated to be approximately 14.7 feet (4.48 m) near Mexico Beach, FL. Rainfall estimates were approximately 12 inches (30.5 cm). Hurricane Michael (2018) was directly responsible for 16 deaths. In total, the storm caused approximately USD 25 billion in damages, some of which was loss of agriculture and timber, although the majority was due to property damage [34].
Hurricane Laura’s lifecycle lasted from 20 to 29 August 2020. On August 27th, it made landfall near Cameron, Louisiana, at a Category 4 intensity. According to the National Hurricane Center, Laura (2020) was the strongest hurricane to affect Louisiana since Camille (which made landfall in Mississippi but caused widespread impacts in neighboring states) in 1969 [35]. The storm had an estimated 150 mph (67 m/s) maximum wind speed [35]. Up to 18 feet (5.48 m) of storm surge and approximately 12 inches (30.5 cm) of rainfall was reported near landfall. In the United States and the Caribbean, 47 deaths were reported as a direct result of Hurricane Laura (2020) [35].
2.3. Statistical Analysis
2.3.1. Storm Track
Participants were tested to see if they could accurately recall the name of a major hurricane 48 h before landfall. Details about the storm were its track, its location, distance from landfall on the specified track, storm forward speed, and current (48 h) maximum sustained wind speed. The National Oceanic and Atmospheric Administration (NOAA) provides data through its National Center for Environmental Information (NCEI) for historical hurricane tracks. Hurricane track shapefiles, which contain point and line spatial units as well as recent and historical data corresponding to each tropical cyclone, were obtained from NCEI’s International Best Track Archive for Climate Stewardship [36,37]. Data contained within each IBTrACS file include variables such as latitude and longitude, maximum sustained wind speeds, and distance to landfall at a particular point.
Given the information presented in the map, the participants were provided with an open text box to input their answer as to which storm track and characteristics they believed they were seeing 48 h before landfall. The storms were presented in a randomized order for each participant to not influence survey answers. Participants who were unsure and put two or more answers (even if one was correct, e.g., “Sally? Ivan?”) were disqualified for the sample of answers that were considered correct. Surveys were only considered for analysis if they were marked as “Finished = True” within Qualtrics, meaning that the survey participants pressed the submit button at the end of the survey. This does not mean that the participants answered every question for every storm.
A chi-square contingency test was performed to see if the participants were able to remember the storm name given a map showing the track. While participants were encouraged to answer to their best ability, answers that were left blank or incorrect were given a score of Wrong, Unsure, or N/A. Wrong meant that they put a wrong answer (e.g., answering Katrina when the correct storm was Michael), Unsure meant that they answered the question but held low confidence in their answer (e.g., “I don’t know” or “I can’t tell if this is Sally or Ivan”), and N/A meant that the participant left the answer blank. For the purposes of this research, these three examples were all considered as incorrect answers.
2.3.2. Storm Hazards
Four storms were used for statistical analysis—Ivan (2004), Katrina (2005), Michael (2018), and Laura (2020). Survey participants that correctly named storms by their track were also tested based on their recollection of three hazards from those storms: maximum reported rainfall, maximum storm surge, and maximum wind speeds at landfall in SSHWS categories. For each hazard, participants were given a multiple-choice question containing a continuous range (see Table 1).
Rainfall and storm surge were divided into 5 inch or 5 foot categories for storm surge with a maximum of more than 20 inches (51+ cm) or more than 20 feet (6.1+ m) for both. It is uncommon for tropical cyclones in the USA to drop more than 20 inches of rainfall or have over 20 feet of storm surge. The SSHWS has established categories from 1 to 5, but we opted to stay consistent with rainfall and storm surge and use the miles per hour ranges of the SSHWS categories. In doing this, we hoped to possibly explore their perceived familiarity with the SSHWS with their actual familiarity in future research.
A second chi-square contingency test was performed to see if participants were able to uniformly remember storm details from Ivan, Katrina, Michael, and Laura. For this test, the data from the first test were weighted by the count of those who answered correctly with regard to each storm’s track. Even if participants correctly answered the storm track, they could have right or wrong answers for each individual storm’s hazards.
3. Results and Discussion
3.1. Sample Characteristics
In total, there were 731 recorded survey attempts. Alabama and Mississippi participants combined for 604/731 attempts. As stated earlier, due to the low sample size from the states included in the initial study area, only responses from those living in Alabama or Mississippi were included for final analysis. A total of 81 attempts were from FL, GA, LA, and TX. There were 46 attempts that were stopped early before providing any location information, reducing the usable number to 685. When using the criteria for “Finished = True”, the number of surveys was reduced to 285 complete surveys, with 246 of those having enough data for use in analysis. This produced an attrition rate of 64 percent of the participants who genuinely began the survey, or only 36 percent of the participants provided enough usable data with their zip code and answers for the four storms in the analysis. The mean time for completed surveys was 11.8 min compared to 6.4 for incomplete surveys, with some extreme outliers skewing the incomplete results. Therefore, the median was 3 min compared to the median for complete at 9 min.
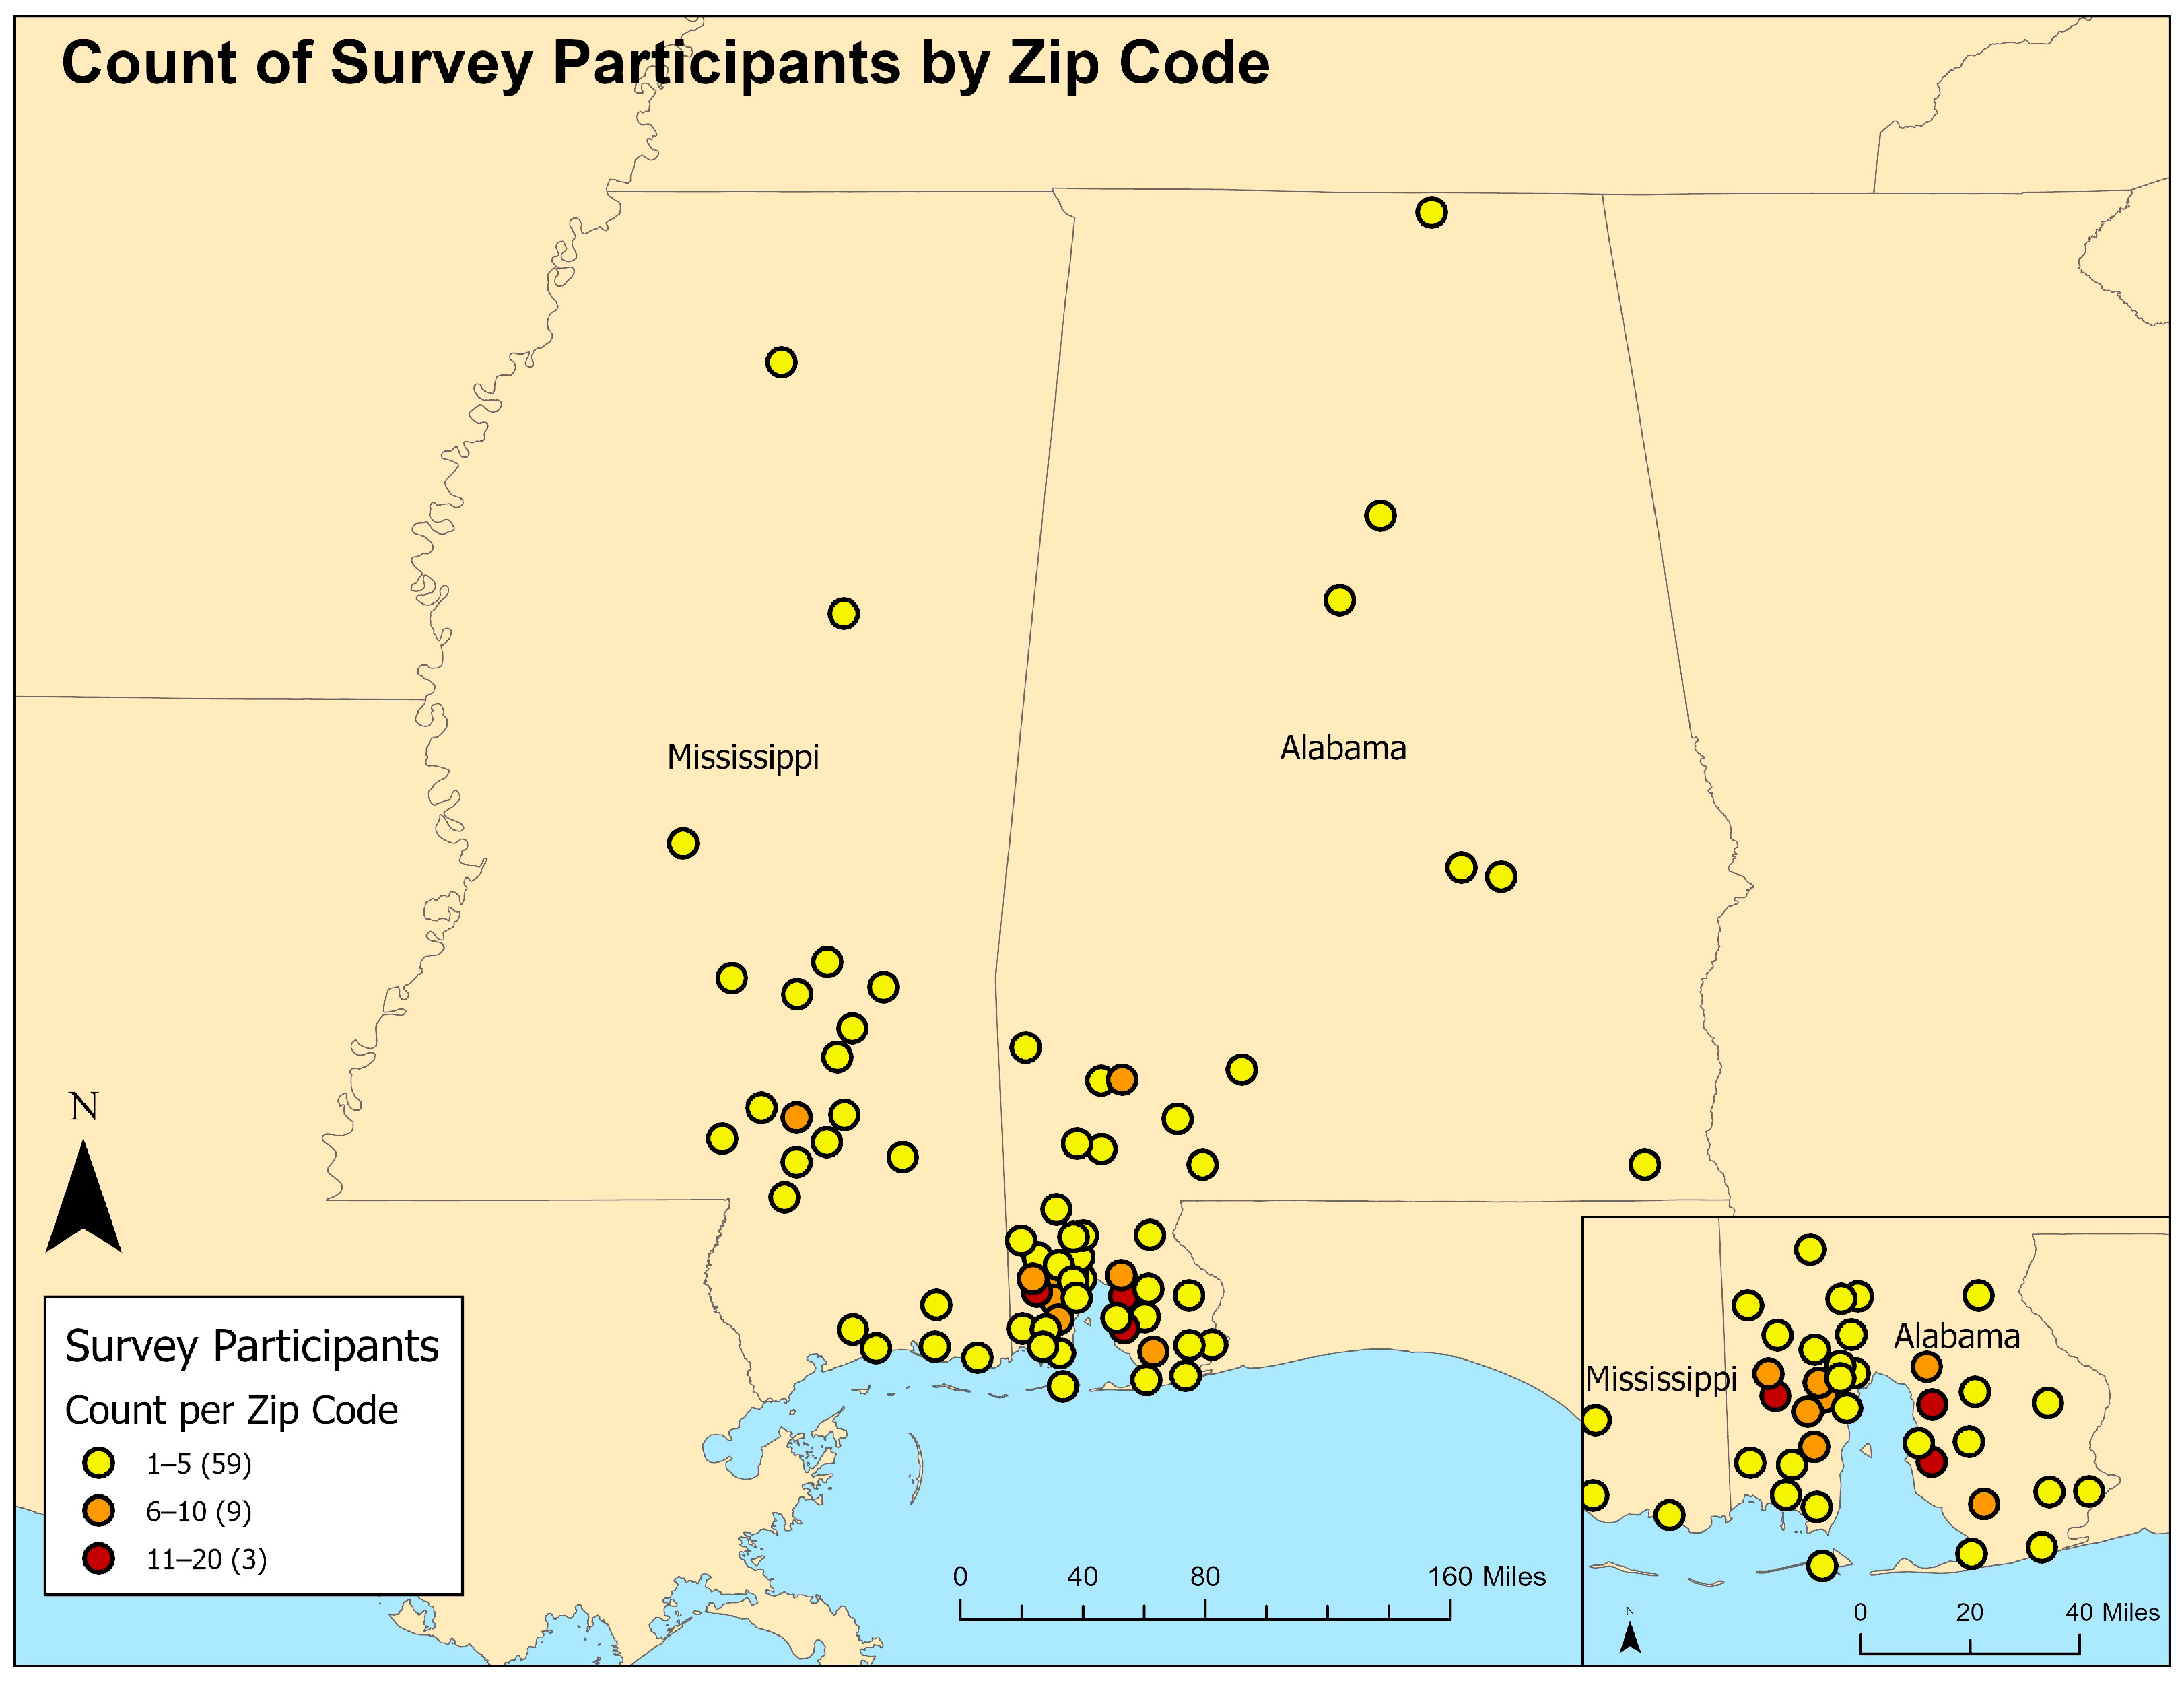
Alabama and Mississippi had 205 and 41 complete participants, respectively, totaling 246 survey responses used for analysis (Figure 3). One participant had an incorrect zip code and therefore could not be included on the map. Two other participants had zip codes that did not exist in the United States. Out of the 246 participants used for analysis, 243 were recorded on the map. A large proportion of participants were located in Mobile and Baldwin County on the Alabama coast. The majority of participants were located towards the Gulf Coast; however, one participant was located as far north as New Market, Alabama.
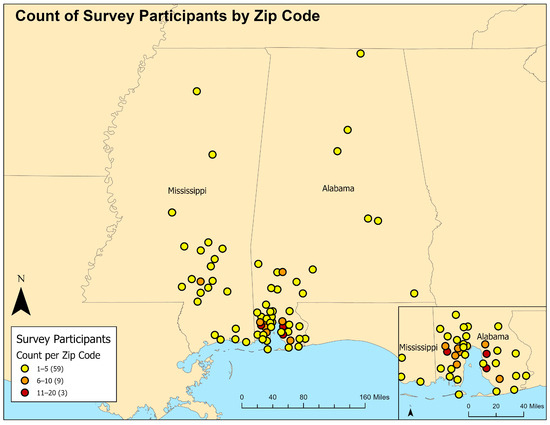
Figure 3.
Count of survey participants per zip code. Each dot represents one zip code.
Of the 246 participants, there was a relatively normal dispersion across the age range groups (Table 2). Notably, the 18–30 age demographic comprised only 10% of responses of the web-based survey. The age range 31–35 made up 39% of the survey responses. When it came to gender, the survey demographics were heavily skewed towards females, with 198 (46 male, 1 non-binary, and 1 no gender). In total, 93% of survey participants identified as White, with all other groups having fewer than 10 participants each. Participants were also asked to choose the range that best reflects their household income. The largest proportion of earners comprised those who make over USD 100,000, which is more than the U.S. national median of approximately USD 75,000 [38]. A question regarding educational attainment garnered responses that suggest that the average participant was well educated. The two groups with the most responses are Bachelor’s degree and Graduate degree. The profile of our weather-interested sample is well educated, above average income, mostly white, and mostly female.
Table 2.
Sample participant characteristics.
3.2. Storm Track Memory
A chi-square contingency table test was used to see if participants were able to uniformly remember storm names for all four hurricanes when viewing the individual storm tracks (See Figure 2). The results showed that the storm tracks were not recognized equally (p < 0.001) (Table 3). Hurricanes Katrina (2005) (65%) and Michael (2018) (52%) were recognized at higher percentages, and both storms had higher observed counts than expected counts (see Table 3). Hurricane Katrina (2005) is possibly the most memorable and recognized hurricane in U.S. history due to its destruction, flooding, and media coverage for weeks after the event [21]. Hurricane Michael (2018) is the only SSHWS Category 5 storm to ever make landfall in the Florida Panhandle and one of the few storms to make landfall in that stretch of coastline. This, coupled with its more recent occurrence, most likely made Michael (2018) easier to identify and fresher in memories. Hurricane Ivan (2004) made landfall in coastal Alabama and was mentioned often as a storm that had been personally experienced by participants. Hurricane Sally made landfall in September 2020 at nearly the same location, which caused many participants to answer Sally instead of Ivan. However, the tracks of Ivan (2004) and Sally (2020) were very different in orientation to the coastline, approach angle, and shape. This suggests that the landfall location of the storm and the time since landfall are stronger points of emphasis in memories than the tracks. Hurricane Laura (2020) was poorly recognized. The Louisiana coast has been hit by an anomalous number of storms since 2020, and that made it more difficult to recognize the distinct track of Laura (2020). Many of the 2020 and 2021 Louisiana storms were listed as Laura tracks. Hurricane Rita from 2005 was also a common storm mentioned for the track of Hurricane Laura (2020), and it has a very similar track to Laura. This lends more credence to the idea that landfall locations are remembered but the exact tracks of hurricanes are less important to people and thus forgotten. Hurricane tracks are remembered better if there are fewer other overlapping tracks or landfall points nearby.
Table 3.
Storm track memory chi-square contingency test results (p < 0.001).
Other possible influences on hurricane memory were explored. It was hypothesized that participants with more familiarity of the SSHWS may have better hurricane track memories. Participants were asked to rank their familiarity with the SSHWS into three categories: (1) very familiar (n = 118), (2) mostly familiar (n = 59), and (3) somewhat familiar (n = 69). A Mantel–Haenszel (MH) test was run on the same four storms to control for the influence of SSHWS familiarity to see if it changed the chi-square test results. The MH tests were run in a 2 × 2 format with each storm compared to the others for a total of six tests. Every storm comparison was significant at p < 0.001 with the exception of Michael (2018) against Katrina (2020), p = 0.002. SSHWS familiarity did not change the results. This further supports the finding that storm tracks are not remembered equally even though past hurricanes are used in preparation and evacuation decision-making [22]. Those preparation decisions could be marked by errors if people do not accurately remember track details.
3.3. Geophysical Hazard Memory
Overall, the participants that correctly identified the storm by its track struggled to remember the maximum geophysical storm hazard values for wind, storm surge, and rainfall (Table 4). There were no significant differences in the accuracy of remembering wind versus storm surge or rainfall across all four storms. SSHWS category ranges were used but it was not explicitly stated that each range provided corresponded with an SSHWS category. Participants may have responded more accurately if a Category 1–5 was an answer choice, but we wanted to be consistent with surge and rainfall, which have value ranges and no categories. It was hypothesized that wind would be remembered better since it is the only variable featured on the SSHWS and wind receives the most attention prior to landfall. Therefore, the focus shifted to once again determining if the memory of storm details was equal across all four storms for each geophysical variable. Chi-square tests were also performed on wind, rainfall, and storm surge.
Table 4.
Correct answers and percentage correct for each geophysical hazard. Imperial units were used in the survey and displayed here in this table since SI units are unfamiliar to most U.S. citizens. The actual highest values are listed below each storm. (* indicates high water marks from estuarine surge which affected the city of Pensacola.)
3.3.1. Wind
Storm wind details on the SSHWS were not remembered equally across the four storms (p < 0.001) (see Table 4). Notably, although most participants were able to guess the correct storm track for Hurricane Katrina (2005), only 37 percent of those participants were able to recall the wind speeds at landfall for Hurricane Katrina. Many participants wrongly assumed that the storm was more intense than its SSHWS Category 3 intensity at landfall. A total of 65 percent thought Katrina (2005) was an SSHWS Category 4 or 5 hurricane at landfall. Katrina (2005) was a Category 5 one day prior to weakening as it approached the coastline. People were able to more correctly answer the question regarding wind speeds for Ivan at 58 percent, despite it occurring in 2004. This is possibly explained by the storm making direct landfall within the area where the majority of the participants reside and experienced the eyewall and eye of the hurricane. For Hurricane Michael (2018), more participants answered the wind speed incorrectly at 44 percent, although Michael was an intense Category 5 storm and more recent. Most of the people who answered the question regarding Hurricane Laura (2020) were correct at 70 percent. Although it made landfall in Louisiana, participants were still able to answer that the wind speeds at landfall were those of a Category 4 hurricane. These results are inconsistent, and it is difficult to draw any firm conclusions. It is apparent that people are not familiar with the wind speed ranges of the SSHWS categories, and this is important for future storm communication. If a forecaster says that a future Hurricane X has maximum sustained winds of 120 mph (54 m/s), then it must be referenced as a Category 3 hurricane in the range between 111 and 129 mph (49.6–57.7 m/s). This is especially salient with more intense hurricane landfalls projected for the future [4].
3.3.2. Storm Surge and Rainfall
Similar to the wind results, the maximum storm surge values were not remembered equally across all four storms (p < 0.001). Hurricane Katrina (2005) had one of the most devastating storm surges ever observed with values up to 28 feet (8.5 m), resulting in 65 percent of the participants correctly answering 20+ feet (6.1+ m). Hurricanes Ivan (2004) (29% correct), Michael (2018) (27% correct), and Laura (2020) (39% correct) all displayed elements of randomness with every storm surge category having responses. While storm surge is forecast before landfall and available publicly in supplementary products from The National Hurricane Center, most people are not retaining the final observed values for use in future decision-making. Forecasters and broadcast meteorologists need to clearly communicate the maximum values from notable storms and use these in visual animations such as technology seen on The Weather Channel.
While the results for rainfall were significant (p = 0.002), it was the most difficult variable to remember accurately. The two most recent storms, Laura (2020) (42%) and Michael (2018) (37%), were much higher in accuracy compared to Katrina (2005) (22%) and Ivan (2004) (19%). The National Hurricane Center began to emphasize rainfall and flooding forecasts more in their supplementary material in the years after the historic 2005 hurricane season. This information is now prominently featured alongside wind if people wish to know more about the potential excessive rainfall and flooding. Broadcast meteorologists need to inform the public of maximum rainfall amounts from notable storms and discuss the severity of flooding potential using the examples of past storms so that people have a better idea of what to expect. Social science research should continue exploring the best ways to communicate flood potential.
4. Conclusions
This study asked survey participants if they could accurately recall details from past major hurricanes in the Gulf of Mexico, including the track of a specific storm as well as storm hazards: maximum rainfall, maximum storm surge, and maximum wind speeds. The sample of participants were recruited from the social media followers of prominent broadcast meteorologists. Thus, the weather-interested sample was hypothesized to perform better than a similar sized sample of the public since our sample closely followed daily weather.
Participants were able to identify Hurricanes Katrina (2005) and Michael (2018) at 65 and 52 percent but struggled with Hurricanes Ivan (2004) and Laura (2020). Hurricane tracks are remembered better if there are fewer other overlapping tracks or landfall points from other storms nearby. It appears that landfall locations are remembered but the exact tracks of hurricanes are less important to people and thus forgotten. SSHWS familiarity was not a significant factor in better memory of storm tracks. Preliminary evaluations of distance from landfall also did not yield consistent results on storm track memory, but this is an idea to explore in future research.
The participants who correctly identified storms by track struggled to remember the maximum hazard values for wind, storm surge, and rainfall. There were no significant differences in the accuracy of remembering wind versus storm surge or rainfall across all four storms. Wind speed was not remembered equally across the four storms, and results were inconsistent or insignificant regarding time and distance from landfall. This weather-interested sample of participants was less familiar with wind speed ranges of the SSHWS categories than they thought. Forecasters and broadcast meteorologists need to emphasize the SSHWS categories of past storms at landfall and those wind speed ranges when communicating about approaching hurricanes.
Maximum storm surge values were not remembered equally across all four storms. Most people are not retaining the final observed values of storm surge for use in future decision-making. Forecasters and broadcast meteorologists need to clearly communicate the maximum values from notable storms and use these in visual animations, such as technology seen on The Weather Channel. Rainfall was the most difficult variable to remember accurately. Broadcast meteorologists need to inform the public of maximum rainfall amounts from notable storms and discuss the severity of flooding potential using the examples of past storms so that people have a better idea of what to expect.
Why does it matter? Why does accurate memory matter for having a hurricane-ready nation? People use benchmark storms in their area when they are making their preparation and evacuation decisions. If their perception of a benchmark storm is wrong, then their preparation and decision-making are flawed from the start. Therefore, the National Hurricane Center, National Weather Service, and other members of the weather enterprise need to clearly communicate the area’s benchmark storm in their warning language and local statements with the correct values for wind, storm surge, and rainfall so that memories are refreshed with accuracy to enhance perception and enable better preparation and decision-making.
The pre-landfall window is a time of constant updates about the hurricane’s current and forecast vital signs on many different media outlets. Vital signs are the storm’s characteristics (track, wind speed, surge, rainfall, and SSHWS category) and those exact numbers are not remembered well in the long term by the public. More emphasis should be placed on the communication of forecast vital signs at and after landfall, allowing for the inclusion of uncertainty. While it is important to clearly communicate and reference the benchmark storm characteristics, the takeaway message should be translated into something less technical and more memorable. Innovative and creative technology and graphics that translate the forecast vital signs into lasting images should continue to develop and evolve in the hope of creating a more accurate hazard memory before the next storm affects that region.
Author Contributions
Conceptualization, K.B. and J.C.S.; Methodology, K.B. and J.C.S.; Formal Analysis, K.B. and J.C.S.; Writing—original draft preparation, K.B.; Writing—review and editing, J.C.S. All authors have read and agreed to the published version of the manuscript.
Funding
This research received no external funding.
Institutional Review Board Statement
The study was conducted in accordance with the Declaration of Helsinki, and approved by the Institutional Review Board of The University of Alabama (IRB# 21-05-4658 06/09/21) for studies involving humans.
Informed Consent Statement
Informed consent was obtained from all subjects involved in the study.
Data Availability Statement
The datasets presented in this article are not readily available due to IRB restrictions. The corresponding author will answer any inquiries about data.
Acknowledgments
The authors wish to thank Alan Sealls, former chief meteorologist at WPMI in Mobile, AL, for his help with survey distribution.
Conflicts of Interest
The authors declare no conflicts of interest.
References
- Kossin, J.P.; Knapp, K.R.; Olander, T.L.; Velden, C.S. Global increase in major tropical cyclone exceedance probability over the past four decades. Proc. Natl. Acad. Sci. USA 2020, 117, 11975–11980. [Google Scholar] [CrossRef] [PubMed]
- Dinan, T. Projected Increases in Hurricane Damage in the United States: The Role of Climate Change and Coastal Development. Ecol. Econ. 2017, 138, 186–198. [Google Scholar] [CrossRef]
- Li, Y.; Tang, Y.; Wang, S.; Toumi, R.; Song, X.; Wang, Q. Recent increases in tropical cyclone rapid intensification events in global offshore regions. Nat. Commun. 2023, 14, 5167. [Google Scholar] [CrossRef]
- Trepanier, J.C. North Atlantic Hurricane Winds in Warmer than Normal Seas. Atmosphere 2020, 11, 293. [Google Scholar] [CrossRef]
- Gori, A.; Lin, N. Projecting Compound Flood Hazard Under Climate Change With Physical Models and Joint Probability Methods. Earth’s Future 2022, 10, e2022EF003097. [Google Scholar] [CrossRef]
- Balaguru, K.; Judi, D.R.; Leung, L.R. Future hurricane storm surge risk for the U.S. gulf and Florida coasts based on projections of thermodynamic potential intensity. Clim. Chang. 2016, 138, 99–110. [Google Scholar] [CrossRef]
- Meyer, R.J.; Baker, J.; Broad, K.; Czajkowski, J.; Orlove, B. The Dynamics of Hurricane Risk Perception: Real-Time Evidence from the 2012 Atlantic Hurricane Season. Bull. Am. Meteorol. Soc. 2014, 95, 1389–1404. [Google Scholar] [CrossRef]
- Senkbeil, J.; Collins, J.; Reed, J. Evacuee Perception of Geophysical Hazards for Hurricane Irma. Weather Clim. Soc. 2019, 11, 217–227. [Google Scholar] [CrossRef]
- Senkbeil, J.C.; Myers, L.; Jasko, S.; Reed, J.R.; Mueller, R. Communication and Hazard Perception Lessons from Category Five Hurricane Michael. Atmosphere 2020, 11, 804. [Google Scholar] [CrossRef]
- Matyas, C.; Srinivasan, S.; Cahyanto, I.; Thapa, B.; Pennington-Gray, L.; Villegas, J. Risk perception and evacuation decisions of Florida tourists under hurricane threats: A stated preference analysis. Nat. Hazards 2011, 59, 871–890. [Google Scholar] [CrossRef]
- Hyatt, D.; Riley, K.; Sederstrom, N. Recall of Television Weather Reports. Journal. Q. 1978, 55, 306–310. [Google Scholar] [CrossRef]
- Gallo, H.B.; Hargis, M.B.; Castel, A.D. Memory for Weather Information in Younger and Older Adults: Tests of Verbatim and Gist Memory. Exp. Aging Res. 2019, 45, 252–265. [Google Scholar] [CrossRef] [PubMed]
- Reed, J.R.; Senkbeil, J.C. The Disconnect in Extended the Forecast Graphic: A Survey of Broadcast Meteorologists and their Public. Bull. Am. Meteorol. Soc. 2020, 101, 289–293. [Google Scholar] [CrossRef]
- Colten, C.E.; Giancarlo, A. Losing Resilience on the Gulf Coast: Hurricanes and Social Memory. Environment 2011, 53, 6–19. [Google Scholar]
- Senkbeil, J.C.; Sheridan, S.C. A Postlandfall Hurricane Classification System for the United States. J. Coast. Res. 2006, 225, 1025–1034. [Google Scholar] [CrossRef]
- Senkbeil, J.C.; Brommer, D.M.; Comstock, I.J. Tropical Cyclone Hazards in the USA. Geogr. Compass 2011, 5, 544–563. [Google Scholar] [CrossRef]
- Demnitz, R.; Joslyn, S. The Effects of Recency and Numerical Uncertainty Estimates on Overcautiousness. Weather Clim. Soc. 2020, 12, 309–322. [Google Scholar] [CrossRef]
- Bauer, P.J.; Stark, E.N.; Ackil, J.K.; Larkina, M.; Merrill, N.; Fivush, R. The recollective qualities of adolescents’ and adults’ narratives about a long-ago tornado. Memory 2016, 25, 412–424. [Google Scholar] [CrossRef]
- Charles, S.T.; Mather, M.; Carstensen, L.L. Aging and emotional memory: The forgettable nature of negative images for older adults. J. Exp. Psychol. Gen. 2003, 132, 310–324. [Google Scholar] [CrossRef]
- Nekola, J.C.; White, P.S. The distance decay of similarity in biogeography and ecology. J. Biogeogr. 1999, 26, 867–878. [Google Scholar] [CrossRef]
- Sherman-Morris, K.; Senkbeil, J.; Carver, R. Who’s Googling What? What Internet Searches Reveal about Hurricane Information Seeking. Bull. Am. Meteorol. Soc. 2011, 92, 975–985. [Google Scholar] [CrossRef]
- Demuth, J.L.; Morss, R.E.; Lazo, J.K.; Trumbo, C. The Effects of Past Hurricane Experiences on Evacuation Intentions through Risk Perception and Efficacy Beliefs: A Mediation Analysis. Weather Clim. Soc. 2016, 8, 327–344. [Google Scholar] [CrossRef]
- Billman, M.; Atoba, K.; Thompson, C.; Brody, S. How about Now? Changes in Risk Perception before and after Hurricane Irma. Sustainability 2023, 15, 7680. [Google Scholar] [CrossRef]
- Rickard, L.N.; Schuldt, J.P.; Eosco, G.M.; Scherer, C.W.; Daziano, R.A. The Proof is in the Picture: The Influence of Imagery and Experience in Perceptions of Hurricane Messaging. Weather Clim. Soc. 2017, 9, 471–485. [Google Scholar] [CrossRef]
- Reed, J.R.; Jasko, S.A.; Senkbeil, J.C. Weather Forecast Semiotics: Public Interpretation of Common Weather Icons. Weather Clim. Soc. 2022, 14, 323–335. [Google Scholar] [CrossRef]
- Saunders, M.E.; Senkbeil, J.C. Perceptions of hurricane hazards in the mid-Atlantic region. Meteorol. Appl. 2017, 24, 120–134. [Google Scholar] [CrossRef]
- Sherman-Morris, K. Tornadoes, television and trust—A closer look at the influence of the local weathercaster during severe weather. Environ. Hazards 2005, 6, 201–210. [Google Scholar] [CrossRef]
- Kanhabua, N.; Nguyen, T.N.; Niederée, C. What Triggers Human Remembering of Events? A Large-Scale Analysis of Catalysts for Collective Memory in Wikipedia. In IEEE/ACM Joint Conference on Digital Libraries; IEEE: Piscataway, NJ, USA, 2014; pp. 341–350. [Google Scholar] [CrossRef]
- Perrin, A. Social Media Usage: 2005–2015. Pew Research Center: Internet, Science & Tech. 2015. Available online: https://www.pewresearch.org/internet/2015/10/08/social-networking-usage-2005-2015/ (accessed on 10 April 2024).
- Stewart, S.R. Tropical Cyclone Report—Hurricane Ivan. National Hurricane Center, NOAA, 16 December 2004. Available online: https://www.nhc.noaa.gov/data/tcr/AL092004_Ivan.pdf (accessed on 10 April 2024).
- Johnson, D.L. Service Assessment—Hurricane Katrina August 23–31, 2005. National Weather Service, NOAA, June 2006. Available online: https://www.weather.gov/media/publications/assessments/Katrina.pdf (accessed on 10 April 2024).
- Knabb, R.D.; Rhome, J.R.; Brown, D.P. Tropical Cyclone Report—Hurricane Katrina. National Hurricane Center, NOAA, August 2006. Available online: https://www.nhc.noaa.gov/data/tcr/AL122005_Katrina.pdf (accessed on 10 April 2024).
- Pruitt, S. Hurricane Katrina: 10 Facts About the Deadly Storm and Its Legacy. History.Com, A&E Television Networks, 19 August 2020. Available online: https://www.history.com/news/hurricane-katrina-facts-legacy (accessed on 10 April 2024).
- Beven, J.L.; Berg, R.; Hagen, A. Tropical Cyclone Report—Hurricane Michael. National Hurricane Center, NOAA, 17 May 2019. Available online: https://www.nhc.noaa.gov/data/tcr/AL142018_Michael.pdf (accessed on 10 April 2024).
- Pasch, R.J.; Berg, R.; Roberts, D.P.; Papin, P.P. Tropical Cyclone Report—Hurricane Laura. National Hurricane Center, NOAA, 26 May 2021. Available online: https://www.nhc.noaa.gov/data/tcr/AL132020_Laura.pdf (accessed on 10 April 2024).
- Knapp, K.R.; Kruk, M.C.; Levinson, D.H.; Diamond, H.J.; Neumann, C.J. The International Best Track Archive for Climate Stewardship (IBTrACS): Unifying tropical cyclone best track data. Bull. Am. Meteorol. Soc. 2010, 91, 363–376. [Google Scholar] [CrossRef]
- Knapp, K.R.; Diamond, H.J.; Kossin, J.P.; Kruk, M.C.; Schreck, C.J. 2018: International Best Track Archive for Climate Stewardship (IBTrACS) Project, Version 4. ALL. NOAA National Centers for Environmental Information. Available online: https://www.ncei.noaa.gov/access/metadata/landing-page/bin/iso?id=gov.noaa.ncdc:C01552 (accessed on 2 April 2024).
- Guzman, G.; Melissa, K. Income in the United States: 2022. Census. Gov, United States Census Bureau, 12 September 2023. Available online: https://www.census.gov/library/publications/2023/demo/p60-279.html (accessed on 10 April 2024).
Disclaimer/Publisher’s Note: The statements, opinions and data contained in all publications are solely those of the individual author(s) and contributor(s) and not of MDPI and/or the editor(s). MDPI and/or the editor(s) disclaim responsibility for any injury to people or property resulting from any ideas, methods, instructions or products referred to in the content. |
© 2024 by the authors. Licensee MDPI, Basel, Switzerland. This article is an open access article distributed under the terms and conditions of the Creative Commons Attribution (CC BY) license (https://creativecommons.org/licenses/by/4.0/).