Abstract
This study presents the results of a pilot survey utilizing an innovative DVD-based method to measure outdoor radon and thoron levels. Twenty-six discriminative radon/thoron detectors were deployed across four different territorial zones in Bulgaria. Positioned 1 m above the ground, these detectors were left in place for several months. Notably, the dataset reveals significant variability in measurements, even over short distances, with thoron exhibiting greater variability than radon. Radon levels ranged from 7 ± 1 to 34 ± 3 Bq m−3 (average: 21 Bq m−3), while thoron levels ranged from 13 ± 5 to 307 ± 54 Bq m−3 (average: 170 Bq m−3). A weak but statistically significant correlation (correlation coefficient: 0.559) was observed between radon and thoron levels, which improved significantly when averaged across the four zones. These findings underscore the importance of measuring both radon and thoron in outdoor surveys. High thoron levels can significantly bias radon measurements, particularly when radon concentrations are substantially lower than those of thoron. If further studies confirm the good correlation between area averages, the observed correlation between area-average values could be used to correct average radon levels in large areas (e.g., radon priority areas) for thoron interference when thoron data are missing from the analyzed radon dataset.
1. Introduction
Radon (222Rn) has garnered significant attention in recent decades due to its status as a proven carcinogen [1] and its position as the second leading cause of lung cancer after smoking [2]. Historically, the focus was predominantly on indoor 222Rn because human exposure to 222Rn and its short-lived progeny (218Po, 214Pb, 214Bi, and 214Po, the latter always in radioactive equilibrium with 214Bi) occurs mainly indoors. However, interest in outdoor 222Rn has surged in recent years. Typically, outdoor 222Rn concentrations are much lower than those indoors [3], and their contribution to the overall dose is considered of secondary importance. Nonetheless, outdoor 222Rn levels have been found useful in delineating “radon priority areas” [4,5] according to the European Council Directive [6]. Additionally, atmospheric 222Rn levels might be valuable for studying processes related to climate change [5,7,8,9]. This has prompted new priorities in radon metrology, emphasizing the need for metrological protocols and traceability for radon measurements down to the range of 1–10 Bq m−3 and even less than 1 Bq m−3 if technically possible [10]. Novel methods and techniques have been developed to meet this challenge for both active monitors [11,12] and passive detectors [13,14].
Compared to 222Rn, interest in the isotope thoron (220Rn) is lower due to its perceived lesser radiological significance. Data on 220Rn, both indoors and outdoors, are much scarcer than for 222Rn. Another practical reason for this focus is that most detectors are designed to measure radon (222Rn) only, due to the predominant interest in this isotope. However, there are no commercial radon detectors that are completely free of thoron interference [15,16]. This issue is particularly significant outdoors, where thoron levels can sometimes greatly exceed those of radon, even at heights of 1 m or more above the ground surface [17]. In such cases, especially when 222Rn levels are low (e.g., a few Bq m−3), the results for 222Rn can be strongly biased by thoron interference. Therefore, thoron levels outdoors warrant sufficient attention alongside radon.
Passive detectors for combined radon/thoron discriminative measurements are described in the scientific literature [18]. However, their sensitivity range after six months of exposure is reported to be 5–1000 Bq m−3 for radon and 15–1000 Bq m−3 for thoron [18]. Outdoor radon concentrations can frequently be lower than 5 Bq m−3, necessitating more sensitive methods and techniques for outdoor studies, especially for shorter exposure times.
In 2022, a method and passive detector for combined discriminative radon and thoron measurements with much improved sensitivity were proposed [19]. This method has a detection limit of less than 1 Bq m−3 for radon and about 1.5 Bq m−3 for thoron after three months of exposure. The method employs DVDs (Digital Versatile Disks) as radon/thoron detectors. CDs/DVDs were first used for 222Rn measurements in 2001 [20] and for 220Rn measurements in 2012 [21]. The initial method for 222Rn leveraged the high radon absorption ability and track-etch properties of the polycarbonate material of CDs/DVDs [20]. However, this version lacked sufficient sensitivity for outdoor radon measurements. The 2022 study [19] modified the use of DVDs to provide adequate sensitivity for outdoor studies.
This work presents results from a pilot survey of radon and thoron outdoors using this innovative method. The survey, conducted in 2023, involved detectors exposed at 26 points across four different zones in Bulgaria. The primary aim was to study the concentrations of radon and thoron outdoors, their variability over short (a few meters) and long distances, and to examine potential correlations between radon and thoron levels.
2. Materials and Methods
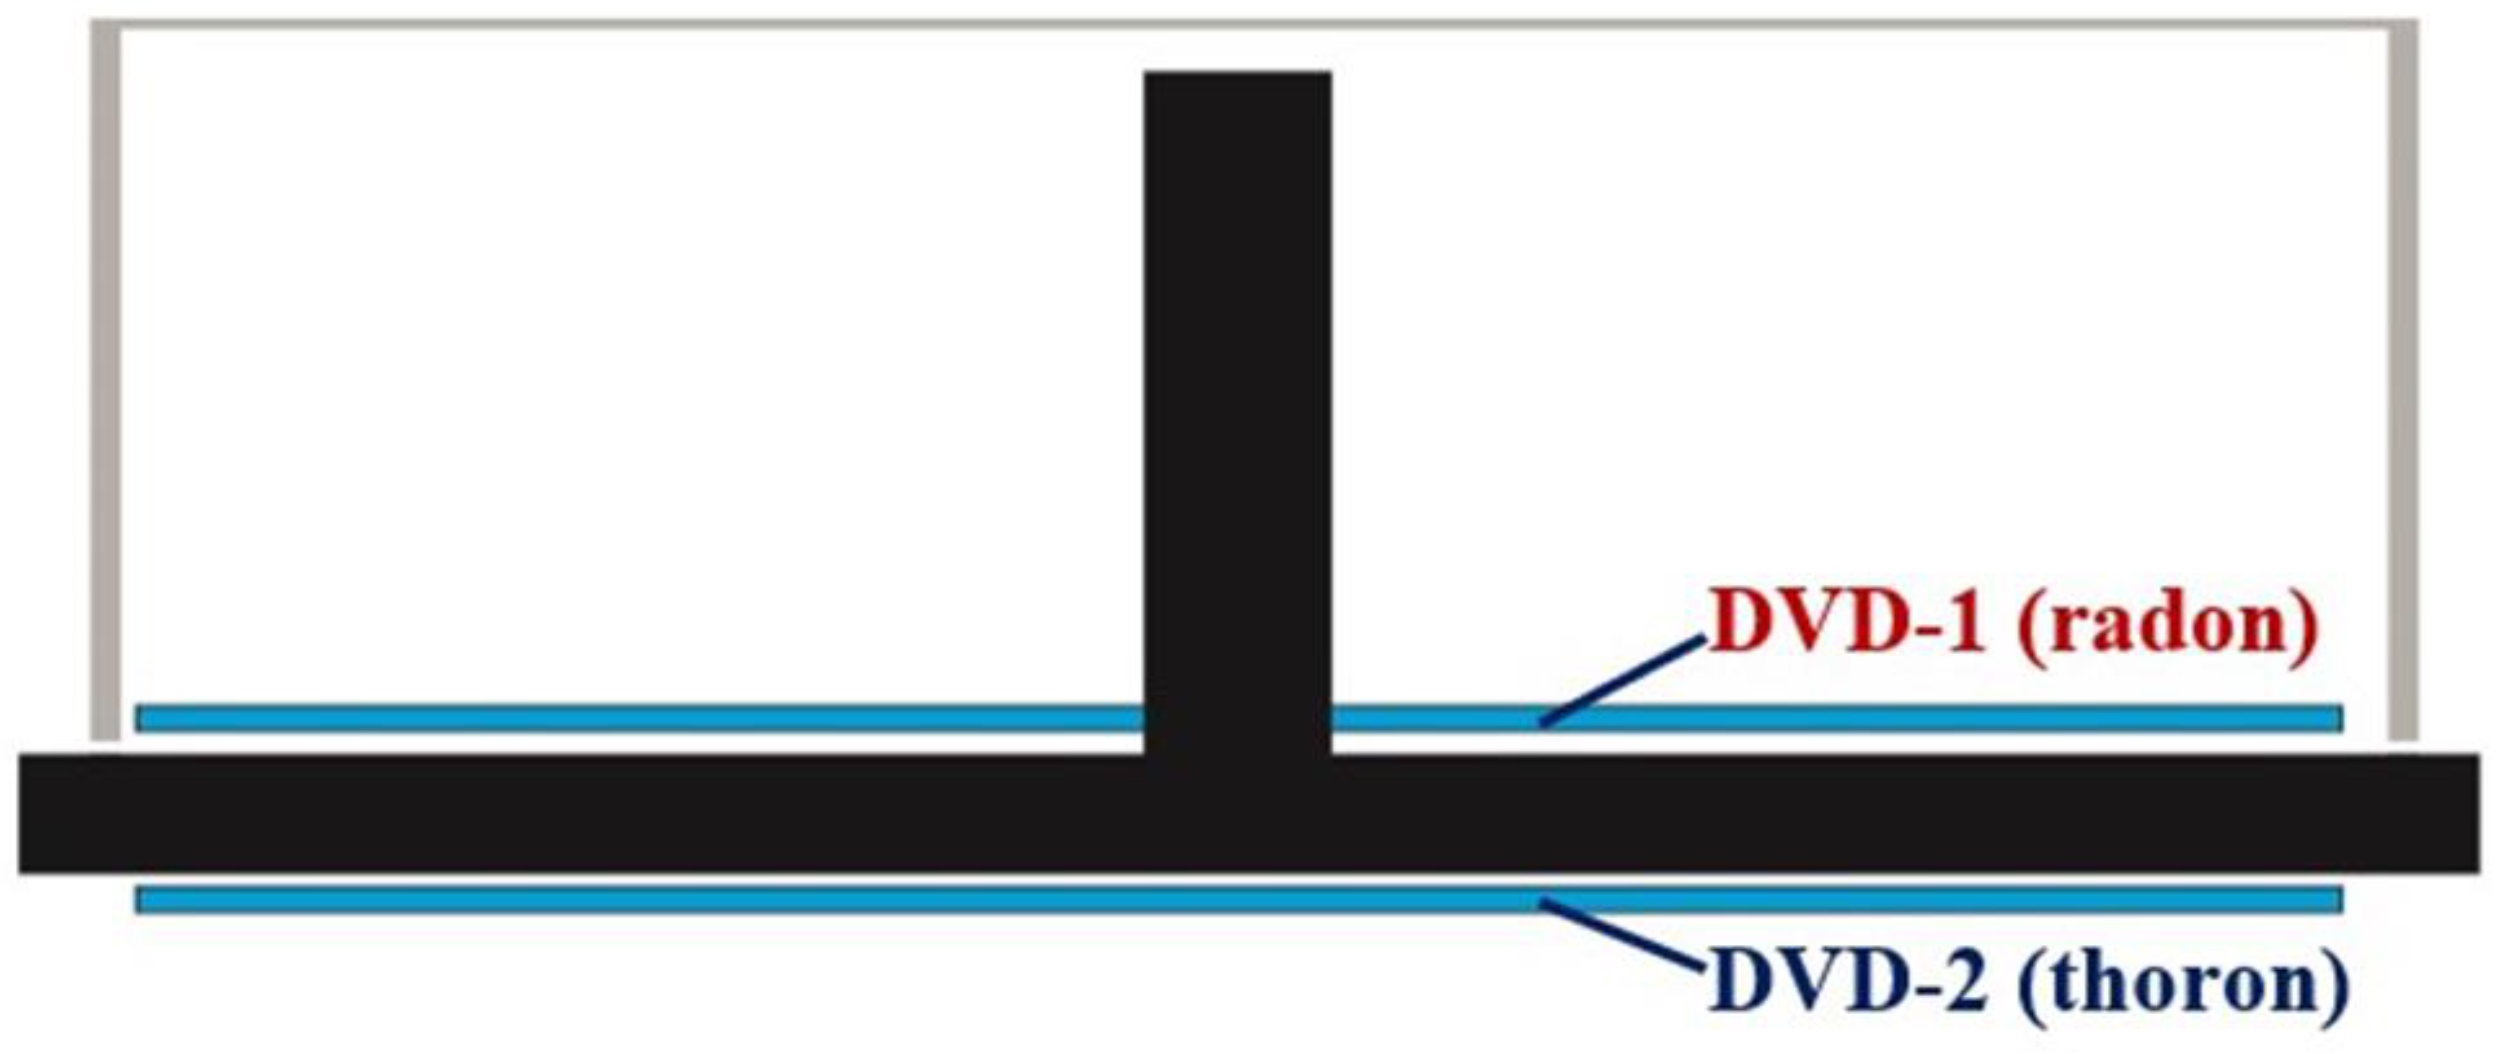
The detector proposed in [19] and used in this research is shown schematically in Figure 1. It employs two DVDs: one placed inside a CD/DVD spindle, and another placed outside, as illustrated in Figure 1. These DVDs serve as large-area, low-background alpha track detectors. Each commercial DVD consists of two thinner disks adhered together, with the front side made of bisphenol-A polycarbonate—a material known for its track-etch properties [22]. After separating the two parts, the polycarbonate half can be used as a large-area track detector. The background track density of the inner surface of this half, after electrochemical etching, is extremely low: down to 1.1 ± 0.3 cm−2 [23], which is an order of magnitude lower than the background of other track detectors. This surface is used as a “sensitive” surface of the DVD track detector.
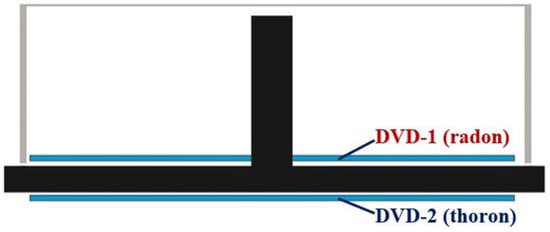
Figure 1.
A scheme of the sensitive passive discriminative radon/thoron detector used in the present survey. The scheme is a simplified derivative of Figure 2 from [19] (copyright license: https://creativecommons.org/licenses/by/4.0/).
The passive monitor uses a spindle designed to hold 25 DVDs (spindle height 4 cm), as shown in Figure 1 and reasoned in [19]. Inside the spindle, one DVD (DVD-1) is fixed on the base with its inner surface facing inward. The spindle acts as a large “radon diffusion chamber,” where radon permeates through small gaps at the junction between the casing and the base. At equilibrium, the radon concentration inside the spindle is almost equal to that in the ambient air, while the thoron concentration is only a few percent of the ambient thoron concentration. Another DVD (DVD-2) is fixed outside the spindle (Figure 1) with its inner surface exposed to the exterior environment.
After exposure, both DVDs undergo electrochemical etching—DVD-1 on the surface and DVD-2 at a depth of 64 µm. As detailed elsewhere [21,24], the signal at this depth is primarily due to thoron and partly to radon absorbed in the polycarbonate material. The 64 µm depth for DVD-2 is achieved through chemical pre-etching using an aqueous solution of 52% KOH (m/v) and 40% methanol (m/v) at 30 °C. Under these conditions, the bulk-etch velocity is about 1 µm/min, allowing the targeted depth to be reached in a reasonable time frame. The electrochemical etching is performed at an effective electric field of 3.0 kV/mm at a frequency of 6 kHz and a temperature of 25 °C. The etching solution is a mixture of ethanol and 6M KOH water solution in a 1:4 volume ratio. The process begins with a 30 min pre-etching in the same solution, followed by the application of an electric field for three hours. The laboratory equipment used for etching includes thermostatic metal plates and a programmable HV/HF generator with a 6 kHz frequency and variable effective voltage up to 4 kV (model ECETD, Mikon K Ltd., Varna, Bulgaria, http://www.mikon.bg, accessed on 23 March 2021).
After etching, the tracks are counted automatically using a computer scanner, as described elsewhere [25], and the signal is determined. The signal in this context is the net track density (i.e., the number of tracks per unit area of the detector after subtracting the background track density). The detector was calibrated by exposure to reference radon and thoron concentrations as described in [19] using the facility described in [26] and a reference radon/thoron monitor (AlphaGUARD PQ2000 PRO Rn Tn) (Saphymo/Bertin Instruments, Frankfurt am Main, Gernany) that is traceable to a primary radon standard and a primary thoron system [27,28].
The data-processing algorithm, which accounts for both radon and thoron contributions to the signals from DVD-1 and DVD-2, is detailed in [19]. Under this design and DVD treatment, DVD-1 is primarily sensitive to 222Rn, while DVD-2 is primarily sensitive to 220Rn. When radon and thoron activity concentrations are equal, the thoron contribution to the DVD-1 signal is 2.3%, and the radon contribution to the DVD-2 signal is 18.2% [19]. The algorithm for calculating the average activity concentrations of 222Rn and 220Rn and their uncertainties, using track densities from DVD-1 and DVD-2 and the background track density, is explained in detail in [19]. This algorithm was used for data processing in the present work. The integrated activity concentration Ii [Bq d m−3] of the corresponding isotope (i = 1, 2 refer to 222Rn and 220Rn, correspondingly) is calculated by the expression:
where nj are the net track densities [cm−2] obtained by DVD-1 and DVD-2, correspondingly, and mij are the elements of the following matrix:
The values of mij are obtained by the calibration procedure described elsewhere [19]. The average activity concentration cAi [Bq m−3] for the exposure time Texp [d] is then calculated as:
The uncertainty budget includes counting statistics, individual variations in the response of different detectors, and the uncertainty in the reference radon/thoron activity concentrations. Since the matrix elements in Equation (2) are correlated, determining the uncertainties in the activity concentrations requires a more detailed procedure for propagating the uncertainties of correlated values, as described in [29]. The procedure and derivation of the corresponding mathematical expressions are fully detailed in [19]. The working formulas to calculate these uncertainties in units of Bq m−3, when Texp is expressed in days, are as follows:
where ni(g) (i = 1, 2) are the corresponding gross track densities in DVD-1 and DVD-2, and nb is the background track density.
Twenty-six radon/thoron detectors constructed in this manner were placed at 26 points across four different zones. Each spindle was fixed on a wooden rod driven into the soil, positioning the spindle 1 m above the ground with DVD-2 facing downward. The four zones were as follows:
Zone A: A district of Sofia, the capital of Bulgaria (2 detectors, 156 days of exposure, from 27 June to 30 November 2023).
Zone B: A town 63 km northeast of Sofia (9 detectors, 122 days of exposure, 29 June–29 October 2023).
Zone C: A town 76 km east of Sofia (7 detectors, 164 days of exposure, 30 June–11 December 2023).
Zone D: A town 17 km northwest of Sofia (8 detectors, 133 days of exposure, 2 July–12 November 2023).
In Zone A, only two detectors were placed 4 m apart. For Zones B, C, and D, an area of 300–500 m2 was selected for each zone. Within these areas, detector points were strategically distributed, with distances ranging from 3 to 50 m. This distribution was designed to investigate whether outdoor radon and thoron levels exhibit significant variations over short distances, as such data are currently lacking in the scientific literature. The examination of short-distance variations is based on our observation that radon levels in soil gas can fluctuate considerably over just a few meters. This is also indirectly supported by the variability seen in indoor radon levels, where concentrations can differ dramatically even between neighboring houses.
Statistical analysis of the dataset, including Pearson’s correlation coefficients and the statistical significance, was performed using the PAST statistical package [30].
3. Results
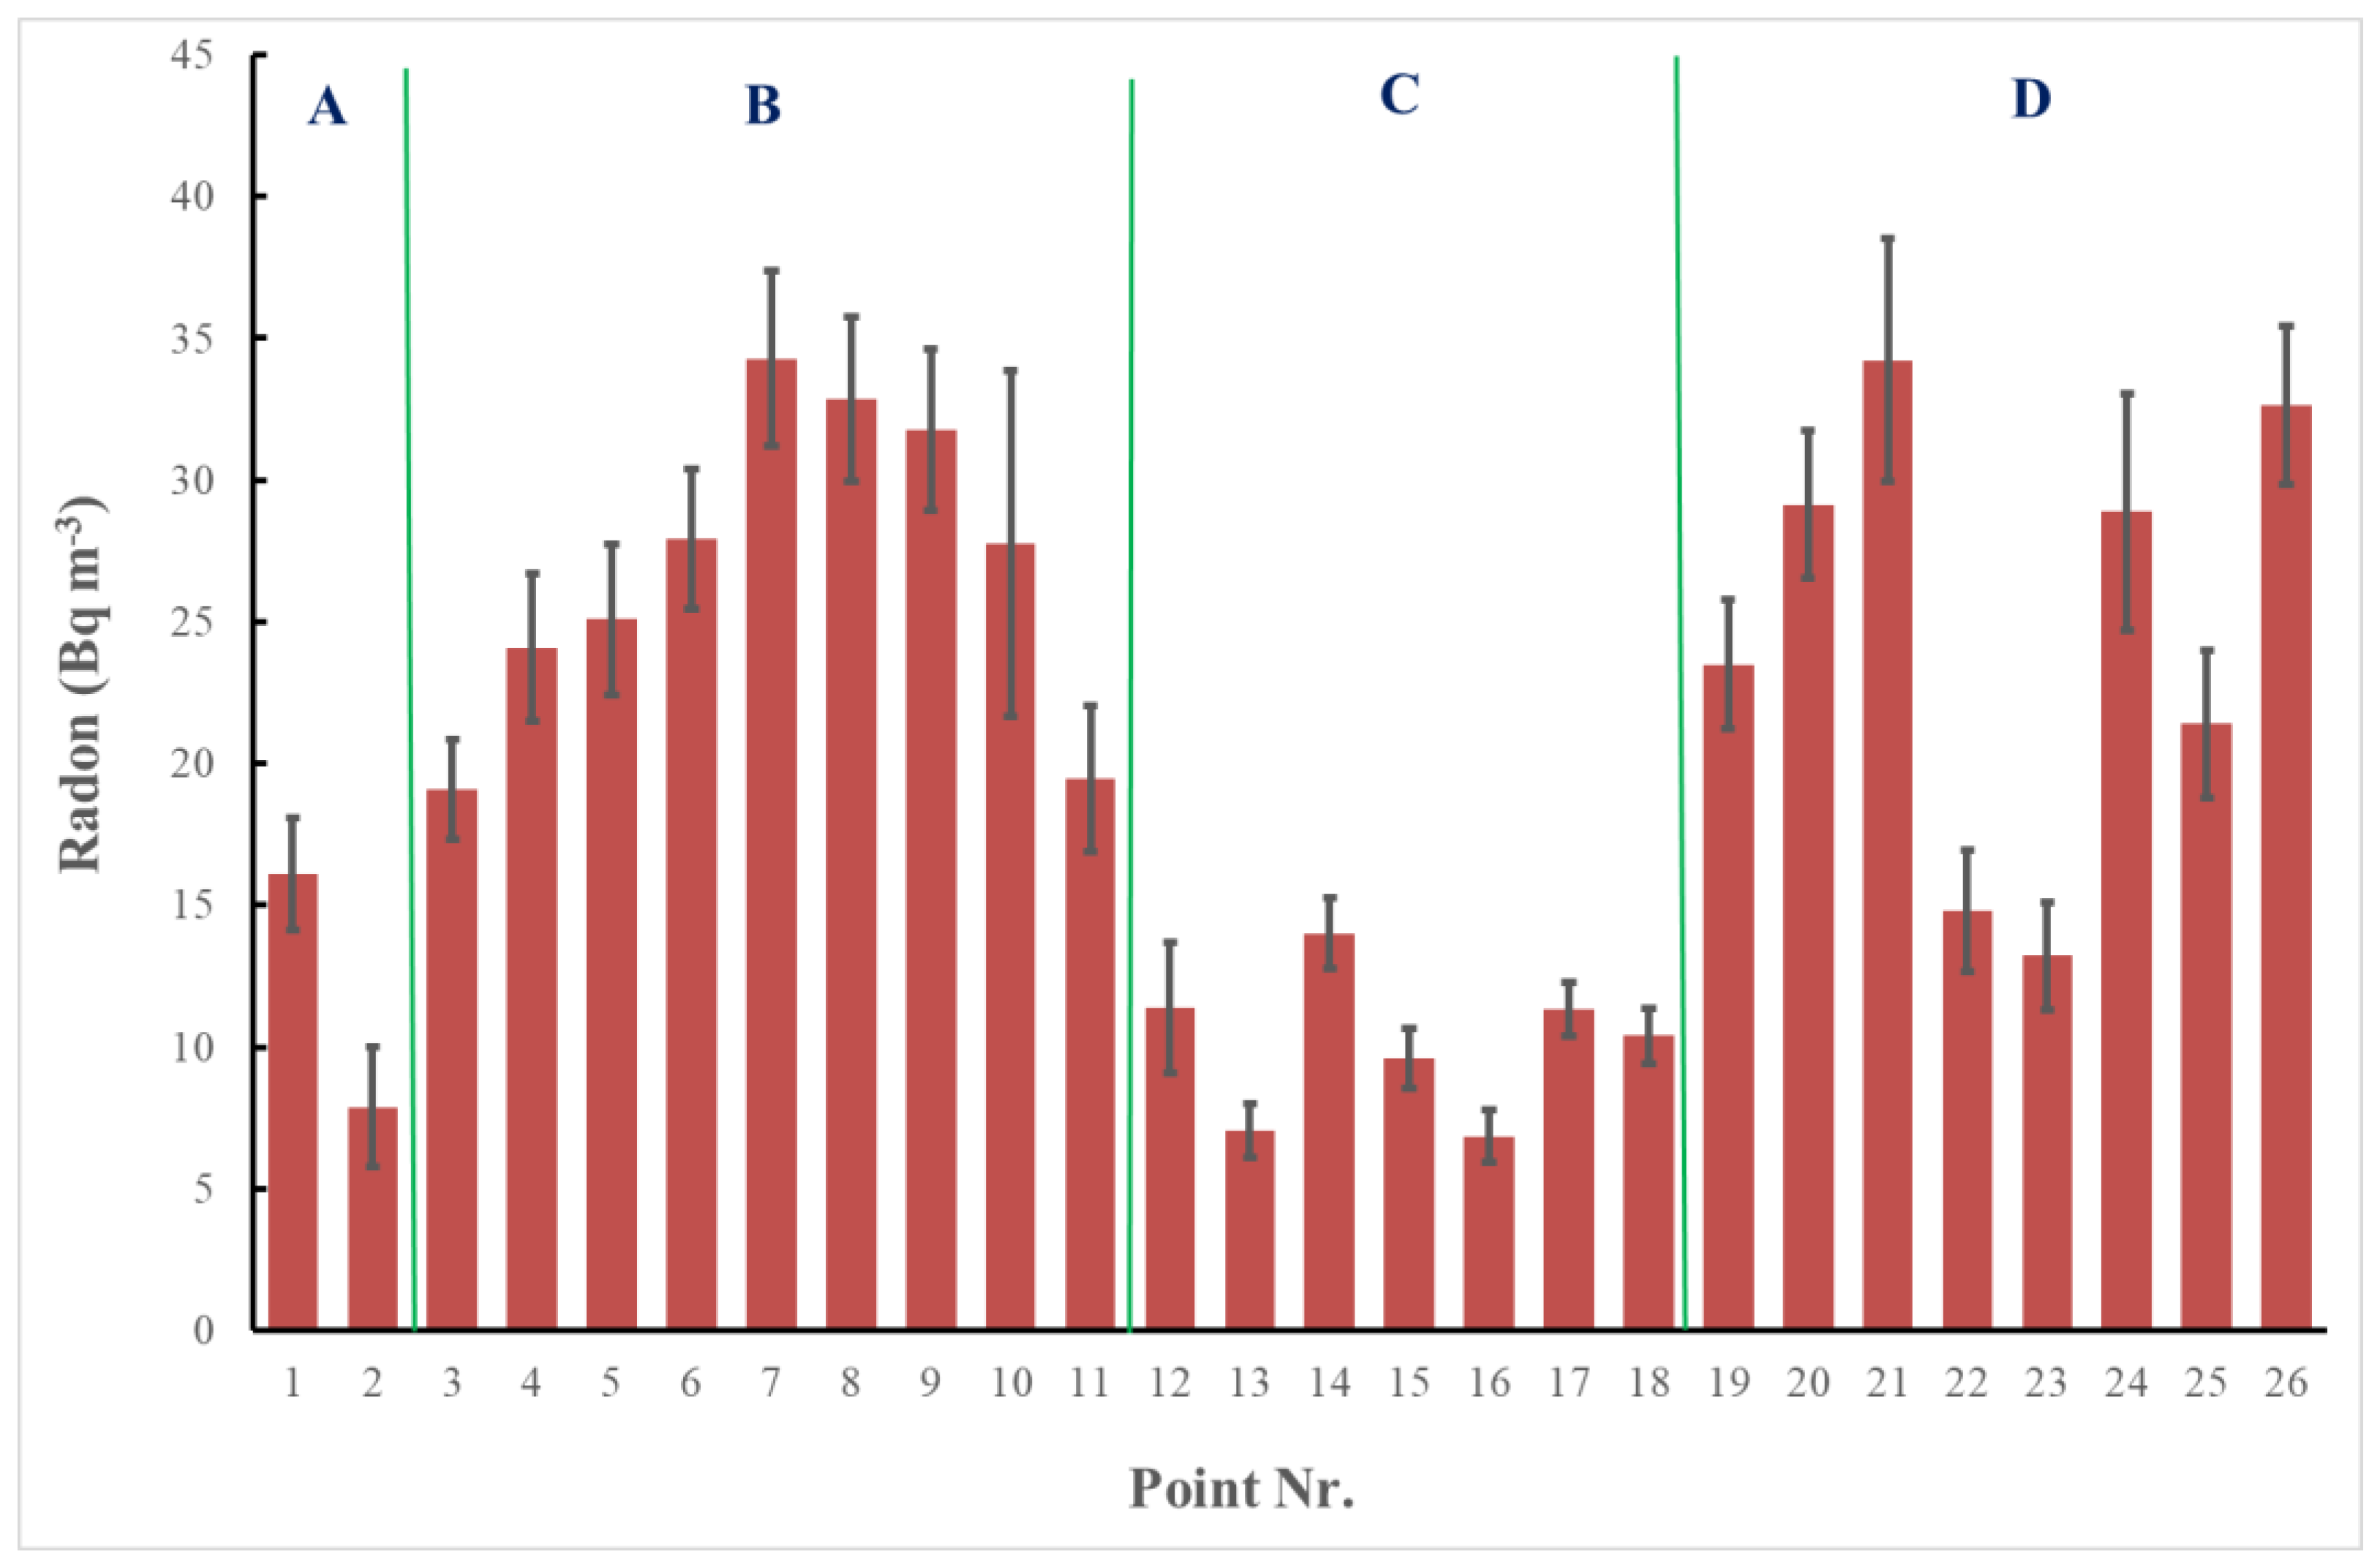
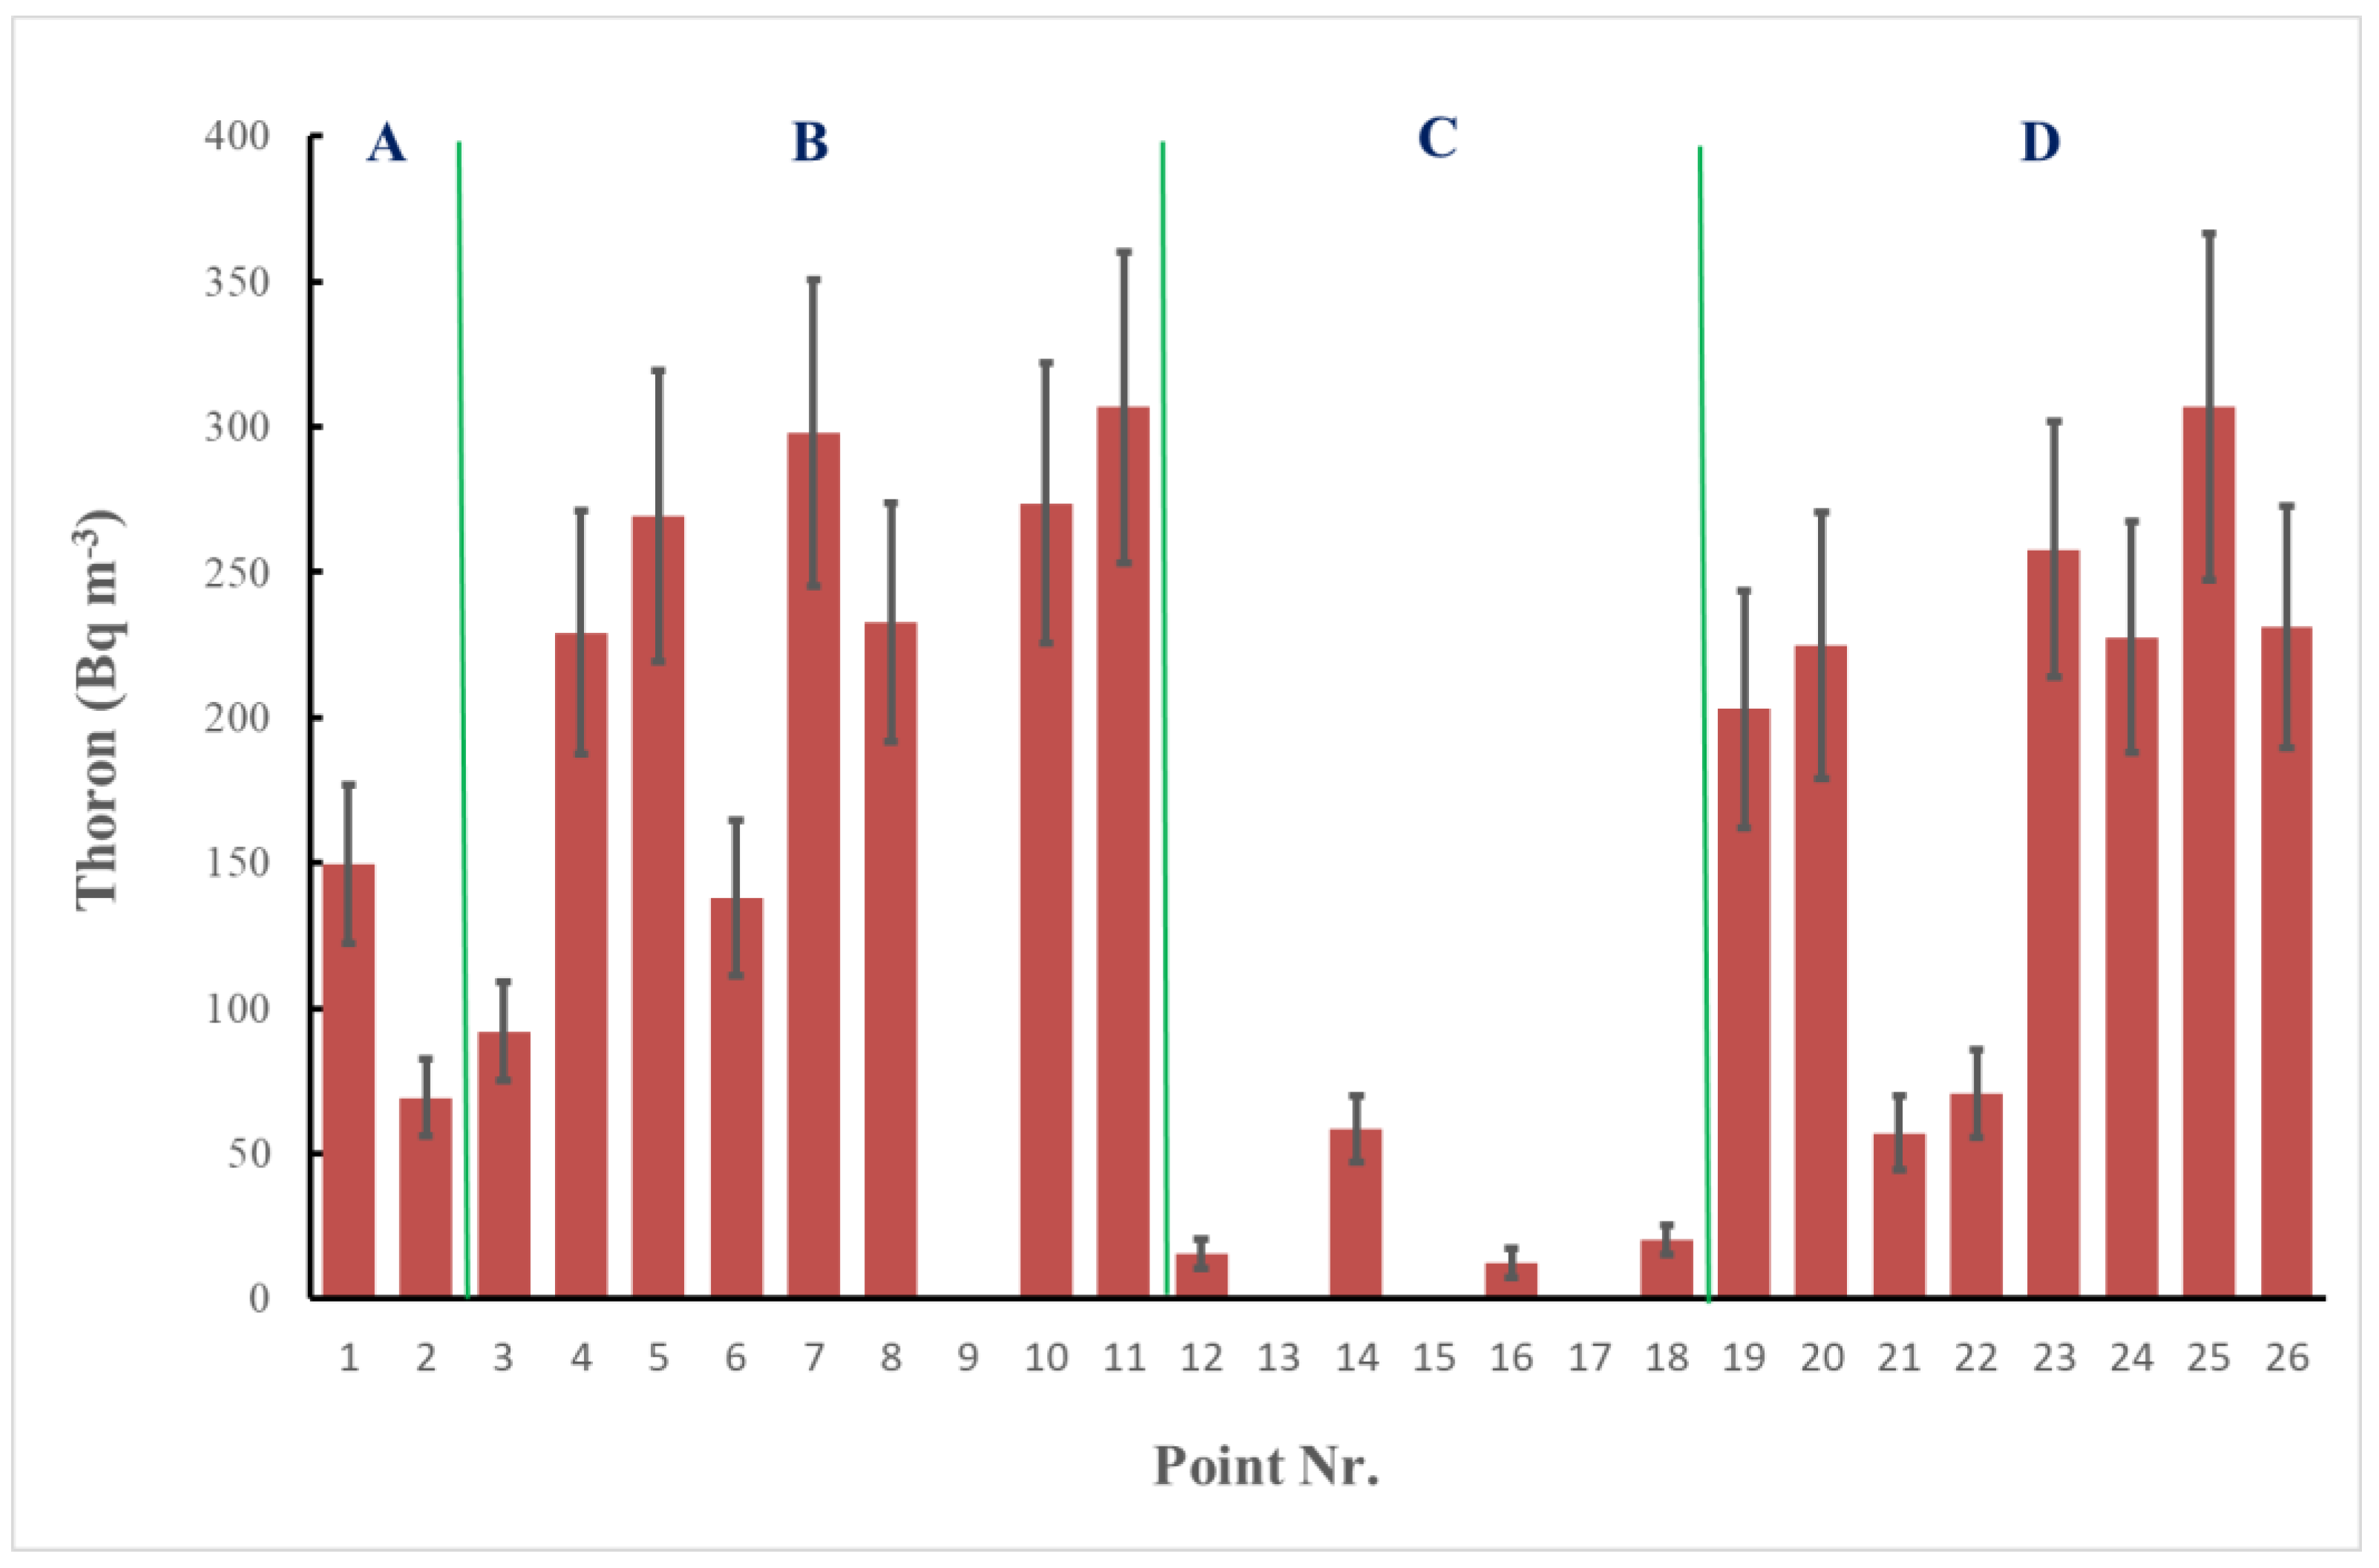
The distribution of the average activity concentrations of 222Rn over the exposure period at all 26 points is shown in Figure 2, and that of 220Rn in Figure 3. Four of the thoron DVDs (DVD-2), which were placed outside the spindles, were lost or damaged during exposure and could not be analyzed. In these cases, for 222Rn determination the average DVD-2 signal for the corresponding zone was used in data processing. The four different regions of measurements are indicated, and the data are summarized in Table 1.
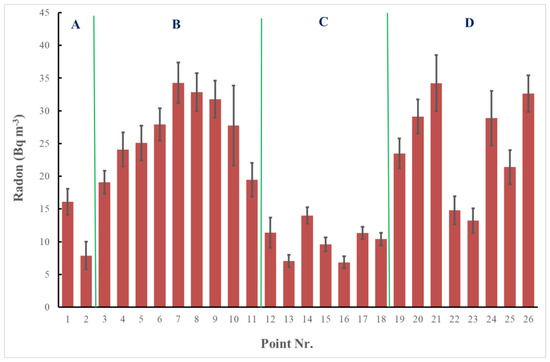
Figure 2.
Average activity concentrations of 222Rn at different points of measurement. Different zones of survey are indicated, with points that belong to them.
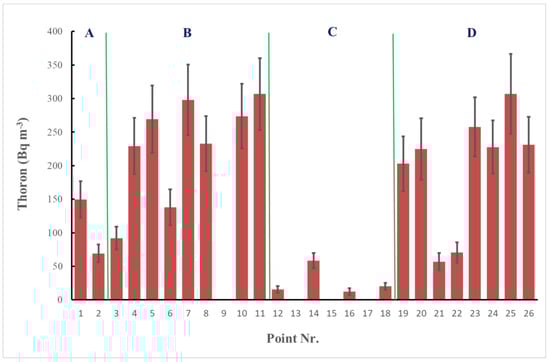
Figure 3.
Average activity concentrations of 220Rn at different points of measurement. Different zones of survey are indicated, with points that belong to them.

Table 1.
Radon and thoron statistical quantities for the four regions and all data (N—number of points with a result, AM—arithmetic mean).
As observed, there is considerable variation in concentrations both between zones and within each zone. Overall, the variations are more pronounced for thoron. Significant variations were noted even over short distances. Overall, no systematic trend in these variations was identified. Outdoor radon concentrations range from 7 ± 1 to 34 ± 3 Bq m−3, while thoron concentrations range from 13 ± 5 to 307 ± 54 Bq m−3. This high variability in thoron levels has also been observed in radon/thoron surveys in mines [31].
As shown in Table 1, the mean outdoor thoron activity concentrations in all four zones are substantially higher than those of radon. Similar observations have been reported in other studies on outdoor radon and thoron levels [17] as well as indoor levels [32]. These findings have implications for future detector placement and study designs, even in surveys focused solely on radon, as thoron interference can significantly bias radon detector results.
A unique aspect of the present study, which has not been addressed elsewhere, is that in each zone, some detectors were placed near each other (less than 10 m apart). Somewhat unexpectedly, significant differences were observed between the results of these closely positioned detectors, for both thoron and radon. For instance, in Zone A, where only two detectors were placed 4 m apart, the difference in radon activity concentrations was a factor of 2, and for thoron, a factor of 2.2. Both differences were statistically significant at the 95% confidence level. In Zone B, there were 5 detector pairs (out of 36 possible pairs, combining 9 elements (detectors), according to the combinatorics calculation) with a distance <10 m between detectors, and no statistically significant differences were found in radon levels between detectors situated less than 10 m apart. However, for thoron, differences of up to a factor of 2.5 were observed. In Zone C, 7 detector pairs (out of a total of 21 detector “pairs”) were placed with <10 m between detectors, and in Zone D the same with 5 pairs (out of 28 possible pairs). In Zones C and D, statistically significant differences between detectors less than 10 m apart were observed for both radon and thoron. In Zone C, the maximum difference in radon levels between closely spaced detectors was a factor of 2, while for thoron, it was a factor of 3.8. In Zone D, the maximum difference in radon levels was 60%, and for thoron, it was a factor of 4.3. No correlation was found between radon and thoron differences in these detector pairs.
These variations cannot be attributed to differences in the response of individual detectors. In laboratory experiments [19], four detectors were placed in close proximity—just a few centimeters apart—within a 50 L exposure chamber and exposed to strictly controlled reference radon and thoron activity concentrations, as described in [19,26]. After processing, individual deviations from the mean signal were within 6% for radon and 16% for thoron. These deviations were factored into the uncertainty budget for the calculations (Equation (4)). The significant variation in outdoor radon and thoron concentrations, even over short distances, underscores the importance of careful study design, particularly for mapping radon and thoron concentrations over large areas.
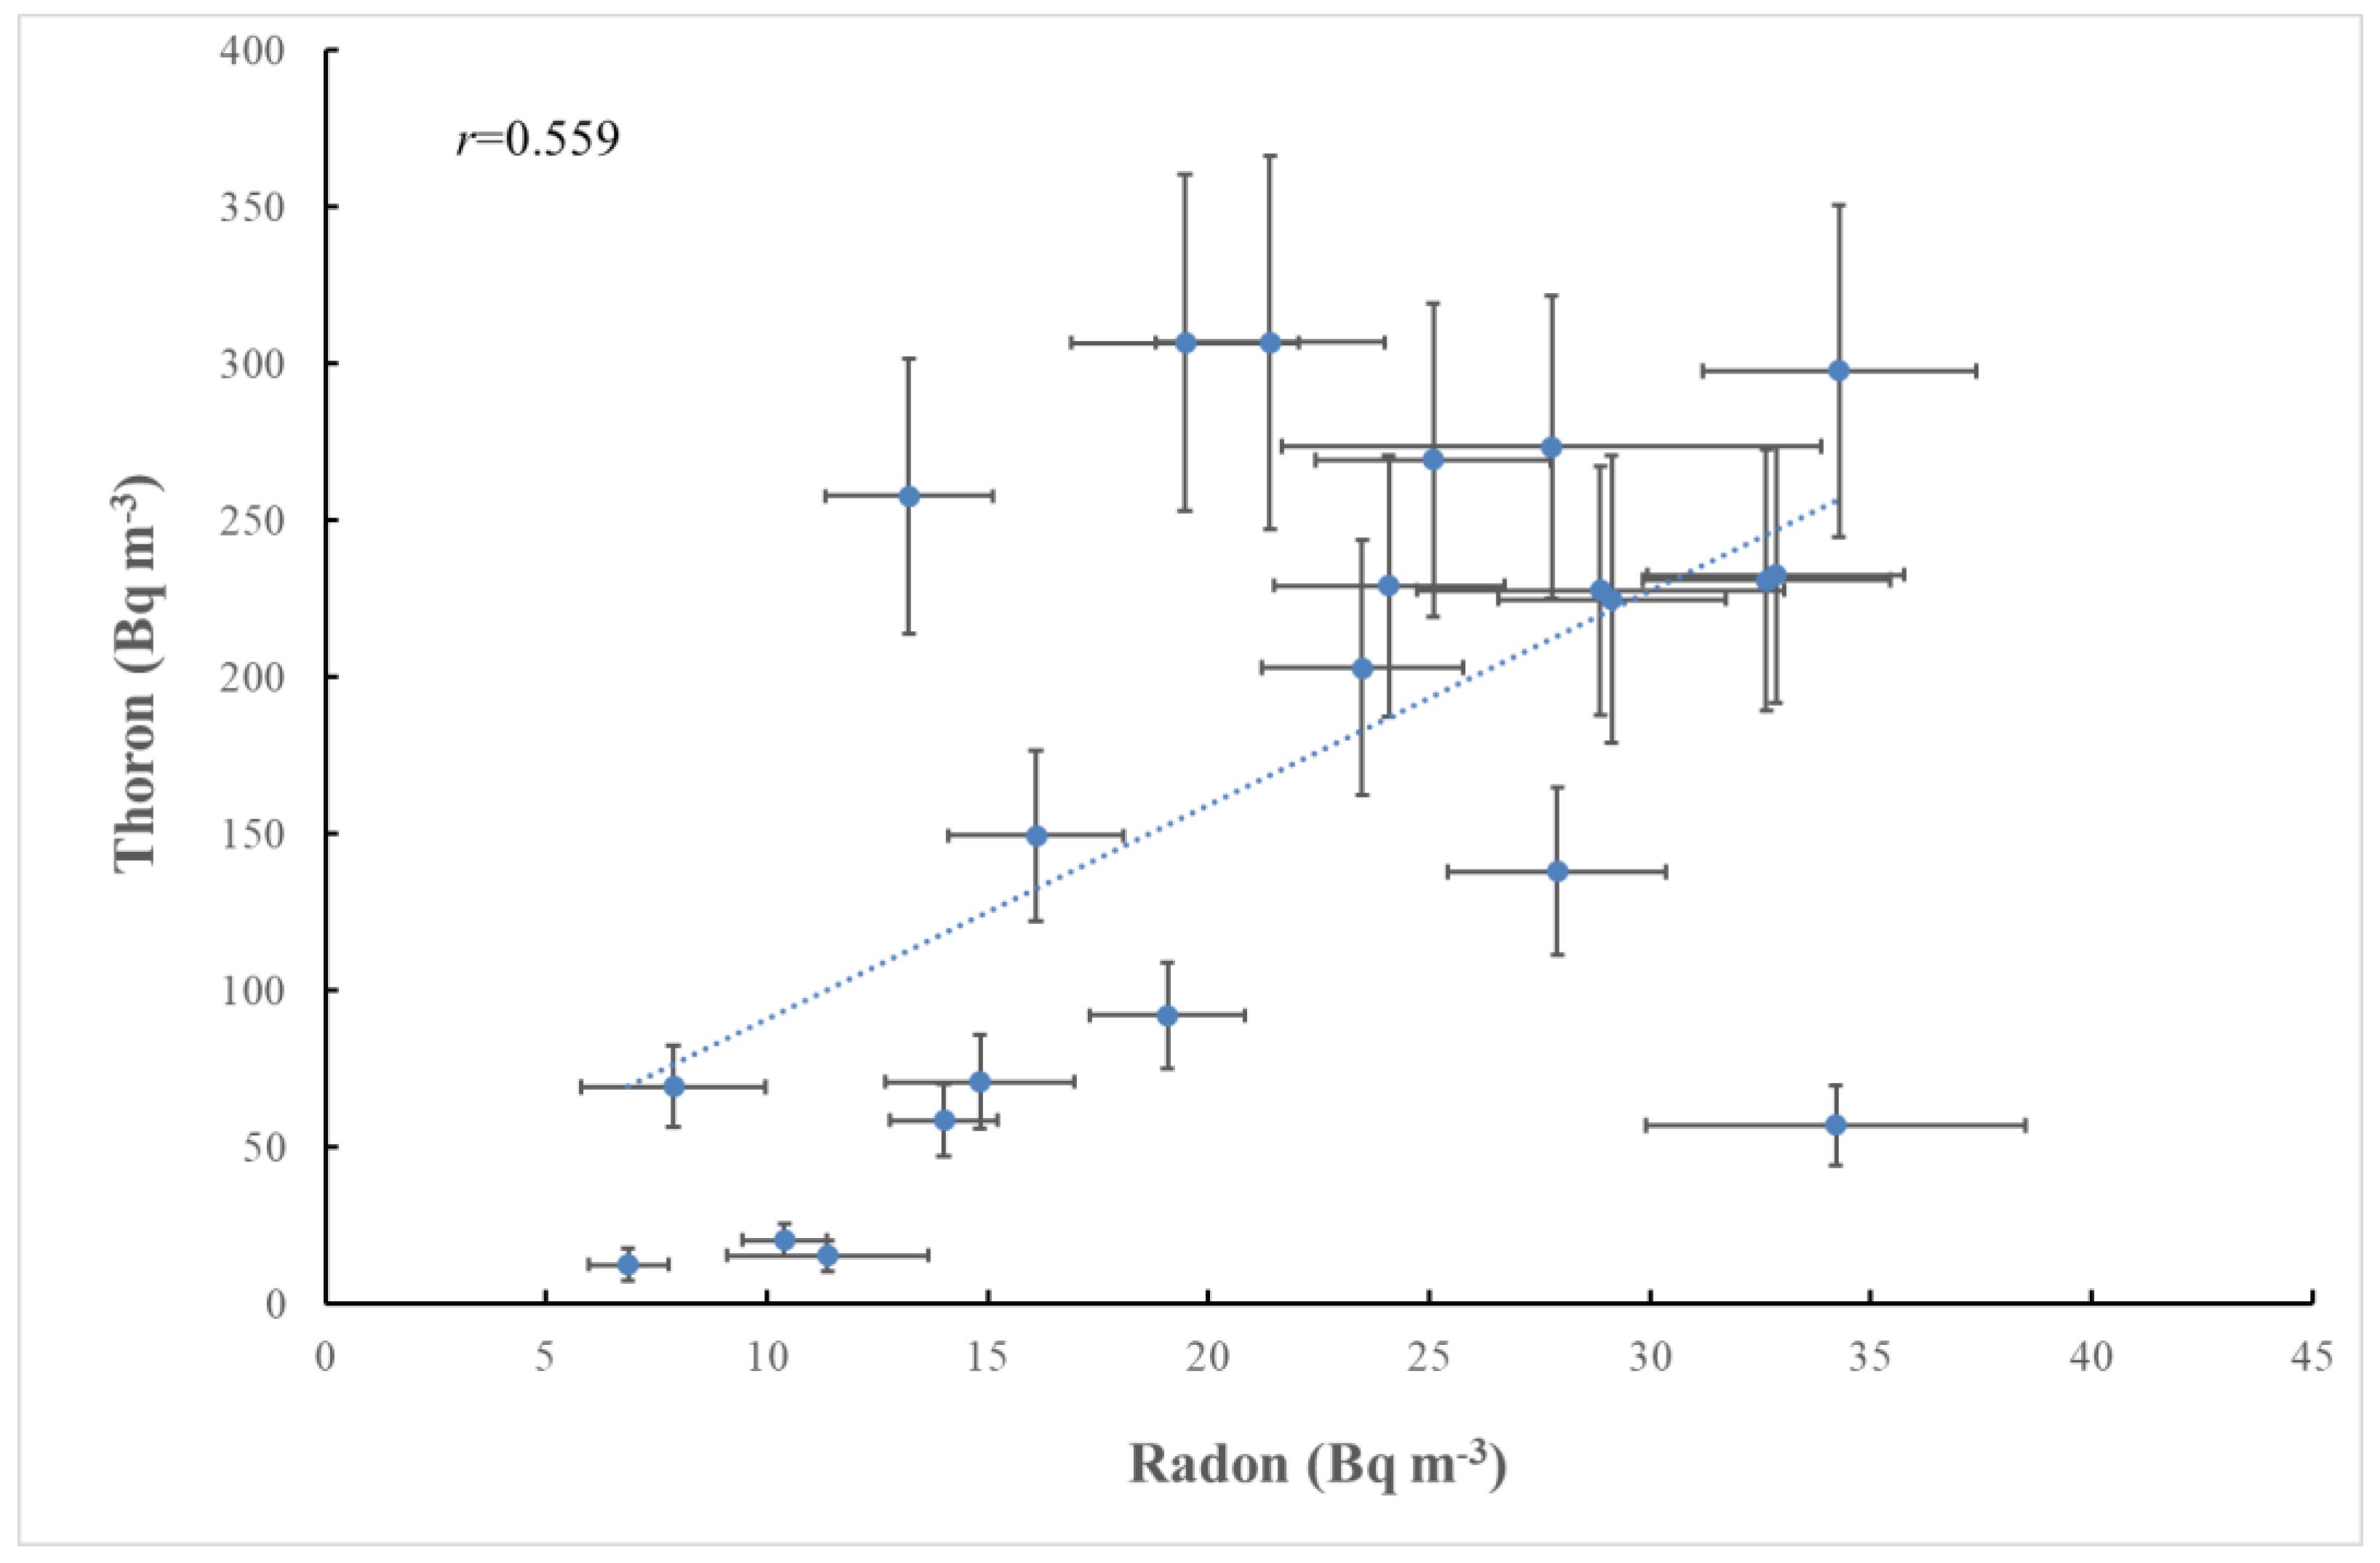
What is visible in Figure 2 and Figure 3, as well as in Table 1, is that regions with relatively higher radon concentrations also show higher thoron levels. Therefore, a correlation between radon and thoron was explored. As seen in Figure 4, there is a weak but statistically significant correlation between radon and thoron for the entire dataset (r = 0.559). A correlation between radon and thoron has also been observed in other studies of their outdoor levels [33], but not indoors [16] or in mines [31].

Figure 4.
Radon–thoron correlation for the entire data set. The correlation is weak but statistically significant. The Pearson’s coefficient of correlation (r) [30] is given.
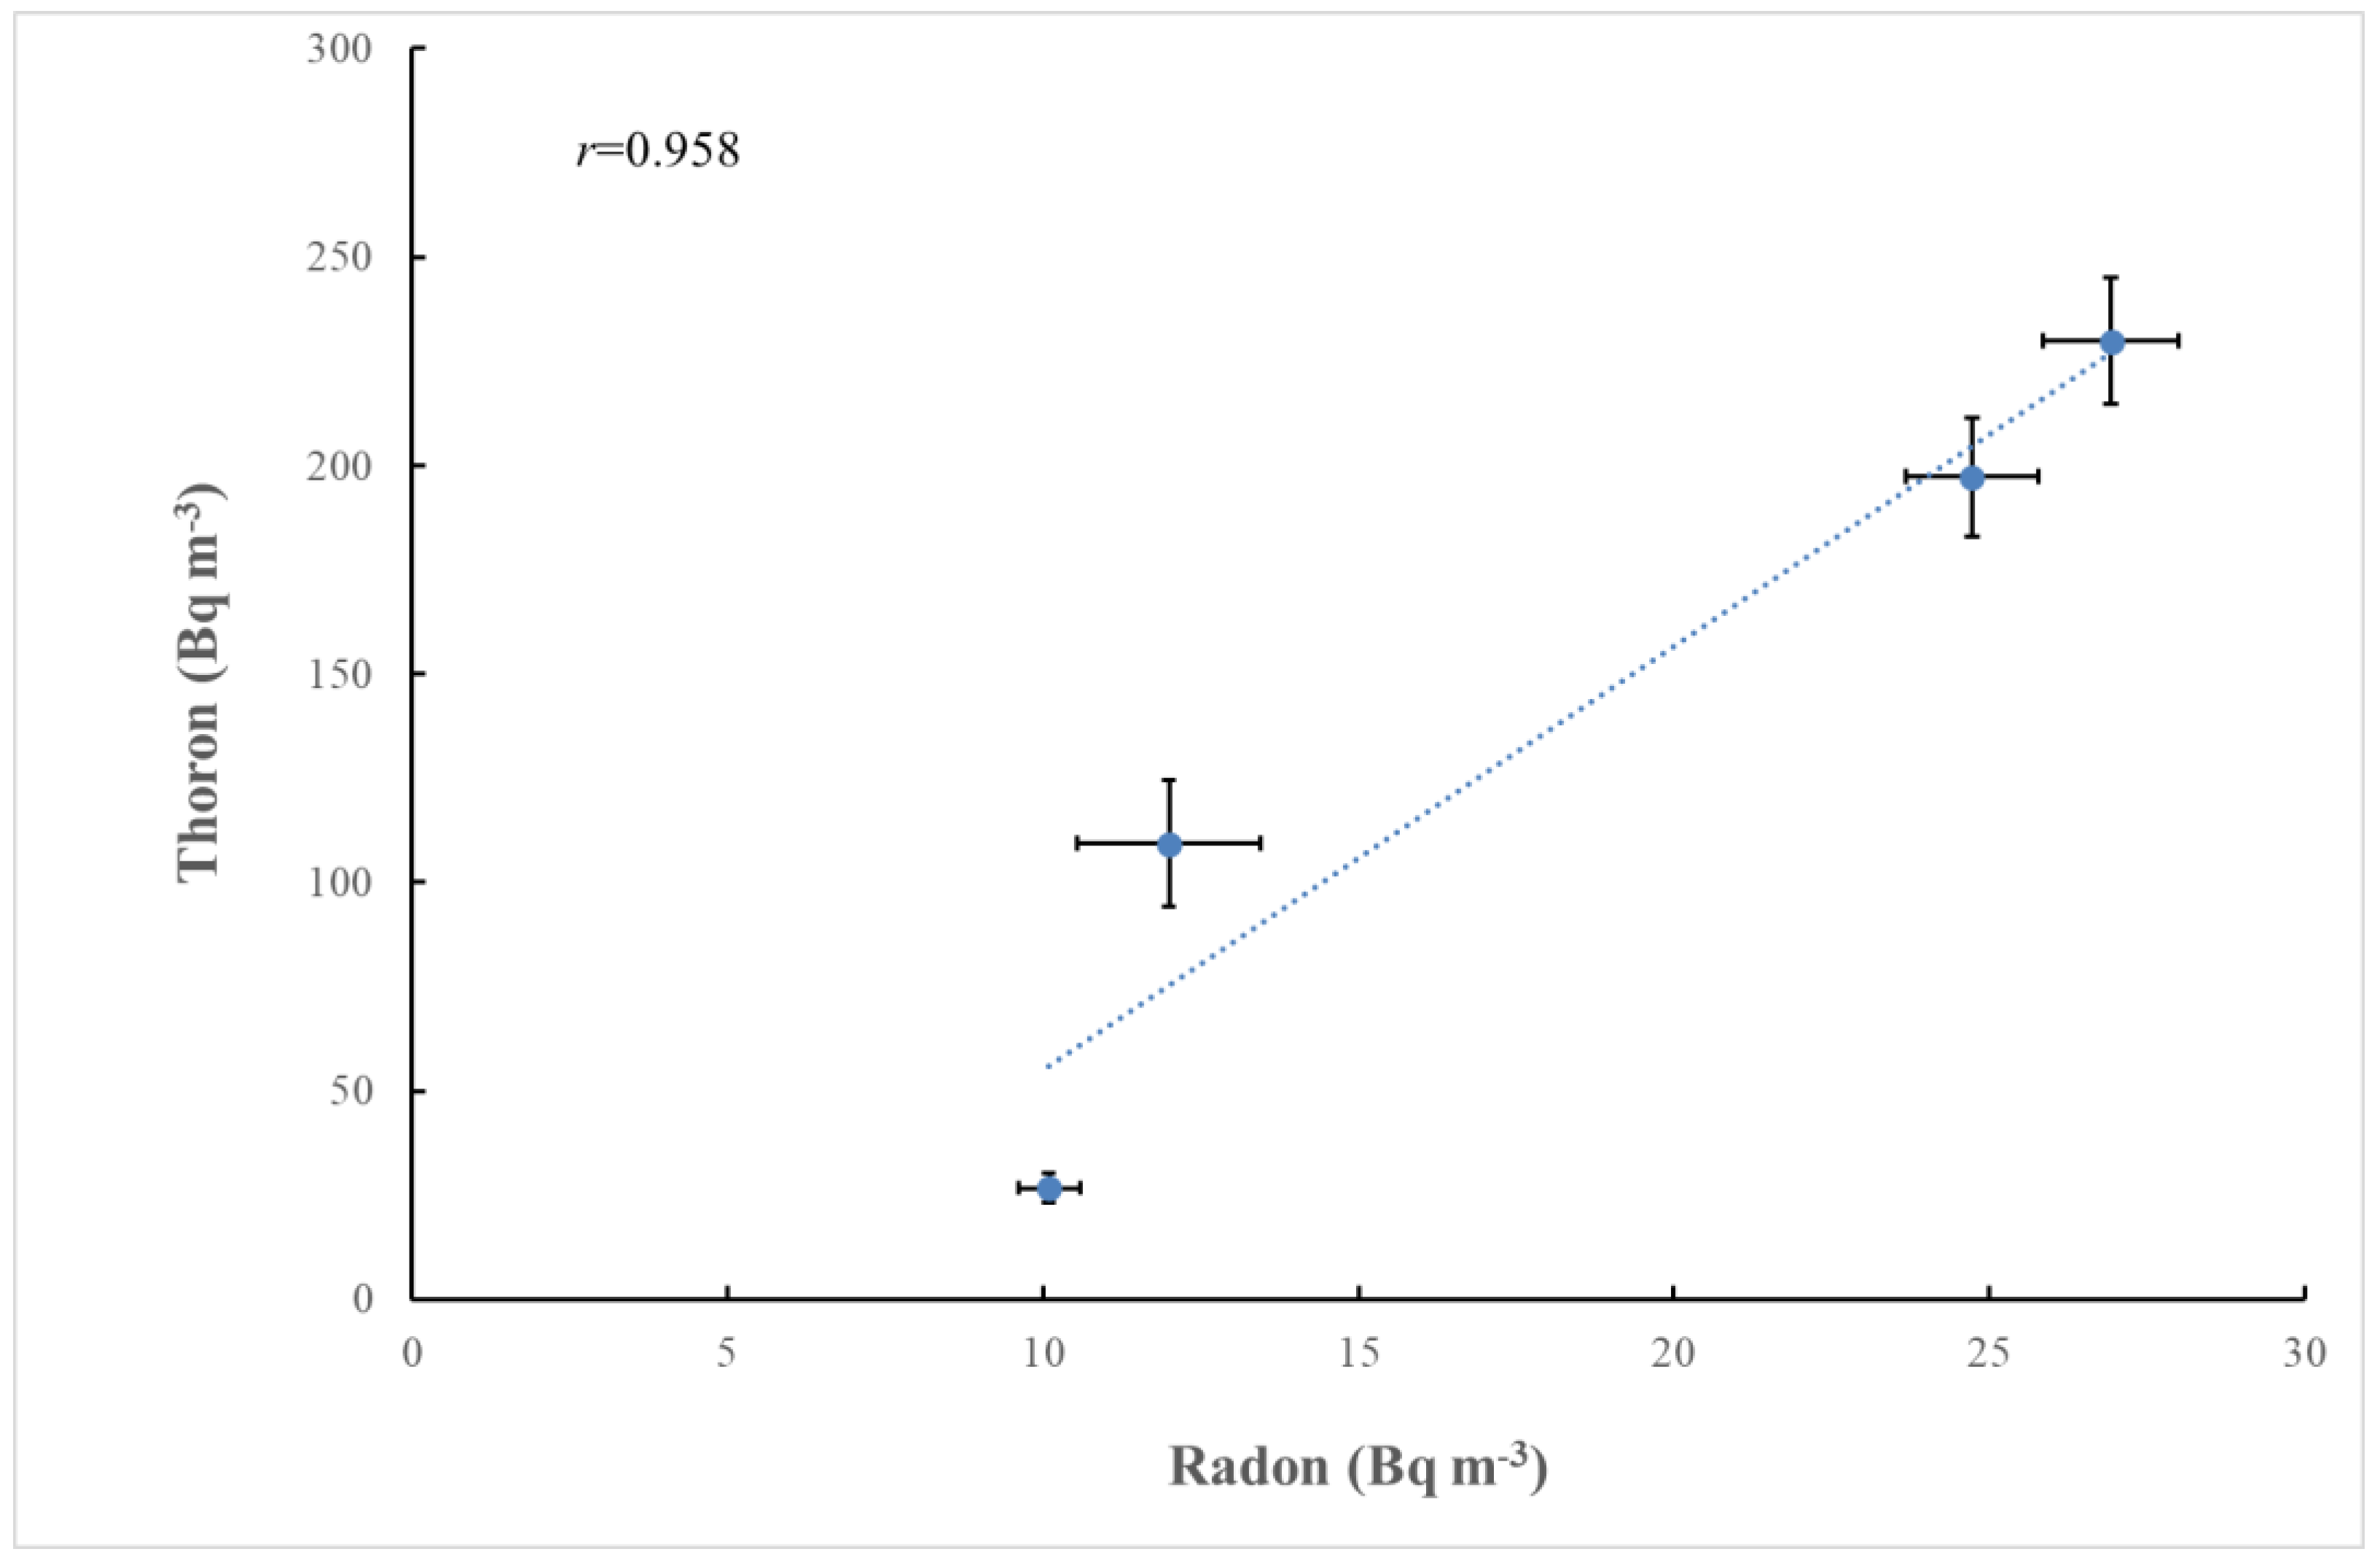
As previously mentioned, there is significant variation in the results even within a single zone. However, when we aggregate the data for each zone and analyze the correlations between the zone averages, the correlation improves considerably, as shown in Figure 5 (r = 0.958). The uncertainties of the zone averages (represented by error bars in Figure 5 and Figure 6) were calculated following standard rules for the propagation of uncertainties [29].
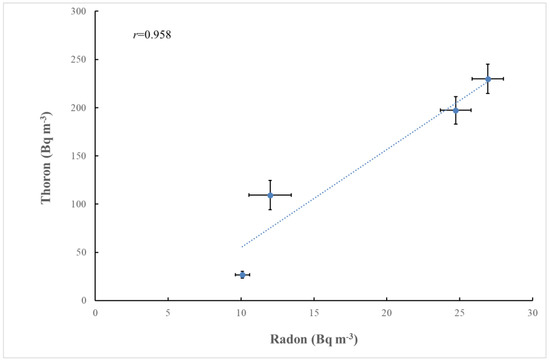
Figure 5.
Radon–thoron correlation for the averages of zones A–D. The correlation is much improved and significant. The Pearson’s coefficient of correlation (r) [30] is given.
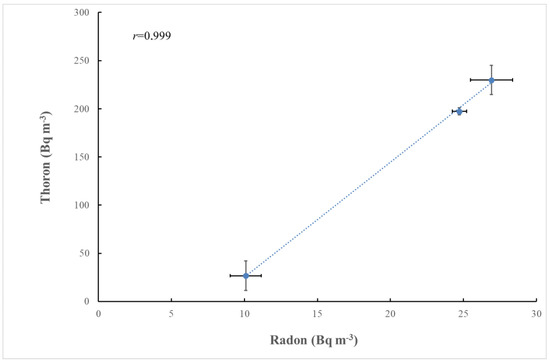
Figure 6.
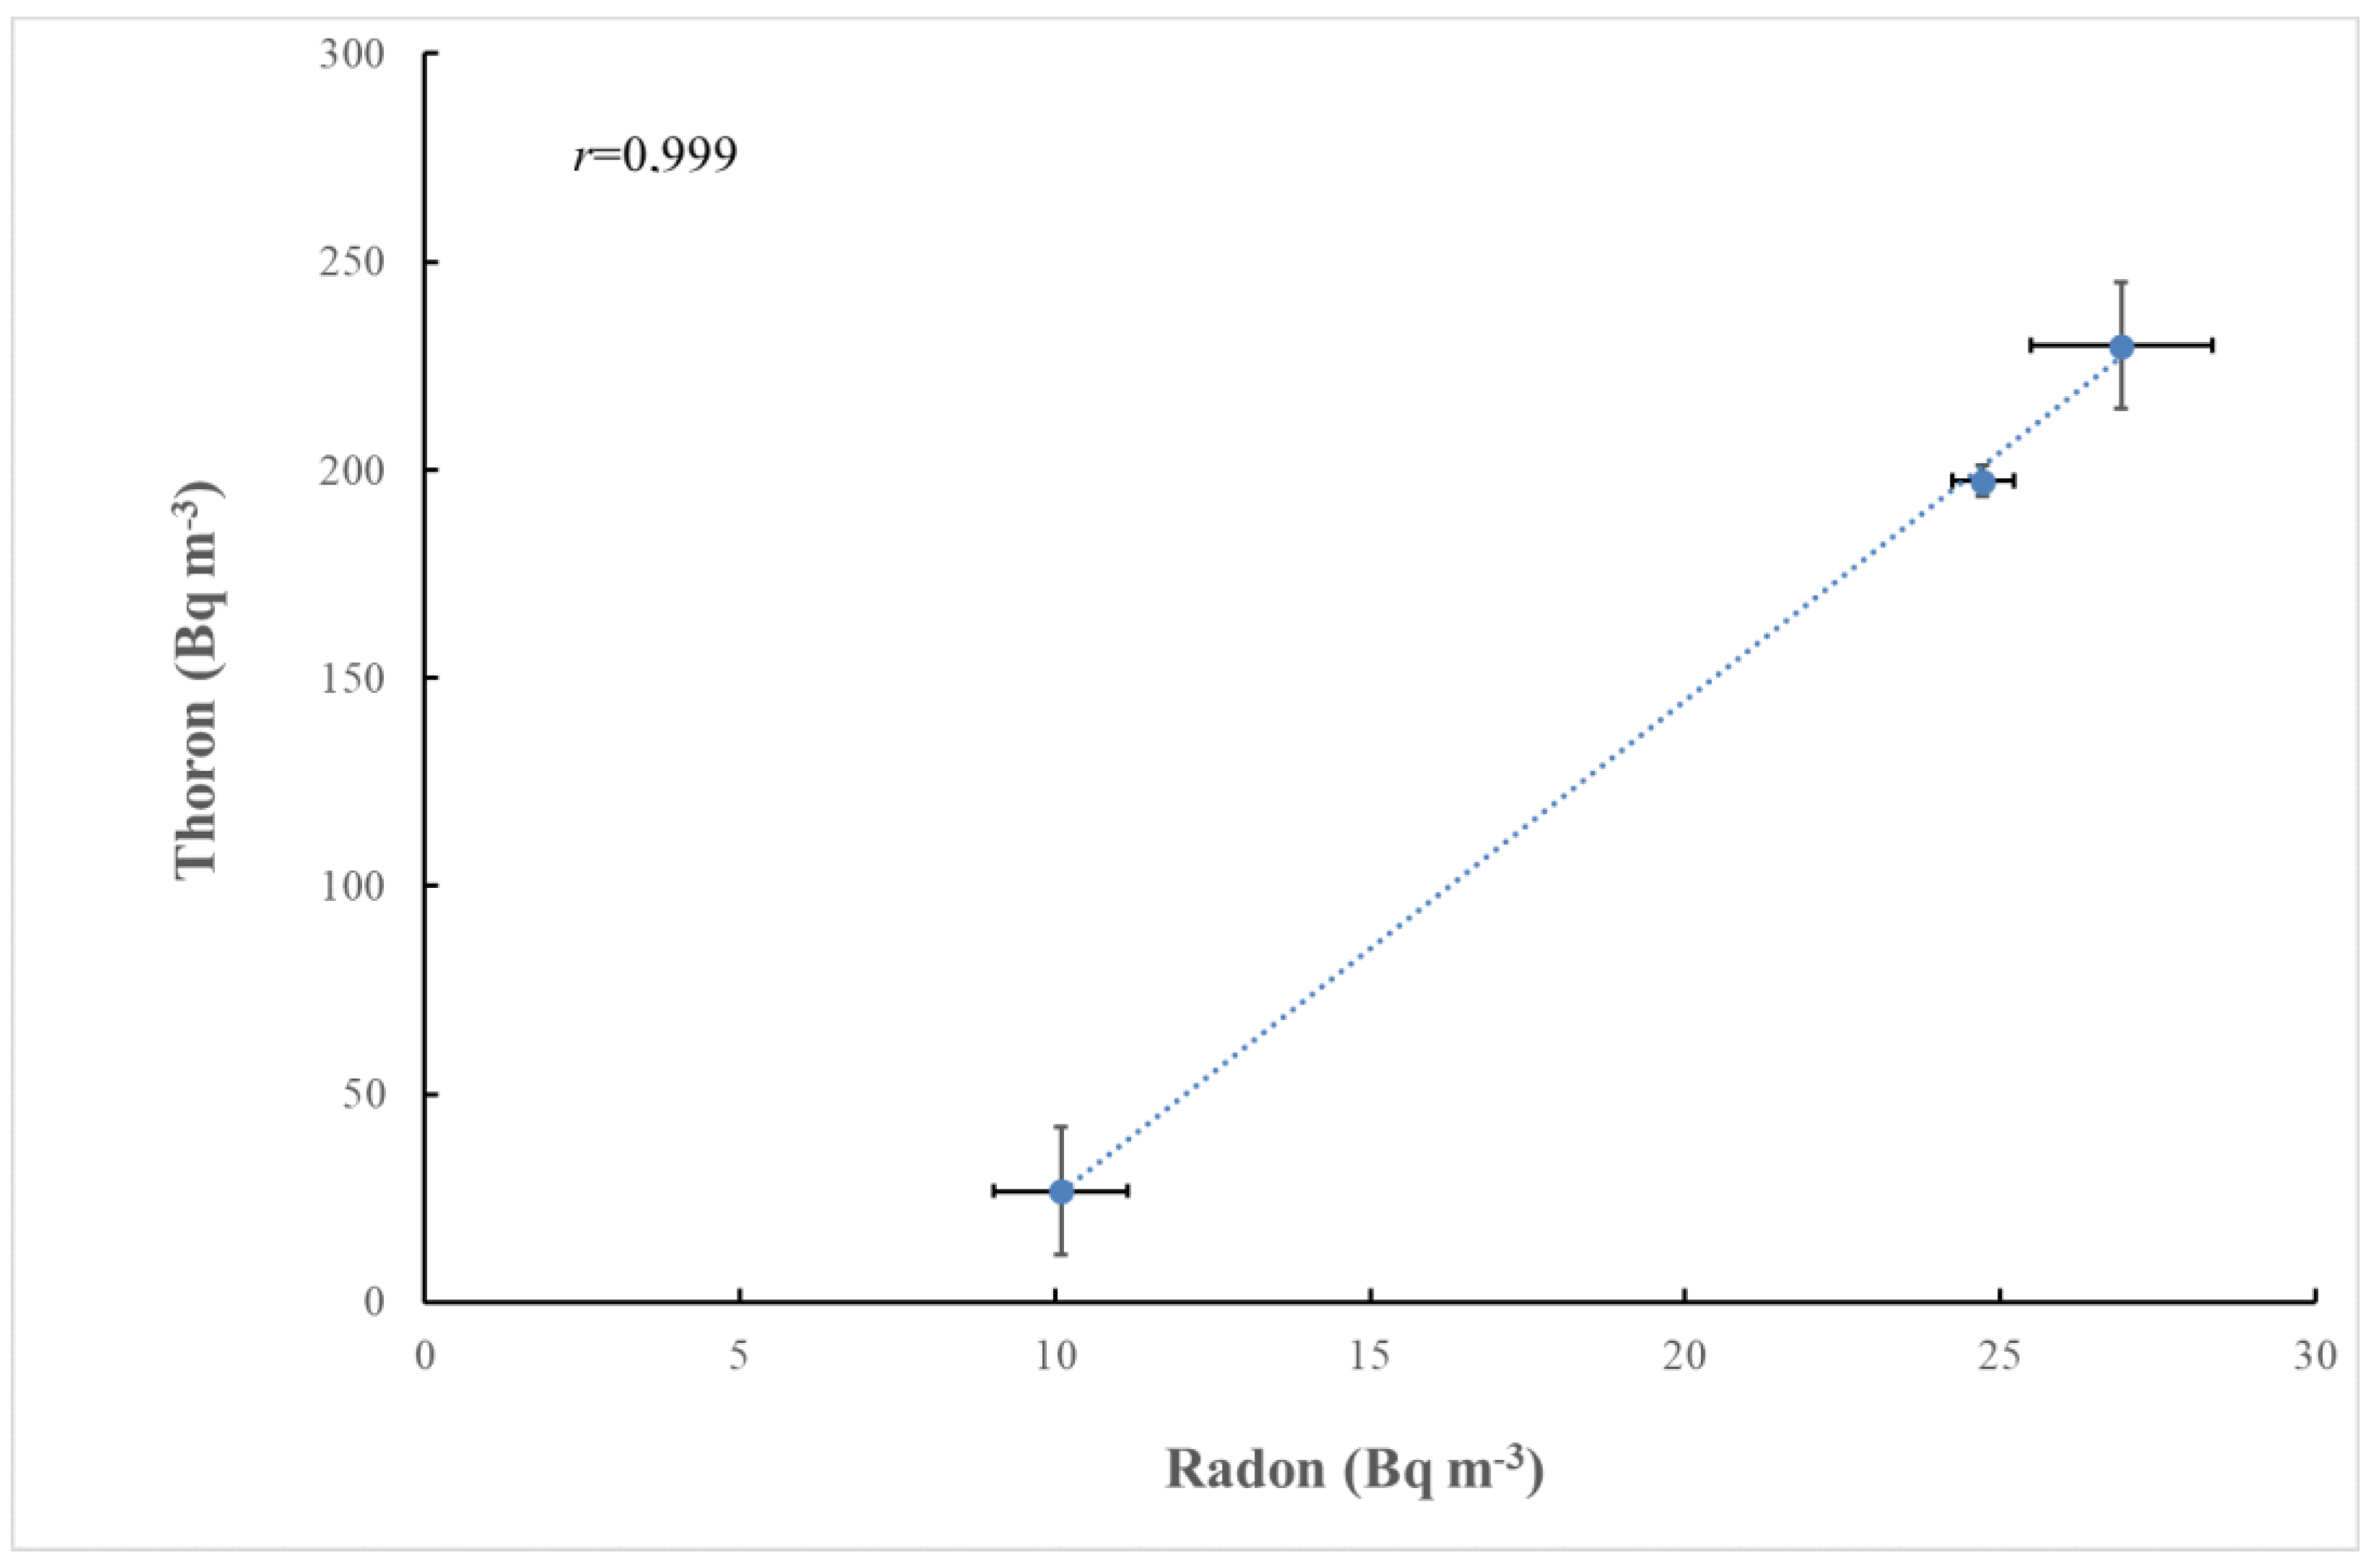
Radon–thoron correlation between the averages of zones B–D. Zone A is excluded, being statistically weak (only 2 points). The correlation becomes practically perfect. The Pearson’s coefficient of correlation (r) [30] is given.
Interestingly, if the data point for Zone A in Figure 5 is removed—given that it is based on only two closely positioned detectors—the radon–thoron correlation for the remaining three zones becomes nearly perfect (r = 0.999), as shown in Figure 6. Although we should be cautious about drawing statistical conclusions from just three data points, it seems unlikely that the perfect correlation observed in Figure 6 is merely due to chance.
4. Discussion
As shown in Table 1, the average outdoor thoron concentrations are significantly higher than those of radon. Similar observations have been reported in other studies on outdoor radon and thoron levels, including measurements taken at a height of 1 m [17], though not in underground mines [31] or caves [34,35]. In such cases, even a small percentage of thoron interference in the radon signal can introduce significant bias, especially when thoron concentrations are much higher than radon levels.
For example, consider a radon monitor with 20% sensitivity to thoron compared to radon. Such a monitor still complies with the IEC 61577-2:2014 standard [36], which allows for a maximum of 20% thoron interference with the radon signal, making it eligible for use. However, if such a monitor is used for outdoor radon measurements, as in our survey area at point 11 (Zone B), the radon results could be overestimated by a factor greater than 4. Recent research has experimentally studied thoron interference with radon measurements by some of the most sensitive and widely used continuous radon monitors (AlphaGUARD and RadonEye Plus) [37], which could potentially be used for outdoor surveys. The thoron interference for these devices is estimated at 8% and 11%, respectively [37]. Other studies [27] report similar thoron interference levels for AlphaGUARD radon monitors but substantially higher interference for RadonEye Plus, where it may exceed 20%. If, for instance, the AlphaGUARD model studied in [37] is used for outdoor radon measurements at point 11 (Zone B), the radon results could be overestimated by a factor of 2.3. The overestimation would be even greater if the RadonEye Plus is used. Such significant biases render the radon results unreliable, undermining any conclusions based on them.
Currently, significant attention is being paid to radon measurements in the atmosphere as part of climate change research. Atmospheric radon monitors are being planned for inclusion in climate monitoring networks, such as the European Integrated Carbon Monitoring System (ICOS) and greenhouse gas monitoring stations. It seems that, in addition to utilizing innovative and highly sensitive radon detection systems, these monitors should also accurately estimate and/or compensate for thoron interference, ideally through discriminative measurements of radon and thoron. The key takeaway for future research is that in outdoor surveys where radon concentrations are relatively low, only combined discriminative measurements of radon and thoron can provide reliable data.
One notable observation in the present dataset is the variation in results, even over short distances, with this variability being more pronounced for thoron than for radon. Similar non-systematic variability in thoron concentrations has also been observed in studies of underground mines [31]. In the present study, significant differences in both radon and thoron concentrations were observed, even between detectors situated less than 10 m apart. The weather conditions during exposure in all four zones were predominantly stable, with minimal air turbulence and no frequent temperature inversions. Under such conditions, the horizontal wind transfer of exhaled radon and thoron over long distances may be limited, making their concentrations largely dependent on the radon and thoron exhalation from the soil directly beneath the detector.
Some studies use radon levels in soil as an indicator of radon concentrations in the air above the soil surface [38]. Although studies on radon/thoron variability in atmospheric air over short distances are lacking in the scientific literature, our experience in measuring radon in soil gas suggests that significant differences can be observed even when measurement points are less than 10 m apart. Based on this experience, it can be expected that under predominantly stable air conditions—where radon and thoron concentrations in the air are mainly influenced by exhalation from the spot directly beneath the detector—these concentrations may vary significantly over short distances. Future research could benefit from mathematical modeling of radon and thoron atmospheric transfer over short distances from the source, under varying meteorological conditions.
Another finding in our study is the presence of a weak but statistically significant correlation between individual radon and thoron levels. Similar correlations have been reported in other outdoor radon/thoron surveys [33], while studies conducted indoors [16] and in underground mines [31] have not found any correlation between radon and thoron. This weak correlation is unlikely to be useful for precisely correcting radon results for thoron interference when thoron data is unavailable. However, the correlation improves significantly when considering the radon and thoron averages across the four zones and becomes nearly perfect if the statistically weak Zone A is excluded. While we should be cautious about over-interpreting conclusions based on only three points as in Figure 6, the potential correlation between area-averaged data clearly warrants further investigation. This correlation may be site-specific and dependent on the geology of the studied area. However, if it is confirmed as a common occurrence, it could be used to correct average radon levels over large areas (e.g., radon priority areas) for thoron interference, even when thoron data are missing from the analyzed radon dataset.
5. Conclusions
Although the study presented here is just a pilot one, it uncovered new insights that could significantly impact future studies on radon (and thoron) in atmospheric air—an area that has gained considerable attention in recent years:
- Substantial variation in radon and thoron concentrations outdoors: Radon and thoron levels can vary significantly outdoors even over distances of less than 10 m. With advancements in the design of highly sensitive radon detectors [12,13,14,19] and the development of protocols for their metrological assurance [10], it is likely that large-scale projects for mapping outdoor radon concentrations will be initiated. In the past, extensive indoor radon mapping projects have been conducted [39], often using a 10 × 10 km grid [39]. Within such a grid, both indoor and outdoor radon concentrations can vary substantially, and these variations should be considered when assessing the “map uncertainties”. For outdoor mapping, addressing potential short-distance variations might require the definition of a “place of measurement” that includes several measuring points situated 10 to 100 m apart.
- Weak but statistically significant radon–thoron correlation outdoors: A weak but statistically significant correlation between outdoor radon and thoron levels was observed. The correlation between average concentrations across zones is much stronger than that between individual points. Further studies are needed to explore the radon–thoron correlation outdoors and to determine whether it can be used to correct (including retrospectively) data collected using radon detectors that are also sensitive to thoron.
- Benchmarks for further research: Once resources become available, we plan to conduct a more comprehensive radon and thoron survey in this and other regions. In addition to atmospheric radon and thoron measurements, the survey will include soil gas radon sampling and soil collection at measurement points for subsequent gamma spectrometry analysis. This will allow for the determination of natural radionuclides from the 238U and 232Th decay series, which may help clarify the reasons behind significant variations in radon and thoron levels, even over short distances.
Overall, the present results, along with findings from other studies, suggest that the most effective approach for outdoor surveys is to rely on combined discriminative measurements of radon and thoron. This method may provide reliable data on both isotopes, minimizing the risk of mutual interference between them.
Author Contributions
Conceptualization, D.P.; methodology, D.P. and D.D.; software, D.P.; validation, D.D.; formal analysis, D.P.; investigation, D.D. and D.P.; resources, D.P.; data curation, D.D.; writing—original draft preparation, D.P.; writing—review and editing, D.P.; visualization, D.P. and D.D.; supervision, D.P.; project administration, D.P.; funding acquisition, D.P. All authors have read and agreed to the published version of the manuscript.
Funding
This study is financed by the European Union-Next Generation EU, through the National Recovery and Resilience Plan of the Republic of Bulgaria, project № BG-RRP-2.004-0008-C01 and by the Bulgarian National Science Fund under contract KP-06-N58/9 (22 November 2021).
Institutional Review Board Statement
Not applicable.
Informed Consent Statement
Not applicable.
Data Availability Statement
Data will be made available on reasonable request.
Conflicts of Interest
The authors declare no conflicts of interest.
References
- International Agency for Research on Cancer (IARC). IARC Monographs on the Evaluation of Carcinogen Risks to Humans; IARC: Lyon, France, 1988; Volume 43.
- WHO. Handbook on Indoor Radon: A Public Health Perspective; Zeeb, H., Shannoun, F., Eds.; WHO Publications: Geneva, Switzerland, 2009. [Google Scholar]
- United Nations Scientific Committee on the Effects of Atomic Radiation (UNSCEAR). Sources of Ionizing Radiation. In United Nations Scientific Committee on the Effects of Atomic Radiation Report to the General Assembly; Volume I: Sources; UNSCEAR: Vienna, Austria, 2008. [Google Scholar]
- Celikovic, I.; Pantelic, G.; Vukanac, I.; Nikolic, J.K.; Živanovic, M.; Cinelli, G.; Gruber, V.; Baumann, S.; Poncela, L.S.Q.; Rabago, D. Outdoor Radon as a Tool to Estimate Radon Priority Areas—A Literature Overview. Int. J. Environ. Res. Public Health 2022, 19, 662. [Google Scholar] [CrossRef] [PubMed]
- TraceRADON. Available online: http://traceradon-empir.eu (accessed on 18 July 2024).
- Council of the European Union. Council Directive 2013/59/EURATOM of 5 December 2013. Off. J. Eur. Union 2014, 13, 103. [Google Scholar]
- Lopez, M.; Schmidt, M.; Yver, C.; Messager, C.; Worthy, D.; Kazan, V.; Ramonet, M.; Bousquet, P.; Ciais, P. Seasonal variation of N2O emissions over three sites in Northern France inferred from 10 years of continuous atmospheric N2O and 222Rn measurements. J. Geophys. Res. 2012, 117, D14. [Google Scholar]
- Wada, A.; Matsueda, H.; Murayama, S.; Taguchi, S.; Hirao, S.; Yamazawa, H.; Moriizumi, J.; Tsuboi, K.; Niwa, Y.; Sawa, Y. Quantification of emission estimates of CO2, CH4 and CO for East Asia derived from atmospheric radon-222 measurements over the western North Pacific. Tellus 2013, B 65, 18037. [Google Scholar] [CrossRef]
- Grossi, C.; Vogel, F.R.; Curcoll, R.; Àgueda, A.; Vargas, A.; Rodó, X.; Morguí, J.-A. Study of the daily and seasonal atmospheric CH4 mixing ratio variability in a rural Spanish region using 222Rn tracer. Atmos. Chem. Phys. 2018, 18, 5847–5860. [Google Scholar] [CrossRef]
- Röttger, S.; Röttger, A.; Grossi, C.; Vargas, A.; Karstens, U.; Cinelli, G.; Chung, E.; Kikaj, D.; Rennick, C.; Mertes, F.; et al. Radon metrology for use in climate change observation and radiation protection at the environmental level. Adv. Geosci. 2022, 57, 37–47. [Google Scholar] [CrossRef]
- Grossi, C.; Arnold, D.; Adame, J.A.; López-Coto, I.; Bolívar, J.P.; de la Morena, B.A.; Vargas, A. Atmospheric 222Rn concentration and source term at El Arenosillo 100 m meteorological tower in southwest Spain. Radiat. Meas. 2012, 47, 149–162. [Google Scholar] [CrossRef]
- Chambers, S.D.; Hong, S.-B.; Williams, A.G.; Crawford, J.; Griffiths, A.D.; Park, S.-J. Characterising terrestrial influences on Antarctic air masses using Radon-222 measurements at King George Island. Atmos. Phys. Chem. 2014, 14, 9903–9916. [Google Scholar] [CrossRef]
- Pressyanov, D. New generation of highly sensitive radon detectors based on activated carbon with compensated temperature dependence. Sci. Rep. 2022, 12, 8479. [Google Scholar] [CrossRef]
- Pressyanov, D.; Dimitrov, D. The sensitivity of innovative techniques for measuring low levels of radon in the environment using passive detectors. J. Environ. Radioact. 2024, 277, 107461. [Google Scholar] [CrossRef]
- MetroRADON. Deliverable 2, Annexes V and VIII. Available online: http://metroradon.eu (accessed on 24 July 2024).
- Tokonami, S. Why is 220Rn (thoron) important? Radiat. Prot. Dosim. 2010, 141, 335–339. [Google Scholar] [CrossRef] [PubMed]
- Haanes, H.; Finne, I.E.; Kolstad, T.; Mauring, A.; Dahlgren, S.; Rudjord, A.L. Outdoor thoron and progeny in a thorium rich area with old decommissioned mines and waste rock. J. Environ. Radioact. 2016, 162–163, 23–32. [Google Scholar] [CrossRef]
- Tokonami, S.; Takahashi, H.; Kobayashi, Y.; Zhuo, W. Up-to-date radon-thoron discriminative detector for a large-scale survey. Rev. Sci. Instrum. 2005, 76, 113505. [Google Scholar] [CrossRef]
- Pressyanov, D.; Dimitrov, D.; Georgiev, P. A sensitive DVD-based radon and thoron detector for environmental monitoring. Measurement 2022, 203, 112026. [Google Scholar] [CrossRef]
- Pressyanov, D.; Buysse, J.; Van Deynse, A.; Poffijn, A.; Meesen, G. Indoor radon detected by compact discs. Nucl. Instrum. Methods 2001, A 457, 665–666. [Google Scholar] [CrossRef]
- Pressyanov, D. Retrospective measurements of thoron and radon by CDs/DVDs: A model approach. Radiat. Prot. Dosim. 2012, 149, 464–468. [Google Scholar] [CrossRef]
- Vancraeynest, G.; Franchoo, S.; Huyse, M.; Moons, R. Optimization and modeling of electrochemically etched polycarbonate track detectors. Nucl. Instrum. Methods 1997, B 129, 65–72. [Google Scholar] [CrossRef]
- Dimitrova, I.; Mitev, K.; Pressyanov, D.; Georgiev, S.; Boshkova, T. Measurement of 222Rn and 226Ra in water by absorption of radon in polycarbonates and etching alpha-tracks. Radiat. Meas. 2011, 46, 119–127. [Google Scholar] [CrossRef]
- Pressyanov, D. Use of polycarbonate materials of high radon absorption ability for measuring radon. Rom. J. Phys. 2013, 58, S221–S229. [Google Scholar]
- Mitev, K.; Madzhunkov, Y.; Gerganov, G.; Dimitrova, I.; Georgiev, S.; Pressyanov, D. Automatic counting of electrochemically etched tracks in compact discs. Application to retrospective measurements of Rn-222. IEEE Trans. Nucl. Sci. 2010, 57, 300–308. [Google Scholar] [CrossRef]
- Pressyanov, D.; Mitev, K.; Georgiev, S.; Dimitrova, I.; Kolev, J. Laboratory facility to create reference radon + thoron atmosphere under dynamic exposure conditions. J. Environ. Radioact. 2017, 166, 181–187. [Google Scholar] [CrossRef] [PubMed]
- MetroRADON. Deliverable 2, Annexes IV. Available online: http://metroradon.eu (accessed on 24 July 2024).
- Sabot, B.; Pierre, S.; Michielssen, N.; Bondiguel, S.; Cassette, P. A new thoron atmosphere reference measurement system. Appl. Radiat. Isot. 2016, 109, 205–209. [Google Scholar] [CrossRef] [PubMed]
- Joint Committee for Guides in Metrology (JCGM). Evaluation of Measurement Data—Guide to the Expression of Uncertainty in Measurement; JCGM Publication: Sèvres, France, 2008; pp. 18–19. Available online: https://www.bipm.org/en/committees/jc/jcgm/publications (accessed on 15 August 2024).
- Hammer, Ø.; Harper, D.A.T.; Ryan, P.D. PAST: Paleontological statistics software package for education and data analysis. Paleont. Electron. 2001, 4, 4. [Google Scholar]
- Dimitrov, D.; Pressyanov, D. The CD/DVD method as a tool for the health physics service and ventilation diagnostics in underground mines. Radiat. Prot. Dosim. 2018, 181, 30–33. [Google Scholar] [CrossRef]
- Serge, A.B.M.; Didier, T.S.S.; Samuel, B.G.; Kranrod, C.; Omori, Y.; Hosoda, M.; Saïdou; Tokonami, S. Assessment of radiological risks due to indoor radon, thoron and progeny, and soil gas radon in thorium-bearing areas of the centre and south regions of Cameroon. Atmosphere 2023, 14, 1708. [Google Scholar] [CrossRef]
- Nuhu, H.; Hashim, S.; Syazwan, M.; Sanusi, M.; Saleh, M.A.M. Radiological assessment subjected to outdoor radon and thoron concentrations and terrestrial gamma radiation measurements in Perak Malaysia. Appl. Radiat. Isot. 2022, 179, 109991. [Google Scholar] [CrossRef] [PubMed]
- Burghele, B.; Cucos, A.; Papp, B.; Dicu, T.; Pressyanov, D.; Dimitrov, D.; Dimitrova, I.; Constantin, S. Comparative study of radon and thoron measurements in four Romanian show caves. Radiat. Prot. Dosim. 2017, 177, 181–185. [Google Scholar] [CrossRef]
- Bonczyk, M.; Chałupnik, S.; Wysocka, M.; Grygier, A.; Hildebrandt, R.; Tosheva, Z. The determination of radon/thoron exhalation rate in an underground coal mine—Preliminary results. Int. J. Environ. Res. Public Health 2022, 19, 6038. [Google Scholar] [CrossRef]
- IEC 61577-2; Radiation Protection Instrumentation—Radon and Radon Decay Product Measuring Instruments—Part 2: Specific Requirements for 222Rn and 220Rn Measuring Instruments. International Electrotechnical Commission (IEC): Geneva, Switzerland, 2014.
- Di Carlo, C.; Ampollini, M.; Antignani, S.; Caprio, M.; Carpentieri, C.; Bochicchio, F. Thoron interference on performance of continuous radon monitors: An experimental study on four devices and a proposal of an indirect method to estimate thoron concentration. Int. J. Environ. Res. Public Health 2022, 19, 2423. [Google Scholar] [CrossRef]
- Karthik Kumar, M.B.; Nagaiah, N.; Mathews, G.; Ambika, M.R. Assessment of annual effective dose due to outdoor radon activity in the environment of Bengaluru. Radiat. Prot. Environ. 2018, 41, 115–118. [Google Scholar]
- Cinelli, G.; De Cort, M.; Tollefsen, T. (Eds.) European Atlas of Natural Radiation, European Commission; Publication Office of the European Union: Luxembourg, 2019. [Google Scholar]
Disclaimer/Publisher’s Note: The statements, opinions and data contained in all publications are solely those of the individual author(s) and contributor(s) and not of MDPI and/or the editor(s). MDPI and/or the editor(s) disclaim responsibility for any injury to people or property resulting from any ideas, methods, instructions or products referred to in the content. |
© 2024 by the authors. Licensee MDPI, Basel, Switzerland. This article is an open access article distributed under the terms and conditions of the Creative Commons Attribution (CC BY) license (https://creativecommons.org/licenses/by/4.0/).