Article

Characterizing Industrial VOC Hotspots in One of Eastern China’s Largest Petrochemical Parks Using Mobile PTR–ToF–MS Measurements

Collaborative Innovation Center of Atmospheric Environment and Equipment Technology, Jiangsu Key Laboratory of Atmospheric Environment Monitoring and Pollution Control, School of Environmental Science and Engineering, Nanjing University of Information Science and Technology, Nanjing 210044, China
*
Author to whom correspondence should be addressed.
Atmosphere 2025, 16(1), 104; https://doi.org/10.3390/atmos16010104
Submission received: 28 November 2024 / Revised: 20 December 2024 / Accepted: 16 January 2025 / Published: 18 January 2025
(This article belongs to the Special Issue Industrial Emissions: Characteristics, Impacts and Control)

Abstract

:
The industrial emissions of volatile organic compounds (VOCs) are a major contributor to air pollution in urban areas. Previous studies on VOC emissions in industrial zones have primarily relied on in situ monitoring techniques, which pose significant challenges in capturing high emissions peaks and near-source measurements on regional scales. In this study, we employed mobile proton transfer reaction–time-of-flight–mass spectrometry (PTR–ToF–MS) to identify and characterize industrial VOC hotspots in a petrochemical park in eastern China, from June to September 2021. The average total VOC concentrations in the industrial zone were 131.5 ± 227.7 ppbv, approximately 48% higher than those in the background area (88.9 ± 63.3 ppbv), reflecting the substantial emissions from industrial hotspots. Oxygenated VOCs were the most abundant components in the industrial zone (83.2 ppbv). The overall OH reactivity, aerosol formation potential, and lifetime cancer risk of the industrial zone were also substantially higher than those in the background zone. These findings emphasize the need for targeted VOC emissions controls in industrial hotspots to mitigate air quality and health risks.

1. Introduction

Volatile organic compounds (VOCs) are organic compounds with small molecular weights, high vapor pressures, and the tendency to evaporate at ambient temperatures [1]. As key precursors to secondary organic aerosols (SOAs) and ozone (O3), VOCs significantly influence their formation through a series of oxidation reactions with hydroxyl radicals (OH) in the atmosphere [2,3,4]. As one of the world’s largest developing countries, China has experienced rapid urban and industrial development, leading to increasingly severe VOC pollution. This not only impacts the natural environment but also poses significant health risks to humans [5,6,7]. In particular, industrial zones, often referred to as VOC hotspots, are critical areas of concern due to their high emissions density and diverse VOC sources. These hotspots significantly contribute to urban air pollution; the control of VOC emissions in such areas has become a crucial step for improving air quality and mitigating health risks [8,9,10].
VOCs have complex sources that are categorized into natural and anthropogenic origins [11,12], with human activities being the primary cause of urban VOC pollution [13,14,15]. Among the various anthropogenic emissions sources, industrial processes play a significant role in VOCs, especially in areas with the high emissions density of VOC hotspots. [16,17]. The contribution of VOCs from various industrial processes differs; understanding the key components and sources within these hotspots is crucial for effective pollution control. For instance, studies in Nanjing and the broader Yangtze River Delta have revealed that industries, such as furniture manufacturing, mechanical equipment, and oil refining, contribute significantly to local VOC emissions [18,19]. The monitoring results of VOCs in the industrial area of Houston, USA, showed that average VOC concentrations are dominated by alkane compounds, with anthropogenic sources of VOCs primarily influenced by oil, gas, and natural gas activity factors [20]. A study in Ulsan, South Korea, indicated that the total VOC concentrations in the industrial area were about four times higher than those in the city center, with oxygenated hydrocarbons accounting for the highest proportion [21]. Research in Dunkirk, France, showed that industrial activities, such as metallurgy, petrochemicals production, and coal combustion, are the main sources of VOCs in the region [22]. Industrial production is a key hotspot for the intensive emissions of VOCs, which require close monitoring and the development of targeted control strategies to reduce their impacts on atmospheric pollution [23,24,25,26].
In addition to their environmental impacts, VOCs pose serious health risks, affecting the respiratory, cardiovascular, and nervous systems [27,28]. Research has shown that VOCs from industrial processes, such as chloroform and benzene, are key contributors to both carcinogenic and non-carcinogenic health risks [17,29]. VOC hotspots in industrial parks represent regions with elevated concentrations of harmful VOCs; assessing these risks is essential for public health protection.
Traditional VOC monitoring methods, such as offline derivatization (DNPH-HPLC) or online gas chromatography–mass spectrometry (GC–MS), are limited by factors such as high detection limits, long sampling times, and limited species detection [30,31,32,33]. These methods often struggle to effectively capture the complex emissions profiles of industrial hotspots. Proton transfer reaction–time-of-flight–mass spectrometry (PTR–ToF–MS), however, offers several advantages in this regard. PTR–ToF–MS provides higher sensitivity, lower detection limits, and the ability to quickly identify and quantify a wide range of VOCs with high temporal resolution [34,35]. Furthermore, PTR–ToF–MS does not require carrier gases or specialized media, making it ideal for real-time, mobile monitoring in industrial environments. This ability to capture VOC emissions across different industrial VOC hotspots is crucial for identifying pollution sources, assessing health risks, and guiding pollution control strategies.
This study aims to explore the VOC emissions characteristics, OH reactivity (OHR), secondary organic aerosol formation potential (SOAFP), and health risks in a typical industrial park in Jiangsu Province, China, from June to September 2021, using high-resolution, mobile PTR–ToF–MS measurements. By focusing on VOC hotspots within industrial regions, this research provides critical insights into VOC emissions sources, their chemical reactivity, and the associated health risks. This is vital for developing targeted strategies to manage VOC emissions and mitigate their impact on air quality and public health in high-emissions industrial zones.

2. Methods

2.1. Sampling Site and Instrumentation

The location of this study is the Lianyungang petrochemical industrial base, situated in the XuWei New District of Lianyungang City, Jiangsu Province, China (34.56° N, 119.58° E). It is one of the largest and fastest-developing coastal petrochemical industrial bases in China. The base features a complete industrial chain, with integrated refineries, ethylene production, and aromatic hydrocarbon factories, as well as diversified raw material processing workshops. Additionally, there are numerous enterprises producing clean energy, organic raw materials, and synthetic materials, making it a large-scale refining and chemical industrial complex with a multi-product cluster.
The online mobile VOC measurements were conducted using proton transfer reaction–time-of-flight–mass spectrometry (PTR–ToF–MS) [36,37], a technique known for its high temporal resolution, low detection limits (at the pptv level), excellent stability, and long endurance capabilities. The technical parameters of the PTR–ToF–MS system used for this study are summarized in Table 1.
This high-resolution, real-time monitoring system is particularly well-suited for studying VOC hotspots in industrial environments, where emissions densities are high and the VOC composition is complex. By utilizing PTR–ToF–MS, we can effectively capture and quantify VOC emissions from a variety of sources within the industrial base, offering critical insights into pollution profiles in VOC hotspot regions. The working principle of PTR–ToF–MS relies on the proton affinity of VOCs (see Equation (1)). H3O+ ions, acting as the reagent ions, enter the reaction chamber, where they interact with the target gas (M) to induce a soft ionization reaction. As a result, the target components are ionized, generating the target ion MH+. These ions are then transmitted downstream through an ion mirror to a high-vacuum flight time chamber in the mass spectrometer. In the chamber, ions are separated based on their mass-to-charge (m/z) ratio; the resulting peaks in the mass spectrum are used for both qualitative and quantitative analyses of the VOC species and their concentrations in the measured air sample [38]. The formula used is as follows:
H 3 O + + M M H + + H 2 O ,
The PTR–ToF–MS was supported by Tofwerk software (version 3.0.2: Tofwerk AG, Switzerland), which stores raw data in HDF5 format, including the mass spectra and associated instrument metadata [39]. The data were then processed using Tofware software (version 3.0.2: Tofwerk AG, Thun, Switzerland) for mass axis calibration, baseline determination, peak width and shape fitting, and peak analysis [40]. Further data processing, including background subtraction, humidity correction, and concentration calculations, was carried out using IGOR Pro software (version 8.04: WaveMetrics, Inc, Portland, OR, USA), resulting in the final concentrations of VOC species in the ambient air.
This study defined two research areas: the industrial park area (34.50–34.58° N, 119.53–119.64° E); and the background area, which includes locations outside the industrial park that primarily consist of major roads and residential areas. The study period lasted from 6 May to 30 September 2021. During this time, three mobile monitoring sessions were conducted each day, with each session lasting two hours: from 9:00 to 11:00, 13:00 to 15:00, and 16:00 to 18:00. Additionally, two flexible work periods were reserved within each session, allowing for high-value data analysis and on-site inspection of the enterprises. The average temperature during the monitoring period was 24.4 °C, with a relative humidity of 79.4% and an average wind speed of 3.4 m/s. Figure S1 shows the wind rose diagram of Xuwei Industrial Park in Lianyungang. The prevailing wind directions in Lianyungang were easterly, southeasterly, and northeasterly winds. The sampling routes mainly followed the downwind direction, covering the upwind direction, and were conducted under wind speeds below level 4, with no rainfall. Based on the center of the industrial park, when the wind is from the northeast, southeast, or east, the key routes extend 1 km eastward. When the prevailing wind is from the northwest, southwest, or west, the key routes extend 1 km westward. The sampling routes comprehensively cover the entire industrial park. In the event of a sudden increase in VOC concentrations, the monitoring is carried out from the downwind to the upwind direction, moving towards the source of pollution. A total of 55 hydrocarbon compounds (CxHy); 78 oxygenated VOCs (OVOCs); 42 nitrogen-containing VOCs; and 10 sulfur/chlorine-containing VOCs were measured (Table S1). This comprehensive VOC monitoring is crucial for characterizing the emissions from VOC hotspots in industrial environments and provides valuable data for assessing the impact of industrial activities on local air quality.

2.2. OH Reactivity and SOAFP

In this study, we calculated two key indicators of atmospheric reactivity, hydroxyl radical (OH) reactivity and secondary organic aerosol formation potential (SOAFP), to assess the contribution of VOCs to ozone formation and secondary aerosol generation. The contribution of VOCs to ozone formation depends on the reaction rate of each volatile organic compound with OH radicals in the daytime troposphere, known as OH reactivity [41]. OH reactivity is calculated as follows [42]:
O H R i = V O C s i × k O H i ,
where O H R i is the OH reactivity of species i (units: s−1), V O C s i is the concentration of species i (units: mol cm−3), and k O H i is the reaction rate constant of species i with OH radicals (units: cm3 mol−1 s−1). The values for different species can be found in Table S1. The OH reactivity of the VOCs indicates their potential to contribute to ozone formation, with higher reactivity corresponding to a greater contribution.
The SOAFP quantifies the potential ability of VOCs to form secondary organic aerosols (SOA). It provides an estimate of the contribution of individual precursors to SOA formation and allows for the preliminary quantification of the relative importance of these precursors [43,44,45]. The SOAFP is calculated as follows:
S O A F P i = V O C s i × S O A P i ,
where S O A F P i is the SOAFP value for species i (units: μg·m−3), V O C s i is the concentration of species i (units: μg·m−3), and S O A P i is the SOA formation potential parameter for species i (unitless), derived from McDonald et al. [46]. By calculating the SOAFP, we can estimate how much each VOC species contributes to potential SOA formation, which is critical for understanding the role of industrial VOC hotspots in local air quality and aerosol loading. The combined analysis of OH reactivity and SOAFP provides insights into both the photochemical and aerosol-forming potentials of VOCs in the industrial park environment.

2.3. Health Risk Assessment

For health risk assessment, the methods recommended by the U.S. Environmental Protection Agency (EPA) and the International Agency for Research on Cancer (IARC) in the Integrated Risk Information System (IRIS) for evaluating the carcinogenic risk (lifetime carcinogenic risk, LCR) of specific pollutants have been widely used [47]. In this study, we considered 21 known carcinogenic VOCs with toxicity values. The formula for calculating the LCR for a specific VOC is as follows:
E C i = V O C s i × E T × E F × E D A T ,
L C R = I U R × E C ,
where E C i is the exposure concentration of species i (units: μg·m−3) while V O C s i is the concentration of species i in μg·m−3. The exposure time (ET) is the average outdoor exposure time for Chinese adults, which is 3.7 h per day, and the exposure frequency (EF) is 365 days per year. The exposure duration (ED) reflects the average life expectancy of Chinese individuals, which is 74.8 years. The average time (AT) is calculated as 74.8 × 365 × 2474.8 h, corresponding to a typical lifespan of 74.8 years. These data, including exposure factors, were sourced from the Chinese Ecological and Environmental Ministry’s exposure factor manual for the Chinese adult population [48]. Finally, the inhalation unit risk (IUR) is a factor obtained from the U.S. Environmental Protection Agency [49], with the units of m3·μg−1 used to quantify the carcinogenic risk based on inhalation exposure to the specific VOCs. This study identified 21 VOCs with carcinogenic risks in the industrial and background areas, with detailed information provided in Table S2.
The LCR provides a quantitative measure of the potential cancer risk associated with long-term exposure to VOCs in industrial environments, particularly in hotspots such as the studied petrochemical industrial base. The assessment highlights the importance of controlling VOC emissions in industrial areas to mitigate both environmental and human health risks, especially in regions with high industrial VOC concentrations. This risk evaluation is crucial for formulating effective air-quality management policies and setting emissions standards that protect public health.

3. Results and Discussion

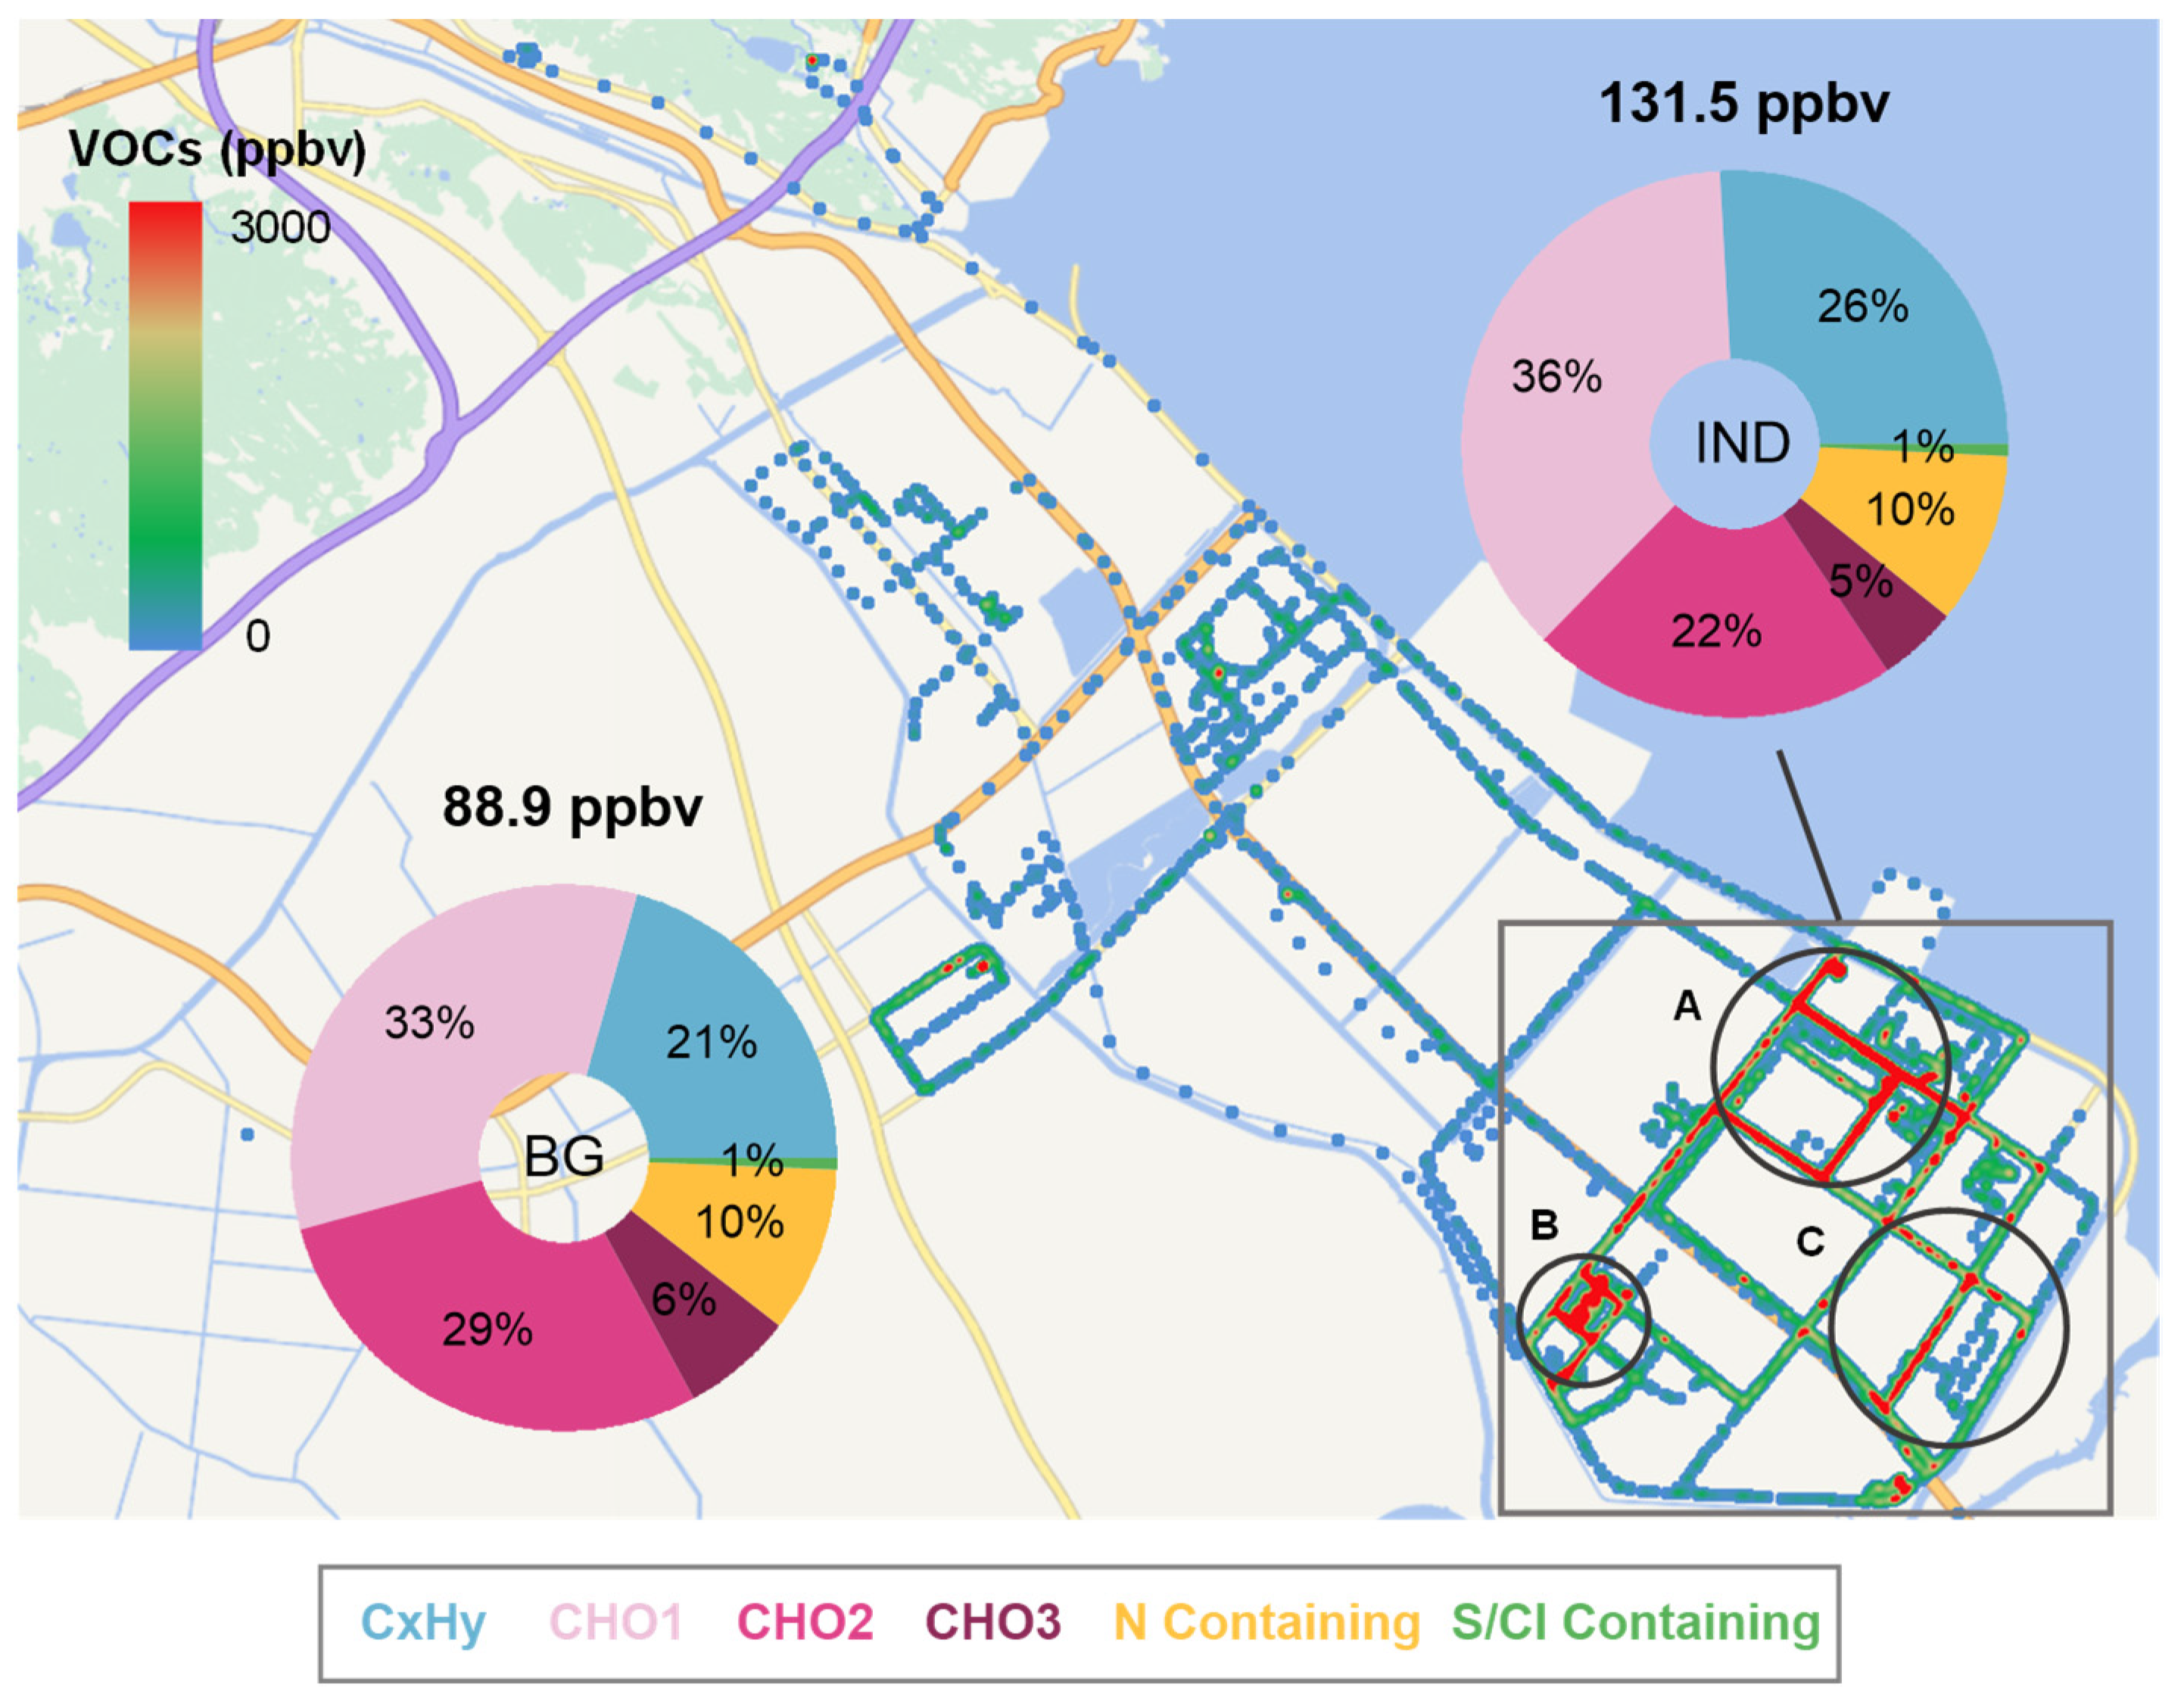
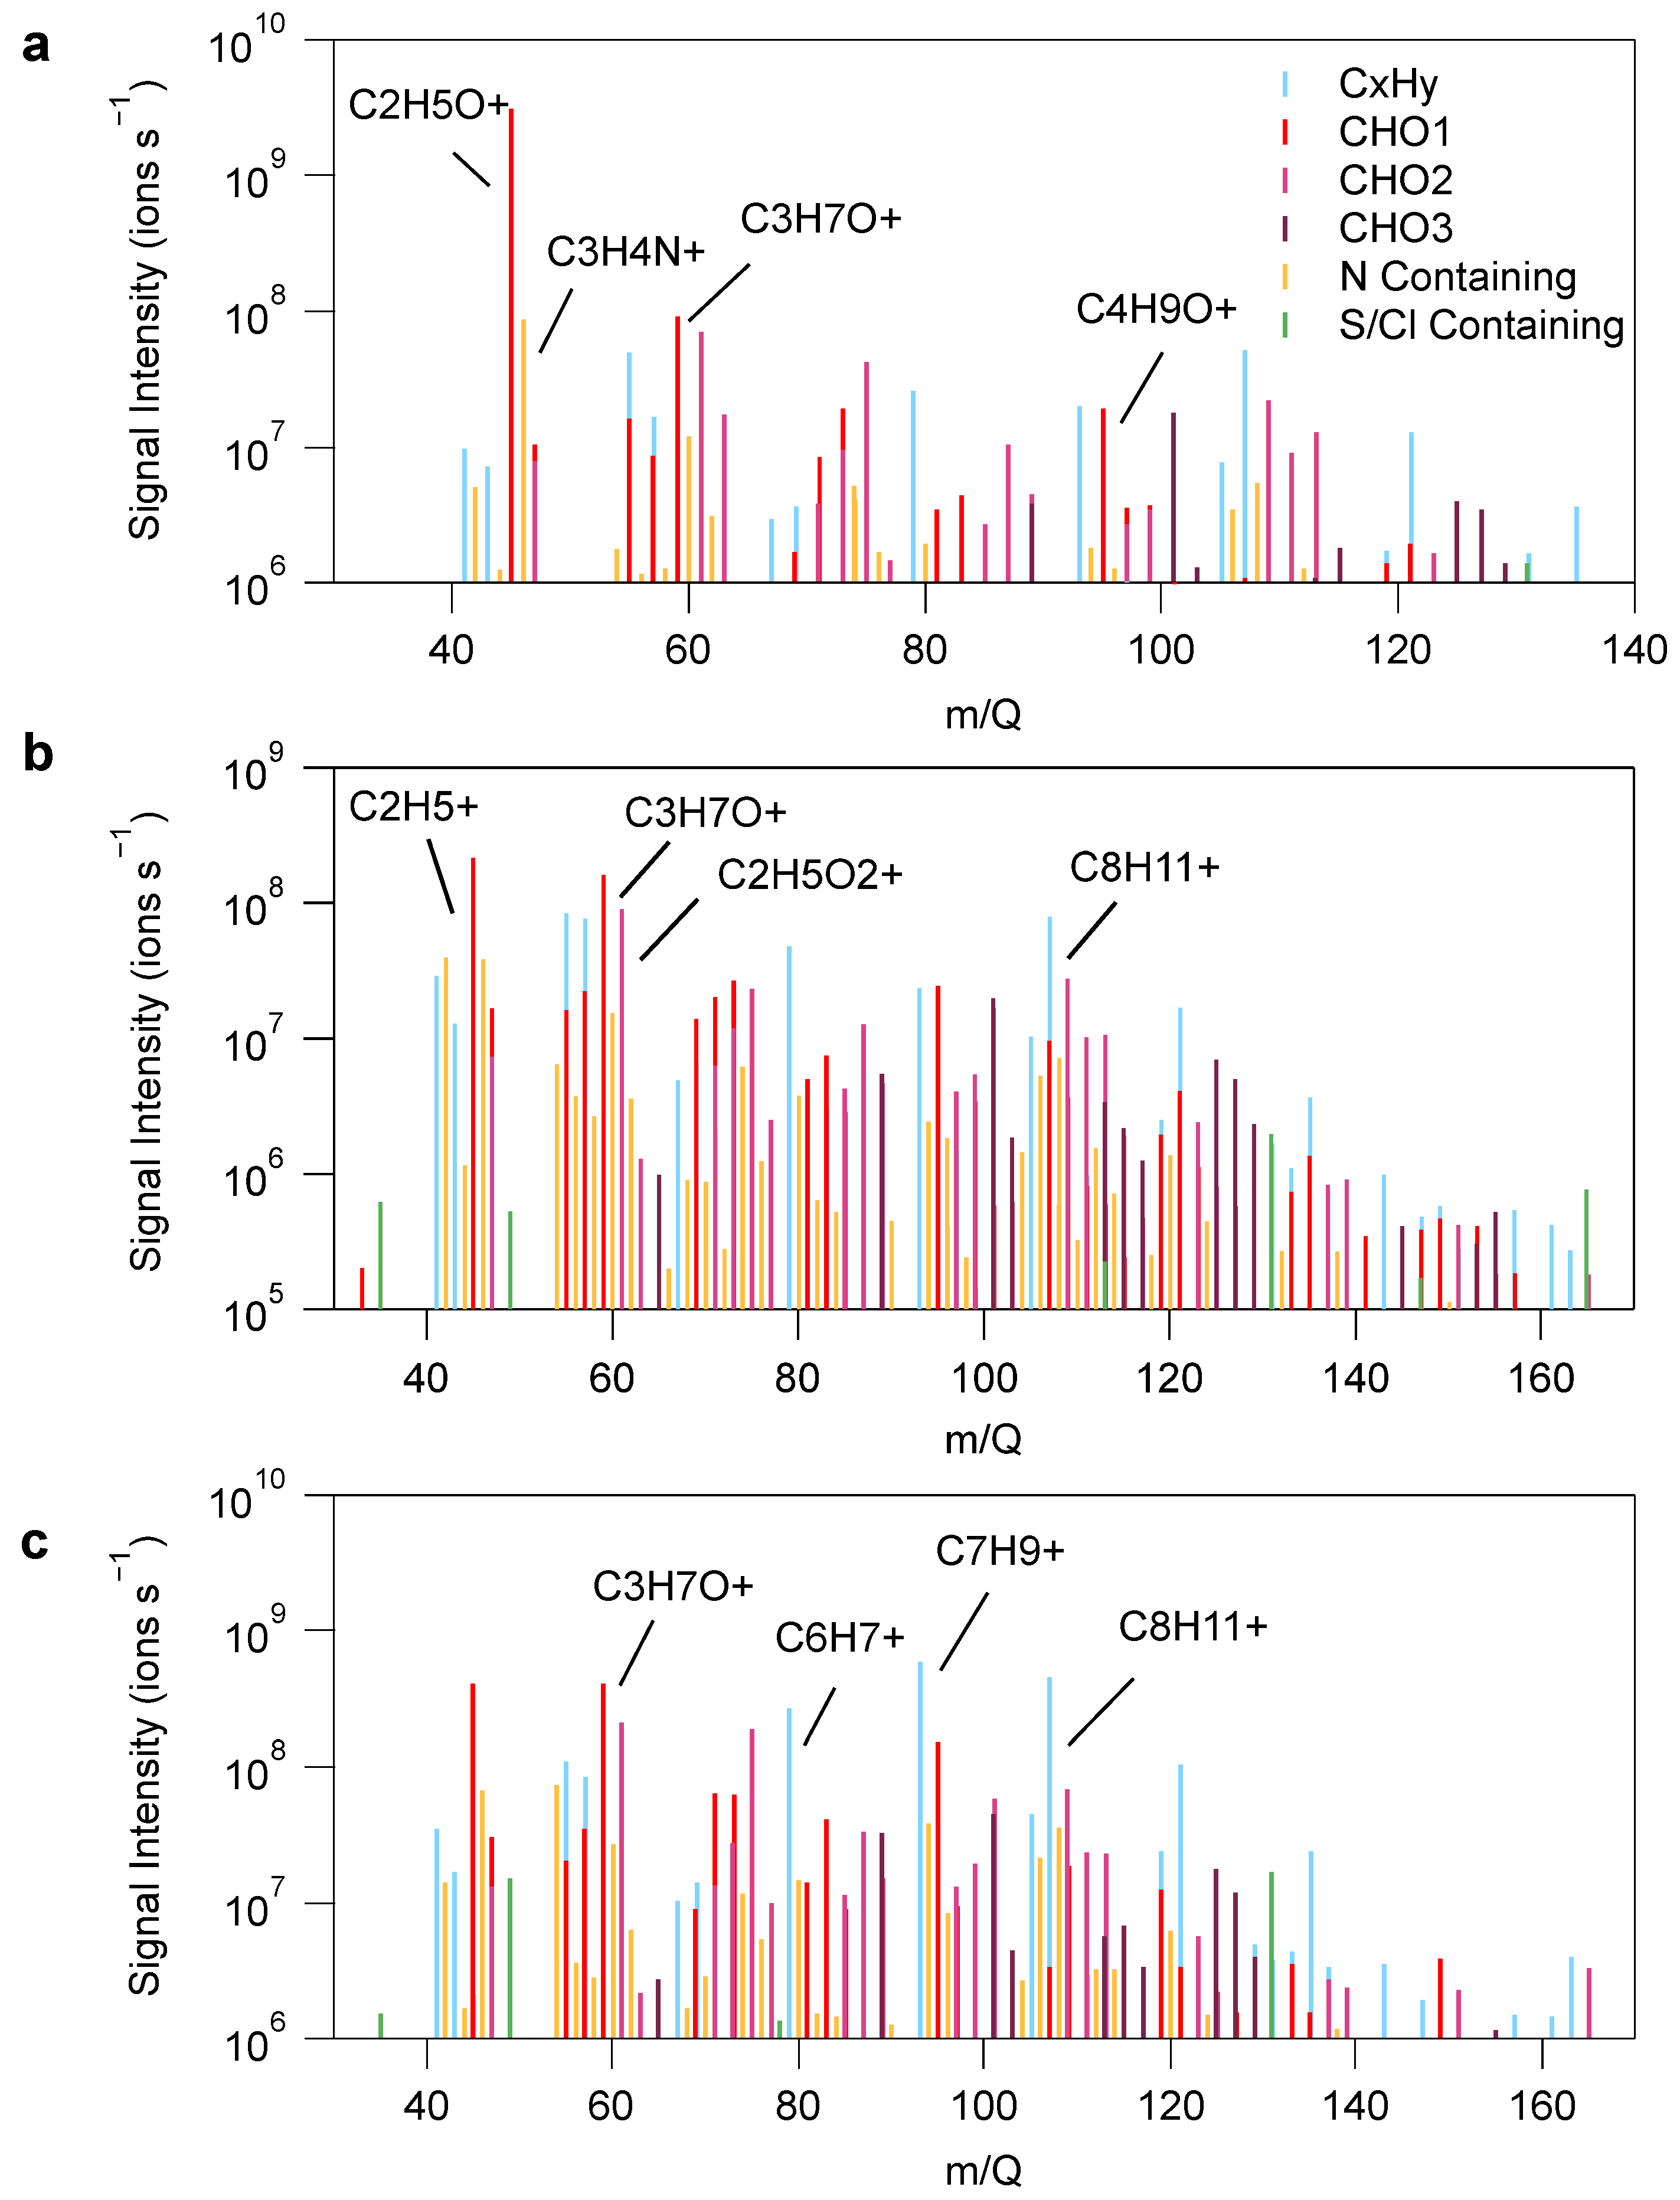
3.1. VOC Emissions Characteristics

Figure 1 presents the spatial distribution of VOC concentrations in the Lianyungang Xuwei Industrial Park, along with heat maps and pie charts showing the relative proportions of various VOC species in both the industrial (IND) and background (BG) zones. The industrial zone is outlined in the gray box, while the remaining sampling points correspond to the background region. During the observation period, the average total VOC (TVOC) concentrations in the industrial zone were 131.5 ± 227.7 ppbv, with hydrocarbons (CxHy) contributing 34.0 ppbv, oxygenated VOCs with one oxygen atom (CHO1) contributing 48.4 ppbv, oxygenated VOCs with two oxygen atoms (CHO2) contributing 28.6 ppbv, oxygenated VOCs with three oxygen atoms (CHO3) contributing 6.2 ppbv, nitrogen-containing species contributing 13.4 ppbv, and sulfur/chlorine-containing species contributing 0.9 ppbv. In contrast, the average TVOC concentrations in the background area were 88.9 ± 63.3 ppbv, with CxHy at 18.4 ppbv, CHO1 at 29.8 ppbv, CHO2 at 25.5 ppbv, CHO3 at 5.8 ppbv, nitrogen-containing species at 8.7 ppbv, and sulfur/chlorine-containing species at 0.6 ppbv. The TVOCs concentration in the industrial zone were approximately 48% higher than in the background area, with concentrations of all VOC species in the industrial zone being higher than those in the background zone.
Both in the industrial and background areas, CHO1 was the most abundant VOC species, accounting for 36% in the industrial zone and 33% in the background zone. Hy-drocarbons (CxHy) were the second most prevalent VOC species in the industrial zone (26%), compared to 21% in the background zone. CHO2 species had a higher proportion in the background zone (29%) than in the industrial zone (22%). The proportions of nitro-gen-containing species (10%) and CHO3 species (5–6%) were similar in both zones. Sul-fur/chlorine-containing species, which are associated with odorous compounds, were found in minimal concentrations in both the industrial (1%) and background (1%) zones.
Three high-concentration VOC hotspots (A, B, and C) were identified in the industrial area. In Region A, high concentrations of substances, such as acetaldehyde, acetone, and acrylonitrile were detected; their mass spectrum profiles are shown in Figure 2a. These may be related to emissions from chemical synthesis and chemical storage facilities in the area. Region B shows high levels of OVOCs, such as acetaldehyde and ethanol, with their mass spectrum profiles shown in Figure 2b. These are primarily associated with several nearby chemical production enterprises. In Region C, the mass spectrum profile is shown in Figure 2c, where toluene, xylene, and other VOCs are the predominant species. The high concentrations in this area are likely related to nearby plastic manufacturing and paint solvent production plants. The results of this study on industrial hotspots are similar to those of a study on a typical chemical industrial park in eastern China [50], where OVOCs are the most abundant volatile organic compounds (VOCs). The study conducted in the Lanzhou industrial area [51] showed that oxygenated VOCs, such as methanol, acetaldehyde, and acetic acid, have a higher mixing ratio, which is consistent with the findings of this study. The total VOC concentrations in this study were lower than that found in a study of oil tanks in the Wuhan [52] industrial area (4630 μg/m3), but slightly higher than those in a chemical park in the Yangtze River Delta (73.2 ± 39.4 ppbv) [53]. VOC hotspots in industrial areas highlight the significant impact of local industrial emissions on air quality, emphasizing the need for targeted emissions controls and monitoring strategies in these areas.

3.2. OH Reactivity of VOCs

Once emitted into the atmospheric environment, VOCs undergo a series of complex chemical reactions with oxidants such as OH radicals, leading to the consumption of most VOCs and the formation of some oxygenated organic compounds. OH reactivity (OHR) serves as a comprehensive metric to evaluate the concentration of reactive species in the atmosphere that can interact with OH radicals [54]. Figure 3 shows the top 20 VOC species contributing to OHR in both the industrial and background zones, as well as the overall composition of OHR contributors. The average total OHR in the industrial zone was 51.3 ± 68.7 s−1, compared to 35.8 ± 21.9 s−1 in the background zone, which is approximately 43% higher in the industrial area. The contributions of different VOC species to the OHR in the industrial zone were as follows: CHO1 (36%), CxHy (28%), CHO2 (19%), CHO3 (11%), nitrogen-containing species (5%), and sulfur/chlorine-containing species (1%). In the background zone, CHO1 (33%) was also the dominant contributor to OHR, but CxHy (22%) had a slightly lower contribution compared to CHO2 (23%). This shift was largely driven by the higher OHR contributions from aromatic hydrocarbons such as o-xylene (3.5 s−1), 1,2,3-trimethylbenzene (1.9 s−1), and styrene (1.9 s−1) in the industrial area.
The industrial zone also featured several VOC hotspots with notably higher concentrations of specific VOCs. For example, acetaldehyde was the species with the highest OHR contribution in both the industrial and background zones; however, its OHR value in the industrial area (7.5 s−1) was much higher than in the background zone (2.8 s−1). O-xylene also made a significant contribution to OHR in the industrial zone, with a value of 3.5 s−1, whereas in the background zone, it was only 0.9 s−1. Phenol contributed notably to OHR in both zones, with values of 3.1 s−1 in the industrial zone and 2.5 s−1 in the background zone. Among the CHO2 species, methyl furfural contributed the most to OHR, with comparable values in both zones (2.2 s−1 in the industrial zone and 2.1 s−1 in the background zone). Hydroxymethyl furfural was the dominant contributor in the CHO3 group, with its OHR value slightly higher in the background zone (2.4 s−1) than in the industrial zone (1.9 s−1). Compared to other studies in urban areas, the OHR value in this study’s industrial area is higher than that in Beijing (20 ± 11 s−1) [55] and Wangdu (40 s−1) [56].
The VOC hotspots within the industrial zone contributed significantly to the overall OHR, particularly in areas with intense chemical manufacturing and processing activities. In these hotspot areas, compared to the surrounding regions, VOC species such as acetaldehyde, toluene, and xylene exhibit higher OHR values. Vinylpyridine (0.8 s−1), a nitrogen-containing compound, was also found to contribute to OHR in the industrial zone, albeit to a lesser extent. The higher concentrations of VOCs in these industrial hotspots suggest that they play a crucial role in driving the regional OH reactivity. Therefore, to better manage and mitigate OHR levels, it is essential to focus on controlling emissions from key VOC hotspots within the industrial zone, particularly for VOCs such as acetaldehyde and o-xylene.

3.3. SOA Formation Potential of VOCs

VOCs play a crucial role in tropospheric photochemical reactions, and the secondary organic aerosol formation potential (SOAFP) is a key metric used to evaluate the potential of VOCs to form secondary organic aerosols (SOA) after photochemical reactions with free radicals in the atmosphere [57]. Figure 4 presents the top 10 species contributing to SOAFP, along with the relative contributions of each species in the industrial zone (IND) and the background zone (BG). The average total SOAFP in the industrial zone was 4605.8 μg/m3, which is approximately 124% higher than the average total SOAFP of 2053.4 μg/m3 in the background zone. Compared to other studies, the SOAFP in this study’s industrial area is higher than Wuhan (447.04 ± 253.85 ppb) [44], while the SOAFP in Beijing (2885.1 μg/m3) falls between the levels observed in the industrial and background areas of this study [58].
In both the industrial and background zones, aromatic compounds were the largest contributors to the SOAFP, followed by oxygenated VOCs (OVOCs) and aliphatic compounds. The substantial difference in SOAFP values between the two zones can primarily be attributed to the higher concentrations of aromatic compounds in the industrial zone. The top three contributors to the SOAFP in the industrial zone were styrene (1323.1 μg/m3), toluene (1053.8 μg/m3), and benzene (807.6 μg/m3), all of which are aromatic compounds. These three species together accounted for 69% of the total SOAFP in the industrial zone. Compared to the background zone, the contributions of these compounds were significantly higher, with styrene, toluene, and benzene being 169%, 154%, and 121% higher, respectively. Benzaldehyde, an OVOCs compound, also contributed significantly to the SOAFP in both the industrial zone (801.6 μg/m3) and the background zone (555.8 μg/m3). Furthermore, although aliphatic compounds contributed less overall to the SOAFP (2%), α-pinene (35.2 μg/m3) and 1,3-butadiene (31.1 μg/m3) in the industrial zone made notable contributions.
In terms of VOC hotspots, the industrial zone exhibited three distinct regions with significantly elevated VOC concentrations, which likely contribute to the high SOAFP levels. Region A showed high concentrations of acetaldehyde, acetone, and acrylonitrile, likely emitted by local chemical synthesis and chemical storage industries. Region B, characterized by high levels of acetaldehyde and ethanol, was influenced by several chemical manufacturing plants. In Region C, the primary VOC species were toluene and xylene, with nearby plastic manufacturing and coating solvent companies contributing to these elevated concentrations. These findings underscore the importance of controlling the emissions of aromatic compounds and certain OVOCs, especially in industrial hotspot areas, to mitigate SOA pollution and reduce the atmospheric formation of secondary organic aerosols in the region.

3.4. Health Risk Assessment of VOCs

In addition to their photochemical effects on the atmosphere, certain VOCs are toxic and pose various carcinogenic risks to human health. We analyzed the carcinogenic risks of 21 identified carcinogenic species found in the industrial zone and background zone, which included 7 nitrogen-containing species, 4 chlorine-containing species, 4 CxHy compounds, and 6 OVOCs. The acceptable and tolerable safety thresholds for lifetime carcinogenic risk (LCR) are set at 1 × 10⁻⁶ and 1 × 10⁻⁴, respectively [59]. As shown in Figure 5, the average total LCR in the industrial zone was (9.0 ± 7.4) × 10−4, compared to (7.6 ± 5.1) × 10−4 in the background zone, which means that the average total LCR was about 18.4% higher in the industrial zone.
In the industrial zone, 13 VOCs exceeded the acceptable safety threshold, with one compound exceeding the tolerable safety threshold. In the background zone, 12 VOCs surpassed the acceptable safety threshold, with one exceeding the tolerable threshold. Despite its relatively low concentrations, the nitrogen-containing group contributed the most to the LCR in both the industrial and background zones, followed by CxHy compounds. The species exceeding the tolerable threshold in both zones was ethanimine, with the industrial zone value (6.8 × 10⁻⁴) slightly higher than that of the background zone (6.1 × 10⁻⁴). Within the acceptable safety threshold, 1,3-butadiene contributed the most to the LCR in both zones, with values of (8 × 10⁻⁵) in the industrial zone and (7.8 × 10⁻⁵) in the background zone. In addition, OVOCs, such as acetaldehyde and acetone, made notable contributions to the LCR. In addition, OVOCs such as acetaldehyde and acetone also contribute to the LCR. The LCR characteristics of the industrial park in this study differ from those of other studies. The LCR value is lower than that of the Wuhan chemical industrial park, where 1,3-butadiene posed the highest carcinogenic risk (6.7 × 10⁻³) [60]. It is higher than that of the coke industry park in north China (3.6 − 15.0 × 10⁻⁶), where VOCs, such as benzene and 1,2-dichloropropane, presented higher carcinogenic risks [61].
The industrial zone, particularly certain hotspot, such as those near chemical synthesis, storage facilities, and plastic manufacturing industries, exhibited elevated concentrations of VOCs, such as ethanimine, 1,3-butadiene, and benzene, which significantly contributed to the LCR values. These hotspots not only amplify the overall health risk in the industrial zone but also highlight critical areas for targeted emissions control. These results underline the importance of reducing VOC emissions from key industrial sources, especially in VOC hotspots, to mitigate their carcinogenic effects and reduce health risks to the local population.

4. Conclusions and Implications

This study, utilizing mobile PTR–ToF–MS technology, monitored VOC emissions in typical industrial parks in Jiangsu Province from June to September 2021. The results revealed that the average TVOC concentrations in the industrial area were 131.5 ± 227.7 ppbv, approximately 48% higher than the background area’s TVOC concentrations of 88.9 ± 63.3 ppbv. Among the VOCs in the industrial area, OVOCs were the most abundant component (83.2 ppbv). The OHR in the industrial area was mainly driven by OVOCs and CxHy compounds, with the industrial area’s average OHR value (51.3 ± 68.7 s−1) being 43% higher than that of the background area (35.8 ± 21.9 s−1). The higher OHR in the industrial area was primarily attributed to aromatic compounds, such as o-xylene (3.5 s−1), 1,2,3-trimethylbenzene (1.9 s−1), and styrene (1.9 s−1), which are more prevalent in industrial hotspots.
For SOAFP, aromatic and OVOCs were the major contributors. The total SOAFP in the industrial area (4605.8 μg/m3) was about 124% higher than that in the background area (2053.4 μg/m3), largely due to the high concentrations of aromatic compounds. The total lifetime carcinogenic risk (LCR) in the industrial area was (9.0 ± 7.4) × 104, approximately 18.4% higher than that in the background area (7.6 ± 5.1) × 104. N-containing compounds and CxHy species were the primary contributors to LCR. Notably, 13 VOCs in the industrial area exceeded the acceptable safety threshold, with ethanimine (6.8 × 10⁴) exceeding the tolerable safety threshold.
These findings emphasize the need to focus on industrial VOC hotspots in areas with high emissions. Given the current context of emissions reduction efforts in China, it is essential to precisely target VOC emissions in these hotspot areas. In addition, further observation and research on the air quality, health risks, and potential climate effects in these hotspots are crucial. Such targeted actions will help to mitigate the harmful impacts of VOCs on both human health and the environment, ensuring that emissions reduction measures are effectively implemented in the areas that require the most attention.
This study also has some limitations. For example, although we employed mobile monitoring technology, we were unable to fully cover the entire observation area. Additionally, we only collected data on the spatial distribution of VOCs and did not capture vertical concentration profiles. Due to the mobile nature of our sampling approach, we lacked continuous fixed-point observations, which made it challenging to establish a direct statistical relationship between meteorological conditions and the observed VOC levels. These limitations should be considered and addressed in future studies.

Supplementary Materials

The following supporting information can be downloaded at: https://www.mdpi.com/article/10.3390/atmos16010104/s1, Table S1. The average concentration of VOCs and their OH reaction rate constant measured by PTR-ToF-MS in the industrial area (IND) and background area (BG); Table S2. The EC and IUR of 21 carcinogenic VOC species in the industrial area (IND) and background area (BG); Figure S1. Wind rose diagram of Xuwei Industrial Park in Lianyungang.

Author Contributions

Conceptualization, Y.Z.; methodology, J.F., Z.Z. and Y.Z.; software, J.F., Z.Z. and Y.Z.; validation, J.F., Z.Z. and Y.Z.; formal analysis, J.F. and Z.Z.; investigation, Y.Z.; resources, Y.Z.; data curation, J.F., Z.Z. and Z.L.; writing—original draft preparation, J.F., Z.Z. and Y.Z.; writing—review and editing, Y.Z., X.G. and M.W.; visualization, J.F., Z.Z. and Y.Z.; supervision, Y.Z.; project administration, Y.Z.; funding acquisition, Y.Z. All authors have read and agreed to the published version of the manuscript.

Funding

This study was supported by the National Natural Science Foundation of China (grant no. 42207124) and the Natural Science Foundation of Jiangsu Province (grant no. BK20210663).

Institutional Review Board Statement

Not applicable.

Informed Consent Statement

Not applicable.

Data Availability Statement

The dataset is available on request from Yunjiang Zhang (yjzhang@nuist.edu.cn).

Conflicts of Interest

The authors declare no conflicts of interest.

References

  1. Atkinson, R. Atmospheric chemistry of VOCs and NOx. Atmos. Environ. 2000, 34, 2063–2101. [Google Scholar] [CrossRef]
  2. De Gouw, J.; Middlebrook, A.; Warneke, C.; Goldan, P.; Kuster, W.; Roberts, J.; Fehsenfeld, F.; Worsnop, D.; Canagaratna, M.; Pszenny, A. Budget of organic carbon in a polluted atmosphere: Results from the New England Air Quality Study in 2002. J. Geophys. Res. Atmos. 2005, 110, D16305. [Google Scholar] [CrossRef]
  3. Ehn, M.; Thornton, J.A.; Kleist, E.; Sipilä, M.; Junninen, H.; Pullinen, I.; Springer, M.; Rubach, F.; Tillmann, R.; Lee, B.; et al. A large source of low-volatility secondary organic aerosol. Nature 2014, 506, 476–479. [Google Scholar] [CrossRef] [PubMed]
  4. Ziemann, P.J.; Atkinson, R. Kinetics, products, and mechanisms of secondary organic aerosol formation. Chem. Soc. Rev. 2012, 41, 6582–6605. [Google Scholar] [CrossRef] [PubMed]
  5. Zhou, X.; Zhou, X.; Wang, C.; Zhou, H. Environmental and human health impacts of volatile organic compounds: A perspective review. Chemosphere 2023, 313, 137489. [Google Scholar] [CrossRef] [PubMed]
  6. Li, B.; Ho, S.S.H.; Li, X.; Guo, L.; Chen, A.; Hu, L.; Yang, Y.; Chen, D.; Lin, A.; Fang, X. A comprehensive review on anthropogenic volatile organic compounds (VOCs) emission estimates in China: Comparison and outlook. Environ. Int. 2021, 156, 106710. [Google Scholar] [CrossRef] [PubMed]
  7. Zhang, X.; Xue, Z.; Li, H.; Yan, L.; Yang, Y.; Wang, Y.; Duan, J.; Li, L.; Chai, F.; Cheng, M.; et al. Ambient volatile organic compounds pollution in China. J. Environ. Sci. 2017, 55, 69–75. [Google Scholar] [CrossRef] [PubMed]
  8. Ding, D.; Xing, J.; Wang, S.; Dong, Z.; Zhang, F.; Liu, S.; Hao, J. Optimization of a NOx and VOC Cooperative Control Strategy Based on Clean Air Benefits. Environ. Sci. Technol. 2022, 56, 739–749. [Google Scholar] [CrossRef]
  9. Simayi, M.; Shi, Y.; Xi, Z.; Ren, J.; Hini, G.; Xie, S. Emission trends of industrial VOCs in China since the clean air action and future reduction perspectives. Sci. Total Environ. 2022, 826, 153994. [Google Scholar] [CrossRef]
  10. Pinthong, N.; Thepanondh, S.; Kondo, A. Source Identification of VOCs and their Environmental Health Risk in a Petrochemical Industrial Area. Aerosol Air Qual. Res. 2022, 22, 210064. [Google Scholar] [CrossRef]
  11. Liu, Y.; Shao, M.; Fu, L.; Lu, S.; Zeng, L.; Tang, D. Source profiles of volatile organic compounds (VOCs) measured in China: Part I. Atmos. Environ. 2008, 42, 6247–6260. [Google Scholar] [CrossRef]
  12. Kansal, A. Sources and reactivity of NMHCs and VOCs in the atmosphere: A review. J. Hazard. Mater. 2009, 166, 17–26. [Google Scholar] [CrossRef]
  13. Hui, L.; Liu, X.; Tan, Q.; Feng, M.; An, J.; Qu, Y.; Zhang, Y.; Deng, Y.; Zhai, R.; Wang, Z. VOC characteristics, chemical reactivity and sources in urban Wuhan, central China. Atmos. Environ. 2020, 224, 117340. [Google Scholar] [CrossRef]
  14. Awasthi, A.; Sinha, B.; Hakkim, H.; Mishra, S.; Mummidivarapu, V.; Singh, G.; Ghude, S.D.; Soni, V.K.; Nigam, N.; Sinha, V.; et al. Biomass-burning sources control ambient particulate matter, but traffic and industrial sources control volatile organic compound (VOC) emissions and secondary-pollutant formation during extreme pollution events in Delhi. Atmos. Chem. Phys. 2024, 24, 10279–10304. [Google Scholar] [CrossRef]
  15. Ye, C.; Guo, S.; Lin, W.; Tian, F.; Wang, J.; Zhang, C.; Chi, S.; Chen, Y.; Zhang, Y.; Zeng, L.; et al. Measurement report: Source apportionment and environmental impacts of volatile organic compounds (VOCs) in Lhasa, a highland city in China. Atmos. Chem. Phys. 2023, 23, 10383–10397. [Google Scholar] [CrossRef]
  16. An, J.; Zhu, B.; Wang, H.; Li, Y.; Lin, X.; Yang, H. Characteristics and source apportionment of VOCs measured in an industrial area of Nanjing, Yangtze River Delta, China. Atmos. Environ. 2014, 97, 206–214. [Google Scholar] [CrossRef]
  17. Jia, H.; Gao, S.; Duan, Y.; Fu, Q.; Che, X.; Xu, H.; Wang, Z.; Cheng, J. Investigation of health risk assessment and odor pollution of volatile organic compounds from industrial activities in the Yangtze River Delta region, China. Ecotoxicol. Environ. Saf. 2021, 208, 111474. [Google Scholar] [CrossRef]
  18. Shao, P.; An, J.; Xin, J.; Wu, F.; Wang, J.; Ji, D.; Wang, Y. Source apportionment of VOCs and the contribution to photochemical ozone formation during summer in the typical industrial area in the Yangtze River Delta, China. Atmos. Res. 2016, 176–177, 64–74. [Google Scholar] [CrossRef]
  19. Zheng, C.; Shen, J.; Zhang, Y.; Zhu, X.; Wu, X.; Chen, L.; Gao, X. Atmospheric Emission Characteristics and Control Policies of Anthropogenic VOCs from Industrial Sources in Yangtze River Delta Region, China. Aerosol Air Qual. Res. 2017, 17, 2263–2275. [Google Scholar] [CrossRef]
  20. Sadeghi, B.; Pouyaei, A.; Choi, Y.; Rappenglueck, B. Influence of seasonal variability on source characteristics of VOCs at Houston industrial area. Atmos. Environ. 2022, 277, 119077. [Google Scholar] [CrossRef]
  21. Na, K.; Kim, Y.P.; Moon, K.-C.; Moon, I.; Fung, K. Concentrations of volatile organic compounds in an industrial area of Korea. Atmos. Environ. 2001, 35, 2747–2756. [Google Scholar] [CrossRef]
  22. Farhat, M.; Afif, C.; Zhang, S.; Dusanter, S.; Delbarre, H.; Riffault, V.; Sauvage, S.; Borbon, A. Investigating the industrial origin of terpenoids in a coastal city in northern France: A source apportionment combining anthropogenic, biogenic, and oxygenated VOC. Sci. Total Environ. 2024, 928, 172098. [Google Scholar] [CrossRef]
  23. Louie, P.K.K.; Ho, J.W.K.; Tsang, R.C.W.; Blake, D.R.; Lau, A.K.H.; Yu, J.Z.; Yuan, Z.; Wang, X.; Shao, M.; Zhong, L. VOCs and OVOCs distribution and control policy implications in Pearl River Delta region, China. Atmos. Environ. 2013, 76, 125–135. [Google Scholar] [CrossRef]
  24. Ling, Z.H.; Guo, H. Contribution of VOC sources to photochemical ozone formation and its control policy implication in Hong Kong. Environ. Sci. Policy 2014, 38, 180–191. [Google Scholar] [CrossRef]
  25. Matsumoto, N.; Elder, M.; Ogihara, A. Japan’s policy to reduce emissions of volatile organic compounds: Factors that facilitate industry participation in voluntary actions. J. Clean. Prod. 2015, 108, 931–943. [Google Scholar] [CrossRef]
  26. Mihajlović, M.; Jovanović, M.; Pešić, R.; Jovanović, J.; Milanović, Z. Volatile organic compounds (VOC) policy innovation in petrochemicals river barge transportation. J. Clean. Prod. 2016, 112, 1559–1567. [Google Scholar] [CrossRef]
  27. Soni, V.; Singh, P.; Shree, V.; Goel, V. Effects of VOCs on Human Health. In Air Pollution and Control; Sharma, N., Agarwal, A.K., Eastwood, P., Gupta, T., Singh, A.P., Eds.; Springer: Singapore, 2018; pp. 119–142. [Google Scholar]
  28. Kampa, M.; Castanas, E. Human health effects of air pollution. Environ. Pollut. 2008, 151, 362–367. [Google Scholar] [CrossRef] [PubMed]
  29. Zhang, D.; He, B.; Yuan, M.; Yu, S.; Yin, S.; Zhang, R. Characteristics, sources and health risks assessment of VOCs in Zhengzhou, China during haze pollution season. J. Environ. Sci. 2021, 108, 44–57. [Google Scholar] [CrossRef] [PubMed]
  30. Dunne, E.; Galbally, I.E.; Cheng, M.; Selleck, P.; Molloy, S.B.; Lawson, S.J. Comparison of VOC measurements made by PTR-MS, adsorbent tubes–GC-FID-MS and DNPH derivatization–HPLC during the Sydney Particle Study, 2012: A contribution to the assessment of uncertainty in routine atmospheric VOC measurements. Atmos. Meas. Tech. 2018, 11, 141–159. [Google Scholar] [CrossRef]
  31. Wang, H.; Zhang, X.; Chen, Z. Development of DNPH/HPLC method for the measurement of carbonyl compounds in the aqueous phase: Applications to laboratory simulation and field measurement. Environ. Chem. 2009, 6, 389–397. [Google Scholar] [CrossRef]
  32. Lindinger, C.; Pollien, P.; Ali, S.; Yeretzian, C.; Blank, I.; Märk, T. Unambiguous Identification of Volatile Organic Compounds by Proton-Transfer Reaction Mass Spectrometry Coupled with GC/MS. Anal. Chem. 2005, 77, 4117–4124. [Google Scholar] [CrossRef] [PubMed]
  33. Eckenrode, B.A. Environmental and Forensic applications of field-portable GC-MS: An overview. J. Am. Soc. Mass Spectrom. 2001, 12, 683–693. [Google Scholar] [CrossRef]
  34. Han, C.; Liu, R.; Luo, H.; Li, G.; Ma, S.; Chen, J.; An, T. Pollution profiles of volatile organic compounds from different urban functional areas in Guangzhou China based on GC/MS and PTR-TOF-MS: Atmospheric environmental implications. Atmos. Environ. 2019, 214, 116843. [Google Scholar] [CrossRef]
  35. Graus, M.; Muller, M.; Hansel, A. High resolution PTR-TOF: Quantification and formula confirmation of VOC in real time. J. Am. Soc. Mass Spectrom. 2011, 21, 1037–1044. [Google Scholar] [CrossRef] [PubMed]
  36. Lindinger, W.; Hansel, A.; Jordan, A. On-line monitoring of volatile organic compounds at pptv levels by means of proton-transfer-reaction mass spectrometry (PTR-MS) medical applications, food control and environmental research. Int. J. Mass Spectrom. Ion Process. 1998, 173, 191–241. [Google Scholar] [CrossRef]
  37. Yuan, B.; Koss, A.R.; Warneke, C.; Coggon, M.; Sekimoto, K.; de Gouw, J.A. Proton-Transfer-Reaction Mass Spectrometry: Applications in Atmospheric Sciences. Chem. Rev. 2017, 117, 13187–13229. [Google Scholar] [CrossRef]
  38. de Gouw, J.; Warneke, C. Measurements of volatile organic compounds in the earth’s atmosphere using proton-transfer-reaction mass spectrometry. Mass Spectrom. Rev. 2007, 26, 223–257. [Google Scholar] [CrossRef] [PubMed]
  39. Hutterli, M.A.; Pospisilova, V.; Gonin, M. Time-Of-Flight Mass Spectrometers Made in Switzerland: Examples of Mobile Applications. Chimia 2022, 76, 60–67. [Google Scholar] [CrossRef] [PubMed]
  40. Yuan, B.; Koss, A.; Warneke, C.; Gilman, J.B.; Lerner, B.M.; Stark, H.; de Gouw, J.A. A high-resolution time-of-flight chemical ionization mass spectrometer utilizing hydronium ions (H3O+ ToF-CIMS) for measurements of volatile organic compounds in the atmosphere. Atmos. Meas. Tech. 2016, 9, 2735–2752. [Google Scholar] [CrossRef]
  41. Pfannerstill, E.Y.; Arata, C.; Zhu, Q.; Schulze, B.C.; Ward, R.; Woods, R.; Harkins, C.; Schwantes, R.H.; Seinfeld, J.H.; Bucholtz, A.; et al. Temperature-dependent emissions dominate aerosol and ozone formation in Los Angeles. Science 2024, 384, 1324–1329. [Google Scholar] [CrossRef] [PubMed]
  42. Abeleira, A.; Pollack, I.B.; Sive, B.; Zhou, Y.; Fischer, E.V.; Farmer, D.K. Source characterization of volatile organic compounds in the Colorado Northern Front Range Metropolitan Area during spring and summer 2015. J. Geophys. Res. Atmos. 2017, 122, 3595–3613. [Google Scholar] [CrossRef]
  43. Cui, L.; Wu, D.; Wang, S.; Xu, Q.; Hu, R.; Hao, J. Measurement report: Ambient volatile organic compound (VOC) pollution in urban Beijing: Characteristics, sources, and implications for pollution control. Atmos. Chem. Phys. 2022, 22, 11931–11944. [Google Scholar] [CrossRef]
  44. Hui, L.; Liu, X.; Tan, Q.; Feng, M.; An, J.; Qu, Y.; Zhang, Y.; Cheng, N. VOC characteristics, sources and contributions to SOA formation during haze events in Wuhan, Central China. Sci. Total Environ. 2019, 650, 2624–2639. [Google Scholar] [CrossRef]
  45. Mozaffar, A.; Zhang, Y.-L.; Fan, M.; Cao, F.; Lin, Y.-C. Characteristics of summertime ambient VOCs and their contributions to O3 and SOA formation in a suburban area of Nanjing, China. Atmos. Res. 2020, 240, 104923. [Google Scholar] [CrossRef]
  46. McDonald, B.C.; De Gouw, J.A.; Gilman, J.B.; Jathar, S.H.; Akherati, A.; Cappa, C.D.; Jimenez, J.L.; Lee-Taylor, J.; Hayes, P.L.; McKeen, S.A.J.S. Volatile chemical products emerging as largest petrochemical source of urban organic emissions. Science 2018, 359, 760–764. [Google Scholar] [CrossRef] [PubMed]
  47. Zhang, H.; Li, H.; Zhang, Q.; Zhang, Y.; Zhang, W.; Wang, X.; Bi, F.; Chai, F.; Gao, J.; Meng, L.J.A. Atmospheric volatile organic compounds in a typical urban area of Beijing: Pollution characterization, health risk assessment and source apportionment. Atmosphere 2017, 8, 61. [Google Scholar] [CrossRef]
  48. Qian, Y.; Wang, B.; Chen, Y.; Zhao, X.; Duan, X. Time-Activity Factors Related to Electromagnetic Ex-Posure; Academic Press: Cambridge, MA, USA, 2015; pp. 49–52. [Google Scholar] [CrossRef]
  49. Vu, C.; Sivak, M.; Koporec, K.; Burgess, M. Risk Assessment Guidance for Superfund (RAGS). In Volume I Human Health Evaluation Manual (Part F, Supplemental Guidance for Inhalation Risk Assessment); United States Environmental Protection Agency (U.S. EPA): Washington, DC, USA, 2024; EPA-540-R070-002, OSWER 9285.7-82. [Google Scholar]
  50. Huang, Y.; Che, X.; Jin, D.; Xiu, G.; Duan, L.; Wu, Y.; Gao, S.; Duan, Y.; Fu, Q. Mobile monitoring of VOCs and source identification using two direct-inlet MSs in a large fine and petroleum chemical industrial park. Sci. Total Environ. 2022, 823, 153615. [Google Scholar] [CrossRef]
  51. Zhou, X.; Li, Z.; Zhang, T.; Wang, F.; Wang, F.; Tao, Y.; Zhang, X.; Wang, F.; Huang, J. Volatile organic compounds in a typical petrochemical industrialized valley city of northwest China based on high-resolution PTR-MS measurements: Characterization, sources and chemical effects. Sci. Total Environ. 2019, 671, 883–896. [Google Scholar] [CrossRef]
  52. Shen, L.; Xiang, P.; Liang, S.; Chen, W.; Wang, M.; Lu, S.; Wang, Z. Sources Profiles of Volatile Organic Compounds (VOCs) Measured in a Typical Industrial Process in Wuhan, Central China. Atmosphere. 2018, 9, 297. [Google Scholar] [CrossRef]
  53. Huang, Y.; Gao, S.; Wu, S.; Che, X.; Yang, Y.; Gu, J.; Tan, W.; Ruan, D.; Xiu, G.; Fu, Q. Stationary monitoring and source apportionment of VOCs in a chemical industrial park by combining rapid direct-inlet MSs with a GC-FID/MS. Sci. Total Environ. 2021, 795, 148639. [Google Scholar] [CrossRef] [PubMed]
  54. Whalley, L.K.; Stone, D.; Bandy, B.; Dunmore, R.; Hamilton, J.F.; Hopkins, J.; Lee, J.D.; Lewis, A.C.; Heard, D.E. Atmospheric OH reactivity in central London: Observations, model predictions and estimates of in situ ozone production. Atmos. Chem. Phys. 2016, 16, 2109–2122. [Google Scholar] [CrossRef]
  55. Yang, Y.; Shao, M.; Keßel, S.; Li, Y.; Lu, K.; Lu, S.; Williams, J.; Zhang, Y.; Zeng, L.; Nölscher, A.C.; et al. How the OH reactivity affects the ozone production efficiency: Case studies in Beijing and Heshan, China. Atmos. Chem. Phys. 2017, 17, 7127–7142. [Google Scholar] [CrossRef]
  56. Fuchs, H.; Tan, Z.; Lu, K.; Bohn, B.; Broch, S.; Brown, S.S.; Dong, H.; Gomm, S.; Häseler, R.; He, L.; et al. OH reactivity at a rural site (Wangdu) in the North China Plain: Contributions from OH reactants and experimental OH budget. Atmos. Chem. Phys. 2017, 17, 645–661. [Google Scholar] [CrossRef]
  57. Zhang, Z.; Wang, H.; Chen, D.; Li, Q.; Thai, P.; Gong, D.; Li, Y.; Zhang, C.; Gu, Y.; Zhou, L.; et al. Emission characteristics of volatile organic compounds and their secondary organic aerosol formation potentials from a petroleum refinery in Pearl River Delta, China. Sci. Total Environ. 2017, 584–585, 1162–1174. [Google Scholar] [CrossRef] [PubMed]
  58. Li, Q.; Su, G.; Li, C.; Liu, P.; Zhao, X.; Zhang, C.; Sun, X.; Mu, Y.; Wu, M.; Wang, Q.; et al. An investigation into the role of VOCs in SOA and ozone production in Beijing, China. Sci. Total Environ. 2020, 720, 137536. [Google Scholar] [CrossRef] [PubMed]
  59. Kumar, A.; Singh, D.; Kumar, K.; Singh, B.B.; Jain, V.K. Distribution of VOCs in urban and rural atmospheres of subtropical India: Temporal variation, source attribution, ratios, OFP and risk assessment. Sci. Total Environ. 2018, 613–614, 492–501. [Google Scholar] [CrossRef]
  60. Zheng, H.; Kong, S.; Yan, Y.; Chen, N.; Yao, L.; Liu, X.; Wu, F.; Cheng, Y.; Niu, Z.; Zheng, S.; et al. Compositions, sources and health risks of ambient volatile organic compounds (VOCs) at a petrochemical industrial park along the Yangtze River. Sci. Total Environ. 2020, 703, 135505. [Google Scholar] [CrossRef]
  61. Cheng, L.; Wei, W.; Guo, A.; Zhang, C.; Sha, K.; Wang, R.; Wang, K.; Cheng, S. Health risk assessment of hazardous VOCs and its associations with exposure duration and protection measures for coking industry workers. J. Clean. Prod. 2022, 379, 134919. [Google Scholar] [CrossRef]
Figure 1. Heatmap of VOC concentrations in the Lianyungang Xuwei Industrial Park, along with pie charts showing the proportions of various VOC species in the industrial (IND) and background (BG) zones, highlight A, B, and C as the three high-concentration VOC hotspots in the IND.
Atmosphere 16 00104 g001
Figure 2. Mass spectrum profiles of the three VOC hotspots in the industrial area: (ac).
Atmosphere 16 00104 g002
Figure 3. Top 20 species and their contribution to OH reactivity in: IND (a); and BG (b).
Atmosphere 16 00104 g003
Figure 4. Top 10 dominant species and total species contribution to SOA formation potential in: the industrial area (IND) (a); and background area (BG) (b).
Atmosphere 16 00104 g004
Figure 5. Carcinogenic risk of VOCs in industrial VOCs: hotspot area (a); and industrial background area (b). The yellow dashed line represents the acceptable safety threshold for LCR (1 × 10⁻⁶), while the red dashed line represents the tolerable safety threshold for LCR (1 × 10⁻⁴).
Atmosphere 16 00104 g005
Table 1. Technical parameters of PTR–ToF–MS.
ParametersValue
Limit of detection<5 ppt/min
Sensitivity>4000 cps/ppb
Response time<100 ms
Linear range50 pptv to 5 ppmv
Quality accuracy<0.005 u
Mass-axis stability<0.01 u/8 h
Signal Stabilization<5%/8 h
Mass (in physics)<120 kg
Disclaimer/Publisher’s Note: The statements, opinions and data contained in all publications are solely those of the individual author(s) and contributor(s) and not of MDPI and/or the editor(s). MDPI and/or the editor(s) disclaim responsibility for any injury to people or property resulting from any ideas, methods, instructions or products referred to in the content.

