Article

Optimizing Thermal Comfort in Urban Squares of Hot-Humid Regions: A Case Study Considering Tree Growth, Species, and Planting Intervals

School of Architecture and Urban Planning, Shenyang Jianzhu University, Shenyang 110168, China
*
Author to whom correspondence should be addressed.
Atmosphere 2025, 16(1), 63; https://doi.org/10.3390/atmos16010063
Submission received: 7 December 2024 / Revised: 30 December 2024 / Accepted: 2 January 2025 / Published: 9 January 2025
(This article belongs to the Section Biometeorology and Bioclimatology)

Abstract

:
The worsening urban thermal environment has become a critical challenge in many cities. Trees, as vital components of urban green spaces, provide multiple ecosystem services, especially in improving the microclimate. However, limited studies address how morphological changes during tree growth influence their cooling benefits. This study combined the tree growth model with ENVI-met to simulate 27 scenarios in a subtropical urban square, considering three planting intervals, three urban tree species, and three growth stages to evaluate their daytime thermal impacts. The key findings include: (1) Tree size and planting intervals are more important than tree quantity in enhancing thermal comfort. (2) Reducing intervals by 2 m enhances cooling effects but minimally affects PET (physiological equivalent temperature). (3) Increasing DBH (diameter at breast height) significantly improves cooling. For every 10 cm increase in DBH, Michelia alba, Mangifera indica, and Ficus microcarpa L. f. reduced solar radiation by 19.54, 18.09, and 34.50 W/m2, and mean radiant temperature by 0.61 °C, 0.68 °C, and 1.35 °C, respectively, while decreasing PET by 0.23 °C, 0.23 °C, and 0.46 °C. These findings provide empirical evidence and practical recommendations for designing comfortable open spaces in subtropical cities.

1. Introduction

With the rapid pace of urbanization, global climate change, and the intensification of the urban heat island (UHI) effect, temperatures in urban areas are significantly higher than their surrounding rural regions [1]. The frequent occurrence of prolonged heatwaves and elevated temperatures not only increases building energy consumption but also restricts outdoor activities for urban residents [2,3]. These extreme heat conditions are closely associated with a rise in heat-related illnesses and mortality rates, posing a severe threat to public well-being [4]. Consequently, enhancing outdoor thermal comfort has become an urgent priority, making the optimization of urban thermal environments a key focus in urban ecology [5]. As a nature-based solution, urban trees play a vital role in microclimate regulation [6]. Understanding their thermal behavior is essential for guiding sustainable urban development and fostering resilient urban climates.
Urban trees play a crucial role in moderating microclimates primarily through radiation attenuation and evapotranspiration, which contribute to improved thermal comfort [7]. Tree canopies intercept a significant portion of incoming solar radiation (SR), with only about 15% of SR reaching the ground during the day, thereby reducing surface heating [8]. This shading effect lowers surface temperatures, indirectly decreasing heat storage and modifying sensible heat flux in the underlying surfaces [9,10,11]. Additionally, trees regulate heat through evapotranspiration, where water vaporization from leaf surfaces transfers energy as latent heat, reducing leaf temperature and influencing the surrounding air [12,13]. This process can lower air temperature (Ta) and increase relative humidity (RH) near the tree canopy [14,15]. Therefore, urban trees often create an Urban Cooling Island (UCI) effect [16], especially in large-scale green planting scenarios. In London, green patches can reduce nighttime temperatures by 1.1–4 °C over a distance of 20–440 m [17]. Similarly, in Changsha, China, doubling park area can increase the UCI effect by 0.8 K, while increasing the average tree patch size by 1 hectare can enhance the UCI intensity by 0.43 K [18]. It is worth noting that a global meta-analysis found that the cooling benefits of trees often vary depending on tree characteristics, urban morphology, and climatic conditions [19]. Given that hot-humid regions typically experience hot and rainy summers, this highlights the necessity of conducting research specifically tailored to such climates.
In micro-scale studies, the cooling effects of trees are typically assessed using various microclimate indicators, as these directly affect human thermal comfort [20,21,22]. A study conducted in Freiburg, Germany, found that tree-covered residential areas experienced an average reduction in mean radiant temperature (MRT) of 43 K and physiological equivalent temperature (PET) of 22 K [23]. A cooling assessment of 12 tree species conducted in Campinas, Brazil, indicated that Caesalpinia pluviosa is an optimal choice for improving thermal comfort in the region, reducing PET by approximately 16 °C [24]. The cooling benefits of trees have also been widely reported in hot and humid regions [25,26,27]. For instance, Zheng et al. conducted a field study in Guangzhou during summer and found that four common tree species effectively reduced SR, Ta, MRT, PET, and surface temperature (Ts) [28]. Among these species, Ficus microcarpa L. f., with its high leaf area index (LAI) of 4.97, reduced PET by 1050 W/m2 and 32.4 °C [28]. Another study demonstrated that trees significantly cooled the environment even during transitional seasons, with average reductions in Ta, SR, and PET of 4.33%, 24.27%, and 22.09%, respectively [29]. Furthermore, a study in Hong Kong revealed that an isolated tree could reduce PET and the Universal Thermal Climate Index (UTCI) by 3.9 °C and 2.5 °C, respectively, during the daytime [30]. Of note, while tree-covered areas significantly enhance thermal comfort at pedestrian height compared to open spaces [31], the aerodynamic resistance of tree clusters can negatively impact airflow, impeding nocturnal heat dissipation [32].
Trees are often arranged in urban spaces such as squares, roadsides, parks, and residential areas to enhance esthetics, guide pedestrians, and delineate spaces [33]. In these urban scenarios, the selection of tree species and planning strategies significantly influence their cooling benefits [34,35,36]. Moreover, the effectiveness of different strategies for improving outdoor environments largely depends on site-specific climatic conditions [37]. Given the challenges of evaluating multiple tree-planting schemes through field measurements, numerical simulations are frequently employed to assess urban thermal environment designs [38]. Tools such as ENVI-met, SOLWEIG, and Fluent are widely used for this purpose [39]. For example, Aminipouri et al. conducted a study in Vancouver, Canada, demonstrating that during the hottest hours of the day (local time 11:00–17:00), every 1% increase in street tree coverage reduced MRT by 3.3–7.1 °C [40]. Similarly, ENVI-met simulations in Hong Kong indicated that tree planting in street canyons should be implemented regardless of urban geometry [41]. However, the shading effect of buildings reduces the necessity and effectiveness of tree planting in improving human thermal comfort as the depth of the street canyon increases [42]. These studies highlight the importance of strategic tree planting, advocating for a “right tree, right place” approach to maximize cooling potential [43]. Particularly in urban squares, which often serve as focal points for city life, outdoor activities, and transportation, tree planting plays a critical role in improving thermal comfort [44]. Squares are also integral to a city’s identity [45], emphasizing the importance of enhancing their microclimatic conditions. However, the microclimatic benefits of trees are often overlooked during the design and construction of squares. Evaluating the cooling benefits of different planting schemes in squares is therefore essential. ENVI-met, a three-dimensional microclimate computational fluid dynamics (CFD) software, provides an effective tool for achieving this goal [46]. It simulates interactions among microclimate parameters in urban scenarios and includes the “Albero” module, which enables customization of tree models. This versatility has made ENVI-met widely used in thermal environment studies, offering valuable insights into the cooling potential of various urban tree-planting strategies.
Existing research has thoroughly explored the mechanisms and significance of trees in reducing local temperatures and improving thermal comfort. However, in practical urban planning and design, the entire growth process of trees—from planting to maturity—can significantly impact their microclimate regulation effectiveness. This dynamic process requires precise data support. A lack of analysis on the cooling effects of trees during different growth stages may result in suboptimal planning and design outcomes, potentially underestimating the contributions of trees to thermal comfort throughout their growth cycle. To address these gaps, this study is grounded in the practical demands of urban greening. It aims to analyze the dynamic impacts of tree growth on microclimate and thermal comfort under typical summer conditions in a humid subtropical city square. By integrating tree growth models with ENVI-met simulations and accounting for morphological variations across different growth stages, the study provides more accurate theoretical foundations and practical recommendations for square design. Our findings offer scientific support for urban planners and designers in humid and hot regions to develop effective greening strategies that address urban heat challenges. This approach emphasizes the importance of considering the dynamic nature of tree growth in creating resilient urban environments.

2. Materials and Methods

2.1. Climate Conditions

Guangzhou (23°12′ N, 113°20′ E), the capital of Guangdong Province in southern China, is characterized by a predominantly flat terrain and low altitude (average elevation 21 m above sea level). According to the Köppen–Geiger climate classification, Guangzhou has a hot and humid subtropical climate (CWA) [47], with an average annual temperature of 21.9 °C, a relative humidity of 78%, and a wind speed of 1.9 m/s [48]. May to September is Guangzhou’s summer, with average temperatures ranging from 27.5 to 29 °C, and the highest daily temperature recorded is over 35 °C [49]. This hot and humid climate emphasizes the need to optimize the outdoor thermal environment design. The prevailing wind direction in Guangzhou is seasonal. In summer, southeasterly winds dominate due to the influence of subtropical high pressure and low pressure in the South China Sea.

2.2. Study Area and Field Measurement

The study was conducted at the main square of a university campus in Panyu District, Guangzhou (Figure 1a). This square serves as the primary space for transportation and congregation within the campus. It is bordered by buildings on the northeast and southwest sides, accompanied by small-scale roadside greenery (Ficus microcarpa L. f. Bauhinia × blakeana and Trachycarpus fortunei). Surroundings are vehicular roads, with the northwest side being a public transit route and the other roads designated for campus traffic. The plaza is primarily paved with granite bricks, while trees (Trachycarpus fortune, average tree height and crown width are 10 and 5 m) are planted in rows along the northwest-southeast axis on either side of a water feature. This layout not only showcases the cultural and esthetic aspects of the campus but also guides pedestrians into the university. Due to the design constraints of the square, the green coverage rate is relatively low, highlighting the necessity for thermal environment assessments and corresponding improvement recommendations.
Field measurements were conducted on 15 July 2022, local time, from 8:00 to 18:00. Two measurement points were set up within the square to monitor the thermal environment, and the collected data were used to validate the ENVI-met simulations. Point 1 was located on the impermeable pavements without any shading, while Point 2 was positioned beneath the planted trees. This setup effectively validated the accuracy of ENVI-met. Instruments at two points were installed at a height of 1.5 m to record synchronized data every minute and calibrated before the measurements, and their technical parameters are detailed in Table 1. To measure Ta, we used the HOBO Pro Temperature/Relative Humidity Data Logger (Onset Computer Corporation, Bourne, MA, USA), with an accuracy of ±0.2 °C; SR was recorded using the Kipp & Zonen CMP3 (Kipp & Zonen, Delft, The Netherlands) with an accuracy of ±5.0%; Globe temperature (Tg) was recorded using a Deltaohm-HD32.3 AP3203.2 (Delta OHM, Selvazzano Dentro, Italy), with an accuracy of ±0.15 °C; Wind speed (Va) was measured using a Kestrel 5500 weather meter (NK Kestrel, Boothwyn, PA, USA), with an accuracy of ±0.05 m/s.

2.3. ENVI-Met Validation

The validation of the ENVI-met model (version 5.6.1) is crucial for ensuring reliable simulation outputs. Buildings and vegetation were first modeled in the spaces interface based on actual parameters. The simulation domain consisted of a grid with dimensions of 53 × 56 cells, each with a resolution of 2 m. Vertically, 35 layers were defined, with uniform spacing of 0.2 m for heights below 2 m and an expansion factor of 20% for layers above 2 m. Additionally, 10 nesting grids surrounded the model, with loam soil defined as the boundary material. The thermal and physical parameters of the ground surface, as well as the initial soil temperature and moisture content, were referenced from the study by Yang et al. [50]. Data collected at Points 1 and 2 were used as the validation dataset, representing the accuracy of tree modeling and the surrounding environment, respectively (Figure 1b,c).
During the simulation, the Full Forcing Approach was applied for both validation and research purposes. Input parameters, updated every 30 min, included meteorological conditions such as air temperature (Ta), relative humidity (RH), direct (SRdir) and diffuse (SRdif) shortwave radiation, longwave radiation (LR), wind speed (Va), and wind direction (WD). These parameters were obtained from a weather station located on the rooftop of a building approximately 1 km away from the study site. Although this setup cannot fully eliminate minor errors or capture extremely localized variations, the data from weather stations are sufficiently accurate for validating the ENVI-met model. This approach is consistent with findings from previous studies, which have demonstrated the model’s reliability under similar validation conditions [51,52]. Since the weather station recorded only total solar radiation, the data were decomposed into direct and diffuse components for further analysis using the following equations [53]:
S R d i r , e s t i m a t e d = S R 0 · P 1 / s i n h ,
S R d i f , e s t i m a t e d = 0.5 · S R 0 · ( 1 P 1 / s i n h ) ( 1 1.4 l n P ) ,
S R s u m , e s t i m a t e d = S R d i r , e s t i m a t e d · s i n h + S R d i f , e s t i m a t e d ,
S R s u m , e s t i m a t e d = S R s u m , m e a s u r e d ,
where S R d i r , e s t i m a t e d and S R d i f , e s t i m a t e d are the estimated normal direct and diffused horizontal radiation, W/m2. They are calculated by the solar constant ( S R 0 ), h (solar altitude), and atmospheric transmissivity ( P ). h is calculated based on local time, longitude, and latitude. P is adjusted to ensure the sum of direct and diffuse components at the horizontal plane ( S R s u m , e s t i m a t e d , W/m2) is equal to measured incoming solar radiation ( S R s u m , m e a s u r e d , W/m2). All input meteorological parameters are shown in Figure 2, with WD averaging 120°.
The validated parameters included Ta, RH, and MRT, all of which play a critical role in assessing human thermal comfort [54]. Ta is a key parameter that directly reflects the ambient temperature of the environment. RH significantly influences human heat exchange, particularly in humid and hot regions. MRT represents the energy transferred to the human body from the surrounding environment via radiative heat exchange.
The calculation of MRT was performed using a simplified algorithm based on microclimate parameters including Tg, Ta, and Va, which are relatively easy to obtain. This method has been proven to be highly applicable in humid and hot regions [55]. The expression is as follows:
M R T = [ T g + 273.15 4 + 1.1 × 10 8 V a 0.6 ε D 0.4 × ( T g T a ) ] 0.25 273.15 ,
where MRT (°C) is mean radiation temperature, Tg (°C) is globe temperature, Ta (°C) is air temperature, Va (m/s) is wind speed, D is the diameter of the globe sphere (50 mm), and ε is the emissivity of the globe surface (0.95).
The reliability of the ENVI-met model was evaluated by comparing the differences between measured and simulated values. Four statistical metrics were selected for this analysis [37,56]: R2 (coefficient of determination), MAE (mean absolute error), RMSE (root mean square error), and MBE (mean bias error). These metrics were chosen based on standard recommendations for model validation. R2 measures the overall performance of the model, indicating how well the simulation results align with the observed data; higher R2 values suggest better model performance. MAE reflects the average magnitude of errors between simulated and observed values, without considering their direction (overestimation or underestimation). RMSE highlights the differences between simulated and observed values, similar to MAE, but is more sensitive to extreme values due to the squaring of errors. MBE indicates whether the model systematically overestimates (positive MBE) or underestimates (negative MBE) the results, providing insights into the bias of the model. The detailed description is as follows:
M A E = N 1 i = 1 N X m e a s u r e , i X s i m u l a t e , i ,
R M S E = i = 1 N ( X m e a s u r e , i X s i m u l a t e , i ) 2 N ,
M B E = N 1 i = 1 N X s i m u l a t e , i X m e a s u r e , i 2 ,
where X m e a s u r e , i is the measured values, X s i m u l a t e , i is the simulated values of ENVI-met, and N is the sample size.

2.4. Tree Growth Models and Parameter Setting

Due to the comprehensive changes in morphological parameters of trees during their growth, adjusting a single parameter in isolation is neither objective nor reflective of real-world conditions. Therefore, to better describe the effects of different tree species and their morphological parameters on the thermal environment, this study utilized a tree growth model to obtain the corresponding morphological parameters for trees at various growth stages. Quantitative analysis results were then obtained through ENVI-met simulations.
Based on previous studies, this research adopted the database of typical urban trees in Guangzhou established by Liu et al. [57,58]. The database provides the relationships between tree diameter at breast height (DBH), crown width (D), tree height (H), and LAI for various tree species. Three common urban tree species were selected for analysis: Ficus microcarpa L. f. (FM), Mangifera indica (MI), and Michelia alba (MA). Their descriptions are shown in Table 2. These three tree species are widely planted in urban parks, residential areas, and along roadsides in Guangzhou, making them representative and broadly applicable for this study.
Among them, MA is the tallest, capable of reaching over 15 m at maturity. However, it has the smallest LAI for a given DBH, indicating relatively lower leaf density. While less effective for shading compared to the other two species, it compensates with high evapotranspiration rates, contributing to cooling effects [59]. In contrast, FM has the largest crown width, exceeding 10 m and sometimes reaching up to 20 m at maturity. This species is characterized by a high LAI, dense canopy coverage, and year-round evergreen foliage, making it highly effective at providing shade and reducing solar radiation [59]. Its high transpiration rate further enhances cooling through latent heat dissipation, making it the most effective species for shading and cooling in this study. MI, with moderate tree height, crown width, and LAI for a given DBH, serves as a middle ground between MA and FM in terms of canopy density and growth characteristics. While not as dense as FM, it provides a balance of shading and cooling effects, making it a versatile option for urban greenery. These distinct characteristics highlight the varying impacts of the three species on the urban thermal environment, making them ideal candidates for modeling and simulation in ENVI-met.

2.5. ENVI-Met Setting

Based on the tree growth model, the H, D, and LAI corresponding to different DBH for the three tree species can be obtained. To simulate the impact of trees at various growth stages on the thermal environment, this study focuses on the cooling effects of row-planted trees. This planting pattern reflects realistic scenarios commonly found in urban open spaces, such as roadside plantings, square greenery, and other open urban environments [60]. In this study, the tree planting plans were adjusted based on the current site conditions (Figure 1) to assess the thermal effects of trees under different row planting scenarios and provide recommendations for optimizing the microclimate [61].
Some studies have analyzed the relationship between DBH and morphological characteristics of common urban trees in hot and humid regions of China. A survey conducted in Zhanjiang, a coastal city in South China’s hot-humid region, found that the DBH of most urban trees ranges from 5 to 15 cm, with the majority of trees under 15.24 cm considered relatively young [62]. In a study conducted in Hong Kong, a DBH of 30 cm was used as an indicator of mature trees, with most species having an average crown diameter exceeding 10 m at this stage [63]. It is worth noting that factors such as growth conditions, environmental influences, and pruning practices can result in significant variability in tree growth models [64,65,66], particularly for larger DBH values. Additionally, trees with larger DBH are relatively uncommon in urban areas and are often solitary plantings, primarily represented by Ficus species [62]. Considering that this study focuses on scenarios involving row-planted trees, the DBH for all tree species was standardized to 15 cm, 25 cm, and 35 cm.
A DBH of 15 cm represents young trees at the early growth stage; 25 cm corresponds to moderately mature trees with distinct species characteristics; and 35 cm represents fully mature trees with dense canopies and significant height. This arrangement facilitates the comparison of the cooling effects of the three tree species at different DBH stages. Such a design not only reflects the ecological functional differences in trees at various growth stages but also highlights the impact of DBH on microclimatic regulation, providing a scientific basis for urban greening strategies.
Furthermore, prior research by Liu et al. [57] demonstrated that root morphology has negligible effects on simulation results; hence, default values for root depth and width from ENVI-met were applied. Leaf albedo values were based on empirical data from Guo et al. [67], with values of 0.27, 0.28, and 0.31 assigned to MI, MA, and FM, respectively. Although albedo is influenced by leaf optical properties and canopy characteristics, its variation with tree size or LAI is challenging to quantify accurately. Therefore, fixed albedo values were applied for each growth stage in this study, supported by evidence consistent with findings from prior research [7]. In addition, after calculating the LAI of three species at different DBH, the LAD at different crown heights was calculated using the following empirical formula [68]:
L A I = 0 H L A D m a x H z m a x H z exp [ n ( 1 H z m a x H z ) ] d z 0 z < z m a x ,   n = 6 z m a x z H , n = 0.5   ,
where LAI is leaf area index, H (m) is tree height, L A D m a x is maximum leaf area density at height z m a x , z is any given height within the tree canopy (m), and n is an empirical constant, which adjusts the shape of the LAD distribution.
Using the morphological parameters corresponding to the three tree species at different DBH values (Appendix A), the ENVI-met model was configured to simulate various scenarios. Since the spacing between row-planted trees (the distance between the centers of adjacent tree canopies) significantly impacts their cooling effectiveness, scenarios with different planting intervals were also simulated. Based on relevant studies, the planting intervals were set at 6 m, 8 m, and 10 m. A 6 m interval represents dense planting, 8 m represents moderately spaced planting, and 10 m represents sparse planting. In total, 27 row-planted tree scenarios were simulated, combining different tree species, DBH values, and planting intervals. Additionally, a baseline scenario with no trees in the area (Case-0) was established to represent the worst-case condition. All other model parameters and validation settings remained consistent across scenarios to ensure comparability. These scenarios are summarized in Table 3, illustrating the systematic approach used to evaluate the cooling benefits under varying conditions.

2.6. Thermal Comfort Evaluation Indices

Many thermal comfort indices based on human energy balance have been developed to evaluate outdoor environments, such as PET, UTCI, and Wet Bulb Globe Temperature (WBGT) [69,70]. In this study, PET was selected as the human thermal comfort index, as it is widely used in studies of hot and humid regions [71,72,73] and frequently applied to evaluate the impact of urban vegetation on human thermal comfort [74,75]. PET integrates outdoor thermal environmental parameters, including Ta, Va, MRT, and RH, as well as human factors such as gender, height, age, weight, clothing heat resistance, and behavior to express thermal comfort or heat stress as a single value [76,77]. It represents the equivalent air temperature under typical indoor conditions and approximates the thermal perception of the human body in outdoor environments [78]. PET accounts for all fundamental thermoregulatory processes, including convection, radiation, and evaporation of the human body, and is defined based on the Munich Energy Balance Model for Individuals (MEMI) through equivalent temperature [78]. This model describes the thermal balance at the human body surface, where the heat received by the skin equals the heat produced by the body core, a state defined as thermal neutrality (comfortable). PET is classified into nine levels, ranging from “very cold” to “very hot”, each corresponding to a specific level of thermal comfort or heat stress, as shown in Table 4 [77].
After completing ENVI-met simulations, the results (including Ta, RH, Va, and MRT every half hour) were imported into Bio-met to calculate PET. Considering that the main activities in the campus entrance plaza involve students, the standard human characteristics were set as a 19-year-old male with a height of 1.71 m, a weight of 60.14 kg, a basic clothing insulation value of 0.4 clo, and a metabolic rate of 2.0 MET (primarily corresponding to walking activity) [34,79,80]. This study utilized the average values of various microclimate and thermal comfort indices across the site for subsequent comparative analysis. This approach provides a comprehensive understanding of the thermal performance of different tree planting scenarios.

3. Results

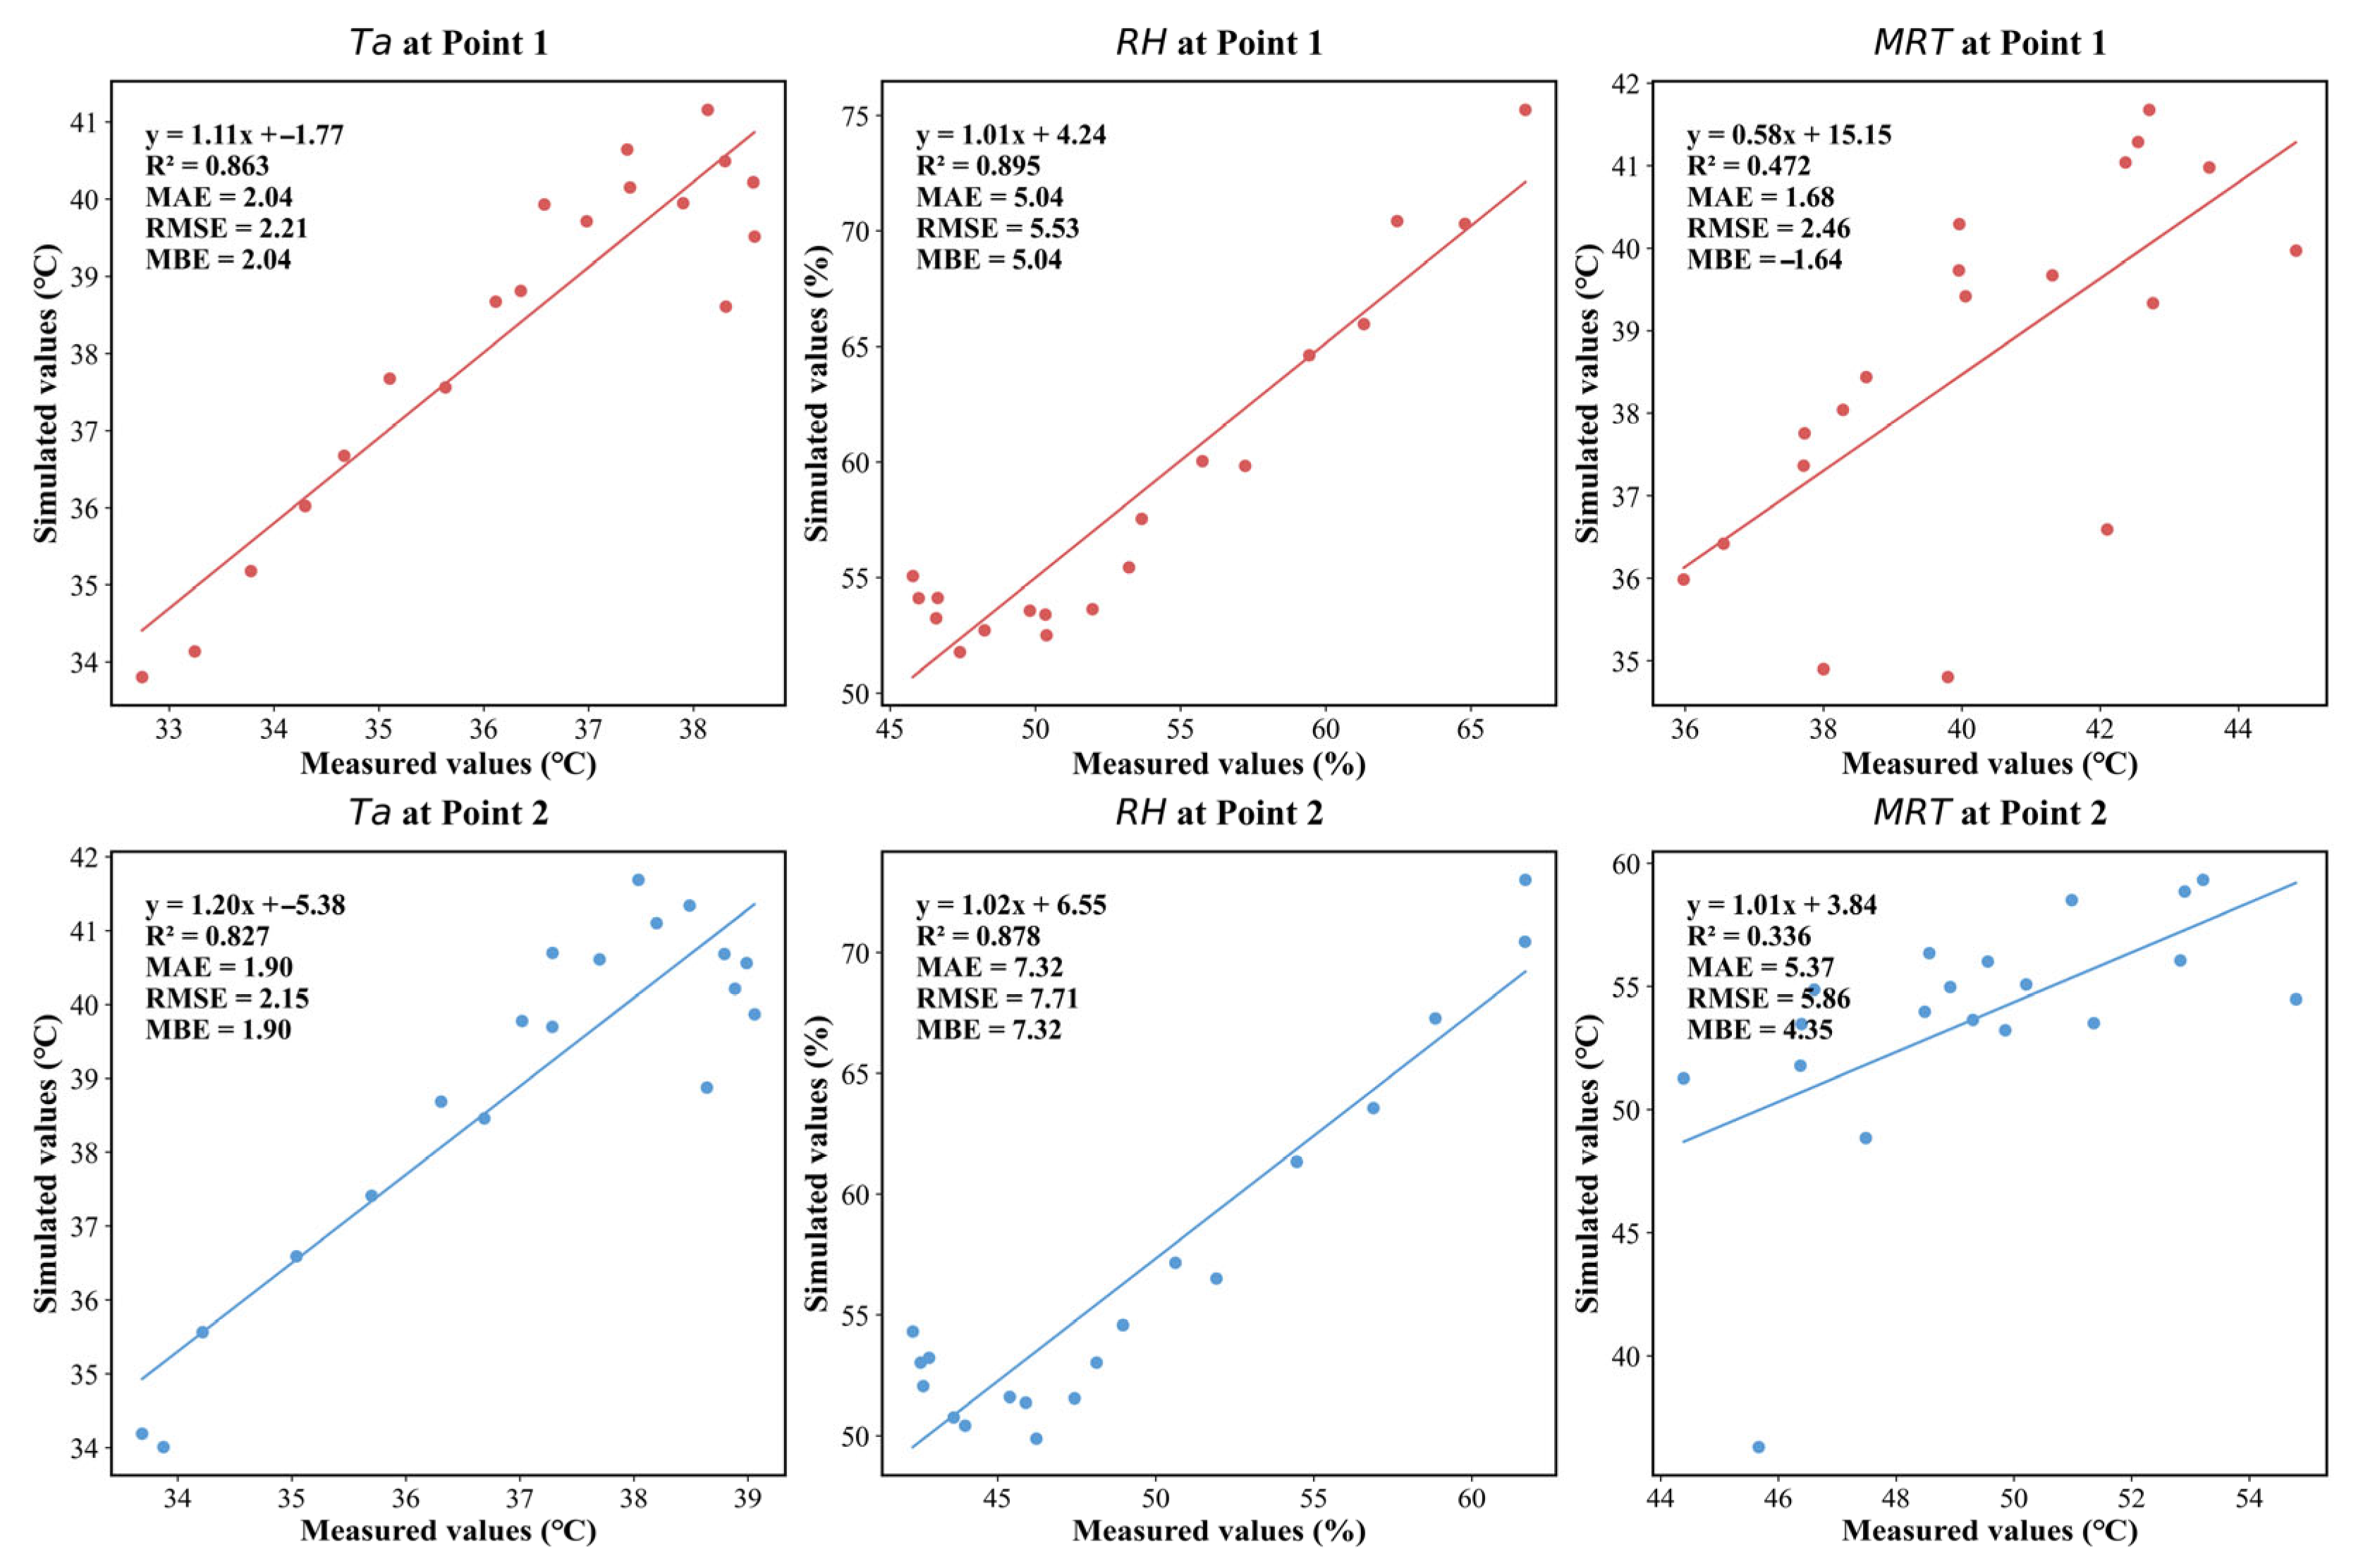
3.1. Assessment of Thermal Environment and Accuracy of ENVI-Met

We calculated and analyzed the error between simulated and measured values (Figure 3), finding that the Ta and RH values at both validation points were generally consistent. For Ta, the R2 for Points 1 and 2 were 0.86 and 0.83, with MAE values of 2.04 °C and 1.90 °C, RMSE values of 2.21 °C and 2.15 °C, and MBE values of 2.04 °C and 1.90 °C, respectively. For RH, the R2 for Points 1 and 2 were 0.90 and 0.88, with MAE values of 5.04% and 7.32%, RMSE values of 5.53% and 7.71%, and MBE values of 5.04% and 7.32%, respectively. These results indicate that ENVI-met tends to overestimate both Ta and RH, but the overall validation results are satisfactory. In contrast, the validation results for MRT showed larger errors, with inconsistencies between Points 1 and 2. R2 for MRT were 0.47 and 0.34; MAE values were 1.68 °C and 5.37 °C; RMSE values were 2.46 °C and 5.86 °C; and MBE values were −1.64 °C and 4.35 °C, respectively. At Point 1 (under the tree canopy), MRT was underestimated, whereas at Point 2 (open area), it was significantly overestimated. This discrepancy aligns with findings from previous studies, likely due to differences in how ENVI-met simulations and field measurements calculate MRT. Overall, while certain discrepancies exist, the errors are relatively small and within an acceptable range according to prior research [81,82,83]. These findings demonstrate that ENVI-met is well-suited for studying urban trees and thermal environments in hot and humid regions.

3.2. Decrease in Solar Radiation

Figure 4 illustrates the reduction in SR (ΔSR) under different simulation scenarios, representing the difference in SR between tree-covered scenarios and the no-tree baseline scenario (Case_0). Across all scenarios, the greatest reduction in SR by the three tree species occurred between 9:00 and 11:00, gradually diminishing after 16:00. FM demonstrated the highest ΔSR due to its large canopy and high LAI. For scenarios involving different DBH values, reducing the planting interval by 2 m increased the ΔSR of MA, MI, and FM by an average of 5.43 W/m2, 4.98 W/m2, and 4.52 W/m2, respectively. For scenarios involving different planting intervals, increasing the DBH by 10 cm improved the ΔSR of MA, MI, and FM by an average of 19.54 W/m2, 18.09 W/m2, and 34.50 W/m2, respectively. Among the three species, FM exhibited the greatest improvement in SR reduction during growth. For example, at a 6 m planting interval, when the DBH increased from 15 cm to 35 cm, the ΔSR of MA increased by 38.37 W/m2, MI by 35.75 W/m2, and FM by 65.87 W/m2. Beyond planting interval, tree species, and size, SR reduction may also depend on the background weather conditions of the day, resulting in some variability in the data. However, tree species and size were the dominant factors influencing ΔSR, while planting interval had a relatively smaller effect, particularly for FM. The simulation results for MA and FM displayed pronounced gradients, whereas the impact of different planting intervals on FM’s ΔSR capacity was minimal and mainly size dependent. Interestingly, scenarios such as MA-25-6 (22 trees per row) and MA-35-10 (12 trees per row) exhibited nearly equivalent ΔSR capacities, with an average difference of only about 4.3 W/m2. This suggests that for MA, tree size plays a more significant role than the number of trees. Additionally, after 16:00, MA demonstrated superior SR reduction capacity compared to the other species, especially in the late afternoon, further emphasizing its effectiveness during evening hours.

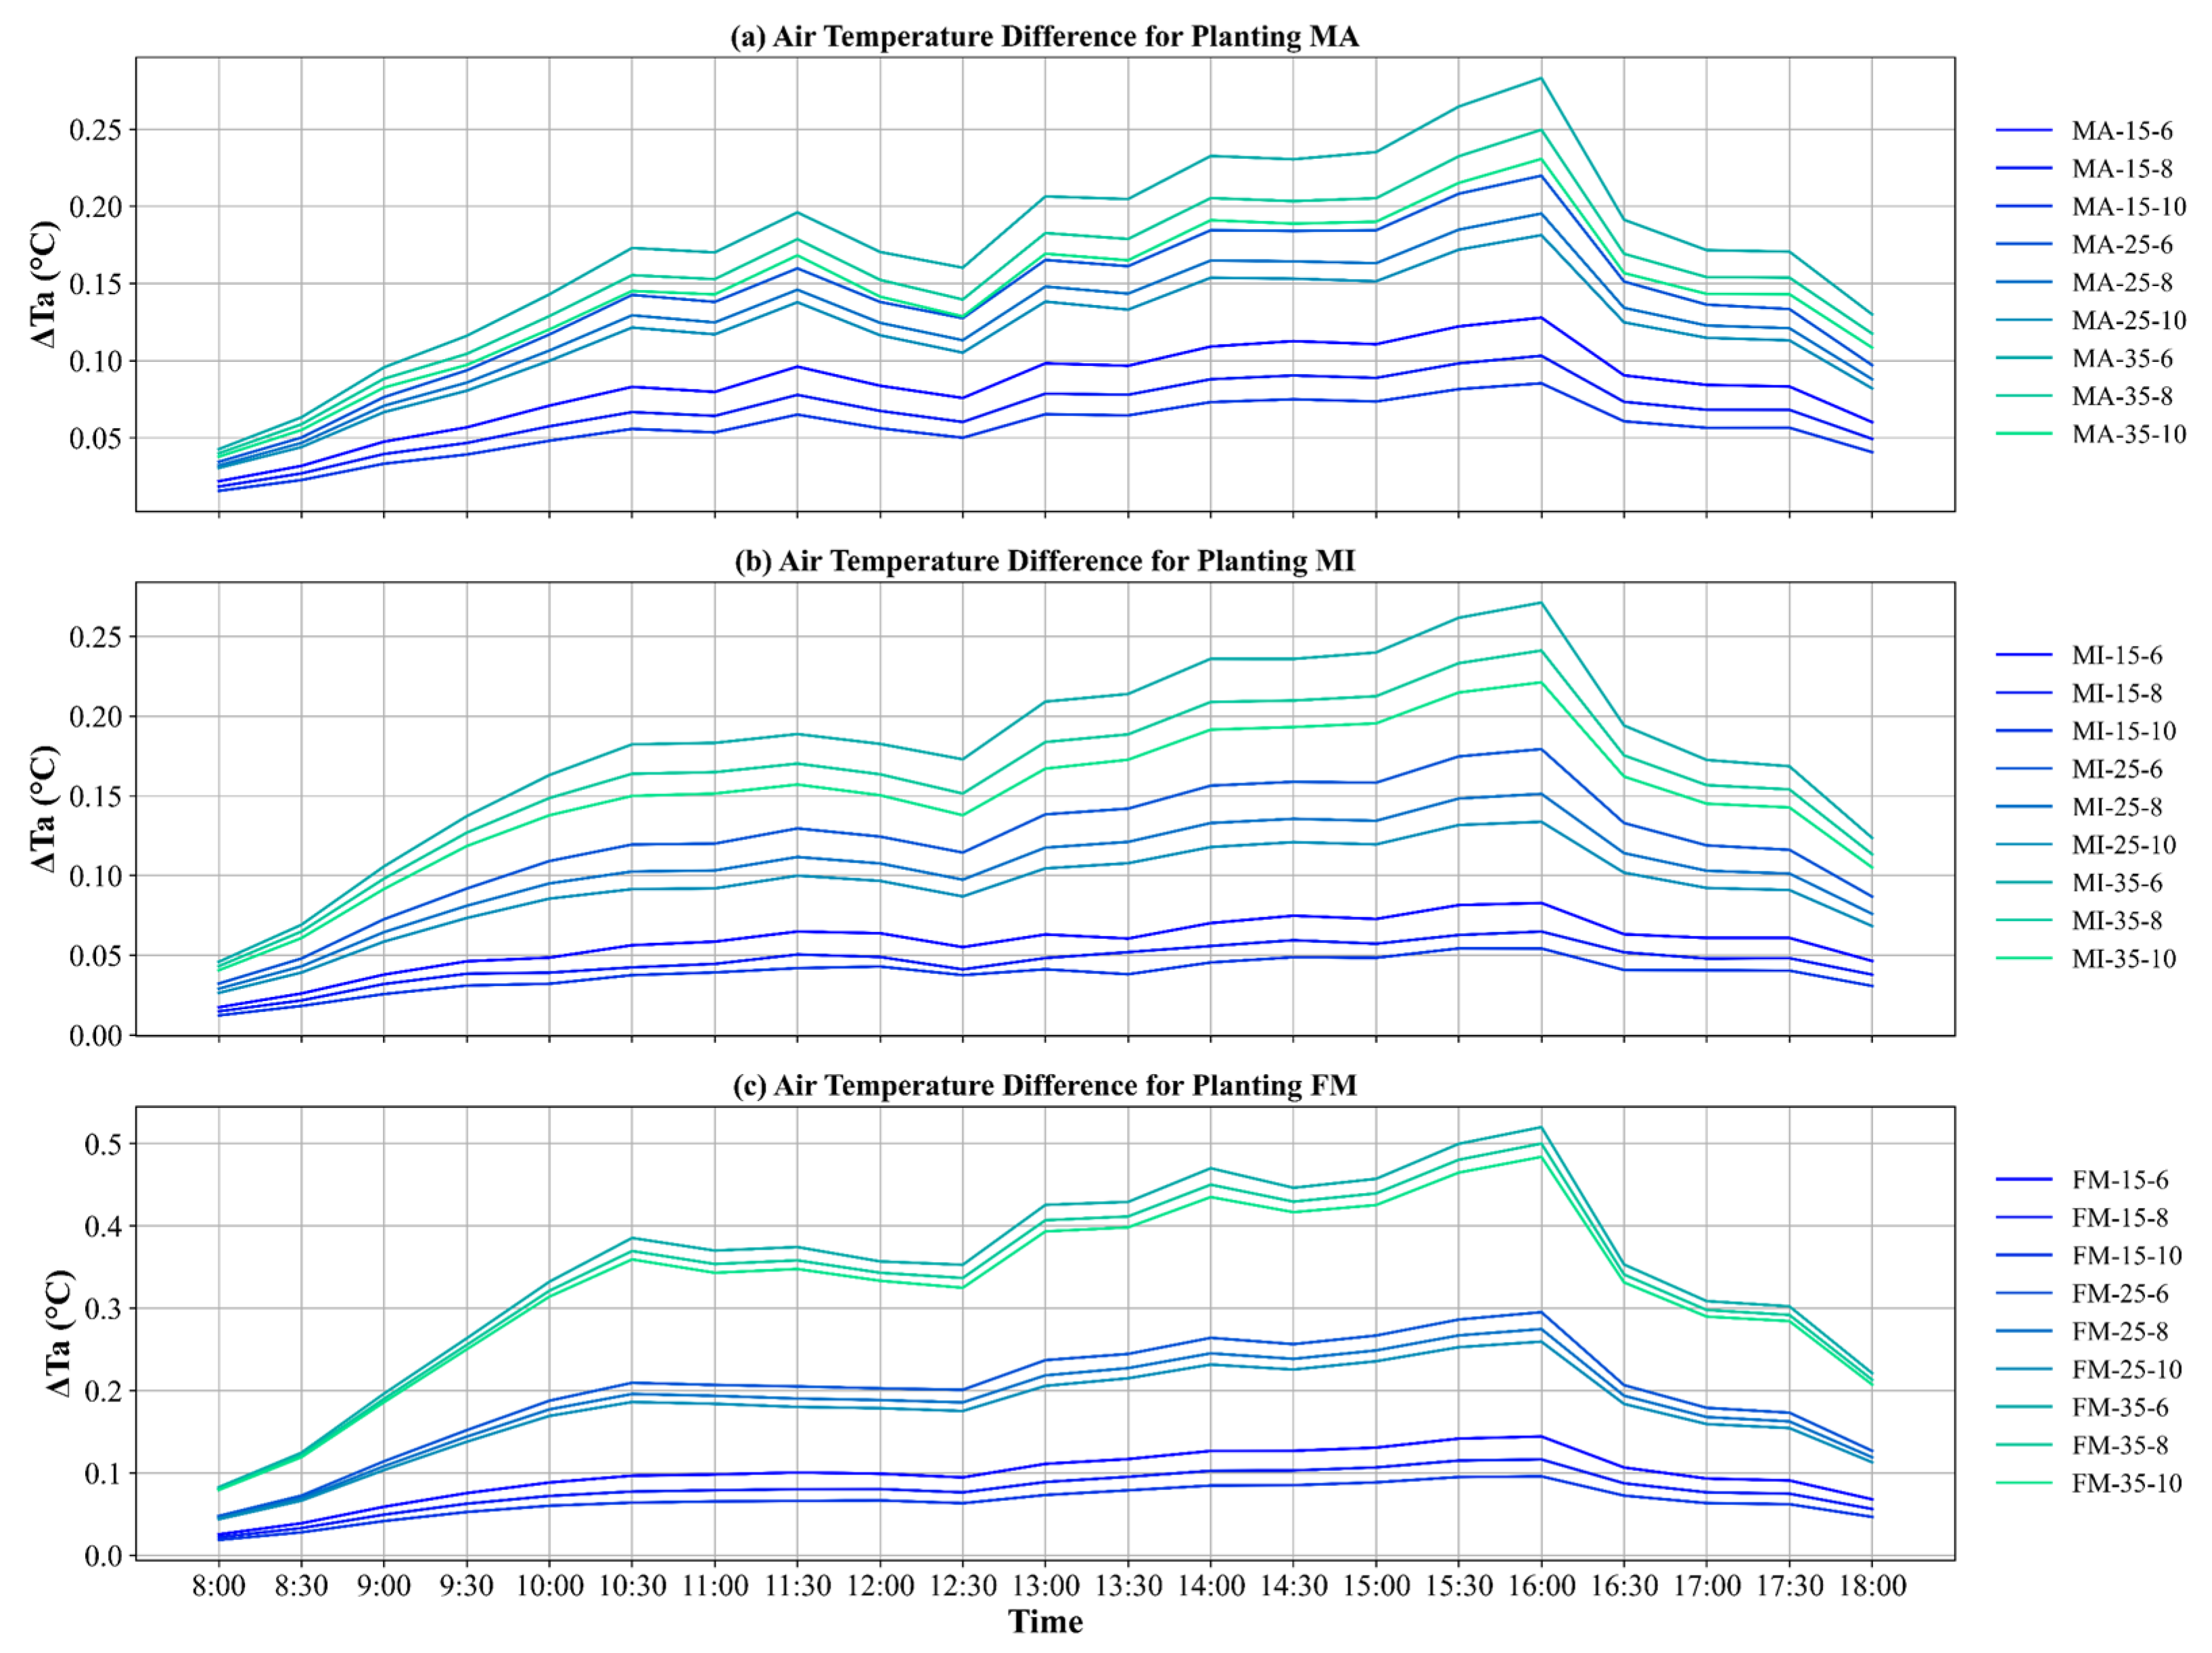
3.3. Ta and RH Variation in Line-Planting Scenarios

Figure 5 and Figure 6 demonstrated that different tree design strategies significantly enhanced the cooling and humidifying effects in the plaza, especially compared to the no-tree baseline scenario (Case_0). These effects generally increased throughout the day, peaking between 8:00 and 18:00. For MA and MI, the cooling (ΔTa) and humidifying (ΔRH) effects showed more pronounced gradients under varying planting configurations. In contrast, FM exhibited minimal changes in ΔTa and ΔRH with increased planting intervals, with temperature reduction and humidity increase remaining within 0.1 °C and 0.7%, respectively. All tree species displayed enhanced cooling and humidifying effects as their DBH increased, with FM showing the most significant improvements. For every 10 cm increase in DBH, FM reduced temperatures by 0.10–0.15 °C and increased humidity by 0.38–0.57%, outperforming MA and MI. These results highlight the critical role of tree size, particularly DBH, in optimizing the microclimatic benefits of urban trees.

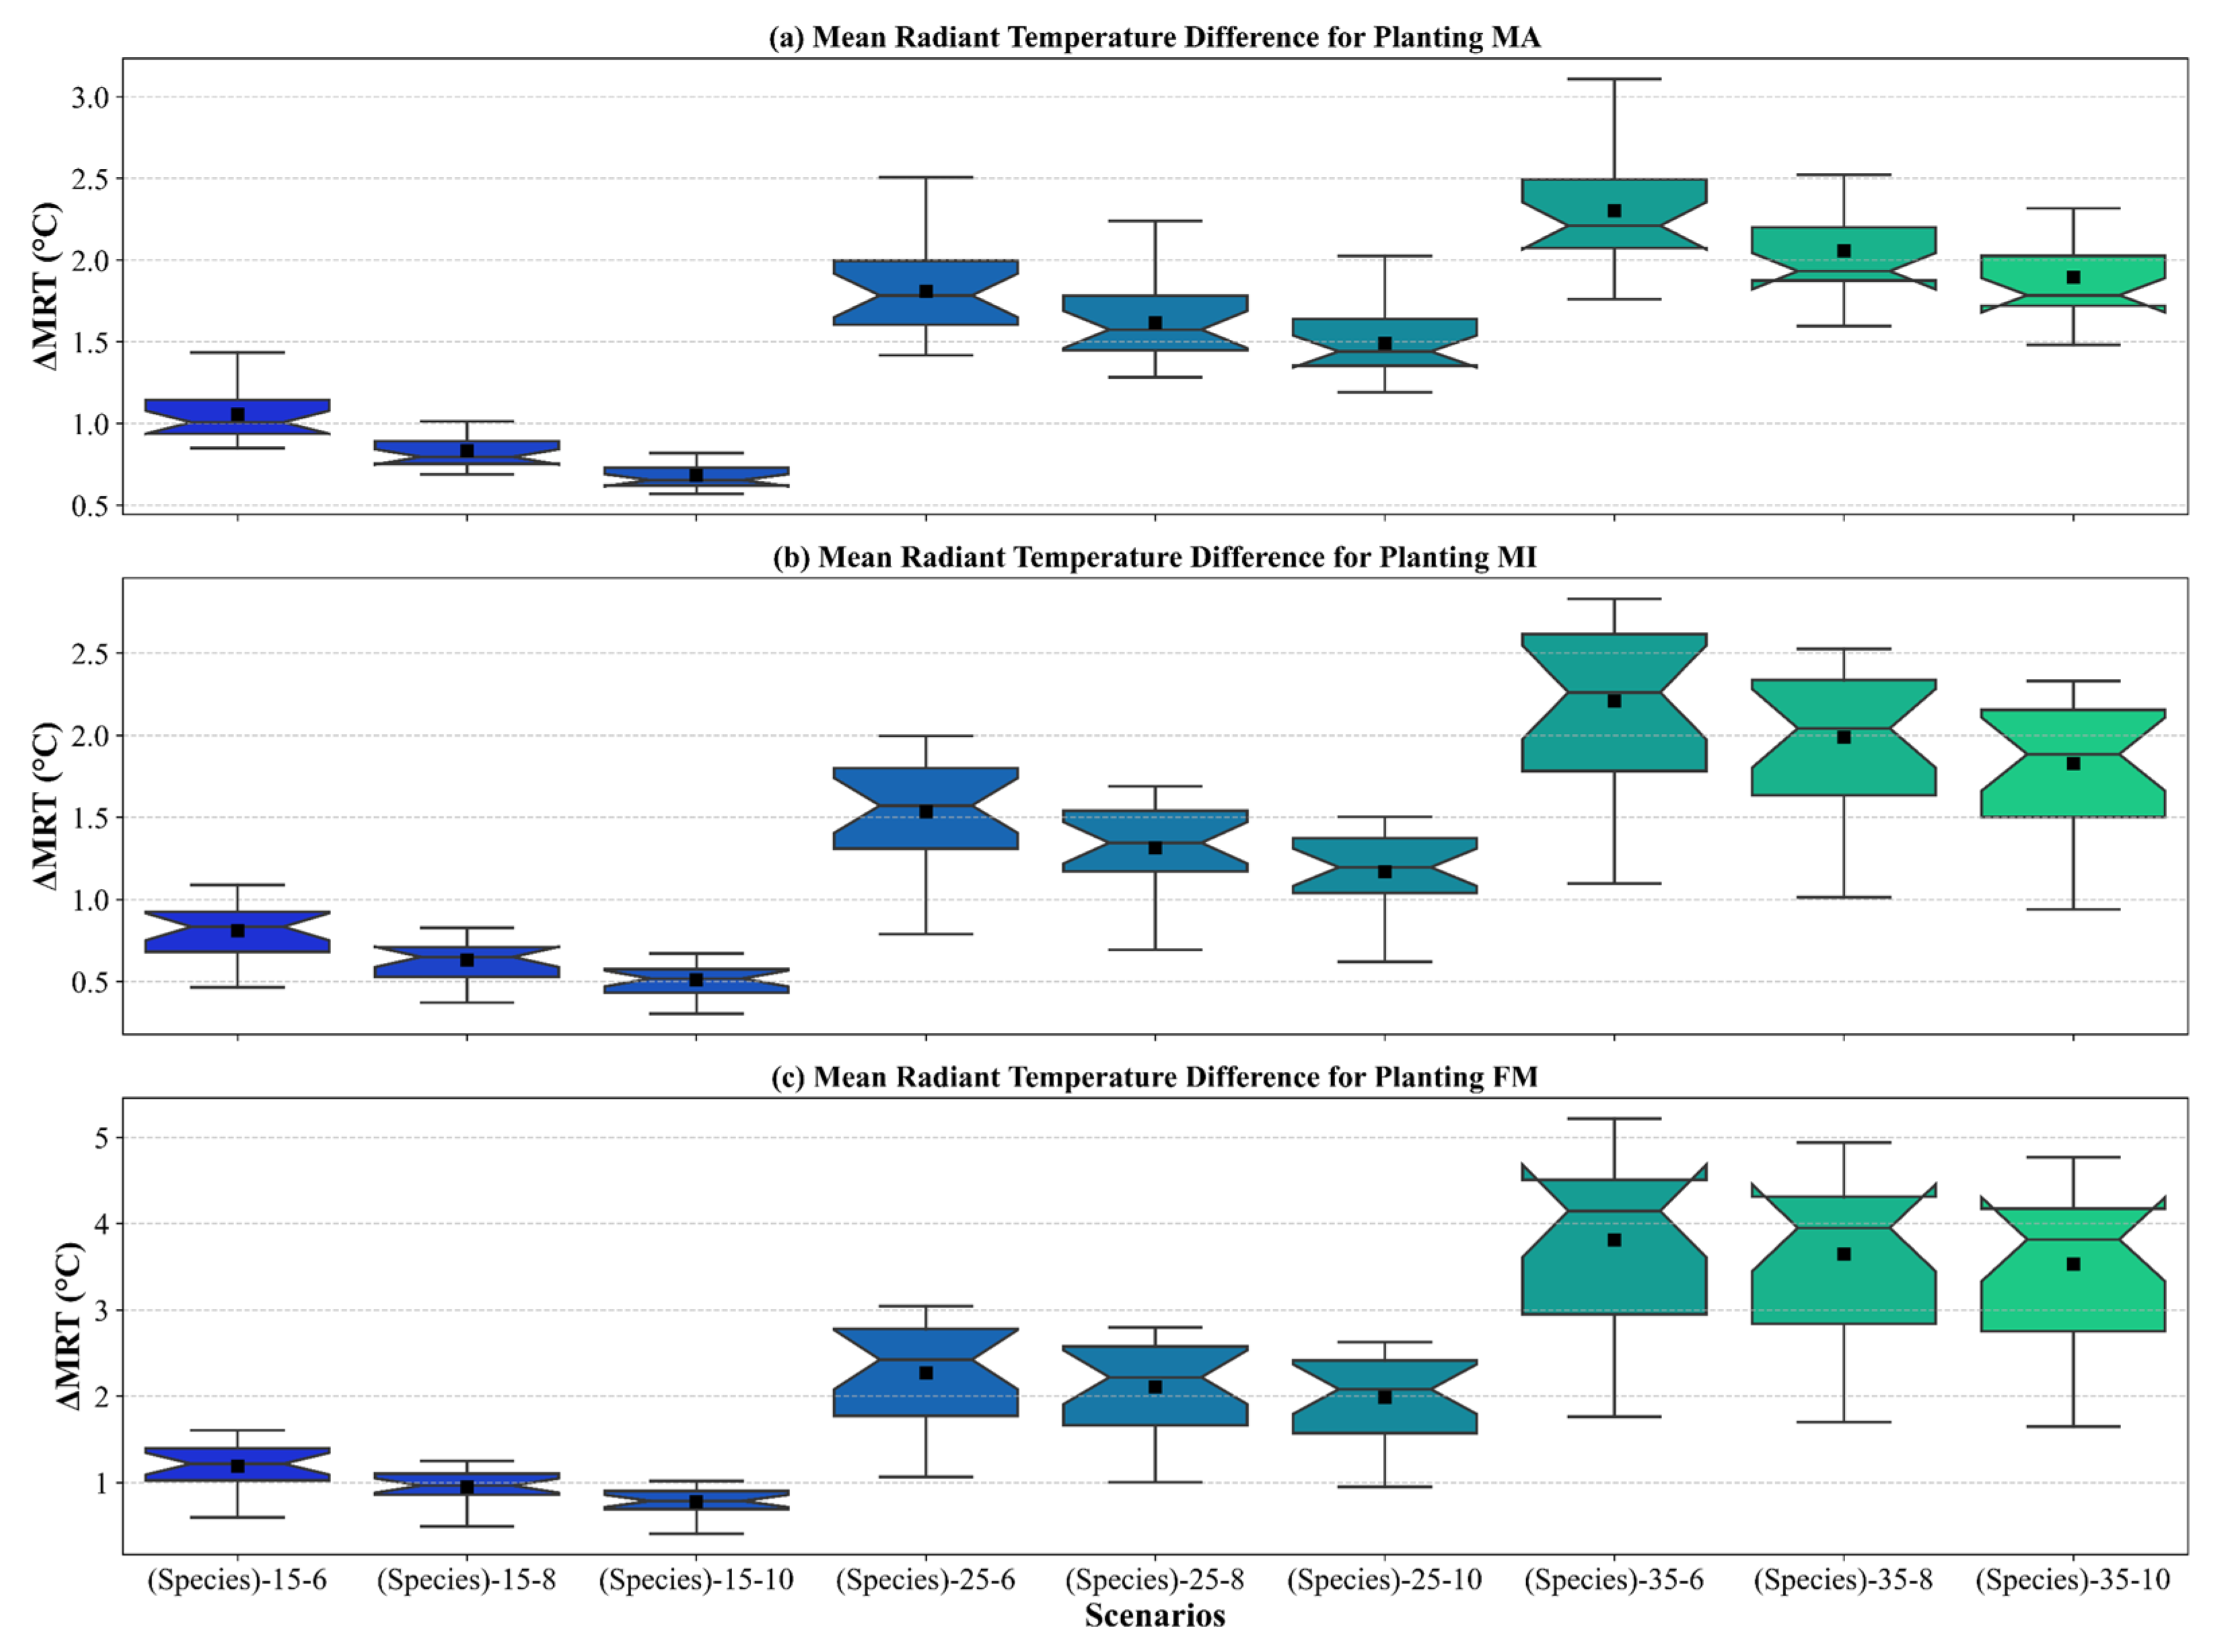
3.4. Decrease in MRT

Regardless of tree size or species, MRT decreases (ΔMRT) with reduced planting intervals and as trees grow larger (Figure 7). For scenarios with varying DBH values, reducing the planting interval by 2 m increased the MRT reduction capacity of MA, MI, and FM by an average of 0.18 °C, 0.17 °C, and 0.16 °C, respectively. For scenarios with different planting intervals, increasing the DBH by 10 cm enhanced MRT reduction by 0.61 °C, 0.68 °C, and 1.35 °C for MA, MI, and FM, respectively. Tree size emerged as the dominant factor affecting ΔMRT, with FM showing the greatest cooling benefit during growth. FM consistently reduced MRT more than the other species at all growth stages, especially at maturity. For example, FM with a 35 cm DBH and a 6 m planting interval reduced MRT by an average of 3.81 °C. MA had stronger cooling capacity than MI at earlier growth stages, but their effectiveness converged at maturity. Dense planting led to overlapping shadows, making FM less suited to tighter intervals. At a 35 cm DBH, FM with a 10 m planting interval provided comparable cooling benefits to a 6 m interval, with only a slight increase of 6.84 W/m2 in SR and 0.28 °C in MRT. Overall, FM demonstrated the most significant cooling improvement during growth, thanks to its large, dense canopy, which effectively blocked SR. With a 6 m planting interval, MRT reduction for MA, MI, and FM increased by 1.25 °C, 1.40 °C, and 2.62 °C, respectively, as DBH grew from 15 cm to 35 cm.

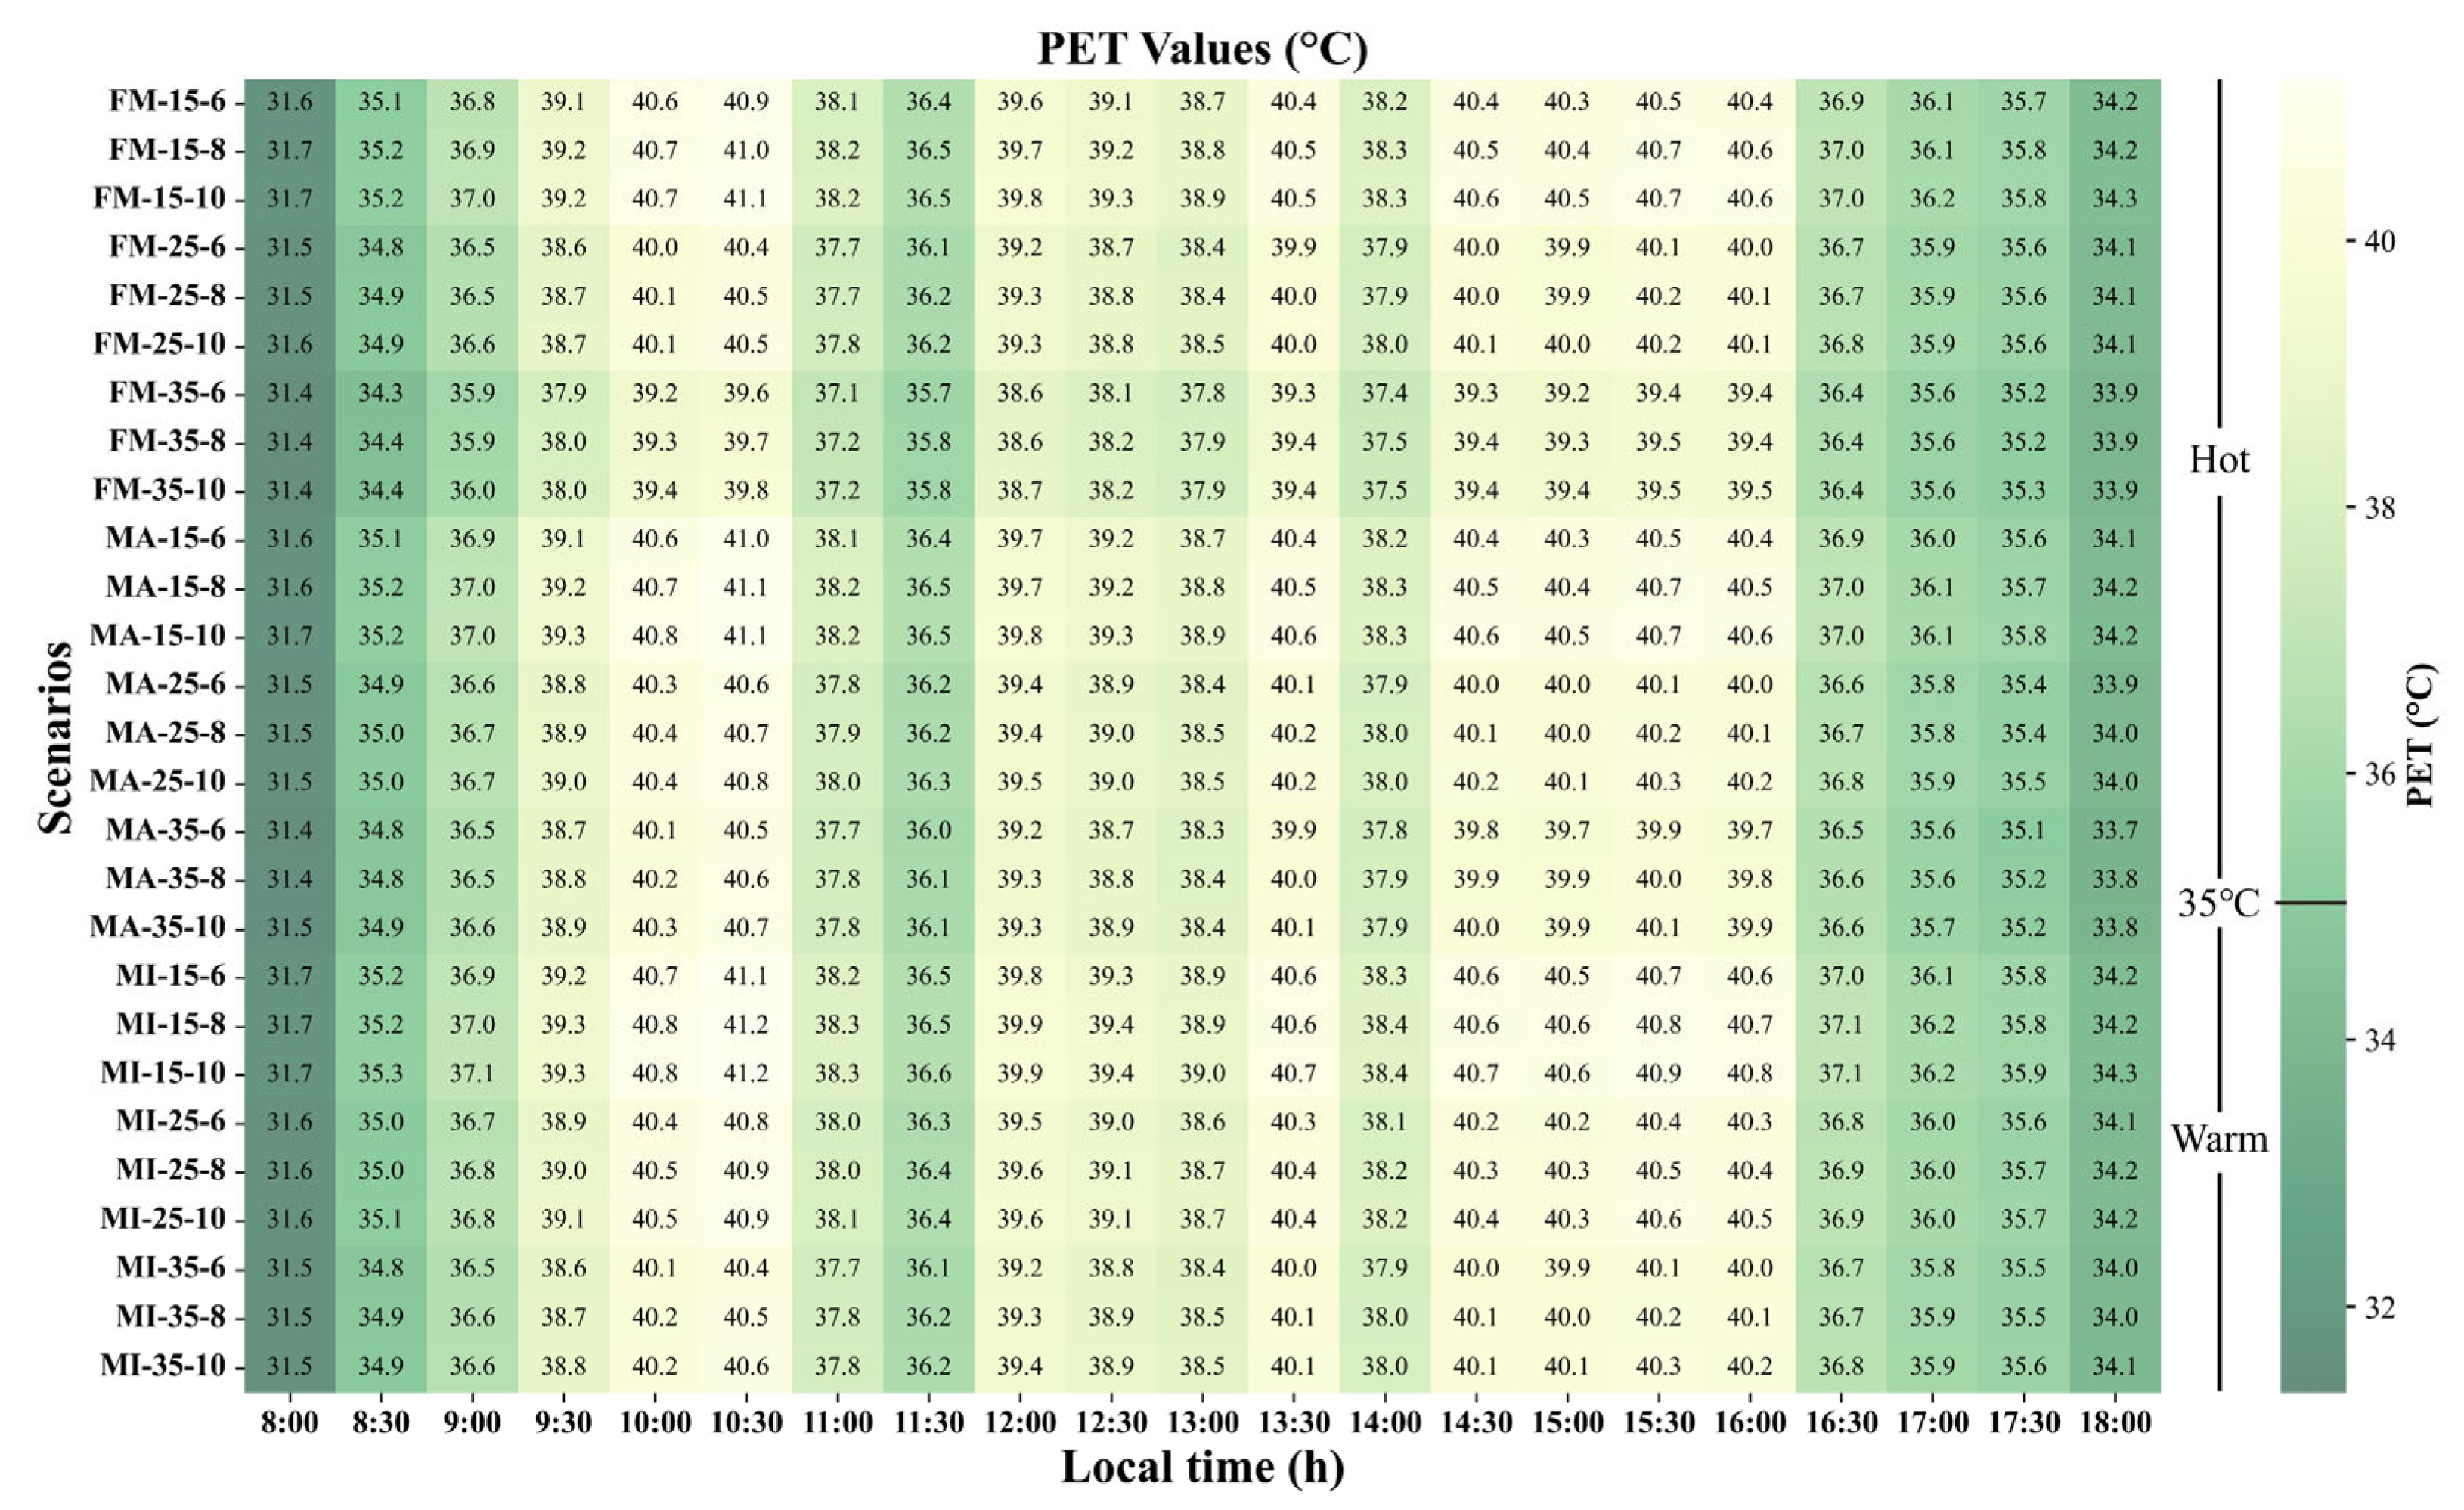
3.5. Thermal Comfort Assessment

Figure 8 and Figure 9 illustrate the reduction in PET under different scenarios, showing patterns similar to those observed for SR and MRT. From 9:30 to 17:00 local time, all scenarios fall within the “Hot” PET category, while the rest of the time is categorized as “Warm”. Although tree planting provides a cooling effect, it remains challenging to lower the plaza’s average PET to the “Warm” category or below. Nonetheless, several key findings were observed. Larger trees and closer planting intervals resulted in greater PET reductions. For every 10 cm increase in DBH, the average PET reduction was 0.23 °C for MA and MI and 0.46 °C for FM. Planting interval had a minimal impact on PET reduction, with an increase of 2 m in spacing leading to changes of less than 0.1 °C in PET reduction for all tree species. For trees with a 15 cm DBH, MA, MI, and FM reduced PET by up to 0.56 °C, 0.37 °C, and 0.56 °C, with average reductions of 0.31 °C, 0.21 °C, and 0.31 °C, respectively. For a 25 cm DBH, the maximum PET reductions were 0.98 °C, 0.71 °C, and 1.04 °C, with averages of 0.61 °C, 0.45 °C, and 0.69 °C. For a 35 cm DBH, maximum PET reductions were 1.28 °C, 0.99 °C, and 1.82 °C, with averages of 0.77 °C, 0.67 °C, and 1.22 °C, respectively. These results indicate that for smaller trees, MA and FM provided similar improvements in thermal comfort, while MI showed weaker regulation due to its smaller LAI, height, and crown width. At intermediate growth stages, FM and MA had comparable effects, with FM reducing PET by less than 0.1 °C more than MA. However, at full maturity, FM’s large canopy and high LAI significantly outperformed MA, reducing PET by an average of 0.45 °C more. At this stage, MI and MA showed similar performance, with only a 0.1 °C difference in PET reduction. A comparison between the scenario with a 25 cm DBH and a 6 m planting interval (22 trees per row) and the scenario with a 35 cm DBH and a 10 m planting interval (12 trees per row) revealed that, except for FM at 35 cm DBH, which exhibited exceptional cooling benefits, the PET improvements for MA and MI were nearly identical under both conditions.

4. Discussion

Few studies have considered the effects of different tree growth stages on microclimates. This study, based on ENVI-met simulations, investigated the cooling benefits of three common tree species in a subtropical urban square. Despite the lack of growth rate data for specific tree species and the inability to establish a direct relationship between tree growth years and thermal comfort, several key findings and design recommendations have emerged.
Closer planting intervals enhance thermal comfort more effectively (Appendix A). For example, at a DBH of 15 cm, both Michelia alba (tree height = 9 m, crown width = 5 m, LAI = 1.88) and Ficus microcarpa L. f. (tree height = 5 m, crown width = 4 m, LAI = 2.60) exhibited similar cooling effects, whereas Mangifera indica (tree height = 5 m, crown width = 3 m, LAI = 0.98) was less effective due to its smaller canopy and LAI. For 25 cm DBH, MA had a taller height (12 m), while Ficus microcarpa L. f. had a larger crown width (9 m) and higher LAI (4.90). At 35 cm DBH, FM (tree height = 8 m, crown width = 14 m, LAI = 7.20) demonstrated the strongest cooling effects. However, overly dense planting is not recommended. The study confirmed a threshold effect [84], where planting intervals of 10 m or more already achieve significant cooling benefits, and further reducing intervals has minimal impact on MRT, SR, and PET. For example, FM with a 35 cm DBH and 10 m interval produced comparable cooling effects to a 6 m interval, with negligible differences in PET reduction.
Yekang Ko et al. conducted a study in California, USA, investigating the growth rates of 297 trees from seven species in residential areas [85]. They found that the annual canopy growth rate ranged from 0.13 to 0.48 m/year, with both the mean and median values at 0.34 m/year. The study also revealed that large trees exhibited faster growth rates after maturity, small trees grew more slowly, and medium-sized trees had the highest survival rates. In this study, with tree diameters at breast height ranging from 15 cm to 35 cm, the canopy growth of Michelia alba, Mangifera indica, and Ficus microcarpa L. f. was approximately 3 m, 6 m, and 10 m, respectively. The time required for these growths might be around 10 years, 18 years, and 30 years, or even longer [85]. From a long-term perspective, planting moderately mature trees (e.g., 25 cm DBH) is an optimal strategy. At this stage, MA and FM show comparable cooling effects. While FM at 35 cm DBH offers exceptional cooling (reducing PET by up to 1.8 °C), its long maturation period (30+ years) suggests that a mixed planting strategy, such as interspersing MA and FM, could be more practical. MA provides immediate cooling benefits, while FM offers superior long-term performance.
Additionally, studies indicate that factors such as growth environment, water availability, pests, climate change, and human interference significantly affect canopy development and transpiration, thus influencing thermal comfort [86,87,88,89]. Plant physiological traits, such as stomatal conductance, photosynthesis, and water-use efficiency, play a key role in regulating transpiration rates and canopy cooling performance [59,90,91]. Therefore, in subtropical cities, selecting plant species with high transpiration rates, such as Ficus microcarpa L. f., Mangifera indica, and Bauhinia blakeana, combined with their shading effects [59], can effectively enhance cooling performance and improve thermal comfort. However, to fully realize these cooling benefits, regular maintenance and irrigation are essential; proper maintenance not only ensures adequate water supply for transpiration but also supports healthy canopy development [92]. Research further shows that pruning should focus on retaining higher branches to preserve canopy density and LAI, particularly for slower-growing species, while avoiding excessive branch removal to maintain optimal cooling performance [93,94]. In future studies, the cooling potential of diverse vegetation combinations, including trees, shrubs, and lawns, warrants further exploration to optimize urban greening strategies and enhance thermal comfort through complementary mechanisms.
Beyond cooling benefits, it is crucial to recognize the broader social, esthetic, economic, and environmental benefits of trees, such as carbon sequestration, energy savings, and health improvements [95]. The approach of “the more trees, the better” is impractical in urban contexts, as excessive planting can lead to pollutant accumulation and reduced thermal comfort [96]. Future studies should explore the synergistic effects of different tree species combinations, balancing growth rates to optimize cooling performance [97]. As a key landscape element, urban tree planting strategies must consider multiple benefits, user needs, and site-specific characteristics to create comfortable, healthy urban environments.
This study has some limitations. It is important to note that the meteorological data were collected on a single representative day with stable weather conditions. While this limits the ability to assess the influence of varying background weather conditions, the findings primarily reflect the effects of tree species, size, and planting intervals on SR reduction. Future studies incorporating multiple days under diverse weather scenarios will help further validate these results. It focuses solely on daytime microclimatic effects of trees in a humid, hot city during summer and does not account for different climates, seasons, or nighttime conditions. Future research should include long-term observations across diverse contexts. Additionally, the tree growth model used here is based on morphological regressions, without accounting for growth rates and years. Further studies should investigate how growth environments and climate change affect tree microclimatic performance, collect comprehensive growth data for urban trees in humid regions, and evaluate the thermal comfort impacts of species combinations.

5. Conclusions

This study first validated the applicability and accuracy of the ENVI-met model in simulating microclimatic conditions in humid regions, focusing on parameters including Ta, RH, and MRT. After confirming the model’s reliability, the study simulated the effects of three morphologically distinct tree species at various growth stages and planting intervals on the thermal environment and human thermal comfort in a subtropical urban square. Optimal planting strategies were then discussed. The key findings are as follows:
1. When the planting interval (6, 8, and 10 m) was reduced by 2 m, the ability of Michelia alba, Mangifera indica, and Ficus microcarpa L. f. to reduce incoming solar radiation and mean radiant temperature increased by an average of 5.43 W/m2 and 0.18 °C, 4.98 W/m2 and 0.17 °C, and 4.52 W/m2 and 0.16 °C, respectively. However, the reduction in PET remained minimal, with increases of 0.1 °C.
2. For every 10 cm increase in DBH, Michelia alba, Mangifera indica, and Ficus microcarpa L. f. enhanced their ability to reduce incoming solar radiation and mean radiant temperature by an average of 19.54 W/m2 and 0.61 °C, 18.09 W/m2 and 0.68 °C, and 34.50 W/m2 and 1.35 °C, respectively. Their PET reduction capacity increased by an average of 0.23 °C, 0.23 °C, and 0.46 °C, respectively.
3. Tree size and high LAI are more critical than planting density in improving thermal comfort. To achieve optimal cooling performance and thermal comfort, this study recommends planting all three tree species at a DBH of 25 cm. For Michelia alba and Mangifera indica, a 6 m interval is ideal to maximize shading and transpiration benefits. In contrast, for Ficus microcarpa L. f., an 8 m interval is recommended due to its larger crown width, which prevents overcrowding and maintains effective microclimatic regulation.
This study provides actionable recommendations for landscape architects, urban planners, and policymakers, demonstrating that thoughtful tree selection and placement can significantly improve urban microclimates, contribute to sustainable development, and foster healthier, more comfortable urban environments.

Author Contributions

Conceptualization, Y.X., Y.H. and X.P.; Methodology, Y.X., Y.H. and X.P.; Software, Y.X. and X.P.; Validation, Y.H.; Formal analysis, Y.X., Y.H. and X.P.; Investigation, Y.X.; Resources, X.P.; Writing – original draft, Y.X., Y.H. and X.P.; Visualization, Y.H.; Project administration, X.P.; Funding acquisition, X.P. All authors have read and agreed to the published version of the manuscript.

Funding

This research was funded by the National Natural Science Foundation of China (NO. 52278030).

Institutional Review Board Statement

Not applicable.

Informed Consent Statement

Not applicable.

Data Availability Statement

The data presented in this study are available on request from the corresponding author.

Conflicts of Interest

The authors declare no conflicts of interest.

Appendix A

Three morphological parameters were used in ENVI-met simulations. Table A1, Table A2 and Table A3 show the morphological parameters of Michelia alba, Mangifera indica, and Ficus microcarpa L. f. at different growth stages, respectively.
Table A1. The morphological parameters of MI with different breast diameters.
Mangifera indicaDBH = 15 cmDBH = 25 cmDBH = 35 cm
Crown width (m)369
Tree height (m)578
Leaf albedo0.27
Root depth (m)0.45
Root diameter (m)default value in ENVI-met
LAI0.982.784.5
2–3 m of LAD0.300.490.78
3–4 m of LAD0.400.741.02
4–5 m of LAD0.290.741.01
5–6 m of LAD 0.630.95
6–7 m of LAD 0.180.70
7–8 m of LAD 0.14
Table A2. The morphological parameters of MA with different breast diameters.
Michelia albaDBH = 15 cmDBH = 25 cmDBH = 35 cm
Crown width (m)578
Tree height (m)91215
Leaf albedo0.28
Root depth (m)0.45
Root diameter (m)default value in ENVI-met
LAI1.882.683.48
3–4 m of LAD0.190.290.33
4–5 m of LAD0.300.350.36
5–6 m of LAD0.460.400.39
6–7 m of LAD0.450.400.39
7–8 m of LAD0.380.390.39
8–9 m of LAD0.110.370.38
9–10 m of LAD 0.300.36
10–11 m of LAD 0.170.33
11–12 m of LAD 0.020.28
12–13 m of LAD 0.20
13–14 m of LAD 0.08
14–15 m of LAD 0.01
Table A3. The morphological parameters of FM with different breast diameters.
Ficus microcarpa L. f.DBH = 15 cmDBH = 25 cmDBH = 35 cm
Crown width (m)4914
Tree height (m)568
Leaf albedo0.31
Root depth (m)0.45
Root diameter (m)default value in ENVI-met
LAI2.604.907.20
2–3 m of LAD0.240.801.22
3–4 m of LAD1.371.711.59
4–5 m of LAD0.981.661.59
5–6 m of LAD 0.721.49
6–7 m of LAD 1.10
7–8 m of LAD 0.22

References

  1. Oke, T.R.; Mills, G.; Christen, A.; Voogt, J.A. Urban Climates; Cambridge University Press: Cambridge, UK, 2017; ISBN 978-0-521-84950-0. [Google Scholar]
  2. Anderson, G.B.; Bell, M.L. Heat Waves in the United States: Mortality Risk during Heat Waves and Effect Modification by Heat Wave Characteristics in 43 U.S. Communities. Environ. Health Perspect. 2011, 119, 210–218. [Google Scholar] [CrossRef]
  3. He, B.-J.; Wang, J.; Zhu, J.; Qi, J. Beating the Urban Heat: Situation, Background, Impacts and the Way Forward in China. Renew. Sustain. Energy Rev. 2022, 161, 112350. [Google Scholar] [CrossRef]
  4. He, B.-J.; Zhao, D.; Dong, X.; Xiong, K.; Feng, C.; Qi, Q.; Darko, A.; Sharifi, A.; Pathak, M. Perception, Physiological and Psychological Impacts, Adaptive Awareness and Knowledge, and Climate Justice under Urban Heat: A Study in Extremely Hot-Humid Chongqing, China. Sustain. Cities Soc. 2022, 79, 103685. [Google Scholar] [CrossRef]
  5. Yang, J.; Yin, P.; Sun, J.; Wang, B.; Zhou, M.; Li, M.; Tong, S.; Meng, B.; Guo, Y.; Liu, Q. Heatwave and Mortality in 31 Major Chinese Cities: Definition, Vulnerability and Implications. Sci. Total Environ. 2019, 649, 695–702. [Google Scholar] [CrossRef]
  6. Cheng, K.Y.; Lau, K.; Shek, Y.T.; Liu, Z.; Ng, E. Evaluation on the Performance of Tree View Factor in a High-Density Subtropical City: A Case Study in Hong Kong. Build. Environ. 2023, 239, 110431. [Google Scholar] [CrossRef]
  7. Park, C.Y.; Lee, D.K.; Krayenhoff, E.S.; Heo, H.K.; Hyun, J.H.; Oh, K.; Park, T.Y. Variations in Pedestrian Mean Radiant Temperature Based on the Spacing and Size of Street Trees. Sustain. Cities Soc. 2019, 48, 101521. [Google Scholar] [CrossRef]
  8. Kurn, D.M.; Bretz, S.E.; Huang, B.; Akbari, H. The Potential for Reducing Urban Air Temperatures and Energy Consumption Through Vegetative Cooling; Lawrence Berkeley National Lab: Berkeley, CA, USA, 1994. [Google Scholar]
  9. Forzieri, G.; Miralles, D.G.; Ciais, P.; Alkama, R.; Ryu, Y.; Duveiller, G.; Zhang, K.; Robertson, E.; Kautz, M.; Martens, B.; et al. Increased Control of Vegetation on Global Terrestrial Energy Fluxes. Nat. Clim. Change 2020, 10, 356–362. [Google Scholar] [CrossRef]
  10. Li, Z.; Zhang, J.; Wei, Y.; Hu, D. 3D Urban Landscape Optimization: From the Perspective of Heat Flux-Microclimate Relations. Sustain. Cities Soc. 2023, 97, 104759. [Google Scholar] [CrossRef]
  11. Wong, N.H.; Tan, C.L.; Kolokotsa, D.D.; Takebayashi, H. Greenery as a Mitigation and Adaptation Strategy to Urban Heat. Nat. Rev. Earth Environ. 2021, 2, 166–181. [Google Scholar] [CrossRef]
  12. Liu, Z.; Cheng, K.Y.; He, Y.; Jim, C.Y.; Brown, R.D.; Shi, Y.; Lau, K.; Ng, E. Microclimatic Measurements in Tropical Cities: Systematic Review and Proposed Guidelines. Build. Environ. 2022, 222, 109411. [Google Scholar] [CrossRef]
  13. Monteith, J.L.; Unsworth, M.H. Chapter 3—Transport of Heat, Mass, and Momentum. In Principles of Environmental Physics, 4th ed.; Monteith, J.L., Unsworth, M.H., Eds.; Academic Press: Boston, MA, USA, 2013; pp. 25–35. ISBN 978-0-12-386910-4. [Google Scholar]
  14. Rana, G.; Ferrara, R.M. Air Cooling by Tree Transpiration: A Case Study of Olea europaea, Citrus sinensis and Pinus pinea in Mediterranean Town. Urban Clim. 2019, 29, 100507. [Google Scholar] [CrossRef]
  15. Wang, X.; Rahman, M.A.; Mokroš, M.; Rötzer, T.; Pattnaik, N.; Pang, Y.; Zhang, Y.; Da, L.; Song, K. The Influence of Vertical Canopy Structure on the Cooling and Humidifying Urban Microclimate during Hot Summer Days. Landsc. Urban Plann. 2023, 238, 104841. [Google Scholar] [CrossRef]
  16. Sugawara, H.; Narita, K.; Mikami, T. Vertical Structure of the Cool Island in a Large Urban Park. Urban Clim. 2021, 35, 100744. [Google Scholar] [CrossRef]
  17. Doick, K.J.; Peace, A.; Hutchings, T.R. The Role of One Large Greenspace in Mitigating London’s Nocturnal Urban Heat Island. Sci. Total Environ. 2014, 493, 662–671. [Google Scholar] [CrossRef]
  18. Liao, W.; Guldmann, J.-M.; Hu, L.; Cao, Q.; Gan, D.; Li, X. Linking Urban Park Cool Island Effects to the Landscape Patterns inside and Outside the Park: A Simultaneous Equation Modeling Approach. Landsc. Urban Plann. 2023, 232, 104681. [Google Scholar] [CrossRef]
  19. Li, H.; Zhao, Y.; Wang, C.; Ürge-Vorsatz, D.; Carmeliet, J.; Bardhan, R. Cooling Efficacy of Trees across Cities Is Determined by Background Climate, Urban Morphology, and Tree Trait. Commun. Earth Environ. 2024, 5, 1–14. [Google Scholar] [CrossRef]
  20. Zhao, T.F.; Fong, K.F. Characterization of Different Heat Mitigation Strategies in Landscape to Fight against Heat Island and Improve Thermal Comfort in Hot–Humid Climate (Part I): Measurement and Modelling. Sustain. Cities Soc. 2017, 32, 523–531. [Google Scholar] [CrossRef]
  21. Kumar, P.; Debele, S.E.; Sahani, J.; Rawat, N.; Marti-Cardona, B.; Alfieri, S.M.; Basu, B.; Basu, A.S.; Bowyer, P.; Charizopoulos, N.; et al. Nature-Based Solutions Efficiency Evaluation against Natural Hazards: Modelling Methods, Advantages and Limitations. Sci. Total Environ. 2021, 784, 147058. [Google Scholar] [CrossRef] [PubMed]
  22. Abdi, B.; Hami, A.; Zarehaghi, D. Impact of Small-Scale Tree Planting Patterns on Outdoor Cooling and Thermal Comfort. Sustain. Cities Soc. 2020, 56, 102085. [Google Scholar] [CrossRef]
  23. Lee, H.; Mayer, H.; Chen, L. Contribution of Trees and Grasslands to the Mitigation of Human Heat Stress in a Residential District of Freiburg, Southwest Germany. Landsc. Urban Plann. 2016, 148, 37–50. [Google Scholar] [CrossRef]
  24. de Abreu-Harbich, L.V.; Labaki, L.C.; Matzarakis, A. Effect of Tree Planting Design and Tree Species on Human Thermal Comfort in the Tropics. Landsc. Urban Plann. 2015, 138, 99–109. [Google Scholar] [CrossRef]
  25. Chen, Y.; Zheng, B.; Hu, Y. Numerical Simulation of Local Climate Zone Cooling Achieved through Modification of Trees, Albedo and Green Roofs—a Case Study of Changsha, China. Sustainability 2020, 12, 2752. [Google Scholar] [CrossRef]
  26. Ng, E.; Chen, L.; Wang, Y.; Yuan, C. A Study on the Cooling Effects of Greening in a High-Density City: An Experience from Hong Kong. Build. Environ. 2012, 47, 256–271. [Google Scholar] [CrossRef]
  27. Tan, Z.; Lau, K.K.-L.; Ng, E. Urban Tree Design Approaches for Mitigating Daytime Urban Heat Island Effects in a High-Density Urban Environment. Energy Build. 2016, 114, 265–274. [Google Scholar] [CrossRef]
  28. Zheng, S.; Guldmann, J.-M.; Liu, Z.; Zhao, L. Influence of Trees on the Outdoor Thermal Environment in Subtropical Areas: An Experimental Study in Guangzhou, China. Sustain. Cities Soc. 2018, 42, 482–497. [Google Scholar] [CrossRef]
  29. Zheng, S.; He, C.; Xu, H.; Guldmann, J.-M.; Liu, X. Heat Mitigation Benefits of Street Tree Species during Transition Seasons in Hot and Humid Areas: A Case Study in Guangzhou. Forests 2024, 15, 1459. [Google Scholar] [CrossRef]
  30. Cheung, P.K.; Jim, C.Y. Comparing the Cooling Effects of a Tree and a Concrete Shelter Using PET and UTCI. Build. Environ. 2018, 130, 49–61. [Google Scholar] [CrossRef]
  31. Müller, N.; Kuttler, W.; Barlag, A.-B. Counteracting Urban Climate Change: Adaptation Measures and Their Effect on Thermal Comfort. Theor. Appl. Climatol. 2014, 115, 243–257. [Google Scholar] [CrossRef]
  32. McPherson, E.G.; Nowak, D.; Heisler, G.; Grimmond, S.; Souch, C.; Grant, R.; Rowntree, R. Quantifying Urban Forest Structure, Function, and Value: The Chicago Urban Forest Climate Project. Urban Ecosyst. 1997, 1, 49–61. [Google Scholar] [CrossRef]
  33. Rahman, M.A.; Hartmann, C.; Moser-Reischl, A.; von Strachwitz, M.F.; Paeth, H.; Pretzsch, H.; Pauleit, S.; Rötzer, T. Tree Cooling Effects and Human Thermal Comfort under Contrasting Species and Sites. Agric. For. Meteorol. 2020, 287, 107947. [Google Scholar] [CrossRef]
  34. Lin, C.; Yang, J.; Huang, J.; Zhong, R. Examining the Effects of Tree Canopy Coverage on Human Thermal Comfort and Heat Dynamics in Courtyards: A Case Study in Hot-Humid Regions. Atmosphere 2023, 14, 1389. [Google Scholar] [CrossRef]
  35. Zhang, L.; Zhan, Q.; Lan, Y. Effects of the Tree Distribution and Species on Outdoor Environment Conditions in a Hot Summer and Cold Winter Zone: A Case Study in Wuhan Residential Quarters. Build. Environ. 2018, 130, 27–39. [Google Scholar] [CrossRef]
  36. You, C.; Qu, H.; Feng, C.-C.; Guo, L. Evaluating the Match between Natural Ecosystem Service Supply and Cultural Ecosystem Service Demand: Perspectives on Spatiotemporal Heterogeneity. Environ. Impact Assess. Rev. 2024, 108, 107592. [Google Scholar] [CrossRef]
  37. Liu, Z.; Cheng, W.; Jim, C.Y.; Morakinyo, T.E.; Shi, Y.; Ng, E. Heat Mitigation Benefits of Urban Green and Blue Infrastructures: A Systematic Review of Modeling Techniques, Validation and Scenario Simulation in ENVI-Met V4. Build. Environ. 2021, 200, 107939. [Google Scholar] [CrossRef]
  38. Bartesaghi Koc, C.; Osmond, P.; Peters, A. Evaluating the Cooling Effects of Green Infrastructure: A Systematic Review of Methods, Indicators and Data Sources. Sol. Energy 2018, 166, 486–508. [Google Scholar] [CrossRef]
  39. Buccolieri, R.; Santiago, J.-L.; Rivas, E.; Sanchez, B. Review on Urban Tree Modelling in CFD Simulations: Aerodynamic, Deposition and Thermal Effects. Urban For. Urban Green. 2018, 31, 212–220. [Google Scholar] [CrossRef]
  40. Aminipouri, M.; Knudby, A.J.; Krayenhoff, E.S.; Zickfeld, K.; Middel, A. Modelling the Impact of Increased Street Tree Cover on Mean Radiant Temperature across Vancouver’s Local Climate Zones. Urban For. Urban Green. 2019, 39, 9–17. [Google Scholar] [CrossRef]
  41. Lau, K.K.-L.; Tan, Z.; Morakinyo, T.E.; Ren, C. Effect of Tree Species on Outdoor Thermal Comfort. In Outdoor Thermal Comfort in Urban Environment: Assessments and Applications in Urban Planning and Design; Lau, K.K.-L., Tan, Z., Morakinyo, T.E., Ren, C., Eds.; Springer: Singapore, 2022; pp. 101–123. ISBN 978-981-16-5245-5. [Google Scholar]
  42. Tan, Z.; Wang, A.; Morakinyo, T.E.; Yung, E.H.K.; Chan, E.H.W. Assessing the Mitigation Performance of Building Setback from Street and the Combination with Roadside Tree Planting. Build. Environ. 2022, 212, 108814. [Google Scholar] [CrossRef]
  43. Morakinyo, T.E.; Ouyang, W.; Lau, K.K.-L.; Ren, C.; Ng, E. Right Tree, Right Place (Urban Canyon): Tree Species Selection Approach for Optimum Urban Heat Mitigation - Development and Evaluation. Sci. Total Environ. 2020, 719, 137461. [Google Scholar] [CrossRef] [PubMed]
  44. Yang, J.; Zhao, Y.; Zou, Y.; Xia, D.; Lou, S.; Liu, W.; Ji, K. Effects of Tree Species and Layout on the Outdoor Thermal Environment of Squares in Hot-Humid Areas of China. Buildings 2022, 12, 1867. [Google Scholar] [CrossRef]
  45. Chen, L.; Wen, Y.; Zhang, L.; Xiang, W.-N. Studies of Thermal Comfort and Space Use in an Urban Park Square in Cool and Cold Seasons in Shanghai. Build. Environ. 2015, 94, 644–653. [Google Scholar] [CrossRef]
  46. Bruse, M.; Fleer, H. Simulating Surface–Plant–Air Interactions inside Urban Environments with a Three Dimensional Numerical Model. Environ. Modell. Software 1998, 13, 373–384. [Google Scholar] [CrossRef]
  47. Peel, M.C.; Finlayson, B.L.; McMahon, T.A. Updated World Map of the Köppen-Geiger Climate Classification. Hydrol. Earth Syst. Sci. 2007, 11, 1633–1644. [Google Scholar] [CrossRef]
  48. Wu, H.; Jin, R.; Liu, M.; Nie, Z.; Zhao, H.; Yao, L.; Zhao, L. Investigating the Potential of Street Trees in Mitigating Pedestrian Thermal Stress during Heatwaves Conditions: An Empirical Study in Guangzhou. Build. Environ. 2024, 265, 111955. [Google Scholar] [CrossRef]
  49. Qi, Q.; Meng, Q.; Wang, J.; He, B.; Liang, H.; Ren, P. Applicability of Mobile-Measurement Strategies to Different Periods: A Field Campaign in a Precinct with a Block Park. Build. Environ. 2022, 211, 108762. [Google Scholar] [CrossRef]
  50. Yang, X.; Zhao, L.; Bruse, M.; Meng, Q. An Integrated Simulation Method for Building Energy Performance Assessment in Urban Environments. Energy Build. 2012, 54, 243–251. [Google Scholar] [CrossRef]
  51. Ouyang, W.; Sinsel, T.; Simon, H.; Morakinyo, T.E.; Liu, H.; Ng, E. Evaluating the Thermal-Radiative Performance of ENVI-Met Model for Green Infrastructure Typologies: Experience from a Subtropical Climate. Build. Environ. 2022, 207, 108427. [Google Scholar] [CrossRef]
  52. Sinsel, T.; Simon, H.; Ouyang, W.; dos Santos Gusson, C.; Shinzato, P.; Bruse, M. Implementation and Evaluation of Mean Radiant Temperature Schemes in the Microclimate Model ENVI-Met. Urban Clim. 2022, 45, 101279. [Google Scholar] [CrossRef]
  53. Lai, D.; Liu, Y.; Liao, M.; Yu, B. Effects of Different Tree Layouts on Outdoor Thermal Comfort of Green Space in Summer Shanghai. Urban Clim. 2023, 47, 101398. [Google Scholar] [CrossRef]
  54. Guo, T.; Lin, Z.; Zhao, Y.; Fang, Z.; Fan, Y.; Zhang, X.; Yang, J.; Li, Y. Investigation and Optimization of Outdoor Thermal Comfort in Elementary School Campuses: Example from a Humid-Hot Area in China. Build. Environ. 2024, 248, 111055. [Google Scholar] [CrossRef]
  55. Kántor, N.; Kovács, A.; Lin, T.-P. Looking for Simple Correction Functions between the Mean Radiant Temperature from the “Standard Black Globe” and the “Six-Directional” Techniques in Taiwan. Theor. Appl. Climatol. 2015, 121, 99–111. [Google Scholar] [CrossRef]
  56. Willmott, C.J.; Matsuura, K. Advantages of the Mean Absolute Error (MAE) over the Root Mean Square Error (RMSE) in Assessing Average Model Performance. Clim. Res. 2005, 30, 79–82. [Google Scholar] [CrossRef]
  57. Liu, Z.; Brown, R.D.; Zheng, S.; Jiang, Y.; Zhao, L. An In-Depth Analysis of the Effect of Trees on Human Energy Fluxes. Urban For. Urban Green. 2020, 50, 126646. [Google Scholar] [CrossRef]
  58. Liu, Z.; Zheng, S.; Zhao, L. Evaluation of the ENVI-Met Vegetation Model of Four Common Tree Species in a Subtropical Hot-Humid Area. Atmosphere 2018, 9, 198. [Google Scholar] [CrossRef]
  59. Zheng, S.; Guldmann, J.-M.; Wang, Z.; Qiu, Z.; He, C.; Wang, K. Experimental and Theoretical Study of Urban Tree Instantaneous and Hourly Transpiration Rates and Their Cooling Effect in Hot and Humid Area. Sustain. Cities Soc. 2021, 68, 102808. [Google Scholar] [CrossRef]
  60. Yang, Y.; Zhou, D.; Wang, Y.; Meng, X.; Gu, Z.; Xu, D.; Han, X. Planning Method of Centralized Greening in High-Rise Residential Blocks Based on Improvement of Thermal Comfort in Summer. Sustain. Cities Soc. 2022, 80, 103802. [Google Scholar] [CrossRef]
  61. Estacio, I.; Hadfi, R.; Blanco, A.; Ito, T.; Babaan, J. Optimization of Tree Positioning to Maximize Walking in Urban Outdoor Spaces: A Modeling and Simulation Framework. Sustain. Cities Soc. 2022, 86, 104105. [Google Scholar] [CrossRef]
  62. Cheng, X.-L.; Nizamani, M.M.; Jim, C.-Y.; Qureshi, S.; Liu, S.; Zhu, Z.-X.; Wu, S.-S.; Balfour, K.; Wang, H.-F. Response of Urban Tree DBH to Fast Urbanization: Case of Coastal Zhanjiang in South China. Urban Ecosyst. 2022, 25, 511–522. [Google Scholar] [CrossRef]
  63. Hui, L.C.; Jim, C.Y.; Zhang, H. Allometry of Urban Trees in Subtropical Hong Kong and Effects of Habitat Types. Landsc. Ecol. 2020, 35, 1143–1160. [Google Scholar] [CrossRef]
  64. Hauer, R.J.; Koeser, A.K.; Parbs, S.; Kringer, J.; Krouse, R.; Ottman, K.; Miller, R.W.; Sivyer, D.; Timilsina, N.; Werner, L.P. Long-Term Effects and Development of a Tree Preservation Program on Tree Condition, Survival, and Growth. Landsc. Urban Plann. 2020, 193, 103670. [Google Scholar] [CrossRef]
  65. Chau, N.L.; Jim, C.Y.; Zhang, H. Species-Specific Holistic Assessment of Tree Structure and Defects in Urban Hong Kong. Urban For. Urban Green. 2020, 55, 126813. [Google Scholar] [CrossRef]
  66. McPherson, E.G.; Xiao, Q.; van Doorn, N.S.; Johnson, N.; Albers, S.; Peper, P.J. Shade Factors for 149 Taxa of In-Leaf Urban Trees in the USA. Urban For. Urban Green. 2018, 31, 204–211. [Google Scholar] [CrossRef]
  67. Guo, T.; Zhao, Y.; Yang, J.; Zhong, Z.; Ji, K.; Zhong, Z.; Luo, X. Effects of Tree Arrangement and Leaf Area Index on the Thermal Comfort of Outdoor Children’s Activity Space in Hot-Humid Areas. Buildings 2023, 13, 214. [Google Scholar] [CrossRef]
  68. Lalic, B.; Mihailovic, D.T. An Empirical Relation Describing Leaf-Area Density inside the Forest for Environmental Modeling. J. Appl. Meteorol. Climatol. 2004, 43, 641–645. [Google Scholar] [CrossRef]
  69. Niu, J.; Xiong, J.; Qin, H.; Hu, J.; Deng, J.; Han, G.; Yan, J. Influence of Thermal Comfort of Green Spaces on Physical Activity: Empirical Study in an Urban Park in Chongqing, China. Build. Environ. 2022, 219, 109168. [Google Scholar] [CrossRef]
  70. Potchter, O.; Cohen, P.; Lin, T.-P.; Matzarakis, A. A Systematic Review Advocating a Framework and Benchmarks for Assessing Outdoor Human Thermal Perception. Sci. Total Environ. 2022, 833, 155128. [Google Scholar] [CrossRef] [PubMed]
  71. Lam, C.K.C.; Weng, J.; Liu, K.; Hang, J. The Effects of Shading Devices on Outdoor Thermal and Visual Comfort in Southern China during Summer. Build. Environ. 2023, 228, 109743. [Google Scholar] [CrossRef]
  72. Luo, X.; Zhao, Y.; Yang, J.; Li, Y.; Luo, Z. Adaptive Design Strategies for Thermal Comfort in Waterfront Campsites during Summer in Hot and Humid Regions. Int. J. Therm. Sci. 2024, 199, 108945. [Google Scholar] [CrossRef]
  73. Luo, X.; Zhao, Y.; Li, Y.; Yang, J.; Guo, T. Effects of Tree Species and Planting Forms on the Thermal Comfort of Campsites in Hot and Humid Areas of China. Int. J. Biometeorol. 2024, 68, 1437–1449. [Google Scholar] [CrossRef]
  74. Teshnehdel, S.; Akbari, H.; Di Giuseppe, E.; Brown, R.D. Effect of Tree Cover and Tree Species on Microclimate and Pedestrian Comfort in a Residential District in Iran. Build. Environ. 2020, 178, 106899. [Google Scholar] [CrossRef]
  75. Yang, Y.; Zhou, D.; Wang, Y.; Ma, D.; Chen, W.; Xu, D.; Zhu, Z. Economical and Outdoor Thermal Comfort Analysis of Greening in Multistory Residential Areas in Xi’an. Sustain. Cities Soc. 2019, 51, 101730. [Google Scholar] [CrossRef]
  76. Matzarakis, A.; Rutz, F.; Mayer, H. Modelling Radiation Fluxes in Simple and Complex Environments: Basics of the RayMan Model. Int. J. Biometeorol. 2010, 54, 131–139. [Google Scholar] [CrossRef] [PubMed]
  77. Matzarakis, A.; Rutz, F.; Mayer, H. Modelling Radiation Fluxes in Simple and Complex Environments—Application of the RayMan Model. Int. J. Biometeorol. 2007, 51, 323–334. [Google Scholar] [CrossRef] [PubMed]
  78. Matzarakis, A.; Mayer, H.; Iziomon, M.G. Applications of a Universal Thermal Index: Physiological Equivalent Temperature. Int. J. Biometeorol. 1999, 43, 76–84. [Google Scholar] [CrossRef]
  79. Fang, Z.; Xu, X.; Zhou, X.; Deng, S.; Wu, H.; Liu, J.; Lin, Z. Investigation into the Thermal Comfort of University Students Conducting Outdoor Training. Build. Environ. 2019, 149, 26–38. [Google Scholar] [CrossRef]
  80. Fang, Z.; Feng, X.; Xu, X.; Zhou, X.; Lin, Z.; Ji, Y. Investigation into Outdoor Thermal Comfort Conditions by Different Seasonal Field Surveys in China, Guangzhou. Int. J. Biometeorol. 2019, 63, 1357–1368. [Google Scholar] [CrossRef] [PubMed]
  81. Tsoka, S.; Tsikaloudaki, A.; Theodosiou, T. Analyzing the ENVI-Met Microclimate Model’s Performance and Assessing Cool Materials and Urban Vegetation Applications—A Review. Sustain. Cities Soc. 2018, 43, 55–76. [Google Scholar] [CrossRef]
  82. Aleksandrowicz, O.; Saroglou, T.; Pearlmutter, D. Evaluation of Summer Mean Radiant Temperature Simulation in ENVI-Met in a Hot Mediterranean Climate. Build. Environ. 2023, 245, 110881. [Google Scholar] [CrossRef]
  83. Liu, S.; Middel, A.; Fang, X.; Wu, R. ENVI-Met Model Performance Evaluation for Courtyard Simulations in Hot-Humid Climates. Urban Clim. 2024, 55, 101909. [Google Scholar] [CrossRef]
  84. Xiao, Q.; Fan, X.; Guo, Y.; Li, S.; He, W.; Deng, Y.; Xiao, Z.; Wang, P.; Wu, C. Tree Form Characteristics as Criteria for Tree Species Selection to Improve Pedestrian Thermal Comfort in Street Canyons: Case Study of a Humid Subtropical City. Sustain. Cities Soc. 2024, 105, 105339. [Google Scholar] [CrossRef]
  85. Ko, Y.; Lee, J.-H.; McPherson, E.G.; Roman, L.A. Long-Term Monitoring of Sacramento Shade Program Trees: Tree Survival, Growth and Energy-Saving Performance. Landsc. Urban Plann. 2015, 143, 183–191. [Google Scholar] [CrossRef]
  86. Dervishi, V.; Poschenrieder, W.; Rötzer, T.; Moser-Reischl, A.; Pretzsch, H. Effects of Climate and Drought on Stem Diameter Growth of Urban Tree Species. Forests 2022, 13, 641. [Google Scholar] [CrossRef]
  87. Shu, Q.; Rötzer, T.; Detter, A.; Ludwig, F. Tree Information Modeling: A Data Exchange Platform for Tree Design and Management. Forests 2022, 13, 1955. [Google Scholar] [CrossRef]
  88. Rahman, M.A.; Arndt, S.; Bravo, F.; Cheung, P.K.; van Doorn, N.; Franceschi, E.; del Río, M.; Livesley, S.J.; Moser-Reischl, A.; Pattnaik, N.; et al. More than a Canopy Cover Metric: Influence of Canopy Quality, Water-Use Strategies and Site Climate on Urban Forest Cooling Potential. Landsc. Urban Plann. 2024, 248, 105089. [Google Scholar] [CrossRef]
  89. Franceschi, E.; Moser-Reischl, A.; Honold, M.; Rahman, M.A.; Pretzsch, H.; Pauleit, S.; Rötzer, T. Urban Environment, Drought Events and Climate Change Strongly Affect the Growth of Common Urban Tree Species in a Temperate City. Urban For. Urban Green. 2023, 88, 128083. [Google Scholar] [CrossRef]
  90. Li, S.; Ma, Y.; Yang, X.; Zhang, L.; Xu, Y.; Yuan, X.; Agathokleous, E.; Xu, Y.; Feng, Z. Phenology- and Light-Based Parameterization of Stomatal Conductance Model for Urban Woody Species in Northern China. Environ. Res. 2024, 260, 119658. [Google Scholar] [CrossRef] [PubMed]
  91. Li, C.; Zhang, Y.; Wang, J.; Feng, H.; Zhang, R.; Zhang, W.; Siddique, K.H.M. Considering Water-Temperature Synergistic Factors Improves Simulations of Stomatal Conductance Models under Plastic Film Mulching. Agric. Water Manag. 2024, 306, 109211. [Google Scholar] [CrossRef]
  92. Pattnaik, N.; Honold, M.; Franceschi, E.; Moser-Reischl, A.; Rötzer, T.; Pretzsch, H.; Pauleit, S.; Rahman, M.A. Growth and Cooling Potential of Urban Trees across Different Levels of Imperviousness. J. Environ. Manag. 2024, 361, 121242. [Google Scholar] [CrossRef] [PubMed]
  93. Lecigne, B.; Delagrange, S.; Messier, C. Determinants of Delayed Traumatic Tree Reiteration Growth: Levels of Branch Growth Control and Insights for Urban Tree Management, Modeling and Future Research. Urban For. Urban Green. 2020, 47, 126541. [Google Scholar] [CrossRef]
  94. Jia, J.; Wang, L.; Yao, Y.; Jing, Z.; Zhai, Y.; Ren, Z.; He, X.; Li, R.; Zhang, X.; Chen, Y.; et al. Nonlinear Relationships between Canopy Structure and Cooling Effects in Urban Forests: Insights from 3D Structural Diversity at the Single Tree and Community Scales. Sustain. Cities Soc. 2025, 118, 106012. [Google Scholar] [CrossRef]
  95. van den Berg, M.; Wendel-Vos, W.; van Poppel, M.; Kemper, H.; van Mechelen, W.; Maas, J. Health Benefits of Green Spaces in the Living Environment: A Systematic Review of Epidemiological Studies. Urban For. Urban Green. 2015, 14, 806–816. [Google Scholar] [CrossRef]
  96. Doan, Q.C.; Ma, J.; Chen, S.; Zhang, X. Nonlinear and Threshold Effects of the Built Environment, Road Vehicles and Air Pollution on Urban Vitality. Landsc. Urban Plann. 2025, 253, 105204. [Google Scholar] [CrossRef]
  97. Sugiyama, T.; Carver, A.; Koohsari, M.J.; Veitch, J. Advantages of Public Green Spaces in Enhancing Population Health. Landsc. Urban Plann. 2018, 178, 12–17. [Google Scholar] [CrossRef]
Figure 1. (a) Aerial view of the study area, (b) measurement points, and (c) ENVI-met modeling of the study area.
Atmosphere 16 00063 g001
Figure 2. Meteorological parameters used in ENVI-met simulations and validations. The vertical axes of the subgraphs represent the following parameters: SRdir (direct solar radiation, W/m2), SRdif (diffuse solar radiation, W/m2), LR (longwave radiation emitted by the sky, W/m2), Ta (air temperature, °C), RH (relative humidity, %), and Va (wind speed, m/s).
Atmosphere 16 00063 g002
Figure 3. ENVI-met validation results. The first and second rows of subgraphs depict the comparison between measured and simulated values at Point 1 and Point 2, respectively. The x-axis of each subgraph represents the measured values, while the y-axis represents the ENVI-met simulated values.
Atmosphere 16 00063 g003
Figure 4. Solar radiation difference (ΔSR) compared to no-tree scenario (Case_0) for different tree species, planting intervals, and DBH: (a) for planting MA (Michelia alba), (b) for planting MI (Mangifera indica), and (c) for planting FM (Ficus microcarpa L. f.).
Atmosphere 16 00063 g004
Figure 5. Cooling effect (ΔTa) compared to the no-tree scenario (Case_0) for different tree species, planting intervals, and DBH: (a) for planting MA (Michelia alba), (b) for planting MI (Mangifera indica), and (c) for planting FM (Ficus microcarpa L. f.).
Atmosphere 16 00063 g005
Figure 6. Humidifying effect (ΔRH) compared to the no-tree scenario (Case_0) for different tree species, planting intervals, and DBH: (a) for planting MA (Michelia alba), (b) for planting MI (Mangifera indica), and (c) for planting FM (Ficus microcarpa L. f.).
Atmosphere 16 00063 g006
Figure 7. Mean radiant temperature reduction (ΔMRT) compared to the no-tree scenario (Case_0) for different tree species, planting intervals, and DBH: (a) for planting MA (Michelia alba), (b) for planting MI (Mangifera indica), and (c) for planting FM (Ficus microcarpa L. f.).
Atmosphere 16 00063 g007
Figure 8. Variation in daytime (local time 8:00–18:00) average PET values in different scenarios.
Atmosphere 16 00063 g008
Figure 9. Effects of tree species and planting intervals on the reduction in physiological equivalent temperature (ΔPET) under different DBH conditions: (a) effect of tree species and (b) effect of planting intervals.
Atmosphere 16 00063 g009
Table 1. Technical parameters of measuring instruments.
InstrumentsParametersRangeAccuracySampling Rate
HOBO ProTa−40–70 °C±0.02 °C1 min
RH0–100%±2.5%
Kipp & Zonen CMP3SR300–2800 nm±5.0% (−40–80 °C)
Deltaohm-HD32.3 AP3203.2Tg−30–120 °C±0.15 °C
Kestrel 5500Va0–5 m/s±0.05 m/s
Table 2. Growth models of MI (Mangifera indica), MA (Michelia alba), and FM (Ficus microcarpa L. f.), where DBH is the diameter at breast height (cm), D is the crown width (m), H is tree height (m), and LAI is the leaf area index.
SpeciesMIMAFM
Growth
Models
D B H = 3.62 D + 3.33 D B H = 6.39 D 16.69 D B H = 1.96 D + 7.22
L A I = 0.18 D B H 1.72 L A I = 0.08 D B H + 0.68 L A I = 0.23 D B H 0.86
H = 0.14 D B H + 3.32 H = 0.3 D B H + 4.07 H = 0.17 D B H + 2.2
Table 3. ENVI-met simulation scenarios for three tree species: MI (Mangifera indica), MA (Michelia alba), and FM (Ficus microcarpa L. f.), across three growth stages (DBH = 15 cm, 25 cm, and 35 cm) and planting intervals of 6 m, 8 m, and 10 m.
Planting Interval (m)6810
MIDBH = 15 cmMI-15-6MI-15-8MI-15-10
DBH = 25 cmMI-25-6MI-25-8MI-25-10
DBH = 35 cmMI-35-6MI-35-8MI-35-10
MADBH = 15 cmMA-15-6MA-15-8MA-15-10
DBH = 25 cmMA-25-6MA-25-8MA-25-10
DBH = 35 cmMA-35-6MA-35-8MA-35-10
FMDBH = 15 cmFM-15-6FM-15-8FM-15-10
DBH = 25 cmFM-25-6FM-25-8FM-25-10
DBH = 35 cmFM-35-6FM-35-8FM-35-10
Case-0No tree
Table 4. Thermal sensation/stress classification on the PET scale [78].
Thermal SensationGrade of Physiological StressPET Range (°C)
Very coldExtreme cold stress<4
ColdStrong cold stress4–8
CoolModerate cold stress8–13
Slightly coolSlight cold stress13–18
ComfortableNo thermal stress18–23
Slightly warmSlight heat stress23–29
WarmModerate heat stress29–35
HotStrong heat stress35–41
Very hotExtreme heat stress>41
Disclaimer/Publisher’s Note: The statements, opinions and data contained in all publications are solely those of the individual author(s) and contributor(s) and not of MDPI and/or the editor(s). MDPI and/or the editor(s) disclaim responsibility for any injury to people or property resulting from any ideas, methods, instructions or products referred to in the content.

