Article

Assessment of Rainfall Frequencies from Global Precipitation Datasets

1
Key Laboratory of Hydrometeorological Disaster Mechanism and Warning of Ministry of Water Resources, Nanjing University of Information Science and Technology, Nanjing 210044, China
2
School of Hydrology and Water Resources, Nanjing University of Information Science and Technology, Nanjing 210044, China
*
Author to whom correspondence should be addressed.
Atmosphere 2025, 16(1), 66; https://doi.org/10.3390/atmos16010066
Submission received: 21 December 2024 / Revised: 4 January 2025 / Accepted: 7 January 2025 / Published: 9 January 2025
(This article belongs to the Section Meteorology)

Abstract

:
Rainfall is of vital importance to terrestrial ecosystems and its intermittent characteristics have a profound impact on plant growth, soil biogeochemical cycles, and water resource management. Rainfall frequency, one of the key statistics of rainfall intermittency, has received relatively little research attention. Leveraging scale-dependent relationships in rainfall frequencies and using various global precipitation datasets, we found most grid-scale rainfall frequencies are relatively large and do not converge to the field-scale frequencies as grid size decreases. Specifically, these differences are as high as 41.8% for the Global Precipitation Climatology Project (GPCP) and 74.8% for the fifth-generation European Centre for Medium-Range Weather Forecasts Reanalysis (ERA5), which are much larger than the differences in mean rainfall rates but can be partially corrected by redefining wet days with higher rainfall thresholds. These differences across most regions of the world should be interpreted as the inherent biases associated with the model structure or algorithms used for deriving precipitation data and cannot be reduced simply by increasing the data resolutions. Such biases could propagate into the hydrological process and influence the calibration of the rainfall-runoff process, one of the key nonlinear relationships in land surface modeling. We, therefore, call for urgent research into this topic to avoid misunderstandings of rainfall intermittency and ensure its proper application in various fields.

1. Introduction

Rainfall, essential to life in terrestrial ecosystems, is often described as an intermittent/pulse signal of water flux [1,2]. One of the main statistics of this intermittency is the rainfall frequency, which is estimated as the fraction of the rainy days with the accumulated daily precipitation larger than a specified threshold (e.g., 0.1 mm). The intermittent nature of rainfall has great impacts on plant growth, soil biogeochemical cycle, and water resource management [3,4,5,6,7]. For example, it was found that above-ground net primary productivity and plant water use efficiency are closely associated with rainfall frequency [8,9]. Compared with ambient conditions, the same amount of rainfall with lower frequency increases the root-to-shoot ratio and decreases net primary productivity [10,11]. For terrestrial ecosystems, larger but less frequent rainfall events may lead to a reduction in the proportion of evaporative losses in arid systems, which may result in higher soil water availability [12,13,14]. As a result of lower rainfall frequency, hypoxic periods in wetland ecosystems are expected to be reduced, affecting soil microbial processes and possibly lowering the emission of methane and nitrous oxide [15]. In addition, the leaf onset period is found to be positively correlated with rainfall frequency and reduced rainfall events in future climates could exacerbate water stress for herbaceous plants in semi-arid regions [7,16].
Global daily precipitation datasets are the primary sources for evaluating large-scale rainfall frequency (e.g., across continents). These products, developed from rain gauge observations, remote sensing, and data assimilation [17,18,19,20], have been widely used in various fields including climate research, weather forecast, environmental monitoring, and agriculture management (e.g., [21]). When applied to land surface models, these meteorological forcings can be used to assimilate comprehensive datasets of land surface conditions for detailed hydrometeorological application [22,23]. Extensive research has shown that there are large discrepancies in rainfall statistics among various global datasets [24,25,26,27]. The precision of these precipitation datasets, including their intermittency as explored herein, is paramount for all these applications.
Various factors have contributed to the accuracy of these global datasets. The model structures and resolutions are directly related to the accuracy of rainfall frequency in assimilated or modeled precipitation products [28,29]. The sensor resolutions and algorithms used to derive precipitation from satellite observations are also responsible for certain biases [30,31]. The spatial interpolation techniques employed to generate grid-scale precipitation from site observations also influence the spatial variability of rainfall and affect the following estimations of rainfall frequency [32,33]. Applying these datasets without knowing the uncertainties in rainfall frequency may lead to potential misinterpretations of rainfall variability and could impact their applications across various fields.
However, it should be noted that precipitation from most of these global datasets is often averaged within each grid of relatively large areas and this averaging reduces the spatial variability of rainfall. The rainfall rate is assumed to be homogeneous over each grid cell with a typical size of tens of kilometers. In real conditions, contrasting weather patterns (rain and no rain) can be found in regions a few kilometers apart. It is widely recognized that the rainfall frequency estimated from these global datasets exceeds that derived from rain gauge records [32]. Rainfall frequency tends to be unity at the global scale as it is always raining somewhere over the world; grid-scale rainfall frequency, if it is accurate, should theoretically approach the field-scale value with increasing grid resolutions.
Such spatial smoothing presents a challenge for large-scale data validation. It is impractical to evenly distribute rain gauges over a relatively large area to have the ground truth of rainfall [34]. Radar estimates the reflectivity of the precipitation, which is then converted into rainfall rates using empirical relationships [35]. While providing rainfall measurements over large areas, radars do not have global coverage and their empirical relationships can sometimes smooth out the rainfall heterogeneity [36]. For these reasons, few studies have assessed rainfall frequencies from global precipitation datasets, which are essential for their applications across various fields.
To solve some of these problems, here we made use of rain gauge records and other independent studies to compare rainfall frequency estimated from typical global datasets. Instead of repeating conventional data comparisons, we only chose typical datasets and used the theoretical relationships between field-scale and grid-scale rainfall frequencies to infer the data biases. We found that grid-scale rainfall frequencies are relatively high and do not seem to approach field-scale values with increasing spatial resolutions, suggesting a systematic overestimation of grid-scale rainfall frequency. Such biases, being often overlooked in previous studies, are relatively larger than the biases of average rainfall rate and should receive much research attention in light of their significant impacts on hydrological modeling. The paper is organized as follows: Section 2 describes the data sources and research methods used in this study. Results of field-scale and grid-scale rainfall frequencies from various datasets are presented in Section 3 along with the corresponding biases and their implications. The final discussions are provided in Section 4.

2. Data and Methods

Global precipitation datasets can be classified as gauge-based, satellite-derived, and reanalysis products. Rain gauge records, collected by weather stations across the world, are the most fundamental data sources for the production of global precipitation data. For example, the Global Precipitation Climatology Center (GPCC) collects rain gauge data from various international projects or institutions such as the Climatic Research Unit (CRU), Food and Agriculture Organization (FAO), and Global Historical Climatology Network (GHCN) [37,38,39,40]. The CRU itself, one of the most widely used climate datasets, provides monthly climate variables at 0.5° resolution covering the land surface globally over one century [38,41]. Additional gauge-based global precipitation datasets such as the CPC and GPCC (see the abbreviation list for the full data source names) will also be used in this study. Other local meteorological networks provide useful observations of precipitation, although it remains difficult to access these datasets [42].
It should be noted that the CRU not only provides the climate variable of monthly precipitation (PRE) but also counts the wet days (WET) in the specific month, which, after dividing the overall days of the corresponding month, gives the rainfall frequencies. As illustrated in Figure 1, statistical analysis is conducted on the rain gauge records to obtain wet day counts, which then interpolate onto the grid to generate CRU WET products, whereas CPC and GPCC grid datasets of precipitation directly are directly interpolated from rainfall records. Therefore, rainfall frequencies from grid data of CRU WET may be less influenced by spatial interpolation and still close to field-scale values. This topic will be comprehensively addressed in Section 3.1 by comparing CRU WET with GHCN observations.
Aside from gauge observations and their derivatives, we will use the Global Precipitation Climatology Project (GPCP) and the fifth generation of the European Centre for Medium-Range Weather Forecasts Global Climate Atmospheric Reanalysis (ERA5) to analyze the corresponding rainfall frequency regarding global coverage. The former provides global daily precipitation data on a 2.5-degree grid from 1979 to the present by merging satellite observations, rain gauge measurements, and sounding data [43]; the latter provides hourly precipitation starting from 1940 on a 31 km grid and is used for climate research, weather forecasting, and understanding climate change [44]. We also used other independent studies for a more comprehensive comparison (e.g., [45,46]), which include datasets of CMORPH, TRMM 3B42, PERSIANN CCS, PERSIANN CDR, MSWEP, 20CR, CFSR, NECP1, NCEP2, JRA55, ERA Interim, and MERRA (see abbreviation list).
In this study, rainfall frequencies, λ , are estimated as frequencies of wet days defined as the daily cumulative precipitation over a specified threshold
λ = 1 N i = 1 N Θ ( P i P t ) ,
where N is number of days for the period of consideration, P i is cumulative precipitation in day i, Θ is the Heaviside step function, and P t is the precipitation threshold. To be consistent with the definition of wet days in the CRU for direct comparisons, we use 0.1 mm as the default threshold.Since the Heaviside step function Θ ( x ) is a monotonically increasing function of x, Θ ( P i P t ) is therefore a monotonically decreasing function of P t . Consequently, λ ( P t ) in (1) is also a monotonically decreasing function of P t . Theoretically, the minimal of λ is 0 as P t and the maximum is obtained as P t = 0 .
To quantify the differences between two paired datasets ( X 1 , Y 1 ) , ( X 2 , Y 2 ) , …, ( X n , Y n ) , we used both Pearson correlation coefficient ( ρ ) and relative deviation (RD). The former is defined as
ρ = i = 1 n X i X ¯ Y i Y ¯ i = 1 n X i X ¯ 2 Y i Y ¯ 2
and the latter is
RD = i = 1 n | Y i X i | i = 1 n X i × 100 %
where the overbar refers to the sample averages. The correlation coefficient only measures linear relationships between two sets of data and is not affected by the scale of the data. The nonlinear differences between two datasets may be captured by the relative deviation, which provides insight into how significant the differences are in proportion to the size of the values.
To test whether the linear correlations are statistically significant, we perform t-tests by calculating t-scores:
t = ρ n 2 1 ρ 2 .
The corresponding two-tailed p-values are estimated from Student’s t distribution with degrees of freedom of n 2 . If the estimated p-values are less than the default significant level of 0.05, we would conclude that the correlations are statistically significant.

3. Results and Discussions

Using the methods introduced in the previous section, we assess the rainfall frequencies from CRU WET grid data [38] to verify that these are close to the field-scale observations (Section 3.1). After this verification, we compared CRU WET data with other satellite and reanalysis data to show the differences between field- and grid-scale rainfall frequencies (see Section 3.2). Finally, these differences are interpreted by comparing regional rainfall frequencies against their data resolutions (see Section 3.3).

3.1. Field-Scale Rainfall Frequency

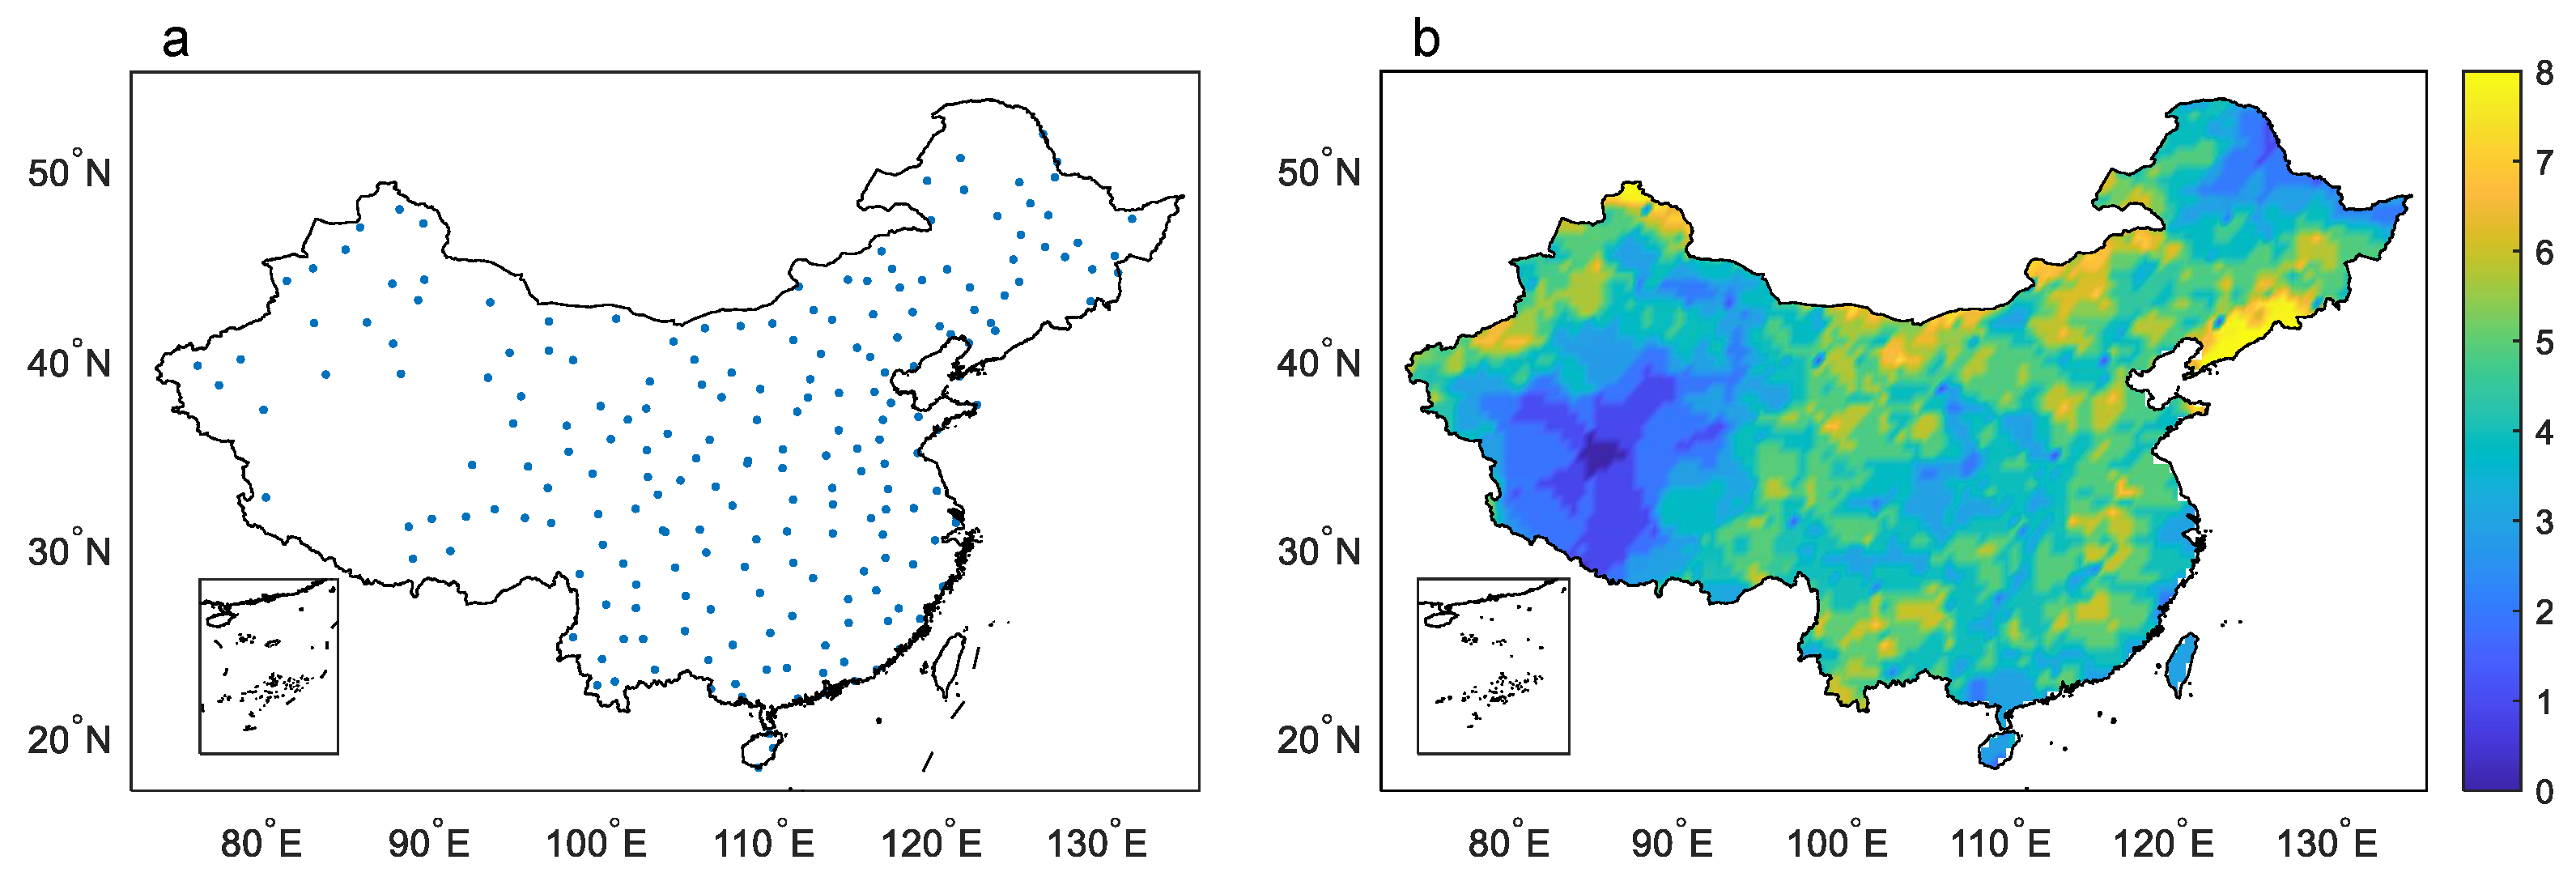
We compared the rainfall frequency from CRU WET and GHCN-Daily over China where there are abundant observations and the corresponding records were collected and maintained by the same methods from one nation. The site locations of GHCN-Daily and the number of stations used for the interpolation of CRU WET data are reported in Figure 2. As can be seen, the spatial distributions of weather stations from CRU and GHCN-Daily are approximately similar with denser networks over eastern, southern, and northern parts of China. Specifically, eight CRU WET stations can be found in each half-degree grid near Liaoning, where there are only a few GHCN-Daily stations. While GHCN-Daily weather stations [47] are one of the main data sources used for compiling CRU WET, there are many other data sources and such inconsistent data sources should partially account for the differences in rainfall frequency from CRU WET and GHCN-Daily.
We used Equation (1) to estimate rainfall frequency from CRU WET as the ratio of wet days to the total length of the days in the corresponding months. GHCN-Daily provides a time series of precipitation records over 211 weather stations across China. Consistent with the wet day definition in CRU WET, we set the wet day precipitation threshold as 0.1 mm. Stations with more than 5 percent of records failing any quality assurance check were excluded from our analyses.
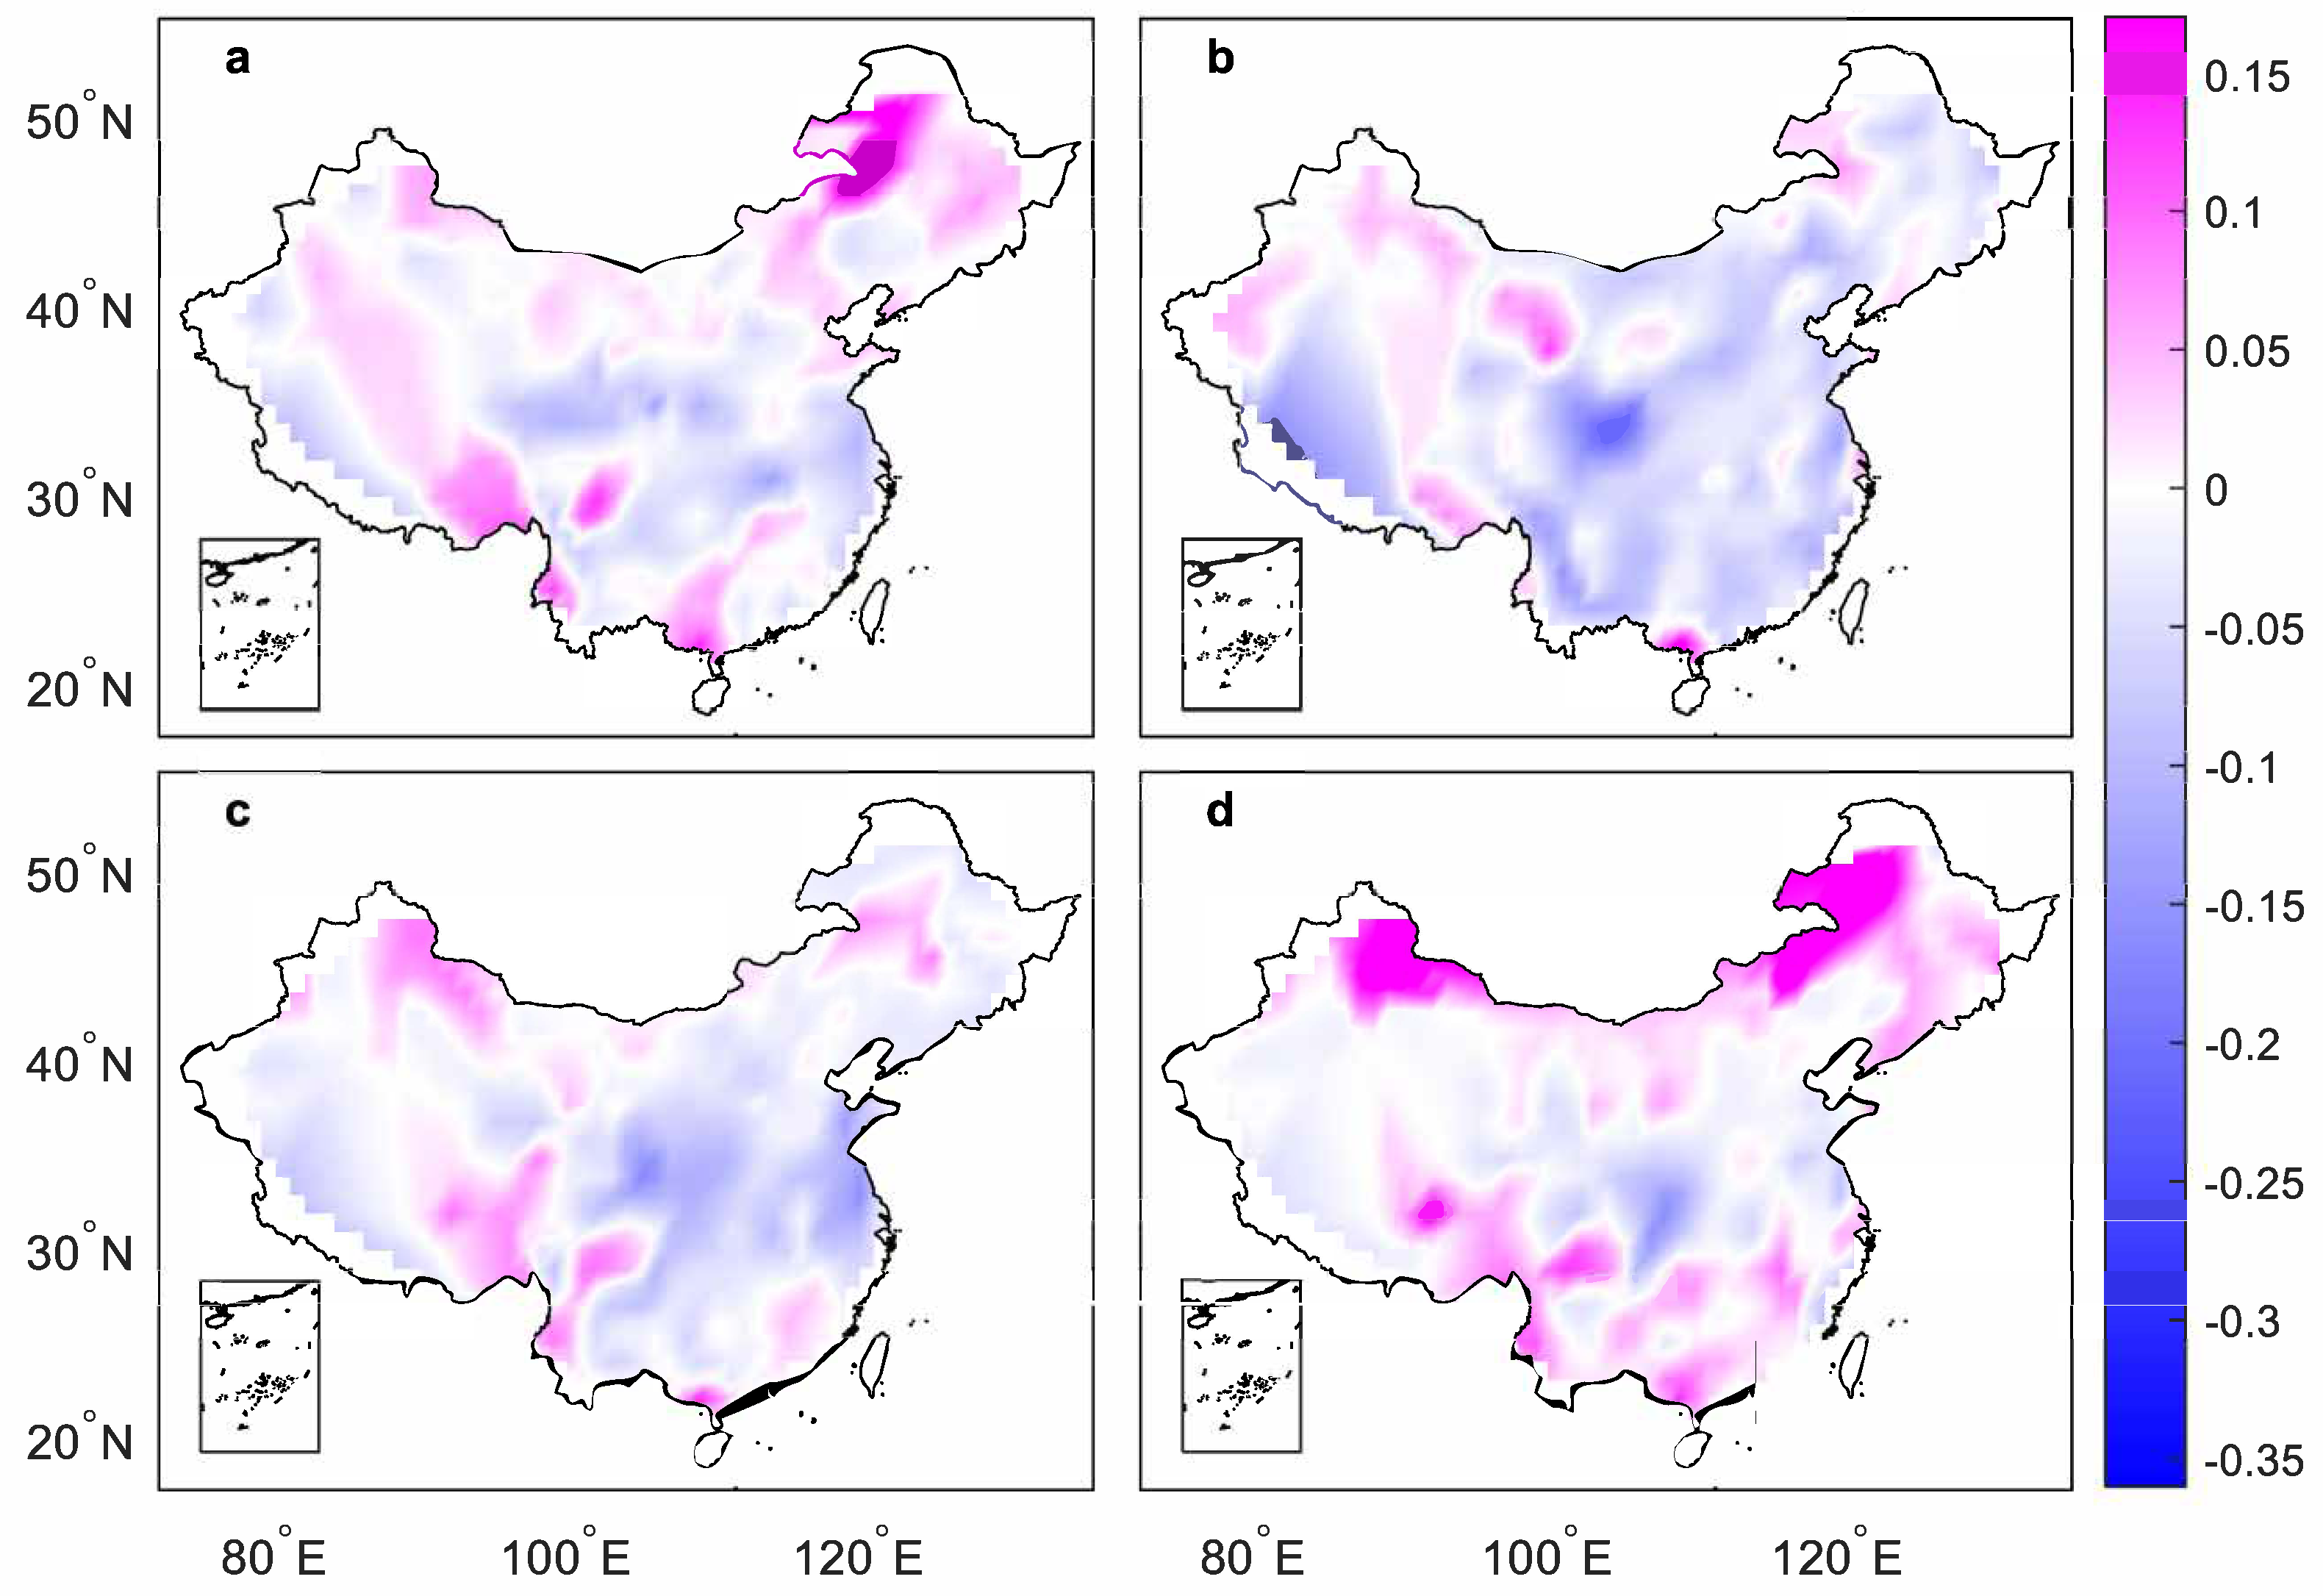
To compare these two datasets, we matched each weather station in GHCN-Daily with the nearest grid point from CRU WET. The differences in rainfall frequency in these two datasets are shown in Figure 3. As can be seen, there are indeed certain inconsistencies between these two datasets, particularly in winter when rainfall frequencies from CRU WET are often larger than those from GHCN-Daily in most parts of China (shown in red color in the maps). Except for central China, most regions generally appear to have larger rainfall frequencies from CRU WET. In the south of the Inner Mongolia Plateau, Daxinganling, the Junggar Basin, and the Tibetan Plateau, the differences in rainfall frequency can reach 0.15 day−1. On the contrary, CRU WET in summer tends to have smaller rainfall frequencies in most regions across the country, except for some parts of western China, Beihai in the south, and some parts of the Daxinganling in the north.
We also plot the rainfall frequencies from GHCN-Daily against those from CRU WET in the nearest grid points and use bias statistics (see Section 2) to quantify their differences (see Figure 4). The linear correlation estimated from Equation (2) between rainfall frequencies from CRU WET and GHCN-Daily is statistically significant in all four seasons ( α = 0.05). The relative differences estimated from Equation (3) are around 16% and tend to be larger in winter and smaller in spring and summer. Overall, there are strong seasonal variations in rainfall frequency with more rainfall events observed in summer as identified in both datasets, consistent with the rainy seasons in southeastern China influenced by the East Asian monsoon [48].
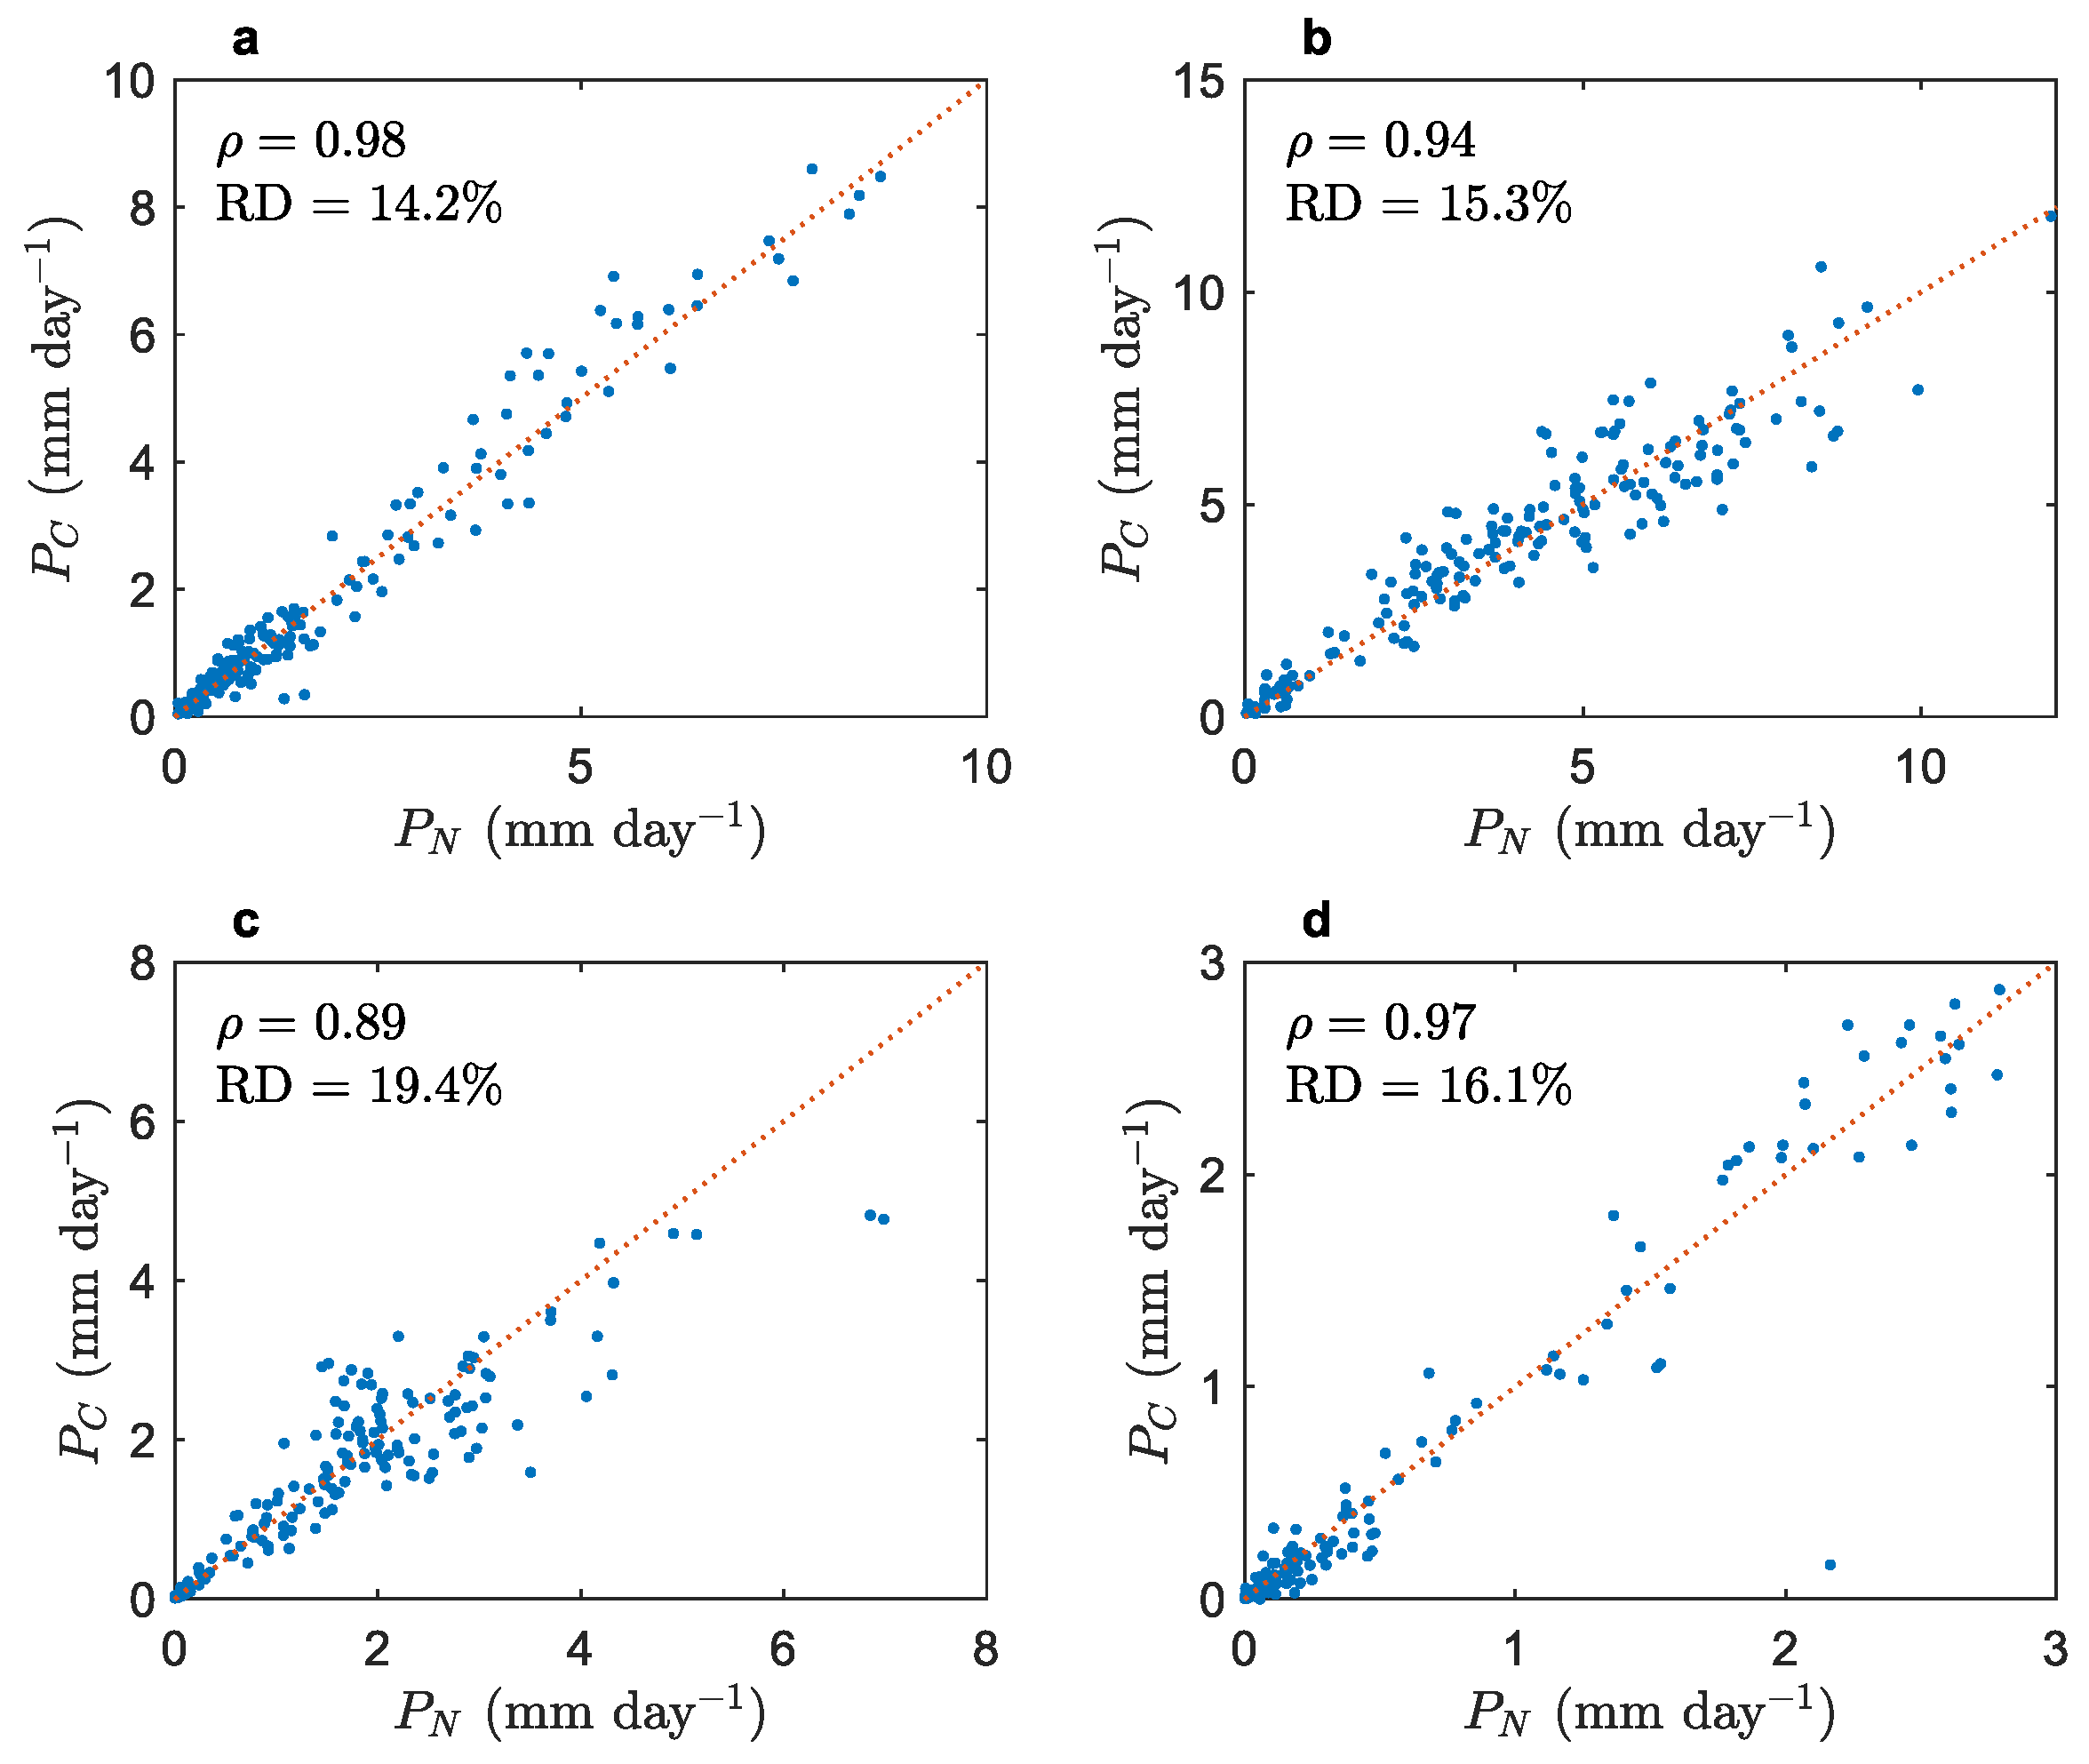
It is also interesting to compare the mean rainfall rate, which is one of the most significant rainfall statistics and has been extensively studied for various data sources. We calculated seasonal precipitation rates from GHCN-Daily datasets in each station and matched them with rainfall rates from the nearest grid point in CRU PRE data. As shown in Figure 5, the correlations between rainfall rates from CRU PRE and GHCN-Daily are also statistically significant in all four seasons ( α = 0.05). The relative differences in rainfall rate are around 16%, similar to those in rainfall frequency (see Figure 4). Large differences in rainfall rate are found in fall and winter, consistent with large differences in rainfall frequency. Note that one outlier in Figure 5d with a large rainfall rate from GHCN-Daily but a small value from CRU PRE is located in Yushu, Qinghai (station ID: CHM00056029). While this passed the quality control check in GHCN-Daily, it is suggested to exercise additional caution since this station with relatively large rainfall records is located in the semiarid regions of China.
Overall, the differences in rainfall rates and frequencies are relatively small, particularly when compared with other grid datasets as explored later in the next section. The differences in rainfall frequency should be partially accounted for by different data sources used in CRU WET and GHCN-Daily. The grid interpolation methods used in CRU WET seem to have limited impacts on the counts of rainfall events and the resulting rainfall frequencies are close to those from field observations. In this regard, the rainfall frequency from the grid data of CRU WET should be interpreted as field-scale values. In what follows, we will use CRU WET as a benchmark for the comparison of rainfall frequency from other global precipitation datasets.

3.2. Grid-Scale Rainfall Frequency

To provide an overview of grid-scale rainfall frequencies and identify their relationships with field-scale values, in this section we compare CRU WET with GPCP and ERA5, both of which represent typical satellite-derived and reanalysis products. To match locations from different data sources, we first calculated rainfall frequencies from Equation (1) and then mapped these frequencies onto the same equal-area grids of 280 × 280 km size using the nearest-neighbor interpolation method, resulting in 1860 grids over the global land (Antarctica is excluded in this study).
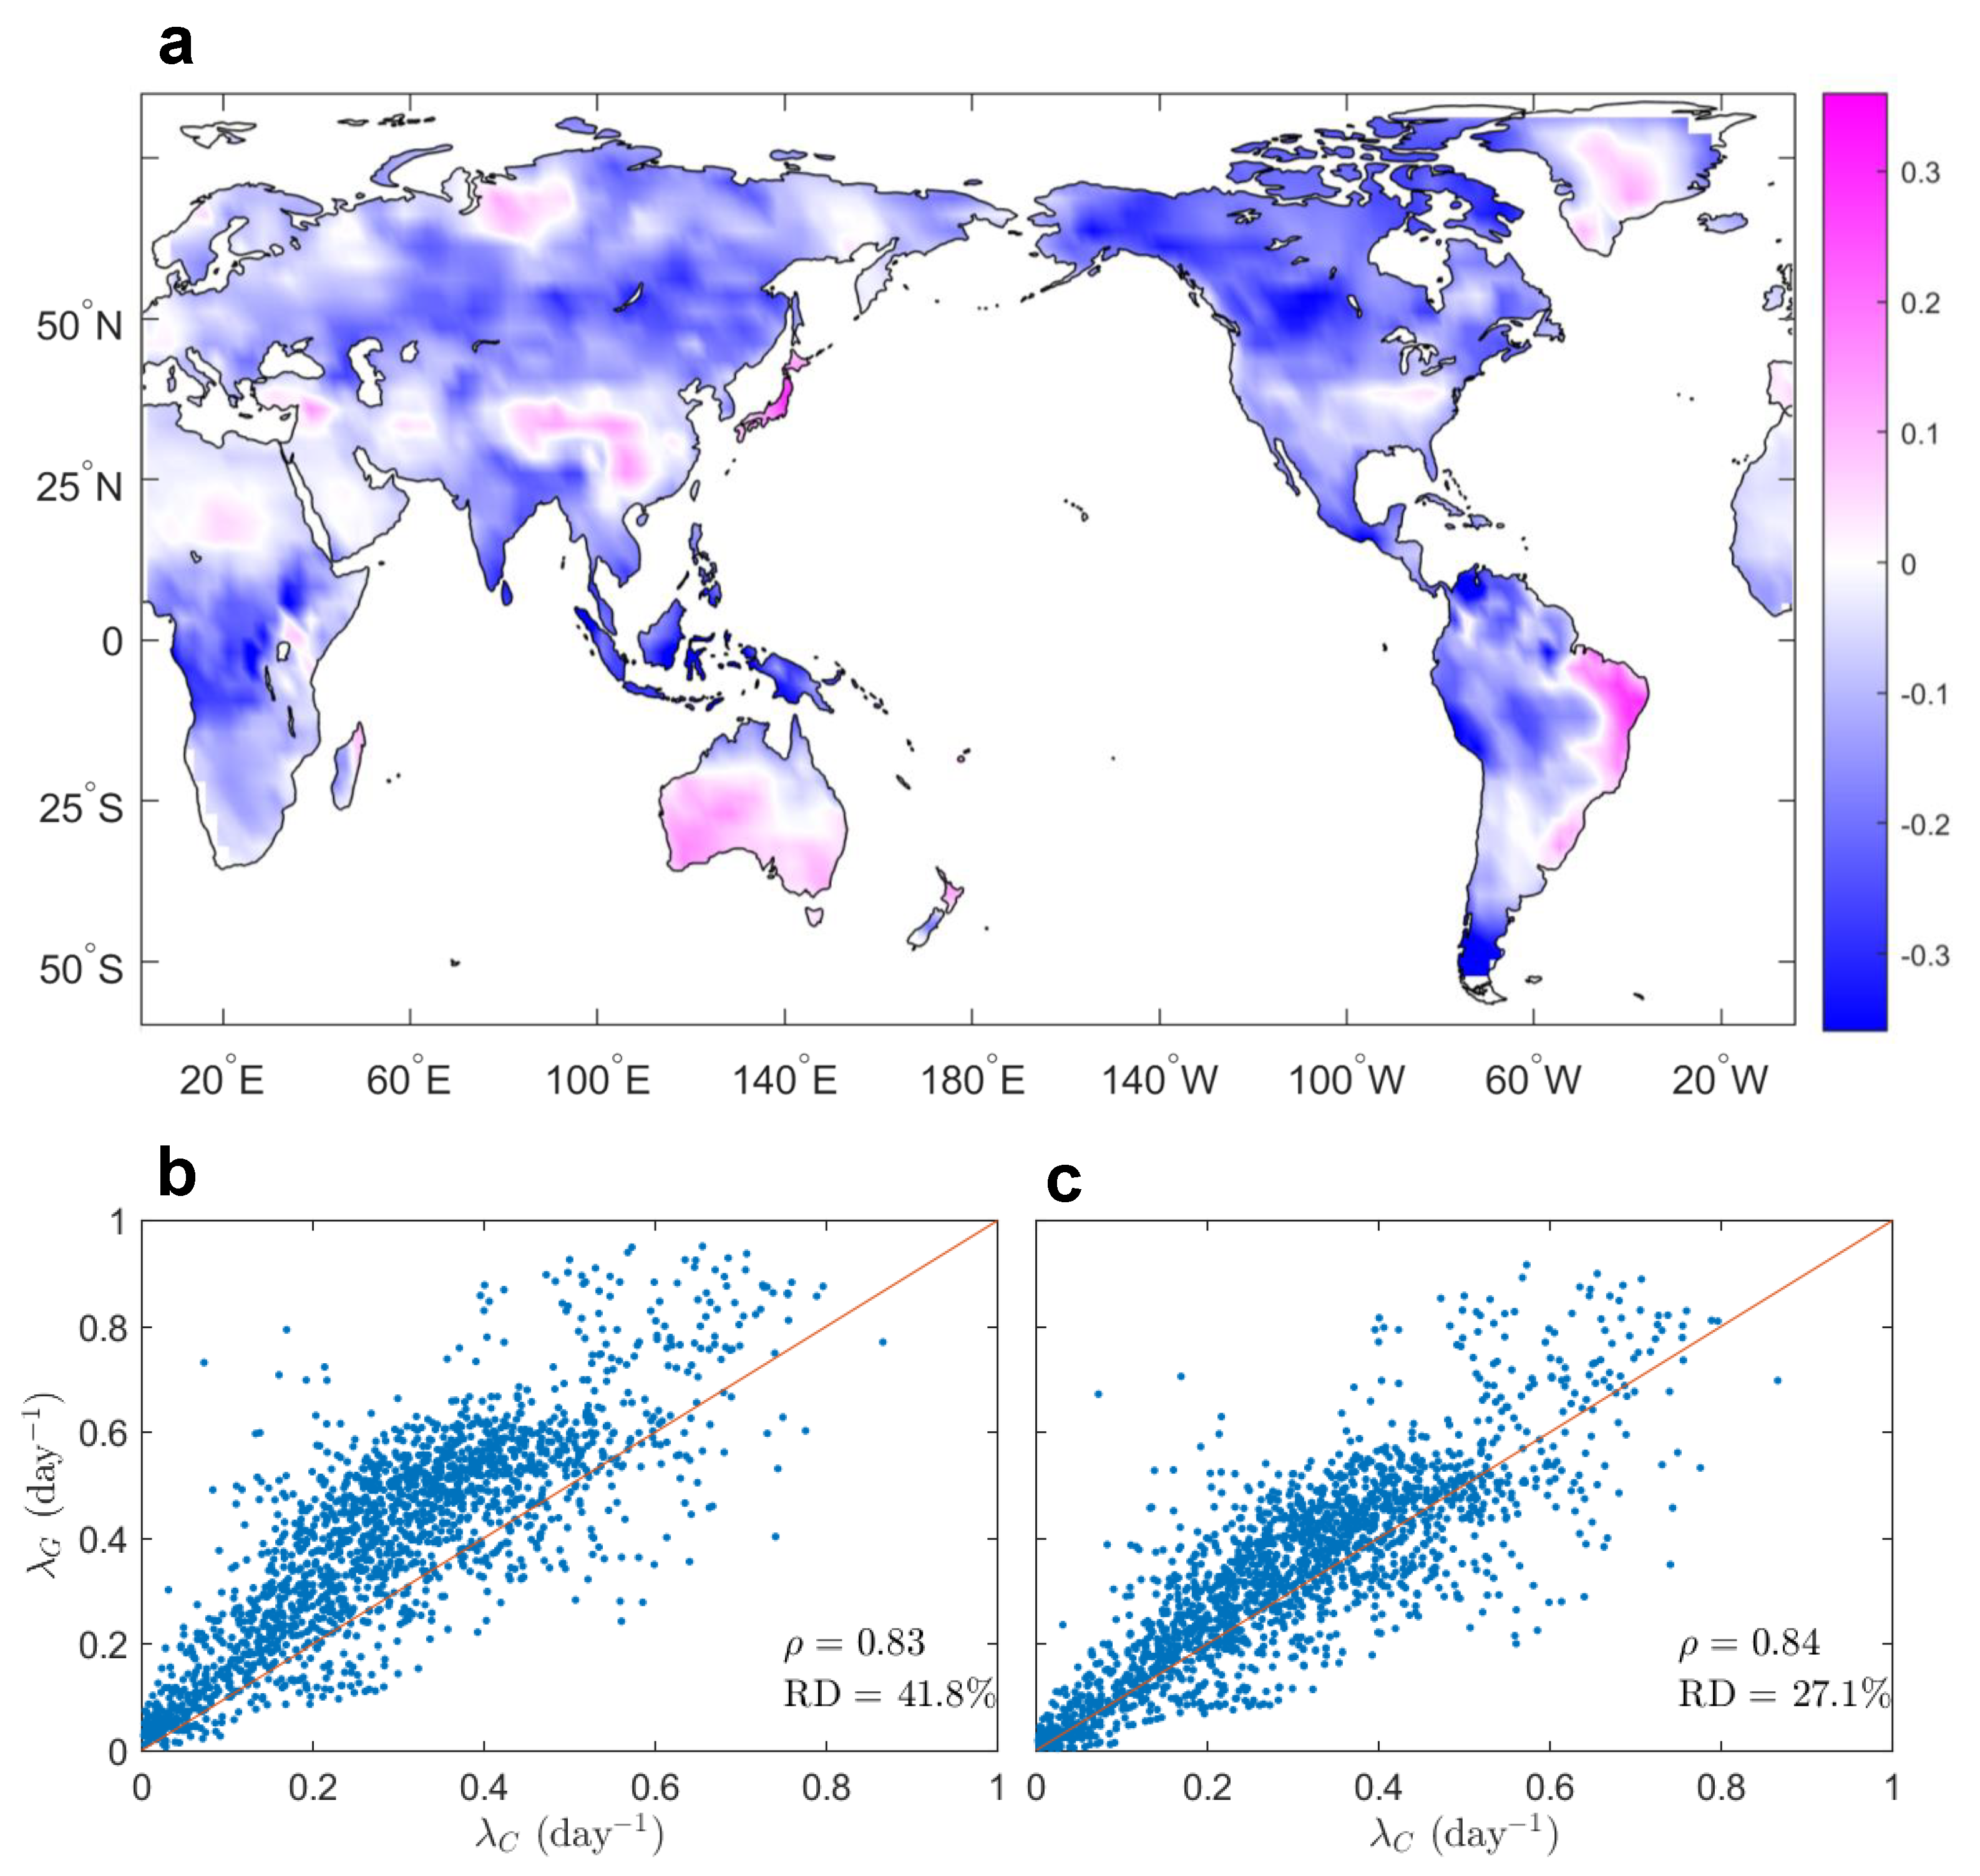
As shown in Figure 6a, rainfall frequencies from GPCP are generally larger than those from CRU WET. The large values from GPCP (shown in blue color) appear in most regions, particularly in the western and central coasts of North America, the northwestern and southern coasts of South America, central Africa, central Eurasia, and Indonesia, where the differences are greater than 0.2 day−1. Note that there are also relatively lower frequencies of GPCP in a few regions such as parts of Japan, western Russia, central China, southern Australia, the east coast of South America, and central and southern Greenland (a more detailed regional analysis is reported in Supplementary Table S1).
More specifically, higher correlation coefficients are often found in regions with less-dense rain gauge stations (see Supplementary Table S2). It is possible that the inconsistent observations from different networks increase the difficulty for model calibration and validation. Higher correlation coefficients are found in some tropical and temperate climate zones and lower values are found in arid regions (see Supplementary Figure S1). Using CRU WET as a benchmark, we find the relative differences between GPCP and CRU across the global land is as high as 41.8%, although their spatial correlation is statistically significant ( α = 0.05, see Figure 6b).
Similar patterns were observed for ERA5 (see Figure 7a), which have even higher rainfall frequencies than those from GPCP. Specifically, in the arid land of northern Africa, central and western Australia, and parts of eastern Brazil, both the ERA5 and GPCP datasets have lower rainfall frequencies. It is likely that CRU WET may have overestimated rainfall events in these dry regions and requires further investigation. The relative differences between ERA and CRU WET across the global land reach 74.8%, which is much larger than those between GPCP and CRU WET. However, the spatial correlation is still statistically significant and comparable to the GPCP-CRU correlation (see Figure 7b).
The differences in rainfall frequencies can have certain impacts on modeling hydrological process. To illustrate this point, we used a stochastic soil–water balance model [6,49,50] to investigate the long-term water balance near the transitional climate zone of Huaihe River Basin, China, where the dryness index is around one [51]. Rainfall frequencies estimated from CRU WET and ERA5 are around 0.30 and 0.42, respectively, whereas the rainfall rates are close for these two data sources. After applying the Budyko curve for both of these rainfall frequencies, one can find the evaporation coefficients are 0.7 and 0.76, respectively. The higher evaporation coefficients suggest the high-frequent rainfall patterns tends to have smooth the soil moisture dynamics, resulting in lower runoff generation and larger evaporation for the same amount of total rainfall.
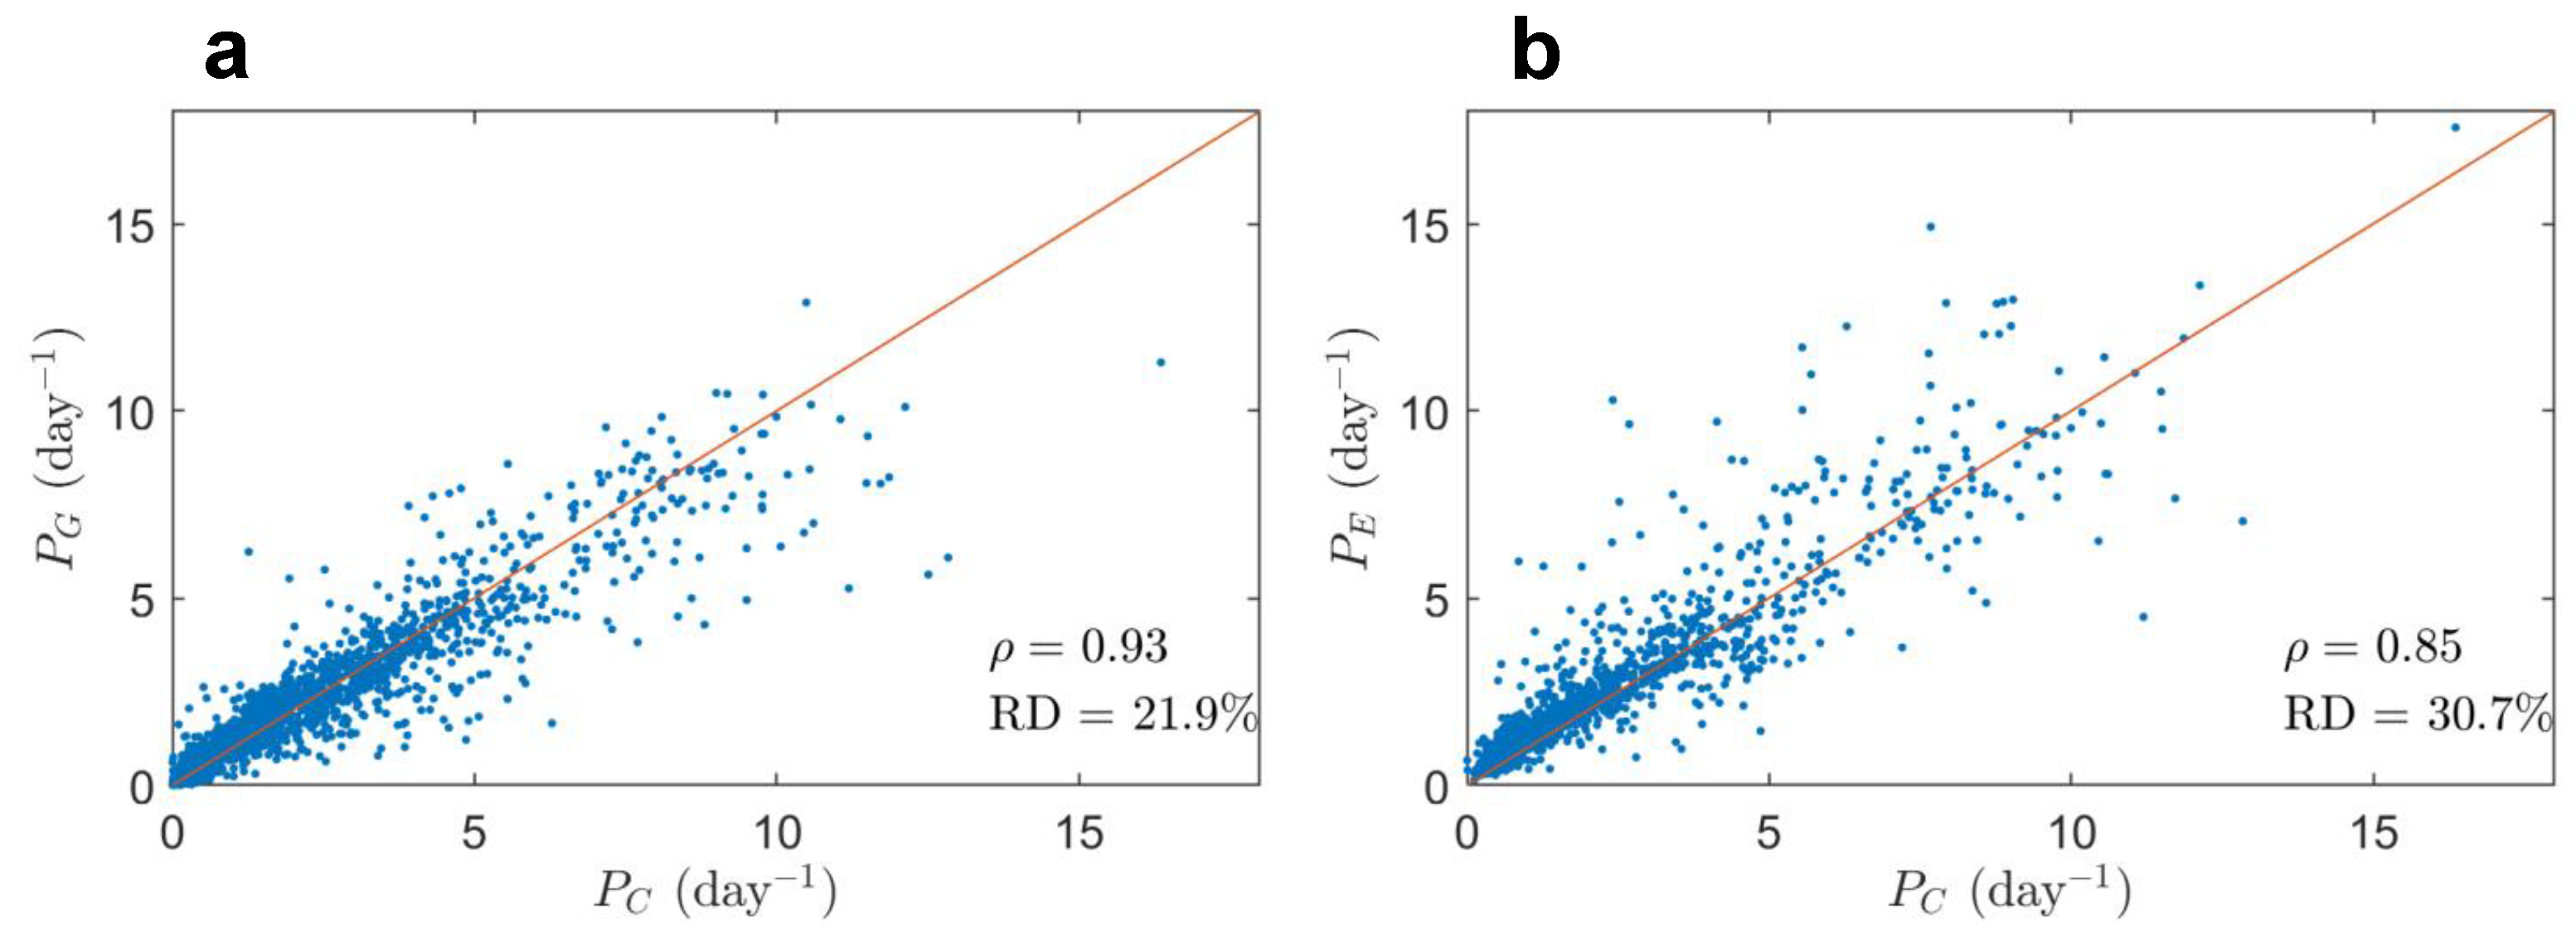
It is also interesting to investigate the differences in mean rainfall rates, another important feature of rainfall. Since much attention has been paid to the overall rainfall rate, model calibration is often focused on reducing the overall biases of the rainfall rate. The relative differences in mean rainfall rate across various datasets are significantly smaller when compared with those in rainfall frequencies (see Figure 8). Model calibration with addition goals of reducing rainfall frequency biases could be an effective approach for enhancing model performance.
Since λ ( P t ) is a monotonically decreasing function of P t (see Section 2), it is possible to increase the wet day thresholds of P t to reduce the overestimated rainfall frequencies. To test this point, we also defined wet days as daily accumulated rainfall larger than 0.5 and 0.8 mm in GPCP and ERA5, respectively. The corresponding frequencies of wet days are compared with those from CRU WET with wet days defined as daily rainfall larger than 0.1 mm (see Figure 6c and Figure 7c). As can be seen, the correlations are similar for different thresholds but the relative differences are significantly reduced from 41.8 to 27.1% for GPCP and from 74.8 to 30.6% for ERA5. Therefore, adjusting wet day thresholds is an efficient method for calibrating rainfall frequencies, although these thresholds are data-source specific. It is straightforward to recommend higher P t for data with more frequent rainfall events, thus reducing λ by redefining wet days.

3.3. Independence of Rainfall Frequencies on Grid Resolutions

After demonstrating the large discrepancies between field- and grid-scale rainfall frequencies in the previous section, one may wonder whether these discrepancies are primarily associated with the grid resolutions. Ideally, grid-scale rainfall frequencies will approach field-scale ones with increasing grid resolutions (or reducing grid sizes). The two detailed examples already show larger rainfall frequencies for higher grid resolution (i.e., ERA5 with a high resolution of 0.25°), suggesting other important sources of biases in these global precipitation datasets.
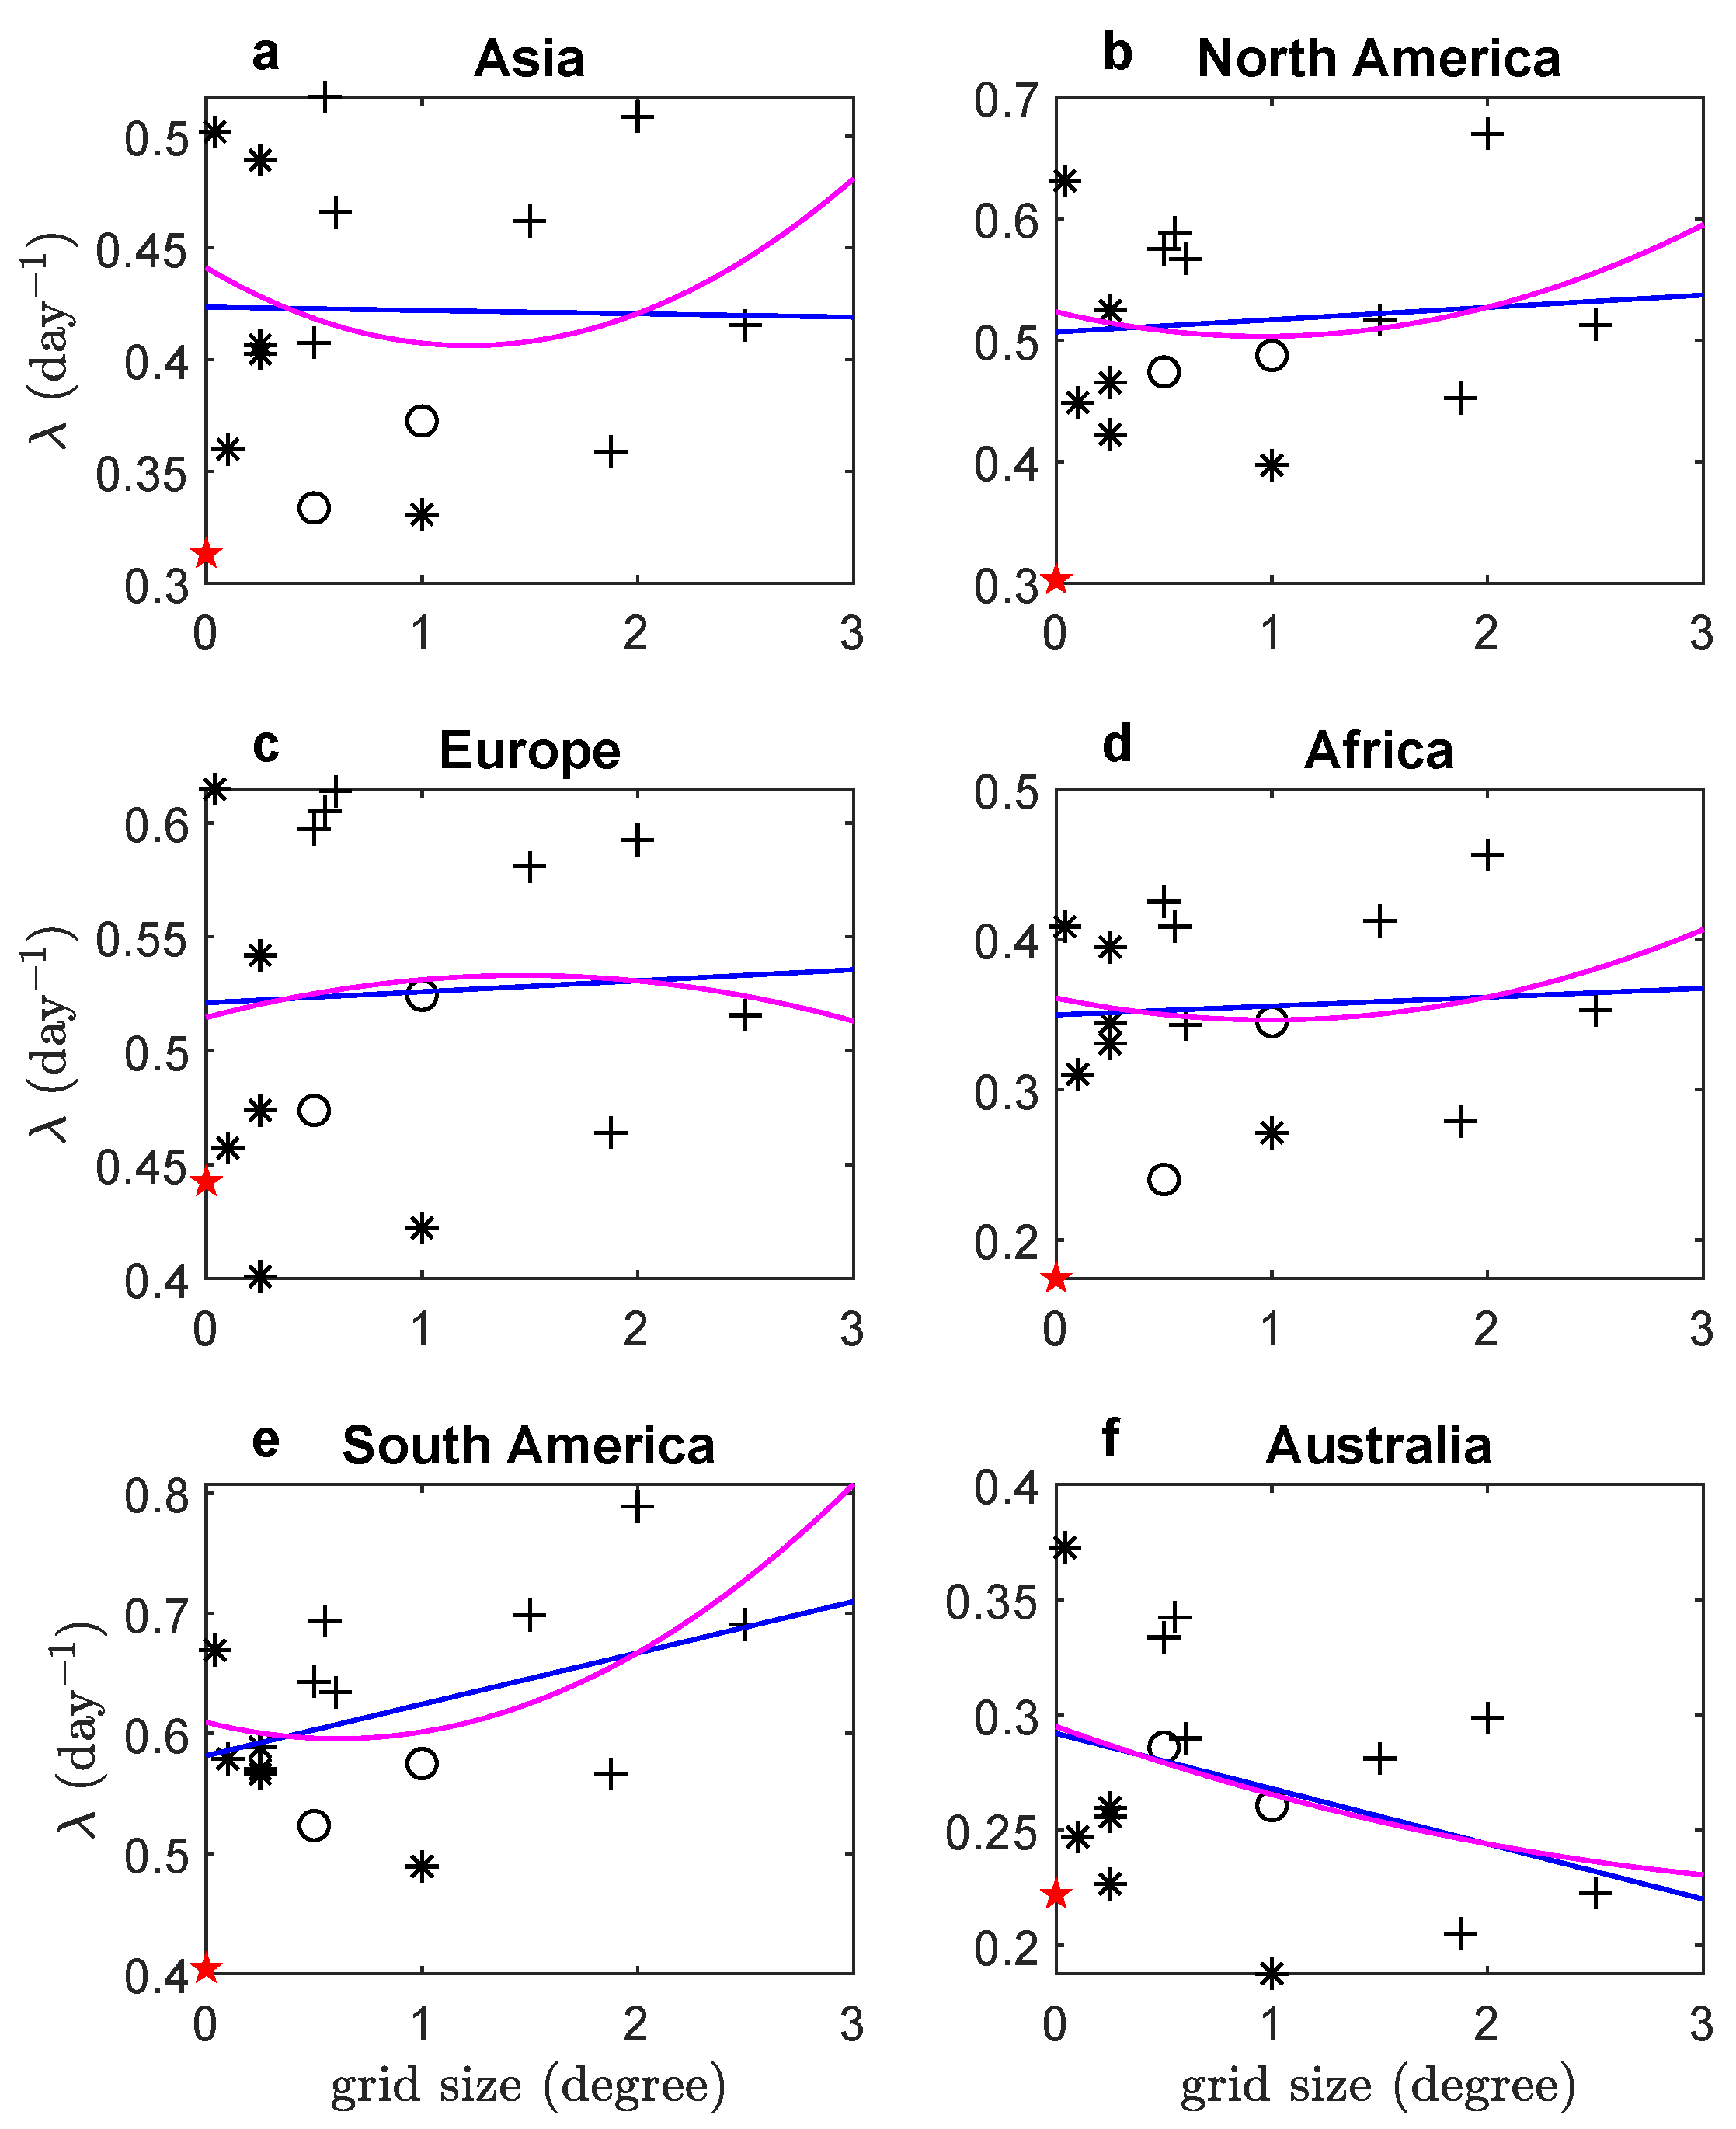
To further verify this point, we took advantage of an independent study of Sun et al. [46], which estimated frequencies of light (0.1–5 mm day−1), moderate (5–20 mm day−1), and heavy rainfall events (>20 mm day−1) across different regions from various grid data sources with grid resolutions varying from 0.04 to 2.5°. This allowed us to calculate rainfall frequencies with 0.1 mm day−1 threshold and compare them with the corresponding data-source resolutions (see Figure 9).
The relationships between the grid-scale rainfall frequencies and their data source resolutions are statistically insignificant ( α = 0.05 ). This suggests that spatial averaging within 0.04–2.5° has limited impacts on the rainfall frequency estimation. Results from CRU WET were used as field-scale references and plotted as red pentagrams in Figure 9. After fitting by first- or second-order polynomials, we tentatively extrapolate grid-scale rainfall frequencies into field-scale ones (i.e., intercepts of fitted lines or curves). As can be seen, these are still systematically higher than those from CRU WET across most regions globally. Only in Europe and Australia, the differences are smaller and grid-scale rainfall frequencies from some data sources are close to the field-scale values.
Given the weak relationships between grid-scale rainfall frequencies and the grid sizes, we would not expect significant improvement in data accuracy simply by increasing grid resolutions in remote sensors or data assimilation models. A large portion of these differences should be interpreted as the inherent biases of datasets. For remote sensing data, the algorithms used to transfer signals from passive and active sensors to precipitation rate may have reduced its variability, resulting in frequent rainfall events. For reanalysis data, the assimilation models for convective, boundary-layer, and microphysics schemes may be responsible for the overestimation of rainfall frequencies. Model and algorithm calibrations usually aim to reduce the biases in long-term precipitation rates, resulting in more accumulated systematic errors in rainfall frequencies. Too frequent but light rainfall from these grid datasets could have pronounced impacts on their application in hydrological and ecological processes, where both the total amount of rainfall and its intermittency determine the dynamics of soil moisture, microbial activity, and plant growth [6].

4. Conclusions

In summary, grid-scale rainfall frequencies from most global precipitation datasets do not converge to field-scale values with increasing data resolutions. The grid-scale and field-scale differences in rainfall frequencies should be primarily accounted for by the inherent biases of grid data. Unlike other grid datasets, CRU WET first counts the wet days from observations and then interpolates them to the grids; rainfall frequencies from CRU WET should be interpreted as field-scale values. The overestimated rainfall frequencies can be reduced by adjusting the thresholds for defining wet days. As we learned from GPCP and ERA5, the adjusted thresholds are even larger for the higher-resolution data of ERA5, further suggesting the biases of these grid-scale rainfall frequencies are largely associated with methods or models used in the data production.
As one of the key statistics describing the intermittency of rainfall, rainfall frequency is of great significance to ecosystems. When these grid datasets are used to land surface models, the corresponding biases could propagate into the hydrological processes. High-frequency rainfall events with smaller intensities may generate less runoff due to the smoother inputs of water. The rainfall–runoff relationships calibrated with field-scale records need to be re-calibrated for grid datasets. Such re-calibration under regular climate conditions may influence its accuracy in modeling extreme events or under changing climates and will be the subject of future research.

Supplementary Materials

The following supporting information can be downloaded at: https://www.mdpi.com/article/10.3390/atmos16010066/s1, Figure S1: Correlatoin coefficients of rainfall frequencies estimated from CRU WET and GPCP in different climate zones. According to Beck (2018), there are 30 Koppen-Geiger climate zones and each may have different size. Only climate zones with area larger than 2,352,000 km2 (30 or more equal-areal grids) are reported. Table S1: Correlation coefficients of rainfall frequencies estimated from CRU WET and GPCP in different regions. Table S2: Correlation coefficients of rainfall frequencies estimated from CRU WET and GPCP with different levels of network density.

Author Contributions

Conceptualization, X.Y., Z.Z. and J.Y.; methodology, X.Y., Z.Z. and J.Y.; software, X.Y., Z.Z. and Z.L.; validation, X.Y., Z.Z. and Z.L.; formal analysis, X.Y., Z.Z. and J.Y.; investigation, X.Y., Z.Z. and J.Y.; resources, J.Y.; data curation, X.Y., Z.Z. and Z.L.; writing—original draft preparation, X.Y.; writing—review and editing, X.Y., Z.Z., Z.L. and J.Y.; visualization, X.Y., Z.Z. and Z.L.; supervision, J.Y.; project administration, J.Y.; funding acquisition, J.Y. All authors have read and agreed to the published version of the manuscript.

Funding

This research was funded by the National Natural Science Foundation of China (42330604).

Institutional Review Board Statement

Not applicable.

Informed Consent Statement

Not applicable.

Data Availability Statement

GHCN-Daily data were obtained from https://www.ncei.noaa.gov/cdo-web/search?datasetid=GHCND (accessed on 1 July 2023), CRU data were obtained from https://crudata.uea.ac.uk/cru/data/hrg/ (accessed on 1 July 2024), GPCP data were obtained from https://doi.org/10.7289/V5RX998Z (accessed on 1 July 2023), and ERA data were obtained from https://cds.climate.copernicus.eu/#!/search?text=ERA5&type=dataset (accessed on 1 July 2023). Rainfall frequencies over six continents in Figure 9 were obtained from Sun et al. [46] (accessed on 1 July 2023). Code for calculating rainfall frequency is available at https://github.com/jy-junyin/rainfallfrequency.

Acknowledgments

We would like to express our sincere gratitude to the editor for waiving the Article Processing Charges for this publication.

Conflicts of Interest

The authors declare no conflicts of interest.

Abbreviations

The following abbreviations are used in this manuscript:
GPCP 1ddGlobal Precipitation Climatology Project 1 degree of daily precipitation analysis
CPCClimate Prediction Center
20CRTwentieth-century reanalysis system
CFSRClimate Forest System Reanalysis system
NECP1National Centers for Environmental Prediction version 1
NCEP2National Centers for Environmental Prediction version 2
JRA55Japanese 55-year Reanalysis
ERA InterimEuropean Centre for Medium-Range Weather Forecasts Reanalysis interim
MERRAModern-Era Retrospective Analysis for Research and Application system
GPCC-dailyGlobal Precipitation Climatology Centre daily precipitation analysis
CMORPHClimate Prediction Center morphing technique
TRMM 3B42Tropical Rainfall Measuring Mission 3B42 daily precipitation analysis
PERSIANN CCSPrecipitation Estimation from Remotely Sensed Information using Artificial Neural Networks Cloud Classification System
PERSIANN CDRPrecipitation Estimation from Remotely Sensed Information using Artificial Neural Networks Climate Data Record
MSWEPMulti-Source Weighted-Ensemble Precipitation

References

  1. Eagleson, P.S. Climate, soil, and vegetation: 1. Introduction to water balance dynamics. Water Resour. Res. 1978, 14, 705–712. [Google Scholar] [CrossRef]
  2. Austin, A.T.; Yahdjian, L.; Stark, J.M.; Belnap, J.; Porporato, A.; Norton, U.; Ravetta, D.A.; Schaeffer, S.M. Water pulses and biogeochemical cycles in arid and semiarid ecosystems. Oecologia 2004, 141, 221–235. [Google Scholar] [CrossRef] [PubMed]
  3. Liang, M.; Feng, X.; Gornish, E.S. Rainfall pulses mediate long-term plant community compositional dynamics in a semi-arid rangeland. J. Appl. Ecol. 2021, 58, 708–717. [Google Scholar] [CrossRef]
  4. Breinl, K.; Lun, D.; Müller-Thomy, H.; Blöschl, G. Understanding the relationship between rainfall and flood probabilities through combined intensity-duration-frequency analysis. J. Hydrol. 2021, 602, 126759. [Google Scholar] [CrossRef]
  5. MC Fernandes, V.; Rudgers, J.A.; Collins, S.L.; Garcia-Pichel, F. Rainfall pulse regime drives biomass and community composition in biological soil crusts. Ecology 2022, 103, e3744. [Google Scholar] [CrossRef] [PubMed]
  6. Porporato, A.; Yin, J. Ecohydrology: Dynamics of Life and Water in the Critical Zone; Cambridge University Press: Cambridge, UK, 2022. [Google Scholar]
  7. Feldman, A.F.; Feng, X.; Felton, A.J.; Konings, A.G.; Knapp, A.K.; Biederman, J.A.; Poulter, B. Plant responses to changing rainfall frequency and intensity. Nat. Rev. Earth Environ. 2024, 5, 276–294. [Google Scholar] [CrossRef]
  8. Fay, P.a.; Kaufman, D.M.; Nippert, J.B.; Carlisle, J.D.; Harper, C.W. Changes in grassland ecosystem function due to extreme rainfall events: Implications for responses to climate change. Glob. Chang. Biol. 2008, 14, 1600–1608. [Google Scholar] [CrossRef]
  9. Peng, S.; Piao, S.; Shen, Z.; Ciais, P.; Sun, Z.; Chen, S.; Bacour, C.; Peylin, P.; Chen, A. Precipitation amount, seasonality and frequency regulate carbon cycling of a semi-arid grassland ecosystem in Inner Mongolia, China: A modeling analysis. Agric. For. Meteorol. 2013, 178–179, 46–55. [Google Scholar] [CrossRef]
  10. Fay, P.A.; Blair, J.M.; Smith, M.D.; Nippert, J.B.; Carlisle, J.D.; Knapp, A.K. Relative effects of precipitation variability and warming on tallgrass prairie ecosystem function. Biogeosciences 2011, 8, 3053–3068. [Google Scholar] [CrossRef]
  11. Robinson, T.M.P.; La Pierre, K.J.; Vadeboncoeur, M.A.; Byrne, K.M.; Thomey, M.L.; Colby, S.E. Seasonal, not annual precipitation drives community productivity across ecosystems. Oikos 2012, 122, 727–738. [Google Scholar] [CrossRef]
  12. Arnbjerg-Nielsen, K.; Willems, P.; Olsson, J.; Beecham, S.; Pathirana, A.; Bülow Gregersen, I.; Madsen, H.; Nguyen, V.T.V. Impacts of climate change on rainfall extremes and urban drainage systems: A review. Water Sci. Technol. 2013, 68, 16–28. [Google Scholar] [CrossRef]
  13. Schwinning, S.; Sala, O.E. Hierarchy of responses to resource pulses in arid and semi-arid ecosystems. Oecologia 2004, 141, 211–220. [Google Scholar] [CrossRef]
  14. Trenberth, K.E.; Fasullo, J.T.; Shepherd, T.G. Attribution of climate extreme events. Nat. Clim. Chang. 2015, 5, 725–730. [Google Scholar] [CrossRef]
  15. Siteur, K.; Eppinga, M.B.; Karssenberg, D.; Baudena, M.; Bierkens, M.F.; Rietkerk, M. How will increases in rainfall intensity affect semiarid ecosystems? Water Resour. Res. 2014, 50, 5980–6001. [Google Scholar] [CrossRef]
  16. Wang, J.; Liu, D.; Ciais, P.; Peñuelas, J. Decreasing rainfall frequency contributes to earlier leaf onset in northern ecosystems. Nat. Clim. Chang. 2022, 12, 386–392. [Google Scholar] [CrossRef]
  17. Xie, P.; Arkin, P.A. Analyses of Global Monthly Precipitation Using Gauge Observations, Satellite Estimates, and Numerical Model Predictions. J. Clim. 1996, 9, 840–858. [Google Scholar] [CrossRef]
  18. Kidd, C. Satellite rainfall climatology: A review. Int. J. Climatol. 2001, 21, 1041–1066. [Google Scholar] [CrossRef]
  19. Bosilovich, M.G.; Chen, J.; Robertson, F.R.; Adler, R.F. Evaluation of Global Precipitation in Reanalyses. J. Appl. Meteorol. Climatol. 2008, 47, 2279–2299. [Google Scholar] [CrossRef]
  20. Schneider, U.; Becker, A.; Finger, P.; Meyer-Christoffer, A.; Ziese, M.; Rudolf, B. GPCC’s new land surface precipitation climatology based on quality-controlled in situ data and its role in quantifying the global water cycle. Theor. Appl. Climatol. 2013, 115, 15–40. [Google Scholar] [CrossRef]
  21. Tapiador, F.J.; Turk, F.; Petersen, W.; Hou, A.Y.; García-Ortega, E.; Machado, L.A.; Angelis, C.F.; Salio, P.; Kidd, C.; Huffman, G.J.; et al. Global precipitation measurement: Methods, datasets and applications. Atmos. Res. 2012, 104–105, 70–97. [Google Scholar] [CrossRef]
  22. Rodell, M.; Houser, P.R.; Jambor, U.; Gottschalck, J.; Mitchell, K.; Meng, C.J.; Arsenault, K.; Cosgrove, B.; Radakovich, J.; Bosilovich, M.; et al. The Global Land Data Assimilation System. Bull. Am. Meteorol. Soc. 2004, 85, 381–394. [Google Scholar] [CrossRef]
  23. Beck, H.E.; Vergopolan, N.; Pan, M.; Levizzani, V.; van Dijk, A.I.J.M.; Weedon, G.P.; Brocca, L.; Pappenberger, F.; Huffman, G.J.; Wood, E.F. Global-scale evaluation of 22 precipitation datasets using gauge observations and hydrological modeling. Hydrol. Earth Syst. Sci. 2017, 21, 6201–6217. [Google Scholar] [CrossRef]
  24. Paredes Trejo, F.J.; Álvarez Barbosa, H.; Peñaloza-Murillo, M.A.; Moreno, M.A.; Farias, A. Intercomparison of improved satellite rainfall estimation with CHIRPS gridded product and rain gauge data over Venezuela. Atmósfera 2016, 29, 323–342. [Google Scholar] [CrossRef]
  25. Prakash, S.; Mitra, A.K.; Momin, I.M.; Rajagopal, E.N.; Basu, S.; Collins, M.; Turner, A.G.; Achuta Rao, K.; Ashok, K. Seasonal intercomparison of observational rainfall datasets over India during the southwest monsoon season: Comparison of monsoon rainfall. Int. J. Climatol. 2014, 35, 2326–2338. [Google Scholar] [CrossRef]
  26. Tanarhte, M.; Hadjinicolaou, P.; Lelieveld, J. Intercomparison of temperature and precipitation data sets based on observations in the Mediterranean and the Middle East. J. Geophys. Res. Atmos. 2012, 117, D12102. [Google Scholar] [CrossRef]
  27. Tapiador, F.; Navarro, A.; Levizzani, V.; García-Ortega, E.; Huffman, G.; Kidd, C.; Kucera, P.; Kummerow, C.; Masunaga, H.; Petersen, W.; et al. Global precipitation measurements for validating climate models. Atmos. Res. 2017, 197, 1–20. [Google Scholar] [CrossRef]
  28. Serreze, M.C.; Hurst, C.M. Representation of Mean Arctic Precipitation from NCEP–NCAR and ERA Reanalyses. J. Clim. 2000, 13, 182–201. [Google Scholar] [CrossRef]
  29. Zolina, O.; Kapala, A.; Simmer, C.; Gulev, S.K. Analysis of extreme precipitation over Europe from different reanalyses: A comparative assessment. Glob. Planet. Chang. 2004, 44, 129–161. [Google Scholar] [CrossRef]
  30. Romilly, T.G.; Gebremichael, M. Evaluation of satellite rainfall estimates over Ethiopian river basins. Hydrol. Earth Syst. Sci. 2011, 15, 1505–1514. [Google Scholar] [CrossRef]
  31. McCollum, J.R.; Krajewski, W.F.; Ferraro, R.R.; Ba, M.B. Evaluation of Biases of Satellite Rainfall Estimation Algorithms over the Continental United States. J. Appl. Meteorol. 2002, 41, 1065–1080. [Google Scholar] [CrossRef]
  32. Chen, M.; Shi, W.; Xie, P.; Silva, V.B.S.; Kousky, V.E.; Wayne Higgins, R.; Janowiak, J.E. Assessing objective techniques for gauge-based analyses of global daily precipitation. J. Geophys. Res. Atmos. 2008, 113, D04110. [Google Scholar] [CrossRef]
  33. Wagner, P.D.; Fiener, P.; Wilken, F.; Kumar, S.; Schneider, K. Comparison and evaluation of spatial interpolation schemes for daily rainfall in data scarce regions. J. Hydrol. 2012, 464, 388–400. [Google Scholar] [CrossRef]
  34. Kidd, C.; Becker, A.; Huffman, G.J.; Muller, C.L.; Joe, P.; Skofronick-Jackson, G.; Kirschbaum, D.B. So, how much of the Earth’s surface is covered by rain gauges? Bull. Am. Meteorol. Soc. 2017, 98, 69–78. [Google Scholar] [CrossRef] [PubMed]
  35. Krajewski, W.; Smith, J.A. Radar hydrology: Rainfall estimation. Adv. Water Resour. 2002, 25, 1387–1394. [Google Scholar] [CrossRef]
  36. Moreau, E.; Testud, J.; Le Bouar, E. Rainfall spatial variability observed by X-band weather radar and its implication for the accuracy of rainfall estimates. Adv. Water Resour. 2009, 32, 1011–1019. [Google Scholar] [CrossRef]
  37. Schamm, K.; Ziese, M.; Becker, A.; Finger, P.; Meyer-Christoffer, A.; Schneider, U.; Schröder, M.; Stender, P. Global gridded precipitation over land: A description of the new GPCC First Guess Daily product. Earth Syst. Sci. Data 2014, 6, 49–60. [Google Scholar] [CrossRef]
  38. Harris, I.; Osborn, T.J.; Jones, P.; Lister, D. Version 4 of the CRU TS monthly high-resolution gridded multivariate climate dataset. Sci. Data 2020, 7, 109. [Google Scholar] [CrossRef]
  39. Jaffrés, J.B. GHCN-Daily: A treasure trove of climate data awaiting discovery. Comput. Geosci. 2019, 122, 35–44. [Google Scholar] [CrossRef]
  40. Dinku, T.; Alessandrini, S.; Evangelisti, M.; Rojas, O. A description and evaluation of FAO satellite rainfall estimation algorithm. Atmos. Res. 2015, 163, 48–60. [Google Scholar] [CrossRef]
  41. Harris, I.; Jones, P.; Osborn, T.; Lister, D. Updated high-resolution grids of monthly climatic observations—The CRU TS3.10 Dataset. Int. J. Climatol. 2013, 34, 623–642. [Google Scholar] [CrossRef]
  42. Lin, J.; Bryan, B.A.; Zhou, X.; Lin, P.; Do, H.X.; Gao, L.; Gu, X.; Liu, Z.; Wan, L.; Tong, S.; et al. Making China’s water data accessible, usable and shareable. Nat. Water 2023, 1, 328–335. [Google Scholar] [CrossRef]
  43. Adler, R.; Sapiano, M.; Huffman, G.; Wang, J.J.; Gu, G.; Bolvin, D.; Chiu, L.; Schneider, U.; Becker, A.; Nelkin, E.; et al. The Global Precipitation Climatology Project (GPCP) Monthly Analysis (New Version 2.3) and a Review of 2017 Global Precipitation. Atmosphere 2018, 9, 138. [Google Scholar] [CrossRef] [PubMed]
  44. Dee, D.P.; Uppala, S.M.; Simmons, A.J.; Berrisford, P.; Poli, P.; Kobayashi, S.; Andrae, U.; Balmaseda, M.A.; Balsamo, G.; Bauer, P.; et al. The ERA-Interim reanalysis: Configuration and performance of the data assimilation system. Q. J. R. Meteorol. Soc. 2011, 137, 553–597. [Google Scholar] [CrossRef]
  45. Gehne, M.; Hamill, T.M.; Kiladis, G.N.; Trenberth, K.E. Comparison of Global Precipitation Estimates across a Range of Temporal and Spatial Scales. J. Clim. 2016, 29, 7773–7795. [Google Scholar] [CrossRef]
  46. Sun, Q.; Miao, C.; Duan, Q.; Ashouri, H.; Sorooshian, S.; Hsu, K. A Review of Global Precipitation Data Sets: Data Sources, Estimation, and Intercomparisons. Rev. Geophys. 2018, 56, 79–107. [Google Scholar] [CrossRef]
  47. Menne, M.J.; Durre, I.; Vose, R.S.; Gleason, B.E.; Houston, T.G. An Overview of the Global Historical Climatology Network-Daily Database. J. Atmos. Ocean. Technol. 2012, 29, 897–910. [Google Scholar] [CrossRef]
  48. Ha, K.J.; Heo, K.Y.; Lee, S.S.; Yun, K.S.; Jhun, J.G. Variability in the East Asian monsoon: A review. Meteorol. Appl. 2012, 19, 200–215. [Google Scholar] [CrossRef]
  49. Porporato, A.; Daly, E.; Rodriguez-Iturbe, I. Soil Water Balance and Ecosystem Response to Climate Change. Am. Nat. 2004, 164, 625–632. [Google Scholar] [CrossRef]
  50. Daly, E.; Calabrese, S.; Yin, J.; Porporato, A. Linking parametric and water-balance models of the Budyko and Turc spaces. Adv. Water Resour. 2019, 134, 103435. [Google Scholar] [CrossRef]
  51. Yin, J.; Porporato, A. Global Distribution of Climatic Aridity. Geophys. Res. Lett. 2023, 50, e2023GL105228. [Google Scholar] [CrossRef]
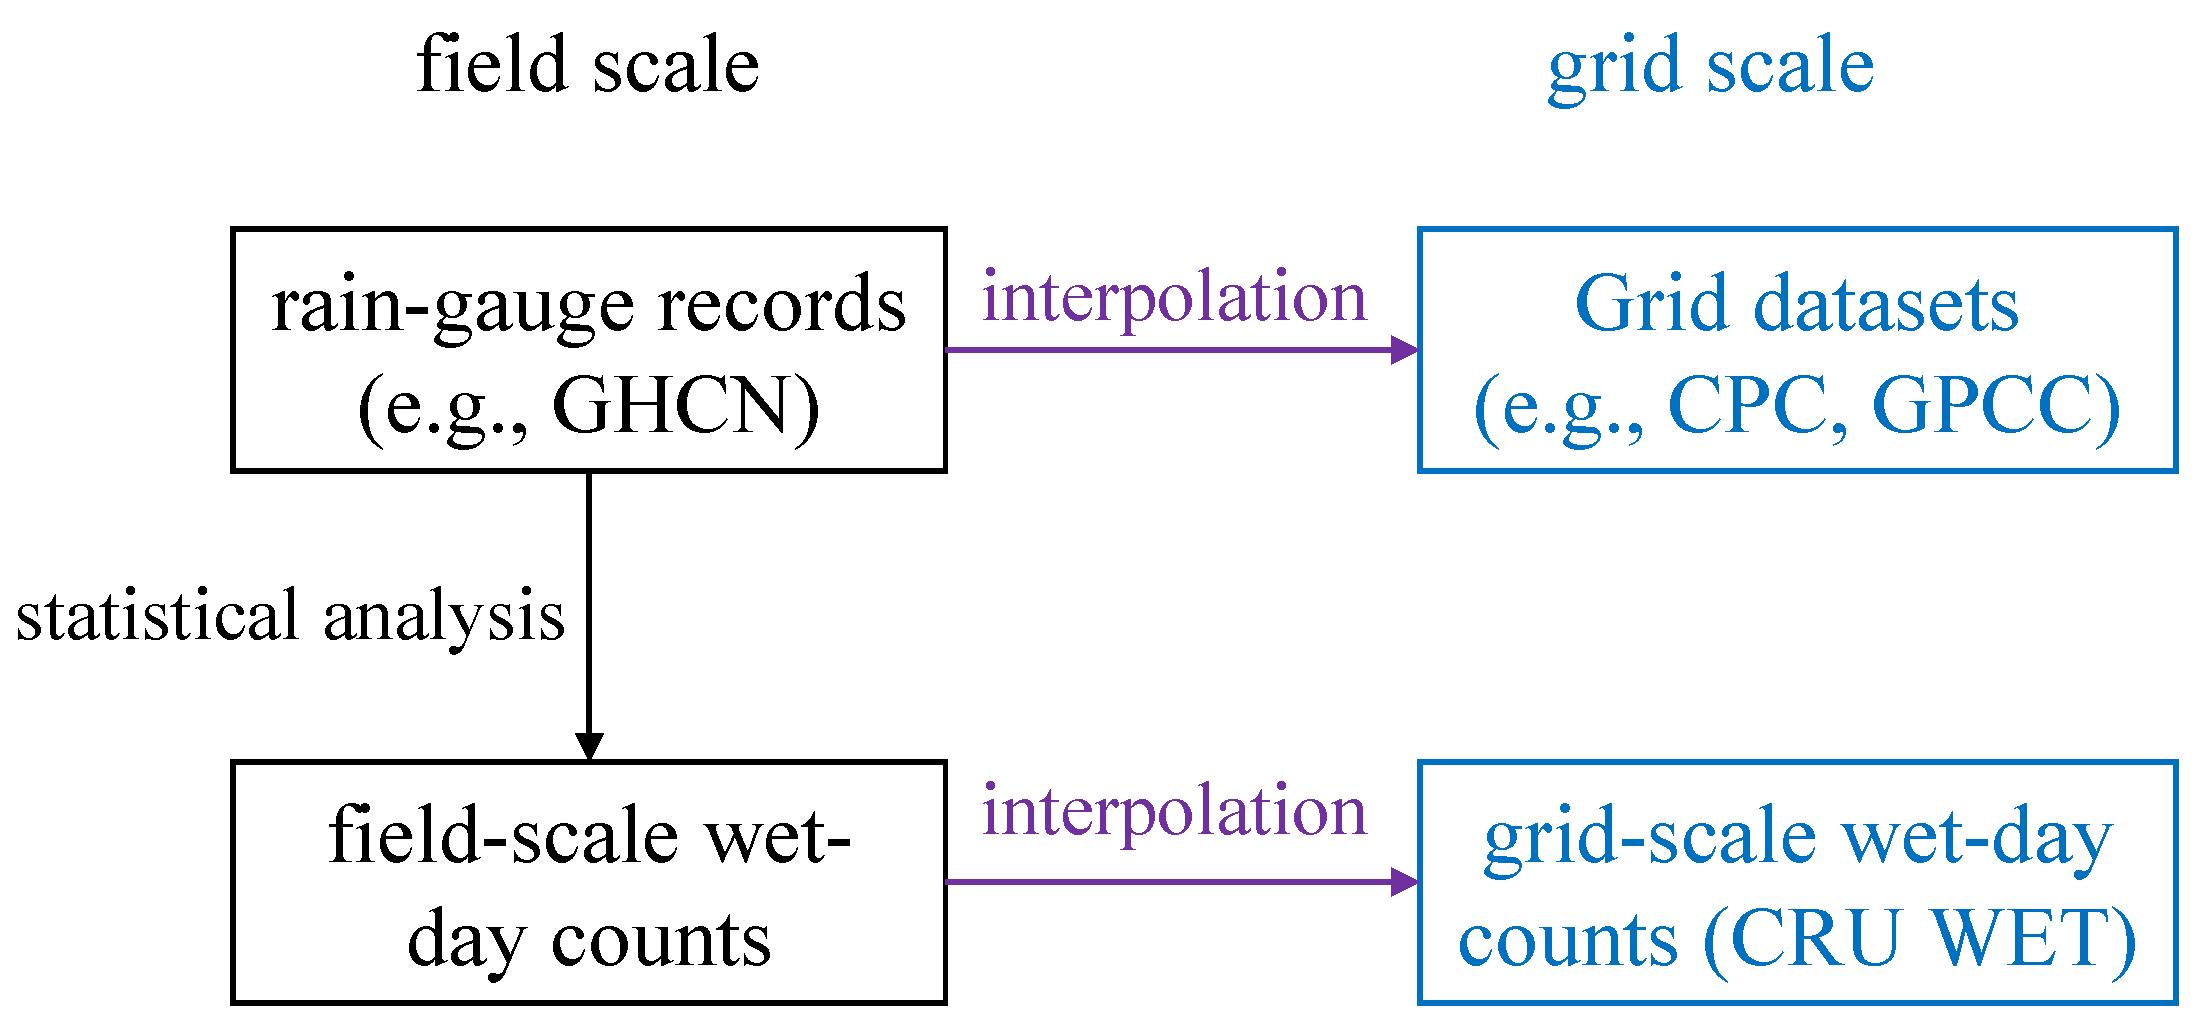
Figure 1. Flowchart of grid datasets of precipitation and wet day counts. The left (black color) and right (blue color) columns refer to field- and grid-scale datasets/variables.
Atmosphere 16 00066 g001
Figure 2. (a) Weather station locations across China for GHCN-Daily precipitation data; (b) number of rain-gauge stations across China used to interpolate into each 0.5 × 0.5° grid for CRU WET products.
Atmosphere 16 00066 g002
Figure 3. Differences in rainfall frequency from GHCN-Daily and CRU WET in (a) spring, (b) summer, (c) fall, and (d) winter during 2021–2022. The red and blue colors suggest higher and lower rainfall frequencies from CRU WET, respectively.
Atmosphere 16 00066 g003
Figure 4. Scatter plots of rainfall frequency from GHCN-Daily, λ N , and CRU WET, λ C , in (a) spring, (b) summer, (c) fall, and (d) winter during 2021–2022.
Atmosphere 16 00066 g004
Figure 5. Scatter plots of rainfall rates from GHCN-Daily, P N , and CRU PRE, P C , in spring (a), summer (b), fall (c), and winter (d) during 2021–2022.
Atmosphere 16 00066 g005
Figure 6. Rainfall frequencies from CRU WET, λ C , and GPCP, λ G , are presented as the (a) geographical distributions of λ C λ G and (b,c) scatter plots of λ C and λ G . In (b,c), the statistics of the correlation and relative difference between these two rainfall frequencies are given in the text as ρ and RD. λ G is calculated as the frequencies of wet days defined as the daily rainfall rate larger than a threshold of 0.1 mm in (b) and 0.5 mm in (c), whereas the threshold for λ C is always 0.1 mm.
Atmosphere 16 00066 g006
Figure 7. (a) As in Figure 6 but for the comparison of rainfall frequencies from CRU WET, λ C and ERA5, λ E . In (b,c), λ E is calculated as the frequencies of wet days defined as the daily rainfall rate larger than a threshold of 0.1 mm in (b) and 0.8 mm in (c), whereas the threshold for λ C is always 0.1 mm.
Atmosphere 16 00066 g007
Figure 8. The difference in mean rainfall rates (a) between CRU WET and GPCP, and (b) between CRU WET and ERA5. The subscripts C, G, and E represent CRU WET, GPCP, and ERA5.
Atmosphere 16 00066 g008
Figure 9. Multi-source rainfall frequencies and the corresponding data source resolutions over (a) Asia, (b) North American, (c) Europe, (d) Africa, (e) South America, and (f) Australia. The circles, stars, and crosses are derived from the independent study of [46] with datasets based on rain gauge observations (CPC, GPCC-daily), satellite products (GPCP 1dd, CMORPH, TRMM 3B42, PERSIANN CCS, PERSIANN CDR, MSWEP), and reanalysis (20CR, CFSR, NECP1, NCEP2, JRA55, ERA Interim, MERRA), respectively. The blue and magenta lines are first- and second-order polynomial fits. The filled pentagrams are estimated from CRU WET data as the reference for the field-scale rainfall frequency. All rainfall frequencies are estimated over the period 2003 and 2010. Full data source names are provided in the abbreviation list.
Atmosphere 16 00066 g009
Disclaimer/Publisher’s Note: The statements, opinions and data contained in all publications are solely those of the individual author(s) and contributor(s) and not of MDPI and/or the editor(s). MDPI and/or the editor(s) disclaim responsibility for any injury to people or property resulting from any ideas, methods, instructions or products referred to in the content.